Embed Size (px)
Citation preview
ARTICLE IN PRESS
Marine Structures 19 (2006) 1–22
0951-8339/$ -
doi:10.1016/j
�CorrespoE-mail ad
www.elsevier.com/locate/marstruc
Effect of weld geometric profile on fatigue life ofcruciform welds made by laser/GMAW processes
V. Caccesea,�, P.A. Blomquistb, K.A. Berubea,S.R. Webberb, N.J. Orozcob
aDepartment of Mechanical Engineering, University of Maine, Orono, ME 04469, USAbApplied Thermal Sciences Inc., PO Box C, 1861 Main Street, Sanford, ME 04073, USA
Received 20 September 2005; received in revised form 25 June 2006; accepted 10 July 2006
Abstract
The effect of weld geometric profile on fatigue life of laser-welded HSLA-65 steel is evaluated.
Presented are results of cruciform-shaped fatigue specimens with varying weld profiles loaded
cyclically in axial tension–compression. Specimens with a nearly circular-weld profile were created at
133 cm/min, as part of this effort, with a hybrid laser gas-metal-arc welding GMAW (L/GMAW)
process. The ability of the laser-welding process to produce desirable weld profiles resulted in fatigue
life superior to that of conventional welds. Comparison of finite-element analyses, used to estimate
stress-concentration factors, to the hot spot and mesh insensitive approaches for convergent cases
with smooth weld transitions is presented in relation to the experimental results. When a geometry-
based stress concentration factor is used, the fatigue tests show much less variability and can be
lumped into one master curve.
r 2006 Elsevier Ltd. All rights reserved.
Keywords: Fatigue; Laser welds; S–N Curves; Cruciform; Full-penetration welds; Hybrid welds; Stress-
concentration factors
1. Introduction
Fatigue life of a weldment is influenced by the material, environment, weldingtechniques, weld quality, connection details and the geometric profile of the weld. Welded
see front matter r 2006 Elsevier Ltd. All rights reserved.
.marstruc.2006.07.002
nding author. Tel.: +1207 581 2131; fax: +1 207 581 2379.
dress: [email protected] (V. Caccese).
ARTICLE IN PRESSV. Caccese et al. / Marine Structures 19 (2006) 1–222
joints are regions of stress concentration where fatigue cracks are likely to initiate.Geometry is one of the primary factors that control the fatigue life. Accordingly,procedures that improve weld geometric profile by reducing stress concentrations will havea beneficial impact on fatigue life. Most fatigue-life improvement methods implemented todate are post-weld operations. Kirkhope et al. [1,2] discusses methods of improving fatiguelife in welded steel structures by operations such as grinding, peening, water-jet erodingand remelting. They stated that use of special welding techniques applied as part of thewelding process in lieu of post-weld operations are attractive because the associated costsare lower and the quality control is simpler. Demonstrated in this paper is the use of acombined laser and gas-metal-arc welding (GMAW) weld procedure that results in asubstantially improved geometric profile of a longitudinal fillet weld. The improved weldprofile results in lower stress concentrations without the need of post-weld operations.Laser welding is a relatively new technique that has potential to achieve excellent fatigue
resistance, especially when used in combination with other more traditional weldingmethods such as GMAW. Good control over weld profile is demonstrated when a laserand GMAW processes (L/GMAW) are used together. Laser welding is a high-energydensity process that can be used on a wide variety of metals and alloys. The automotiveindustry has used laser welding in production since the 1980s. Recently, the ship-buildingindustry has looked toward laser welding to provide fabricated components in shipproduction. Original laser welding for ship structures utilized CO2 lasers with up to 25KWpower. Current manufacturing systems are looking toward use of state-of-the-artytterbium fiber lasers with power rating up to 10KW. Also, much hope is placed inlaser techniques to economically weld other structural components such as sandwichpanels. The work presented in this paper is part of an ongoing effort to quantify the fatiguelife of laser-fabricated shapes for use in naval vessels.Some of the advantages that can be achieved through laser welding are ease of process
automation, high welding speed, high productivity, increased process reliability, lowdistortion of the finished part and no requirement for filler metal. With current laser-welding techniques it is possible, as described by Duhamel [3], to achieve full-penetrationwelds in one pass on materials up to 1-in thick, depending on laser power and weld speed,with no filler and preparation as simple as precision cutting of the edges. In addition,distortion of the finished component is significantly less than distortions measured inconventionally welded or hot-rolled shapes. Even though filler material is not required inall cases to achieve a sound full-penetration weldment, lack of filler may cause undue stressconcentrations due to the geometry of the joint, especially if a sharp radius or reentrantcorner exists. These stress concentrations can substantially reduce fatigue life of a high-quality full-penetration weld, solely due to the geometry of the weld profile. Thecombination of laser welding with other processes such as GMAW, which is used to addfiller material, can dramatically improve the weld geometric profile. Accordingly, theimproved weld geometry results in lower stress concentrations and hence improved fatiguelife.Fatigue strength of laser-welded joints can be markedly different than that of
conventional welds. Therefore, an experimental program was undertaken to assess thefatigue resistance of laser-welded joints to be used in beam fabrication. Tests were used toquantify the actual fatigue life of welds that were laser fabricated with various weldgeometric profiles, using differing process parameters. Another objective of this effort is tocompare the current results to existing methods used in analyzing fatigue life. The current
ARTICLE IN PRESSV. Caccese et al. / Marine Structures 19 (2006) 1–22 3
study is focused upon estimating the influence of the weld geometric profile on the fatiguelife based upon the stress concentration factor due to the weld geometry. Ideally, tofabricate the optimal weld geometric profile, with a stress-concentration factor near unity,requires unrealistically slow speeds and unrealistically high amounts of filler metal.Accordingly, in developing an economical and practical weld profile for a line of productsuch as T-beams, tradeoffs must be made regarding desired weld geometry, operationspeed, and amount of filler metal.
2. Fatigue-life prediction in welded connections
In a marine structure, the environment may consist of load cycles in the order of millionsper year. Fatigue failures typically take place at sites of high stress in either the basematerial or weldments. Base material failures typically occur at openings, sharp corners orat edges. Fatigue failure in weldments is highly dependent on the structural connection andweld geometry details. Unfortunately, according to Kendrick [4], weld profile data formost of the nominal stress S–N curves have not always been reported. Therefore, results oftests with unknown weld profiles have been traditionally lumped together. In reality,variation in fatigue life exists within a weld detail category due to weld geometry. Thisaccounts for a significant variation in test results when fatigue data are lumped together.
Modern welding techniques such as L/GMAW can be used to increase fatigue life byimproving the weld geometry. Analysis techniques that capture this effect in the designprocess will allow fabricators to take economic advantage of the welding-techniqueimprovements. It is more likely that practical implementation of advanced weldingtechniques will occur if analytical tools are used in design that capture the economic benefitof an improved weld geometric profile.
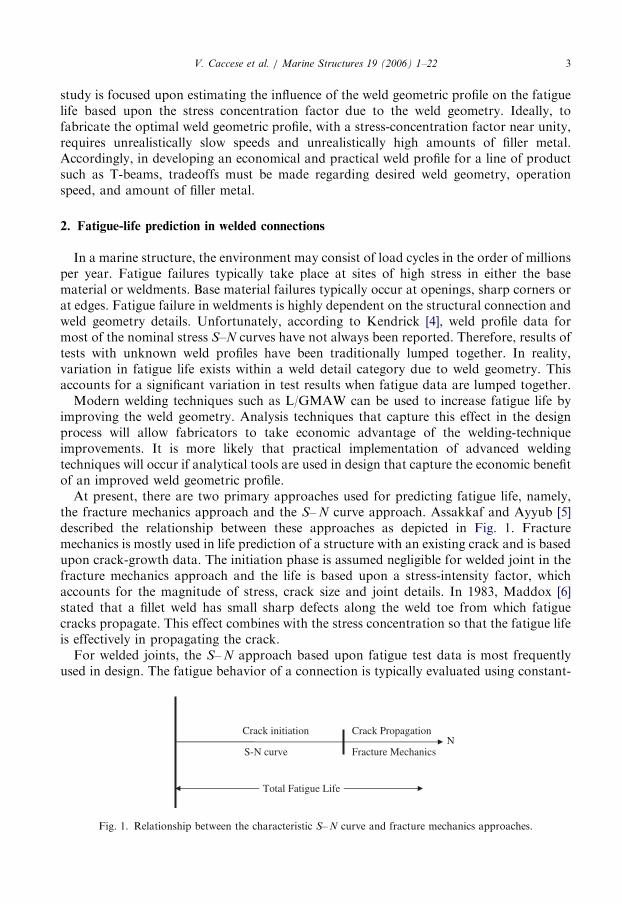
At present, there are two primary approaches used for predicting fatigue life, namely,the fracture mechanics approach and the S– N curve approach. Assakkaf and Ayyub [5]described the relationship between these approaches as depicted in Fig. 1. Fracturemechanics is mostly used in life prediction of a structure with an existing crack and is basedupon crack-growth data. The initiation phase is assumed negligible for welded joint in thefracture mechanics approach and the life is based upon a stress-intensity factor, whichaccounts for the magnitude of stress, crack size and joint details. In 1983, Maddox [6]stated that a fillet weld has small sharp defects along the weld toe from which fatiguecracks propagate. This effect combines with the stress concentration so that the fatigue lifeis effectively in propagating the crack.
For welded joints, the S– N approach based upon fatigue test data is most frequentlyused in design. The fatigue behavior of a connection is typically evaluated using constant-
N Crack Propagation Crack initiation
S-N curve Fracture Mechanics
Total Fatigue Life
Fig. 1. Relationship between the characteristic S– N curve and fracture mechanics approaches.
ARTICLE IN PRESSV. Caccese et al. / Marine Structures 19 (2006) 1–224
amplitude fatigue tests and the results are presented as the stress amplitude versus thenumber of cycles to produce failure. Fatigue damage is then treated as a linear process andlife due to a varying load history is estimated using methods such as Miner’s rule. The S– N
method will be focused upon in this paper of which there are several variations. Theapproach chosen dictates whether or not the analysis considers the local effect of the weldgeometric profile.
2.1. Use of S– N curves
The characteristic S– N curve approach uses fatigue test data and assumes that fatiguedamage accumulation is a linear phenomenon. Three different approaches often used inS– N type fatigue design of metal structures will be discussed in this paper, namely, (1)nominal stress, (2) hot spot stress, and (3) the notch stress.Using an S– N approach, the expression for fatigue life of a welded joint can be cast into
a general form as follows:
N ¼A
Sm , (1)
where N is the number of cycles to failure, S is the appropriate stress level for the analysisapproach being used, and A and m are material parameters. This equation can belinearized by taking the logarithm of each side of Eq. (1) resulting in the expression
logðNÞ ¼ logðAÞ �m logðSÞ. (2)
2.1.1. Nominal-stress approach
The nominal-stress approach uses fatigue data derived from experimental testing of astructural detail, which are used to generate an S– N curve unique to this particular detail.The nominal-stress approach does not include the stress concentration due to weldgeometric profile, since it is assumed that the connection specific S– N curve alreadycharacterizes this effect. The stress, S, in Eqs. (1) and (2) is then equal to the nominalstress, Snom, which is the far-field stress due to the forces and moments at the potential siteof cracking. In that regard, neither the local geometry of the weld toe or the local materialproperties are taken into account in the analysis. Most design codes use differentclassifications when implementing the nominal-stress approach for different structuraldetails. A different S– N curve, characterized by m and A, is provided for eachclassification.Munse et al. [7] categorized numerous weld and attachment details typical in steel-ship
construction. They provided fatigue parameters including uncertainties for over 50 weldedconnection details. The cruciform connection studied under this current effort is listed inthe Munse report as structural detail 14 and the fatigue parameters compiled for theseconnections encompass data that span years of testing with reported fatigue parameters ofm ¼ 7:35 and logðAÞ ¼ 23:2 for stress, Snom, in MPa. Mansour et al. [8] reports anabbreviated joint classification for BS 5400 and DNV where a load-carrying full-penetration fillet weld without undercutting at the corners dressed out by local grinding isplaced in category F. Design parameters associated with category F are m ¼ 3 andlogðAÞ ¼ 11:8 with stress, Snom, in MPa.
ARTICLE IN PRESSV. Caccese et al. / Marine Structures 19 (2006) 1–22 5
2.1.2. Hot spot-stress approach
In a hot spot approach, the hot spot stress, Shs, is determined at the location where thefatigue stress is the highest. This is typically at the toe of the weld where fatigue cracking islikely to initiate. Computational difficulty may arise because the stress at the transitionpoint of the joint is usually a singularity. To overcome this effect, the hot spot stress at theweld toe is estimated using results in the vicinity of the weld and not at the singular point.Various extrapolation standards are used and some of the uncertainties of the effect ofweld geometry are removed. The hot spot stress is derived from a detailed analysis of theconnection and will include global effects and to some extent the influences of the localgeometry. With this approach, each material requires a single S– N curve for fatigue-lifeassessment. However, a detailed finite-element (FE) analysis is necessary. The hot spotstress, Shs can be related to Snom using a stress-concentration factor for the gross geometry,Kg as
Shs ¼ Kg Snom: (3)
Shs is then used in Eq. (1), along with a baseline S– N curve to predict the fatigue life. Theresulting hot spot stress may differ depending upon the FE program, element type, elementmesh and method used for dealing with the singularity.
Several methods have been prescribed for determination of the hot spot stress. Fricke[9], Niemi and Marquis [10] recommend using results at 0.4 and 1.4 t from the weld toe toextrapolate the stress at the hot spot for certain types of weldments. Extrapolation at 0.5and 1.5 t has also been recommended as described by Kendrick [4]. Other recommenda-tions include using a fine mesh to predict the stress distribution, noting that the stress at thehot spot is a singularity (unless the fillet is radiused). The hot spot stress is thenextrapolated at a preset distance from elements in the vicinity of the singularity.
Error can also be introduced in the hot spot-stress calculation if the weld profiles have ahigh degree of variability or if the FE model does not accurately represent the as-weldedjoint geometry. Also, the extrapolation technique used to compute the hot spot stress willsignificantly influence the results. A standard method that is consistently applied isrequired for analysis. In a test program, the weld profile needs to be accurately recorded sothat a proper assessment can be made.
Procedures for experimental determination of stress-concentration factors, similar to theapproach used in hot spot analyses, have been demonstrated by Niemi and Marquis [10]and Dong [11], among others. These techniques extrapolate the response recorded by twoor more strain gages to the hot spots. Strains are converted to stress and extrapolationtechniques similar to those used in hot spot analyses are employed.
2.1.3. Notch-stress approach
The notch-stress approach uses S– N curves based upon smooth material specimenswithout notches. A stress-concentration factor is then determined to account for variousimperfections. According to Kendrick [4], this method can be used to predict the effect ofan imperfect weld profile on fatigue life. It will include an additional stress-concentrationfactor for the actual weld geometry, Kw as well as factors for increased stress due tomisalignment and angular mismatch. Applied fatigue stress, Sn, can then be written interms of an aggregate stress-concentration factor, K, and the nominal stress as
Sn ¼ KSnom. (4)
ARTICLE IN PRESSV. Caccese et al. / Marine Structures 19 (2006) 1–226
K is the product of the individual stress concentration factors given as
K ¼ KgKwK teK taKn. (5)
Kg is the stress-concentration factor due to the gross geometry, Kw is the stress-concentration factor due to the weld geometry, Kte is the additional stress-concentrationfactor due to eccentricity tolerance (used for plate connections only), Kta is the additionalstress-concentration factor due to angular mismatch (used for plate connections only), Kn
is the additional stress-concentration factor for un-symmetrical stiffeners on laterallyloaded panels applied when nominal stress is derived from simple beam analysis.For an ideal case with no eccentricity or angular mismatch, the notch stress, Sn, is
related to the nominal and hotspot stresses as follows:
Sn ¼ KgKwSnom ¼ KwShs (6)
2.1.4. Mesh-insensitive approach
Dong [12] recently suggested a method for determination of the hot spot stress that isinsensitive to the FE mesh. A FE analysis is performed and the resulting nodal forcesacross the thickness of the plate in the area in question are used to compute a mesh-insensitive structural stress, Smi, which can be used in a fatigue analysis. This methodincludes effects of both the gross connection geometry and to a lesser extent the local weldprofile. The mesh-insensitive stress can be related to the nominal stress by
Smi ¼ KgSnom. (7)
In this approach, an equilibrium-equivalent stress state and a self-equilibrating stress stateare used to compute the mesh-insensitive stress. Nodal forces are used instead of theresulting stresses at or near the singularity (hot spot) location, since the stresses are highlymesh sensitive. This results in stress-level predictions with little sensitivity to the fineness ofthe FE mesh. Therefore, this procedure may be useful in the analysis of ship structureswhere coarse FE meshes are used, especially at the preliminary design stage.
3. Fatigue testing of laser-welded cruciforms
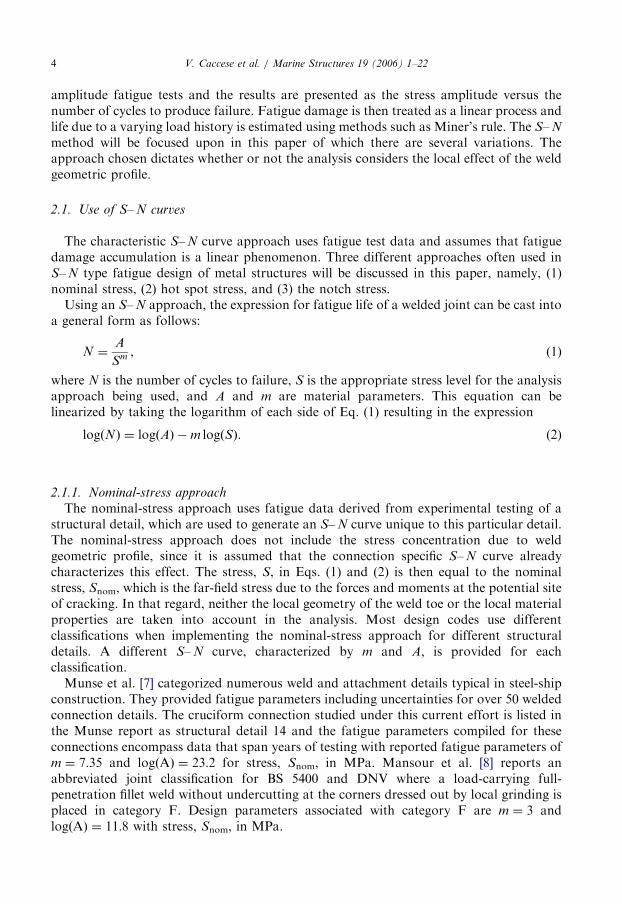
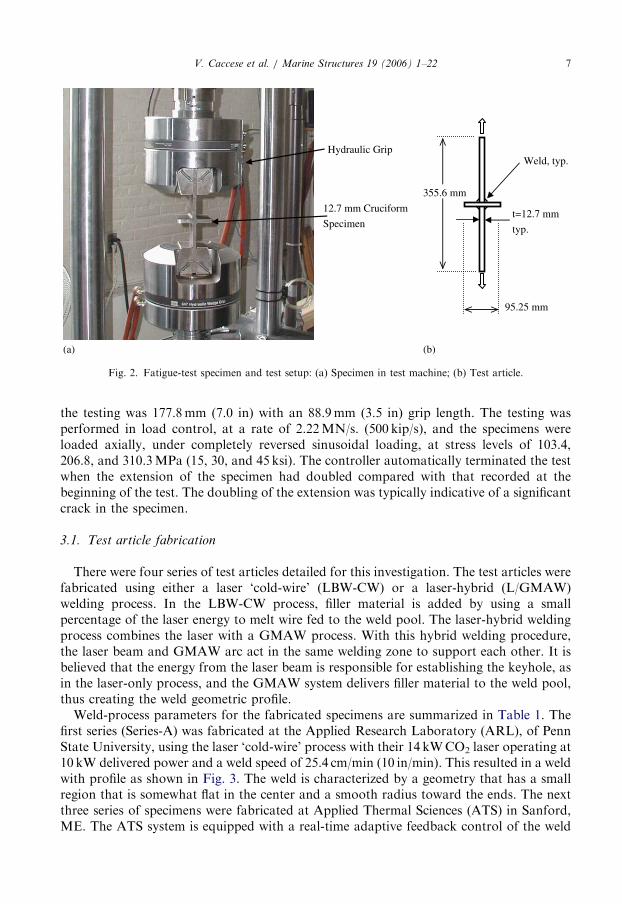
An experimental fatigue study was undertaken to further investigate the effect of localweld profile. The weld geometry of cruciform specimens was intentionally varied,measured and categorized. Numerous fatigue tests were performed to determine theinfluence of geometry on fatigue life. Laser welding proved to be an invaluable techniqueto carry out this effort due to the ability to develop a full-penetration weld. Whensupplemented with a GMAW process, a smooth, nearly circular geometric profile wasrealized. The fatigue tests summarized in this paper are a subset of a larger database beingcompiled for the qualification of laser-welded HSLA-65 steel for use in US Navy vessels asdocumented by Kihl [13] and Berube et al. [14]. Results specifically demonstrating theeffect of weld geometry on fatigue life were selected. The fatigue testing was performed atthe University of Maine [14] using a 50metric ton (110 kips) MTSTM 810 universal testingmachine with a TestStarTM digital controller, as shown in Fig. 2a. The 355.6mm (14 in)long, 95.25mm 3� 3
4in:
� �wide test specimens (Fig. 2b) were cruciform shaped and
fabricated from 12.7mm ð0:56 in:Þ thick HSLA-65 steel plating. The gage length used for
ARTICLE IN PRESS
Hydraulic Grip
12.7 mm Cruciform
Specimen
Weld, typ.
t=12.7 mm
typ.
95.25 mm
355.6 mm
(a) (b)
Fig. 2. Fatigue-test specimen and test setup: (a) Specimen in test machine; (b) Test article.
V. Caccese et al. / Marine Structures 19 (2006) 1–22 7
the testing was 177.8mm (7.0 in) with an 88.9mm (3.5 in) grip length. The testing wasperformed in load control, at a rate of 2.22MN/s. (500 kip/s), and the specimens wereloaded axially, under completely reversed sinusoidal loading, at stress levels of 103.4,206.8, and 310.3MPa (15, 30, and 45 ksi). The controller automatically terminated the testwhen the extension of the specimen had doubled compared with that recorded at thebeginning of the test. The doubling of the extension was typically indicative of a significantcrack in the specimen.
3.1. Test article fabrication
There were four series of test articles detailed for this investigation. The test articles werefabricated using either a laser ‘cold-wire’ (LBW-CW) or a laser-hybrid (L/GMAW)welding process. In the LBW-CW process, filler material is added by using a smallpercentage of the laser energy to melt wire fed to the weld pool. The laser-hybrid weldingprocess combines the laser with a GMAW process. With this hybrid welding procedure,the laser beam and GMAW arc act in the same welding zone to support each other. It isbelieved that the energy from the laser beam is responsible for establishing the keyhole, asin the laser-only process, and the GMAW system delivers filler material to the weld pool,thus creating the weld geometric profile.
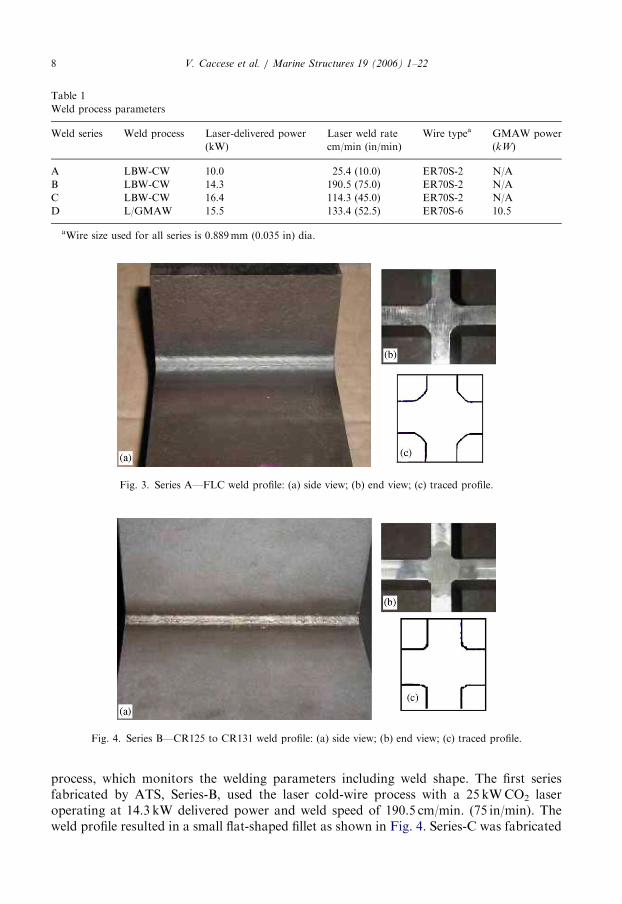
Weld-process parameters for the fabricated specimens are summarized in Table 1. Thefirst series (Series-A) was fabricated at the Applied Research Laboratory (ARL), of PennState University, using the laser ‘cold-wire’ process with their 14 kWCO2 laser operating at10 kW delivered power and a weld speed of 25.4 cm/min (10 in/min). This resulted in a weldwith profile as shown in Fig. 3. The weld is characterized by a geometry that has a smallregion that is somewhat flat in the center and a smooth radius toward the ends. The nextthree series of specimens were fabricated at Applied Thermal Sciences (ATS) in Sanford,ME. The ATS system is equipped with a real-time adaptive feedback control of the weld
ARTICLE IN PRESS
Table 1
Weld process parameters
Weld series Weld process Laser-delivered power Laser weld rate Wire typea GMAW power
(kW) cm/min (in/min) (kW)
A LBW-CW 10.0 25.4 (10.0) ER70S-2 N/A
B LBW-CW 14.3 190.5 (75.0) ER70S-2 N/A
C LBW-CW 16.4 114.3 (45.0) ER70S-2 N/A
D L/GMAW 15.5 133.4 (52.5) ER70S-6 10.5
aWire size used for all series is 0.889mm (0.035 in) dia.
Fig. 3. Series A—FLC weld profile: (a) side view; (b) end view; (c) traced profile.
Fig. 4. Series B—CR125 to CR131 weld profile: (a) side view; (b) end view; (c) traced profile.
V. Caccese et al. / Marine Structures 19 (2006) 1–228
process, which monitors the welding parameters including weld shape. The first seriesfabricated by ATS, Series-B, used the laser cold-wire process with a 25 kWCO2 laseroperating at 14.3 kW delivered power and weld speed of 190.5 cm/min. (75 in/min). Theweld profile resulted in a small flat-shaped fillet as shown in Fig. 4. Series-C was fabricated
ARTICLE IN PRESSV. Caccese et al. / Marine Structures 19 (2006) 1–22 9
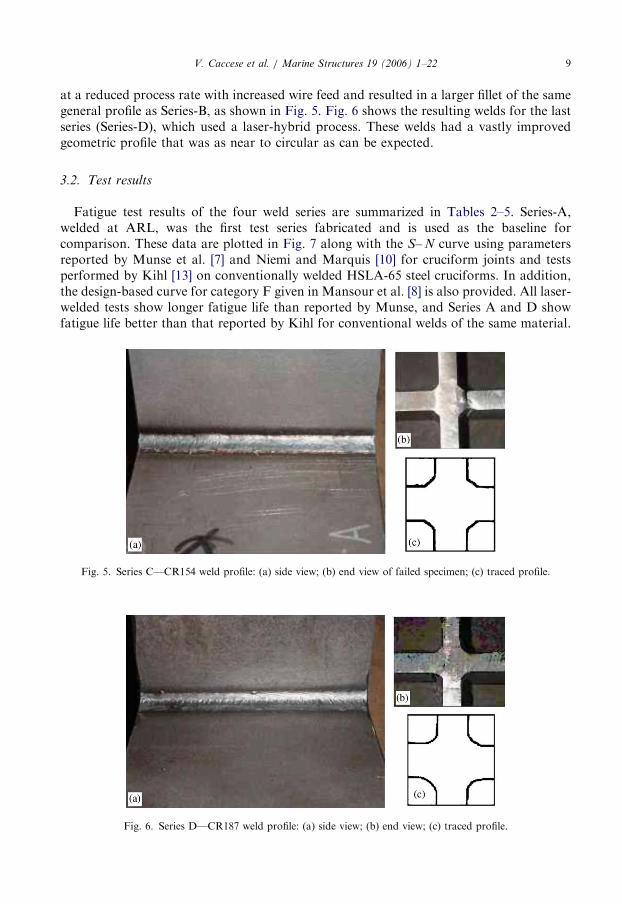
at a reduced process rate with increased wire feed and resulted in a larger fillet of the samegeneral profile as Series-B, as shown in Fig. 5. Fig. 6 shows the resulting welds for the lastseries (Series-D), which used a laser-hybrid process. These welds had a vastly improvedgeometric profile that was as near to circular as can be expected.
3.2. Test results
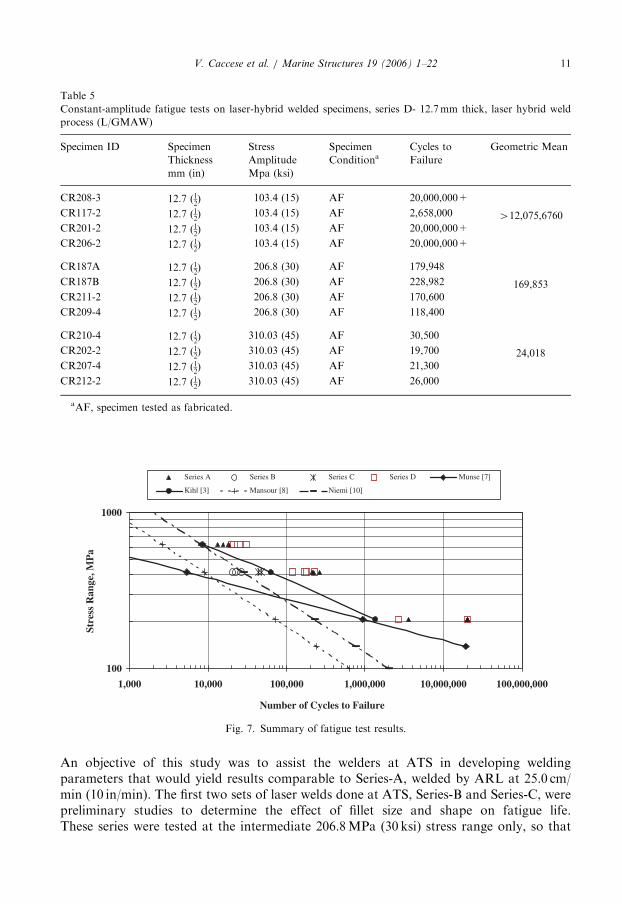
Fatigue test results of the four weld series are summarized in Tables 2–5. Series-A,welded at ARL, was the first test series fabricated and is used as the baseline forcomparison. These data are plotted in Fig. 7 along with the S– N curve using parametersreported by Munse et al. [7] and Niemi and Marquis [10] for cruciform joints and testsperformed by Kihl [13] on conventionally welded HSLA-65 steel cruciforms. In addition,the design-based curve for category F given in Mansour et al. [8] is also provided. All laser-welded tests show longer fatigue life than reported by Munse, and Series A and D showfatigue life better than that reported by Kihl for conventional welds of the same material.
Fig. 5. Series C—CR154 weld profile: (a) side view; (b) end view of failed specimen; (c) traced profile.
Fig. 6. Series D—CR187 weld profile: (a) side view; (b) end view; (c) traced profile.
ARTICLE IN PRESS
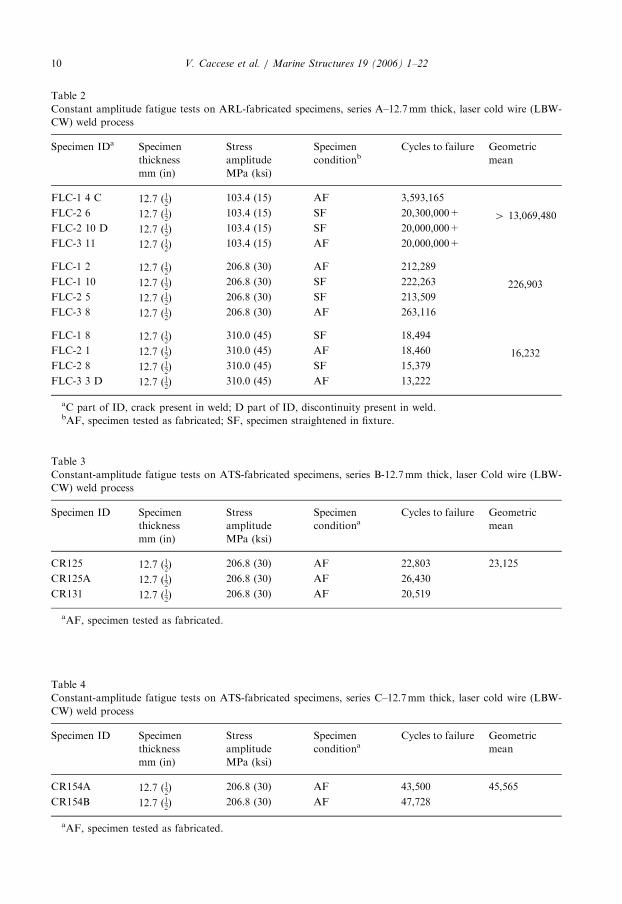
Table 2
Constant amplitude fatigue tests on ARL-fabricated specimens, series A–12.7mm thick, laser cold wire (LBW-
CW) weld process
Specimen IDa Specimen
thickness
Stress
amplitude
Specimen
conditionbCycles to failure Geometric
mean
mm (in) MPa (ksi)
FLC-1 4 C 12.7 ð12Þ 103.4 (15) AF 3,593,165
4 13,069,480FLC-2 6 12.7 ð12Þ 103.4 (15) SF 20,300,000+
FLC-2 10 D 12.7 ð12Þ 103.4 (15) SF 20,000,000+
FLC-3 11 12.7 ð12Þ 103.4 (15) AF 20,000,000+
FLC-1 2 12.7 ð12Þ 206.8 (30) AF 212,289
226,903FLC-1 10 12.7 ð12Þ 206.8 (30) SF 222,263
FLC-2 5 12.7 ð12Þ 206.8 (30) SF 213,509
FLC-3 8 12.7 ð12Þ 206.8 (30) AF 263,116
FLC-1 8 12.7 ð12Þ 310.0 (45) SF 18,494
16,232FLC-2 1 12.7 ð12Þ 310.0 (45) AF 18,460
FLC-2 8 12.7 ð12Þ 310.0 (45) SF 15,379
FLC-3 3 D 12.7 ð12Þ 310.0 (45) AF 13,222
aC part of ID, crack present in weld; D part of ID, discontinuity present in weld.bAF, specimen tested as fabricated; SF, specimen straightened in fixture.
Table 3
Constant-amplitude fatigue tests on ATS-fabricated specimens, series B-12.7mm thick, laser Cold wire (LBW-
CW) weld process
Specimen ID Specimen
thickness
Stress
amplitude
Specimen
conditionaCycles to failure Geometric
mean
mm (in) MPa (ksi)
CR125 12.7 ð12Þ 206.8 (30) AF 22,803 23,125
CR125A 12.7 ð12Þ 206.8 (30) AF 26,430
CR131 12.7 ð12Þ 206.8 (30) AF 20,519
aAF, specimen tested as fabricated.
Table 4
Constant-amplitude fatigue tests on ATS-fabricated specimens, series C–12.7mm thick, laser cold wire (LBW-
CW) weld process
Specimen ID Specimen
thickness
Stress
amplitude
Specimen
conditionaCycles to failure Geometric
mean
mm (in) MPa (ksi)
CR154A 12.7 ð12Þ 206.8 (30) AF 43,500 45,565
CR154B 12.7 ð12Þ 206.8 (30) AF 47,728
aAF, specimen tested as fabricated.
V. Caccese et al. / Marine Structures 19 (2006) 1–2210
ARTICLE IN PRESS
Table 5
Constant-amplitude fatigue tests on laser-hybrid welded specimens, series D- 12.7mm thick, laser hybrid weld
process (L/GMAW)
Specimen ID Specimen
Thickness
Stress
Amplitude
Specimen
ConditionaCycles to
Failure
Geometric Mean
mm (in) Mpa (ksi)
CR208-3 12.7 ð12Þ 103.4 (15) AF 20,000,000+
412,075,6760CR117-2 12.7 ð12Þ 103.4 (15) AF 2,658,000
CR201-2 12.7 ð12Þ 103.4 (15) AF 20,000,000+
CR206-2 12.7 ð12Þ 103.4 (15) AF 20,000,000+
CR187A 12.7 ð12Þ 206.8 (30) AF 179,948
169,853CR187B 12.7 ð12Þ 206.8 (30) AF 228,982
CR211-2 12.7 ð12Þ 206.8 (30) AF 170,600
CR209-4 12.7 ð12Þ 206.8 (30) AF 118,400
CR210-4 12.7 ð12Þ 310.03 (45) AF 30,500
24,018CR202-2 12.7 ð12Þ 310.03 (45) AF 19,700
CR207-4 12.7 ð12Þ 310.03 (45) AF 21,300
CR212-2 12.7 ð12Þ 310.03 (45) AF 26,000
aAF, specimen tested as fabricated.
100
1000
1,000 10,000 100,000 1,000,000 10,000,000 100,000,000
Number of Cycles to Failure
Stre
ss R
ange
, MP
a
Series A Series B Series C Series D Munse [7]
Kihl [3] Mansour [8] Niemi [10]
Fig. 7. Summary of fatigue test results.
V. Caccese et al. / Marine Structures 19 (2006) 1–22 11
An objective of this study was to assist the welders at ATS in developing weldingparameters that would yield results comparable to Series-A, welded by ARL at 25.0 cm/min (10 in/min). The first two sets of laser welds done at ATS, Series-B and Series-C, werepreliminary studies to determine the effect of fillet size and shape on fatigue life.These series were tested at the intermediate 206.8MPa (30 ksi) stress range only, so that
ARTICLE IN PRESSV. Caccese et al. / Marine Structures 19 (2006) 1–2212
timely results could be obtained. A fillet size was chosen for Series-D such that thefatigue life is comparable to that of the Series-A welds. Series-D is the final productiondetail of the fillet to be used in beam fabrication and was fabricated at a weldrate of 133.4 cm/min (52.5 in/min), which is 5� 1
4 times faster than the rate used for theSeries-A welds.
4. Analysis
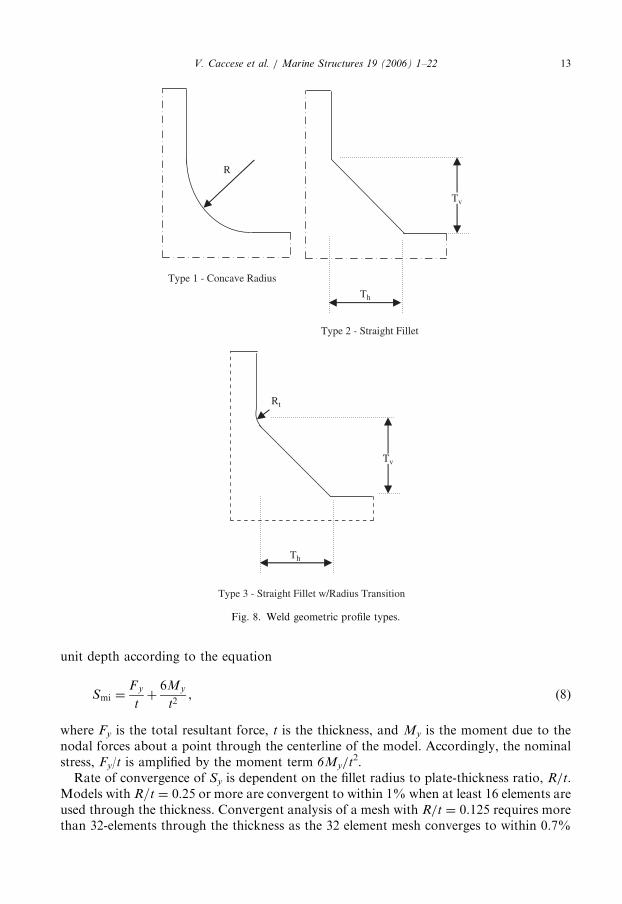
FE analyses were performed on the cruciform-shaped test articles to ascertain the stressconcentration factor for various shaped fillet geometries. The ANSYSTM FE program wasused for this purpose. Results of the FE analysis were processed using several analyticalmethods and these data were used to estimate the relative change in fatigue life due to thegeometry of the fillet. Since it is desirable to use this method with a multitude of weldprofiles, the FE method was chosen for the analysis procedure to determine the stressconcentration factor, K. In the case of weld geometries with a smooth transition, resultingstresses will converge to a single value as the mesh size is reduced. The results were used toevaluate the stress at the keypoint (fillet transition point) for convergent cases, the hot spotstress and the mesh-insensitive structural stress. One-fourth symmetry was used withisoparametric, 8-noded, plane-strain elements. A uniform unit pressure was placed at thetop of the model and symmetric boundary conditions were enforced.Geometric profiles evaluated are summarized in Fig. 8 and include: Type-(1) toe with a
smooth concave radius, Type-(2) straight toe with a discontinuous transition and Type-(3)straight toe with a smooth radius transition. Type-1 has a smooth radius transition withthe radius, R, as a parameter. With hybrid-laser welding it is now possible to achieve weldswith geometries very close to Type-1. The Type-2 profile has a straight toe and adiscontinuous corner. Linear analysis of the Type-2 weld to determine a convergent stress-concentration factor at the hot spot is not possible due to the singularity which causes amesh-sensitive model. The legs of the fillet can either be equal ðTh ¼ TvÞ or unequalðThaTvÞ. The Type-3 weld has a relatively flat profile with a smooth transition from theflat section to the load-carrying elements. The smooth transition will allow for convergentanalysis of this type of weld.
4.1. Concave round fillet
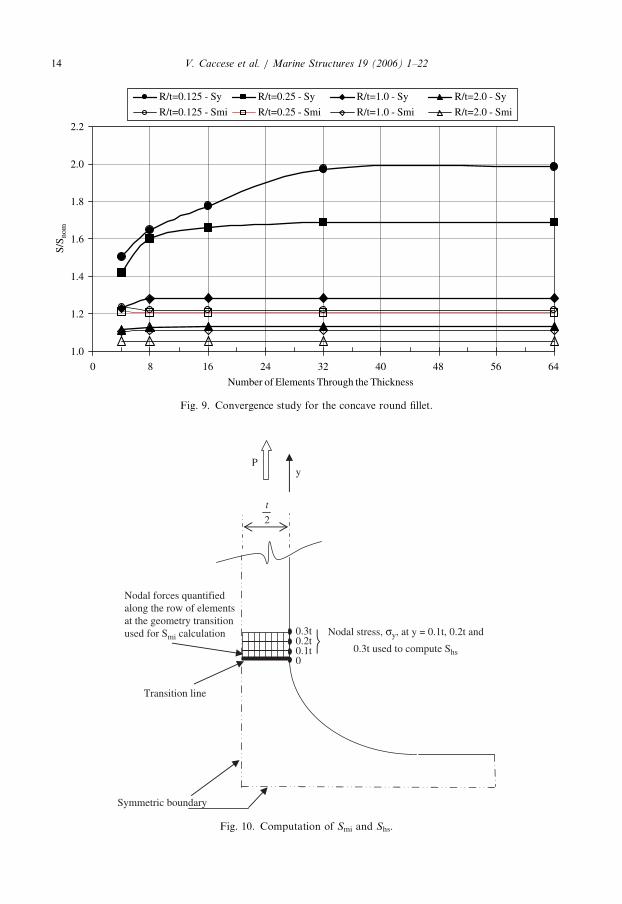
The concave round fillet (Type-1) is a convergent case and can be used as a baseline forcomparison of the various evaluation methods. It was demonstrated in Fig. 6 that a nearlyround fillet is possible using the L/GMAW process described, therefore making this casemore than just an idealization. A convergence study was undertaken by prescribing avarying number of elements through the thickness of the model and the results aresummarized in Fig. 9. The peak stress recorded in the analysis, Sy, is plotted in thisdiagram using solid symbols along with the mesh-insensitive stress, Smi, calculated withDong’s [12] method is plotted using open symbols. In the case of a cruciform-shapedsection with fillet welds, the mesh-insensitive stress is computed by determination of theforces along the elements through the thickness at the weld geometry transition as shownin Fig. 10. The nodal forces along the transition line are determined by FE analysis as thesum of the elemental forces at each node. The total resultant forces on this line are inequilibrium with the applied load. The stress, Smi, is computed for a plane-strain case of
ARTICLE IN PRESS
R
Th
Th
Rt
Tv
Tv
Type 1 - Concave Radius
Type 2 - Straight Fillet
Type 3 - Straight Fillet w/Radius Transition
Fig. 8. Weld geometric profile types.
V. Caccese et al. / Marine Structures 19 (2006) 1–22 13
unit depth according to the equation
Smi ¼F y
tþ
6My
t2, (8)
where Fy is the total resultant force, t is the thickness, and My is the moment due to thenodal forces about a point through the centerline of the model. Accordingly, the nominalstress, Fy/t is amplified by the moment term 6My/t2.
Rate of convergence of Sy is dependent on the fillet radius to plate-thickness ratio, R/t.Models with R=t ¼ 0:25 or more are convergent to within 1% when at least 16 elements areused through the thickness. Convergent analysis of a mesh with R/t ¼ 0.125 requires morethan 32-elements through the thickness as the 32 element mesh converges to within 0.7%
ARTICLE IN PRESS
2
t
y
0
0.3t
Nodal forces quantified along the row of elements at the geometry transition used for Smi calculation
P
Transition line
Symmetric boundary
Nodal stress, σy, at y = 0.1t, 0.2t and
0.3t used to compute Shs0.2t0.1t
Fig. 10. Computation of Smi and Shs.
1.0
1.2
1.4
1.6
1.8
2.0
0 8 16 24 32 40 48 56 64
S/S n
om
R/t=0.125 - Sy R/t=0.25 - Sy R/t=1.0 - Sy R/t=2.0 - Sy
R/t=0.125 - Smi R/t=0.25 - Smi R/t=1.0 - Smi R/t=2.0 - Smi2.2
Number of Elements Through the Thickness
Fig. 9. Convergence study for the concave round fillet.
V. Caccese et al. / Marine Structures 19 (2006) 1–2214
ARTICLE IN PRESSV. Caccese et al. / Marine Structures 19 (2006) 1–22 15
of the 64-element mesh. The mesh insensitive stress, Smi, is always convergent, as indicatedby Dong [12], but its value is considerably less than the peak stress Sy.
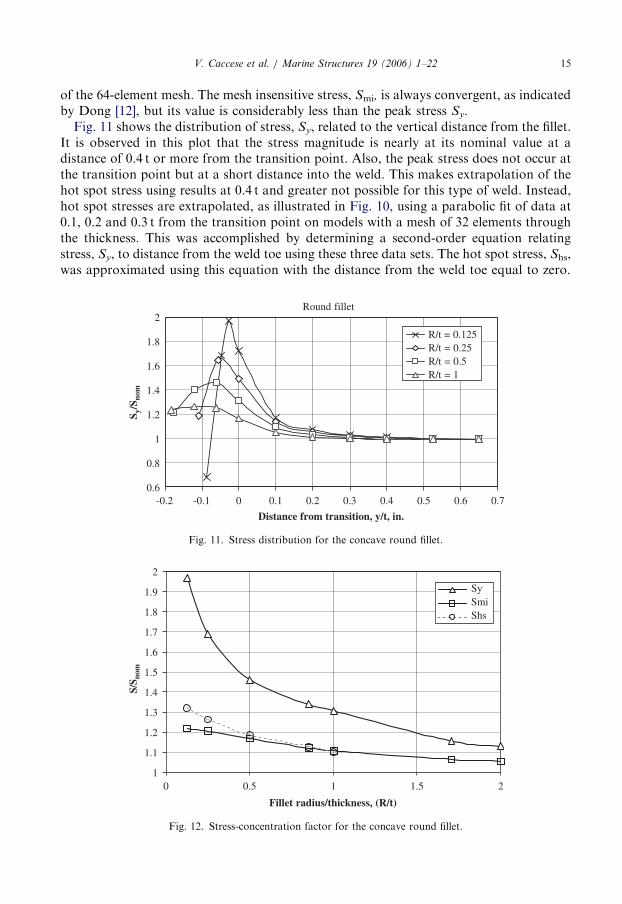
Fig. 11 shows the distribution of stress, Sy, related to the vertical distance from the fillet.It is observed in this plot that the stress magnitude is nearly at its nominal value at adistance of 0.4 t or more from the transition point. Also, the peak stress does not occur atthe transition point but at a short distance into the weld. This makes extrapolation of thehot spot stress using results at 0.4 t and greater not possible for this type of weld. Instead,hot spot stresses are extrapolated, as illustrated in Fig. 10, using a parabolic fit of data at0.1, 0.2 and 0.3 t from the transition point on models with a mesh of 32 elements throughthe thickness. This was accomplished by determining a second-order equation relatingstress, Sy, to distance from the weld toe using these three data sets. The hot spot stress, Shs,was approximated using this equation with the distance from the weld toe equal to zero.
1
2
0
S y/S
nom
R/t = 0.125R/t = 0.25R/t = 0.5R/t = 1
Round fillet
1.8
1.6
1.4
1.2
0.8
0.6-0.2 -0.1 0.1 0.2 0.3 0.4 0.5 0.6 0.7
Distance from transition, y/t, in.
Fig. 11. Stress distribution for the concave round fillet.
1
1.1
1.2
1.3
1.4
1.5
1.6
1.7
1.8
2
0 1 2
SySmiShs
Fillet radius/thickness, (R/t)
S/S n
om
1.9
0.5 1.5
Fig. 12. Stress-concentration factor for the concave round fillet.
ARTICLE IN PRESSV. Caccese et al. / Marine Structures 19 (2006) 1–2216
Fig. 12 shows the stress concentration factor, S/Snom, for various R/t ratios and analysistechniques using a mesh of 32 elements through the thickness. The technique used tocompute the hot spot stress, Shs, results in stress-concentration factors nearly the same asSmi for this case. Both are considerably less than Sy, especially for small radii. Forexample, a small-radius fillet with R=t ¼ 0:125 shows a stress amplification of 1.97,whereas the Smi is 1.22 and Shs is 1.32 for this same size fillet.
4.2. Straight fillet
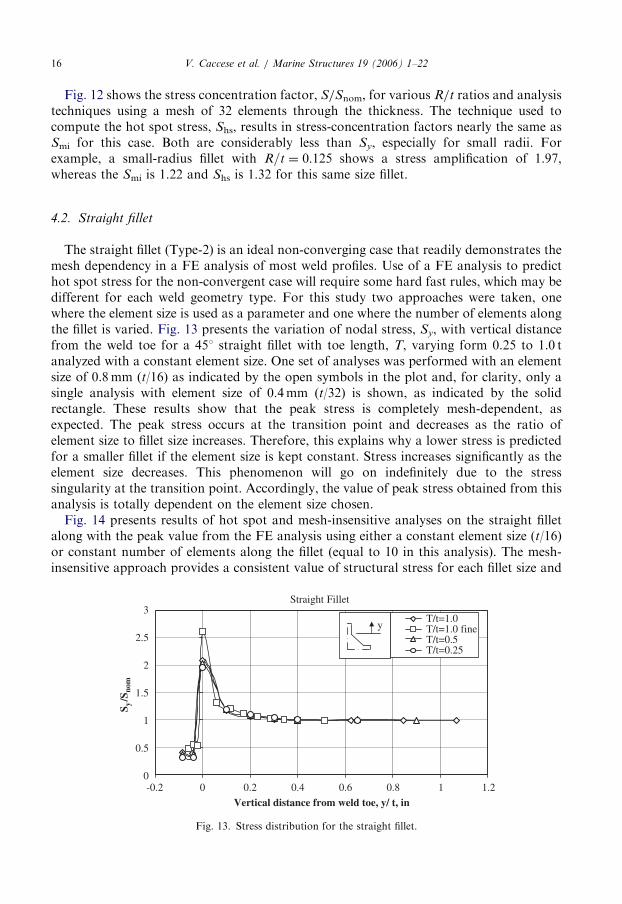
The straight fillet (Type-2) is an ideal non-converging case that readily demonstrates themesh dependency in a FE analysis of most weld profiles. Use of a FE analysis to predicthot spot stress for the non-convergent case will require some hard fast rules, which may bedifferent for each weld geometry type. For this study two approaches were taken, onewhere the element size is used as a parameter and one where the number of elements alongthe fillet is varied. Fig. 13 presents the variation of nodal stress, Sy, with vertical distancefrom the weld toe for a 451 straight fillet with toe length, T, varying form 0.25 to 1.0 tanalyzed with a constant element size. One set of analyses was performed with an elementsize of 0.8mm (t/16) as indicated by the open symbols in the plot and, for clarity, only asingle analysis with element size of 0.4mm (t/32) is shown, as indicated by the solidrectangle. These results show that the peak stress is completely mesh-dependent, asexpected. The peak stress occurs at the transition point and decreases as the ratio ofelement size to fillet size increases. Therefore, this explains why a lower stress is predictedfor a smaller fillet if the element size is kept constant. Stress increases significantly as theelement size decreases. This phenomenon will go on indefinitely due to the stresssingularity at the transition point. Accordingly, the value of peak stress obtained from thisanalysis is totally dependent on the element size chosen.Fig. 14 presents results of hot spot and mesh-insensitive analyses on the straight fillet
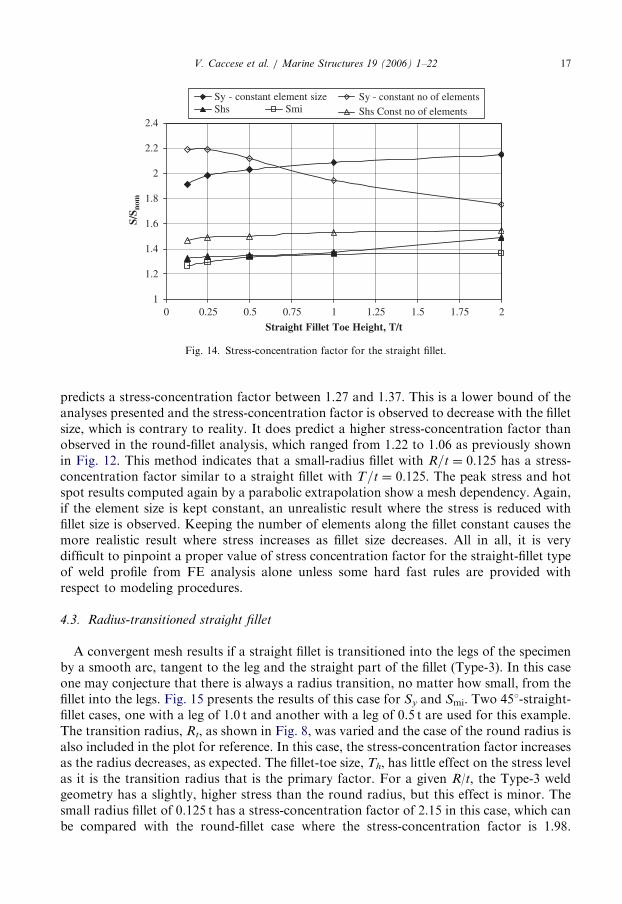
along with the peak value from the FE analysis using either a constant element size (t/16)or constant number of elements along the fillet (equal to 10 in this analysis). The mesh-insensitive approach provides a consistent value of structural stress for each fillet size and
0
0.5
1
1.5
2
2.5
3
0 0.4 0.6 0.8 1 1.2
S y/S
nom
T/t=1.0T/t=1.0 fineT/t=0.5T/t=0.25
y
-0.2
Vertical distance from weld toe, y/ t, in0.2
Straight Fillet
Fig. 13. Stress distribution for the straight fillet.
ARTICLE IN PRESS
1
1.2
1.4
1.6
1.8
2
2.2
2.4
0 1 2
Sy - constant element sizeShs Smi
Sy - constant no of elementsShs Const no of elements
S/S n
om
Straight Fillet Toe Height, T/t0.25 0.5 0.75 1.25 1.5 1.75
Fig. 14. Stress-concentration factor for the straight fillet.
V. Caccese et al. / Marine Structures 19 (2006) 1–22 17
predicts a stress-concentration factor between 1.27 and 1.37. This is a lower bound of theanalyses presented and the stress-concentration factor is observed to decrease with the filletsize, which is contrary to reality. It does predict a higher stress-concentration factor thanobserved in the round-fillet analysis, which ranged from 1.22 to 1.06 as previously shownin Fig. 12. This method indicates that a small-radius fillet with R=t ¼ 0:125 has a stress-concentration factor similar to a straight fillet with T=t ¼ 0:125. The peak stress and hotspot results computed again by a parabolic extrapolation show a mesh dependency. Again,if the element size is kept constant, an unrealistic result where the stress is reduced withfillet size is observed. Keeping the number of elements along the fillet constant causes themore realistic result where stress increases as fillet size decreases. All in all, it is verydifficult to pinpoint a proper value of stress concentration factor for the straight-fillet typeof weld profile from FE analysis alone unless some hard fast rules are provided withrespect to modeling procedures.
4.3. Radius-transitioned straight fillet
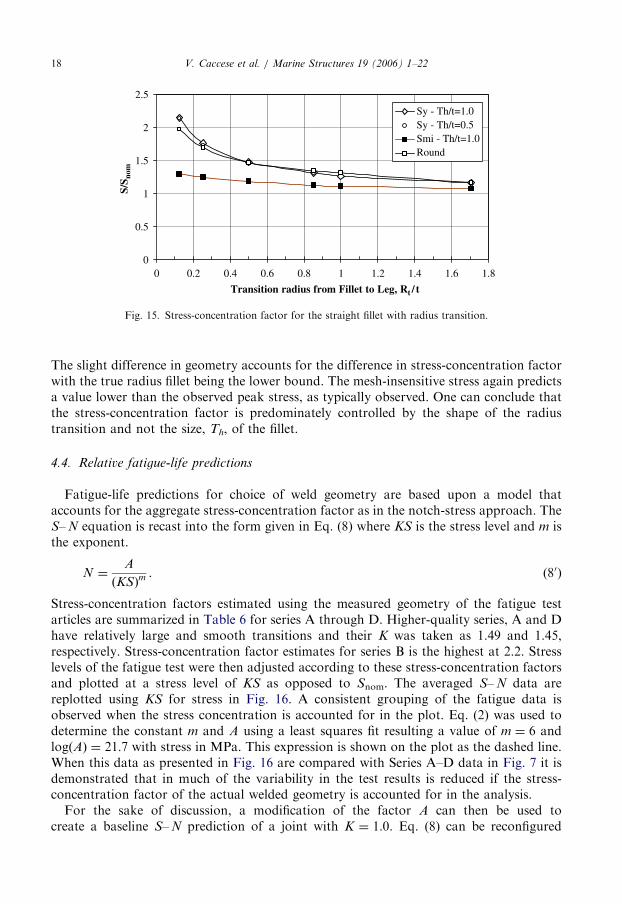
A convergent mesh results if a straight fillet is transitioned into the legs of the specimenby a smooth arc, tangent to the leg and the straight part of the fillet (Type-3). In this caseone may conjecture that there is always a radius transition, no matter how small, from thefillet into the legs. Fig. 15 presents the results of this case for Sy and Smi. Two 451-straight-fillet cases, one with a leg of 1.0 t and another with a leg of 0.5 t are used for this example.The transition radius, Rt, as shown in Fig. 8, was varied and the case of the round radius isalso included in the plot for reference. In this case, the stress-concentration factor increasesas the radius decreases, as expected. The fillet-toe size, Th, has little effect on the stress levelas it is the transition radius that is the primary factor. For a given R/t, the Type-3 weldgeometry has a slightly, higher stress than the round radius, but this effect is minor. Thesmall radius fillet of 0.125 t has a stress-concentration factor of 2.15 in this case, which canbe compared with the round-fillet case where the stress-concentration factor is 1.98.
ARTICLE IN PRESS
0
0.5
1
1.5
2
2.5
0 0.2 0.4 0.6 0.8 1 1.2 1.4 1.6 1.8
S/S n
om
Transition radius from Fillet to Leg, Rt / t
Sy - Th/t=1.0Sy - Th/t=0.5Smi - Th/t=1.0Round
Fig. 15. Stress-concentration factor for the straight fillet with radius transition.
V. Caccese et al. / Marine Structures 19 (2006) 1–2218
The slight difference in geometry accounts for the difference in stress-concentration factorwith the true radius fillet being the lower bound. The mesh-insensitive stress again predictsa value lower than the observed peak stress, as typically observed. One can conclude thatthe stress-concentration factor is predominately controlled by the shape of the radiustransition and not the size, Th, of the fillet.
4.4. Relative fatigue-life predictions
Fatigue-life predictions for choice of weld geometry are based upon a model thataccounts for the aggregate stress-concentration factor as in the notch-stress approach. TheS– N equation is recast into the form given in Eq. (8) where KS is the stress level and m isthe exponent.
N ¼A
ðKSÞm. (80)
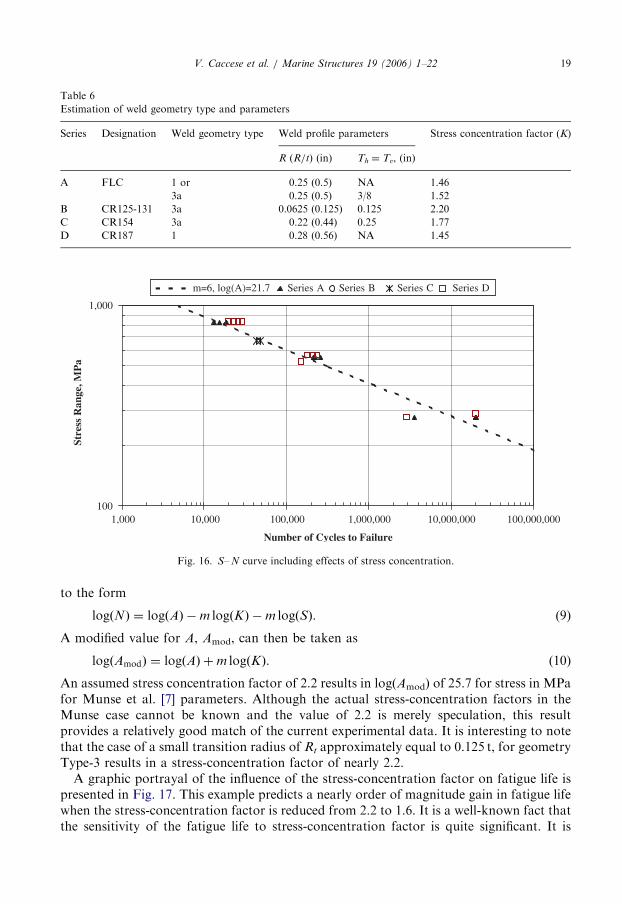
Stress-concentration factors estimated using the measured geometry of the fatigue testarticles are summarized in Table 6 for series A through D. Higher-quality series, A and Dhave relatively large and smooth transitions and their K was taken as 1.49 and 1.45,respectively. Stress-concentration factor estimates for series B is the highest at 2.2. Stresslevels of the fatigue test were then adjusted according to these stress-concentration factorsand plotted at a stress level of KS as opposed to Snom. The averaged S– N data arereplotted using KS for stress in Fig. 16. A consistent grouping of the fatigue data isobserved when the stress concentration is accounted for in the plot. Eq. (2) was used todetermine the constant m and A using a least squares fit resulting a value of m ¼ 6 andlogðAÞ ¼ 21:7 with stress in MPa. This expression is shown on the plot as the dashed line.When this data as presented in Fig. 16 are compared with Series A–D data in Fig. 7 it isdemonstrated that in much of the variability in the test results is reduced if the stress-concentration factor of the actual welded geometry is accounted for in the analysis.For the sake of discussion, a modification of the factor A can then be used to
create a baseline S– N prediction of a joint with K ¼ 1:0. Eq. (8) can be reconfigured
ARTICLE IN PRESS
1001,000 10,000 100,000 1,000,000 10,000,000 100,000,000
Stre
ss R
ange
, MP
a
m=6, log(A)=21.7 Series A Series B Series C
1,000
Number of Cycles to Failure
Series D
Fig. 16. S– N curve including effects of stress concentration.
Table 6
Estimation of weld geometry type and parameters
Series Designation Weld geometry type Weld profile parameters Stress concentration factor (K)
R (R/t) (in) Th ¼ Tv, (in)
A FLC 1 or 0.25 (0.5) NA 1.46
3a 0.25 (0.5) 3/8 1.52
B CR125-131 3a 0.0625 (0.125) 0.125 2.20
C CR154 3a 0.22 (0.44) 0.25 1.77
D CR187 1 0.28 (0.56) NA 1.45
V. Caccese et al. / Marine Structures 19 (2006) 1–22 19
to the form
logðNÞ ¼ logðAÞ �m logðKÞ �m logðSÞ. (9)
A modified value for A, Amod, can then be taken as
logðAmodÞ ¼ logðAÞ þm logðKÞ. (10)
An assumed stress concentration factor of 2.2 results in log(Amod) of 25.7 for stress in MPafor Munse et al. [7] parameters. Although the actual stress-concentration factors in theMunse case cannot be known and the value of 2.2 is merely speculation, this resultprovides a relatively good match of the current experimental data. It is interesting to notethat the case of a small transition radius of Rt approximately equal to 0.125 t, for geometryType-3 results in a stress-concentration factor of nearly 2.2.
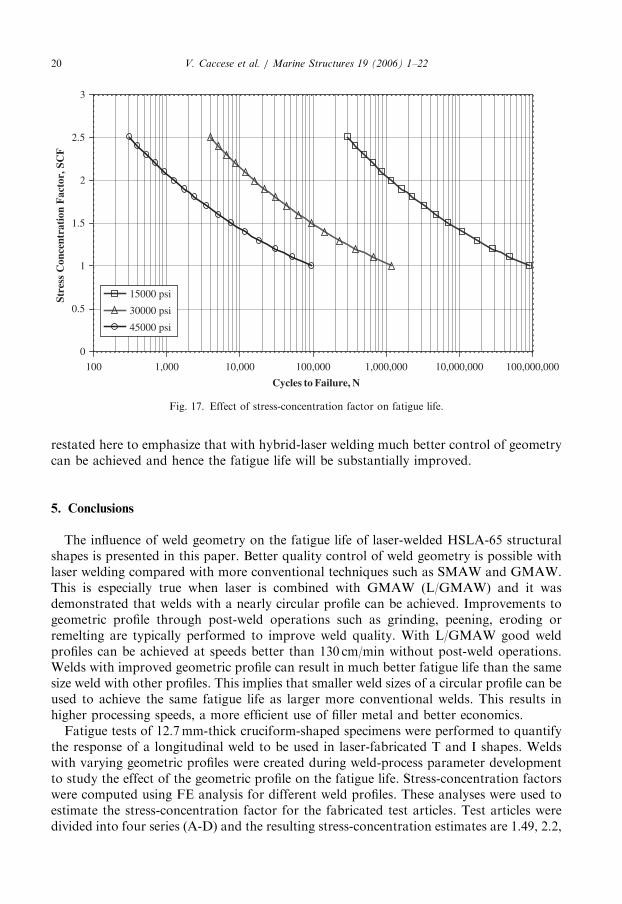
A graphic portrayal of the influence of the stress-concentration factor on fatigue life ispresented in Fig. 17. This example predicts a nearly order of magnitude gain in fatigue lifewhen the stress-concentration factor is reduced from 2.2 to 1.6. It is a well-known fact thatthe sensitivity of the fatigue life to stress-concentration factor is quite significant. It is
ARTICLE IN PRESS
0
0.5
1
1.5
2
2.5
3
Stre
ss C
once
ntra
tion
Fac
tor,
SC
F
15000 psi
30000 psi
45000 psi
100,000,00010,000,0001,000,000
Cycles to Failure, N
100 1,000 10,000 100,000
Fig. 17. Effect of stress-concentration factor on fatigue life.
V. Caccese et al. / Marine Structures 19 (2006) 1–2220
restated here to emphasize that with hybrid-laser welding much better control of geometrycan be achieved and hence the fatigue life will be substantially improved.
5. Conclusions
The influence of weld geometry on the fatigue life of laser-welded HSLA-65 structuralshapes is presented in this paper. Better quality control of weld geometry is possible withlaser welding compared with more conventional techniques such as SMAW and GMAW.This is especially true when laser is combined with GMAW (L/GMAW) and it wasdemonstrated that welds with a nearly circular profile can be achieved. Improvements togeometric profile through post-weld operations such as grinding, peening, eroding orremelting are typically performed to improve weld quality. With L/GMAW good weldprofiles can be achieved at speeds better than 130 cm/min without post-weld operations.Welds with improved geometric profile can result in much better fatigue life than the samesize weld with other profiles. This implies that smaller weld sizes of a circular profile can beused to achieve the same fatigue life as larger more conventional welds. This results inhigher processing speeds, a more efficient use of filler metal and better economics.Fatigue tests of 12.7mm-thick cruciform-shaped specimens were performed to quantify
the response of a longitudinal weld to be used in laser-fabricated T and I shapes. Weldswith varying geometric profiles were created during weld-process parameter developmentto study the effect of the geometric profile on the fatigue life. Stress-concentration factorswere computed using FE analysis for different weld profiles. These analyses were used toestimate the stress-concentration factor for the fabricated test articles. Test articles weredivided into four series (A-D) and the resulting stress-concentration estimates are 1.49, 2.2,
ARTICLE IN PRESSV. Caccese et al. / Marine Structures 19 (2006) 1–22 21
1.77 and 1.45, respectively. The lower stress-concentration factor resulted in better fatiguelife, as expected.
In the FE analyses, a circular-shaped fillet is shown to converge to a stress-concentrationfactor of unity at a weld radius of more than twice the plate thickness being welded. Thissize weld is large and impractical for most situations. Therefore, compromises on thefatigue life must be made, such as reducing the weld size to practical and economicalproportions. Welds with sharp corners such as a straight fillet, classified as Type-2 in thispaper, have theoretically infinite stress-concentration factors. Special techniques arerequired to assess a stress-concentration factor for these weld shapes. Two such techniquesare the hot spot approach and mesh-insensitive approach, which were used in anevaluation of the specimens tested. These approaches were compared with convergentcases of numerical analysis where a single value of stress-concentration factor can bedetermined. The hot spot and mesh-insensitive approaches resulted in consistent stress-concentration factors that were significantly lower in magnitude than the FE results. Weldswith a flat region transitioned by a radius are common with laser welds, and arecategorized as Type-3. It was demonstrated that the critical parameter is the radius atwhich the flat section of the weld transitions to the load-carrying element. Increasing thetoe size without increasing this radius has negligible effect on the stress-concentrationfactor, and may not help to increase the fatigue life of this type of profile. Analysistechniques that capture the effect of weld geometric profile in the design process will allowfabricators to take economic advantage of the welding-technique improvements.
Fatigue-test results were compared to historical data provided by Munse et al. [7] for thecruciform test articles and the fatigue life of all laser-welded specimens in Series A–D wassignificantly better. The laser-welded data were also compared with fatigue tests ofconventionally welded cruciform specimens made of the same HSLA-65 material tested byKihl [13]. The laser-welded test articles in Series A and D with the lower stress-concentration factors performed better than the conventionally welded specimens tested.When stress-concentration factor is accounted for in the data analysis, the fatigue testresults show much less variability and can be lumped into one master curve.
Acknowledgments
The authors would like to acknowledge the Office of Naval Research (ONR) and JohnCarney, MANTECH Program Officer for their support and funding of this project underONR contract no. N00014-01-C-0355. Also acknowledged are Ed Hansen and Dave Patchof PL Systems Inc., of Brunswick, Maine for their support of this effort. Furthermore, theinput and guidance of NAVSEA Carderock Division, especially Drs. Dave Kihl andErnest Czyryca is gratefully acknowledged. The authors would also like to acknowledgeand thank the Maine Technology Institute (MTI) for their support and funding of the lasercenter.
References
[1] Kirkhope KJ, Bell R, Caron L, Basu RI, Ma KT. Weld detail fatigue life improvement techniques, part 1:
review. Marine Struct 1999;V12:447–74.
[2] Kirkhope KJ, Bell R, Caron L, Basu RI, Ma KT. Weld detail fatigue life improvement techniques, part 2:
application to ship structures. Marine Struct. 1999;V12:477–96.
ARTICLE IN PRESSV. Caccese et al. / Marine Structures 19 (2006) 1–2222
[3] Duhamel RF. Laser welding of thick plates. Structural and heavy plate fabrication conference, New Orleans,
LA, November 1996.
[4] Kendrick A. Effect of fabrication tolerance on fatigue life of welded joints. Ship Structure Committee, SSC-
436, NTIS, Springfield, VA 22161. 2005.
[5] Assakkaf IA, Ayyub BM. Load and resistance factor design approach for fatigue of marine structures. In:
Eighth ASCE specialty conference on probabilistic mechanics and structural reliability, PMC2000-169, Notre
Dame, IA.
[6] Maddox SJ. Fatigue of welded joints. In: Seminar on fatigue performance of weldments–update 1983.
Cambridge, England: The Welding Institute; 1983.
[7] Munse WH, Wilbur TW, Tellalian ML, Nicoll K, Wilson K. Fatigue characterization of fabricated ship
details for design. Ship Structure Committee 1983, SSC-318, NTIS, Springfield, VA 22161. 1983.
[8] Mansour A, Wirsching P, White G, Ayyub B. Probability based ship design implementation of design
guidelines for ships: a demonstration. Ship Structure Committee SSC-392, NTIS 1996.
[9] Fricke W, Evaluation of hot spot stresses in complex welded structures. In: Proceedings of The IIW fatigue
seminar, Commission XIII, International Institute of Welding, Tokyo. 2002.
[10] Niemi E, Marquis G. Introduction to the structural stress approach to fatigue analysis of plate structures. In:
Proceedings of the IIW fatigue seminar, Tokyo. 2002. p. 18.
[11] Dong P. Mesh-insensitive structural stress method for fatigue evaluation of welded structures. Batelle
Memorial Institute, JIP training course, Houston, TX. May 2005.
[12] Dong P. A robust structural stress method for fatigue analysis of ship structures. In: Proceedings of the 22nd
International Conference on offshore mechanics and arctic Engineering, Cancun, Mexico. June 2003.
[13] Kihl DP. Fatigue strength of HSLA-65 weldments. Naval Surface Warfare Center–Carderock Division;
Survivability, structures, and materials directorate technical report, July 2002.
[14] Berube KA, Caccese V, Kihl DP. Fatigue strength of laser welded HSLA-65 steel cruciforms. University
Maine Department of Mechanical Engineering, report no. C2000-001-RPT-003, March 2005, p. 40.