Embed Size (px)
Citation preview

EFFECT OF MORINGA LEAF MEAL (MOLM) ON NUTRIENT DIGESTIBILITY, GROWTH,
CARCASS AND BLOOD INDICES OF WEANER RABBITS
BY
FREDERICK NUHU
FEBRUARY, 2010
KWAME NKRUMAH UNIVERSITY OF SCIENCE AND TECHNOLOGY, KUMASI
FACULTY OF AGRICULTURE AND NATURAL RESOURCES
DEPARTMENT OF ANIMAL SCIENCE
EFFECT OF MORINGA LEAF MEAL (MOLM) ON NUTRIENT DIGESTIBILITY,
GROWTH, CARCASS AND BLOOD INDICES OF WEANER RABBITS
A THESIS SUBMITTED TO THE SCHOOL OF GRADUATE STUDIES, KWAME
NKRUMAH UNIVERSITY OF SCIENCE AND TECHNOLOGY, KUMASI, IN
PARTIAL FULFILMENT OF THE REQUIREMENTS FOR THE AWARD OF MASTER
OF SCIENCE DEGREE IN ANIMAL NUTRITION
BY
FREDERICK NUHU
B.SC. (HONS) AGRIC. (CAPE COAST)
FEBRUARY, 2010

i
CERTIFICATION
I, Nuhu Frederick, hereby certify that the work herein submitted as a thesis for the Master of
Science (Animal Nutrition) degree has neither in whole nor in part been presented nor is being
concurrently submitted for any other degree elsewhere. However, works of other researchers and
authors which served as sources of information were duly acknowledged by references of the
authors.
Name of student: Frederick Nuhu
Signature:
Date:
Name of supervisor: Mr. P.K. Karikari Name of head of department: Prof. E.L.K. Osafo
Signature: Signature:
Date: Date:

ii
TABLE OF CONTENTS
Title Page
Certification i
List of Tables vi
Acknowledgement xi
Abstract xii
Chapter one 1
1.0 Introduction 1
Chapter two 4
2.0 Literature Review 4
2.1 Origin and distribution of moringa 4
2.2 Uses of moringa 4
2.3 Nutritive value of moringa plant 5
2.4 Phytochemicals of moringa and their uses 8
2.5 Moringa leaf production 10
2.6 Soyabean meal (SBM) 11
2.7 Nutritional evaluation of leaf meals on the performance of animals 12
2.8 Antinutritional factors 17

iii
2.9 Effect of nutrition on biochemical and haematological blood components
of rabbits 20
2.10 Importance of rabbit production 23
2.11 Nutrient requirements of rabbits 25
2.11.1 Crude protein 25
2.11.2 Energy 30
2.11.3 Crude fibre 32
2.11.4 Minerals and vitamins 34
2.11.5 Water as a nutrient for rabbits 36
2.12 The digestive tract of rabbits 37
2.13 Gut microbes and utilization of fibre in rabbits 39
2.14 Utilization of protein in rabbits 40
2.15 Utilization of starch in rabbits 41
2.16 Calcium metabolism in rabbits 41
2.17 Rabbit meat composition 42
2.18 Review of findings on rabbits under tropical conditions 43
2.18.1 Feed intake, weight gain, FCE and mortality of rabbits fed
concentrates in the tropics 43
2.18.2 Haematological and biochemical values of rabbits 49
2.18.3 Carcass characteristics of rabbits under tropical conditions 52
2.18.4 Digestibility values of rabbits fed concentrates in the tropics 54
Chapter three 59
3.0 Materials and Methods 59

iv
3.1 Experimental site 59
3.2 Cultivation of moringa plants 59
3.3 Sources of feed ingredients and experimental animals 60
3.4 Processing of moringa leaves 60
3.5 Experimental animals and management 60
3.6 Experimental diet 61
3.7 Experimental design and duration of experiment 61
3.8 Growth study 61
3.9 Blood sample collection and analysis 62
3.10 Digestibility study 63
3.11 Carcass yield evaluation 63
3.12 Economics of production 64
3.13 Statistical analysis 65
Chapter four 66
4.0 Results 66
4.1 Moringa cultivation 66
4.1.1 Chemical composition of moringa leaf meal (MOLM) 66
4.2 Percentage inclusion levels and chemical contents of experimental diets 67
4.3 Productive performance of rabbits fed moringa diets 68
4.4 Apparent nutrient digestibility of rabbits fed moringa diets 70
4.5 Carcass measurements and meat composition of rabbits fed moringa
diets 70
4.6 Blood components of rabbits fed moringa diets 72

v
Chapter five 73
5.0 Discussion 73
Chapter six 84
6.0 Conclusions and Recommendation 84
References 85
Appendices 101

vi
LIST OF TABLES
Page
Table 1.0:
Analysis of nutritional value of moringa pods, fresh (raw) leaves and 6
dry leafy powder per 100 g of edible portion
Table 2.0:
Chemical composition of extracted and unextracted moringa leaves 8
Table 3.0:
Production parameters of moringa at first cutting 10
Table 4.0:
Production parameters of moringa at first cutting on test plots with high
density plants 10
Table 5.0:
Crude protein and essential amino acids in soyabean meal (dry matter basis) 11
Table 6.0:
Normal physiological ranges of haematological and biochemical components
for rabbits 23
Table 7.0:
Nutrient requirements of rabbits 27
Table 8.0:
Minimum dietary protein and amino acids recommendations for rabbits 29

vii
Table 9.0:
The chemical composition of rabbit meat as compared to other common meats 43
Table 10.0:
The effect of feeding graded levels of cassava root meal (CRM)
on the live performance of fryer rabbits 44
Table 11.0:
Performance of rabbits fed diets containing poplar leaf meal 45
Table 12.0:
Performance of weaner rabbits fed varying dietary cyanide levels 45
Table 13.0:
Effect of palmitic acid fortified maize wet-milling by-products on the performance
of weaner rabbits 46
Table 14.0:
Effect of different levels of cassava meal and supplementary palm oil on
weaner rabbits 48
Table 15.0:
Effect of unsupplemented cassava peel meal and protein sources on the performance
of growing rabbits 48
Table 16.0:
Performance of weaner rabbits fed graded levels of gliricidia leaf meal (GLM) diets 49
Table 17.0:
Mean leucocytic and erythrocytic values for rabbits reared at different stocking densities 50

viii
Table 18.0:
Haematological and biochemical components of rabbits fed diets containing raw,
boiled, toasted or soaked pigeon pea seed 50
Table 19.0:
Summary of blood haematological components of rabbits fed various processed forms
of cassava based diets 51
Table 20.0:
Serum biochemical characteristics of buck rabbits fed graded levels of neem leaf
meal (NLM) 52
Table 21.0:
Carcass characteristics of rabbits fed varying levels of dietary cyanide 52
Table 22.0:
Organ weights of rabbits fed graded levels of gliricidia leaf meal 53
Table 23.0:
Carcass yield (%live weight) of rabbits fed different levels of palmitic acid fortified
maize wet milling by-product 53
Table 24.0:
Carcass characteristics of New Zealand White rabbits 54
Table 25.0:
Apparent digestibility of rabbits fed concentrates, grass and legume combinations 55
Table 26.0:
Apparent nutrient digestibility of rabbits fed varying levels of dietary cyanide 56

ix
Table 27.0:
Nutrient digestibility coefficient of weaner rabbits fed
graded levels of soyabean cheese waste/maize offal meal and brachiaria hay 56
Table 28.0:
Dry matter and nutrient digestibility of diets containing different
percentages of concentrates and mulberry leaves fed to rabbits 57
Table 29.0:
Nutrient digestibility values of rabbits fed diets containing poplar leaf meal 58
Table 30.0:
Feed ingredients and their prices per kilogramme 64
Table 31.0:
Moringa leaf production at 90 days of planting 66
Table 32.0:
Chemical composition of moringa leaf meal (MOLM) 66
Table 33.0:
Percentage inclusion and chemical contents of experimental diets fed to weaner rabbits 67
Table 34.0:
Productive performance of weaner rabbits fed moringa diets 69
Table 35.0:
Apparent nutrient digestibility of rabbits fed moringa leaf meal (MOLM)
diets 70

x
Table 36.0:
Carcass measurements (g) and meat composition (%) of rabbits fed moringa diets 71
Table 37.0:
Blood haematological and biochemical components of weaner rabbits fed moringa diets 72

xi
ACKNOWLEDGEMENT
I thank the Almighty God for blessing me to complete this project without any hitch. Special
thanks and appreciation go to my project supervisor, Mr. P.K. Karikari, for his patience,
guidance, assistance and technical advice. His astute comments and suggestions have added
considerably to the clarity and organization of presentation of this work. May God richly bless
him and his family.
My appreciation also goes to Professor E.L.K. Osafo, the Head of Department of Animal
Science, KNUST, Professor D.B. Okai and all other lecturers of the Department for their
constructive criticisms regarding the thesis synopsis as well as the invaluable support during the
course of my studies.
I am also indebted to Mr. Godwin Deku and all the staff of the KNUST Dairy/Beef Cattle
Research Station for their diverse contributions towards the success of this project.
The technical and laboratory assistance given to me by Mr. Joseph Bentil, an Analytical Chemist
of the Animal Nutrition Laboratory, KNUST, Kumasi, is also acknowledged.
My sincere thanks also go to Mr. Christian Asumah who helped me in various ways including
the typing of the manuscript.
Finally, the spiritual and moral support given by my family and my sister Mrs. Helena Awaafoh
is highly appreciated.

xii
ABSTRACT
The study involved the cultivation of moringa and the use of the moringa leaf meal (MOLM) to
determine its effect on nutrient digestibility, growth, carcass characteristics and haematological
and biochemical indices of weaner rabbits.
Five (5) treatment diets were formulated to contain MOLM inclusion levels of 0% (control), 5%,
10%, 15% and 20%. Thirty (30) weaner rabbits of mixed breeds and sexes were used for the
experiment. They were randomly divided into 5 groups of 6 animals per treatment with 2 animals
per replicate, in a Completely Randomized Design (CRD). Feed and water were provided ad
libitum.
Data obtained from the moringa cultivation showed that on dry matter (DM) basis, 425.10 kg/ha
of moringa leaves could be produced at first harvest at 90 days of age using a planting spacing of
1.3 × 1.3 m. Elemental analysis of the moringa leaf meal (MOLM) on DM basis indicated that
the leaves contained 24.65% DM, 29.25% CP, 2.23% EE, 19.25% CF, 7.13% ash, 41.98% NFE,
0.33% P and 8.64% Ca.
The dry matter (DM) and CP digestibility values were affected (p<0.05) by dietary treatments
whilst the CF and EE digestibility values were not (p>0.05).
The average daily feed intake and FCR did not differ between dietary treatments (p>0.05),
however, the average daily weight gain was higher (p<0.05) in rabbits on the MOLM based-diets
(13.49, 13.69, 14.03, 15.01 g/d) compared to those on the control diet (11.71 g/d).

xiii
Except for meat crude protein and ether extract, which were influenced by dietary treatment
(p<0.01), the carcass characteristics studied did not differ between treatments (p>0.05). All the
blood parameters studied did not vary between treatments (p>0.05).
The cost of feed to gain a kilogramme weight, although not significant (p>0.05), was highest
when soyabean meal (SBM) was completely replaced with MOLM due solely to the large price
disparities between MOLM and SBM.
The study revealed that the MOLM is rich in nutrients. It also showed that the MOLM could be
used as a partial or total replacement for SBM without any adverse effect on the productive
performance and blood indices of weaner rabbits.

1
CHAPTER ONE
1.0 INTRODUCTION
Protein supplementation is often important to improve livestock performance, and this needs to
be done with respect to the requirements of the animal in addition to the balance of other
nutrients available. Soyabean meal and fish meal have been widely and successfully used as
conventional protein sources for livestock.
However, the prices of these protein sources have been escalating continuously in recent times,
whilst availability is often erratic. The problem has been worsened due to the increasing
competition between humans and livestock for these protein ingredients as food. According to
Odunsi (2003) the rapid growth of human and livestock population, which is creating increased
needs for food and feed in the less developed countries, demand that alternative feed resources
must be identified and evaluated.
In Low-Income Food-Deficit Countries (LIFDCs), surplus of cereals is generally not available;
therefore, it is not advisable to develop a wholly grain-based feeding system. The recommended
policy is to identify and use locally available feed resources to formulate diets that are as
balanced as possible(Guèye and Branckaert, 2002). There is the need, therefore, to explore the
use of non-conventional feed sources that have the capacity to yield the same output as
conventional feeds,and perhaps at cheaper cost.
Hence, any similar high protein ingredient which could partially or completely be used as a
substitute for soyabean meal or fishmeal is desirable.

2
This strategy could help reduce the cost of production, and ensure cheaper meat production
thereby making available the major crops for human consumption. The economization of feed
cost using cheaper and unconventional feed resources (Vasanthakumar et al., 1999; Bhatt and
Sharma, 2001; Muriu et al., 2002) is an important aspect of commercial rabbit production.
One possible source of cheap protein is the leaf meals of some tropical legume browse plants.
Leaf meals do not only provide protein source but also some essential vitamins such as vitamins
A and C, minerals and oxycarotenoids. The constraints to enhanced utilization of leaf meals
reside chiefly on factors such as fibre content, the presence of anti-nutritive compounds and
deficiencies of certain amino acids.
Recently, there has been interest in the utilization of moringa (Moringa oleifera) commonly
called horseradish tree or drumstick tree, as a protein source for livestock (Makker and Becker,
1997; Sarwatt et al., 2002). Moringa leaves have quality attributes that make it a potential
replacement for soyabean meal or fish meal in non-ruminant diets. Moringa can easily be
established in the field, has good coppicing ability, as well as good potential for forage
production. Furthermore, there is the possibility of obtaining large amounts of high quality
forage from moringa without expensive inputs due to favourable soil and climatic conditions for
its growth. Sarwattet al. (2004) reported that moringa foliages are a potential inexpensive protein
source for livestock feeding. The advantages of using moringa for a protein resource are
numerous, and include the fact that it is a perennial plant that can be harvested several times in
one growing season and also has the potential to reduce feed cost.Moringa oleifera is in the
group of high-yielding nutritious browse plants with every part having food value (Duke, 1998).

3
Despite the high crude protein content of moringa leaf meal, there is little information available
on the use of this unconventional feed resource, especially as an alternative protein supplement
for rabbit production.
The present study aimed at assessing the possibility of replacing soyabean meal either partially
or completely with moringa leaf meal for weaner rabbits.
The objectives of the study were to:
Evaluate the chemical content of cultivated, air-dried moringa leaf meal.
Assess the performance of weaner rabbits fed on diets containing varying levels of
moringa leaf meal.
Determine the carcass and blood haematological and biochemical indices of the weaner
rabbits fed the varying levels of the moringa leaf meal, and
Assess the economics of rabbit production using moringa diets.

4
CHAPTER TWO
2.0 LITERATURE REVIEW
2.1 Origin and distribution of moringa
Moringa (Moringa oleifera Lam), according to Makkar and Becker(1997), belongs to the
moringaceae family, and is considered to have its origin in the north-west region of India, south
of the Himalayan mountains. It is now widely cultivated and has become naturalized in many
locations in the tropics (Faheyet al., 2001). Kristin (2000) reported that there are thirteen species
of moringa trees in the family moringaceae and that Moringa oleifera is the most widely
cultivated species. It was further stated that they are native to India, the Red Sea area and/or parts
of Africa including Madagascar. Moringa oleifera is indigenous to Northern India and Pakistan
(Bosch, 2004) and was introduced throughout the tropics and sub-tropics becoming naturalized
in many African countries. This rapidly-growing tree also known as horseradish tree or
drumstick tree was utilized by the ancient Romans, Greeks and Egyptians.
2.2 Uses of moringa
All parts of the moringa tree are edible and have long been consumed by humans. Fuglie (1999)
reported the many uses of moringa as follows: alley cropping (biomass production), animal
forage (leaves and treated seed-cake), biogas (from leaves), domestic cleaning agent (crushed
leaves), blue dye (wood), fertilizer (seed-cake), foliar nutrient (juice expressed from the leaves),
green manure (from leaves), gum (from tree trunks), honeyand sugar cane juice-clarifier
(powdered seeds), honey (flower nectar), medicine (all plant parts), ornamental plantings,
biopesticide (soil incorporation of leaves to prevent seedling damping off), pulp (wood), rope
(bark), tannins for tanning hides (bark and gum), and water purification(Powdered seeds).

5
In the West, one of the best known uses for moringa is the use of powdered seeds to flocculate
contaminants and purifying drinking water (Berger et al., 1984; GassenSchmidt et al., 1995;
Olsen, 1987), but the seeds are also eaten green, roasted, powdered and steeped for tea or used in
curries (GassenSchmidt et al., 1995). Moringa seed oil (yield 30-40% by weight), also known as
Ben oil, is a sweet non-sticking, non-drying oil that resists rancidity. This tree according to
Faheyet al. (2001) has in recent times been advocated as an outstanding indigenous source of
highly digestible protein, calcium, iron, vitamin C, and carotenoids suitable for utilization in
many of the so-called “developing” regions of the world where undernourishment is a major
concern.
The cytokinine-type hormones extracts of moringa leaves in 80% ethanol as a foliar spray can be
used according to Foidl et al. (2001) to accelerate the growth of young plants such as soyabean,
blackbean, maize, onion, sorghum, tomato, coffee, and sugar cane. Moringa leaves have also
been shown to increase breast milk production (Estrella et al., 2000). In many Asian and African
countries (Fuglie, 2001) women consume moringa leaves to enhance breast milk production.
Moringa leaves have very strong antioxidant activity (Siddhuraju and Becker, 2003; Yang et al.,
2006).
2.3 Nutritive value of moringa plant
Grubben and Denton (2004) reported that the leafy tips of Moringa oleifera contain per 100 g
edible portion: water 78.7 g, energy 268 kJ (64 kcal), protein 9.4 g, fat 1.4 g, carbohydrates 8.3
g, total dietary fibre 2.0 g, Ca 185 mg, Mg 147 mg, P 112 mg, Fe 4.0 mg, Zn 0.6 mg, vitamin A
7564 IU, thiamine 0.3 mg, riboflavin 0.7 mg, niacin 2.2 mg, folate 40 µg, and ascorbic acid 51.7
mg.

6
The raw fruits of the plant, according to Bosch (2004), contain per 100 g edible portion: water
88.2 g, energy 155 kJ (37 kcal), protein 2.1 g, fat 0.2 g, carbohydrates 8.5 g, total dietary fibre
3.2 g, Ca 30 mg, Mg 45 mg, P 50 mg, Fe 0.4 mg, Zn 0.4 mg, vitamin A 74 IU, thiamin 0.05 mg,
riboflavin 0.07 mg, niacin 0.6 mg, folate 44 µg, and ascorbic acid 141.0 mg. The analysis of
nutritional value of moringa is presented in Table 1.0.
Table 1.0: Analysis of nutritional value of Moringa pods, fresh (raw) leaves and dried leafy
powder per 100 g of edible portion.
Components Pods Leaves Leaf powder
Moisture (%) 86.9 75.0 7.5
Calories 26 92 205
Protein (g) 2.5 6.7 27.1
Fat (g) 0.1 1.7 2.3
Carbohydrates (g) 3.7 13.4 38.2
Fibre (g) 4.8 0.9 19.2
Minerals (g) 2.0 2.3 -
Ca Calcium (mg) 30 440 2003
Cu Copper (mg) 3.1 1.1 0.57
Fe Iron (mg) 5.3 7.0 28.2
K Potassium (mg) 259 259 1324
Mg Magnesium (mg) 24 24 368
P Phosphorus (mg) 110 70 204
S Sulphur (mg) 137 137 870
Se Selenium (mg) - - 0.09
Zn Zinc (mg) - - 3.29
Oxalic acid (mg) 10 101 1600
Vitamin A (mg) 0.11 6.8 18.9
Vitamin B (mg) 423 423 -
Vitamin B1(mg) 0.05 0.21 2.64
Vitamin B2 (mg) 0.07 0.05 20.5
Vitamin B3 (mg) 0.2 0.8 8.2
Vitamin C (mg) 120 220 17.3
AMINO ACIDS
Arginine (mg) 90 402 1325
Histidine (mg) 27.5 141 613
Isoleucine (mg) 110 422 825
Leucine (mg) 163 623 1950
Lysine (mg) 37.5 288 1325
Methionine (mg) 35 134 350
Phenylanaline (mg) 108 429 1388
Threonine (mg) 98 328 1188
Tryptophan (mg) 20 127 425
Valine (mg) 135 476 1063
Source: Booth and Wickens (1988)

7
Moringa oleifera leaves could serve as a valuable source of nutrients for all age groups. For
example, in Haiti and Senegal, health workers have been treating malnutrition in small children,
pregnant and nursing women with Moringa leaf powder (Price, 1985). The leaves are known to
be great source of vitamins and minerals being served raw, cooked or dried.
Fugile (2005) reported that 8 g serving of dried leaf powder will satisfy a child within ages 1-3
years with 14% of the protein, 40% of the calcium, 23% of the iron, and nearly all vitamin A that
the child needs in a day.
One 100 g portion of leaves could provide a woman with over a third of her daily need of
calcium and give her important quantities of iron, protein, copper, sulphur, and B-vitamins. It is
estimated that only 20-40% of vitamin A content will be retained if leaves are dried under direct
sunlight, but that 50-70% will be retained if leaves are dried in the shade (Subadra et al., 1997).
The nutritional characteristics of the moringa tree are excellent so it can easily be used as a fresh
forage material for animals. The leaves are rich in protein, carotene, iron and ascorbic acid and
the pod is rich in the amino acid lysine (CSIR, 1962). In an experiment where extracted and
unextracted leaves of moringa were used as a component of animal feed, Makker and Becker
(1996) analyzed these samples for nutrients and antinutrients.
Table 2.0 presents the chemical composition of both the extracted and unextracted moringa
leaves. The extracted and unextracted moringa leaves gave crude protein values of 43.5 and
25.1% respectively, suggesting that both the extracted and unextracted leaves are good sources
of protein for livestock. As expected, the crude protein and fibre contents of the extracted leaves
were higher than those of the unextracted leaves due to the loss of some cell solubles and lipids
during the treatment with 80% ethanol.

8
The crude protein, crude lipids and ash values of 26.4%, 6.5% and 12%, respectively were
reported for the unextracted leaves by Gupta et al. (1989).Also, higher levels of NDF (28.8%)
and ADF (13.9%) were reported (Gupta et al., 1989).
The variations in the reported values may be due to differences in agro-climatic conditions or to
different ages of trees, and possibly not due to different stages of maturity, since tender green
leaves have been used in both studies.
Table 2.0: Chemical composition of extracted and unextracted moringa leaves
Type of leaf Crude Protein Lipid Ash NDF ADF ADL Gross energy (MJkg
-1)
Extracted leaves 43.5 1.4 10.0 47.4 16.3 2.2 17.7
Unextracted leaves 25.1 5.4 11.5 21.9 11.4 1.8 18.7
All values except gross energy are expressed as percentage dry matter. NDF = Neutral Detergent
Fibre, ADF = Acid Detergent Fibre, ADL = Acid Detergent Lignin
Source: Fuglie (1999).
2.4 Phytochemicals of moringa and their uses
An examination of the phytochemicals of moringa species affords the opportunity to examine a
range of fairly unique compounds (Faheyet al., 2001).
In particular, this plant family is rich in compounds containing the simple sugar, rahmnose, and it
is rich in a fairly unique group of compounds called glucosinolates and isothiocyanates (Bennett
et al., 2003; Faheyet al., 2001).

9
Some of the compounds that have been isolated from moringa preparations which are reported to
have hypotensive, anticancer and antibacterial activity include 4-(4'-O-acetyl-a-L-
rhamnopyranosyloxy)benzyl isothiocyanate, 4-(a-L-rhamnopyranosyloxy)benzyl isothiocyanate,
niazimicin, pterygospermin, benzyl isothiocyanate,and 4-(a-L-rhamnopyranosyloxy) benzyl
glucosinolate (Daxenbichler et al., 1991; Fahey et al., 2001; Bennett et al., 2003; Mekonnen and
Dräger, 2003). Antioxidant activity of these compounds has also been reported (Win and Jongen,
1996).
Flowers of moringa have been reported to contain flavonoid pigments such as quercetin,
kaempferol, rhamnetin, isoquercitrin and kaempferitrin (Nair and Subramanian, 1962).
According to Foidl et al. (2001) extracts of moringa leaves in 80% ethanol contain cytokinine-
type hormones.
The flavonoids such as quercetin and kaempferol were identified as the most potent antioxidants
in moringa leaves. Their antioxidant activity was higher than the conventional antioxidants such
as ascorbic acid, which is also present in large amounts in moringa leaves (Siddhuraju and
Becker, 2003).
The extracts of moringa leaves as reported by Siddhuraju and Becker (2003) also appear to have
cancer preventive effect, when assayed by the differentiating activity against human
promyelocytic leukaemia cells (HL-60). Seeds of moringa contain a glucosinolate that on
hydrolysis yields 4-(a-L-rhamnosyloxy)-benzyl isothiocyanate, an active bactericide and
fungicide (Grubben and Denton, 2004). Duke (1983) reported that moringa root-bark yields two
alkaloids: moringine and moringinine.

10
2.5 Moringa leaf production
A study consisting of many trials to discover the optimum density at which moringa should be
planted to produce a maximum amount of fresh green matter was conducted by Makker and
Becker (1997); spacing in the trials ranged from 1 m × 1 m or 10,000 plants per ha to 2.50 cm ×
2.50 cm or 16,000,000 plants per ha.
The optimum density in sandy, well drained and fertile soils was found to be 10 cm ×10 cm or
1,000,000 plants per ha, the results of the trials are shown in Table 3.0.
Table 3.0: Production parameters of moringa at first cutting
Plant Density (plants/ha) Fresh Matter (metric tons/ha) Dry Matter (metric tons/ha)
95,000 19.60 (19600 kg/ha) 3.33 (3330 kg/ha)
350,000 29.70 (29700 kg/ha) 5.05 (5050 kg/ha)
900,000 52.60 (52600 kg/ha) 8.94 (8940 kg/ha)
1,000,000 78.00 (78000 kg/ha) 13.26 (13260 kg/ha)
Source: Makker and Becker (1997)
In smaller trial areas, (10 m2) densities of 4,000,000 per ha and 16,000,000 plants per ha were
tried. The results of these trials are also presented in Table 4.0.
Table 4.0: Production parameters of moringa at first cutting on test plots with high density plants.
Density fresh (plants/ha) Fresh Matter (metric tons/ha) Dry Matter (metric tons/ha)
4 million 97.40 (97400 kg/ha) 16.56 (16560 kg/ha)
16 million 259.00 (259000 kg/ha) 44.03 (44030 kg/ha)
Source: Makker and Becker (1997)
Boimasa (1996) reported that whether produced for use as a green manure for livestock or
human consumption, moringa can be grown intensively with yields up to 650 metric tons of
green matter per ha. Akinbamijo et al. (2001) under high density cultivation using a planting

11
density of 15 cm × 15 cm, biomass yields in excess of 15 tons DM per ha in a 60-day growing
cycle was obtained at the international Trypanotolerance Centre in the Gambia.
2.6 Soya bean meal (SBM)
According to Kellems and Church (2006), soya bean meal is the product obtained by grinding
the flakes which remain after removal of most of the oil from either whole or dehaulled soya
beans by a solvent extraction process.Soya bean meal is a highly favoured feed ingredient
because it is quite palatable, highly digestible, has high energy value and results in excellent
performance when used for different animal species (Kellems and Church, 2006).Table 5.0
shows crude protein and essential amino acids in soyabean meal.
Table 5.0: Crude protein and essential amino acids in soya bean meal (DM basis)
Item Soya bean meal, solvent extracted
Dry matter, % 89.1
Crude protein 52.4
Essential amino acids (%)
Arginine 3.8
Cysteine 0.8
Histidine 1.4
Isoleucine 2.8
Leucine 4.3
Methionine 0.7
Lysine 3.4
Phenylalanine 2.8
Threonine 2.2
Tryptophan 0.7
Valine 2.8
Source: NRC (1994)

12
The protein in soya bean meal contains all the essential amino acids but the concentrations of
cysteine and methionine are sub-optimal (McDonald et al., 1988).Methionine is the first limiting
amino acid and may be particularly important in high energy diets.
The quality of protein in soya bean meal is dependent on the cultivar and processing method.
Under processing may lead to deleterious level of anti-nutritional factors which may impact
negatively on the growth and performance especially in young animals. By contrast, excessive
heating reduces the availability of some amino acids particularly lysine in soya bean meal
(Parkhurst and Mountney, 1988). Raw soya bean should not be fed to animals, because of the
presence of trypsin inhibitor that must be destroyed by heat or other methods. In the case of
young growing chicks, raw soya beans will produce only about two-thirds of the growth
achieved with processed soya bean meal (North and Bell, 1990). Say (1987) reported that soya
bean meal must be subjected to heat treatment that improves its digestibility and also destroys
some of the toxic factors present in the raw soya bean. Apart from problems associated with
either under or over processing, a major concern with the use of soya bean meal is its relatively
low metabolizable energy content. Soya bean meal is best supplemented with some animal or
fish protein to make up its deficiencies of certain amino acids (North and Bell, 1990). Soya bean
meal is adequate in magnesium and a good source of potassium and supplies a fair amount of
trace elements (Lassiter and Hardy, 1982). According to Say (1995), soya bean meal is very
often used in large proportions, of the order of 30% for growing poultry and 20% for layers.
2.7 Nutritional evaluation of leaf meals on the performance of animals
Some plant leaves have been used as feedstuffs for rabbits and other animals as a partial
substitute for the conventional grains and forages. Leucaena leucocephala has been successfully
used in rabbit diets when incorporated in low levels.

13
The presence of mimosine, a toxic amino acid can cause growth depression at higher
incorporation levels (Parigi-Bini and Xiccato, 1998).
A 20-week feeding trial was conducted by Odeyinka et al. (2008) to evaluate the reproductive
performance of rabbits fed Moringa oleifera as a replacement for Centrosema pubescens.
Freshly harvested C. pubescens and M. oleifera leaves were offered to the animals at 20% of
their liveweight at the ratios of 100:0 (MO), 75:25 (M25), 50:50 (M50), 25:75 (M75), and 0:100
(M100), in addition to the concentrate feed offered to the animals. There were significant
differences in the total DM intake, litter size at weaning, average daily weight gain per kid and
milk yield of does, on the different treatments (P<0.05). However, there was no significant
difference in crude protein intake, initial average body weight, and gestation length as well as
litter weight at birth. It was concluded that Moringa oleifera can be used to replace Centrosema
pubescens without adverse effects on the reproductive performance of rabbits.
Iheukwumere et al. (2007) carried out a 25-day feeding trial in Nigeria with 120 five-week old
Anak broilers to evaluate growth, blood chemistry and carcass yield of broilers fed cassava leaf
meal at dietary levels of 0, 5, 10, or 15%. Results of the trial indicated that, feed intake, body
weight gain, feed conversion ratio of the control (0% leaf meal) were superior (p<0.05) to the
group on 10 and 15% leaf meal. The total serum protein, albumin and haemoglobin at 0 and 5%
leaf meal were superior to the values at 10 and 15% leaf meal, however, cholesterol, creatinine
and urea showed no significant differences (p>0.05) between the treatment groups.
The cut parts of the carcass showed superior values (p<0.05) in the control treatment and they
differed significantly (p<0.05) from broilers on 5, 10 and 15% leaf meal in carcass yield. In
conclusion, it was suggested that 5% inclusion of cassava leaf meal could be used in broiler

14
finisher diet without any deleterious effect on growth, blood chemistry and carcass yield of
broilers.
In a study by Odunsi et al. (2002) 72 laying hens were allotted to four dietary treatments
containing 0, 5, 10 or 15% gliricidia leaf meal (GLM). The inclusion of the GLM in the layer
diets significantly (p<0.05) reduced feed consumption in a linear function. Layers fed 0 and 5%
GLM had similar (p>0.05) hen-day egg production, body weight changes and feed conversion
efficiency which worsened significantly at 10 and 15% GLM levels. Egg quality values showed
no significant differences (p>0.05) in terms of egg weight, haugh units and shell thickness while
yolk index increased (p<0.05) with GLM and was found to be best at 10 and 15% GLM. Yolk
colour was positively enhanced at all levels of GLM. Proportionally, egg membrane values were
lower (p<0.05) on GLM diets compared to the control while the egg yolk, albumen and shell
were not affected. Boiling of egg resulted in little yolk and albumen but heavier shell and
membrane with a 43% reduction (p<0.05) in egg yolk colouration. Results of the study indicated
that at dietary levels greater than 5% GLM depressed feed intake and egg production.
Smith (1988) compared the rumen degradability of some foliages in cattle and goats. In all these
ruminants, a similarly high 48-hour degradability of 84.3% (mean) for cassava leaves was
obtained which was higher than the degradability of Leucaena leucocephala, Gliricidia sepium,
bamboo and oil palm leaves.
Cassava foliage is thus a valuable feed material for ruminants. The feed value apparently
decreases with age, and Müller (1977) suggested the foliage should be harvested at 3-4 months to
ensure high nutrient content and to avoid reduction in tuber yield. Ross and Enriquez (1969) used
up to 20% cassava leaf meal in poultry diets and found a decrease in weight and feed efficiency
15
when the diet had more than 5% leaf meal. When cassava leaf meal was used up to 10%, no
differences were observed in egg production, feed efficiency and egg weight. However, when
0.15 to 0.30% methionine and 3.0% corn oil were added, the results were similar to those from
the control. Cassava leaf meal has some yellow pigment that gives good egg yolk pigmentation,
and it can be a substitute for all the alfalfa in the diet of laying hens.
In an experiment to determine the nutritional potential of two leafy vegetables (Moringa oleifera
and Ipomoea batatas), Oduro et al. (2008) reported that Moringa oleifera leaves contained crude
protein 27.51%, crude fibre 19.25%, crude fat 2.23%, ash 7.13%, moisture 76.53%,
carbohydrates 43.88%, and caloric value 1296.00 kJ/g (305.62 cal/g).Calcium and Iron content
in mg/100 g (DM) were 20.09and 28.29, respectively. They concluded that Moringa oleifera
leaves could contribute to the nutrient requirements of humans and should be strongly
recommended in Ghana. An experiment on the nutritional potentials ofChromolaena odorata
(siam weed)leaf meal (SWLM) on laying hens: biochemical and haematological implications
was carried out by Fasuyi et al. (2005) using 24 laying hens in their eighth month of lay in an 8-
week trial. In the experiment diet 1 served as the control diet and had no SWLM inclusion.
SWLM was introduced at 2.5%, 5.0% and 7.5% in diets 2, 3 and 4 respectively. The
haematological and biochemical investigations revealed no statistical differences (p>0.05)
among the mean values of treatments 1, 2 and 3.
However, the mean value of treatment 4 (7.5% SWLM inclusion level) was statistically different
(P<0.05) from the others. The numerical values of most haematological indices showed an initial
increase up to treatment 3 followed by a decrease in treatment 4. Almost all haematological
indices studied (PCV, RBC counts, Hb content) progressively increased up to diet 3 (5% SWLM

16
inclusion) after which there was a decline indicating a probable acceptance limit of 5% SWLM
dietary inclusion in layer diets without any serious health implication.
Bamikole et al. (2005) investigated the potential of Mulberry leaves in rabbit production in a 12-
week long experiment where feed intake, weight gain, and nutrient digestibility of the rabbits
were monitored. Thirty weaner rabbits were allocated to five experimental diets. The percentage
of concentrate in the rations was incrementally replaced with mulberry leaves: 100:0, 75:25,
50:50, 25:75, 0:100 were fed in a completely randomized design. Total dry matter (DM) intake
of the concentrate: mulberry diet remained at the level of that of the all- concentrate ration until
mulberry leaves comprised greater than 50% of the ration before it declined significantly. The
intakes of crude protein (CP) and crude fibre (CF) increased significantly whilst those of ether
extract (EE), ash, and nitrogen free extract (NFE) decreased significantly with increasing level of
mulberry leaves in the diets, following the trends of the concentrations of the nutrients in the
materials. The nutrient digestibilities of the diets were high and there were no significant
differences among the means for dry matter, organic matter, crude protein, crude fibre, and ash.
Digestibility of ether extract and nitrogen free extract significantly declined with increasing
levels of mulberry leaves in the rations.
Weight gain of rabbits on diets containing 20% and 50% mulberry leaves (5.14 and 4.72 g /d
respectively) was not significantly different (p>0.05) from that of all-concentrate ration (5.72
g/d),but these were significantly higher than those of 25:75 and 0:100 concentrates: mulberry
leaves (3.43 and 2.27 g/d respectively). It was concluded that mulberry leaves could support feed
intake, digestibility and satisfactory weight gain in rabbits, and could reduce reliance on and cost
of expensive concentrate diets.

17
Famounyan and Meffega (1986) feeding rabbits sun-dried cassava leaves diets containing 13, 14
or 16% crude fibre contents observed that the rabbits consumed 65.8, 73.5 and 71.8 g/d and
gained 17.4, 19.4 and 18.2 g/d, respectively. The low weight gains observed in this trial was
attributed to the fact that the feed was not pelleted and was scattered.
Ghasi et al.(1999) reported that juice extracted from moringa leaves was a potent
hypocholesterolemic agent. In their research usingWister rat, they concluded thateven when
given at the relatively low dose of 1 mg/g, co-administered with a high fat diet daily over a
period of 30 days, cholesterol was reduced in serum, liver and kidney.
Nworgu et al. (1999) reported a reduction in feed intake as the percentage of forage meal in the
diet of rabbits was increased. Upadhyay (1990) and Oforjindu (2006) reported a decrease in the
cholesterol and liver lipid levels in birds and rats when they fed broiler birds and rats with diets
containing neem leaf meal (NLM).
2.8 Anti-nutritional factors
Anti-nutritional factors are compounds mainly organic, which when present in a diet, may affect
the health of the animal or interfere with normal feed utilization.
Anti-nutritional factors may occur as natural constituents of plant and animal feeds, as artificial
factors added during processing or as contaminants of the ecosystem (Barnes and Amega, 1984).
Ingestion of feed containing such substances induces, in some cases, chronic intoxication and in
others interferes with the digestion and utilization of dietary protein and carbohydrate and also
interferes with the availability of some minerals, thus feed efficiency and growth rate and,
consequently, the production of the edible products.

18
Although anti-nutritional factors are present in many conventional feeds, they are more common
in most of the non-conventional feeds. Nityanand (1997) classified the various antinutritional
factors (ANFs) in feedstuffs according to their chemical nature and their activity in animals as:
1. Chemical nature, in this category are acids, enzymes, nitrogenous compounds, saponins,
tannins, glucosinolates and phenolic compounds.2. Factors interfering with the digestion and
utilization of dietary proteins and carbohydrates, for example, tannins, trypsin or protease
inhibitors, saponins, and haemagglutinins.
3. Factors interfering with the availability of minerals are for example, phytates or phytic acid,
oxalates or oxalic acid, glucosinolates and gossypol.
Tannins which are complex polymeric phenols having molecular weight greater than 500 are
natural constituents of many plants, and grouped into two forms-hydrolysable and condensed
tannins (Nityanand, 1997). Hydrolysable tannins are potentially toxic and cause poisoning if
large amounts of tannin-containing plant material such as leaves of oak (Quercus spp.) and
yellow wood (Terminalia oblongata) are consumed (Garg et al., 1982). Makker et al. (1988)
reported that tannins can inhibit the activities of rumen microbes.
The tannins form complexes with protein, cellulose, hemicelluloses, lignin and starch and
interfere with their optimum utilization in the digestive tract and systems. Protein sources of
plant origin containing high amounts of tannins and in particular hydrolysable tannins should be
used with caution (Becker and Makker, 1999). Ranjhan (1999) reported that soaking and
washing removes substantial amount of tannins and this is usually accompanied by some loss of
dry matter. Tannins have been found to affect digestibility and therefore rate of utilization of

19
dietary nutrients in both ruminants (Kumar and Singh, 1984) and non-ruminants (Hale and
McCormick, 1981; Okai et al., 1984).
Saponins are bitter in taste and hence reduce palatability; they are also haemolytic and alter the
permeability of cell membranes and produce toxic effects on organized tissues when ingested.
Lucerne, white and red clovers, mahua seed cake and soyabean are rich sources of saponins.
Soaking and washing in water is quite effective in removing a greater proportion of saponins
(Nityanand, 1997). Saponins have been reported to cause depressions in feed intake (Cheeke,
1976). According to Rajhan (2001) ruminants can breakdown saponins but monogastrics cannot.
Phytates (salts of phytic acid) are found in almost all feeds of plant origin. The phytates are
present in association with protein and generally high in protein feeds e.g. groundnut cake,
soyabean cake and sesame cake. Phytic acid possesses high chelating ability and in plants, it is
found as phytates of many minerals which are mostly not available to monogastrics as they lack
the enzyme phytase. The use of the enzyme phytase can make minerals such as phosphorus
available to monogastrics (Nityanand, 1997).
According to Nityanand (1997 ) anti-vitamin activities against vitamins A and D have been
observed in soyabean, against vitamin E in kidney bean ( Phaseolus vulgaris), against vitamin K
in sweet clover and against pyridoxine in linseed cake. Akinmutimi (2004) had observed that
most processing methods employed in improving the food value of non-conventional or
alternative feedstuffs do not completely eliminate anti-nutritional factor substances, but only
reduce their concentrations to tolerable levels in feedstuffs. It is a common practice in feeding
trials to use the weights of some internal organs like liver and kidney as indicators of toxicity.
Bone (1979) reported that if there are toxic elements in the feed, abnormalities in weights of liver

20
and kidney would be observed. The abnormalities will arise because of increased metabolic rate
of the organs in an attempt to reduce these toxic elements or anti-nutritional factors to non toxic
metabolites.
2.9 Effect of nutrition on biochemical and haematological blood components of rabbits
Blood is a complex fluid containing a large variety of dissolved suspended inorganic and organic
substances (Stewart, 1991) or specialized circulating tissues and cells suspended in the
intercellular fluid substance (Dellman and Brown, 1976). Blood circulates in the arteries, veins
and capillaries of man and animals (Kronfield and Mediway, 1975). Its primary function is to
transport oxygen from respiratory organs to body cells (Duke, 1975), distributing nutrients and
enzymes to cells and carrying away waste products (Baker and Silverton, 1982), thereby
maintaining homeostasis of the internal environment (Bentrick, 1974).
The various functions of blood are made possible by the individual and collective actions of its
constituents – the biochemical and haematological components. Generally, both the biochemical
and haematological blood components are influenced by the quantity and quality of feed and also
the level of anti-nutritional elements or factors present in the feed (Akinmutimi, 2004).
Biochemical components are sensitive to elements or factors present in the feed (Akinmutimi,
2004), including elements of toxicity. They can also be used to monitor protein quality of feeds.
Haematological components of blood are also valuable in monitoring feed toxicity especially
with feed constituents that affect the formation of blood (Oyawoye and Ogunkunle, 1998). Abu
et al. (1988) reported that low level haemoglobin (Hb) of treatment diets could imply that dietary
proteins were not of high quality. Diets containing poor protein would usually result in poor
transportation of oxygen from the respiratory organs to the peripheral tissues (Roberts et al.,

21
2000). Reduction in the concentration of PCV in the blood usually suggests the presence of a
toxic factor (e.g. haemagglutinin) which has adverse effect on blood formation (Oyawoye and
Ogunkunle, 1998).
High WBC count is usually associated with microbial infection or the presence of foreign body
or antigen in the circulating system. High blood urea levels are associated with poor protein
quality (Eggum, 1970) or excess tissue catabolism associated with protein deficiency (Oduye and
Adadevoh, 1976). There is evidence in literature that haematological characteristics of livestock
suggest their physiological disposition to the plane of nutrition (Madubuike and Ekenyem, 2006).
Reduction in packed cell volume and red blood cell values are indicative of low protein intake or
mild anaemia (Lindsay, 1977). Blood chemistry constituents reflect the physiological
responsiveness of the animal to its internal and external environments which include feed and
feeding (Esonuet al., 2001; Iheukwumere and Okoli, 2002).
Blood chemistry studies are usually undertaken to establish the diagnostic baselines of blood
characteristics for routine management practices of farm animals (Tambuwalet al., 2002;
Onyeyilli etal., 1992; Aba-Adulugba and Joshua, 1990).
The haematopoietic system is an important index of physiological and pathological status in
animals and man (Harper, 1973) since it is the one which becomes exposed to a high
concentration of toxic agents first.
Total serum protein has been reported as an indication of the protein retained in the animal body
(Akinola and Abiola, 1991; Esonu et al., 2001), while total blood protein and creatinine contents
have been shown to depend on the quantity and quality of dietary protein (Eggum, 1970; Iyayi,
1998; Awosanya et al., 1999; Esonu et al., 2001). Muscle wasting has been shown to be the
22
source of excess creatinine in the blood of animals and is normally due to creatinine phosphate
catabolism during this process (Bell et al., 1992). Table 6.0 shows the normal ranges of some
haematological and biochemical blood values of rabbits. Increased serum urea concentration may
suggest an increase in activities of urea enzymes ominthine, carbonyl transferase and orginase,
which may also indicate kidney damage (Ajagbonna et al., 1999). Normal range of blood sugar
level indicates that animals are not surviving at the expense of body tissues (Ologhobo et al.,
1992).
Frandson (1986) reported that the number of neutrophils in the blood increases rapidly when
acute infection is present, hence a blood count showing this increase is useful in diagnosis of
infections. He reported further that eosinophils which normally are scarce increase in numbers in
certain chronic diseases, such as infection with parasites and also in allergic reactions.

23
Table 6.0: Normal Physiological Ranges of Haematological and Biochemical Components for Rabbits.
Parameter Range
Haematological components
Haemoglobin (g/dl)
Packed cell volume (%)
Red blood cell (x 106/µl)
White blood cell (x 103/dl)
Neutrophils (%)
Lymphocytes (%)
Eosinophils (%)
Biochemical components
Cholesterol (mg/dl)
Total protein (g/dl)
Albumin (g/dl)
Globulin (g/dl)
8.0-17.5
30.0-50.0
4.0-8.0
5.0-12.0
35.0-55.0
25.0-50.0
0-5.0
35.0-60.0
5.4-7.5
2.5-4.5
1.9-3.5
Sources: Hillyer (1994) and Jenkins (1993)
2.10 Importance of rabbit production
Rabbits have a potential as meat producing animals in the tropics due to their characteristics such
as small body size, short generation interval, rapid growth rate and ability to utilize forage or
agricultural by-products.
The wastes from products grading before selling to the market, such as vegetable wastes, are
well utilized as feed resources for rabbits, and the manure from the animals could be used as an
organic fertilizer for crops (Mikled, 2005).
Rabbits could contribute significantly to solving the problem of meat shortage (Lebas, 1983;
Taylor, 1980).

24
Production systems with small or large ruminants usually need a long time to give a saleable
product and with high cost, especially for feeds. According to Ruiz-Feria et al. (1998) rabbits can
subsist on inexpensive diets based on forages under small-scale farm conditions in arid and
tropical regions.
Agricultural by-products, foliages and weeds such as Centrosema pubescens, cassava root meal,
rice bran, natural grasses and leucaena can be used as dietary ingredients for rabbits (Lukefahr
and Cheeke, 1991; Ha et al., 1996; Ruiz-Feria et al.,1998). The demand for human food from
animal products such as meat, eggs and milk is continually increasing (Delgado et al., 1999).
The consumers of today pay great attention to the health aspects of food, such as low fat content
and organic origin. Meat from rabbits has a low cholesterol level, high protein/energy ratio and is
relatively rich in essential fatty acids (Iraqi, 2003). Rabbits utilize waste products more
effectively thus offering an alternative to other producing species for the improvement of protein
supply to the human population and the realization of monetary income by putting into effective
use the waste materials that are inedible for humans (Schlolaut, 1985).
The rabbit offers a role as an alternative food source, particularly for people in developing
countries (Owen, 1981). It is claimed that there are few traditional/social taboos concerning the
eating of rabbit meat (Mamattah, 1978).
According to one report (Elemele et al., 1980), dry rabbit manure contains 18.8% crude protein,
9.0% moisture, 13.5% crude fibre and 19.2 MJ gross energy per kg. In the same study, 100 g of
rabbit manure per kg of diet was fed to broiler chickens with no decline in growth rate as
compared to performances on a standard diet. Rabbit manure has also been experimentally fed to
rabbits (Swick et al., 1978) and could be fed to ruminants as well.

25
Rabbit and other animal manures can be used to produce methane gas as a household source of
alternative energy (Sicwaten and Stahl, 1982; Jacobs, 1986; Trujillo et al., 1991). Scientists use
the animals in experiments dealing in nutrition and medical research; manufacturers use them for
testing products and in addition animals are sold as pets.
2.11 Nutrient requirements of rabbits
2.11.1 Crude protein
Protein is perhaps the most frequent nutrient lacking in rabbit diets primarily because the
common energy sources such as maize and other cereal grains and tuber crops are low in protein.
The rabbit makes its own particular proteins from the proteins and amino acids it obtains from its
food (Fielding, 1991; Kellems and Church, 2006). This protein synthesis uses up energy. The ten
essential amino acids which must be provided in the diet if the rabbit is to survive and grow are:
lysine; methionine; arginine; phenylalanine; histidine; valine; threonine; tryptophan; leucine;
isoleucine (Fielding, 1991).
Essential amino acids need to be included in the ration for rabbits. Lysine and methionine are
usually the amino acids that are found to be deficient in rabbit ration (Gillespie, 1998). While
there is some bacterial protein synthesis in the caecum, it is not enough to meet the essential
amino acid requirements of rabbits.
For rabbits the recommended crude protein level in the dry matter of the ration is over 18% for
newly weaned rabbits; 16-18% for rabbits from 12-24 weeks; 15-17% for breeding does; and 12-
14% for all other stock (Fielding, 1991). Several researchers have investigated the protein
requirement of growing rabbits.

26
In an experiment in which Martina and Damianan(1983) fed rabbits with decreasing crude
protein levels of 18.08, 16.32, 14.22 and 12.50%, they found that crude protein could be reduced
to 16.32% with lysine and methionine supplementation without affecting weight gain and feed
efficiency. Different results were obtained when Carregal and Nikuma (1983) used diets with
increasing crude protein levels, 14.3, 17.2 and 21.4%, as they found no significant difference
among groups of rabbits with regard to body weight, feed intake or feed conversion efficiency.
Abdella et al. (1988) conducted an experiment and observed that there were no differences in
final body weight, live weight gain and feed intake when diets containing 16, 18 and 20% crude
protein were fed to five week-old rabbits. Abdel-Salem et al. (1972) using mash diets containing
crude protein ranging from 11.63 to 26.85% reported that the diets containing 20.74% crude
protein recorded the highest final live body weight and live weight gain.Gillespie (1998) has
shown that soya bean meal or fish meal promotes better growth rates than other protein
supplements when the alternative supplements do not have essential amino acids added.
He further reported that when essential amino acids were added to protein supplements such as
cotton seed meal, rapeseed meal, horsebeans, and peas, growth rates similar to those achieved
with soya bean and fish meals were attained. According to Pond et al. (1995) dietary protein
quality is particularly important for rapidly growing weanling rabbits, which may not have well
developed caecal fermentation. Recent research has demonstrated that the amino acid
requirements are age dependent and change during the reproduction cycle of the doe. In early
growth stage (4-7 weeks of age), rabbits need a higher dietary amount of digestible crude protein
and amino acids (Maertens et al., 1997). Also, during peak lactation the response to higher
amino acids is more pronounced (Taboada et al., 1994; Taboada et al., 1996).

27
Many research reports have shown that a reduction of the level of protein and essential amino
acids in the diet, from an optimum level for growth in animals, is associated with a decreased
growth rate and efficiency of feed utilization and a concomitant increase in body fatness
(Wahlstrom and Libal, 1974; Noblet and Henry, 1977; Russell et al., 1983). Dietary protein level
is one of the several non-genetic factors that influence the amount of body fat in animals (Marks,
1990; Wang et al., 1991). Forbes (1995) reported that if the amino acid content in the feed of
animals differed widely from the animal’s requirement for amino acids, feed intake would be
depressed and that if the deficient amino acid was supplemented, intake would be increased.
Estimated nutrient requirements (Table 7.0) and minimum dietary protein and amino acid
recommendations (Table 8.0) published by Cheeke (1987) and Maertens (1992) respectively are
shown as follows.
Table7.0: Nutrient requirements of rabbits
Class of rabbit
Growing Lactation Gestation Maintenance Does & Litters fed
4-12 weeks one diet
Crude protein, % 15 18 18 13 17
Amino acid, %
S-amino acids 0.5 0.6 - - 0.55
Lysine 0.6 0.75 - - 0.7
Arginine 0.9 0.8 - - 0.9
Threonine 0.55 0.7 - - 0.6
Tryptophan 0.18 0.22 - - 0.2
Histidine 0.35 0.43 - - 0.4
Isoleucine 0.60 0.70 - - 0.65
Valine 0.70 0.85 - - 0.8

28
Table 7.0 continued
Leucine 1.05 1.25 - - 1.2
Phenylalanine 1.20 1.40 - - 1.25
Crude fibre, % 14 12 14 15-16 14
Indigestible fibre, % 12 10 12 13 12
Digestible energy 2500 2700 2500 2200 2500
(kcal/kg)
Metabolizable 2400 2600 2400 2120 2410
Energy, (kcal/kg)
Fat, % 3 5 3 3 3
Minerals
Ca (%) 0.5 1.1 0.8 0.6 1.1
P (%) 0.3 0.8 0.5 0.4 0.8
K (%) 0.8 0.9 0.9 - 0.9
Na (%) 0.4 0.4 0.4 - 0.4
Cl (%) 0.4 0.4 0.4 - 0.4
Mg (%) 0.03 0.04 0.04 - 0.04
S (%) 0.04 - - - 0.04
Co(ppm) 1.0 1.0 - - 1.0
Cu, ppm 5.0 5.0 - - 5.0
Zn (ppm) 50 70 70 - 70
Fe (ppm) 50 50 50 50 50
Mn (ppm) 8.5 2.5 2.5 2.5 8.5
I (ppm) 0.2 0.2 0.2 0.2 0.2
Vitamins
Vitamin A (IU/kg) 6,000 12,000 12,000 - 10,000
Carotene (ppm) 0.83 0.83 0.83 - 0.83
Vitamin D (IU/kg) 900 900 900 - 900

29
Table 7.0 continued
Vitamin E (ppm) 50 50 50 50 50
Vitamin K (ppm) 0 2.0 2.0 0 2.0
Vitamin C (ppm) 0 0 0 0 0
Thiamin (ppm) 2.0 - 0 0 2.0
Riboflavin (ppm) 6.0 - 0 0 4.0
Pyridoxine (ppm) 40 - 0 0 2.0
Vitamin B12 (ppm) 0.01 0 0 0 -
Folic acid (ppm) 1.0 - 0 0 -
Pantothenic acid (ppm) 20.0 - 0 0
Source: (Cheeke, 1987)
Table8.0: Minimum dietary protein and amino acids recommendations for rabbits
Dietary Level Reproducing Does Young at weaning Fattening rabbits
(for a DM of 89-90%)
Digestible energy (kcal/kg) 2500 2275 2400
Crude protein (%) 17.5 16.0 15.5
Digestible protein (%) 12.7 11.0 10.8
Arginine 0.85 0.90 0.90
Histidine 0.43 0.33 0.35
Isoleucine 0.70 0.65 0.60
Leucine 1.25 1.10 1.05
Lysine 0.85 0.75 0.70
Methionine + Cystine 0.62 0.65 0.65
Phenylalanine + Tyrosine 1.40 1.20 1.20
Threonine 0.65 0.60 0.60
Tryptophan 0.15 0.13 0.13
Valine 0.85 0.70 0.70
Source: Maertens (1992)

30
2.11.2 Energy
Although energy is not a nutrient, it is a property of carbohydrates, fats and proteins when they
are oxidized during metabolism. The energy needed by rabbits for organic synthesizing is usually
supplied by carbohydrates and a lesser extent by fats. Where there is an excess of protein, these
also help to supply energy after deamination. Rabbits adjust their feed intake as a function of
their dietary energy concentration (Partridge, 1989).
According to Partridge (1989), this regulation of intake to achieve constant daily energy intake is
only possible at a dietary digestible energy (DE) concentration above 2250kcal/kg. Several
factors influence the energy requirements of rabbits (Kellems and Church, 2002). These include
productive function (growth, lactation, maintenance, etc), age, sex, body size and environment
(temperature, humidity, air-movement). As temperatures decrease, the rabbit requires more
energy to maintain normal body temperature (Gillespie,1998), and to compensate for this
increased energy, either the intake level of feed must be increased or the energy content of the
ration must be increased.
Average maintenance requirementdetermined in growing rabbits is about 100kcal DE/kg0.75
(Maertens, 1992). Fed on energy-concentrated foods, rabbits can satisfy their requirements, but
this is not possible on forages alone because forages are usually dilute sources of energy
(Fielding, 1991); hence when fed only on forages they cannot obtain as much energy as those fed
on concentrated foods such as maize grains or cereal brans.
Rabbits (Cheeke, 1994) require a diet of 2200kcal/kg of diet or 2.2kcal/g of diet. For breeding
rabbits (Fielding, 1991), a general recommendation is that the food should contain: 65-66%TDN;
or 2600-2700kcalDE/kg DM; or 2.4-3.5 MJ DE/kg DM; or 2.0-3.0 MJ ME/kg DM.

31
Products of microbial degradation of dietary fibre which contributes to the energy demand of the
host animal, are the volatile fatty acids (VFAs). An effective absorption of VFAs from the large
intestine has been demonstrated in all non-ruminant herbivores which have been investigated
(Hintz et al., 1978). In rabbits about 10-20% of maintenance energy expenditure comes from
VFAs (Hoover and Heitman, 1972).
Despite the apparently poorer utilization of fibre by rabbits than by horses or ruminants, Parker
(1976) concluded from Carbon-14 studies that VFAs absorbed 30% of the maintenance energy
requirement, avalue similar to that attributed to those products from the caecum and colon of the
horse (Glinsky et al., 1976). Pond et al. (1995) reported that digestible energy levels in typical
rabbit diets are quite low, being in the range of 2400-2800kcal/kg weight diet. They further
indicated that higher energy levels impair animal performance and result in reduced energy
intake. Rabbits are efficient users of starch in cereal grains and prefer barley to corn (Gillespie,
1998) when given a choice of cereal grains. According to him, diets that are based on corn have
produced poorer growth rates as compared to barley- or oat-based diets.
About 3% fat is recommended in rabbit diets;dietary fat is well utilized by rabbits and improves
diet palatability and increases energy level without causing carbohydrate overload of the hindgut
(Pond et al., 1995). The rabbit, for instance the breeding doe, adjusts its feed intake according to
the energy concentration of the feed as well as the protein and other dietary components present
(Lebas et al., 1986); to around 220-240kcal of digestible energy (DE) per kg metabolic weight
(W0.75
).

32
2.11.3 Crude fibre
According to Maertens (1988) although fibre is not considered a real nutrient in rabbits because
of its low digestibility (average dietary digestibility is less than 20%), it is considered a nutrient
to maintain the gut motility.
Cell-wall constituents from feedstuffs having low lignin content or young plants have a
considerable higher digestibility than highly lignified sources, 40-70% versus 5-20%
respectively. It is not clear what the minimum fibre intake for prevention of diarrhoea in rabbits
should be.
Research reports from Blas et al. (1994) and Gidenne and Jehl (2000) examined the effect of low
fibre diets to rabbits, and observed that a sharp decrease in fibre level from 19-9% in the diet
doubled the risk of digestive trouble. The population of cellulolytic bacteria decreased in the
caecum, and the microbial ecology system in the caecum became unbalanced, which may cause
death from diarrhoea.
Feeding rabbits with a diet low in fibre and high in energy or a finely ground concentrate diet;
can result in high mortality due to intestinal disorders, such as enterotoxemia (Lukefahr and
Cheeke, 1991). The significant role of dietary lignin (ADL) on the rate of passage and its
protective effect against diarrhoea has been demonstrated by the French INRA (Institut National
de la Recherche Agronomique) team (Gidenne and Perez, 1994; Lebas et al., 1998). The
mortality rate as a result of digestive disorders was closely related (r = 0.99) to the ADL level in
their experiments. The relationship was expressed as follows:
Mortality rate (%) = 15.8-1.08 ADL (%); n >2,000 rabbits.

33
Quite similar effects were observed by the same team of researchers with various cellulose
(ADF-ADL) levels (Gidenne and Perez, 1996; Perez, 1996). They clearly indicate that the
recommendations in terms of dietary safety cannot be expressed as a single fibre fraction.
Furthermore, recommendations of dietary fibre are age dependent. Young rabbits require higher
minimum levels than fattening or breeding does, probably because of their lower daily intake to
reduce enteritis. An excess of dietary fibre is also not desirable because digestible energy (DE)
content decreases and a too high protein- to- energy ratio is commonly the result. Such a
situation is favourable for the proteolytic flora that produces ammonia with an increasing risk of
digestive disorders (De Blas, 1981; Lebas, 1989).
Besides dietary fibre, starch also plays a key role in the nutrition-enteritis interaction. Young
rabbits have an immature pancreatic enzyme system that can lead to significant amount of starch
reaching the caecum when using high-starch diets. Especially dietary starch with higher
resistance (corn) against hydrolysis could lead to starch overload. The risk of destabilization of
the caecal flora is higher if the increased ileal starch flow is not accompanied with a similar
increase of fibre intake (Gidenne and Perez, 1996).
Rabbits use crude fibre less efficiently due to a faster rate of passage of digesta and smaller
holding capacity, compared to grazing ruminants. Rabbits are therefore more selective in their
diets than ruminants (Jarvis, 1976).
Optimal fibre balance also includes a dietary recommendation for particle size. A sufficient
amount of large-size particles is required for optimal performance and to reduce the risk of
digestive disorders. According to De Blas et al. (1999) a minimum proportion of 25 % of large
particles (> 0.315 mm) is required.

34
Chemical composition and form of fibre not only affect its susceptibility to digestion but can also
influence feeding habits. Spreadbury and Davidson (1978), in an experiment, compared oat husk
with barley straw and pure cellulose in rabbit diets, and concluded that daily feed intake
increased as the crude fibre content of the diet was increased from 3.9 to 27.0%. The optimum
level of crude fibre for growing rabbits is 13-14% (Lebas et al., 1986).
2.11.4 Minerals and vitamins
Pond et al. (1995) stated that the major mineral elements of concern in rabbit diet formulation
are calcium and phosphorus (Ca and P), and that the other minerals are usually provided in
adequate amounts by the ingredients used plus the addition of trace-mineralized salt. Studies on
the calcium and phosphorus requirements of growing rabbits have shown that they need these
minerals much less than lactating does. The amounts excreted through the milk are significant.
However, excesses of calcium (> 40 g/kg) or phosphorus (> 19 g/kg) induce significant alteration
of fertility and prolificacy or higher proportions of stillbirths. Total dietary phosphorus intake
ranging from 0.45 to 0.76% did not affect any of the does’ reproduction performances (Lebas
and Jouglar, 1990). Aduku et al. (1988) fed weaner rabbits peanut meal, sunflower meal and
palm kernel meal diets containing 14.84, 23.24 and 38.89% crude fibre respectively and
observed thatfeed consumption was significantly (p<0.05) higher with the palm kernel and
sunflower meal diets than with the pea nut diet. This was however, attributed to the rabbits
having to compensate for their energy requirement. In the same experiment they found feed to
gain ratios to be significantly (p<0.05) poorer on the palm kernel and sunflower meal diets than
on the pea nut meal diet.

35
Differences in weight gain and final body weight for the three diets were however, not
significant (p>0.05) though the diet with lower fibre content had higher weight gains than the
one with higher crude fibre content.
The performances of the progeny were independent of their mothers’ diet. The lack of response
to low-dietary phosphorus levels has been confirmed with fatteners (Lebas et al., 1998). The
Ca:P ratio does not seem to be critical for rabbits (Lebas et al., 1998) and is usually 2:1,
however, rabbits can tolerate much higher ratios.
Copper sulphatewhich is often used as a non-nutritive feed additive aids in preventing enteritis
(Pond et al., 1995). Fielding (1991) stated that rabbits are born with high levels of iron in their
livers, sufficient for their preweaning growth. Rabbits require water-soluble (B group and C) as
well as fat-soluble vitamins (A, D, E, and K). According to Lukefahr and Cheeke (1991) the
major vitamins needed in rabbit diets are vitamins A, D and E and that protein and carbohydrate
dietary sources, fed in good variety, may largely meet the mineral and vitamin requirements.
Micro-organisms in the digestive flora synthesize sizeable amounts of water-soluble vitamins
which are utilized by the rabbits through caecotrophy.
Vitamin K and the B vitamins are not required in the diet, since they are synthesized through
coprophagy and fermentation in the caecum or hindgut; likewise vitamin C (Lukefahr and
Cheeke, 1991). Under practical conditions, the B-complex vitamins are not dietary essentials for
rabbits; however, under stress situations and at high performance levels deficiencies can occur
(Ismael, 1992).
Gillespie (1998) has indicated that the use of iodized salt at the rate of 0.5% of the diet will
supply the needed sodium, chlorine and iodine for rabbits.

36
The vitamin A requirement of rabbits has not been adequately determined and a level of 10,000
IU/kg of diet is adequate while levels in excess of 40,000 IU/kg diet may adversely affect
reproduction (Pond et al., 1995). They further stated that vitamin A-deficient rabbits exhibit poor
growth, leg deformities, increased susceptibility and a high incidence of enteritis. Vitamin C
supplementation is recommended for rabbits under stress (Verde and Piquer, 1986).
2.11.5 Water as a nutrient for rabbits
Water is normally considered a nutrient, although its properties and functions are quite different
from those of other nutrients found in feeds. Water is the major component of the rabbit body,
making up 70% of the lean body mass (Maertens, 1992). Maertens (1992) further indicated that
rabbits will die more rapidly from water deprivation than from food deprivation.
Restricted drinking water or limited drinking time leads to reduced feed intake that is directly
proportional to the amount of water being consumed (Szendro et al., 1988). They further
reported that water and feed consumption varies with changes in environmental temperature and
humidity.As the temperature rises above 200C day and night, feed intake tends to drop while
water consumption increases. At high temperatures, (300C and over) feed and water intakes
decline, affecting the performance of growing and lactating animals (Femandez-Carmona et al.,
1996). According to Pond et al. (1995) water plays an essential role in a number of functions
vital to an animal such as digestion, nutrient transport, waste excretion and temperature
regulation.
One of the most important properties of water in nutrition is its remarkable ability to dissolve
substances. It is said that this property is due to its dielectric constant, which inturn is due to its
hydrogen bonding (Lassiter and Edwards, 1982).

37
2.12 The digestive tract of rabbits
Domestic rabbits (Oryctolagus cuniculus) are herbivores, concentrate selectors, and are classified
as hindgut (caecum and colon) fermentors (Cheeke, 1987;McNitt et al., 1996). Since there are no
mammalian enzymes to break down the cellulose components of their plant-based diets, rabbits
as well as other herbivores have a symbiotic microbe population (primarily Bacteroides).
Due to smaller body size and higher metabolic rate than horses, rabbits rely on other adaptations
for forage utilization (Cheeke, 1987). In rabbits, the microbial population is found in the
caecum.The rabbit caecum is very large, compared with the rest of the gut (Stevens and Hume,
1995) and forms a spiral that fills the abdominal cavity. The caecum (Jenkins, 1999) has a
capacity 10 times that of the rabbit’s stomach, about 40% of the gastrointestinal tract.
Instead of completely fermenting fibre, rabbits utilize a mechanism to sort out indigestible fibre
and expel it from the body, a process that is a specialized feeding strategy that overcomes poor-
quality protein (Pond et al., 1995). This sorting mechanism occurs as digesta enter the rabbit’s
large intestine and muscular contractions facilitate the separation of fibre and non-fibre (protein,
soluble carbohydrates, etc) fractions.
A series of peristaltic (move fibre through colon) and anti-peristaltic waves (move fluid and non-
fibre components to caecum for fermentation) separate out non-fibre fractions for further
fermentation in the caecum (Cheeke, 1987; Carabano and Piquer, 1998); particle size and
density aid separation (Cheeke, 1994). The fibre components are voided from the body (day, or
hard, faeces) about 4 hours after consumption of the diet (Cheeke, 1994). After fermentation of
the non-fibre components in the caecum, a pellet is formed (called a cecotrope, also soft, or
night, faeces) that is voided from the body approximately 8 hours after consumption of the diet

38
(Pond et al., 1995). A neural response (Jenkins, 1999) or the strong odour of VFA (Stevens and
Hume, 1995) in the cecotrope seems to stimulate its consumption directly form the anus.
This practice of consuming cecotropes is called coprophagy (Gillespie, 1998). In natural settings,
coprophagy usually occurs during the night, opposite of feed intake and the voiding of hard
faeces, in a circadian rhythmic pattern (Carabano and Piquer, 1998; Jenkins, 1999), and is an
integral part of the rabbit’s digestion process (Cheeke, 1994). Due to their small body size, if
allowed to consume a diet ad libitum, rabbits will daily eat an amount that approximates 5% of
their body weight in dry matter and drink about 10% of their body weight in water (Okerman,
1994). Even at this intake, if a rabbit was to consume only low-quality forages, there would be
insufficient energy and nutrients to meet its metabolic requirements. However, if rabbits at
maintenance are fed a high-quality pelleted diet for ad libitum consumption, they will become
obese (Brooks, 1997).
When allowed to select their own diet in a natural habitat, rabbits select the most tender,
succulent plant parts or the plant parts that are most nutrient-dense and lowest in available cell
walls.
Some researchers refer to animals that practice this type of eating behaviour concentrate
selectors, a practice that allows the animal to meet the dietary requirements for their high
metabolic rate (Cheeke, 1994). Rabbits have high feed intake (65-80 g/kg BW) and fast feed
transit time (19 hours), which enable them to consume lower-quality forages and still meet
nutritional requirements (Gidenne, 1992). Most problems seen in rabbit production involve the
gastrointestinal tract. Enteritis is the primary gastrointestinal disorder, and it often results in
diarrheoa (Milon, 1996).
39
2.13 Gut microbes and utilization of fibre in rabbits
When compared with other herbivores, actual fibre digestion capability for rabbits is relatively
low (14% for alfalfa hay in rabbits compared with 44% in cattle, 41% in horses, and 22% in hogs
(McNitt et al., 1996).
The actual crude fibre component of most forages fed is only 20-25% (McNitt et al., 1996),
depending on forage maturity. Obviously, the more mature the forage, the higher the crude fibre.
Other non-fibre fractions of forage, protein, and soluble carbohydrates are easily digested by
rabbits. In rabbits, dietary fibre has a critical role in maintaining gut health, stimulating gut
motility (insoluble fibre only), reducing fur chewing and preventing enteritis (Brooks, 1997).
The composition of the hard faeces and the cecotrope is influenced by the diet. If dietary fibre
concentration increases, the fibre composition of the faecal pellets also increases. Fibre
fermentation in rabbits does not seem to be enhanced by coprophagy (Cheeke, 1994).
Microbes in rabbit gut produce VFA, as do microbes in the rumen of a cow. In rabbits fed a
traditional alfalfa/corn diets, acetate is the primary volatile fatty acid produced by microbes, with
more butyrate than propionate being formed. Butyrate is the preferred energy source for the hind
gut (Stevens and Hume, 1995; Gidenne et al., 1998; Jenkins, 1999). Microbes in rabbits produce
more VFA on starch-based diets than on forage diets (Cheeke, 1994). Stevens and Hume (1995)
indicated that VFA provide a major energy source in rabbit colon. Gut microflora of rabbits are
sensitive to most antibiotics (McNitt et al., 1996). If antibiotics are fed, the microbe population is
altered, favouring E. Coliand Clostridia organisms that produce toxins harming the gut lining,
causing diarrhoea and enterotoxemia (Stein and Walshaw, 1996).

40
2.14 Utilization of protein in rabbits
In ruminants, microbial protein satisfies the major amino acid requirements for the animal, but
this is not true for rabbits. Even though amino acids produced by bacteria may be available via
coprophagy (especially lysine, surphur amino acids, and threonine; Carabano and Piquer, 1998),
research has shown that microbial protein plays only a minor role in meeting a rabbit’s protein
and amino acids needs (McNitt, 1996). The majority of microbial protein utilized by the animal
is digested in the colon (Stevens and Hume, 1995). As a result, synthetic amino acids are often
added to commercial rabbit diets to fully meet amino acids needs, particularly lysine and
methionine, which may be limiting amino acids in traditional alfalfa-corn diets (McNitt et al.,
1996).
Cecotropes do, however, contain approximately 28% crude protein (Stevens and Hume, 1995).
Urea is recycled by the rabbit large intestine in a manner similar to that occurring in the rumen
(Stevens and Hume, 1995). However, when dietary urea is fed to rabbits, it is not well utilized by
microbes.
Prolonged feeding of 0.5% urea in the diet of rabbits will result in liver or kidney lesions
(Cheeke, 1994). Urea is converted to ammonia in rabbit gut, and when absorbed, it results in
toxicity. Ingestion of cecotropes is influenced by dietary protein and energy. When an animal is
fed a lower energy diet, cecotrope ingestion is maximized (Jenkins, 1999).
When an animal is fed a diet for ad libitum consumption, dietary protein and fibre concentration
affect cecotrope consumption which seems to be a protein-sparing mechanism (Cheeke, 1994).
Coprophagy has been found to increase protein digestibility (50 vs 75 to 80% for alfalfa) of
forages in rabbits. Care should be taken when feeding high levels of dietary protein because

41
excess protein may increase caecal ammonia levels, causing an increase in caecal pH (Cheeke,
1994). This rise in pH may allow pathogens to flourish and may increase the potential for
enteritis.
2.15Utilization of starch in rabbits
High-starch diets are often incompletely digested in the small intestine of the rabbit due to rapid
transit times (McNitt et al., 1996). Incomplete chemical digestion of the starch results in the
availability of starch for microbial fermentation (Stevens and Hume, 1995). Excess starch in the
gut results in an extremely rapid growth of microbes. If toxin-producing microbes (primarily
Clostridium spiroforme) are in residence, high levels of starch may lead to enteritis and possible
death (Tisch, 2006). As a result of potential incomplete starch digestion, low-energy grains such
as oats are preferred over corn or wheat (Cheeke, 1994).
Grains processed too finely can lead to rapid bacterial fermentation of the starch and cause
enterotoxemia. Thus, a coarse grind is recommended.
2.16Calcium metabolism in rabbits
Rabbits have an unusual calcium metabolism, absorbing calcium without vitamin D facilitation
and activation of calcium-binding proteins in the gut (McNitt et al., 1996; Jenkins, 1999),
resulting in excess calcium being excreted in the urine.
In most mammals, less than 2% of dietary calcium is excreted in the urine, but in rabbits it is
much higher. In one study cited by Jenkins (1999), the fractional excretion of calcium was 44%
when animals were fed a “typical” commercial diet. Since rabbits can absorb calcium without the
facilitation of vitamin D, a mechanism is needed to regulate serum calcium levels. Parathyroid
hormone and calcitonin are thought to prevent serum Ca levels from becoming dangerously high

42
due to dietary influence. Diets high in calcium (alfalfa-based) may result in kidney damage for
animals at maintenance levels (Cheeke, 1994) because homeostatic mechanisms are not as
effective as in other species. Prolonged high dietary calcium will result in calcification of soft
tissues such as aorta and kidney (Cheeke, 1994) and formation of kidney stones.
2.17Rabbit meat composition
Rabbit meat is very nutritious and a rich source of protein, energy, minerals and vitamins.
Relative to other common meats, rabbit meat is low in fat, sodium and cholesterol (Lebas and
Matheron, 1982). Fielding (1991) stated that rabbit meat is especially high in protein and low in
fat and that, the fat in the meat is mainly unsaturated which is believed to be a more healthy type
of fat than saturated fat which is common in other meats.
Rao et al. (1987) reported that rabbit meat mainly composed of 18.8-19.4% protein, 9.9-10.9%
fat and 68.5-72.0% moisture.
In an experiment using New Zealand White rabbit, Mohamed (1989) reported the meat
composition as 77.34% moisture, 21.55% protein, 2.73% ether extract and 1.63% ash. Table 9.0
shows rabbit meat composition relative to other common meats.

43
Table 9.0: The chemical composition of rabbit meat as compared to other common meats
Meat composition Moisture
(%)
Dry matter
(%)
Protein
(%)
Fat (%) Energy
(1 MJ/kg and 2cal/kg)
Rabbit 1
2
- 20-23 20-22 10-12 7-8
67.9 - 20.8 10.2 1749
Chicken 1
2
- 20-23 19-21 11-13 7-8
67.6 - 20.0 11.0 1782
Turkey 1
2
- 38-42 19-21 20-22 10-12
58.3 - 20.1 20.2 2618
Beef 1
2
- 40-50 15-17 27-29 11-14
55.0 - 16.3 28.0 3168
Lamb 1
2
- 40-50 14-18 26-30 11-14
55.8 - 15.7 27.7 3124
Pork 1
2
- 50-55 10-12 42-48 17-20
42.0 - 11.9 45.0 4510
Sources: 1= Fielding (1991) 2=USDA (1963)
2.18 Review of findings on rabbits under tropical conditions
2.18.1 Feed intake, weight gain, FCE and mortality of rabbits fed concentrates in the tropics
Eshiet et al. (1979) under tropical conditions evaluated the effects of feeding graded levels of
cassava root meal on the performance of fryer rabbits. The experiment showed that rabbits could
tolerate up to 30% cassava root meal diet without adverse effects on feed intake and rate of
growth. The 45% cassava root level, however, gave poor growth and utilization efficiency and
this was blamed on the hydrogen cyanide level in the diet. The results are shown in Table 10.0.

44
Table 10.0: The effect of feeding graded levels of cassava root meal (CRM) on the life
performance of fryer rabbits.
Level of CRM inclusion (%)
Parameter 0 (concentrate) 15 30 45
Daily Feed Intake (g) 24.02
c 56.43
a 60.54
ab 79.92
b
Daily Weight Gain (g) 18.25 18.53 18.52 16.72
FCE 2.63a 3.06
b 3.26
b 4.78
c
Mortality (%) 25.00 12.50 12.50 25.00
Source: Eshiet et al. (1979)
Farinu et al. (2008) evaluated the nutritive potential of pigeon pea grain and leaf meals on
growth performance of pre-pubertal rabbits in the tropics. Eighteen weaner rabbits were
randomly allocated to experimental diets 1, 2 and 3, containing 0% pigeon pea, 15% pigeon
grain meal and 15% pigeon pea leaf meal respectively, in replacement of maize offal as the main
energy source. The final liveweight (1375.1 g for diet 1, 1487.5 g for diet 2 and 1347.38 g for
diet 3); daily weight gain (11.6 g for diet 1, 13.00 g for diet 2 and 11.21 g for diet 3); and FCE
values of 6.50, 5.20 and 5.31 for diets 1, 2 and 3, respectively were not significantly (p>0.05)
affected by the dietary treatments. It was concluded that 15% pigeon pea grain meal inclusion in
rabbit diet with maize offal rather than maize, as the main energy base, resulted in better
performance of weaner rabbits.
A feeding trial was conducted using weaner rabbits by Ayers et al. (1996) to evaluate hybrid
poplar (HP) (Populus spp.) leaves as animal feed under tropical conditions. Ten New Zealand
white weaner rabbits were each assigned to treatment 0%, 10%, 20%, or 40% HP foliage. A diet
with 40% Alfalfa Meal (AM) was the control. There was no difference in growth rates of rabbits
on the various diets, even though digestibilities were lower in those on diets with HP than those
in the AM control. Greater gut fillin rabbits on the HP-containing diets associated with the

45
higher feed intakes with these diets (Table 11.0), may compromise accuracy of the weight gain
data. Table 11.0 shows the performance of the rabbits fed the diets containing hybrid poplar leaf
meal.
Table 11.0: Performance of rabbits fed diets containing Poplar leaf meal.
Treatment
(Level of inclusion) Average Daily gain (g) Daily feed intake (g) FCE
I (40% alfalfa) 35.5 105.6 3.4
II (10% hybrid poplar) 39.7 117.3 3.3
III (20% hybrid poplar) 36.7 122.3 3.8
IV (40% hybrid poplar) 37.9 133.9 4.0
Source: Ayers et al. (1996)
Eustace et al. (2003) used 24 weaner rabbits to assess theirperformance using varying dietary
cyanide levels. Daily weight gain, daily feed intake and feed efficiency significantly (p<0.05)
reduced as the cyanide level increased. The results showed that dietary cyanide had negative
impact on growth performance (Table 12.0).
Table 12.0: Performance of weaner rabbits fed varying dietary cyanide levels.
Dietary cyanide Levels
Parameters 0mg 250mg 500mg 750mg
Initial Live weight (g) 769.17 779.17 777.50 766.67
Final live weight (g) 1630.00 1425.00 1371.67 1329.17
Daily feed intake (g) 68.08a 60.33
c 58.12
c 54.56
b
Daily weight gain (g) 16.64a 11.53
b 10.46
b 9.74
b
FCE 4.85 5.32 5.77 5.63
a,b,c = means in the same row having different superscripts are significantly different (p<0.05)
Source: Eustace et al. (2003)
In a study by Eustace et al. (2003) in which weaner rabbits were fed with dietary cyanide levels;
0 mg, 250 mg, 500 mg, and 750 mg, the resulting cholesterol level values reported were 74.33

46
mg/dl, 106.75mg/dl, 53.67mg/dl and 104.00mg/dl, respectively, showing that dietary cyanide
had negative impact on blood cholesterol level.
Okorie (2003) carried out a six-week experiment to determine the effect of palmitic acid fortified
maize wet milling by-product on the performance of weaner rabbits. Forty-eight (48) weaner
New Zealand white and Dutch breed of rabbits were assigned to four dietary treatments of 0%,
25%, 30% and 50% levels of the palmitic acid fortified maize wet milling by-product. The
growth rate of rabbit on the 25% diet was higher followed by the 0% and 30% diets.
Nevertheless, those on 50% showed a depressed growth rate, which could be due to the
unpalatability of the by-product at the 50% level. The animals showed a higher feed intake at the
25% level and 0% level (p>0.05) and the feed intake decreased from the 30% level to the 50%
level of inclusion. The data obtained in the experiment showed a strong promise for the palmitic
acid fortified maize wet-milling by-product as a good source of feedstuff for rabbits.Data on the
performance of weaner rabbits for the various diets are shown in Table 13.0.
Table 13.0: Effect of palmitic acid fortified maize wet-milling by-products on the performance
of weaner rabbits.
Level of Inclusion
Parameters 0% (control) 25% 30% 50%
Average initial weight (g) 466 468 470 469
Average final weight (g) 1462b 1479
a 1482
a 1470
b
Growth rate (g/d) 21.84a 22.06
a 21.54
b 21.03
b
Feed intake (g/d) 65.12a 68.81
a 63.84
b 61.08
b
FCE 2.98a 3.12
a 2.96
a 2.90
b
Mortality - - - -
a,b = within row with different superscripts are significantly different (p<0.05)
Source: Okorie (2003)

47
Hasanat et al. (2006) used cross-bred New Zealand white meat type rabbits in a 128- day trial to
study the effect of concentrate supplementation on growth of rabbits under rural conditions.
Dietary treatment 1 was a conventional diet, while treatment 2 was conventional diet plus
concentrate. All animals had free access to locally available green grasses. The results obtained
were: initial weight (g), T1 = 1055.83 and T2 = 994.98; final weight (g), T1 = 1426.66b and T2 =
1911.66a; weight gain (g/d) T1 = 5.30
b and T2 = 13.02
a. The results showed that, average daily
live weight and final weight gain were significantly (p<0.01) higher in T2 than in T1 group. It
could therefore be inferred that supplementation of concentrates in addition to conventional
feeding may improve growth performance of rabbits under rural conditions.
Omole and Onwudike (1982) investigated the effects of palm oil in cassava peel diet for weaner
rabbits and the results are shown in Table 14.0. The inference drawn showed that dietary cassava
peel meal supplemented with palm oil improved live performances of weaner rabbits in all the
treatments, including the cassava peel meal. The inclusion of up to 30% cassava peel meal
seemed to cause no significant depression in growth or feed utilization.

48
Table 14.0: Effect of different levels of cassava meal and supplementary palm oil on weaner
rabbits.
Parameter
Av. initial weight (g) Av. final weight (g) Daily weight gain (g) FCE
Level of Cassava
peel Meal (%)
0 617.5 1942.5 23.66c
3.09a
10 615.8 1969.3 24.17c
3.11a
20 620.1 1955.7 23.85c
3.04a
30 622.4 1933.9 23.42c
3.21a
40 624.5 1663.9 18.56b
3.87b
50 621.7 1470.7 15.16a
4.59c
Means within a row not followed by the same letter differ significantly (p<0.05)
Source: Omole and Onwudike (1982)
Omole and Sonaiya (1981) evaluated the utilization of cassava peel meal by rabbits in two
separate studies. The results showed that cassava peel meal could make up to 40% of the ration
of growing rabbits without any deleterious effects on live performance, especially when fish
meal (FM) diets were consistently superior to groundnut cake (GNC) diets at all levels of
cassava peel meal.The data on performance of the rabbits are presented in Table 15.0.
Table 15.0: Effect of unsupplemented cassava peel meal and protein sources on the performance
of growing rabbits.
Cassava peel meal (%)
Parameters 0% 20% 40%
Protein sourcesa FM GNC FM GNC FM GNC
Average initial weight (g) 575.6 578.2 580.2 584.7 579.4 582.1
Average final weight (g) 1994.2 1659.7 1936.5 1635.5 1840.5 1453.5
Daily feed intake (g) 76.27a 70.68
a 77.26
a 71.66
a 77.47
a 63.02
b
Daily gain (g) 25.34c 19.31
ab 24.22
c 18.76
ab 22.52
b 15.56
a
FCE 3.01a 4.66
abc 3.19
ab 3.82
abc 3.44
abc 4.05
c
A = protein source, FM = Fish meal, GNC = Groundnut cake values in each row with different superscripts are
significantly different (p<0.05)
Source: Omole and Sonaiya (1981).

49
Amata and Bratte (2008) conducted an experiment to determine the effect of feeding graded
levels of Gliricidia sepium leaf meal (GLM) on the performance of weaner rabbits for an 8 week
period in the tropics.Although body weight gains and feed intake tended to decline as the level of
GLM in the diets was increased, which is a reflection of the increasing levels of fibre in the diets,
the differences were non-significant. FCE though numerically higher for the 10, 15 and 20%
GLM diets when compared to the control treatment, was not significantly affected by dietary
treatments. This implies that inclusion of GLM at moderate levels of up to 20% cannot
significantly reduce feed intake, FCE and growth in rabbits. The results of the experiment are
shown in (Table 16.0).
Table 16.0: Performance of weaner rabbits fed graded levels of gliricidia leaf meal diets.
Level of gliricidia leaf meal inclusion (%)
Parameter (g) 0 5 10 15 20
Initial body weight 571.00 725.00 712.50 727.50 757.47
Final body weight 1533.25 1612.50 1703.40 1700.00 1676.04
Weight gain 958.25 887.31 991.90 972.50 919.37
Feed intake 7160 6830 7120 6780 6590
FCE 0.13 (13%) 0.13 (13%) 0.14(14%) 0.15(15%) 0.14(14%)
Source: Amata and Bratte (2008)
2.18.2 Haematological and biochemical values of rabbits
In an experiment to determine the haematological indices of weaner rabbits as affected by
stocking density in Nigeria, Yakubu et al. (2008) reported values which are shown in Table 17.0.

50
Table 17.0: Mean leucocytic and erythrocytic values for rabbits reared at different stocking
densities.
Stocking density (rabbits/ m2)
Parameter 10 14.3 20 25
Packed cell volume PCV (%) 34.50 32.90 28.40 28.20
Haemoglobin (g/dl) 10.20 9.47 8.93 8.80
Red blood cell (×106/µl) 6.23 6.17 5.37 5.30
White blood cell (×109/dl) 5.50 5.60 5.27 5.13
Neutrophils (%) 45.60 45.90 48.33 49.70
Lymphocytes (%) 52.80 50.80 47.50 47.60
Eosinophils (%) 0.33 0.83 1.10 1.00
Source: Yakubu et al. (2008)
The conclusion drawn from the study was that group-housing of rabbits at a density of 14.30
rabbits per m2 could guarantee and promote an improved welfare in a tropical environment.
Ahamefule et al. (2008) carried out a research to assess the haematological and biochemical
profile of weaner rabbits fed raw or a processed pigeon pea seed (PSM) meal based diets at 20%
inclusion level in the tropics. The summary of the haematological and biochemical components
of the rabbits fed the various diets are presented in Table 18.0.
Table 18.0: Haematological and biochemical components of rabbits fed diets containing raw,
boiled, toasted or soaked pigeon pea seed.
Parameter Raw PSM Diet Boiled PSM Diet Toasted PSM Diet Soaked PSM Diet
Haemoglobin (g/dl) 5.53 6.93 8.40 8.40
PCV (%) 28.5a 19.6
c 24.6
b 25.3
b
WBC (×103) 6.80
a 6.03
ab 5.00
b 6.30
a
Neutrophils (%) 72.6 55.3 56.30 56.00
Eosinophils (%) 10.30 10.00 8.33 11.00
Lymphocytes (%) 37.00a 33.60
b 33.60
b 33.00
b
Total Protein (g/dl) 5.30 4.73 3.93 2.90
Globulin (g/dl) 1.10b 2.70
a 1.76
ab 1.26
b
Albumin (g/dl) 4.20 2.03 2.17 1.64
a ,b = means on the same row not followed by the same letter are significantly different (p<0.05)
Source: Ahamefule et al. (2008)

51
The conclusion drawn from the study was that most haematological and biochemical values
obtained were out of the normal physiological range for rabbits. Raw or processed pea generally
caused remarkable changes in the haematological and biochemical profile ofthe weaner rabbits
when incorporated at 20% level in the feed.
A 12-week feeding trial to evaluate the blood biochemistry and haematology of rabbits fed sun-
dried, ensiled and fermented cassava peel based diet was conducted by Ahamefule et al.(2006) in
Nigeria. It was observed that the haematological values obtained for rabbits fed sun-dried,
ensiled and fermented cassava peel based diets, except PCV and WBC, fell within normal
stipulated ranges. This is a good indication that sun-drying, ensiling and fermentation could be
used to reduce hydrogen cyanide (HCN) to a non-lethal level in cassava peels for rabbit
nutrition.Table 19.0 shows a summary of the results of the trial.
Table 19.0: Summary of blood haematological components of rabbits fed various processed
forms of cassava based diets.
Parameter Control Sun-dried Ensiled Fermented
Packed cell volume PCV (%) 42.75c 45.75
ab 43.25
bc 46.50
a
White blood cell (103/dl) 6.00
b 5.80
b 6.30
b 7.30
a
Neutrophils (%) 41.50a 37.50
b 43.25
a 40.25
ab
Lymphocytes (%) 59.00ab
60.75a 56.50
b 57.50
ab
Eosinophils (%) 1.50 2.00 1.25 1.75
a,b,c = means on the same row not followed by the same letter are significantly different
(p<0.05)
Source: Ahamefule et al. (2006)
Ogbuewu et al. (2008) carried out a 16-week feeding trial to determine the effect of dietary neem
leaf meal (NLM) on serum biochemical constituents of buck rabbits. The results of the trial
suggested that buck rabbits could tolerate 5-15% dietary levels of NLM without deleterious

52
effects. Table 20.0 shows the serum biochemical characteristics of the buck rabbits fed graded
levels of neem leaf meal (NLM).
Table 20.0: Serum biochemical characteristics of buck rabbits fed graded levels of neem leaf
meal (NLM).
Inclusion levels of Neem Leaf Meal (NLM)
Parameter T0 (0%) T1 (5%) T2 (10%) T3 (15%)
Total protein (g/dl) 6.10 3.00 3.20 6.90
Globulin (g/dl) 4.70a 2.10
a 1.50
b 5.10
a
Albumin (g/dl) 1.40ab
0.90b 1.70
a 1.80
a
Cholesterol (mg/dl) 174.60a 115.20
b 95.40
c 56.50
d
Source: Ogbuewu et al. (2008).
2.18.3 Carcass characteristics of rabbits under tropical conditions
Eustace et al. (2003) assessedthe response of carcass characteristics of 24 growing rabbits to
varying dietary cyanide levels. The results indicated that increase in dietary cyanide levels
caused a significant (p<0.05) reduction in the liveweight, slaughter weight and the lungs weight.
This observation may be due to the effect of the cyanide levels interfering in the digestion of the
nutrients. The carcass characteristics of the growing rabbits fed the different levels of dietary
cyanide are shown in Table 21.0.
Table 21.0: Carcass characteristics of rabbits fed varying levels of dietary cyanide.
Dietary cyanide levels
Parameter 0 mg 250 mg 500 mg 750mg
Liveweight (g) 1650.00a 1500.00
c 1375.00
b 1355.00
b
Slaughter weight (g) 1600.00a 1425.00
c 1315.00
b 1305.00
b
Carcass weight (g) 1335.00 1075.00 1,000.00 975.00
Liver weight (g) 48.35 45.94 40.40 40.65
Kidney weight (g) 9.45 9.86 9.80 9.40
Heart Weight (g) 3.90 3.75 2.95 3.45
Lungs weight (g) 9.70a 7.01
b 6.95
b 6.80
b
a,b and c means in the same row having different superscripts are significantly different (p<0.05)
Source: Eustace et al. (2003)

53
Amata and Bratte (2008) carried out an experiment to determine the effect of feeding graded
levels of Gliricidia sepium leaf meal (GLM) on organ weights of 25 weaner rabbits allotted to
five dietary treatments containing 0% (control), 5%, 10% 15% and 20% GLM.
The conclusion from the experiment indicated that beyond 10% GLM in rabbit diets, there would
be probably increases in detoxification activities in the liver and kidneys of the rabbits (Table
22.0).
Table 22.0: Organ weights of rabbits fed graded levels of gliricidia leaf meal.
Levels of GLM inclusion (%)
Organ weights (g) 0 5 10 15 20
Heart 4.75 4.87 5.64 5.99 5.02
Kidney 6.52b 7.65
b 10.54
a 10.95
a 10.25
Liver 32.24b 30.36
b 32.69
b 40.62
a 42.84
Lungs 5.24 5.48 5.18 5.44 6.36
Within each row, means with the same superscripts are not significantly different.
Source: Amata and Bratte (2008)
Okorie (2003) conducted an experiment to assess the effect of palmitic acid fortified maize wet-
milling by-product on the performance of weaner rabbits and reported the following carcass
yield in Table 23.0. Dressing percentage and breast weight were lower (p<0.05) for the 50%
inclusion of the palmitic acid fortified maize wet-milling by-product, while the inclusion of the
by-product increased (p>0.05) the viscera weight. The results of the experiment showed that
palmitic acid fortified maize wet-milling by-product could improve carcass yield of rabbits.
Table 23.0: Carcass yield (% liveweight) of rabbits fed different levels of palmitic acid fortified
maize wet milling by-product.
Inclusion levels of fortified by-product
Parameter 0% 25% 30% 50%
Weight of animals (g) 1200 1290 1311 1205 Dressing % 73.01b 76.2a 75.4 72.6b
Liver weight (g) 3.28a 3.1a 3.01a 2.79a
Kidneys weight (g) 0.80 0.75 0.73 0.70
Heart weight (g) 1.05 0.98 0.92 0.88
a,b = means on the same row not followed by the same letter are significantly different (p<0.05)
Source: Okorie (2003)

54
In an experiment to study the effect of different feeding systems on the carcass characteristics of
New Zealand white rabbits, Biya et al. (2008) reported carcass characteristic values as shown in
Table 24.0.T1 represented rabbits which were fed with concentrate alone.T2rabbits had 25%
replacement of concentrate.T3 had 50 vegetable cuttings on DM basis.T4 had 25%concentrate
and 75% vegetable cuttings on DM basis and T5 had 100% vegetable cuttings on DM basis.The
results showed that T2, which had 25% replacement of concentrate with vegetable cuttings
produced the highest dressing percentage compared to the other treatment groups.
Table 24.0: Carcass characteristics of New Zealand white rabbits.
Parameters T1 T2 T3 T4 T5
Slaughtered weight (g) 1972.50b 2290.00a 1959.17c 1595.83d 261.67c
Carcass weight (g) 1015.55b 1197.36a 988.24c 742.21d 571.66c
Dressing percentage 51.48 52.27 50.44 46.51 45.31
Pelt (%) 11.58b 11.20b 11.00b 10.13c 10.08c
Head (%) 8.77a 8.58ab 8.50b 8.05c 7.75d
Liver (%) 2.66c 3.63a 2.92b 2.51c 2.33d
Kidney (%) 0.89b 1.26a 1.04ab 0.94b 0.84b
Heart + Lungs + Spleen (%) 1.16a 1.14ab 1.13b 1.10c 1.07d
Body components expressed as percentage of slaughter weight. Means bearing different
superscripts in a row differ significantly (p<0.05)
Source: Biya et al. (2008)
2.18.4 Digestibility values of rabbits fed concentrates in the tropics
Iyeghe-Erakpotobor et al. (2005) evaluated concentrate, grass and legume combinations on
performance and nutrient digestibility of grower rabbits under tropical conditions. The results
showed a high digestibility of dry matter, crude protein, crude fibre and ether extract indicating

55
that the rabbits were able to utilize nutrients in the high forage and low concentrate combinations
used for growth.
It could be concluded from this study that any of the combinations of concentrate, grass and
forage would be adequate for grower rabbits.The reported results of apparent digestibility, dry
matter (DM), ether extract (EE), crude fibre (CF) and crude protein (CP) are presented in Table
25.0.
Table 25.0: Apparent digestibility of rabbits fed concentrate, grass and legume combinations.
Treatment Dry Matter (%) Ether extract (%) Crude Fibre (%) Crude protein (%)
RR 0.66 (66)
bc 0.69 (69) 0.51 (51) 0.70 (70)
a
RRG 0.66 (66)bc
0.71 (71) 0.50 (50) 0.69 (69)ab
RRP 0.59 (59)c 0.68 (68) 0.43 (43) 0.59 (59)
b
RRS 0.67 (67)bc
0.68 (68) 0.51 (51) 0.71 (71)a
SRG 0.70 (70)ab
0.71 (71) 0.53 (53) 0.69 (69)ab
SRP 0.72 (72)a 0.77 (77) 0.55 (55) 0.68 (68)
ab
SRS 0.71 (71)a 0.80 (80) 0.51 (51) 0.74 (74)
a
Data
RRP = Rabbit meal and Rhodes grass; RRG = Rabbit meal, Rhodes grass and Groundnut haulms; RRP = Rabbit
meal, Rhodes grass and sweet potato vines; RRS = Rabbit meal, Rhodes grass and soyabean forage; SRG =
Soyabean cheese waste meal, Rhodes grass and Groundnut haulms; SRP = Soyabean cheese waste meal, Rhodes
grass and sweet potato vines; SRS = Soyabean cheese waste meal, Rhodes grass and soyabean forage.
Source: Iyeghe-Erakpotobor et al. (2005)
Eustace et al. (2003) assessed the response of rabbits fed varying levels of dietary cyanide and
reported the apparent digestibility of rabbits as shown in (Table 26.0). The results showed a low
nutrient digestibility with a consequent reduction in growth rate and feed conversion as cyanide
concentration increased beyond 250 mg. Based on the results of this study, diets formulated for
rabbits should contain not more than 250 mg cyanide per kg in diet.

56
Table 26.0:Apparent nutrient digestibility of rabbits fed varying levels of dietary cyanide.
Dietary cyanide levels
Parameter 0 mg 250 mg 500 mg 750 mg
Dry matter 74.94 69.99 69.34 67.55
Crude protein 66.26 62.48 59.43 57.66
Crude fibre 48.53 35.80 33.65 33.37
Ether extract 90.66 88.03 88.46 83.07
Source: Eustace et al. (2003)
A study was carried out to determine the digestibility of weaner rabbits fed graded levels of
soyabean cheese waste/maize offal diet and brachiaria grass hay by Iyeghe-Erakpotobor et al.
(2006) and reported digestibility coefficients as shown in Table 27.0. Dry matter and ether
extract digestibility values were similar for the control, and significantly higher than 100 and
50% SBW treatments. Crude protein digestibility was similar for the control and all the
experimental groups. This could indicate a high efficiency in crude protein utilization. It is
concluded from this study that soybean cheese waste/maize offal diet compared favourably with
the standard rabbit meal fed to rabbits in nutrient digestibility.
Table 27.0: Nutrient digestibility coefficients of weaner rabbits fed graded levels of soyabean
cheese waste/maize offal meal and brachiaria hay
Parameter Control (100% RBM) 100% SBW 75% SBW 50% SBW 25%SBW
Dry matter 0.76a (76) 0.63
b (63) 0.74
a (74) 0.63
b (63) 0.76
a (76)
Ether extract 0.75a (75) 0.67
b (67) 0.75
a (75) 0.65
b (65) 0.77
a (77)
Crude protein 0.78 (78) 0.74 (74) 0.79 (79) 0.69 (69) 0.75 (75)
Crude fibre 0.58ab
(58) 0.45b (45) 0.64
a (64) 0.52
b (52) 0.71
a (71)
Means with different superscripts along rows are significantly different (p<0.05).
RBM = Rabbit meal, and SBW = Soyabean cheese waste meal.
Source: Iyeghe-Erakpotobor et al. (2006)
Bamikole et al. (2005) investigated the potential of mulberry leaves in rabbit production where
the nutrient digestibility of the rabbits was monitored.

57
The percentage of concentrate in the rations was incrementally replaced with mulberry leaves:
100:0, 75:25, 50:50, 25:75, 0:100. The results obtained for nutrient digestibility are shown in
Table 28.0. The results indicated that the levels of DM, CP and CF were not significantly
different among the diets, except for EE. The values of EE significantly declined as the
percentage of concentrate offered decreased. It could be concluded that the high levels of
nutrients intake and digestibility confirm the high nutritive value of mulberry leaves and their
potential as forage that can support rabbit production.
Table 28.0 Dry matter and nutrient digestibility of diets containing different percentages of
concentrate and mulberry leaves fed to rabbits.
Diets (%) (concentrate: mulberry leaves)
Parameter 100:0 75:25 50:50 25:75 0:100
Dry matter 82.33 75.67 75.67 77.00 79.67
Crude protein 84.00 77.67 76.33 80.33 83.67
Crude fibre 81.67 86.67 79.67 83.67 88.67
Ether extract 86.00a 68.67
b 65.67
b 74.33
b 55.65
c
Means in a row followed by the same letter are not significantly different at 0.05%.
Source: Bamikole et al. (2005).
Ayers et al. (1996) conducted a feeding trial using weaner rabbits to evaluate black locust and
hybrid poplar (HP) leaves as animal feed under tropical conditions and reported nutrient
digestibility values as indicated in Table 29.0. Nutrients digestibility values were lower in diets
with hybrid poplar leaf meal than in the alfalfa (control). The reduced crude protein digestibility
with increasing dietary hybrid poplar leaf meal is likely due to effects of antinutritional factors.
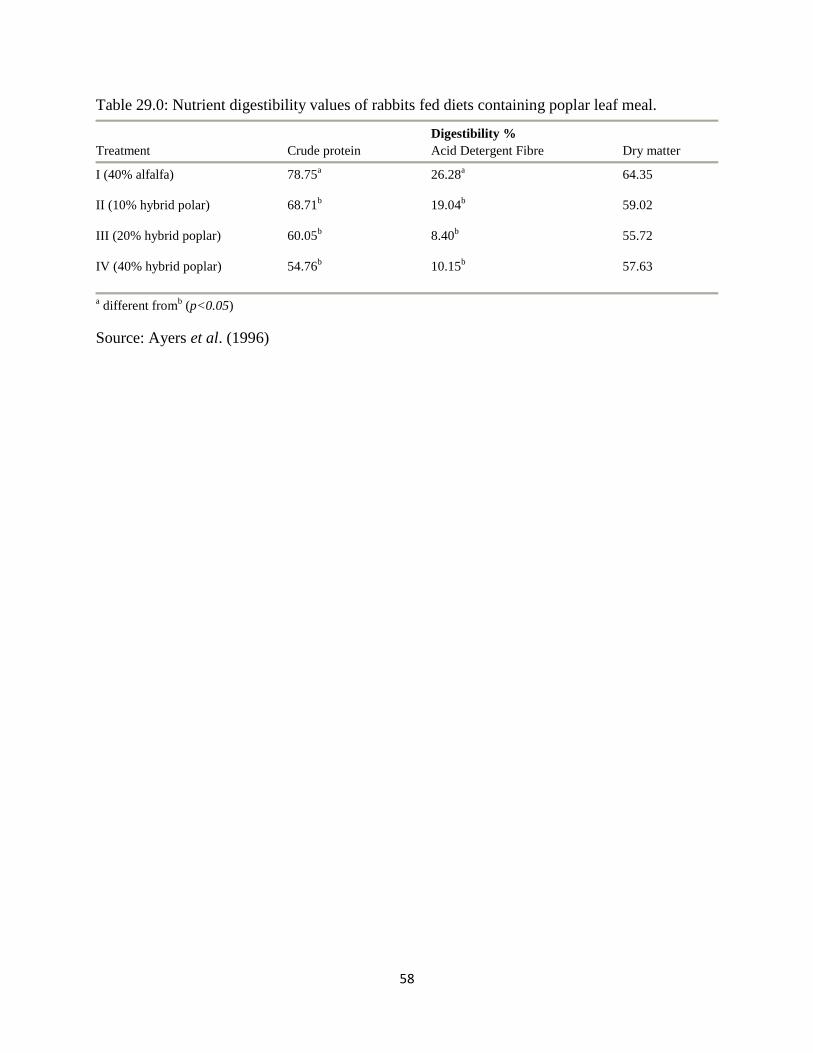
58
Table 29.0: Nutrient digestibility values of rabbits fed diets containing poplar leaf meal.
Digestibility %
Treatment Crude protein Acid Detergent Fibre Dry matter
I (40% alfalfa) 78.75a 26.28
a 64.35
II (10% hybrid polar) 68.71b 19.04
b 59.02
III (20% hybrid poplar) 60.05b 8.40
b 55.72
IV (40% hybrid poplar) 54.76b 10.15
b 57.63
a different from
b (p<0.05)
Source: Ayers et al. (1996)

59
CHAPTER THREE
3.0 MATERIALS AND METHODS
3.1 Experimental site
The study was carried out at the Cattle Research Station, Boadi, of the Kwame Nkrumah
University ofScience and Technology, Kumasi. The Station is located in the south-eastern part of
Kumasi. The average monthly temperatures of the area vary between 26.10C and 28.9
0C. High
temperatures occur during the months of November-April with average maximum temperatures
occurring in February and March while the lowest are experienced in July. Rainfall in the area is
bimodal with an annual mean of 1500 mm. The rainy season covers April-July and September-
November. A short dry season separates the two periods in August. The maindry season lasts
from November to February (Tuah et al., 1990).
3.2 Cultivation of moringa plants
An experimental plot of moringa plants was established at the Cattle Research Station of the
Kwame Nkrumah University of Science and Technology, Kumasi, on the 14th
of July, 2008, as a
source of moringa leaf meal for the experiment. A plot size of 28 × 12.60 m equivalent to 0.035
ha, and a plant spacing of 1.30 m × 1.30 m giving a population of 5,917 plants per ha were
adopted. Seedlings were raised in polybags and transplanted three weeks after germination onto
the prepared plot. Poultry manure was applied before planting and top-dressed with the same
manure type every four weeks interval, until leaves were harvested. Watering and weeding were
done continuously during fodder establishment. At the height of 2 m, the apical buds of all plants
were cut to facilitate branching.

60
All plants were first harvested at 90 days of growth. To avoid border effects,only the central
plants were harvested to determine the total fresh weight of forage.
Dry matter (DM) weight was determined mathematically from the fresh matter weight. Both the
fresh and dry matter weights were then extrapolated to hectare basis. Representative samples of
the air-dried leaves were taken to the laboratory for chemical analysis to determine crude
protein, crude fibre, ether extract, nitrogen free extractives, calcium, and phosphorus, using the
standard procedures of the Association of Official Analytical Chemists (AOAC, 1990).
3.3 Sources of feed ingredients and experimental animals
Millet mash residue was obtained from local porridge makers in Kumasi while soyabean meal
(SBM) was purchased from a commercial feed supplier in Kumasi. The weaned rabbits were
obtained from the Cattle Research Station of the Kwame Nkrumah University of Science and
Technology, Kumasi, and some individual rabbit keepers in and around Kumasi. Moringa leaf
meal was obtained from the established moringa plot at the Research Station.
3.4 Processing of moringa leaves
The harvested moringa leaves were air dried in shade under a shed until they were crispy to
touch, while retaining their greenish colouration. The leaves were then milled using a hammer
mill of sieve size 3 mm, to obtain a product herein referred to as moringa leaf meal (MOLM)
which was stored in sacs until needed.
3.5 Experimental animals and management
Thirty (30) weaner rabbits of mixed breeds and sexes were used for the experiment. The rabbits
were between 6-7 weeks of age and weighed between 641.7 g and 643.3 g.

61
They were randomly divided into five groups of six animals per treatment, after balancing for
body weight. Two animals constituted a replicate and each replicate was housed in a separate
hutch raised from the ground.
The animals were provided with a feeder and a drinker in each hutch. Prior to the experiment,
each animal was dewormed using Piperazine (Dorpharma B.V. Ltd., The Netherlands) and given
acaricide bathe using Amirazzo (Arab Pesticides and Veterinary Drugs Manufacturing Company,
Jordan). Coccidiosis was routinely controlled using Amprocox (Maridav Ltd., Ghana) or
cocciplus (Polichem; S.L. Ltd., Spain).
3.6 Experimental diet
Five experimental diets were formulated. Diet 1, which was designated as TO served as the
control diet and contained soyabean meal as the main protein source with no moringa leaf meal.
Diet 2 designated as T1; Diet 3 as T2; Diet 4 as T3 and Diet 5 as T4 contained moringa leaf meal
at the rate of 5, 10, 15 and 20%, respectively.
3.7 Experimental design and duration of experiment
The five treatment groups were assigned the five experimental diets in a completely randomized
design (CRD). Each treatment was replicated three times and there were two rabbits per
replicate. Each rabbit was fed an assigned diet which started on 29 November, 2008 and lasted
for twelve (12) weeks after one week of adjustment period.
3.8 Growth study
The experimental diets were offered ad libitum in separate wooden feeders in the morning
(08.00h), so the rabbits determined their intake of the feed. The daily supply was about 5% the
body weight of the rabbit concerned.

62
The diets were offered daily and the feed leftover and/or wastage were weighed daily before
feeding. Water was also provided ad libitum in plastic containers. All animals were weighed at
the start of the experiment before allocating them to the treatments. Parameters determined
included average feed intake, average body weight gain, feed conversion ratio, feed cost, feed
cost per kg gain, and mortality.
3.9 Blood sample collection and analysis
At the end of the feeding period, the animals were starved of feed for 24 hours before blood
samples were collected from one rabbit per replicate for haematological and biochemical
analysis. The blood samples were collected from each rabbit from the external ear vein using a
sterilized disposable syringe and needle between 6.30 and 7.30 am.Prior to bleeding, a cotton
swab soaked in 70% ethanol was used to dilate the vein and to prevent infection. An initial 1.0
ml blood was collected into labeled sterile universal bottles containing Ethylene- Diamine-Tetra-
Acetic acid (EDTA) as anticoagulant. This was used to determine the haematological
components within an hour of sample collection. Another 1.0 ml of blood was collected into
labeled sterile sample bottles without anticoagulant and used to determine the biochemical
components. The blood samples were centrifuged at 500 rpm (revolution per minute) for 3
minutes in a microcentrifuge to obtain serum that was free from cell debris for the biochemical
analysis using a spectrophotometer (Available Commercial Kits produced by Sentinel, Italy) at a
wavelength of 500 nm.
The serum obtained was analysed colorimetrically for total protein (TP) by the Biuret method
with kits (PLASMATEC) supplied by Plasmatec Laboratory Products Ltd., U.K.

63
Colorimetric determination of TP is based on the principle of Biuret reaction (copper salts in
alkaline medium) in which cupric ions form a blue complex, in alkaline solution, with NH2of
two or more peptide bonds. The intensityof the blue colour formed is proportional to the protein
concentration in the plasma or serum. Albumin concentration was determined by the
Bromocresol Green (BCG) method (Peters et al., 1982); albumins (Ab) bind with BCG to form a
green compound. The concentration of Ab is directly proportional to the intensity of the green
colour formed. Globulin (Gb) concentration was computed as the difference between total
protein and albumin concentrations. Cholesterol was determined as described by Coles (1986).
The red blood cell (RBC) counts, total white blood cell (WBC) counts, haemoglobin (Hb)
concentration and Packed cell volume (PCV) parameters were determined following standard
procedures described by Davice and Lewis (1991).
3.10 Digestibility study
Digestibility study was carried out during the last week of the feeding trial. It involved feeding
the rabbit with known quantity of feed which lasted for seven days. Total faeces voided was
collected daily and oven dried to determine moisture content. Representative samples of dried
faeces were taken for proximate analysis using AOAC (1990) methods.
The digestibility values for dry matter (DM), crude protein (CP), ether extract (EE), and crude
fibre (CF) were calculated as nutrient intake minus nutrient excreted divided by nutrient intake
multiplied by hundred.
3.11 Carcass yield evaluation
At the end of the experimental period, one rabbit per replicate (15 rabbits in all) was randomly
selected, starved of feed for 24 hours and slaughtered by cutting the jugular vein to allow proper

64
bleeding. Determination of blood weight was by the difference between slaughter weight and
hotcarcassweight. The slaughtered rabbits were defurred using flame and eviscerated to evaluate
their carcasses.Dressing percentage was determined by dividing the hot carcass weight by the
slaughter weight and multiplied by hundred.The meat composition of the carcasses was
determined by removing the right thighs and peeling off the skins of each animal. The muscle of
each rabbit was separated from the bone and ground separately for three times in an electric
grinder (Hong Teng Co. Ltd, China). After thorough mixing, aliquots were obtained for
moisture; protein and ether extract analysis using the procedures outlined by AOAC (1990).
3.12 Economics of production
The prevailing market prices of ingredients used during the period of the study were used for the
economic appraisal of the feeds. Economics of production was based on the feed cost per kg diet
and feed cost per kg weight gain. Feed cost per kg liveweight gain was calculated as a product of
the feed cost per kg diet and feed conversion ratio for individual dietary treatments. Table 30.0
below shows the feed ingredients and their prices per kilogramme.
Table: 30.0 Feed Ingredients and their Prices per kilogramme.
Ingredients Price per kilogramme (GH¢/kg)
Millet mash residue
Soya bean meal
Premix
Dicalcium phosphate
Salt
Moringa leaf meal
0.13
0.78
1.60
1.60
0.20
1.20

65
3.13 Statistical analysis
Analysis of variance (ANOVA) for Completely Randomized Design (CRD) was carried out
using GenStat(Release 4.24)statistical package (Genstat, 2005).Differences between means were
separated by the Duncan’s Multiple Range Test (DMRT).

66
CHAPTER FOUR
4.0 RESULTS
4.1.0 Moringa cultivation
The leaf yield of the moringa trees at the first harvest is presented in Table 31.0.
Table 31.0 Moringa leaf production at 90 days of planting
Plant part Weight in kg/ha
Fresh leaves 2500.61
Dry leaves (DM) 616.40
4.1.1 Chemical composition of moringa leaf meal
The results of the chemical composition analyses of the moringa leaf meal (MOLM) are
presented in Table 32.0. The MOLM was found to be rich in crude protein (29.25%), ash
(7.13%), phosphorus (0.33%) and calcium (8.64%).
Table 32.0:Chemical composition of Moringa leaf meal (MOLM) (%DM basis).
Fraction Composition
Dry matter 24.65
Crude protein (CP) 29.25
Ether Extract (EE) 2.23
Crude Fibre (CF) 19.25
Ash 7.13
Nitrogen Free Extract (NFE) 41.98
Phosphorus 0.33
Calcium 8.64

67
4.2 Percentage inclusion levels and chemical contents of experimental diets
The percentage inclusion levels and chemical contents of the experimental diets fed the weaner
rabbits are shown in Table 33.0.
Table 33.0: Percentage inclusion levels and chemical contents of experimental diets fed to
weaner rabbits.
Dietary Treatments
T0 T1 T2 T3 T4
0%MOLM 5%MOLM 10%MOLM 15%MOLM 20%MOLM
Ingredient (%)
Milletmash residue 78.00 78.00 78.00 78.00 78.00
Soyabean meal 20.00 15.00 10.00 5.00 -
Moringa leaf meal - 5.00 10.00 15.00 20.00
Dicalcium Phosphate 1.00 1.00 1.00 1.00 1.00
Vitamin-mineral premix1 0.50 0.50 0.50 0.50 0.50
Salt 0.50 0.50 0.50 0.50 0.50
Total 100.00 100.00 100.00 100.00 100.00
Calculated composition %
Crude protein (CP) 18.16 17.32 16.46 15.63 14.78
Crude fibre (CF) 8.45 9.11 9.77 10.43 11.09
Ether Extract (EE) 3.51 3.59 3.66 3.74 3.81
Lysine 0.78 7.26 13.70 20.22 26.70
Methionine 0.35 2.07 3.79 5.51 7.23
Digestible energy 2952.70 2883.42 2814.14 2744.86 2675.59
(kcal/kg)
Analyzed composition %
Dry matter (DM) 88.01 88.74 89.40 88.10 88.76
Crude protein (CP) 17.44 17.31 16.66 15.91 15.50
Crude fibre (CF) 7.75 9.01 9.11 10.12 10.84
Ether extract (EE) 1.97 1.20 1.41 1.49 1.52
Calcium (Ca) 1.20 1.04 1.20 1.28 1.36
Phosphorus (P) 0.31 0.25 0.34 0.37 0.38
1Vitamin-mineral premix = Inclusion rate: 2.5 g/kg to supply the following/kg diet: vitamin A-8000IU; vitamin D –
3000IU; vitamin E – 8IU; vitamin K- 2mg; vitamin B1- 1mg; vitamin B2– 2.5mg; vitamin B12–15mcg; niacin –
10mg; panthothenic – 5mg; antioxidant –6mg; folic acid – 0.5mg; choline –150mg; iron -20mg; manganese – 80
mg; copper – 8mg; zinc – 50mg; cobalt – 0.225mg;iodine – 2mg; selenium –0.1mg.

68
The calculated and analyzed nutrient compositions of the five experimental diets fed to the
rabbits during the period of the experiment are also shown in Table 33.0.
The percentage CP of the analyzed diets did not vary considerably from the calculated values.
The crude protein in T0 (0%MOLM) of the analyzed composition, however, reduced while that
of diets T1 (5% MOLM), T2 (10%MOLM), T3 (15%MOLM) and T4 (20%MOLM) appreciated
slightly. The CF and EE compositions in the analyzed diets showed a considerable reduction in
value as compared to the calculated compositions. The lysine and methionine values in the
calculated composition showed relative increase as the inclusion level of MOLM increased from
T0 to T4. It was observed from the analyzed composition of the diets that, as the level of MOLM
inclusion increased, the values of the CF also increased, unlike the CP which showed a
decreasing trend.
4.3 Productive performance of rabbits fed moringa diets
The productive performance of the weaner rabbits fed the various diets is indicated in Table
34.0. The rabbits had similar body weights at the start of the experiment. The final body weight
and the total weight gain increased with increasing levels of MOLM, but the treatment mean
differences were not statistically significant (P>0.05). The daily weight gain also increased with
increasing level of MOLM, and the control animals (T0) performed poorer (p<0.05) than those
fed the MOLM inclusive diets. The daily feed intake and the FCR values similarly improved
with increasing level of MOLM, but the treatment differences were not statistically significant.
The MOLM increased the unit cost of the concentrate feed used. No animal died in the course of
the experiment.

69
Table 34.0:Productiveperformance of weaner rabbits fed moringa diets
PARAMETERS DIETARY TREATMENTS
T0
0% MOLM
T1
5%MOLM
T2
10%MOLM
T3
15%MOLM
T4
20%MOLM
SEM SIG
.
Initial weight (g)
SD
641.67
(76.38)
641.67
( 87.80)
641.67
(52.04)
643.33
(60.28)
641.67
(52.04)
38.81 NS
Final weight (g)
SD
1625.31
(5.00)
1774.83
(5.10)
1791.63
(2.08)
1821.85
(2.00)
1902.51
(2.52)
86.12 NS
Total weight gain (g)
SD
983.64
(0.61)
1133.16
(30.20)
1149.96
(31.04)
1178.52
(41.00)
1260.84
(50.10)
61.05 NS
Daily weight gain (g)
SD
11.71b
(1.41)
13.49a
(0.86)
13.69a
(1.36)
14.03a
(0.15)
15.01a
(0.02)
0.55 *
Daily weight gain per body weight (g/kg)
SD
7.20b
(0.87)
7.60a
(0.06)
7.66a
(0.50)
7.77a
(0.91)
7.90a
(0.38)
0.31 *
Daily(DM) feed intake (g)
SD
60.10
(0.56)
61.13
(1.13)
61.20
(2.91)
62.15
(2.15)
63.40
(3.61)
1.36 NS
Daily (DM) feed intake per body weight (g/kg)
SD
36.98
(0.34)
34.53
(1.88)
34.31
(2.27)
34.42
(3.92)
33.32
(0.48)
1.28 NS
F.C.R.(feed/gain)
SD
5.13
(0.23)
4.53
(0.47)
4.47
(0.26)
4.43
(0.23)
4.22
(0.11)
0.16 NS
Feed Cost/kg (GH¢) 0.28 0.30 0.32 0.35 0.37 - -
Feed Cost/kg gain (GH¢)
SD
1.44
(0.06)
1.36
(0.14)
1.43
(0.09)
1.55
(0.08)
1.56
(0.04)
0.05 NS
Mortality 0.00 0.00 0.00 0.00 0.00 - -
SEM = Standard Error of means; NS = Not significantly different (p>0.05); * = significantly different (p<0.05)
SIG = Significance level; a,b
= Values in the same row with different superscripts differ significantly (p<0.05)
F.C.R. = Feed Conversion Ratio; SD = Standard deviation

70
4.4 Apparent nutrient digestibility of rabbits fed moringa diets
The apparent nutrient digestibility values are shown in Table 35.0.
Table 35.0: Apparent nutrient digestibility of rabbits fed moringa leaf meal diets
Treatments
Parameters T0
0%MOLM
T1
5%MOLM
T2
10%MOLM
T3
15%MOLM
T4
20%MOLM
SEM SIG.
Dry matter (DM)
SD
65.02b
(2.98)
75.50a
(2.00)
76.00a
(6.00)
77.02a
(4.00)
78.40a
(6.41)
2.59 *
Crude protein (CP)
SD
65.10b
(2.90)
74.50a
(6.81)
76.32a
(3.68)
80.75a
(5.72)
87.80a
(2.35)
2.67 *
Crude Fibre (CF)
SD
50.01
(1.00)
50.20
(2.00)
51.00
(1.00)
53.00
(2.74)
55.00
(0.80)
0.97 NS
Ether Extract (EE)
SD
70.00
(17.09)
71.00
(3.00)
72.00
(18.00)
75.12
(10.06)
77.50
(7.00)
9.81 NS
SEM = Standard Error of Means; * = significantly different (p<0.05); NS = Not significantly different (p>0.05)
SIG. = Significance level; SD = Standard deviation
The apparent digestibility values for dry matter (DM), crude protein (CP), crude fibre (CF) and
ether extract (EE) were generally higher for rabbits on dietary treatments 1, 2, 3 and 4 than for
those on T0. The general trend observed was that as the level of MOLM inclusion increased from
T0 to T4, the values obtained for the various nutrients increased accordingly. No significant
(p>0.05) differences were observed for the CF and EE values. The DM and CP digestibility
values were, however, higher (p<0.05) for rabbits on dietary treatments 1, 2, 3, and 4 than for
those on T0.
4.5Carcass measurements and meat composition of rabbits fed moringa diets
The carcass measurements and meat composition are indicated in Table 36.0. The slaughter
weight, hot carcass weight, dressed weight and dressing percentage increased numerically as the
MOLM level was increased in the diet.

71
There was a significant positive correlation between slaughter weight and dressed weight
(r=0.9306, P<0.05).Similarly, the slaughter weight correlated positively with dressing
percentage (r=0.5365, P<0.05). The MOLM improved meat quality by increasing (p<0.01)
protein content and reducing (p<0.01) fat level in the meat.
Table 36.0: Carcass measurements (g) and meat composition (%) of rabbits fed moringa diets Treatments Carcass characteristics T0
0%MOLM
T1
5%MOLM
T2
10%MOLM
T3
15%MOLM
T4
20%MOLM
SEM SIG
.
Slaughter weight
SD
1290.33
(128.70)
1428.67
(78.82)
1430.00
(78.80)
1487.67
(114.72)
1530.33
(133.46)
163.72 NS
Hot carcass weight
SD
1258.33
(75.34)
1383.33
(82.92)
1390.00
(71.36)
1431.00
(67.62)
1484.67
(98.08)
161.73 NS
Blood weight
SD
32.00
(10.58)
45.34
(6.11)
40.00
(12.50)
56.67
(14.22)
45.66
(11.59)
6.54 NS
Dressed weight
SD
801.67
(114.41)
862.67
(112.82)
885.67
(41.20)
927.00
(132.64)
1019.67
(157.47)
68.27 NS
Dressing percentage
SD
62.13
(1.94)
60.38
(3.68)
61.93
(1.43)
62.31
(2.00)
66.63
(0.63)
1.26
NS
Full GIT Weight
SD
212.00
(70.16)
275.67
(53.90)
249.67
(30.83)
251.67
(68.63)
250.00
(60.30)
31.01 NS
Empty GIT Weight
SD
127.00
(76.27)
128.33
(31.53)
126.00
(30.01)
113.67
(38.66)
132.00
(19.35)
26.80 NS
Liver Weight
SD
44.00
(4.00)
42.33
(2.30)
42.13
(2.21)
37.33
(4.45)
32.33
(7.47)
3.22 NS
Kidney Weight
SD
9.33
(1.15)
9.20
(1.09)
8.47
(1.25)
7.41
(0.58)
7.20
(0.59)
0.98 NS
Lung Weight
SD
13.00
(1.73)
9.00
(1.00)
10.33
(1.15)
13.10
(3.46)
12.67
(4.16)
1.52 NS
Heart Weight
SD
4.00
(2.00)
3.00
(1.00)
4.33
(1.15)
3.33
(1.15)
4.20
(2.08)
0.89 NS
Caecum + content weight
SD
65.67
(12.66)
75.00
(5.57)
80.00
(13.80)
77.00
(14.00)
76.90
(14.10)
7.46 NS
Empty Caecum weight
SD
17.33
(2.52)
19.67
(1.53)
20.33
(4.73)
24.67
(2.52)
21.00
(3.61)
1.83 NS
Meat composition (%)
Moisture
SD
73.80
(5.00)
74.04
(4.11)
74.20
(4.12)
75.30
(7.10)
77.10
(8.10)
0.07 NS
Crude protein
SD
20.02b
(0.03)
20.60a
(0.35)
20.70a
(0.50)
21.00a
(0.10)
21.30a
(0.10)
0.16 **
Ether Extract
SD
10.30a
(0.37)
9.45a
(0.20)
9.30a
(0.09)
8.96a
(0.13)
8.56b
(0.03)
0.13 **
SEM = Standard Error of Means; ** = significantly different (p<0.01); NS = Not significantly different (p>0.05)
SIG. = Significance level; SD = Standard deviation

72
4.6 Blood components of rabbits fed moringa diets
The blood haematological and biochemical components of the rabbits are shown in Table 37.0.
The MOLM did not vary the blood characteristics studied. However, the MOLM tended to
reduce the cholesterol level in the blood.
Table 37.0: Haematological and biochemical components of weaner rabbits fed moringa diets
Treatments T0
0%MOLM T1
5%MOLM T2
10%MOLM T3
15%MOLM T4
20%MOLM SEM SIG.
Haematological components
Haemoglobin (g/dl)
SD
14.50
(0.45)
14.45
(0.97)
14.26
(0.77)
14.90
(0.39)
15.95
(0.06)
0.35 NS
Packed cell volume (%)
SD
45.40
(3.33)
43.30
(2.72)
46.17
(4.36)
44.40
(0.44)
46.77
(2.32)
1.69 NS
Red Blood cell (×106/µl)
SD
7.35
(0.84)
7.90
(0.85)
7.40
(0.90)
7.66
(0.75)
7.73
(0.76)
0.28 NS
White blood cell (×103/dl)
SD
8.30
(0.84)
8.90
(0.56)
8.20
(0.35)
8.60
(0.30)
8.53
(0.59)
0.28 NS
Neutrophils (%)
SD
43.00
(16.10)
41.20
(1.59)
39.50
(1.32)
34.50
(9.86)
35.20
(5.30)
5.22 NS
Lymphocytes (%)
SD
56.00
(4.36)
57.50
(26.43)
46.50
(6.84)
43.00
(2.65)
41.00
(1.00)
7.17 NS
Eosinophils (%)
SD
1.04
(0.03)
1.01
(0.03)
1.02
(0.01)
1.03
(0.20)
1.00
(0.02)
0.10 NS
Biochemical components
Cholesterol (mg/dl)
SD
40.70
(1.39)
38.80
(6.64)
36.90
(0.95)
35.50
(1.04)
35.02
(5.01)
2.21 NS
Total protein (g/dl)
SD
5.80
(7.59)
6.00
(6.55)
6.90
(1.73)
5.90
(4.36)
5.10
(4.62)
0.38 NS
Albumin (g/dl)
SD
3.40
(8.30)
3.70
(1.00)
4.10
(1.73)
3.80
(3.12)
3.20
(9.85)
0.35 NS
Globulin (g/dl)
SD
2.40
(3.22)
2.30
(6.25)
2.80
(3.46)
2.10
(5.30)
1.90
(7.21)
0.96 NS
SEM = Standard Error of Means; NS = Not significantly different (p>0.05); SIG. = Significance level
SD = Standard deviation

73
CHAPTER FIVE
5.0 DISCUSSION
The leaf yield obtained for the cultivatedmoringa plants after the first cut using a planting
distance of 1.30m × 1.30 m on the plot size of 28 m × 12.60 m were extrapolated to2,500.61 and
616.40 kg /ha on fresh and dry matter bases, respectively (Table 31.0). These values were,
however, lower than 97400 kg/haon fresh matter and 16560 kg/ha dry matter basis reported by
Makker and Becker (1997) after their first cut of moringa plants. The differences may partly be
attributed to the higher planting densities used by the earlier researchers. Other factors such as
edaphic, climatic and varietal differences may also have contributed tothe observed differences.
The crude protein (CP) content of the MOLM used was 29.25% (Table 32.0). This was higher
than the CP values of 27.1% and 27.51% MOLM reported by Booth and Wickens (1988) and
Oduro et al. (2008), respectively. The values obtained for the crude fibre (CF), ether extract
(EE), calcium (Ca) and Phosphorus (P) for the MOLM in the present study were, however,
similar to those reported by Oduro et al. (2008), but the CF value of 19.25% was slightly higher
than the 19.20% reported by Booth and Wickens (1988). The variations in the nutrients could be
attributed to the age of cuttingor harvesting, climatic conditions, edaphic factors, agronomic
practices as well as methods of processing and analysis (Fuglie, 1999). The CP of MOLM as
observed was lower than that of soyabean meal (44%) or fish meal (60%) used conventionally as
sources of protein in rabbit rations.

74
From Table 33.0 differences were observed between calculated and analyzed crude protein, ether
extract and crude fibre contents of the experimental diets. While analyzed CP values were
slightly higher for T1 (5%MOLM), T2 (10%MOLM), T3 (15%MOLM) and T4 (20%MOLM) the
reverse was true for that of treatment T0(0%MOLM). The CF and EE values for the analyzed
composition for all the treatments were, however, below those of the calculated ones. The
differences might be due to the variations between tabulated nutrient content values used in the
calculation and actual nutrient content of the ingredients used in formulating the diets. Perhaps, if
all the ingredients had been analyzed before the formulation and compounding of the diets, this
situation might not have arisen. The nutrients met the minimum nutrient requirements for rabbits
(Maertens, 1992). The differences observed with the calculated lysine and methionine levels as
the level of MOLM inclusion increased was to be expectedsince MOLM is reported to have
higher levels of these amino acids (Booth and Wickens, 1988) than soyabean meal (NRC, 1994).
High weight gain of animals normally results from increased feed intake. This situation was
observed in the present experiment. Weight gain increased with the level ofMOLM inclusion in
the diet. The average daily weight gain was significantly (p<0.05) higher for the rabbits on the
MOLM diets(T1 toT4)than for those on the control diet (T0).This result agrees with the finding of
Bamikole et al. (2005) when they reported an increase in daily weight gain after feeding rabbits
with mulberry leaves based diets, but conflicts with that of Famounyan and Meffega (1986) who
reported low body weight gain in rabbits fed sun-dried cassava leaves diets in the tropics. In the
present study, feed intake did not vary between treatment groups.

75
The poorer average daily gains in the control animals (T0), therefore, suggests that the control
(T0) diet may be poorer in quality than the MOLM diets (T1to T4).
Normally an increase in CP in diets should result in higher daily weight gain. However, protein
increases should be matched with increased amino acids like methionine and lysine that are
normally deficient in rabbit diets for growth to increase, otherwise growth may be depressed.
The CP values (Table33.0) for the experimental diets reduced slightly as the inclusion level of
MOLM increased.The higher weight gains in the rabbits fed the MOLM diets may, therefore, be
partly due to a better protein quality, possibly arising from a higher methionine and lysine supply
(Booth and Wickens, 1988).
According to McDonald et al. (1988) the protein in soyabean meal contains all the essential
amino acids but the concentration of methionine and cysteine are sub-optimal, and that
methionine is the first limiting amino acid and may be particularly important in high energy
diets. Gillespie (1998) also reported that methionine and lysine are usually the amino acids that
are found to be deficient in rabbit rations.
Vitamin A is important in rabbit growth. MOLM is reported to have a high vitamin A (Booth and
Wickens, 1988; Grubben and Denton, 2004; Fuglie, 2005). The control diet T0 (0%MOLM)
might have provided insufficient vitamin A for the rabbits, hence resulting in poor growth, since
vitamin A aids in promoting growth in rabbits. Pond et al. (1995) stated that vitamin A
deficiency in the diets of rabbits makes the rabbits to exhibit poor growth.

76
The superior feed conversion ratios for the MOLMdiets might have also contributed to the
superior growth rate and weight gain by the rabbits on the MOLMdiets as compared to the
control. The average daily weight gain (ADG) values recorded in this study were higher than
those reported by Farinu et al. (2008).However, the present ADG values of 11.7 - 15.0 g/dwere
lower than the 15.16 – 39.70 g/d reported by Okorie (2003),Omole and Onwudike (1982), Eshiet
et al. (1979); Ayers et al. (1996) and Omole and Sonaiya (1981).
The generally low growth rates observed in this study could be explained by the fact that the
rabbits did not consume a lot of the feeds to ensure higher growth. It might also be possible that
subclinical infections may have adversely affected their growth rate. Another possible reason
may be linked to poor genetic constitution of the rabbits used.
The average daily feed intake (ADFI) did not show any significant (p>0.05) difference between
the dietary treatments, however,the rabbits showed systematic increase in daily feed intake from
treatment T0 to T4.This trend in feed intake by the rabbits is understandable, since leaf meals
contain relatively high fibre which tends to increase the total fibre content of the diet and dilute
other nutrients. Rabbits must eat to meet their energy requirement to sustain rapid growth and
development, hence the increased feed intake. This assertion generally agrees with the findings
by other researchers (Spreadbury and Davidson, 1978; Aduku et al., 1988) who reported higher
feed intake with increasing level of crude fibre (CF) in the diets of rabbits. The results, however,
contrast the findings by Nworgu et al. (1999) who reported a reduction in feed intake by rabbits
on increased forage meal in the diet. Another associated factor for the increased feed intake
might also be due to greater palatability of the MOLM diets as compared to the control diet. The
depressed feed intake of rabbits on the control diet may also be related to variation in the amino

77
acid profiles of the feeds. Forbes (1995) reported that if the amino acid content in the feed
differed widely from the animal’s requirement for amino acids, feed intake would be depressed
and that if the deficient amino acid was supplemented, intake would be increased.The present
study produced daily feed intake values of 60.1- 63.4 g (Table34.0), which were generally lower
than concentrate feed intake of 61.08 – 133.9 g earlier reported for rabbits(Ayers et al., 1996;
Omole and Sonaiya et al., 1981; Okorie, 2003). The values reported in this study however, were
generally higher than the 24.02 – 60.54 g reported by Eshiet et al. (1979) in the tropics.
The feed conversion ratio valuesof 5.13, 4.53, 4.47, 4.43 and 4.22 (Table34.0) obtained in this
study were higher than the 2.63- 4.00reported by earlier researchers in the tropics (Ayers et al.,
1996; Okorie, 2003); but were generallylower than that of 5.32 – 5.63 reported by Eustace et al.
(2003). The generally poor FCRs obtained were probably due to the relatively low growth rates.
Genetic differences might have also contributed to the lower FCRs recorded.
The feed cost increased as the level of MOLM inclusion increased from T0 (0%MOLM) to T4
(20%MOLM). This was to be expected, since the higher MOLM diets contained more of the
expensive MOLM and lesser amounts of the cheaper soyabean meal (SBM). At the time of the
experiment, the prevailing market prices for SBM and MOLM were GH ¢ 0.78 and GH ¢ 1.20
per kg, respectively (Table30.0).The high price of MOLM was due to the high demand for the
product because of the promotion of MOLM as food supplement for humans at the time of the
experiment.The difference in feed cost per kg live weight was not significant (p>0.05), although
the values obtained for 0% MOLM, 15% MOLM and 20% MOLM were comparatively higher
than those for 5% and 10% MOLM diets. This might be due to the low FCR and high feed

78
cost/kg values. Based on the present results, it could be concluded that the rabbits fed the various
dietary treatments produced similar economic efficiency in feed cost per kg weight gain.
The apparent digestibility values recorded for rabbits on the various dietary treatments are shown
in Table 35.0. The lower apparent digestibility values recorded for rabbits on diet T0
(0%MOLM) was somehow unexpected due to its relatively lower crude fibre content as
compared to those of T1 (5%MOLM), T2 (10%MOLM), T3 (15%MOLM) and T4 (20%MOLM).
This may suggest that the CF contents in all the dietary treatments were similar and therefore,
did not affect the digestion of the various nutrients investigated. The probable reason might be
due to the fact that MOLM was more digestible than the SBM used for the formulation of the
treatment diets. Fahey et al. (2001) reported that moringa is an outstanding indigenous source of
highly digestible protein. The fact that digestibility values increased as the level of MOLM
increased may attest to this assumption. The present digestibility values of 65.02-78.40% forDM,
65.10-87.80% forCP, 50.01-55.00% for CF and 70.00-75.50% forEE (Table 35.0) are generally
higher thanthe 55.72-64.35% for DM, 26.28-62.48% for CP, 8.40-48.53% for CF and 65.0-
69.00% for EE reported earlier (Eustace et al., 2003; Iyeghe-Erakpotobor et al., 2006; Ayers et
al., 1996; Iyeghe-Erakpotobor, 2005) in the tropics.This observation may be as a result of the
highly digestible nature of moringa.
The various dietary treatments imposed on the rabbits produced no significant (p>0.05) impact
on the full GIT, empty GIT, lung, heart and empty caecum weights (Table36.0). Although
slaughter weight, hot carcass weight, dressed weight, and dressing percentage did not show any
significant (p>0.05) difference in their average values, it was observed that the values tended to

79
increase with increasing levels of MOLM in the diets.This observation may be a reflection of the
relatively higher feed intake by rabbits on the MOLM diets resulting in higher daily weight gain.
The positive correlation observed between slaughter weight and dressed weight,and between
slaughter weight and dressing percentage were significant (p<0.05), suggesting that as slaughter
weight increased, dressed weight and dressing percentage also increased with increasing
inclusion levels ofMOLM in the diets.This is in line with the observation that the diets
containing the MOLM resulted in better feed: gain ratios and hence the heavier weights of the
rabbits fed those diets.The slaughter weight values of 1428.67 g-1530.33 g obtained in this study
were generally higher than the 1305.00 g - 1425.00 g reported by Eustace et al. (2003).
However, the values were lower thanthe 1595.83 g - 2290.00 g reported by Biya et al.(2008).
The dressing percentage values from the present study were greater than those reported by Biya
et al. (2008), butlower than those reported by Okorie (2003). The dressed weight values of
801.67 g -1019.67 g obtained in this study were generallylowerprobably because of the lower
feed intake by the rabbits when compared with 988.24 g – 1335.00 g reported byother
researchers in the tropics (Biya et al.,2008; Eustace et al., 2003).
The liver and kidney weights differences did not show any significance (p>0.05), however, it
was observed that as the inclusion level of MOLM increased, the corresponding mean values
decreased marginally. This situation may be blamed on the presence of some antinutritional
factors possibly present in the soyabean meal (SBM) used in the formulation of the diets forT0
(0%MOLM), T1 (5%MOLM), T2 (10% MOLM) andT3 (15%MOLM), since rabbits on these
diets had higher liver and kidney weights than treatment four (4) without SBM. According to
80
Bone (1979) increased metabolic rate of the organs in an attempt to reduce toxic or
antinutritional factors in livestock feeds to non-toxic metabolites may cause abnormalities
(increase) in their weights. Ahamefule et al. (2006) reported that the weights of some internal
organs like kidney and liver of animals may be used in animal feeding experiments as evidence
of toxicity. The quality of protein in SBM is dependent on the cultivar and processing
method.Under-processing may lead to deleterious level of antinutritional factors, which may
impact negatively on the growth and performance in young animals (Parkhurst and Mountney,
1988). The SBM used for the study might have been under-processed thereby retaining some
antinutritional factors which could have accounted for the higher weights of the kidney and liver
in an attempt to detoxify them in the rabbits that received the T0, T1, T2 and T3 diets.
The values obtained in this study for the liver and kidney weights were generally lower, but the
heart (3.00 - 4.33 g) and lung (9.00 – 13.10 g) weights were higher indicating a higher
physiological activity of these organs than in thecase of the 2.95 – 3.90 gheart weight and 6.80 –
9.40 g lung weight reported in the tropics by Eustace et al. (2003), when they fed weaner rabbits
varying levels of dietary cyanide.The weights of the liver (32.33 g – 44.00 g) and kidney(7.20 g
– 9.33 g)were higher than the liver (30.36 g – 42.84 g) and kidney (5.18 g – 6.36 g)weights
reported by Amata and Bratte (2008) who studied the effect of partial replacement of SBM with
gliricidia leaf meal (GLM) on the performance and organ weights of weaner rabbits in the
tropics.
The chemical analysis of the meat of the rabbits (Table: 36.0) indicated that the various dietary
treatments did not significantly (p>0.05) influence the moisture content. However, there was an
increase in moisture content in the MOLMdiets T1 (5%MOLM), T2 (10%MOLM), T3

81
(15%MOLM) and T4 (20%MOLM) over the control diet T0 (0%MOLM). The crude protein
content of the meat showed higher (p<0.01) values for rabbits fed diets containing MOLM over
those fed the control diet (T0). The ether extract content of the meat showed higher (p<0.01)
values for rabbits fed diets T0 (0%MOLM), T1 (5%MOLM), T2 (10%MOLM) and T3
(15%MOLM) which had varying amounts of soyabean meal over the T4 (20%MOLM) diet
which did not have any SBM (Table36.0). The differences observed in the chemical composition
of the meat could possibly be attributed to the fact that the protein or amino acid profile of the
SBM was deficient in certain amino acids as compared to that of MOLM. Protein or amino acid
content of a diet is directly related to the moisture level of the carcass, which is inversely related
to the ether extract (fat) level (Noblet and Henry, 1977). Therefore, when a diet is deficient in
certain amino acids or a low protein diet is fed to animals, carcass moisture level declines
resulting in a concomitant increase in carcass fat or lipid levels.
Previous research reports have shown that a reduction of the level of protein and essential amino
acids in the diet, from an optimum level for growth, is associated with a decreased growth rate
and efficiency of feed utilization and a concomitant increase in body fat (Wahlstrom and Libal,
1974; Noblet and Henry, 1977; Russell et al., 1983). Wang et al. (1991) and Marks (1990) also
reported that dietary protein level is one of the several non-genetic factors that influence the
amount of body fat. The results of the analyzed rabbit meat composition values in this study,
20.02 – 21.30% CP and 8.56 – 10.30% EE(Table36.0) compare favourably with the 20.00 -
22.00%CP and 10.00 – 12.00%EE reported by Fielding (1991) but contrast values of 21.55% CP
and 2.73% EE reported by Mohammed (1989) in the tropics.

82
All the haematological parameters measured in the present experiment were within the normal
physiological rangesreported for rabbits;haemoglobin (8.0 – 17.5g/dl), packed cell volume (30.0
– 50.0%), red blood cell (4.0 – 8.0×10⁶/µl), white blood cell (5.0 – 12.0 × 10
3/dl ), neutrophils
(35.0 – 55.0%), lymphocytes (25.0 – 50.0%) and eosinophils (0.0 – 5.0%) (Jenkins, 1993;
Hillyer,1994).Madubuike and Ekenyem (2006) indicated that there is evidence in literature that
haematological characteristics of livestock suggest their physiological disposition to the plane of
nutrition.It may then be suggested that, the different diets imposed on the rabbits were balanced
in their formulation to support relatively high performance and maintain the normal
haematological profile of the rabbits. The values of haemoglobin (14.26 – 15.95g/dl), packed cell
volume (43.30 – 46.77%), red blood cell (7.35 – 7.90 × 10⁶/µl)and white blood cell (8.20 – 8.90
× 103/dl)reported in this study (Table37.0) were generally higher when compared to
haemoglobin (5.53 – 10.20g/dl), packed cell volume (19.60 – 46.50%), red blood cell (5.30 –
6.23 × 10⁶/µl ) and white blood cell (5.00 – 7.30 ×10
3/dl) values reported by other researchers in
the tropics (Ahamefule et al., 2006; Yakubu et al., 2008; Ahamefule et al., 2008).
There were no significant (p>0.05) differences in the averages for the various biochemical
components studied, and this suggeststhat the diets did not influence the biochemical
components studied. However, there was a trend towards a reduction in the cholesterol level as
the inclusion level of MOLM in the diets was increased from T0(0%MOLM) to T4
(20%MOLM). This observation agreeswith the results of a research by Ghasi et al. (1999) where
they reported that juice extracted from moringa leaves was found to be a potent
hypocholesterolemic agent. In their research using Wister rat, they concluded that even when
moringa juice extract was given at the relatively low dose of 1mg/g, co-administered with a high

83
fat diet daily over a period of 30 days, cholesterol was reduced in serum. This reduction in serum
cholesterol level of rabbits fed theMOLMdiets may suggest a general decline in lipid
mobilization. It could be that MOLM has some indirect inhibitory effects exerted at the levels of
HMG-COA reductase, a key enzyme in cholesterol biosynthesis. It may be suggested then that,
moringa leaf meal diets were capable of reducing serum cholesterol, hence assisting in the
reduction and deposition of cholesterol in the muscles.
This fall in serum cholesterol level of rabbits on MOLM diets suggest that MOLM could be used
to produce animal products with reduced cholesterol content.The reduction in the cholesterol
level of rabbits fed MOLM diets is in agreement with earlier findings (Upadhyay, 1990;
Oforjindu, 2006) which indicated that neem leaf meal in the diets of broiler birds and rats
resulted in a decrease in the cholesterol and liver lipid levels. Although the values for total
protein, albumin and globulin did not show any trend, the values obtained and that of cholesterol
were found to be within the normal physiological range for rabbits; total protein (5.4 – 7.5 g/dl),
albumin (2.5 – 4.5 g/dl), globulin (1.9 – 3.5 g/dl) and cholesterol (35.0 – 60.0 mg/dl) (Jenkins,
1993; Hillyer, 1994). The biochemical values of total protein (5.10 – 6.90 g/dl), globulin (1.90 –
2.80 g/dl) and albumin (3.20 – 4.10 g/dl) reported in this study (Table37.0) were generally higher
while cholesterol level (35.02 – 40.70 mg/dl) were lower than cholesterol (56.50 – 174.60 mg/dl)
reported (Ogbuewu et al., 2008; Ahamefule et al., 2008) in other tropical areas. The generally
higher biochemical values in this study could be due to the high nutritional value of the moringa.

84
CHAPTER SIX
6.0 CONCLUSIONS AND RECOMMENDATION
6.1 Conclusions
The present experiment has shown that:
Moringa plants are fast-growing and produce high biomass within a short time period
when cultivated. A yield of 616.40 kg/ha dry matter (DM) could be obtained at first cut using a
planting distance of 1.30 m × 1.30 m.
Moringa leaf meal (MOLM) could be used to improve daily weight gain, and dry matter
(DM) and crude protein (CP) digestibility of rabbits.
Moringa leaf meal (MOLM) diets produced similar economic benefits as soya bean meal
(SBM) diet.
Moringa leaf meal (MOLM) is non-toxic to rabbits at least at the 20% diet inclusionlevel.
Moringa leaf meal (MOLM) has the potential to reduce cholesterol level in blood and the
meat of rabbits.
Moringa leaf meal (MOLM) has the potential to produce leaner carcass due to reduced fat
deposition in the muscles of rabbits.
Moringa leaf meal (MOLM)could be used to replace soyabean meal (SBM) partially or
completely in rabbit diets as a non-conventional protein source, not withstanding the present
high costof themoringa leaf meal.
6.2 Recommendation
Research to support improved production techniques of the moringa plant is, however, needed to
enable farmers produce the meal at lower cost for economic use in animal feeding.

85
REFERENCES
Aba-Adulugba, F. and Joshua, R.A. (1990). Haematological studies in apparently normal five
indigenous breeds of goats in Nigeria. Bull. Anim. Hlth. Prod., 38:59-64.
Abdel – Salem, F. E., El – Abdady, M. R., Aboul – Seoud, A. A., Omar, E. M. and Khafagi, S.
Z. I. (1972). Effect of Dietary Crude Protein Levels on Growing Rabbits. Agric. Res. Rev., 50:
129 – 149.
Abdella, H. M., Shalash, S. M. M., Boulos, N. Z. and Selim, A. B. (1988). Effect on Growing
Rabbits of Feeding Different Levels of Crude Protein. Journal of Applied Rabbit Research,
11(5):252 – 254.
Abu, O.A., Rabo, J.S., Onifade, A.A. and Danny, C.B. (1988). Blood composition and
histological changes in the gastro-intestinal tract of rabbits fed untreated rice husk based diets.
Proceedings of annual Conference of Nigerian Society for Animal Production, 23:144-147.
Adeneye, A. A., Ajagbonna, O.P., Adeleke, T.I. and Bello, S.O. (2006). Preliminary toxicity and
phytochemical studies of the stem bark aqueous extract of Musanga cecropiodes in rats. Journal
of Ethnopharmacology, 105: 374-379.
Aduku, A. O., Dim, N. I., Aganga, A. A. (1988). Note on Comparative Evaluation of Palm
Kernel Meal, Peanut Meal and Sun Flower Meal in Diets for Weanling Rabbits. J. Appli Rabbit
Res.,11 (5):264 – 265.
Ahamefule, F.O, Eduok, G.O., Usman, A., Amaefule, K.U., Obua, B.E. and Oguike, S.A. (2006).
Blood Biochemistry and Hematology of weaner Rabbits Fed Sundried, Ensiled and Fermented
cassava Peel based diets. Pakistan Journal of Nutrition, 5(3):248-253.
Ahamefule, F.O., Obua, B.E., Ukweni, I.A., Oguike, M.A and Amaka, R.A. (2008).
Haematological and biochemical profile of weaner rabbits fed raw or processed pigeon pea seed
meal based diets. African Journal of Agricultural Research,3(4):315-319.
Ajagbonna O. P., Onifade, K. I. and Suleman, U. (1999). Haemotological and biochemical
changes in rats given extracts of Calotropis procera sokoto. J. Vet. Sci., 1:36-42.
Akinbamijo, O.O., Adedioran, S.A., Nouala, S. and Saecker, J. (2001). Moringa fodder in
ruminant nutrition in The Gambia. Moringa News. http://www.moringanews.org. Accessed on 02/
03/ 2009.
Akinmutimi, A. H. (2004). Evaluation of sword bean (Canavalia gladiata) as an alternative feed
resource for broiler chickens. Ph.D. Thesis, Department of Non-ruminant Animal Production,
Michael Okpara University of Agriculture, Umudike, Nigeria.

86
Akinola, A.O. andAbiola, S.S. (1991). Blood chemistry and carcass yield of cockerels fed melon
husk diets. Trop. J. Anim. Sci., 2:39-44.
Amata, I. A. and Bratte,L. (2008). The Effect of Partial Replacement of Soybean Meal with
Gliricidia leaf meal on the performance and Organ weights of weaner rabbits in the tropics.
Asian Journal of Animal and veterinary Advances, 3: 169-173.
AOAC (1990). Association of Official Analytical Chemists, Official methods of Analysis. 15th
edition, Washington, D. C.
Awosanya, B., Joseph, J.K., Apata, D.F. andAyoola, M.A. (1999). Performance, blood
chemistry and carcass quality attributes of rabbits. Int. Trop J. Anim. Sci., 2:89-96.
Ayers, A.C., Barrett, R.P. and Cheeke P.R. (1996). Feeding value of tree leaves (Hybrid Poplar
and black locust) evaluated with sheep, goats and rabbits. Animal Feed Science Technology, 57:
51-52
Baker, F.S. and Silverton, R.E. (1982). Introduction to Medical Laboratory Technology, 5th
edn.
Butterworth S.C., London, pp 481-494.
Bamikole, M.A., Ikhatua, M.I., Ikhatua, U.J. and Ezenwa, I.V. (2005). Nutritive Value of
Mulberry (Morus spp) leaves ingrowing rabbits in Nigeria. Pakistan Journal of Nutrition, 4(4):
231-236.
Barnes, A.R and Amega, W.K. (1984). Utilization of cocoa pod husk meal by growing-finishing
pigs. Proc. 9th
International cocoa Research Conference, Lome, Togo, pp 449-454.
Becker K. and Makkar, H.P.S. (1999). Effects of dietary tannic acid and quebracho tannin on
growth performance and metabolic rates of common carp. Aquaculture, 175:327-335.
Bell, G.H., Enslie-Smith, D. and Patterson, C. R. (1992). Textbook of Physiological
biochemistry. Churchill Livingstone, Edinburgh, pp229-230.
Bennett, R.N., Mellon, F.A., Foidl, N., Pratt, J.H., DuPont, M.S., Perkins, L. and Kroon, P.A.
(2003). Profiling glucosinolates and phenolics in vegetative and reproductive tissues of the
multi-purpose trees Moringa oleifera L. (Horseradish tree) and Moringa stenopetala L. Journal
of Agriculture and Food Chemistry, 51: 3546-3553.
Bentrick, S.(1974). Haematology, Textbook of Veterinary Pathology. Williams and Co.,
Baltimore, pp 217-224.
Berger, M.R., Habs, M., Jahn, S.A. and Schmahl, S. (1984). Toxicological assessment of seeds
from Moringa oleifera and Moringa stenopetala, two highly efficient primary coagulants for
domestic water treatment of tropical raw waters. East African Medical Journal, 61: 712-716.

87
Bhatt, R.S. and Sharma S.R. (2001). Nutrient utilization and growth performance of broiler
rabbit fed oat plant meal and tall fescue hay. Asian-Australasian Journal of Animal Science, 14:
1228-1232.
Biomasa (1996). International Report, UNI Managua.
Biya, A.J., Kannan, A., Murugan, M., and Anil, K.S. (2008). Effect of different feeding systems
on the carcass characteristics of New Zealand White rabbit. Dept. of Livestock Production Mgt.,
College of Veterinary and Animal Sciences, Mannuthy, Thrissur, Kerala.
Blas, E., Cervera, C. and Carmona, J.F. (1994). Effect of two diets with varied starch and fiber
levels on the performance of 4-7 weeks old rabbits. World Rabbit Science, 2: 117-121.
Bone, F. J. (1979).Anatomy and Physiology of Farm Animals.Printice–Hall, Inc., New Jersey,
U.S.A.
Booth, F.E.M. and Wickens, G.E. (1988). Non-timber uses of selected arid zone trees and shrubs
in Africa. FAO conservation guide, Rome, pp 92-101.
Bosh, C.H. (2004). USDA National Nutrient Database for standard reference. In: Grubben,
G.J.H. and Denton, O.A. (eds). PROTOA Foundation, Wageningen Netherlands/CTA,
Wageningen, Netherlands,pp 392- 393.
Brooks, D. (1997). Nutrition and gastrointestinal physiology. In: Hillyer, E.V. and Quesenberry,
K.E (ed). Ferrets, rabbits and rodents – clinical medicine and surgery. Sanders’ W.B. Company,
Philadelphia.
C.S.I.R. (1962). The wealth of India. A dictionary of Indian raw materials and industrial
products. Raw materials, volume 6: L-M, New Delhi, CSIR, India.
Carabano, R. and Piquer, J. (1998). The digestive system of the rabbit. In: De Blas, C. and
Wiseman, J. (eds). The nutrition of the rabbit. CABI publishing, London.
Carregal, R. D. and Nikuma, S. (1983). Crude Protein Levels in Diets for Growing Rabbits. Nutr.
Abst., and Rev. Series, 1353: 246 - 248.
Cheeke, P. R. (1987). Rabbit Feeding and Nutrition. Academic Press, Washington D.C., USA.
Cheeke, P. R. and Patton,N.M. (1987). Rabbit Production and Research in the People’s Republic
of China. J. Appl. Rabbit Res., 10: 68-75.
Cheeke, P.R. (1976). Nutritional and Physiological Properties of Saponins. Nutr. Rep.
Int.,13:315-324.
Cheeke, P.R. (1994). Nutrition and nutritional diseases. In: Manning, P.J., Ringler, D.H. and
Newcomer, C.E. (ed), The biology of the laboratory rabbit, 2nd
ed.Academic Press, New York.

88
Coles, E.H. (1986). Veterinary clinical pathology, 4th
Ed. Coles, E. H. (ed), W.B. Saunders
Company, Philadelphia, USA.
Davice, J.U., and Lewis, S.M.(1991). Practical haematology, 8th
Edition. Longman Ltd., London,
U.K.,pp 22-28.
Daxenbichler, M.E., Spencer, G.F., Calson, D.G., Rose, G.B., Brinker, A.M and Powell, R.G.
(1991). Glucosinolate composition of seeds from 297 species of wild plants. Phytochemistry, 30:
2623-2638.
De Blas, C., Garcia, J. and Carabano, R. (1999). Role of fibre in rabbit diets. A review. Ann
Zootech, 48: 3-9.
De Blas, J.C. (1981). Effect of diet on feed intake and growth of rabbits from weaning to
slaughter of different ages and weights. Journal of Animal Science, 52: 1225 -1231.
Delgado, C., Rosegrant, S., Steinfeld, H., Ehui, S. and Courbois, C. (1999). Livestock to 2020.
The next food revolution. Food, agriculture and the environmental discussion paper 28,
International Food Policy Research Institute, Washington DC.
Dellman, H. and Brown, E. (1976). Textbook on Veterinary Histology. LEA and Febilger,
Philadelphia, pp 88-96.
Duke,A.J.(1998). Moringaceae. Handbook of energy crops. Available:
Http://www/hort.purdue/edu./newcrop/duke_energy/moringa. htm.Accessed on 04/05/2008
Duke, H.H.(1975). Duke’s physiology of Domestic Animals, 8th
edn. Comstock Publishing
Associates, a division of Cornell University Press,New York, U.S.A. pp 33.
Duke, J.A. (1983). Ipomoea batatas. Handbook of Energy Crops
Unpublished.http://www.hort.purdue.edu/newcrop/default.htm.Accessed on 04/05/2008
Eggum, B. O., (1970). Blood urea measurement as a technique for assessing protein quality. Br.
J. Nutrition, 24: 983-988.
Elemele, H.O., Rao,D.R. andChawan, C.B. (1980). Evaluation of rabbit excreta as an ingredient
in broiler diets. Br. Poult. Sci., 21:345-349.
Eshiet, N.O., Omole, T.A. and Ademosun, A.M. (1979). The effect of feeding cassava root meal
on the performance of fryer rabbits. Ife Journal of Agriculture, 2:2-6.
Esonu, B.O., Emenelom, O.O., Udedibie, A.B.I., Herbert, U., Ekpor, C.F., Okoli, I.C. and
Iheukwumere, F.C. (2001). Performance and blood chemistry of weaner pigs fed raw Mucuna
(Velvet bean) meal. Trop. Anim. Prod. Invest, 4:49-54.

89
Estrella, M.C.P., Mantaring, J.B.V. and David, G.Z. (2000). A double blind, randomized
controlled trial on the use of malunggay (Moringa oleifera) for augmentation of the volume of
breast milk among non-nursing mothers of preterm infant. The Philippine Journal of Pediatric,
49: 3-6.
Eustace, A., Iyayi, O., Oluwakemi, O. and Odueso, M. (2003). Response of some metabolic and
biochemical indices in rabbitsfed varying levels of dietary cyanide. African Journal of
Biomedical Research, 6(1): 43-47.
Fahey, J.W., Zakmann, A.T. and Talalay, P. (2001). The chemical diversity and distribution of
glucosinolates and isothiocyanates among plants. [Corrigendum: phytochemistry,(59): 200- 237].
Famounyan, R.T. and Meffega,F. (1986). Cassava by – products in Rabbit and Sheep Diets.
Proceedings of Workshop held at Ryall’s Hotel, Blantyre, Malawi.
Farinu, G.O., Ojebiyi, O.O., Akinlade, J.A., Ajibola, H.O.and Olaniyonu,B.I. (2008). Evaluation
of thenutritive potential of pigeon pea (Cajanus cajan) grain and leaf meals on growth
performance of pre-pubertal rabbits. Bowen Journal of Agriculture, 5: 102-108.
Fasuyi, A.O. and Aletor, V.A. (2005). Varietal composition and functional properties of cassava
leaf meal and leaf protein concentrates. Pak. J. Nutri., 4 : 43 – 49.
Femandez – Carmona, J., Cervera,C. and Blas, E. (1996). High fat diets for rabbit breeding does
housed at 300C – Proc. 6
th World Rabbit Cong., Vol. 1: 167 (July 9 – 12), Toulouse, France.
Fielding, D. (1991). Rabbits:In Tropical Agricultural Series C.T.A. / Macmillan Education
Ltd.London,pp 39-50.
Foidl, N., Makkar, H.P.S. and Becker, K. (2001). The potential of Moringa Oleifera for
agricultural and industrial uses. In: Fugile, L.J. (ed). The miracle tree: the multiple attributes of
Moringa.CTA. Publication. Wageningen, The Netherlands, pp 45-76.
Forbes, J.M. (1995). Voluntary Food Intake and Diet Selection in Farm Animals. CAB
International, Wallingford, U.K., pp. 7-8.
Frandson, R.D. (1986). Anatomy and Physiology of FarmAnimals, 4th
Edition. Lea and Febilger.
Pennsylvania, USA.,pp 240-242.
Fuglie, L. (1999). Producing food without pesticides: local solution to crop pest control in West
Africa. CTA., Wageningen, The Netherlands.
Fuglie, L.J. (2001). Natural Nutrition for the Tropics. In: Fubalie, L.J. (ed). The Miracle Tree:
The Multiple Attributes of Moringa. CTA Publication,Wageningen, The Netherlands, pp 103-
115.

90
Fuglie, L.J. (2005). The Moringa tree: a local solution to malnutrition? Church World Service,
Senegal.
Garg,S.K.,Makkar, H.P.S., Nagpal., K.B, Sharma, S.K., Wadhwa, D. R. and Singh, B. (1982).
Toxicological investigation into oak leaf poisoning in cattle. Vet. and Human Toxicology, 34:
161-164.
GassenSchmidt, U., Jany, K.D., Tauscher, B. and Niebergall, H. (1995). Isolation and
characterization of a flocculating protein from Moringa oleifera Lam. Biochimica Biophysica
Acta, 1243: 477-481.
Genstat (2005). Genstat User’s Guide (Release 4.24). Lawes Agricultural Trust, Rothamsted
Experimental Station, UK.
Ghasi, S., Nwobodo, E. and Ofili, J.O. (1999). Hypocholesterolemic effects of crude extract of
leaf of moringa oleifera Lam in high-fat diet fed Wister rats. Journal of Ethnopharmacology, 69:
21-25.
Gidenne, T. (1992).Effect of fibre level, particle size and adaptation period on digestibility and
rate of passage as measured at the ileum and in the faeces in the adult rabbit. Br. J. Nutr., 67:133.
Gidenne, T. and Jehl, N. (2000). Caecal microbial activity of young rabbit. Incidence of a fibre
deficiency and of feed intake. In: Blasco, A. (ed). 7th
World rabbit congress. C, Universidad
politecnica de Valencia, Valencia, Spain, pp. 233-239.
Gidenne, T. and Perez, J.M. (1994). Apports de lignines et alimentation du lapin en croissance.
1. Consèquences sur la digestion et le transit. Ann, zootech., 43:313-321.
Gidenne, T. and Perez, J.M. (1996). Apoort de cellulose dans l’alimentation du lapin en
croissance. 1. Consèquences sur les performances et la mortalitè. Ann zootech., 45:299-324.
Gidenne, T.R., Carabana, R., Garcia, J., and De Blas, C. (1998). 5- Fibre digestions. In: De Blas,
C. and Wiseman, J. (ed). The nutrition of rabbit. CABI publishing, London, pp 69.
Gillespie, J.R. (1998). Animal Science. Delmar Publishers, Washington, USA.
Glinsky, M.J., Smith, R. M., Spires, H. R. and Davis, G. L. (1976). Measurement of Volatile
Fatty Acid Production Rate in the Caecum of Pony. J. Anim. Sci, 42: 1465 – 1470.
Grubben, G.J.H. and Denton, O.A. (2004). Plant Resources of Tropical Africa 2. Vegetables.
PROTA Foundation, Wageningen, Netherlands/ Backhuys Publishers, Leiden, Netherlands/
CTA, Wageningen, Netherlands.

91
Guèye, E.F. and Branckaert, R.D.S. (2002). FAO’s programme for support to family poultry
production. Proccedings of a workshop on poultry as a tool in poverty eradication and promotion
of gender equality. Animal Production and Health Division, FAO, Rome, Italy.
Gupta, K., Barat, G.K., Wagle, D.S. and Chawla, H.K.L. (1989). Nutrient contents and anti-
nutritional factors in conventional and non-conventional leafy vegetables. Food chemistry, 31:
105-116.
Ha. L.T.T., Suc, N.Q., Binh D.V., Bien, L.T. and Preston T.R. (1996). Replacing concentrates
with molasses blocks and protein-rich tree leaves for reproduction and growth of rabbit.
Livestock research for rural development, 8.
Hale, O.M. and McCormick, W.C. (1981). Value of peanut skins testa as a feed ingredient for
growing-finishing swine. J.Anim. Sci., 53 : 1006-1010.
Harper, H.A. (1973). Review of Physiological Chemistry, 14th
edition. Lange medical
publications, California.
Hasanat, M.S., Hossain, M.E., Mostari, M.P. and Hossain, M.A. (2006). Effect of concentrate
supplementation on growth and reproductive performance of rabbit under rural condition.
Bang.J.Vet.Med., 4(2):129-132.
Hillyer, E.V.(1994).Rabbits.Small Anim Pract., 24:25-65.
Hintz, H. F., Schryer, H. F.and Steven, C. E., (1978). Digestion and Absorption in the Hindgut of
Non – Ruminants Herbivores, J. Anim. Sci., 46: 1803 – 1807.
Hoover, W. H. and Heitman, R. N. (1972). Effects of Dietry Fibre Levels on Weight Gain,
Caecal Volume and Volatile Fatty Acid Production in Rabbits. J. Nutr., 102: 375-398.
Iheukwumere, F.C. and Okoli, I.C.(2002). Preliminary studies on raw Napoleana Imperialis as
feed ingredient . 1: Performance and blood chemistry of weaner rabbits. Trop. Anim. Prod.,5:
100-110.
Iheukwumere, F.C.,Ndubuisi, E.C., Mazi,E.A. and Onyekwere,M.U. (2007). Growth, Blood
Chemistry and Carcass yield of Broilers Fed Cassava leaf meal (Manihot esculenta Crantz).
International Journal of Poultry Science, 6 (8): 555-559.
Iraqi, M.M. (2003). Estimation and evaluation of genetic parameters for body weight traits of
New Zealand white rabbit in Egypt using different multivariate animal models. Livestock
Research for rural development 15.www.Irrd.org/Irr20/5/iraq180083.htm Accessed on
04/03/2009.
Ismael, A.M.(1992). Hypervitaminosis A in rabbits. J. Appl. Rabbit Res., 15: 1196-1197.

92
Iyayi, E.A. and Tewe, O.O. (1998). Serum total protein, urea and creatinine levels as indices of
quality of cassava diets for pigs. Trop. Vet., 16:59-67.
Iyeghe-Erakpotobor, G.T, Aliyu, R. and Uguru, J. (2005). Evaluation of concentrate, grass and
legume combinations on performance and nutrient digestibility of grower rabbits under tropical
conditions. African Journal of Biotechnology, 4 (20): 2004-2008.
Iyeghe-Erakpotobor, G.T., Osuhor, C.U. and Olugbemi, T.S. (2006). Performance and
digestibility of weaner rabbits fed graded levels of soybean cheese waste / maize offal diet and
brachiaria grass hay. African Journal of biotechnology, 5(17): 1579-1583.
Jacobs, L. (1986). Environmentally Sound Small-Scale Livestock Projects. VITA Publication
Services, Arlinghton, USA.
Jarvis, C. (1976). The Evolutionary Strategy of Equidae and The Origin of Rumen and Caecal
Digestion. Evolution, 30:757 – 774.
Jenkins, J.R. (1993). Rabbits.In: Jenkins, J.R.and Brown, S.A.(ed.) Practioner’s Guide to Rabbits
and Ferrets. American Animal Hospital Association, Lake wood, U.S.A.,pp 1-42.
Jenkins, J.R. (1999). Feeding recommendations for the house rabbit. Veterinary clinics of North
America: Exotic Animal practice, VOL. 2, Saunders W.B. Company, Philadelphia, pp143.
Kellems, R.O. and Church, D.C. (2006). Livestock Feeds and feeding, 5th
ed. Pearson Education
Inc., New Jersey, U.S.A.
Kristin, D. (2000). The moringa tree. Echo technical note. Florida, U.S.A.
Kronfield, O.W. and Mediway, N.C. (1975). Blood Chemistry In: Prier, J. E., and Wilkinson,
J.S. (eds.). Textbook of Veterinary Clinical Pathology. Williams and Williams Co., Baltimore,
USA.,pp: 81-96.
Kumar, R. and Singh, B. (1984). Antinutritional adverse role in ruminant nutrition. J. Agric.
Food Chem, 32:447-453.
Lassister, J.W. and Hardy, M. E. Jr. (1982). Animal Nutrition. Reston Publishing Company Inc.,
Virginia.
Lebas, F. (1983). Small-scale rabbit production, feeding and management system. World animal
review, 46: 11-17.
Lebas, F. (1989). Besoins nutritionnels des lapins. Cuni-sciences, 5:1-4.
Lebas, F. and Matheron, G. (1982).Rabbits.Livest. Prod. Sci.,7: 235 – 250.

93
Lebas, F. and Jouglar J.Y. (1990). Influence du taux de phosphore alimentaire sur les
performances de lapins reproductrices. 5 èmes J. Rech. Cunicole, ITAVI, (ed.), 12-13 Dec,
commun. 48, Paris.
Lebas, F., Coudert, P., Rouvier, R. and Rochambeau, H. D. (1986). The Rabbit husbandry, health
and production, AHPP Series No 21, FAO, Italy.
Lebas, F., Giddene, T., Perez, J.M. and Licois, D. (1998). Nutrition and pathology. In: De Blas
C. and Wiseman, J. (eds), The nutrition of the rabbit. CABI publishing. Wallingford, U.K.
Lindsay, D.B. (1977). The effect of feeding patterns and sampling on blood parameters.
Occasional Publication Lister (Ed.). No. 1. Br. Soc. Anim. Prod., pp:99-120.
Lukefahr, S.D. and Cheeke, P.K. (1991). Rabbit project development strategies in subsistence
farming systems through research applications. World animal review, 69: 26-35.
Madubike, F.N. and Ekenyem, B.U. (2006). Haematology and Serum Biochemistry
Characteristics of Broiler Chicks fed varying Dietary Levels of Ipomoea Asarifolia leaf meal.
Int. J.Poult. Sci., 5:9-12.
Maertens, L. (1988). Fats in rabbit nutrition: A review. World Rabbit Science, 6 (3 – 4): 341-
343.
Maertens, L. (1992). Rabbit nutrition and feeding: A review of some recent developments. J.
Appl. Rabbit Res., 15: 889-890.
Maertens, L., Luzi, F. and De Groote,G. (1997). Effect of dietary protein and amino acids on the
performance, carcass composition and N-excretion of growing rabbits. Ann-Zootech., 46:255-
261.
Makkar, H.P.S and Becker,K. (1988). Moringa oleifera seed meal and proteins on rumen
fermentation in vitro. Annual report. Institute for Animal Production in the Tropics and
Subtropics, University of Hohenheim, Stuttgart. Germany.
Makkar, H.P.S. and Becker, K. (1996). Nutritional value and anti-nutritional components of
whole and ethanol extracted Moringe oleifera leaves. Animal feed science and technology, 63:
211-228.
Makker,H.P.S and Becker,K. (1997). Nutrients and anti quality factors in different
morphological parts of the Moringa oleiferatree. Journal of Agric. Sci. (Cambridge), 128:311-
322.
Mamattah, N. (1978) Sociological aspects of introducing rabbits into farm practices. In: Proc.
Workshop on Rabbit Husbandry in Africa, Morogoro, Tanzania, Stockholm, Sweden. IFS, pp.
93-99.

94
Marks, H.L. (1990). Genotype by diet interactions in body and abdominal fat weight in broilers.
Poultry Sci., 69: 879 – 886.
Martina, C. and Damianan, F. (1983) Supplementation of Diets Low in Protein with Lysine and
Methionine for Fattening Young Rabbits.Animal Review series,53(4391).
McDonald, P., Edwards, R.A. and Greenhalgh, J.F.D. (1988). Animal Nutrition, 4th
edition.John
Wiley and Sons,Inc., New York,USA.,pp. 398- 418.
McNitt, J.I., Cheeke, P.R., Patton, N.M. and Lukefahr, S.D. (1996). Rabbit production. Interstate
publishers Inc., Danville, IL.
Mekonnen, Y. and Dräger, B. (2003). Glucosinolates in Moringa stenopetala. Planta medica, 69:
380-382.
Mikled, C. (2005). The integration of small ruminants and the agricultural systems in the royal
project foundation area. In: Ledin, I. (ed), Proceedings from small ruminant research and
development workshop: March 2-4, 2004, Hanoi. Agricultural publishing house, Ho Chi Minh
City, Vietnam, pp. 131-133.
Milon, A. (1996). Weaned rabbit colibacillosis: A model for study of enteropathogenic
Escherichia coli (APEC). Proc. 6th
World Rabbit cong., Vol. 3: 13, Toulouse, France.
Mohammed, K.I. (1989). Studies on some production traits in rabbits under the environmental
conditions on El-Minia Governorate. MSc. Thesis, Faculty of Agriculture, El-Minia University,
Egypt.
Müller, Z. (1977). Improving the quality of cassava root and leaf product technology. In: Nestel,
B. and Graham, M. (eds.). Proceedings, cassava as Animal Feed Workshop. 18-20 April,
1977.University of Guelph, Ontario, Canada. IDRC: Ottawa.
Muriu, J.I., Njoka-Njiri, E.N., Tuitoek, J.N. and Nanua, J.N. (2002). Evaluation of sorghum
(Sorghum bicolor) as replacement of maize in the diet of growing rabbit (Oryctolagus
cuniculus). Asian-Australisian Journal of animal science, 15: 565-569.
N.R.C. (1994). Nutrient Requirements of Domestic Animals. Nutrient Requirements of Poultry.
9th
Revised Edition. National Academy Press, Washington DC.
Nair, A.G.R. and Subramanian, S.S. (1962). Pigments of the Flowers of Moringa
Pterygosperma. Current Science, 31: 155-156.
Nityanand, P. (1997). Textbook of Feed Processing Technology. Vikas Publishing House PVT
Ltd., New Delhi, India.

95
Noblet, J. and Henry,Y. (1977). Consequences d’une reduction du taux de matieres azotees sur le
niveau de consummation et les performances de croissance chez le pore selon l’equilibre en
acides amines et la concentration.En energie de regime. Ann. Zootech., 26:379-381.
North, O.M. and Bell, D.D. (1990). Commercial Chicken Production Manual, 4th
Edition. Van
Nostrand, Reindhold, New York, pp. 582-620.
Nworgu, F.C., Egbunike, G.N., Abu, O.A., Fapohunda, J.B. and Omole, A.J. (1999). Effects of
concentrate and leaf meals on the performance of rabbits. In: Ologhobo, A.D., Egbunke, G.N.,
Adewumi, M.K., Bamgbose, A.M., Iyayi, E.A. and Adesehinwa, A.O.K. (eds.)Sustainability of
the Nigerian Livestock Industry in 2000AD. Proc. 4th
Ann. Conf. Anim. Sci.Association of
Nigeria (ASAN), IITA conference center, Ibadan, Nigeria, September 14-16, 1999. pp 150-153.
Odeyinka, S. M., Oyedele, O. J., Adeleke, T.O. and Odedire, J. A. (2008). Reproductive
performance of rabbits fed moringa oleifera as a replacement for Centrosema pubescens. In: 9th
World Rabbit Congress – June 10 – 13, 2008, Verona, Italy.
Odunsi, A.A. (2003). Assessment of Lablab (Lablab purpureus) leaf meal as a feed ingredient
and yolk colouring agent in the diet of layers. International Journal of Poultry Science, 2(1): 71-
74.
Odunsi, A.A., Ogunleke, M.O., Alagbe,O.S. and Ajani,T.O. (2002). Effect of feeding Gliricidia
sepium leaf meal on the performance and egg quality of layers. Int. J. Poult. Sci., 1:26-29.
Oduro, I., Ellis, W.O. and Owusu, D. (2008). Nutritional potential of two leafy vegetables:
Moringa Oleifera and Impomea batatas leaves. Scientific research and essay, 3(2): 57-60.
Oduye, O.O. and Adadevoh, B.K. (1976). Biochemical values of apparently normal Nigerian
sheep. Nig. Vet.J., 5(1): 43-50.
Oforjindu, O. (2006). The toxicity of graded levels of Neem (Azadirachta indica) leaf meal.
B.Agric Tech. Project Report, Federal University of Technology, Owerri.
Ogbuewu, I.P., Okoli, I.C. and Lioeje, M.U. (2008). Serum Biochemical Evaluation and Organ
Weight Characteristics of Buck Rabbits Fed Graded Levels of Neem (Azadirachta Indica) Leaf
Meals Diets. http://neem rabbits.htm.Accessed on 08/06/2009.
Okai, D.B., Easter, R.A. and Frank, G.R. (1984). The nutritive value of some non-conventional
Ghanaian feed ingredients: Nutrient composition and effects on performance of weaning rats.
Wld. Rev. Anim. Prod, 20:11-16.
Okerman, L. (1994). Diseases of Domestic Rabbits, 2nd
ed. Blackwell Scientific Publications,
Oxford.

96
Okorie, K.C. (2003). The Effect of palmitic acidfortified maize wet milling by-product on the
performance of weaner rabbits. Czech. J. Anim Sci, 48(9): 365-370.
Ologhobo, A.D., Apata, D.F., Oyegide, A., Akinpelu, R. O. (1992). Toxicity of raw lima beans
(Phaseolus lunatus) and lima bean fractions for growing chicks. Brit. Poultry. Sci., 34:505-522.
Olsen, A. (1987). Low technology water purification by bentonite clay and Moringa oleifera
seed flocculation as performed in Sudanese villages. Effect on Schistosoma mansoni cercariae.
Water Research, 21(5): 517-820.
Omole, T.A. and Sonaiya, E.B. (1981). The effect of protein source and methionine
supplementation of cassava peel meal utilization by growing rabbits. Nutrition Reports
International, 23 (4): 729-737.
Omole, T.A. andOnwudike,O.C. (1982). Effect of palm oil on the use of cassava peel meal by
rabbits. Tropical Agriculture. Ibadan, Nigeria.
Onyeyilli, P.A., Egwu, G.O., Jiike, G.I., Pepple,D.O. and Ohaegbulem, J.O. (1992). Seasonal
variation on haematological indices in the grey-breasted Guinea fowls. Nig. J. Anim. Prod., 18:
101-107.
Owen, J.E. (1981). Rabbit meat for the developing countries. Wld. Anim. Rev., 39:2-11.
Oyawoye, E.O. and Ogunkunle, M. (1998). Physiological and biochemical effects of raw jack
beans on broilers. Proceedings of annual Conference of Nigerian Society of Animal Production,
23: 141-142.
Parigi-Bini, R. andXiccato,G. (1998). Energy metabolism and requirements. In: De Blas,C. and
Wiseman,J.(eds). The nutrition of the rabbit. CABI Publishing, U.K.,pp103.
Parker, D. S. (1976). The Measurement of Production Rates of Volatile Fatty Acids in Caecum
of the Rabbit. Br. J. of Nutr., 36:61-66.
Parkhurst, R.C. and Mountney, J.G. (1988). Poultry meat and egg production. Van Nostrand,
Reindhold, New York, pp. 110-118.
Partridge, G.G. (1989). Nutrition of farmed rabbits. Proceedings of the Nutrition
Society,London, U.K., 48: 93-101.
Perez, J.M. (1996). Apoorts de cellulose dans l’alimentation du lapin en croissance. 11.
Consequences sur les performances et la mortalité. Ann zootech., 45:299-304.
Peters, T., Biomonte, C.T., and Doumas, B.T. (1982). Protein (total protein) in serum, urine and
cerebrospinal fluid, albumin in serum: In selected methods of clinical chemistry, volume 9.

97
Faulkner, W.R., and Meites, S. (eds.).American Association of Clinical Chemists, Washington
D.C.
Pond, W.G., Church, D.C. and Pond, K.R. (1995).Basic Animal Nutrition and Feeding, 4th
edition. John Wiley and Sons Publication, New York, U.S.A., pp. 495-504.
Price, M. L. (1985). The Moringa Tree. ECHO Technical Note (revised 2000 by Kristin
Davis).U.S.A.www.current protocols.com/protocol/mc01g02.Accessed on 12/04/2009.
Ranjhan, S.K. (1999).Animal Nutrition and Feeding Practices, 5th
edition. Vikas Pub. House PVT
Ltd.,New Delhi, India,pp 159-167.
Ranjhan, S.K. (2001). Animal Nutrition in the tropics, 6th
Ed. Vikas Publishing House. PVT Ltd.,
New Delhi,pp. 209, 466.
Rao, D.R., Chen, C.P., Sunki, C.R. and Johnson, N.M. (1987). Effect of weaning on slaughter
ages on rabbit meat production. J. Anim. Sci., 46: 573-577.
Roberts K.M., Daryl, K. G., Peter, A. M., Victor, W. R. (2000). Mayer’s Biochemistry, 25th
edition, McGraw Hill, New York, 25: 763-765.
Ross, E., and Enriquez, F.Q. (1969). The Nutritive Value of Cassava leaf meal. Poultry Science,
48 (3): 846-853.
Ruiz-Feria, C.A., Lukefahr, S.D. andFelker, P. (1998). Evaluation of Leucaena leucocephala and
Cactus (Opuntia sp) as forages for growing rabbits. Livestock research for rural development 10.
http://www.cipav.org.co/lrrd10/2/luke102.htm.Accessed on 20/07/2008
Russel, L.E., Cromwell, G.L. and Stahly, T.S. (1983). Tryptophan, threonine, isoleucine and
methionine supplementationofcorn-soybean meal diet for growing pigs. J. Animal Sci., 56:11-
15.
Sarwatt, S.V., Kapange, S.S. and Kakengi, A.M. (2002). Substituting sunflower seed cake with
Moringa oleiferaleaves as supplemental goat feed in Tanzania. Agro-forestry systems, 56: 241-
247.
Sarwatt, S.V., Milang’ha, M.S., Lekule, F.P. and Madalla, N. (2004). Moringa oleifera and
cotton seed cake as supplements for smallholder dairy cows fed napier grass. Livestock research
for rural development. Vol. 16 Art. # 38. http//www.cipac.org.co//Irrd16/6/sarw16038.htm
Accessed on 01/02/2006
Say, R.R. (1987). Manual of poultry production in the tropics. Centre for Agriculture and
Bioscience International (CABI), U.K., pp. 48-49.

98
Say, R.R. (1995). Manual of poultry production in the tropics,5th
edition. CABI publication,
Wallington, U.K.
Schlolaut, W.(1985). Nutritional Needs and Feed of German Angora Rabbits. J. Appl. Rabbit
Res., 10:111 – 121.
Sicwaten, J.B. and Stahl, D. (1982). A Complete Handbook on Backyard and Commercial
Rabbit Production. (Published by CARE, Philippines). Peace Corps, Information Collection and
Exchange, Office of Program Devpt, Washington D.C., USA.
Siddhuraju, P. and Becker, K. (2003). Antioxidant properties of various solvent extracts of total
phenolic constituents from three different agro-climatic origins of drumstick tree (Moringa
oleifera Lam.) leaves. Journal of agricultural and food chemistry, 51: 2144-2155.
Smith, O.B. (1988). A review of ruminant reponses to cassava based diet. Proc. of
IITA/ILCA/UI W/shop on potential utilization of cassava as livestock feed in Africa, IITA,
Ibadan, pp36-63.
Spreadburg, D. and Davidson, J. (1978).A study of Fibre utilization by the growing New Zealand
White Rabbits. J. Sci. and Food Agric., 29:640 – 648.
Stein, S. and Walshaw, S. (1996). Rabbits. In: Laber-Laird, K., Swindle, M.M. and Flecknell, P.
(ed). Handbook of rodent and rabbit medicine. Pergamon press, England, pp183.
Stevens, C.E. and Hume, I.D. (1995). Comparative physiology of the vertebrate digestive
system, 2nd
ed. Cambridge University press, Cambridge, United Kingdom.
Stewart, M. (1991). Animal Physiology. The Open University, U.S.A., pp: 132-133.
Subadra, S. and Monica, J. (1997). Retention and storage stability of beta carotene in dehydrated
drumstick leaves (Moringa oleifera). International Journal of food science and nutrition, 48(6):
373-379.
Swick, R. A.,Cheeke, P.R. and Patton, N.M. (1978). Evaluation of dried rabbit manure as a feed
for rabbits. Can. J. Anim. Sci., 58: 753-757.
Szendro, Z.S., Szabo, S. and Hullar, I. (1988). Effect of reduction of eating time on production of
growing rabbits. Proc. 4th
world rabbit cong, vol. 3: 104.
Taboada, E., Mendez, J., Mateos, G.G.and De Blas, J.C. (1994). The response of highly
productive rabbits to dietary lysine content. Livestock Prod. Sci., 40:329-332.
Taboada, E., Mendez, J., Mateos, G.G. and De Blas, J.C. (1996). The response of highly
productive rabbits to dietary sulphur amino acid content for reproduction and growth. Repro.
Nutr. Develop., 36:191-196.

99
Tambuwal, F.M., Agaie, B.M. and Bangana, B. (2002). Haematological and biochemical values
of apparently healthy Red Sokoto goats. Proc. 22nd
Ann. Conf. Nig. Soc. Animal Production
(NSAP), March 17-21, 2002. Federal University of Technology, Akure, Nigeria,pp. 50-53.
Taylor, S.C. (1980). Liveweight growth from embryo to adult in domesticated animals. Animal
production, 31: 223-235.
Tisch, D.A. (2006). Animal Feeds, Feeding and Nutrition, and Ration Evaluation.Text with CD-
for windows. Delmar Learning, pp 445.
Trujillo, D., Perez,J.F. and Cebreros, F.J. (1991). Anaerobic digestion of rabbit
wastes.Bioresource Technology, 35:95-98.
Tuah, AK., Oppong-Anane, K. and Owusu-Adduomi, K. (1990). Lambing and neonatal
behaviour of Djallonke × Sahel crossbred. Maternal behaviour. Ghana J. of Agric. Science, 20-
23:111-115.
Upadhyay, C. (1990). The medicinal properties of Neem (Azadirachta indica) tree. In:Ogbuewu,
I.P., Okoli, I.C. and Iloeje, M.U. (eds.) Serum Biochemical Evaluation and organ weight
chararteristics of Buck Rabbits fed graded levels of neem (Azadirachta indica). Animal
Pharmacology, Second edition, Longman, England.
USDA (1963). Composition of foods, raw, processed, prepared. Agric. Handbook 8. ARS,
USDA, Washington D.C.
Vasanthakumar, P., Sharma, K., Sastry, V.R.B. and Kumar, R. (1999). Effect of graded levels of
neem (Azadirachta inidica) seed kernel cake on carcass characteristics of broiler rabbits. Asian-
Australasian Journal of Animal Science, 12: 1246-1250.
Verde, M.T. and Piquer, J. (1986). Effect of stress on the corticosterone and ascorbic acid
(vitamin C) content of the blood plasma of rabbits. J. Appl. Rabbit Res., 9: 181-183.
Wahlstrom, R.C. and Libal,G.W. (1974). Gain, feed efficiency and carcass characteristics of
swine fed supplemental lysine and methionine in corn-soybean meal diets during the growing
and finishing periods. J. Anim. Sci., 38:1261-1270.
Wang, I.Z., McMillian, A.M. and Chambers, J.R. (1991). Genetic correlation among growth,
feed and carcass traits of broiler sire and dam populations. Poultry Sci., 70: 719 – 725.
Win, B. and Jongen, F. (1996). Glucosinolates in brassica: occurrence and significance as
cancer-modulating agents. Proceedings of the Nutrition Society,New Delhi, India, 55: 433-446.

100
Yakubu, A., Adua, M.M. and Adamude, H. (2008). Welfare and haematological indices of
weaner rabbits as affected by stocking density. 9th
World rabbit congress-June 10-13, Verona,
Italy.
Yang, R.Y., Tsou, S.C.S., Lee, T.C., Chang, L.C., Kuo, G. and Lai, P.Y. (2006). Moringa a
novel plant rich in antioxidants bio-available iron and nutrients. American chemical society
symposium series, 925: 224-239.

101
APPENDICES
APPENDIX 1.0: ANOVA FOR WEIGHT GAIN
Source DF Sum of Squares Mean Square F-value P
Model
Error
Total
4
10
14
17.293
9.191
26.484
4.323
0.919
4.70 3.48
APPENDIX 2.0: ANOVA FOR CHOLESTEROL
Source DF Sum of Squares Mean Square F-value P
Model
Error
Total
4
10
14
67.119
146.141
213.260
16.780
14.614
1.15 3.48
APPENDDIX 3.0: ANOVA FOR FEED INTAKE
Source DF Sum of Squares Mean Square F-value P
Model
Error
Total
4
10
14
18.520
55.359
73.879
4.630
5.536
0.84 3.48
APPENDIX 4.0: ANOVA FOR F.C.R.
Source DF Sum of Squares Mean Square F-value P
Model
Error
Total
4
10
14
1.399
0.808
2.207
0.350
0.081
4.32 3.48
APPENDIX 5.0: ANOVA FOR SLAUGHTER WEIGHT
Source DF Sum of Squares Mean Square F-value P
Model
Error
Total
4
10
14
98,528.93
804,110.67
902,639.60
24,632.23
80411.07
0.31 3.48

102
APPENDIX 6.0: ANOVA FOR HOT CARASS WEIGHT
Source DF Sum of Squares Mean Square F-value P
Model
Error
Total
4
10
14
84,065.73
784,674.00
868,739.73
21016.43
78467.40
0.27 3.48
APPENDIX 7.0: ANOVA FOR BLOOD WEIGHT
Source DF Sum of Squares Mean Square F-value P
Model
Error
Total
4
10
14
1,028.26
1,284.67
2,312.93
257.07
128.47
2.00 3.48
APPENDIX 8.0: ANOVA FOR DRESSED WEIGHT
Source DF Sum of Squares Mean Square F-value P
Model
Error
Total
4
10
14
78,946.67
139,810.66
218,757.33
19,736.67
13,981.07
1.41 3.48
APPENDIX 9.0: ANOVA FOR FULL GIT WEIGHT
Source DF Sum of Squares Mean Square F-value P
Model
Error
Total
4
10
14
14,138.26
28,842.67
42,980.93
3,534.57
2,884.27
1.23 3.48
APPENDIX 10.0: ANOVA FOR EMPTY GIT WEIGHT
Source DF Sum of Squares Mean Square F-value P
Model
Error
Total
4
10
14
1,349.06
21,548.67
22,897.73
337.27
2,154.87
0.16 3.48
APPENDIX 11.0: ANOVA FOR LIVER WEIGHT
Source DF Sum of Squares Mean Square F-value P
Model
Error
Total
4
10
14
282.26
310.67
592.93
70.57
31.07
2.27 3.48

103
APPENDIX 12.0: ANOVA FOR AVERAGE TOTAL WEIGHT GAIN
Source DF Sum of Squares Mean Square F-value P
Model
Error
Total
4
10
14
122019.128
111817.204
233836.332
30504.782
11181.720
2.72
3.48
APPENDIX 13.0: ANOVA FOR AVERAGE FINAL WEIGHT
Source DF Sum of Squares Mean Square F-value P
Model
Error
Total
4
10
14
122397.204
222475.884
344873.088
30599.301
22247.588
1.38 3.48
APPENDIX 14.0: ANOVA FOR INITIAL ANIMAL WEIGHT
Source DF Sum of Squares Mean Square F-value P
Model
Error
Total
4
10
14
6.670
45183.330
45190.000
1.6675
4518.333
0.0003 3.48
APPENDIX 15.0: ANOVA FOR LYMPHOCYTES
Source DF Sum of Squares Mean Square F-value P
Model
Error
Total
4
10
14
681.90
1544.44
2226.34
170.480
154.440
1.10 3.48
APPENDIX 16.0: ANOVA FOR HAEMOGLOBIN
Source DF Sum of Squares Mean Square F-value P
Model
Error
Total
4
10
14
1.420
10.610
12.030
0.360
1.060
0.34 3.48
APPENDIX 17.0: ANOVA FOR WHITE BLOOD CELLS
Source DF Sum of Squares Mean Square F-value P
Model
Error
Total
4
10
14
2.230
9.740
11.970
0.560
0.970
0.58 3.48

104
APPENDIX 18.0: ANOVA FOR NEUTROPHILS
Source DF Sum of Squares Mean Square F-value P
Model
Error
Total
4
10
14
165.80
817.28
983.08
41.45
81.73
0.51 3.48
APPENDIX 19.0: ANOVA FOR ALBUMIN
Source DF Sum of Squares Mean Square F-value P
Model
Error
Total
4
10
14
14.960
36.733
51.693
3.740
3.673
1.11 3.48
APPENDIX 20.0; ANOVA FOR EOSINOPHILS
Source DF Sum of Squares Mean Square F-value P
Model
Error
Total
4
10
14
0.0009
0.0028
0.0037
0.00025
0.00028
0.89 3.48
APPENDIX 21.0: ANOVA PACKED CELL VOLUME (PCV)
Source DF Sum of Squares Mean Square F-value P
Model
Error
Total
4
10
14
10.320
86.050
96.37
2.58
8.61
0.30 3.48
APPENDIX 22.0: ANOVA FOR RED BLOOD CELL
Source DF Sum of Squares Mean Square F-value P
Model
Error
Total
4
10
14
0.740
2.270
3.010
0.185
0.227
0.81 3.48
APPENDIX 23.0: ANOVA FOR TOTAL BLOOD PROTEIN
Source DF Sum of Squares Mean Square F-value P
Model
Error
Total
4
10
14
47.640
44.133
91.773
11.910
4.413
2.70 3.48

105
APPENDIX 24.0; ANOVA FOR GLOBULIN
Source DF Sum of Squares Mean Square F-value P
Model
Error
Total
4
10
14
13.907
27.733
41.640
3.477
2.773
1.25 3.48
APPENDIX 25.0: ANOVA FOR MEAT MOISTURE
Source DF Sum of Squares Mean Square F-value P
Model
Error
Total
4
10
14
0.0178
0.1834
0.2012
0.0045
0.0183
0.24 3.48
APPENDIX 26.0: ANOVA FOR MEAT PROTEIN
Source DF Sum of Squares Mean Square F-value P
Model
Error
Total
4
10
14
2.7612
0.7814
3.5426
0.6903
0.0781
8.83 5.99
APPENDIX 27.0: ANOVA FOR ETHER EXTRACT OF MEAT
Source DF Sum of Squares Mean Square F-value P
Model
Error
Total
4
10
14
1.1336
0.4174
1.551
0.2834
0.0417
6.79 5.99
APPENDIX 28.0: ANOVA FOR KIDNEY WEIGHT
Source DF Sum of Squares Mean Square F-value P
Model
Error
Total
4
10
14
16.93
28.67
45.60
4.23
2.87
1.47 3.48
APPENDIX 29.0: ANOVA FOR LUNG WEIGHT
Source DF Sum of Squares Mean Square F-value P
Model
Error
Total
4
10
14
40.27
69.33
109.60
10.07
6.93
1.45 3.48

106
APPENDIX 30.0: ANOVA FOR EMPTY CAECUM WEIGHT
Source DF Sum of Squares Mean Square F-value P
Model
Error
Total
4
10
14
84.93
100.67
185.60
21.23
10.07
2.11 3.48
APPENDIX 31.0: ANOVA FOR CAECUM AND CONTENT WEIGHT
Source DF Sum of Squares Mean Square F-value P
Model
Error
Total
4
10
14
369.60
1,669.33
2,038.93
92.40
166.93
0.55 3.48
APPENDIX 32.0: ANOVA FOR HEART WEIGHT
Source DF Sum of Squares Mean Square F-value P
Model
Error
Total
4
10
14
5.73
24.00
29.73
1.43
2.40
0.60 3.48
APPENDIX 33.0: ANOVA FOR CRUDE PROTEIN (DIGESTIBILITY)
Source DF Sum of Squares Mean Square F-value P
Model
Error
Total
4
10
14
933.978
513.327
1,447.30
233.495
51.333
4.55 3.48
APPENDIX 34.0: ANOVA FOR DRY MATTER (DM) DIGESTIBILITY
Source DF Sum of Squares Mean Square F-value P
Model
Error
Total
4
10
14
408.942
200.881
609.823
102.235
20.088
5.09 3.48
APPENDIX 35.0: ANOVA FOR CRUDE FIBRE (CF) DIGESTIBILITY
Source DF Sum of Squares Mean Square F-value P
Model
Error
Total
4
10
14
249.600
190.343
439.943
62.40
19.03
3.28 3.48

107
APPENDIX 36.0: ANOVA FOR ETHER EXTRACT DIGESTBILITY
Source DF Sum of Squares Mean Square F-value P
Model
Error
Total
4
10
14
163.09
2889.52
3052.61
40.7725
288.952
0.14 3.48
APPENDIX 37.0: ANOVA FOR FEED INTAKE PER BODY WEIGHT (g/kg)
Source DF Sum of Squares Mean Square F-value P
Model
Error
Total
4
10
14
22.09
48.815
70.90
5.523
4.882
1.13 3.48
APPENDIX 38.0: ANOVA FOR FEED COST/KG GAIN
Source DF Sum of Squares Mean Square F-value P
Model
Error
Total
4
10
14
0.090
0.0786
0.1686
0.0225
0.00786
2.86 3.48
APPENDIX 39.0: ANOVA FOR DAILY BODY WEIGHT GAIN (g)
Source DF Sum of Squares Mean Square F-value P
Model
Error
Total
4
10
14
4.84
2.96
7.80
1.21
0.296
4.09 3.48

![Fascinating Nutritional, Prophylactic,Therapeutic & Socio ... · Database] Since dried Moringa leaves retain their nutrient content, It’s possible and convenient to convert use](https://img.dokumen.tips/doc/110x75/5f2ccf746963912a6e098a0f/fascinating-nutritional-prophylactictherapeutic-socio-database-since.jpg)