Embed Size (px)
Citation preview

1
Effect of hydrocolloids addition on rheological properties, and sensory quality of tomato ketchup during storage
EL-Desouky, A.I.
Food Sci. Dept., Fac. of Agric., Moshtohor, Benha Univ., Egypt.
ABSTRACT The effect of two different hydrocolloids on rheological properties and sensory quality of tomato ketchup during storage was studied. The starch was add to tomato ketchup at level of 0 ,1 ,2 and 3% while pectin was add at level 0.5 and 1%. Tomato ketchup was stored at room temperature for six months.
The rheological behavior of tomato ketchup samples contained different ratios of hydrocolloids were measured in shear rate range 0.0 to 100 s-1 and studied at a wide range of temperatures (5 - 75 °C) using a Brookfield Digital Viscometer. The results indicated that these tomato ketchups behave as non-Newtonian fluids (pseudoplastic) and have a definite yield stress. Higher significant correlation was found between the viscosity and temperature. The viscosity decreased with increasing in the temperature. All hydrocolloids increased consistency of tomato ketchup. With increasing storage period, viscosity of tomato ketchup decreased. The water separation as important sensory attribute decreased with the addition level of hydrocolloid and increased with increasing storage duration. The effect of temperature on their viscosity can be described by means of an Arrhenius-type equation. The activation energy for viscous flow depends on the chemical composition; the activation energy decreased with increasing hydrocolloids addition. Sensory tests for tomato ketchups were done during storage and the results indicated that the hydrocolloid addition improved the quality of tomato ketchup in zero time and during storage period. Keywords Tomato ketchup. Hydrocolloids. Chemical composition. Starch and pectin addition. Water separation. Rheological parameters. Sensory evaluation. Ketchup storage.
INTRODUCTION Of all vegetables, tomato is both qualitatively and quantitatively an
important component of the Mediterranean diet, whether consumed raw or as processed tomato products (juice, tomato paste and tomato sauces). Tomatoes are regarded as the most important source of the carotenoid, lycopene, and a tomato-rich diet is reported to provide protection against some types of cancer and cardiovascular diseases (Sesso et al., 2004; Walfisch et al., 2007 and Willcox et al., 2003). However, the healthy effects attributed to tomato consumption might not be limited to lycopene content alone (Jacob et al., 2008).
2
The consistency of tomato products depends on the amount of suspended particles (pulp) in a dispersing medium and is directly related to the tomato fruit constituents such as pectin. Other factors such as enzymatic degradations, pulp network, homogenization process and concentration also play an important role in determining the consistency of tomato products (Valencia et al., 2003 and Vercet et al., 2002).
Technological characteristics, such as chemical composition, rheological properties, physical properties and sensory properties play an important role in the formation of the processing steps, which are necessary for the production of tomato ketchup. Ketchup is a descriptive term for a number of different products, which consist of the pulp, strained and seasoned, of various fruits; the variety made from tomatoes being the most popular condiment. Good ketchup is judged by flavor, consistency, uniformity and attractiveness of color. Tomato ketchup is a clean, sound product made from properly prepared strained tomatoes with spices, salt, sugar and vinegar with or without starch, onion and garlic and contains not less than 12 per cent of tomato solids. It is the most important product of tomato and is consumed extensively. A major part of the tomato processed is used for making ketchup compared to other tomato products (Gupta, 1998). Many newly developed tomato products with or without other vegetable juices are now appearing on the market, and among these new products with ‘high service content’ tomato ketchup has been probably the first to meet with the consumer favour and it still represents a large share of the market, Porretta and Birzi (1995). Even though ketchup is known worldwide, information on this product in technical/scientific literature is limited, Porretta (1991). Commercial ketchup can have an extremely variable composition; nearly every manufacturer has a formula of his own which differs in some respects from those of other manufacturers. These differences are mainly in the quantity, number and amount of spices or other flavoring agents used. Thus, it is difficult to establish the analytical parameters on which quality depends. Viscosity is usually considered an important physical property related to the quality of food products. Viscometric data are also essential for the design evaluation of food processing equipment such as pumps, piping, heat exchangers, evaporators, sterilizes filters and mixtures. Many foods of commercial importance, such as tomato paste and tomato ketchup are concentrated dispersions of insoluble matter in aqueous media. Their rehological behavior, especially the yield point, is important in the handling, storage, processing and transport of concentrated suspensions in industry, Rao (1987). The viscosity of fluid foods is an important parameter of their texture. It determines to a great extent the overall mouth-feel and influences the intensity of flavor, Thomas, et al. (1995). Therefore, for many years, the viscosity of liquid and semi solid foods has been of interest to researchers and industrialists. Correlation between sensory and instrumental values of texture parameters can be used for industrial quality control to keep the sensory viscosity within a range
3
assuring good consumer acceptance Szczeniak (1987) and Houska, et al. (1998). A complete outline of the physicochemical and sensory characterization of ketchup has been reported previously Porretta, et al. (1989). The yield point values of ketchup were correlated with pectin content Rani and Banins (1987). Ketchups are time-independent, non-Newtonian fluids that show a small thixotropy, Bottiglieri, et al. (1991). The different brands examined differed essentially only in viscosity and yield point values. The quality of ketchup is strongly dependent on its preservation. The most typical use of ketchup is in ‘fast-food’ restaurants where it is normally stored at room temperature after the opening of the container, the classic black ring which forms in the bottle neck is a definite sign of the result of a Maillard-type degradation which implies other important quality changes Porretta and Birzi (1995). All the test models discussed so far involve subjecting the foodstuff to a step change in share rate (γ&) or share stress (τ) and measuring the stress as s function of time. A useful procedure in the study of food rheology is to subject. The viscosity of tomato ketchup is a major quality component for consumer acceptance. Several parameters contribute to the flow behavior of tomato ketchup, including the quality of the raw material and the processing conditions (Bayoda et al., 2008). Tomato ketchup is a heterogenous suspension product, controlling of the phase separation in tomato ketchup is of a major commercial importance due to a high or low degree of serum separation during storage (Gujral, et al., 2002; Stoforos and Reid, 1990).
Sidhu et al. (1997) indicated that the consistency of tomato ketchup can be improved by adding polysaccharides such as gums and Gujral et al. (2002) reported that hydrocolloids increased the viscosity and reduced the serum loss of tomato ketchups. Also, Sahin and Ozdemir (2004) showed that all tested hydrocolloids can be used to improve consistency/viscosity of tomato ketchups. Hydrocolloids are water-soluble, high molecular weight polysaccharides that find wide application in food industry because of their ability to improve the rheological and textural characteristics of food systems and often used as food additives for enhancing viscosity, creating gel-structures and lengthening the physical stability (Dickinson, 2003).
The present work was done to determine the effect of hydrocolloids addition on rheological properties and sensory quality of tomato ketchup during storage, with relationship of chemical composition and sensory characteristics.
MATERIALS AND METHODS
1. Materials: Tomato fruits (super strain B), spices, salt, sugar, onion, garlic, and acetic
acid were purchased from the local supermarket in Toukh city Quliobia govrnotate.
4
Starch, pectin and all chemicals used in chemical analysis were purchased from Al-Gomhuria Co. for chemicals, Cairo, Egypt. 2. Preparation of ketchups:
Tomato ketchups including control samples were made in (THE) laboratory.
The ketchup was prepared according to Gujral et al. (2002) as follows: The tomato was washed, crushed and then hot pulped (boiled in their owen juice for 5 min). They were then passed through a laboratory pulper to get tomato juice. The tomato ketchup was prepared using ingredient as follows: Tomato juice 1 kg, sugar 80g, salt 10g, onion 3g, ginger 6 g, garlic 6g, mace 0.3g, cloves 0.3g, cinnamon 0.3g, red chilli powder 1.5g, black pepper powder 0.002g and acetic acid 50-60 ml (5-6%). Tomato juice was put into an open pan. Spices were wrapped in a cloth and dipped into the tomato juice. Onion and garlic pulp were added directly to the juice. The mixture was then heated at a moderate temperature, and stirred constantly until the mixture reached a temperature between 75 and 80 °C. At this point, some sugar and all salt were added, and heating was continued until the mixture attained a TSS content of 25% +1. Then, ginger and acetic acid were added to the mixture, and the ketchup was heated until a TSS of 30% +1was obtained. Finally, sodium benzoate was added as a preservative, (500mg/kg) and the ketchup was immediately portioned into 6 samples. The hydrocolloids were mixed with a little bit of sugar then added into ketchup (0,1,2 and 3% of starch and 0.5 and 1% pectin), and stirred for 2 min with an electric blender. Each ketchup sample was then immediately poured into the glass jar, while still hot, sealed with screw caps, and then stored at ambient temperature (25-30°C) for 6 months. 3. Analytical Methods: 3.1. Chemical methods:
Moisture content, total solids, fat, protein, ash, ascorbic acid and starch were determined according to AOAC (2000). Total soluble solids were measured at 25 °C by using Abbe refrectometer Model 1T according to AOAC (2000). The pH was measured with a pH meter model Consort pH meter P107. Titratable acidity was determined by titration with NaOH 0.1 N solution using phenolphthalein as indicator according to AOAC (2000). Total and reducing sugars were determined by Shaffer and Hartman method as described in the AOAC (2000). Total pectin content and fractional pectin components were determined by the method of Carre and Hayness, which was described by Pearson (1976). Pulp content was determined according to El-Mansy et al. (2000 a,b). Color index of ketchup was determined by the method of Meydov et al. (1977). Carotenoids were determined according to Harvey and Catherine (1982). While lycopene was determined according to Ranganna (1997). 3.2. Rheological measurements:
5
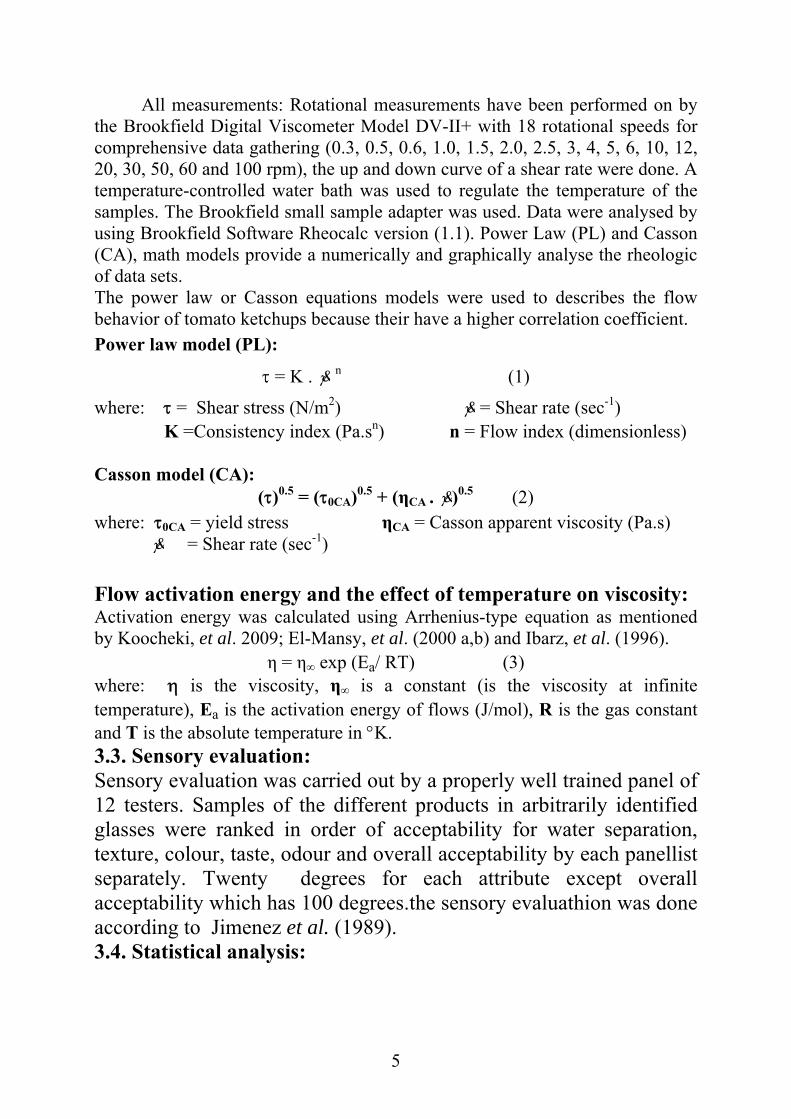
All measurements: Rotational measurements have been performed on by the Brookfield Digital Viscometer Model DV-II+ with 18 rotational speeds for comprehensive data gathering (0.3, 0.5, 0.6, 1.0, 1.5, 2.0, 2.5, 3, 4, 5, 6, 10, 12, 20, 30, 50, 60 and 100 rpm), the up and down curve of a shear rate were done. A temperature-controlled water bath was used to regulate the temperature of the samples. The Brookfield small sample adapter was used. Data were analysed by using Brookfield Software Rheocalc version (1.1). Power Law (PL) and Casson (CA), math models provide a numerically and graphically analyse the rheologic of data sets. The power law or Casson equations models were used to describes the flow behavior of tomato ketchups because their have a higher correlation coefficient. Power law model (PL):
τ = K . γ& n (1)
where: τ = Shear stress (N/m2) γ& = Shear rate (sec-1) K =Consistency index (Pa.sn) n = Flow index (dimensionless) Casson model (CA):
(τ)0.5 = (τ0CA)0.5 + (ηCA . γ&)0.5 (2) where: τ0CA = yield stress ηCA = Casson apparent viscosity (Pa.s)
γ& = Shear rate (sec-1) Flow activation energy and the effect of temperature on viscosity: Activation energy was calculated using Arrhenius-type equation as mentioned by Koocheki, et al. 2009; El-Mansy, et al. (2000 a,b) and Ibarz, et al. (1996).
η = η∞ exp (Ea/ RT) (3) where: η is the viscosity, η∞ is a constant (is the viscosity at infinite temperature), Ea is the activation energy of flows (J/mol), R is the gas constant and T is the absolute temperature in °K. 3.3. Sensory evaluation: Sensory evaluation was carried out by a properly well trained panel of 12 testers. Samples of the different products in arbitrarily identified glasses were ranked in order of acceptability for water separation, texture, colour, taste, odour and overall acceptability by each panellist separately. Twenty degrees for each attribute except overall acceptability which has 100 degrees.the sensory evaluathion was done according to Jimenez et al. (1989). 3.4. Statistical analysis:
6
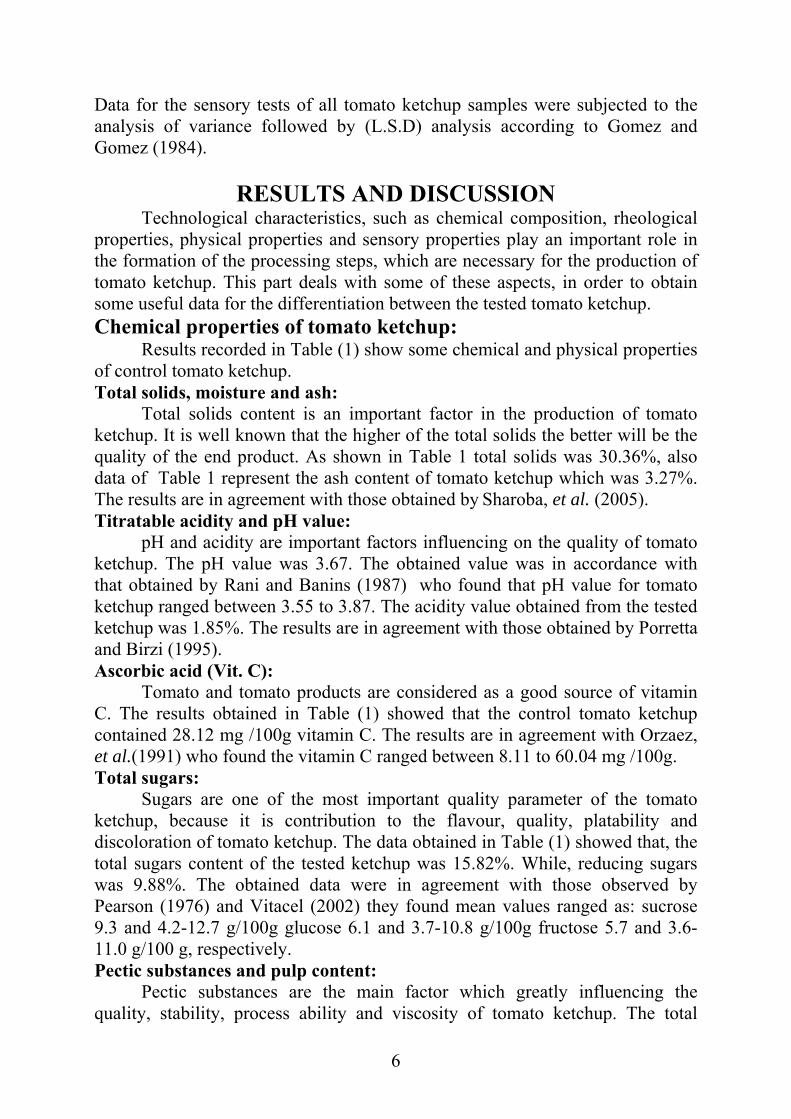
Data for the sensory tests of all tomato ketchup samples were subjected to the analysis of variance followed by (L.S.D) analysis according to Gomez and Gomez (1984).
RESULTS AND DISCUSSION Technological characteristics, such as chemical composition, rheological
properties, physical properties and sensory properties play an important role in the formation of the processing steps, which are necessary for the production of tomato ketchup. This part deals with some of these aspects, in order to obtain some useful data for the differentiation between the tested tomato ketchup. Chemical properties of tomato ketchup:
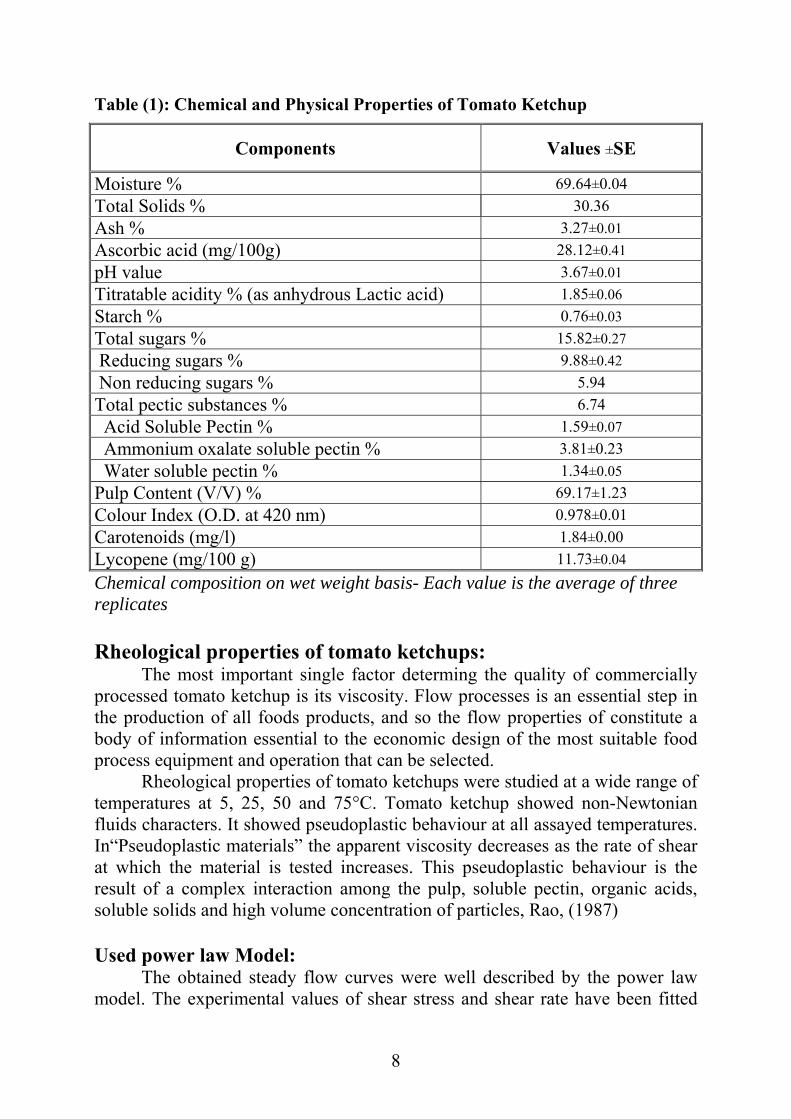
Results recorded in Table (1) show some chemical and physical properties of control tomato ketchup. Total solids, moisture and ash:
Total solids content is an important factor in the production of tomato ketchup. It is well known that the higher of the total solids the better will be the quality of the end product. As shown in Table 1 total solids was 30.36%, also data of Table 1 represent the ash content of tomato ketchup which was 3.27%. The results are in agreement with those obtained by Sharoba, et al. (2005). Titratable acidity and pH value:
pH and acidity are important factors influencing on the quality of tomato ketchup. The pH value was 3.67. The obtained value was in accordance with that obtained by Rani and Banins (1987) who found that pH value for tomato ketchup ranged between 3.55 to 3.87. The acidity value obtained from the tested ketchup was 1.85%. The results are in agreement with those obtained by Porretta and Birzi (1995). Ascorbic acid (Vit. C):
Tomato and tomato products are considered as a good source of vitamin C. The results obtained in Table (1) showed that the control tomato ketchup contained 28.12 mg /100g vitamin C. The results are in agreement with Orzaez, et al.(1991) who found the vitamin C ranged between 8.11 to 60.04 mg /100g. Total sugars:
Sugars are one of the most important quality parameter of the tomato ketchup, because it is contribution to the flavour, quality, platability and discoloration of tomato ketchup. The data obtained in Table (1) showed that, the total sugars content of the tested ketchup was 15.82%. While, reducing sugars was 9.88%. The obtained data were in agreement with those observed by Pearson (1976) and Vitacel (2002) they found mean values ranged as: sucrose 9.3 and 4.2-12.7 g/100g glucose 6.1 and 3.7-10.8 g/100g fructose 5.7 and 3.6-11.0 g/100 g, respectively. Pectic substances and pulp content:
Pectic substances are the main factor which greatly influencing the quality, stability, process ability and viscosity of tomato ketchup. The total
7
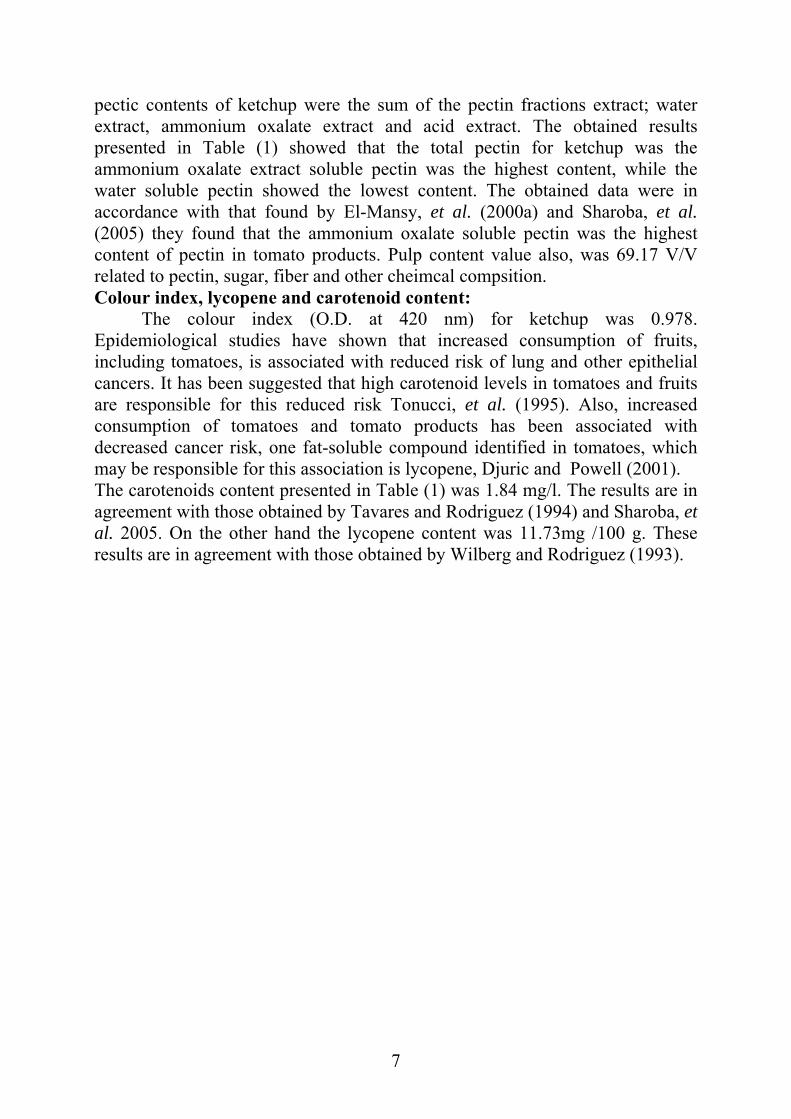
pectic contents of ketchup were the sum of the pectin fractions extract; water extract, ammonium oxalate extract and acid extract. The obtained results presented in Table (1) showed that the total pectin for ketchup was the ammonium oxalate extract soluble pectin was the highest content, while the water soluble pectin showed the lowest content. The obtained data were in accordance with that found by El-Mansy, et al. (2000a) and Sharoba, et al. (2005) they found that the ammonium oxalate soluble pectin was the highest content of pectin in tomato products. Pulp content value also, was 69.17 V/V related to pectin, sugar, fiber and other cheimcal compsition. Colour index, lycopene and carotenoid content:
The colour index (O.D. at 420 nm) for ketchup was 0.978. Epidemiological studies have shown that increased consumption of fruits, including tomatoes, is associated with reduced risk of lung and other epithelial cancers. It has been suggested that high carotenoid levels in tomatoes and fruits are responsible for this reduced risk Tonucci, et al. (1995). Also, increased consumption of tomatoes and tomato products has been associated with decreased cancer risk, one fat-soluble compound identified in tomatoes, which may be responsible for this association is lycopene, Djuric and Powell (2001). The carotenoids content presented in Table (1) was 1.84 mg/l. The results are in agreement with those obtained by Tavares and Rodriguez (1994) and Sharoba, et al. 2005. On the other hand the lycopene content was 11.73mg /100 g. These results are in agreement with those obtained by Wilberg and Rodriguez (1993).
8
Table (1): Chemical and Physical Properties of Tomato Ketchup
Chemical composition on wet weight basis- Each value is the average of three replicates Rheological properties of tomato ketchups:
The most important single factor determing the quality of commercially processed tomato ketchup is its viscosity. Flow processes is an essential step in the production of all foods products, and so the flow properties of constitute a body of information essential to the economic design of the most suitable food process equipment and operation that can be selected.
Rheological properties of tomato ketchups were studied at a wide range of temperatures at 5, 25, 50 and 75°C. Tomato ketchup showed non-Newtonian fluids characters. It showed pseudoplastic behaviour at all assayed temperatures. In“Pseudoplastic materials” the apparent viscosity decreases as the rate of shear at which the material is tested increases. This pseudoplastic behaviour is the result of a complex interaction among the pulp, soluble pectin, organic acids, soluble solids and high volume concentration of particles, Rao, (1987) Used power law Model:
The obtained steady flow curves were well described by the power law model. The experimental values of shear stress and shear rate have been fitted
Components Values ±SE
Moisture % 69.64±0.04 Total Solids % 30.36 Ash % 3.27±0.01 Ascorbic acid (mg/100g) 28.12±0.41 pH value 3.67±0.01 Titratable acidity % (as anhydrous Lactic acid) 1.85±0.06 Starch % 0.76±0.03 Total sugars % 15.82±0.27 Reducing sugars % 9.88±0.42 Non reducing sugars % 5.94 Total pectic substances % 6.74 Acid Soluble Pectin % 1.59±0.07 Ammonium oxalate soluble pectin % 3.81±0.23 Water soluble pectin % 1.34±0.05 Pulp Content (V/V) % 69.17±1.23 Colour Index (O.D. at 420 nm) 0.978±0.01 Carotenoids (mg/l) 1.84±0.00 Lycopene (mg/100 g) 11.73±0.04
9
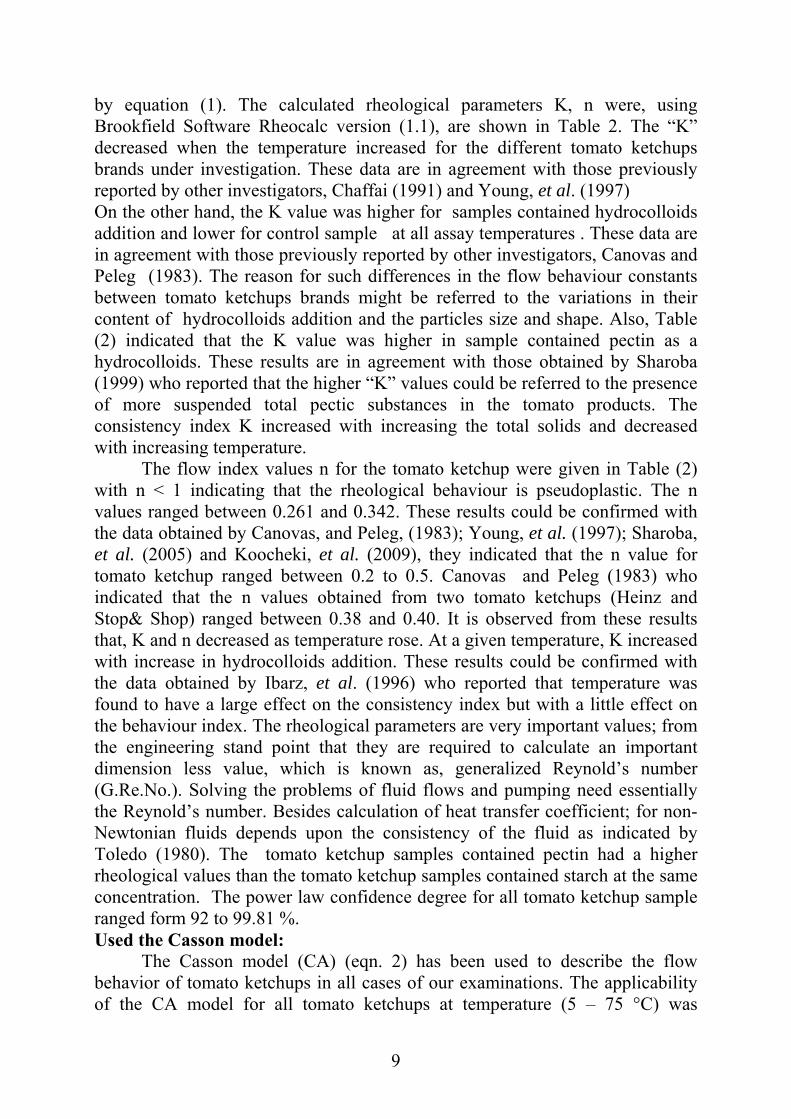
by equation (1). The calculated rheological parameters K, n were, using Brookfield Software Rheocalc version (1.1), are shown in Table 2. The “K” decreased when the temperature increased for the different tomato ketchups brands under investigation. These data are in agreement with those previously reported by other investigators, Chaffai (1991) and Young, et al. (1997) On the other hand, the K value was higher for samples contained hydrocolloids addition and lower for control sample at all assay temperatures . These data are in agreement with those previously reported by other investigators, Canovas and Peleg (1983). The reason for such differences in the flow behaviour constants between tomato ketchups brands might be referred to the variations in their content of hydrocolloids addition and the particles size and shape. Also, Table (2) indicated that the K value was higher in sample contained pectin as a hydrocolloids. These results are in agreement with those obtained by Sharoba (1999) who reported that the higher “K” values could be referred to the presence of more suspended total pectic substances in the tomato products. The consistency index K increased with increasing the total solids and decreased with increasing temperature.
The flow index values n for the tomato ketchup were given in Table (2) with n < 1 indicating that the rheological behaviour is pseudoplastic. The n values ranged between 0.261 and 0.342. These results could be confirmed with the data obtained by Canovas, and Peleg, (1983); Young, et al. (1997); Sharoba, et al. (2005) and Koocheki, et al. (2009), they indicated that the n value for tomato ketchup ranged between 0.2 to 0.5. Canovas and Peleg (1983) who indicated that the n values obtained from two tomato ketchups (Heinz and Stop& Shop) ranged between 0.38 and 0.40. It is observed from these results that, K and n decreased as temperature rose. At a given temperature, K increased with increase in hydrocolloids addition. These results could be confirmed with the data obtained by Ibarz, et al. (1996) who reported that temperature was found to have a large effect on the consistency index but with a little effect on the behaviour index. The rheological parameters are very important values; from the engineering stand point that they are required to calculate an important dimension less value, which is known as, generalized Reynold’s number (G.Re.No.). Solving the problems of fluid flows and pumping need essentially the Reynold’s number. Besides calculation of heat transfer coefficient; for non-Newtonian fluids depends upon the consistency of the fluid as indicated by Toledo (1980). The tomato ketchup samples contained pectin had a higher rheological values than the tomato ketchup samples contained starch at the same concentration. The power law confidence degree for all tomato ketchup sample ranged form 92 to 99.81 %. Used the Casson model:
The Casson model (CA) (eqn. 2) has been used to describe the flow behavior of tomato ketchups in all cases of our examinations. The applicability of the CA model for all tomato ketchups at temperature (5 – 75 °C) was

10
examined by CA parameters. The correlation coefficients indicated reasonably good applicability of the model. The use of the CA model was necessary because this model give the appearance viscosity The values of rheological constants for tomato ketchups, using the CA model were presented in Table (2). Casson yield stress (τ0CA):
Yield stress (τ0CA) value was higher for samples contained hydrocolloids and lower for the control tomato ketchup sample. The τ0C values at temperature 5 °C were 18.34, 20.96, 23.93, 26.11, 24.77 and 29.48 Pa for all tomato ketchups under studies, 0% hydrocolloids adding ratio, (1, 2 and 3% starch), (0.5 and 1% pectin), respectively. On the other hand the confidence degree for Casson model was lower than that obtained using power law model for the different tomato ketchups brands under investigation. These data were in agreement with those obtained by Correia and Mittal (1999). Casson dynamic viscosity:
Casson dynamic viscosity decreased as temperature rose for the different tomato ketchups brands under investigation. The results were in agreement with those obtained by Correia and Mittal (1999), Chaffai (1991) and Canovas and Peleg (1983), they found that the Casson dynamic viscosity ranged between 0.321to 0.891 Pa.s. Effect of Storage on rheological properties of tomato ketchups:
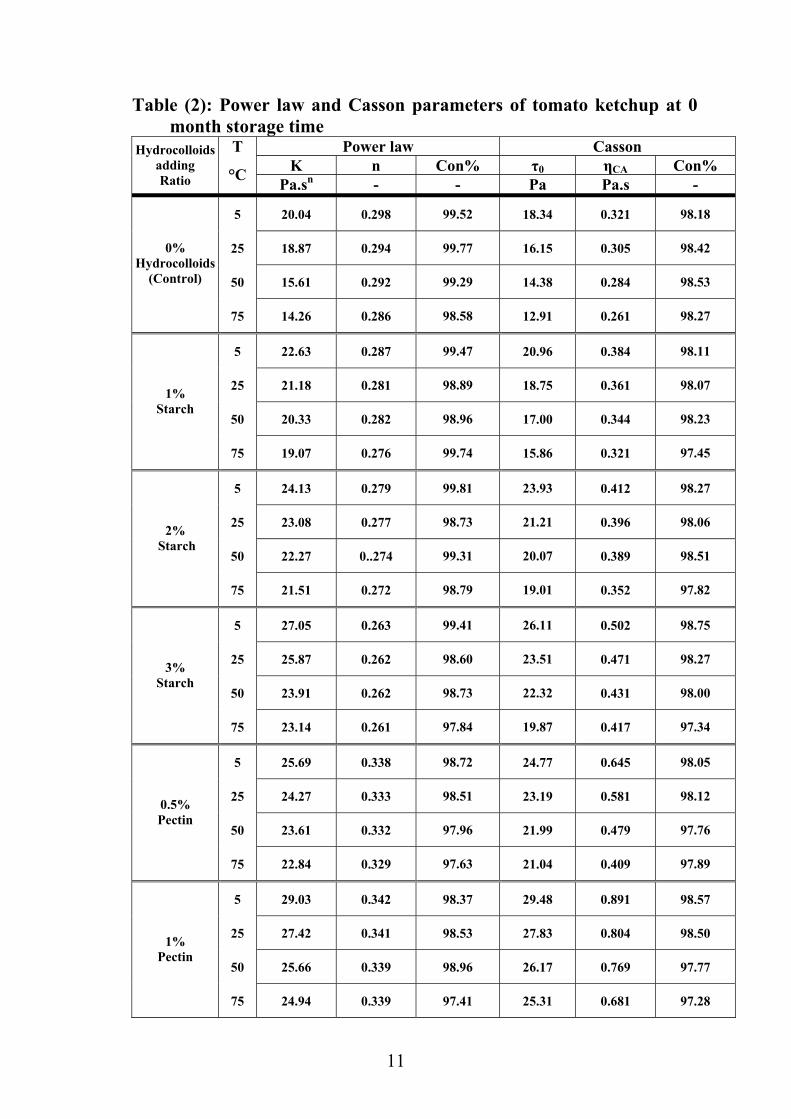
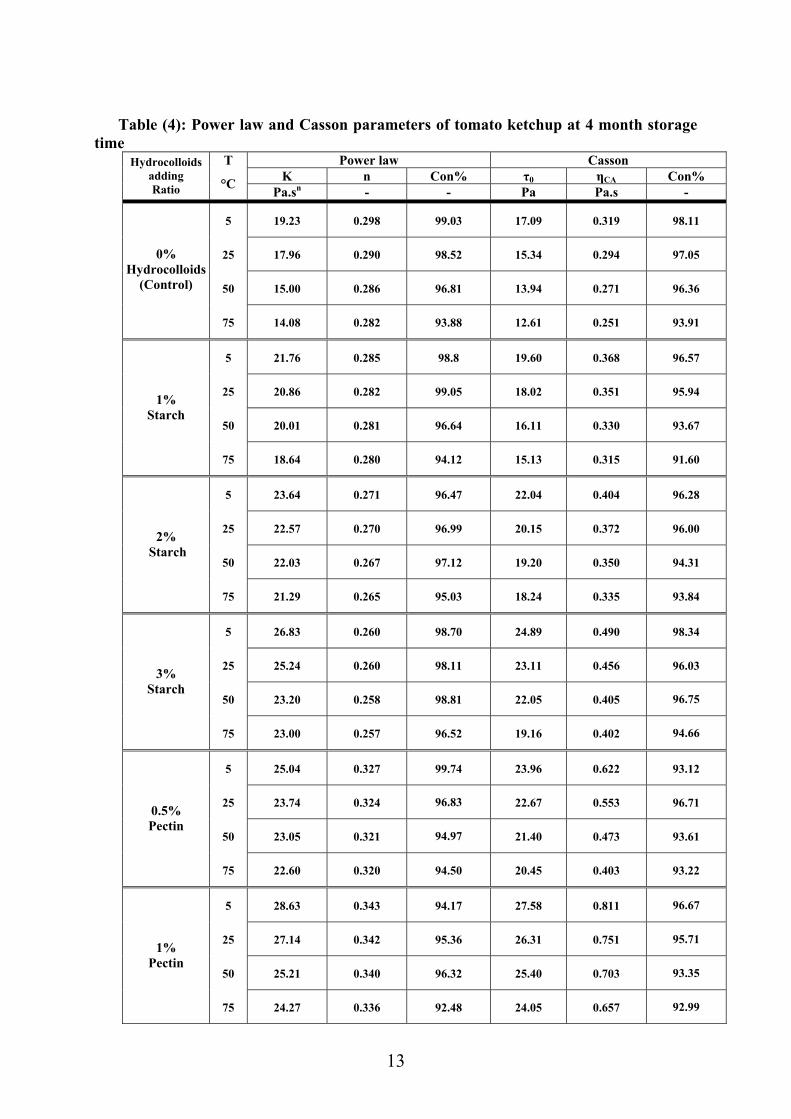
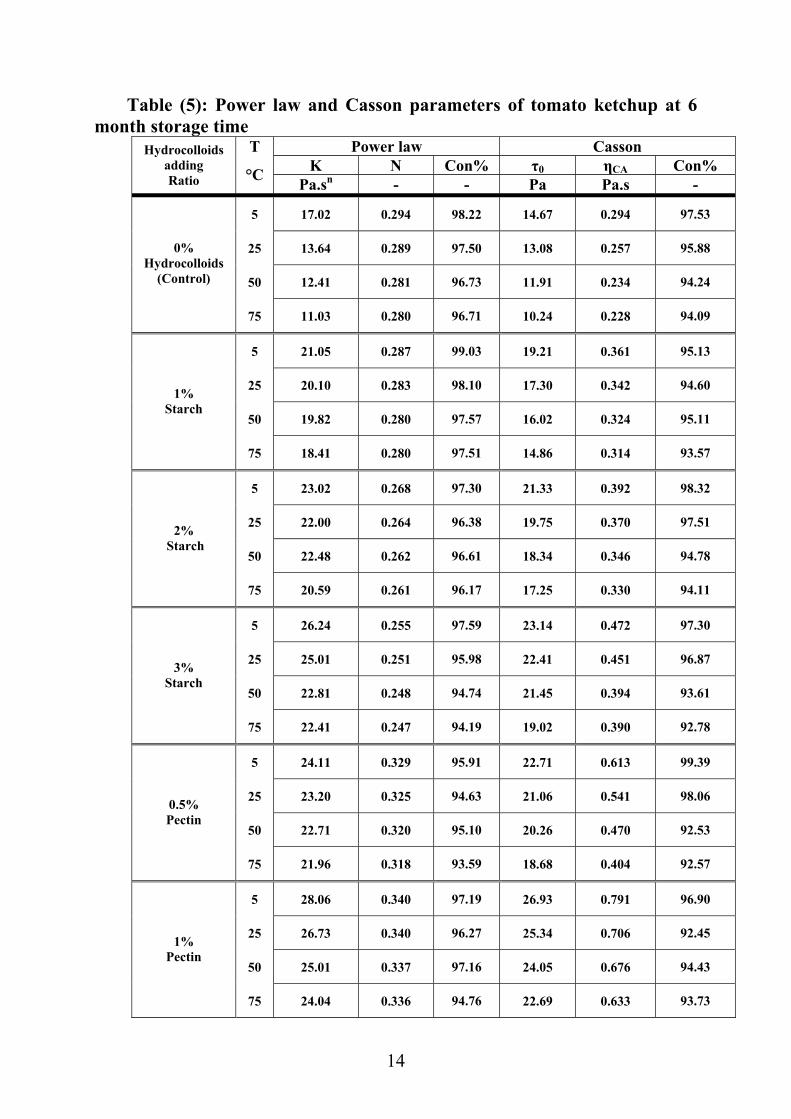
The nature of the components of tomato ketchup (i.e., starch, sugar, pectin, organic acids, etc.,) plays a significant role in viscosity. From such point of views, the viscosity could be used as a mirror to reflect the changes in tomato ketchups components as a result of storage at different conditions of time. Data in Tables (3-5) showed the changes in rheological behavior (power law and casson models parameters) of the presented tomato ketchups after 2, 4 and 6 months of storage. It was clear that the all tomato ketchups samples affected by storage time. Also all tomato ketchups samples exhibited pseudoplastic characteristics with n less than one.
Starch at different ratio ( 1, 2 and 3%) and pectin at ratio (0.5 and 1%) were used as additives to make tomato ketchup and their effects on the rheological properties of the tomato ketchup were examined. The magnitudes of the consistency index, flow index, yield stress and appearance viscosity of the tomato ketchup with the additives, regarded as a for tomato ketchup with pectin adding had rheological parameters greater than tomato ketchup made with starch adding, and both had rheological pramters greater than control sample (no starch or pectin added).
The power law and casson models equations were found a good models to describe the flow behavior of ketchups samples at storage condition Tables (3-5). Values of confidence degree were high. After 2, 4 and 6 months storage power law and Casson models parameters were highly affected by storage time. These results are in agreement with Harnanan et al., (2001).
All rheological parameters increased with the addition of hydrocolloid and decreased with increasing storage duration. These results are in agreement with those obtained by Koocheki, et al. (2009); Sharoba (2004); Varela, et al. (2003)and Singh, et al. (2002).
11
Table (2): Power law and Casson parameters of tomato ketchup at 0 month storage time
T Power law Casson K n Con% τ0 ηCA Con%
Hydrocolloids adding Ratio °C Pa.sn - - Pa Pa.s -
5 20.04 0.298 99.52 18.34 0.321 98.18
25 18.87 0.294 99.77 16.15 0.305 98.42
50 15.61 0.292 99.29 14.38 0.284 98.53
0% Hydrocolloids
(Control)
75 14.26 0.286 98.58 12.91 0.261 98.27
5 22.63 0.287 99.47 20.96 0.384 98.11
25 21.18 0.281 98.89 18.75 0.361 98.07
50 20.33 0.282 98.96 17.00 0.344 98.23
1% Starch
75 19.07 0.276 99.74 15.86 0.321 97.45
5 24.13 0.279 99.81 23.93 0.412 98.27
25 23.08 0.277 98.73 21.21 0.396 98.06
50 22.27 0..274 99.31 20.07 0.389 98.51
2% Starch
75 21.51 0.272 98.79 19.01 0.352 97.82
5 27.05 0.263 99.41 26.11 0.502 98.75
25 25.87 0.262 98.60 23.51 0.471 98.27
50 23.91 0.262 98.73 22.32 0.431 98.00
3% Starch
75 23.14 0.261 97.84 19.87 0.417 97.34
5 25.69 0.338 98.72 24.77 0.645 98.05
25 24.27 0.333 98.51 23.19 0.581 98.12
50 23.61 0.332 97.96 21.99 0.479 97.76
0.5% Pectin
75 22.84 0.329 97.63 21.04 0.409 97.89
5 29.03 0.342 98.37 29.48 0.891 98.57
25 27.42 0.341 98.53 27.83 0.804 98.50
50 25.66 0.339 98.96 26.17 0.769 97.77
1% Pectin
75 24.94 0.339 97.41 25.31 0.681 97.28

12
Table (3): Power law and Casson parameters of tomato ketchup at 2 month storage time
T Power law Casson K n Con% τ0 ηCA Con%
Hydrocolloids adding Ratio °C Pa.sn - - Pa Pa.s -
5 19.81 0.295 99.07 17.32 0.322 99.22
25 18.31 0.291 99.45 15.67 0.301 99.05
50 15.11 0.290 98.99 14.10 0.276 99.12
0% Hydrocolloids
(Control)
75 14.03 0.281 98.51 12.64 0.249 98.34
5 22.05 0.284 99.08 20.10 0.379 97.64
25 21.11 0.282 98.78 18.62 0.354 97.91
50 20.18 0.282 97.14 16.81 0.338 97.62
1% Starch
75 18.89 0.279 97.54 15.74 0.318 97.37
5 24.02 0.277 99.07 23.51 0.411 98.67
25 23.00 0.275 98.33 21.03 0.379 98.08
50 22.31 0.273 97.28 20.00 0.352 97.89
2% Starch
75 21.32 0.274 97.37 18.87 0.344 97.30
5 26.90 0.261 98.33 26.02 0.500 98.10
25 25.54 0.260 98.14 23.56 0.470 98.53
50 23.22 0.260 98.07 22.41 0.429 98.59
3% Starch
75 23.01 0.258 97.92 19.53 0.412 97.34
5 25.33 0.330 99.00 24.60 0.630 97.96
25 24.03 0.327 98.93 23.31 0.567 98.95
50 23.27 0.324 98.37 22.02 0.471 98.10
0.5% Pectin
75 22.81 0.322 98.39 21.01 0.401 97.67
5 29.00 0.344 98.91 29.10 0.832 98.25
25 27.45 0.340 98.22 27.52 0.764 98.01
50 25.41 0.337 98.57 26.00 0.711 97.50
1% Pectin
75 24.39 0.335 97.94 25.34 0.673 97.51
13
Table (4): Power law and Casson parameters of tomato ketchup at 4 month storage time
T Power law Casson K n Con% τ0 ηCA Con%
Hydrocolloids adding Ratio °C Pa.sn - - Pa Pa.s -
5 19.23 0.298 99.03 17.09 0.319 98.11
25 17.96 0.290 98.52 15.34 0.294 97.05
50 15.00 0.286 96.81 13.94 0.271 96.36
0% Hydrocolloids
(Control)
75 14.08 0.282 93.88 12.61 0.251 93.91
5 21.76 0.285 98.8 19.60 0.368 96.57
25 20.86 0.282 99.05 18.02 0.351 95.94
50 20.01 0.281 96.64 16.11 0.330 93.67
1% Starch
75 18.64 0.280 94.12 15.13 0.315 91.60
5 23.64 0.271 96.47 22.04 0.404 96.28
25 22.57 0.270 96.99 20.15 0.372 96.00
50 22.03 0.267 97.12 19.20 0.350 94.31
2% Starch
75 21.29 0.265 95.03 18.24 0.335 93.84
5 26.83 0.260 98.70 24.89 0.490 98.34
25 25.24 0.260 98.11 23.11 0.456 96.03
50 23.20 0.258 98.81 22.05 0.405 96.75
3% Starch
75 23.00 0.257 96.52 19.16 0.402 94.66
5 25.04 0.327 99.74 23.96 0.622 93.12
25 23.74 0.324 96.83 22.67 0.553 96.71
50 23.05 0.321 94.97 21.40 0.473 93.61
0.5% Pectin
75 22.60 0.320 94.50 20.45 0.403 93.22
5 28.63 0.343 94.17 27.58 0.811 96.67
25 27.14 0.342 95.36 26.31 0.751 95.71
50 25.21 0.340 96.32 25.40 0.703 93.35
1% Pectin
75 24.27 0.336 92.48 24.05 0.657 92.99
14
Table (5): Power law and Casson parameters of tomato ketchup at 6 month storage time
T Power law Casson K N Con% τ0 ηCA Con%
Hydrocolloids adding Ratio °C Pa.sn - - Pa Pa.s -
5 17.02 0.294 98.22 14.67 0.294 97.53
25 13.64 0.289 97.50 13.08 0.257 95.88
50 12.41 0.281 96.73 11.91 0.234 94.24
0% Hydrocolloids
(Control)
75 11.03 0.280 96.71 10.24 0.228 94.09
5 21.05 0.287 99.03 19.21 0.361 95.13
25 20.10 0.283 98.10 17.30 0.342 94.60
50 19.82 0.280 97.57 16.02 0.324 95.11
1% Starch
75 18.41 0.280 97.51 14.86 0.314 93.57
5 23.02 0.268 97.30 21.33 0.392 98.32
25 22.00 0.264 96.38 19.75 0.370 97.51
50 22.48 0.262 96.61 18.34 0.346 94.78
2% Starch
75 20.59 0.261 96.17 17.25 0.330 94.11
5 26.24 0.255 97.59 23.14 0.472 97.30
25 25.01 0.251 95.98 22.41 0.451 96.87
50 22.81 0.248 94.74 21.45 0.394 93.61
3% Starch
75 22.41 0.247 94.19 19.02 0.390 92.78
5 24.11 0.329 95.91 22.71 0.613 99.39
25 23.20 0.325 94.63 21.06 0.541 98.06
50 22.71 0.320 95.10 20.26 0.470 92.53
0.5% Pectin
75 21.96 0.318 93.59 18.68 0.404 92.57
5 28.06 0.340 97.19 26.93 0.791 96.90
25 26.73 0.340 96.27 25.34 0.706 92.45
50 25.01 0.337 97.16 24.05 0.676 94.43
1% Pectin
75 24.04 0.336 94.76 22.69 0.633 93.73
15
Activation energy and the effect of temperature on viscosity of tomato ketchup:
The flow activation energy has been related to some fundamental thermodynamic properties of the Newtonian fluids. For example Ea has been found to be approximately equal to 1/3 or 1/4 the heat of vaporization, depending on the shape and bonding of liquid molecules. Empirical equations have been suggested for the estimation of the activation energy as a function of the viscosity and the temperature of various classes of liquids Vanwazer, et al. (1963). Activation energy highly decreased when suspended particles were present in the product, as in cloudy juices and fruit purees. In pseudoplastic fruit products, the activation energy was directly proportional to the flow behaviour index i.e., the more pseudoplastic the product, the less the effect of temperature on its apparent viscosity.
Activation energies of the pseudoplastic products (hydrocolloids addition tomato ketchup) reported on Table (6) were calculated at a constant shear rate (100 s-1). Viscosity decreases with temperature this effect of temperature on the flow behaviour of fluid foods can be described by the Arrhenius relationship according Canovas, and Peleg, (1983); Singh and Eipeson, (2000); Yoo, (2001) and Sharoba, et al. (2005).
The Arrhenius constants for the temperature range 5-75 οC (η∞ and Ea), together with regression coefficients are listed in Table 3. For the flow activation energy, the values range from (14.25 to 11.43 kJ/mol) depends on the chemical composition and hydrocolloids addition. The activation energy decreases with the hydrocolloids addition .These results are in agreement with those obtained by Koocheki, et al. (2009) , Sharoba, et al. (2005) and Rani and Banins (1987). Also these results are trends in accordance with that reported by other authors for different tomato products with similar characteristics Harper and El Sahrigi, (1965) who reported Ea of 3.83 kcal mole-1 K for a tomato juice concentrate of 30 % solids using high shear rates of 500 to 800 s-1. Also Rao, et al. (1981) found the Ea values for tomato concentrates of 30 to 36 % solids (2.3± 0.3 kcal mole-1 K). The Ea decreases with the storage time increasing, these results are in agreement with those obtained by Koocheki, et al. (2009); Sharoba, et al. (2005). On the other hand Ea calculations may be useful in estimating the effect of homogenisation where it would be hypothesized that the homogenized concentrate would have a higher Ea than the non homogenized control due to an increase in the number of insoluble particles, decrease in particle size and decrease in viscosity.

16
Table (6): Arrhenius-type constants relating the effect of temperature* and
viscosity at 100 RPM on tomato ketchup.
Hydrocolloids adding ratio
Storage period
(months)
Coefficient correlation (r)
Ea (J/mol.)
η∞ (mPa.s)
0 0.997 14.25 2.58 2 0.993 14.03 2.49 4 0.995 13.87 2.35
0% Hydrocolloids
(Control)
6 0.991 13.46 2.31 0 0.993 13.34 2.58 2 0.991 13.08 2.36 4 0.994 12.74 2.31
1% Starch
6 0.990 12.40 2.20 0 0.993 13.07 2.37 2 0.993 12.71 2.14 4 0.995 12.39 2.03
2% Starch
6 0.991 12.04 1.88 0 0.972 12.31 2.09 2 0.978 12.11 2.00 4 0.981 11.92 1.84
3% Starch
6 0.977 11.67 1.69 0 0.991 12.85 2.82 2 0.989 12.32 2.65 4 0.992 12.07 2.57
0.5% Pectin
6 0.992 11.80 2.50 0 0.976 11.43 2.14 2 0.979 11.27 2.01 4 0.975 10.94 1.86
1% Pectin
6 0.973 10.62 1.80 • Temperature range for Ea (5-75°C)
Ea (activation energy) η∞ (constant)

17
Sensory Evaluation of Tomato Ketchup: As in all foods, the organoleptic tests are generally the final guide of the
quality from the consumer’s point of view Jimenez, et al. (1989). Thus, it is benefical to make a comparison between tomatoes ketchup. The water separation, texture, and overall acceptability were had high significant difference for all tomato ketchup samples. Also significant difference for tomato ketchup in colour, odour and taste. On the other hand, the scores showed significant differences (p<0.05) between control tomato ketchup and hydrocolloids addition tomato ketchup products. The highest scores on texture for ketchup contained 3% starch and lowest scores on texture for control tomato ketchup. The colour of control tomato ketchup, 0.5% pectin addition tomato ketchup and 1% starch addition tomato ketchup had the higher scores than other tomato ketchup samples. The overall acceptability for hydrocolloids addition tomato ketchup had the higher than other control tomato ketchup. Also the results of sensory evaluation scores are showed in Table (7).
The overall acceptability for tomato ketchup samples contained 2% starch and contant 0.5 had the higher scores than other tomato ketchup products. The overall acceptability for tomato ketchup samples contained 3% starch and contained 1% had smaller scores than other ketchup products.
Data in Table (7) indcated also high significant difference for tomato ketchup during storage.

18
Table (7): Sensory properties of tomato ketchup
Storage period by months Sensory attributes
Hydrocolloids adding ratio 0 2 4 6 Average
0% (Control) 17.08+0.23 16.25+0.33 15.50+0.25 14.00+0.28 15.70d+0.27 1% Starch 17.25+0.21 17.00+0.12 16.66+0.34 15.08+0.74 16.50c+0.19 2% Starch 17.75+0.21 17.91+0.15 16.91+0.23 16.58+0.35 17.29b+0.16 3% Starch 19.33+0.16 18.50+0.18 18.33+0.16 17.58+0.35 18.45a+0.16
0.5 % Pectin 18.75+0.21 17.16+0.21 16.66+0.27 16.83+0.10 17.35b+0.19 1% Pectin 18.75+0.11 18.83+0.27 18.08+0.15 17.25+0.25 18.22a+0.16 Average 18.15a+0.16 17.61b+0.17 17.02c+0.18 16.22d+0.23
LSD( P<0.05)(Storage time) 0.261 LSD( P<0.05) (addition levels) 0.320
Water separation
LSD( P<0.05) (Storage time * addition levels) 0.641 0% (Control) 16.75+0.21 15.91+0.35 15.00+0.46 13.50+0.36 15.29e+0.30
1% Starch 17.50+0.18 16.38+0.10 16.41+0.37 15.91+0.32 16.66d+0.17 2% Starch 18.50+0.12 17.83+0.35 17.33+0.16 17.08+0.30 17.68c+0.16 3% Starch 19.50+ 0.18 18.75+0.11 18.83+0.21 18.66+0.16 18.93a+0.10
0.5% Pectin 18.41+0.15 18.41+0.45 17.83+0.30 17.58+0.20 18.06b+0.16 1% Pectin 19.08+0.23 18.91+0.27 18.50+0.12 18.50+0.12 18.75a+0.10 Average 18.29a+0.17 17.77b+0.21 17.31c+0.24 16.87d+0.31
LSD( P<0.05) (Storage time) 0.303 LSD( P<0.05) (addition levels) 0.371
Texture
LSD( P<0.05) (Storage time * addition levels) 0.742 0% (Control) 19.83+0.10 19.50+0.18 19.16+0.10 19.00+0.18 19.37a+0.09
1% Starch 19.33+0.16 18.19+0.15 18.33+0.33 17.66+0.16 18.56b+0.16 2% Starch 17.91+0.15 17.33+0.16 16.25+0.21 15.91+0.37 16.85d+0.20 3% Starch 17.33+0.24 16.83+0.27 15.50+0.25 14.33+0.24 16.00e+0.27
0.5% Pectin 18.41+0.15 18.25+0.11 17.58+0.23 17.33+0.30 17.89c+0.13 1% Pectin 17.75+0.21 17.25+0.17 16.75+0.21 16.41+0.30 17.04d+0.15 Average 18.43a+0.16 18.01b+0.17 17.26c+0.22 16.77d+0.26
LSD( P<0.05) (Storage time) 0.251 LSD( P<0.05) (addition levels) 0.307
Colour
LSD( P<0.05) (Storage time * addition levels) 0.615

19
Table (7): Continue
Storage period by months Sensory attributes
Hydrocolloids adding
ratio 0 2 4 6 Average 0% (Control) 19.58+0.20 19.33+0.16 18.33+0.21 17.91+0.27 18.79a+0.17
1% Starch 19.33+0.10 18.83+0.21 18.33+0.16 17.66+0.16 18.54a+0.15 2% Starch 18.25+0.17 17.75+0.21 17.25+0.30 17.08+0.32 17.58c+0.15 3% Starch 16.83+0.10 16.25+0.30 16.16+0.33 15.58+0.39 16.20e+0.17
0.5% Pectin 18.19+0.15 18.50+0.12 17.58+0.23 16.83+0.38 17.95b+0.20 1% Pectin 17.33+0.33 17.16+0.21 16.16+0.21 15.58+0.30 16.56d+0.19 Average 18.37a+0.18 17.97b+0.19 17.30c+0.17 16.77d+0.19
LSD( P<0.05) (Storage time) 0.282 LSD( P<0.05) (addition levels) 0.346
Taste
LSD( P<0.05) (Storage time * addition levels) 0.692 0% (Control) 19.75+0.11 19.41+0.15 18.33+0.10 17.33+0.16 18.70a+0.20
1% Starch 19.41+0.20 18.83+0.16 17.83+0.16 16.91+0.23 18.25b+0.21 2% Starch 18.83+0.27 18.16+0.10 17.50+0.22 16.50+0.12 17.75c+0.21 3% Starch 17.33+0.33 16.91+0.30 15.50+0.25 14.00+0.28 15.93e+0.30
0.5% Pectin 19.08+0.20 18.66+0.21 17.50+0.18 16.75+0.21 18.00bc+0.21 1% Pectin 17.58+0.47 17.16+0.35 16.66+0.35 15.66+0.16 16.77d+0.23 Average 18.66a+0.18 18.19b+0.17 17.22c+0.17 16.19d+0.20
LSD( P<0.05) (Storage time) 0.273 LSD( P<0.05) (addition levels) 0.335
Odour
LSD( P<0.05) (Storage time * addition levels) 0.670 0% (Control) 96.33+0.49 91.83+0.98 88.83+1.22 85.50+1.47 90.62b+0.97
1% Starch 95.83+0.83 95.08+0.58 90.58+0.55 89.50+0.42 92.75a+0.64 2% Starch 94.50+0.68 92.66+0.35 91.50+0.40 91.16+0.45 92.45a+0.36 3% Starch 90.50+0.42 90.66+0.24 88.58+0.49 85.33+0.61 88.77c+0.49
0.5% Pectin 92.41+0.20 90.91+0.58 91.25+0.28 91.41+0.52 91.50b+0.23 1% Pectin 89.33+0.65 90.08+0.92 89.08+0.32 89.00+0.90 89.37c+0.35 Average 93.15a+0.49 91.87b+0.37 89.97c+0.31 88.59d+0.31
LSD( P<0.05) (Storage time) 0.772 LSD( P<0.05) (addition levels) 0.946
Overall acceptability
LSD( P<0.05) (Storage time * addition levels) 1.89 Values represent of 12 panellists (Mean ± S.E.) a, b There is no significant difference (p≥0.05) between any two means have the same superscripts, within the same acceptability attribute.

20
REFERENCES
A.O.A.C. (2000). Official Methods of Analysis, 17th Ed. Association of Official Analytical Chemists, Inc.USA.
Bayoda, E.; Willers, E. and Tornberg, E. (2008): Rheological and structural characterization of tomato paste and its influence on the quality of ketchup. LWT 41 (2008) 1289–1300.
Bottiglieri, P.; DeSio, F.; Fasanaro, G.; Mojoli, G.; Impembo, M. and Castaldo, D. (1991). Rheological characterization of ketchup. J. Food Quality 14,497-512.
Canovas, G.V. and Peleg, M. (1983) Flow parameters of selected commercial semi-liquid food products. J. Texture stud., 14; 213-234.
Chaffai-A.H. (1991) A comparative study of the rheology of four semi-solid foods. Sciences-des-Aliments; 11 (4) 673-681.
Correia, L.R. and Mittal, G.S. (1999). Food rheological studies using coaxial rotational and capillary extrusion rheometers. International Journal of Food Properties, 2 (2) 139-150.
Djuric, Z. and Powell, L.C. (2001) Antioxidant capacity of lycopene-containing foods. Inter. J. of Food Sci. and Nutrition; 52 (2) 143-149.
Dickinson, E. (2003). Hydrocolloids at interfaces and the influence on the properties of dispersed systems. Food Hydrocolloids, 17, 25–39.
El-Mansy, H.A; Bahlol, H.El.M.; Mahmoud, M.H.and Sharoba, A.M.A. (2000a). Rheological properties of juice and concentrates of some tomato varieties. Annals of Agric Sci. Moshtohor, 38(3) 1521-1538.
El-Mansy, H.A; Bahlol, H.El.M; Mahmoud, H.M. and Sharoba, A.M.A. (2000b) Comparative study on chemical and rheological properties of orange juice and its concentrates. Annals of Agric Sc. Moshtohor, 38(3) 1557-1574.
Gomez, K.A. and Gomez, A.A. (1984) Statistical Procedures for Agriculture Research. John Wiliy and Sons Editor Inc. USA 2Ed., Chabter 3,129-184.
Gujral, H. S.; Sharma, A., and Singh, N. (2002). Effect of hydrocolloids, storage temperature, and duration on the consistency of tomato ketchup.
Intern. J. of Food Properties, 5, 179–191. Gupta, R.K. (1998). Handbook of Export Oriented Food Processing Projects.
SBP Consultants and Engineers Pvt. Ltd. Harnanan, S.W.; Tejinder, S. and Bains, G.S. (2001). Effect of processing,
preservation and storage on rheology of guava pulp. J. Texture Stud., 32; 271-284.
Harper, J.C. and El Sahrigi, A.F (1965) viscometric behaviour of tomato concentrates J. food Sci, 30,470-476.
Harvey, T.C. and Catherine, G.C. (1982) Aseptically packaged papaya and guava puree: Changes in chemical and sensory quality during processing and storage. J. Food Sci., (47) 1164-1169.
21
Houska, M.; Valentova, H.; Novotna P.; Strohalm, J.; Sestak, J. and Pokorny, J. (1998). Shear rates during oral and nonoral perception of viscosity of fluid foods. J. Texture stud., 14; 603-615.
Ibarz, A.; Garvin, A. and Casta, J. (1996) Rheological Behaviour of sloe (prunvs spinosa) Fruit Juices J. food Eng., 27; 423-430.
Jacob, K.; Periago, M. J.; Bohm, V. and Berruezo, G. R. (2008). Influence of lycopene and vitamin C from tomato juice on biomarkers of oxidative stress and inflammation. British J. of Nutrition, 99(1), 137−146.
Jimenez, L.; Ferrer, L. and Paniego, M.L. (1989) Rheology, composition and sensory properties of pulped tomatoes. J. food Eng., 9; 119-128.
Koocheki, A.; Ghandi, A.; Razavi, S.M.A.; Mortazavi, S.A. and Vasiljevic, T. (2009). The rheological properties of ketchup as a function of different hydrocolloids and temperature. International journal of food science and technology, 44, 596-602.
Meydov, S.; Saguy, I. and Kopelman, I.J. (1977). Browning determination in citrus products. J. Agri. Food Chem., 25 (3): 602.
Orzaez, M.T.; Matallana, M.C.; Palomino, P.; Valdehita, M.T.; Diaz, A. (1991) Changes in vitamin C contents of tomato products. Anales-de-Bromatologia; 43 (1) 45-49.
Pearson, D. (1976). The Chemical Analysis of Food 7th Ed. Churchill London U.D.
Porretta, S. (1991). Analytical profiling of ketchup. J. Sci. Food Agric.; 57 (2)
293-301. Porretta, S. and Birzi, A. (1995). Effect of storage temperature on sensory shelf
life of two ketchups made of wine or spirit vinegar. Sciences-des-Aliments; 15 (6) 529-540.
Porretta, S.; Sandei, L. and Leoni, C., (1989). Commercial-quality classification of tomato ketchup. Ind. Conserve, 64,21-27.
Ranganna, S. (1997). Manual of analysis of fruit and vegetable products. Tata Mcagaw-hill Publishing Company Limited. New Delhi, India.
Rani, U.; and Banins, G.S. (1987). Flow behaviour of tomato Ketchups. J. Texture stud. 18; 125-135.
Rao, M.A. (1987). Predicting flow properties of food suspensions of plant origin. Food Technol.,41 (8), 85-88.
Rao, M.A.; Bovrne, M.C. and Cooley, H.J. (1981) Flow properties of tomato concentrates. J.Texture stud., 12; 521-538.
Sahin, H. and Ozdemir, O.(2004)Effect of some hydrocolloids on the rheological properties of different formulated ketchups. Food Hydrocolloids 18,1015–1022
Sesso, H. D., Buring, J. E., Norkus, E. P., & Gaziano, J. M. (2004). Plasma lycopene, other carotenoids, and retinol and the risk of cardiovascular disease in women. American J. of Clinical Nutrition, 79, 47−53.

22
Sharoba, A.M. (1999) Rheological studies on some foods. M.Sc. Thesis, Fac. of
Agric., Moshtohor, Zagazig Univ., Egypt. Sharoba, A.M. (2004). Effect of heat transfer on rheological and mechanical
properties of some selected foods. Ph.D Thesis, Fac. of Agric., Moshtohor, Zagazig Univ., Egypt.
Sharoba, A.M; Senge, B.; El-Mansy, H.A.; Bahlol, H.El.M. and Blochwitz, R. (2005). Chemical, sensory and rheological properties of some commercial German and Egyptian tomato ketchups. Eur. Food Res. Technol., 220:142-151.
Sidhu, J. S.; Bawa, A. S. and Singh, N. (1997). Studies on the effect of hydrocolloids on the consistency of tomato ketchup. J. of Food Sci. and Technol., 34, 423–424.
Singh, G.H.; Abhishek, S. and Narpinder, S. (2002) Effect of hydrocolloids, storage temperature, and duration on the consistency of tomato ketchup. International J. of Food Properties; 5 (1) 179-191.
Singh, N.I. and Eipeson, W.E. (2000) Rheological Behaviour of clarified Mango juice concentrates J.Texture stud., 31; 287-295.
Stoforos, N. G. and Reid, D. S. (1990). A test for evaluation of the serum potential of tomato ketchup. J. of Food Sci., 55, 1626–1629. Szczeniak, A. (1987). Correlating sensory with instrumental texture
measurements-An overview of recent developments. J.Texture stud., 18; 1-15.
Tavares, C.A. and Rodriguez, D.B. (1994) Carotenoid composition of Brazilian tomatoes and tomato products. Lebensmittel-Wissenschaft-und-Technologie; 27 (3) 219-222.
Thomas, H.A.; Sidel, J.L. and Stone, H. (1995). Relationships between rheological and sensory properties of liquid foods, Trogon Corp. Symposium, USA.
Toledo, R.T. (1980) Fundamental of food process engineering. AVI publishing company Inc. West Port.Connecticut.P.152-196.
Tonucci, L.H.; Holden, J.M.; Beecher, G.R.; Khachik, F.; Davis, C.S.; Mulokozi, G. (1995) Carotenoid content of thermally processed tomato-based food products. Journal of Agricultural and Food Chemistry; 43 (3) 579-586.
Valencia, C.; Sanches, M. C.; Ciruelos, A.; Latorre, A.; Madiedo, J. M., and Gallegos, C. (2003). Non-linear viscoelasticity modelling of tomato paste products. Food Research Inter., 36, 911–919.
Vanwazer, J. R.; Lyons, J.W.; Kin, K.Y. and Colwell, R.E. (1963) “viscosity and flow Measurement. “ Interscience pubisherrs, New York.
Varela, P.; Gambaro, A.; Gimenez, A.M.; Duran, I. and Lema, P.(2003). Sensory and instrumental texture measures on ketchup made with different thickeners. J. Texture Stud., 34(3) 317-330.
23
Vercet, A.; Sanchez, C.; Burgos, J.; Montanes, L. and Buesa, P. L. (2002). The effect of manothermosonication on tomato pectic enzymes and tomato paste rheological properties. J. of Food Engin., 53, 273–278.
Vitacel (2002) Tomato ketchup made with Vitacel tomato fiber. www.jrs.de/jrs/uk/nm/a_tomato.htm.
Walfisch, S.; Walfisch, Y.; Kirilov, E.; Linde, N., Mnitentag, H.; Agbaria, R. (2007). Tomato lycopene extract supplementation decreases insulin-like growth factor-I levels in colon cancer patients. European J. of Cancer Prevention, 16(4), 298−303.
Wilberg-V.C. and Rodriguez-Amaya-DB (1993) Quantification of beta-carotene and lycopene in tomatoes and some tomato products by HPLC. Ciencia-e-Tecnologia-de-Alimentos; 13 (2) 132-141.
Willcox, J. K.; Catignani, G. L. and Lazarus, S. (2003). Tomatoes and cardiovascular health. Critical Review in Food Science and Nutrition, 43, 1−18
Yoo, B. (2001) Rheological properties of hot pepper-soybean paste. J.Texture stud.; 32, 307-318.
Young, I.L.; Seung, J.L. and Wan, S.N. (1997) Effect of the modified starch on the physical properties of tomato ketchup. Agricultural-Chemistry-and-Biotechnology; 40 (1) 48-52.