Embed Size (px)
Citation preview

Effect of Foliar Nitrogen and Sulfur Applications on Aroma Profile of Vitis vinifera L. cv. Petit Manseng using Modified Quantitative Descriptive Analysis, SPME GC-MS and Electronic Nose
Technology
Molly Kathleen Kelly
Dissertation submitted to the faculty of the Virginia Polytechnic Institute and State University in partial fulfillment of the requirements for the degree of
Doctor of Philosophy
In Food Science and Technology
Joseph Marcy, Chair Bruce Zoecklein, Co-Chair
Susan Duncan Sean O’Keefe
Sara Spayd
May 6, 2013 Blacksburg, VA
Keywords: Petit Manseng, descriptive analysis, SPME, GC-MS, Electronic nose, volatile aroma
compounds, nitrogen fertilization, acid/enzyme hydrolysis

Effect of Foliar Nitrogen and Sulfur Applications on Aroma Profile of Vitis vinifera L. cv. Petit Manseng using Descriptive Analysis, SPME, GC-MS and Electronic Nose Technology
Molly Kathleeen Kelly
ABSTRACT
Petit Manseng grapes harvested in 2011 and 2012 were fertilized with soil nitrogen at 0, and 30 kgN/ha, foliar nitrogen at 15kg/ha and foliar nitrogen plus sulfur at 15kg/ha and 5kg respectively. Point quadrat analysis demonstrated foliar nitrogen alone and nitrogen plus sulfur treatments increased percent gaps and lower leaf layer numbers. Berry juice samples differed in ammonia, arginine and yeast assimilable nitrogen concentration. Total glycosides were 25 percent higher in the foliar nitrogen treatment versus the control treatment. Electronic nose measurements on field clusters and laboratory berry analyses was different among treatments in volatile content. Harvest samples underwent acid or enzyme hydrolysis of precursor fractions. Solid phase microextraction (SPME) and gas chromatography-mass spectrometry (GC/MS) analysis identified 27 free aroma and flavor compounds and 52 bound compounds. Lactones and carboxylic acids were the major components of the free fractions while bound fractions had increased concentrations of alcohols, esters and terpenes compared to the free fraction. With nitrogen fertilization, acid and enzyme hydrolysis had reduced concentrations of some higher alcohols and carboxylic acids. Acid hydrolysis released more terpenes with nitrogen treatments versus enzymatic hydrolysis. Ester content was increased in both acid and enzyme hydrolysis fractions in vines receiving nitrogen treatments. For descriptive analysis, eight trained panelists described aroma, flavor, texture/mouthfeel and aftertaste attributes. Analysis of Variance (ANOVA) demonstrated that wines were a significant source of variation with 23 of the 24 attributes used. Wine principal component analysis (PCA) of aroma attributes explained 23.5% of the variation from PC1, while flavor-by-mouth and texture/mouthfeel attributes explained 26.3% of the variation due to PC1. The aim of this study was to develop descriptive terms for Petit Manseng and determine the influence of fruit nitrogen levels on the aroma and flavor profile of this cultivar.

iii
Table of contents
Abstract……………………………………………………………… Table of contents………………………………………………………iii List of Tables …………...…………………………………………….v List of Figures…………………………………………………………vii
I. Chapter 1: Introduction ………………………………………….Ch. 1 pg.1 Review of the Literature……………………………...Ch. 1 pg.2
II. Chapter II: Effect of Foliar Nitrogen and Sulfur Applications on Petit Manseng (Vitis vinifera L.) Grape Composition………………………………………………Ch 2 pg 36
1. Abstract
2. Introduction
3. Materials and Methods
4. Results and Discussion
5. Conclusions
6. Literature Cited
III. Chapter III: Influence of nitrogen fertilization on grape derived aroma volatiles of Petit Manseng (Vitis vinifera L.)…………………………………………..Ch 3 pg 57
1. Abstract
2. Introduction
3. Materials and Methods
4. Results and Discussion
5. Conclusions
6. Literature Cited

iv
IV. Chapter IV: Effect of Foliar Nitrogen and Sulfur Applications on Aroma Profile of Vitis vinifera L. Petit Manseng using Descriptive Analysis……………….Ch 4 pg 94
1. Abstract
2. Introduction
3. Materials and Methods
4. Results and Discussion
5. Conclusions
6. Literature Cited
V. Appendix A: Virginia Polytechnic Institute and State University, Informed Consent for Participants in Research Projects Involving Human Subjects……………………………………………………………………….pg.116
VI. Appendix B: Worksheets for sensory analysis of Petit Manseng wines……………………………………………………………………….....pg.120
VII. Appendix C: Petit Manseng wine intensity rating line scale………….pg.122

v
LIST OF TABLES
Table 1: Heat summation for the growing season, heat summation for the 30 days before harvest, days exceeding 22 oC for the 30 days prior to harvest and precipitation for two growing seasons at experimental vineyard site …………………………………………………………………Ch 2 pg.47 Table 2: Effect of soil and foliar applications of nitrogen and sulfur on components of yield in 2011 and 2012 Petit Manseng vines ………………………………………………………………... Ch 2 pg.48 Table 3: Effect of soil and foliar applications of nitrogen and sulfur on point quadrat analysis of percentages percentages per treatment in 2012 Petit Manseng vines …………………………………………………………………Ch 2 pg.49 Table 4: One-way ANOVA analysis of effect of soil and foliar applications of nitrogen and sulfur on juice chemistries of 2011 Petit Manseng berries ………………………………………………………………….Ch 2 pg.50 Table 5: One-way ANOVA analysis of effect of soil and foliar applications of nitrogen and sulfur on juice nitrogen levels of 2011 and 2012 Petit Manseng berries ………………………………………………………………......Ch 2 pg.51 Table 6: One-way ANOVA analysis of effect of soil and foliar applications of nitrogen and sulfur on berry skin total (TGG) and pulp phenol-free (PFGG) 2011 Petit Manseng glycosides …………………………………………………………………...Ch 2 pg.52 Table 1: Effect of soil and foliar applications of nitrogen and sulfur on free aroma and flavor compounds in 2011 Petit Manseng juice ………………………………………..…………………………….Ch 3 pg.74 Table 2: Effect of soil and foliar applications of nitrogen and sulfur on free aroma and flavor compounds in 2012 Petit Manseng juice ………………………………………..……………………………..Ch 3 pg.76 Table 3: Effect of soil and foliar applications of nitrogen and sulfur on acid hydrolysis products in 2011 Petit Manseng juice ………………………………………..……………………………..Ch 3 pg.78 Table 4: Effect of soil and foliar applications of nitrogen and sulfur on acid hydrolysis products in 2012 Petit Manseng juice ………………………………………..……………………………..Ch 3 pg.80 Table 5: Effect of soil and foliar applications of nitrogen and sulfur on enzyme hydrolysis products in 2011 Petit Manseng juice ………………………………………..……………………………..Ch 3 pg.83
vi
Table 6: Effect of soil and foliar applications of nitrogen and sulfur on enzyme hydrolysis products in 2012 Petit Manseng juice ………………………………………..……………………………...Ch 3 pg.85 Table 1: Petit Manseng attributes, definitions and references applied to Petit Manseng wine …………………………………………………………..Ch 4 pg.104 Table 2: Harvest weights (kg) and juice yields (L) for different soil and foliar applications of nitrogen and sulfur in 2011 Petit Manseng ……………………………………………………………..Ch 4 pg.106 Table 3: ANOVA analysis of effect of soil and foliar applications of nitrogen and sulfur on wine chemistry of 2011 Petit Manseng……………………………………….Ch 4 pg.107 Table 4: Aroma attributes and significance for wines, judges, replications, and their interactions for sensory training……………………………………………………...Ch 4 pg.108 Table 5: Aroma attributes and significance for wines, judges, replications, and their interactions for Petit Manseng treatment wines……………………………………..Ch 4 pg.109 Table 6: Effect of soil and foliar applications of nitrogen and sulfur on aroma and flavor compounds in 2011 Petit Manseng wine……………………………….Ch 4 pg.110

vii
LIST OF FIGURES
Figure 1: Average daily temperature and precipitation April through October 2011, at experimental vineyard site……………………………………………….Ch. 2 pg.53 Figure 2: Average daily temperature and precipitation April through October 2012, at experimental vineyard site …………………………………………...Ch 2 pg.54 Figure 3: Canonical plots of volatile differences in Petit Manseng berry samples in 2012 from four treatments by conducting polymer-based electronic nose in the laboratory………………………………………………………………...Ch 2 pg.55 Figure 4: Canonical plots of volatile differences in Petit Manseng berry samples in 2012 from four treatments by conducting polymer-based electronic nose in the field………………………………………………………………………Ch 2 pg.56 Figure 1: Free aroma compounds in Petit Manseng berry samples in 2011 from four treatments ……………………………………………………………………………Ch 3 pg.88 Figure 2: Free aroma compounds in Petit Manseng berry samples in 2012 from four treatments ……………………………………………………………………………Ch 3 pg.89 Figure 3: Acid hydrolysis products in Petit Manseng berry samples in 2011 from four treatments ……………………………………………………………………………Ch 3 pg.90 Figure 4: Acid hydrolysis products in Petit Manseng berry samples in 2012 from four treatments ……………………………………………………………………………Ch 3 pg.91 Figure 5: Enzyme hydrolysis products in Petit Manseng berry samples in 2011 from four treatments…………………………………………………………………Ch 3 pg.92 Figure 6: Enzyme hydrolysis products in Petit Manseng berry samples in 2012 from four treatments…………………………………………………………………Ch 3 pg.93 Figure 1: PCA of significant aroma attributes in Petit Manseng wines in 2011 from four treatments…………………………………………………………………Ch 4 pg.134 Figure 2: PCA of significant flavor-by-mouth and texture/mouthfeel attributes in Petit Manseng wines in 2011 from four treatments………………………………………Ch 4 pg.111 Figure 3: Mean intensities of aroma attributes in Petit Manseng wines in 2011 from four treatments…………………………………………………………………Ch 4 pg.112 Figure 4: Mean intensities of flavor-by-mouth and texture/mouthfeel attributes in Petit Manseng wines in 2011 from four treatments……………………………………....Ch 4 pg.113

1
Introduction
Wine aroma depends on a number of factors, especially the variety of grape, winemaking process, maturation and aging (Boulton et al. 1996, Versini et al. 1999, Williams 1993). Secondary metabolites of grapes are responsible for the principal aroma compounds in musts and provide the basis of varietal character (Williams 1993, Wirth et al. 2001). Studies on the volatile compounds of Vitis vinifera wines, as reviewed by Strauss et al. (1986), Versini et al. (1999), and Rapp and Mandery (1986), helped to clarify the basic aroma and flavor chemistry. Fermentation increases the chemical and aroma complexity of a wine by extracting compounds from solids present in the grape must, modifying some grape-derived compounds, and by creating yeast secondary metabolites (Lambrechts and Pretorius 2000). The aroma of wine is due to chemical compounds with low boiling points, which are, therefore, volatile. Small differences in the concentration of these volatile aroma and flavor compounds can have a large impact on perceived wine quality. More than 680 volatile compounds have been identified in wines (Maarse et al. 1993).

2
Chapter One
Review of the Literature
I. Petit Manseng Petit Manseng and its larger-berried sibling, Gros Manseng, are both Vitis vinifera cultivars that are grown in the Jurançon region of France. Wolf (2004) evaluated Petit Manseng with cordon-training and spur-pruning , with VSP canopies, and obtained yields of 11.0-13.0 pounds/vine, or about 3.0-3.5 tons per acre equivalent. The clusters are loose and the berries are small (1.1 g, as compared to 1.6 g for Viognier), and fruit rots are almost non-existent. Fruit ripens very late, and could be harvested after Cabernet sauvignon. The average number of days from budburst to harvest is 173 for Cabernet Sauvignon (clone #7) and 182 for Petit Manseng. The variety has a tendency to accumulate and maintain high concentrations of sugar and acid, and is often harvested at approximately 29°Brix (average 27.6°Brix) with titratable acidity (TA) in the 7.0 to 10.0 g/L range (average 8.0 g/L) (Wolf 2004). II. Plant Biochemistry Most of the wine compounds are produced by the plant itself, in leaves (sugars and acids) and in berries (acids and phenolics). Some molecules related to aroma and flavor are produced during fruit development and ripening. These aromas, called primary aromas, are unique to that particular variety (Conde et al. 2007).
1. Rapid growth phase
Grape berries exhibit a double-sigmoid growth pattern (Coombe 1992). Growth occurs first mostly by cell division and, later, by cell expansion. From flowering to about 60 days after, an initial rapid growth phase occurs in which the berry is formed and the seed embryos are produced. Solutes are accumulated in the berry during the first growth period (Possner and Kliewer 1985). Tartaric and malic acid are found in highest concentration. Hydroxycinnamic acid is also accumulated during the initial growth period. These compounds are distributed in the flesh and skin of the berry, and are important because of their role in browning reactions. They are also precursors of volatile phenols (Romeyer et al. 1983). Several other compounds, like minerals, amino acids, micronutrients and aroma compounds, also accumulate during the first phase of berry growth and impact grape berry quality (Conde et al. 2007).
2. Lag phase/véraison
In most varieties, the first growth phase is followed by a lag phase. The length of this phase is specific to the cultivar. After this period, a second growth phase occurs, which coincides with the onset of ripening. The French word véraison describes the onset of ripening. During this period, the flavor that accumulates in grapes is mostly the result of the acid/sugar balance, and the formation of flavor and aroma compounds or their precursors (Boss and Davies 2001, Conde et al. 2007). The berry doubles in size between véraison and harvest. Many of the solutes accumulated in the grape berry during the first period of development remain at harvest. However, the increase in

3
berry size may reduce their concentrations. Some compounds produced during the first growth period are reduced, not just diluted, during the second period of berry growth. These include malic acid, which is metabolized and used as an energy source during ripening. Tartaric acid concentrations usually remain almost constant after véraison. Aroma and flavor compounds formed during the first growth period may also decrease during fruit ripening, including methoxypyrazine compounds that contribute vegetal characters to wines such as Cabernet Sauvignon and Sauvignon blanc. The most vital event occurring during the second growth period is a large accumulation in compounds such as glucose and fructose, as a result of the shift into ripening mode (Conde et al. 2007).
3. Water deficit
Water deficit generally results in smaller berries because it inhibits cell division and cell expansion. Berry size is a determining factor in wine grape quality. Anthocyanins and other phenolic compounds accumulate in the skin (Coombe et al. 1987), therefore, smaller berries have an increased solute-to-solvent ratio than larger berries. Water stress may also affect the chemical breakdown or formation of various acids and flavor compounds. It can also result in the conversion of carotenoids to aroma and flavor compounds (Conde et al. 2007). III. Odoriferous Compounds The volatile compounds produced by yeast fermentation are derived from sugar and amino acid metabolism, and include esters, higher alcohols, carbonyls, volatile fatty acids and sulfur compounds. Flavor and aroma compounds that are grape-derived are more important in determining the regional character of wines than any other aroma component, including monoterpenes, C13-norisoprenoids, methoxypyrazines, and sulfur compounds (Conde et al. 2007).
1. Terpenes
The odor compounds in V. vinifera that have been studied in the greatest detail are the terpenes. Studies have shown that the terpene compounds form the foundation of the wine bouquet, and they help to differentiate grape varieties (Oliveira et al. 2004). Although they are found at low concentrations in simple-flavored varieties, these compounds are responsible for the characteristic aroma in Muscat grapes and wines. Both free forms and odorless precursors, mainly glycosylated forms, have been identified in grapes and wines. Terpene compounds, located in the berry skin (Manitto 1980), are secondary plant metabolites. Their formation begins with acetyl-coenzyme A (CoA). About 50 monoterpene compounds are known. The main monoterpene alcohols, especially from Muscat varieties, include linalool, geraniol, nerol, citronellol, α-terpineol and hotrienol (Conde et al. 2007). The formation of monoterpenes by Saccharomyces cerevisiae, in the absence of grape-derived precursors, was shown to be of de novo origin in wine yeast strains. Both yeast and bacterial fermentation metabolites may contribute to the aromatic profile of wine. However, the application of this knowledge is still limited (Carrau et al. 2007). a. Glycosylation
4
Aroma compounds are conjugated to glucose as β-D-glucopyranosides, or form more complex disaccharides with glucose by being conjugated with a second sugar unit. In grapes and wines, 6-O-(α-L-arabinofuranosyl)-β-D-glucopyranosides, 6-O-(α-L-rhamnopyranosyl)-β-D-glucopyranosides and 6-O-(β-D-apiofuranosyl)-β-D-glucopyranosides have been identified (Williams et al. 1992, Marinos et al. 1994, Vasserot et al. 1995, Voirin et al. 1990, Winterhalter and Skouroumounis 1997). Release of glycosylated compounds, such as monoterpenes, contributes to the aroma and flavor of certain wine varietals (Bayonove et al. 1971, Ribéreau-Gayon et al. 1975). These odorless glycosidic compounds can be hydrolyzed by either chemical or enzymatic treatment. Acid hydrolysis occurs slowly and may result in the rearrangement of aglycones, resulting in new aroma compounds (Winterhalter and Skouroumounis 1997). The rate of acid hydrolysis depends on the pH and temperature of the medium, and on the composition of the aglycone (Sarry and Günata 2004). Glycosides of tertiary alcohols, such as linalool, linalool oxides and α-terpineol, are hydrolyzed more easily than those of primary alcohols, including geraniol and nerol (Günata et al. 1985). Terpenes are the most numerous and structurally-diverse group of natural products (Cheng et al. 2007, Dudareva et al. 2006, Verpoorte and Alfermann 2000), including hemi-, mono-, sesqui-, di-, tri-, and tetra-terpenes. It has been estimated that there are more than 30,000 isoprenoid (terpenoid) compounds present in plants (Page et al. 2004). The vital roles they play in plant processes include reproduction, defense and adaptation to their environment, respiration, photosynthesis, growth, and development (Gershenzon and Kreis 1999, Paschold et al. 2006, Rodriguez-Concepción and Boronat 2002). Acid-catalyzed rearrangements during wine processing and aging can also result in concentration changes and creation of new compounds (Rapp and Güntert 1985). In grapes, terpenes exist both free and as glycosides (Versini et al. 1994), with bound forms released either chemically (Skouroumounis and Sefton 2000, Williams et al. 1992) or by natural β-glycosidase activity of either the grape or yeasts and bacteria during the winemaking process (Boido et al. 2002, Swiegers et al. 2005). Carrau et al. (2007) reviewed the contribution of several chemical and biological pathways to the formation of monoterpenes during alcoholic fermentation of wine. b. Categories There are three categories of monoterpenes with some interrelationships between them. The linalool oxides include linalool, geraniol, and nerol, in pyran- and furan- forms. Additional monoterpenes found in this group include citronellol, α-terpineol, hotrienol, nerol oxide, myrcenol, the ocimenols and other oxides, aldehydes and hydrocarbons. In wines, monoterpene ethyl ethers and acetate esters have been identified among free aroma and flavor compounds (Mateo and Jiménez 2000). The most aromatic of the monoterpene alcohols are citronellol and linalool. The aroma impact of terpene compounds is also synergistic. The second category of monoterpenes is made up of free odorless polyols (diols and triols). Polyols may be reactive and break down, resulting in pleasant and potent volatiles, including diendiol (Williams et al. 1980). Monoterpene polyols are found in grapes at concentrations up to 1 mg/L. The third category of monoterpenes consists of the glycosidically-conjugated forms. Glycosides are usually more plentiful than the unglycosylated forms (Mateo and Jiménez 2000).
5
c. Synthesis Terpenes are formed by condensation of the isopentenyl diphosphate 5-carbon unit (IPP) and its isomer, dimethylallyl diphosphate (DMAPP). In higher plants, these precursors are formed through two isoprenoid biosynthetic pathways. Over the course of evolution, plants have retained the classical pathway, the eukaryotic mevalonic acid (MVA) pathway (Bochar et al. 1999) and acquired the alternative pathway, the prokaryotic 2-C-methyl-D-erythritol 4-phosphate (MEP) pathway (Rohmer 1999, Rohmer et al. 1993, 1996) from the endosymbiotic ancestor of plastids. A study by Luan and Wüst (2002) showed that the exocarp and mesocarp of grape berries contribute to monoterpene formation via the MEP pathway. Isoprenoids formed in the cytoplasm and mitochondria, including sterols and sesquiterpenes, are mostly formed by the classical mevalonate route (MVA). However, the compartmental separation of the two pathways is not clear-cut and crosstalk can occur between the two compartments (Adam et al. 1999, Arigoni et al. 1997, Piel et al. 1998). It is still unclear how much the MVA and DOXP (1-deoxy-D-xylulose 5-phosphate)/MEP routes are used to form monoterpenes in V. vinifera. Studies have shown that, in grape leaves, the DOXP/MEP pathway is almost exclusively used to form monoterpenes (Soler et al. 1993). d. Hydrolysis Terpene glycosides can be hydrolyzed in acidic medium or by enzymes. Rearrangements of the monoterpenol may occur in acid hydrolysis whereas, by enzymatic hydrolysis, the changes in the natural monoterpenol distribution are minimal. Acid hydrolysis always takes place under wine pH conditions (~3.0). Enzyme hydrolysis has been used to release free aroma and flavor compounds from glycoside precursors, using exogenous enzyme activities (β-glucosidase, α-rhamnosidase, α-arabinosidase and β-apiosidase). The enzymatic mechanism occurs in two successive steps: first, α-L-rhamnosidase, α-L-arabinosidase or β-D-apiosidase cleaves the terminal sugar and rhamnose, arabinose or apiose, and the corresponding β-D-glucosides are released; liberation of the monoterpenol takes place after action of a β-D-glucosidase (Günata et al. 1988). The potential use of β-glucosidase activity to free bound terpenes from grape juices or wines has been studied. Alcoholic fermentation has little effect on the hydrolysis of glycosylated fractions of grapes, mainly due to enzymatic activity inhibition by glucose. However, yeast of the genus Hansenula, isolated from the fermentions, have been reported to have an inducible β-glucosidase activity. The activity of this enzyme was also reported in various Saccharomyces strains, where activity is inhibited by ethanol but not glucose (Conde et al. 2007). Enzymatic hydrolysis of glycoside extracts from varietals, including Muscat, Riesling, Semillon, Chardonnay, Sauvignon and Syrah, have resulted not only in the liberation of terpenes, but also C13-norisoprenoids, such as 3-oxo-α-ionol and 3-hydroxy-β-damascenone (Günata et al. 1990). These compounds are completely glycosylated in the grape and, unlike terpenes, are found in the same quantities in both aromatic and neutral grape varieties. They have lower threshold values than terpenes and may contribute characteristic aromas and flavors (Razungles et al. 1987). e. Carotenoids The oxidative degradation of carotenoids, terpenes with 40 carbon atoms, produces derivatives with 9, 10, 11 or 13 carbon atoms (Enzell 1985). Norisoprenoid derivatives with 13 carbon atoms (C13-norisoprenoids) can contribute unique aroma and flavor properties, and include β-

6
damascenone, with a complex smell of flowers, tropical fruit and stewed apple, and β-ionone, with a characteristic aroma of violets, which may be present in all grape varieties (Conde et al. 2007). f. Vineyard conditions Free and bound forms of terpenols accumulate in ripening grapes from the véraison on. Some authors report a continuous accumulation of monoterpenes, while others share the more common opinion that monoterpenes start to decrease before a maximum sugar level is reached. Vineyard conditions during ripening, such as temperature and water supply, may influence aroma development during ripening. The carotenoid concentration decreases following véraison and correlates with increased amounts of C13-norisoprenoids, mainly in glycosylated forms. Exposure of the grapes to sunlight during ripening speeds up carotenoid breakdown (Razungles et al. 1998). It has been demonstrated that hydrocarbon odors (produced by C13-norisoprenoid derivative TDN, 1,1,6-trimethyl-1,2-dihydronaphthalene), that may form as Riesling wines age, are related to extremely high temperatures during grape ripening. Therefore, hot climates may be favorable for sugar accumulation, but they are not necessarily ideal in terms of wine quality (Conde et al. 2007). Studies have shown that total (free and bound forms) monoterpene concentration in the grape is affected by canopy microclimate, including temperature and light (Hunter et al. 2004, Marais et al. 1999, Reynolds and Wardle 1997). A higher berry monoterpene concentration coincides with increased canopy light intensity and with cooler seasons, compared to those ripened in warmer conditions. The effect of vine nutrition in relation to isoprenoids has not been well studied. For example, in Riesling wines from vines treated with nitrogen, higher concentrations of free linalool and bound linalool oxide, citronellol and α-terpineol were found, but lower concentrations of free linalool oxide and citronellol, compared to wines from untreated vines (Webster et al. 1993). Further research is necessary to better understand the behavior of these key aroma compounds under vine conditions (Carrau et al. 2007). A study by Kozina et al. (2008) indicated that basal leaf removal influences on the composition and quality depended on variety. In Sauvignon blanc wines, basal leaf removal significantly reduced tartaric and malic acid content, and increased free and bound monoterpenes. In Riesling wines, basal leaf removal influenced only tartaric acid content, and did not impact the amount of free and bound monoterpenes. Sensory evaluation showed that the quality of Sauvignon blanc wines could be improved by basal leaf removal, while the quality of Riesling wines remained more or less the same. Zoecklein et al. (1998) evaluated the influence of selective leaf removal in Riesling and Chardonnay grapevines on total bound grape glycoconjugates and the phenol-free glycoconjugate fraction(norisoprenoids and terpenyls) at harvest, as estimated by the analysis of glycosyl-glucose. Leaf removal frequently increased the concentration of both groups of glycosides. Morrison and Noble (1990) suggested that the effects of cluster and leaf shading on berry composition were influenced more by light than by temperature. Several researchers (Coombe and Iland 1987, McCarthy and Coombe 1985) showed that potentially volatile terpenes (PVT) in Riesling berries responded to cluster thinning and decreased irrigation in Australia. Eschenbruch et al. (1987) demonstrated increases in PVT of Müller-Thurgau berries as a result of cluster thinning and shoot thinning. They concluded that

7
PVT development on that cultivar closely paralleled soluble solids accumulation and, therefore, was not a better indicator of grape and wine quality. They were also unable to demonstrate a clear relationship between PVT concentration and wine quality. Smith et al. (1988) demonstrated the effectiveness of basal leaf removal on increasing both terpene concentration and wine sensory scores of Sauvignon blanc. Using a modified distillation method by Dimitriadis and Williams (1984), Reynolds and Wardle (1997) found that glycosylated forms responded to viticultural and enological practices such as hedging, basal leaf removal, skin contact, pressing, and use of enzymes, compared to free monoterpenes. Changes in monoterpene concentrations in berries affected by leaf removal or cluster thinning have been shown to result in sensorial changes (Reynolds et al. 1994, 1995, 1996). They also found that free glycosylated forms and PVT are rarely correlated with soluble solids, titratable acidity or pH, and cannot be predicted using these indices. Free forms and PVT can occur between the berry and juice stages, suggesting the desirability of skin contact (Reynolds and Wardle 1997). Ji and Dami (2008) characterized and compared free volatile flavor and aroma compounds in Traminette grapes to those in other white cultivars (Chardonnay, Gewürztraminer and Riesling) by gas chromatography-mass spectrometry with headspace solid-phase microextraction. They also evaluated the effects of vineyard location (based on growing degree days) and different training systems on Brix, pH, TA, and flavor and aroma compounds in Traminette juice over two seasons. Concentrations of free volatile compounds varied between the hot and cool sites. Concentrations of 6-carbon aldehydes were higher in grapes grown in the cool site, and monoterpenes were higher in the hot site. Among the five training systems, vertical shoot-positioned vines produced the highest amounts of monoterpenes. The authors also identified geraniol, the most characteristic odor in Traminette, and suggested that its presence can be used as a quality indicator for that variety. Furthermore, it may be possible for wineries to achieve a certain aroma and flavor profile by selecting a certain training system and vineyard location (Ji and Dami 2008). Zoecklein et al. (2008) evaluated Viognier grapes and resultant wines as a function of training system, including vertical shoot-positioned (VSP), Smart-Dyson (SD) and Geneva double curtain (GDC). Volatile compounds were analyzed using headspace solid-phase microextraction GC-MS. Fruit showed consistent differences in n-hexanol, linalool, α-terpineol, and β-damascenone concentrations among training systems. Both the SD and GDC systems produced higher fruit glycosides and free volatiles than the non-divided VSP. Webster et al. (1993) studied the relationship between vineyard nitrogen fertilization and the concentration of monoterpenes, higher alcohols and esters in Riesling wines, three to five years after bottling. They found that concentrations of higher alcohols, free and bound monoterpenes, and esters in wines produced from grapes from a vineyard nitrogen fertilization study showed significant differences. Sensory analysis showed wines produced from grapes with no nitrogen fertilization significantly differed in bouquet from those with 224 kg N/ha fertilization. Oliva et al. (2008) studied the effect of several fungicide residues (famoxadone, fenhexamid, fluquinconazole, kresoxim-methyl, quinoxyfen and trifloxystrobin) on the aroma composition of Monastrell red wines. They found all fungicide treatments significantly impacted wine aroma. The authors attributed this to an effect on the yeast fermentative activity.
8
g. Winery practices Reynolds et al. (2007) found that winery practices such as yeast strain selection and/or enzyme use may increase the varietal intensity of Muscat cultivars. Research on the effectiveness of commercial enzyme preparations, usually pectinases with β-glucosidase “side-activity,” in freeing bound forms from glycosidic precursors has met with both negative (Delcroix et al. 1994) and positive (Macaulay and Morris 1993) results. The impact of yeast strains and enzymes on varietal characteristics of wine remains a controversial subject (Reynolds et al. 2007). The contribution of different yeast strains on wine composition and sensory attributes has been documented (Antonelli et al. 1999, Reynolds et al. 2001). Reynolds et al. (2007) studied leaf removal and cluster thinning, as well as yeast strain and enzyme treatments on the berry and must composition and sensory attributes of Chardonnay musqué. The significant enological-viticultural treatment interactions observed suggest that both free and bound volatiles may be favored by certain combinations of yeast strain, enzyme, and viticultural treatment combinations, impacting the aroma and flavor profile of wines (Reynolds et al. 2007). h. Quantification using contribution index (C.I.) Zamuz et al. (2006) discussed a method to quantify the odor activity of a compound by determining its contribution index (C.I.). This value is calculated by dividing the concentration of the compound in the must into its contribution limit (20% perception threshold) (Versini et al. 1994). This C.I. allows the potential aroma contribution in the final wine to be evaluated. Aromas with C.I.s lower than 1.0 were not considered important aroma contributors. This research was conducted in Albariño musts from three different geographic areas for Galicia, Spain. The aromatic compounds isolated included α-terpineol, linalool, nerol, 2-phenylethanol, limonene and citronellol.
i. Analytical determination of monoterpenes
Acid hydrolysis (Williams et al. 1992), with its disadvantage of terpene rearrangements, and enzymatic hydrolysis (Rapp et al. 1985) are based on the analysis of monoterpenols released (Engel and Tressl 1983). Monoterpenols must first be isolated from the hydrolyzed sample, requiring at least two steps prior to GC analysis. GC-MS for determination of synthetic glycosides can be used to separate and identify monoterpenyl glycosides and to identify individual glycosides and their aglycones (Voirin et al. 1990).
2. C13-Norisoprenoids
Norisoprenoids have been reported in both white and red wines, including Madeira, Rioja, Grenache, Rieslings, Chardonnay, Chenin blanc, Shiraz, Cabernet Sauvignon, Sauvignon blanc and Pinot noir (Winterhalter and Rouseff 2002, de Freitas et al. 1999, Eggers et al. 2006, Fang and Qian 2006, Ferreira et al. 2002, Boido et al. 2003). Norisoprenoids have low odor perception thresholds and, therefore, high sensorial impact. The norisoprenoids can be formed by direct degradation of carotenoids such as β-carotene and neoxanthin, or they can be stored as glycoconjugates. Norisoprenoids identified in wine include TCH (2,2,6-trimethylcyclohexanone), β-damascenone, β-ionone, vitispirane, actinidol, TDN (1,1,6-trimethyl-1,2-dihydronaphthalene), Riesling acetal and TPB (4-(2,3,6-trimethylphenyl)buta-1,3-diene) (Mendes-Pinto 2009). With the exception of TCH, which is a C9-compound with a “rock-rose-

9
like” descriptor, found only in Ports, all norisoprenoids in wine are C13-compounds. TDN, found in aged Riesling wines, where concentrations can reach 200 µg/L, produces a potentially-negative quality in wine (Winterhalter and Rouseff 2002). In addition to the well-studied norisoprenoids, a newer compound has been described: 4-(2,3,6-trimethylphenyl)buta-1,3-diene (TPB) (Janusz et al. 2003, Cox et al. 2005). This compound, detected in Semillon, Chardonnay and Riesling wines, has a descriptor of “green or cut grass” at low concentrations and “pungent or chemical” when present in higher concentrations (Cox et al. 2005). The major carotenoids (85% of the total) are β-carotene and lutein, in the range of mg/kg; the remaining fraction is found at levels of µg/kg , including neochrome, neoxanthin, violaxanthin, luteoxanthin, flavoxanthin, lutein-5,6-epoxide and zeaxanthin, and cis-isomers of lutein and β-carotene (Marais et al. 1989, Mendes-Pinto et al. 2004, Razungles et al. 1987). The carotenoids that may be directly involved in the aroma and flavor of wine include β-carotene and neoxanthin. Lutein and violaxanthin may also contribute to aroma and flavor because they undergo breakdown reactions that may form norisoprenoid compounds (Wahlberg and Eklund 1998, Winterhalter and Rouseff 2002). a. Breakdown reactions of carotenoids Carotenoids in grapes are affected by several factors including plant variety, climatic conditions, stage of maturity, soil characteristics, and viticultural practices. These parameters combined impact the quality of wine (Falcão et al. 2007, Lee et al. 2007, Van Leeuwen et al. 2004). Carotenoids can be degraded by enzymatic or non-enzymatic reactions yielding norisoprenoids (Wahlberg and Eklund 1998, Winterhalter and Rouseff 2002). Norisoprenoids can be formed either by direct degradation of carotenoids or by glycosylated intermediates (Wahlberg and Eklund 1998, Winterhalter and Rouseff 2002). Those that are in the free fraction make up the C13 varietal aromas in grapes; glycoconjugated forms (bound fraction) are stored and can release their volatile aglycones during fermentation (Wahlberg and Eklund 1998, Winterhalter and Rouseff 2002). b. Aged wine In young wines, the aroma-producing norisoprenoids come directly from grapes or are released during fermentation, but wine storage conditions, especially temperature and oxygen, can affect the development of aroma and flavors in wines. The wine aging process, in oak and bottles, leads to the development of aroma properties, and has been the subject of study during the past two decades (Mendes-Pinto 2009). High oxygen intake and high temperatures stimulate the formation of norisoprenoids in wines, possibly causing the high levels of some norisoprenoids typically found in aged wines, especially in aged Rieslings (Winterhalter et al. 1990). c. Sun/shade exposure Light is the main factor in the biosynthesis and regulation of carotenoids (Goodwin et al. 1980, Winterhalter and Rouseff 2002, Young and Britton 1990, 1993). It seems that light promotes the increase of carotenoids before véraison, compared to shaded grapes; during maturity, grapes

10
exposed to sunlight show a decrease in carotenoids compared to shaded grapes (Oliveira et al. 2004, Razungles and Bayonove 1996, Winterhalter and Rouseff 2002). d. Stage of maturity Carotenoids start forming during the first stage of fruit formation and then degrade until the end of maturity (Baumes et al. 2002). This may be related to chemical and enzymatic degradation, or to bioconversion of these compounds into other compounds, for example, the formation of violaxanthin from β-carotene (Baumes et al. 2002, Oliveira et al. 2004). Carotenoids are generally concentrated in the skin of mature grapes at levels 2-3 times higher than in the pulp (Guedes de Pinho et al. 2001, Razungles et al. 1987). e. Soil characteristics and viticultural practices Some studies indicate that irrigation has less of an influence on carotenoid levels than the type of soil and its water retention capacity, showing that soil with low water retention capacity can result in an increase in carotenoid concentration (Oliveira et al. 2003). It was shown that water-deficit stress irrigation leads to changes in the organoleptic properties of grapes and may have an effect on the mRNA expression patterns in the grapes (Grimplet et al. 2007). Another study showed that different irrigation treatments affect the size of the berry, and levels of sugar and organic acids, therefore, directly impacting the growth of the plant and the maturation of the grape (Intrigliolo and Castel 2008). Because different light intensities are associated with a higher or lower degree of shading of the grapes in the canopy, it is possible that pruning techniques may have an impact on carotenoid levels (Mendes-Pinto 2009).
3. Sulfur compounds: S-cysteine conjugates/thiols
Highly-impactful odor compounds include sulfur compounds with thiol functions. They have been shown to participate in the aromas of certain grape varieties, especially Sauvignon blanc. They occur in grapes in S-cysteine conjugate form. The first S-cysteine thiol identified in Sauvignon blanc wines was 4-mercapto-4-methyl-pentan-2-one (Darriet et al. 1993). This molecule is extremely odorous with a smell of boxwood and broom; concentrations may reach 40 ng/L in Sauvignon blanc wines. Some sulfur compounds are present in must in S-cysteine conjugate form in larger quantities than the aromas they form in wine. The aromas are released during alcoholic fermentation, probably due to the action of a specific enzyme. Aromas vary in intensity depending on the S. cerevisiae yeast strain used (Conde et al. 2007). The S-cysteine conjugates were identified in Sauvignon blanc by Tominaga et al. (1998). Volatile thiols involved in the characteristic aroma of Sauvignon blanc wines include 4-mercapto-4-methylpentan-2-one (4MMP), 4-mercapto-4-methylpentan-2-ol (4MMPOH), 3-mercaptohexan-1-ol (3MH), 3-mercapto-3-methylbutan-1-ol (3MMB) and 3-mercaptohexyl acetate (A3MH) (Tominaga et al. 2000a). 4MMP and A3MH have a strong box-tree odor, 3MH has aromas of grapefruit and passion fruit, 4MMPOH, of citrus zest, and 3MMB, aromas of cooked leeks (Tominaga et al. 2000a). The detection level for 4MMP in a model solution is very low (0.8 ng/L). 4MMPOH has a detection threshold in a model solution of 55 ng/L and 3MH has a threshold of 60 ng/L (Peyrot des Gachons et al. 2005). These compounds are present in the aroma of wines of other varieties, including Petit Manseng (Peyrot des Gachons et al. 2002). Tominaga et al. (2000) identified these volatile thiols in Petit Manseng (and other white wines) whose aromas have been compared with that of Sauvignon blanc, or described using similar
11
terms. For example, Petit Manseng wines have been described as having grapefruit or passion fruit aromas and flavors, terms used to describe Sauvignon blanc wines. Only a small percentage of the precursors (P-) are transformed into aroma during fermentation. According to Peyrot des Gachons et al. (2005), the average level of transformation is 1.4% for P-4MMP, 3.0% for P-4MMPOH and 4.2% for P-3MH. a. Volatile thiols in Petit Manseng Tominaga et al. (2000) investigated the impact of volatile thiols on the aromas of wines, including Petit Manseng. The volatile thiols were extracted by the reversible combination of the thiols with p-hydroxymercuribenzoate and analyzed by GC-MS as described by Tominaga et al. (1998). Sweet wines were made from several harvest dates of late-harvest Petit Manseng grapes by picking overripe grapes that dried on the vines. They contained 3MMB, 3MH and A3MH, while 4MMP and 4MMPOH were not detectable. The 3MMB content was always below the odor perception threshold and, therefore, may have had no impact on aroma. Concentrations of 3MH may be as high as several µg/L. The wine from the first harvest had the highest 3MH content, therefore, 3MH may still contribute to the grapefruit aromas and flavors in Petit Manseng wines. The A3MH content may also be above the perception threshold but, because it gradually hydrolyzes, it is only detectable in young wines. These volatile thiols were always present in much higher concentrations in wines made from the first harvest. However, 2-furanemethanethiol, a highly-aromatic molecule with roasted coffee bean aromas, was present at higher concentrations in wines made from grapes picked later (Tominaga et al. 2000b). b. Localization in berry Peyrot des Gachons et al. (2002) studied the localization in the berry of S-cysteine conjugates. They found the contents of 4MMP and 4MMPOH precursors (P-4MMP and P-4MMPOH) were equivalent in the juice and skin, while the concentration of 3MH precursor (P-3MH) was almost eight times higher in the skin. Skin contact allowed a modest increase in the concentration of P-4MMP and P-4MMPOH, but resulted in a noticeable increase in P-3MH. These differences may be due to where P-4MMP and P-4MMPOH and the P-3MH are found in the berries. These results showed that skin contact can enrich the musts in P-3MH and requires long contact time between the juice and skins (18 hr). c. Yeast enhancement Monoterpenes and norisoprenoids exist in the berry in both free and bound forms but, in the absence of exogenous enzyme treatment, the bound form is only slightly hydrolyzed during alcoholic fermentation. In contrast, volatile thiols are almost completely absent in the grape and are released by the yeast during fermentation. Therefore the aroma of Sauvignon blanc wines depends on precursors present in the must (Peyrot des Gachons et al. 2002). The ability of Saccharomyces cerevisiae strains to enhance Sauvignon blanc aromas related to these sulfur-containing aroma compounds is variable. The same Sauvignon blanc must fermented by pure cultures of different yeast strains resulted in wines with different amounts of volatile sulfur aromas. Certain yeast strains (EG8, VL3c) release the largest quantities of 4MMP. Certain wild varieties of Saccharomyces bayanus have been shown to free the Sauvignon sulfur aromas. Natural hybrids between S. cerevisiae and S. bayanus var. uvarum have also been found. Wines

12
fermented by this hybrid strain contained higher amounts of 4MMP and 3MH compared to wines fermented by S. cerevisiae strain VL3c. (Dubourdieu et al. 2006). d. Tryptophanase S-cysteine conjugates can produce volatile thiols by cleaving the C-S linkage to cysteine. A β-lyase enzyme, such as tryptophanase, can catalyze this reaction. Peyrot des Gachons et al. (2005) developed a method to measure these precursors in Sauvignon blanc must. e. Nitrogen Chone et al. (2006) found that an increase in nitrogen supply in the vine leads to higher cysteine precursor levels in the grape. They also showed that a late addition of nitrogen at berry set led to a lower level of phenolic compounds and higher glutathione levels in white grapes. Nitrogen deficiency has been shown to decrease Sauvignon blanc aroma expression, because grapes contain fewer aroma precursors. In addition, more volatile thiols are lost during grape processing because of higher total phenolics and lower glutathione levels. Research by Peyrot des Gachons et al. (2005) involved monitoring S-cysteine conjugate precursors of three volatile thiols in Sauvignon blanc grapes during fruit ripening to study the impact of vine water and nitrogen status on the grape aroma potential in field conditions. Aroma potential was greatest in vines under mild water deficit and moderate nitrogen supply. Severe water stress and nitrogen deficiency seemed to limit aroma potential. These observations could be used in site selection for Sauvignon blanc (as well as Petit Manseng) and in optimizing irrigation and fertilization practices for these varieties (Peyrot des Gachons et al. 2005). Lacroux et al. (2008) investigated the impact of foliar nitrogen (prior to véraison), as well as foliar nitrogen and sulfur applications, on aromatic expression, vigor and susceptibility to rot in Sauvignon blanc. They found that wines made from vines with foliar nitrogen and sulfur applications contained more volatile thiols and glutathione. These results were confirmed by a tasting of wines produced with grapes from experimental plots. Foliar nitrogen fertilization alone (10 kg/ha of N) also increased Sauvignon blanc aromatic expression, but not as much as the foliar nitrogen and sulfur treatment combined. The authors concluded that foliar nitrogen and sulfur applications can enhance aromatic expression in Sauvignon blanc wines without an increase in vine vigor. Dufourcq (2006) also found that vines treated with foliar nitrogen and sulfur contained more volatile thiols and showed improved aromatics. Although the study was carried out on Sauvignon blanc vines, researchers noted that it is likely that foliar nitrogen, or foliar nitrogen and sulfur applications, would have similar effects on other varieties containing volatile thiols, such as Colombard, Riesling, Petit Manseng and Semillon. f. Glutathione and phenols The aromatic potential of grapes is also determined by glutathione and phenolic compounds. During the prefermentation processing of grapes, phenolic compounds can form quinones, especially when exposed to oxygen. These are very reactive molecules that can reduce precursors of volatile thiols in must and wines. Low phenolic content in Sauvignon blanc grapes limits the risk of aromatic compound loss, and also protects against oxidation. High glutathione content in
13
grapes is an important factor in aroma protection in Sauvignon blanc grapes (Lacroux et al. 2008). By limiting the formation of quinones during the various stages of winemaking in Sauvignon blanc, it is possible to stabilize their varietal aroma. It is necessary to minimize the level of phenolic compounds in musts and to protect them from oxidation (Chone et al. 2006).
4. Esters
Acetate esters contribute to wine aroma (Suomalainen 1971). Some of the factors affecting volatile acetate ester formation in wine fermentation were studied by Daudt and Ough (1973). The temperatures of fermentation that gave maximum formation were found to be 60-70°F for ethyl acetate, n-propyl acetate, and isoamyl acetate, and 50-60° F for isobutyl acetate. Ester formation also was influenced by yeast strain and grape variety. The composition of the juice contributes greatly to the total amounts of each ester formed (Daudt and Ough 1973). IV. Acid and Enzymatic Hydrolysis Glycoside hydrolysis may occur enzymatically through glucosidases or via acid hydrolysis (Francis et al. 1996, Günata et al. 1985, Williams et al. 1982). Enzymatic hydrolysis of disaccharide glycosides occurs as a two-step process. In the case of monoglucosides, the glucosidase acts directly (Dubourdieu et al. 1988). Acid hydrolysis cleaves glycosides of activated alcohols, producing a carbocation that may cause aroma and flavor changes (Sefton et al. 1996, Sefton 1998, Williams et al. 1982). Enzyme hydrolysis cleaves the glycosidic bond without changing the chemical structure of the aglycone (Sefton 1998). Therefore, enzymatic hydrolysis is sometimes preferred for the characterization of glycosidically-bound volatile compounds (Ugliano and Moio 2008). Conversely, acid-catalyzed hydrolysis involves cleavage of the ether linkage between the glucose and the aglycone, resulting in a reactive carbocation that may result in a variety of products (Sefton 1998, Skouroumounis and Sefton 2000). Although this means that acid hydrolysis products may not be directly diagnostic of the volatile composition of the precursors fraction (Williams et al. 1982), acid hydrolysis is important in formation of wine varietal aroma, especially during aging (Ugliano and Moio 2008). Williams et al. (1989) examined hydrolysates produced by glycosidase enzyme or pH 3.2 acid treatment of C18 reversed-phase isolates from juices of “non-floral” Vitis vinifera varieties. Chardonnay, Sauvignon blanc and Semillon grapes contained conjugated forms of monoterpenes, C13-norisopresoids, and shikimic acid-derived metabolites. The products from acid hydrolysis had sensory significance when assessed by a panel in a neutral wine medium. Ugliano and Moio (2008) studied the free and glycosidically-bound volatile compounds of Fiano grapes. The free volatile fraction was mostly characterized by the presence of several aliphatic alcohols, with small amounts of the monoterpenes linalool and geraniol, and traces of the norisoprenoid β-damascenone. The volatile fraction from either enzymatic or acid hydrolysis of juice glycosides contained compounds including terpenes, norisoprenoids, benzenoids, and aliphatic alcohols. Pathways of formation for these compounds during winemaking were also studied. Yeast-driven enzymatic hydrolysis of glycosides led to increased linalool and geraniol formation, while acid hydrolysis led to formation of terpinen-4-ol, TDN, β-damascenone, TPD and ethyl cinnamate. β-Damascenone is formed by acid-catalyzed hydrolysis (Skouroumounis et al. 1995), but not by enzyme-catalyzed hydrolysis of grape glycosides (Sefton et al. 1993).
14
Rocha et al. (2007) extracted free volatile components, using a liquid-liquid continuous method, and analyzed samples by GC-MS. The potential volatile compounds (PVC) were determined after a heat treatment, followed by an enzymatic treatment. The PVC fraction contained the compounds released by the enzymes from the glycosidically-linked components, plus the compounds produced by the heat treatment at the must pH (3.2), as well as compounds from the thermal degradation of sugars. Based on three varietal chemical groups (terpenoids, C13-norisoprenoids and aromatic alcohols) the volatile profile of four white Vitis vinifera varietals (Fernão Pires, Bical, Cerceal and Arinto) was determined. The four varietals had different volatile composition patterns (different components and different distributions between free and PVC forms). This suggests that winemaking should be developed specifically for the characteristics of each variety. Du et al. (2008) compared mild enzymatic hydrolysis and acidic hydrolysis of aroma precursors in Pinot noir grapes. The flavor precursors were isolated from Pinot noir grape must with C18 SPE columns, and then hydrolyzed either by Macer8 FJ enzyme in 0.2 M citric acid buffer, pH 3.1, at 45°C, or in 0.2 M citric acid buffer, pH 2.5, at 100°C. The aglycones were analyzed with SBSE (stir bar sorptive extraction) GC-MS. Results demonstrated that aglycone composition depended on hydrolysis conditions. Enzymatic hydrolysis generated many monoterpene alcohols, while mild acidic hydrolysis gave mostly neroloxide. The levels of the C13-norisoprenoids were proportional to hydrolysis time using enzymatic hydrolysis. Acidic hydrolysis resulted in more of the C13-norisoprenoid compounds.
1. Glycosidase activity in the grape
a. Enzymatic hydrolysis The hydrolysis of monoglucosides requires the action of β-glucosidase, while hydrolysis of disaccharide glycosides requires the sequential activity of an appropriate exoglycosidase to remove the outermost sugar residue, followed by a β-glucosidase to remove the remaining glucose (Günata et al. 1988). It was also shown that an endoglycosidase alone is able to hydrolyze this linkage and free the disaccharide and aglycone (Günata et al. 1998). Günata et al. (1990) demonstrated that the amounts of monoterpenols freed from their glucoside precursors can vary according to the enzyme used. The enzyme should have, besides an aglycone specificity, tolerance to low pH (3.0-3.5), to glucose (0.5 M in juice), to gluconolactone (Günata et al. 1989) and to ethanol (10-15% in wine) (Günata et al. 1990).
Favale et al. (2006) used solid-phase extraction (SPE), as proposed by Di Stefano (1996), and GC-MS to determine the qualitative and quantitative composition of free and glycosidically-bound aroma compounds in the skins of Cesanese d’Affile. Skins were incubated at three different temperatures for two time periods in a nitrogen-saturated environment. Data obtained suggested a low intracellular glycosidase activity in the skins. Therefore, the contribution of enzymatic activity of skins could play less of a role in the hydrolysis of glycosidically-bound compounds that take place during winemaking.
2. Yeast glycosidase activity
a. Non-Saccharomyces

15
Numerous reports have shown that several yeasts involved in vinification processes display β-glycosidase activity, and that this activity tends to be greater in non-Saccharomyces strains than in S. cerevisiae (Manzanares et al. 2000, McMahon et al. 1999, Riccio et al. 1999, Rosi et al. 1994, Strauss et al. 2001). Strains such as Debaryomyces castellii, D. hansenii, D. polymorphus, Kloeckera apiculata and Hansenula anomala, showed β-glycosidase activity. These indigenous species of non-Saccharomyces yeasts may contribute special characteristics to the wines (Ciani and Picciotti 1995). The activity of these enzymes has not been studied extensively and therefore their role on wine flavor is still not well understood (Lambrechts and Pretorius 2000, Mateo and Di Stefano 1997).
b. Saccharomyces cerevisiae During fermentation of V. vinifera cv. Moscato Giallo with mixed cultures of non-Saccharomyces and S. cerevisiae strains, an increase of approximately 30% in monoterpene concentrations was detected, based on the total amount of free and conjugated terpenes determined prior to and after fermentation (Carrau 2003). S. cerevisiae M522 (University of California, Davis) was used to evaluate factors affecting terpene production. It was demonstrated that the yeast assimilable nitrogen (YAN) and oxygen content of the fermentation medium influence monoterpene formation. High YAN concentration (400 compared with 180 mg N/L), stimulated fermentation rates and monoterpene formation. In addition, microaerobic, compared to anaerobic, conditions favored terpene formation during fermentation. Assimilable nitrogen, as well as oxygen, is known to regulate mevalonic acid and sterol formation and, hence, the concentration of intermediates, such as geranyl pyrophosphate which can act as a terpene precursor (Carrau et al. 2007). Ugliano et al. (2007) investigated the hydrolysis of grape glycosidic aroma precursors by S. cerevisiae during alcoholic fermentation in a synthetic grape juice (fructose 100g/L, glucose 100g/L, vitamins and microelements, pH 3.2) containing glycosides from Muscat grapes. Fermentation resulted in a large decline in glycosides, accompanied by a significant increase in the concentration of several compounds resulting from their hydrolysis. This indicates that S. cerevisiae can significantly influence the volatile composition of wine through the release of volatiles from glycosylated precursors.
3. Bacterial glycosidase activity in wine
After alcoholic fermentation in wines, malolactic fermentation can take place. Lactic acid bacteria (LABs), mainly Oenococcus oeni, are responsible, metabolizing malic acid to lactic acid and carbon dioxide (Davis et al. 1985, Henick-Kling 1993, Wibowo et al. 1985). Studies of β-glycosidase activity in one strain of O. oeni (Guilloux-Benatier et al. 1993) showed activity at a must pH of 3.5, retaining 78% of its maximum activity value. Researchers, working with cultures derived from 11 commercial preparations of O. oeni, reported the responses of β-glycosidase activity to enological pH values, and to glucose/fructose and ethanol concentrations (Grimaldi et al. 2000). Studies using various grape varieties and bacterial strains reported β-glycosidase activity (Barbagallo et al. 2004, Grimaldi et al. 2005, Mansfield et al. 2002, Ugliano et al. 2003). Enzyme activities of lactic acid bacteria could be proposed as a useful tool in winemaking for flavor liberation in wines.

16
V. Amino Acid Content
Some of the most important compounds of wine aroma are produced during alcoholic fermentation as secondary products of yeast metabolism. Several metabolic pathways impacting wine aroma formation have been studied, but less is known about the role of amino acids. Guitart et al. (1999) examined the relationships between the amino acid contents of musts and wines, made with Chardonnay grapes, and the volatile compounds formed during fermentation. They showed that when the musts had a high content of all the amino acids, more esters and fewer higher alcohols were formed. Wines high in ethyl esters, which produce fruity aromas, are derived from musts with the highest amino acid content. They found that levels of fusel alcohols and fatty isoacids of the wines are independent, or slightly anticorrelated, with the must amino acid content. VI. Analytical Component The determination of the volatile fraction is normally performed by gas chromatography (GC), a technique which has made great advances. However, it should be noted that, in the majority of the cases, determination by GC needs to be preceded by a prior stage of sample preparation. There are a number of different considerations and preparative techniques available, including the following:
• The volatility of the analytes: distillation processes and headspace techniques. • The solubility of the analytes in certain organic solvents: solvent extraction, liquid-liquid
extraction (LLE), supercritical fluid extraction (SFE), solid-phase extraction (SPE), ultrasound-assisted extraction (UAE), and microwave-assisted extraction (MAE).
• The adsorption and absorption of the analytes on a particular material: solid-phase extraction (SPE), solid-phase microextraction (SPME), stir-bar sorptive extraction (SBSE) and solid-phase dynamic extraction (SPDE) (Castro et al. 2008).
1. SPE Solid-phase extraction (SPE) can be directly applied to isolates and to concentrated volatile compounds from liquid samples. This technique is based on the selective retention of analytes, followed by elution using an appropriate solvent. The sorbents utilized are similar to the stationary phases in liquid chromatography, and can be grouped into polar, non-polar and ion-exchange types. The choice of the sorbent depends on the nature of the analyte. Silica, and polymeric sorbents such as styrene-divinylbenzene copolymers, are used routinely. The silica sorbents have a low loading capacity and a high consumption of solvents and time; they also may degrade certain analytes (Culleré et al. 2003). The second type, based on styrene-divinylbenzene polymers, have a greater loading capacity and more stability against extreme pH values (Culleré et al. 2003).
2. Electronic nose
Free volatiles may contribute directly to odor, while some non-volatile conjugates represent aroma precursors that may be released during winemaking and aging. The pool of free aroma components and their precursors increases rapidly in the advanced stage of fruit maturity referred to as engustment (Coombe and McCarthy 1997). Many winemakers sensorially and subjectively

17
evaluate juice aroma as a maturity gauge. Because of the difficulties associated with sensorial evaluation, studies have been conducted to demonstrate techniques for the evaluation of fruit maturity based on fruit volatiles (Zoecklein et al. 2007). The electronic nose is utilized in a variety of applications in the medical and food industries. It is, in part, a simulation of the human olfactory system, which can aid in decision-making when volatile compounds correlate with sample attributes. In the wine industry, the electronic nose has been suggested as a tool to monitor toasting homogeneity of oak barrels and for regional wine discrimination, among other applications. Zoecklein et al. (2007) evaluated the capacity of a conducting polymer-based electronic nose to monitor Cabernet Sauvignon fruit maturity by analyzing headspace volatiles. A hand-held Cyranose 320 with 32 polymer-based sensors was used; measurements were compared with physical and chemical indices frequently used to evaluate fruit maturity. These included berry weight, pH, Brix, titratable acidity, total phenols, color intensity, hue, total anthocyanins, and total and phenol-free glycosides. Cross-validation analysis indicated 91% of samples were correctly classified among the maturity groups based on physical and chemical data, compared to 100% and 98% based on laboratory and field electronic nose data measurements, respectively. This demonstrates the potential for this technology to be used as a rapid and objective tool for evaluating grape maturity, which may contribute to maximizing wine quality with minimum cost.
3. Solid-phase microextraction (SPME)
Solid-phase microextraction (SPME) is an extraction technique developed by Pawliszyn (1997). SPME is a fast, simple, solvent-free method for analysis of volatile compounds from liquid and solid samples. The technique combines extraction, concentration and chromatographic injection into one step. Due to the importance of volatile compounds to the aroma and flavor of wines, SPME combined with GC-MS can be a significant tool for wine research. This technique is based on the establishment of partition equilibria of the analytes between the matrix of the sample and a polymeric stationary phase, which covers a fused silica fiber. Only small volumes of sample are required. The device can be coupled easily to a gas chromatography system and, with some modifications, to a high performance liquid chromatography (HPLC) system (Castro et al. 2008). There are three basic types of solid-phase microextraction: direct extraction, headspace extraction, and extraction utilizing a protective membrane. Thermodynamics predict the effects produced by certain extraction conditions on the distribution of the analytes between the fiber and the matrix. These parameters include the polymeric coating of the fiber, extraction temperature and time, saline effect, pH of the sample, volume of the sample, volume of the headspace, agitation of the sample, and shape of the vial. The chemical nature of the analyte determines what type of phase is used in the extraction (Castro et al. 2008). Polydimethylsiloxane (PDMS) is a non-polar phase that has affinity for apolar compounds, although it can be utilized to extract moderately-polar compounds. Polyacrylate (PA) is a phase that is suitable for more-polar compounds. In addition to these phases, other coatings of more specific materials, and mixed phases that have complementary properties, have been developed, such as polydimethylsiloxane /polydivinylbenzene (Carbowax/DVB) and Carboxen/PDMS. These fibers, more polar than those of PA, are used for extracting more-polar compounds like
18
alcohols and ethers. Fibers of Carboxen/PDMS have a larger surface area and are suitable for the extraction of volatile organic compounds (VOCs) (Castro et al. 2008). The SPME device consists of a small fiber of fused silica (usually of 1 cm length and 0.11 mm internal diameter), normally coated with a polymeric phase. For protection, this fiber is mounted in a type of modified syringe or holder. The analytes are retained by the fiber until the system reaches equilibrium (Castro et al. 2008). Solid-phase microextraction is comprised of two stages: extraction and desorption. In the first stage, the sample is placed in a vial. The vial is sealed with a septum and a capsule. The needle of the syringe, with the fiber inside, perforates the septum. The fiber is brought into contact with the aqueous sample or with the headspace over the liquid. After a predetermined time, the fiber is withdrawn and inserted back into the needle and the syringe is inserted in the injector of an analytical instrument (GC or HPLC), where the analytes are desorbed thermally or by solution in the mobile phase, according to the instrument being used. This desorption stage takes 1-2 minutes to complete. In HPLC, the standard injector must be replaced by a special device (Castro et al. 2008). Several groups have studied the use of SPME-GC for analysis of wine volatiles. García et al. (1997) compared different fibers for recovery of a variety of compound classes. They later compared headspace SPME with direct sampling SPME for determination of terpenes and found higher responses using the headspace (HS) method (García et al. 1998). They also found that increasing temperature decreased the response of 3-decanol (internal standard) and had a complex effect on terpene response. Boninoa et al. (2003) utilized HS-SPME for the extraction of aroma compounds to study a Piedmont wine (Ruché) derived from a non-aromatic wine. They identified 59 primary aromatic compounds related to the typical flavor of Ruché. The skin of the grape berries was attributed as the main source of varietal aromatic precursors. The use of solid-phase extraction-GC and SPME-GC has allowed the characterization of the volatile composition of 23 monovarietal wines from 13 white and red grape varieties cultivated in the same area (Piñeiro et al. 2006). Other researchers have applied SPME to the monitoring of volatile compounds during wine fermentation (Mallouchos et al. 2002). Vas et al. (1998) compared immersion and headspace SPME with solvent extraction and found headspace SPME preferable for characterization of a wide range of wine aroma compounds. Whiton and Zoecklein et al. (2000) further studied the effects of sample matrix and sampling conditions on detection of wine aroma and flavor compounds of varying volatilities and functionalities. They reported that sampling time and temperature were important in controlling analyte response, and the effects vary for different compound classes and volatilities. Tests with model solutions containing a range of typical wine volatiles showed that increasing temperature and sampling time can increase sensitivity for higher boiling polar compounds, but decrease sensitivity for very volatile compounds. They noted that it is necessary for the analyst to be aware of the potential interactions of aroma compounds with other wine components, such as polyphenols, which can vary from one wine sample to another and affect quantitation (Whiton and Zoecklein et al. 2000). Another important aspect of the use of SPME for volatiles in wines is its application to the determination of terpenes and similar compounds. Peña et al. (2005) developed a method for the
19
analysis of certain terpenes in wine samples using SPME and GC-MS. The best results were obtained by direct immersion of the fiber using a sampling period of 15 minutes with constant magnetic stirring.
4. Glycosyl-Glucose Determination
Grape glycosides are, in part, an important source of varietal wine aroma and flavor. A positive correlation between the concentration of grape glycoconjugates and wine quality has been suggested (Abbott et al. 1993). Glycoside hydrolysis yields equimolar proportions of D-glucose and the aglycone, the former referred to as glycosyl-glucose (GG) (Zoecklein et al. 2000). A rapid method to assess the glycoconjugates was developed by Williams et al. (1995) in which glycosides are isolated by C18 solid-phase extraction (SPE), followed by hydrolysis and enzymatic determination of the released glucose. The method was further modified by Iland et al. (1996). Because the glycoside fraction in red grapes is dominated by glycosylated anthocyanins, Iland added a spectrophotometric measurement of anthocyanins, which is subtracted from the GG value to obtain an estimate of “red-free” GG. Zoecklein et al. (2000) also modified the GG method by performing the glycoside extraction at pH 13, so that the phenolic glycosides would be ionized and not retained by the sorbent. This phenol-free (PFGG) measurement is intended to give a better estimate of the pool of aroma and flavor precursors (Whiton and Zoecklein 2002). Whiton and Zoecklein (2002) found that the total GG method using C18 sorbent material exhibited poor recoveries of benzenoid glycosides. This is a particular problem for low-terpene grape varieties. The recoveries for the phenol-free GG method were satisfactory for alkyl and benzenoid glycosides. This indicates that the PFGG method may be better suited to determine the pool of potential aroma and flavor compounds in low-terpene varieties. They also modified the PFGG method to a 96-well microplate format which showed comparable results to the standard column format (Whiton and Zoecklein 2002). Schneider et al. (2004) developed a fast method using Fourier-transform infrared (FTIR) spectrometry and chemometric techniques for grape-aroma glycoconjugate analysis. Abbott et al. (1993) and Williams et al. (1995) proposed that the determination of GG provides an indirect measure of the total pool of glycosidically-bound secondary metabolites, some of which are aroma and flavor precursors. The determination of total GG measures all grape glycosides including aliphatic residues, monoterpenes, sesquiterpenes, norisoprenoids, and phenolic compounds (Zoecklein et al. 2000). Although phenolic glycosides are important wine color and structural components, their impact on aroma and flavor is not believed to be substantial (Zoecklein et al. 2000). Williams et al. (1996) suggested an additional determination that would, in part, eliminate phenolic glycosides to produce a phenol-free GG. Zoecklein et al. (1996) reported use of polyvinylpolypyrrolidone (PVPP) as a means of removing a significant proportion of phenolic glycosides to produce a phenol-free GG measurement. In a study by Zoecklein et al. (2000), methods of isolating phenol-free glycosides were evaluated and compared. Phenol-free glycoside fractions were obtained by three isolation methods: (1) the addition of polyvinylpolypyrrolidone (PVPP), (2) isolation at pH 10.0 using C18 solid phase extraction cartridges, or (3) isolation at pH 13.0 using Oasis™ hydrophilic-lipophilic balance

20
(HLB) extraction cartridges. Glycoside separation using the Oasis cartridges reduced the phenol-free glycoside fraction in Chardonnay juice and wines by an average of 49.7% compared to 33.6% using C18. Reversed-phase silica gel has been found to be a particularly suitable adsorbent for the isolation of glycosidic terpenes (Williams 1993). The commercial availability of this adsorbent in uniform, prepacked cartridges was an additional advantage in development of the isolation step. A method has been proposed to extract glycosylated precursors from grape juices by microwaves (Bureau et al. 1996). This method was compared to the method using a column of Amberlite XAD-2 resin. Although a further purification of the extracts was required, this method provided the advantages of speed, ease of extraction and the possibility of extracting berries without deseeding or crushing. VII. Sensory Component Mirarefi et al. (2004) examined Chardonel, a promising white hybrid in the eastern U.S. wine industry, by using sensory profiling. For the sensory profiling of Chardonel wines, a combined form of the Spectrum™ Method (Lawless and Heymann 1998, Meilgaard et al. 1999) and Quantitative Descriptive Analysis® (Stone et al. 1974) was used. The objectives of the study were to develop descriptive terms for Chardonel wines and to characterize twelve Chardonel wines from different Midwestern states. Thirteen trained panelists described the aroma, flavor-by-mouth, texture/mouthfeel and aftertaste characteristics. Analysis of variance (ANOVA) results revealed that wines were a significant source of variation for 13 of the 23 attributes used. These 13 attributes were used to conduct cluster analysis and principal component analysis (PCA). Two major clusters were observed by cluster analysis. The defined and referenced sensory descriptive terms for Chardonel wines developed in this study could be used to standardize the future sensory analysis of Chardonel and other eastern U.S. wines. Some recommendations by the authors for future research include (1) conduct correlative gas chromatography (GC-O) instrumental/sensory data analysis and sensory panel analysis, using the same panel for the two analyses to allow the correlation of attributes developed to key chemical compounds, (2) use multivariate statistical methods to aid the selection process of the initial attributes generated during the panel training to eliminate nonsignificant attributes early in the study, and (3) correlate expert descriptive terms and consumer-generated terms for wines to scientific and analytical terms in order to gain a better understanding of how experts and regular consumers assess wines. Additional studies containing a similar lexicon development process to the Mirarefi study can be found in the descriptor lexicons developed for peanuts, warmed-over flavor in beef, pond-raised catfish, and cheddar cheese (Drake et al. 2001, Johnsen 1986, Johnsen et al. 1987). In a study by Abbott et al. (1991), volatile components liberated by hydrolysis of C18 reversed phase isolates from Vitis vinifera cv. Shiraz juice were evaluated by sensory descriptive analysis. The isolates were hydrolyzed at pH 3.2 or by treatment with a non-selective glycosidase enzyme. For both duo-trio difference tests and descriptive analyses, the precursor hydrolysates were presented to the panel in a neutral base Shiraz wine at a concentration equivalent to that at which the precursor glycosides were present in the original juice. The study indicated that Shiraz grapes of high quality, when compared to grapes of lesser quality, yield a greater concentration of
21
volatiles as enzyme-liberated products, and a greater number of volatiles deconjugated by acid hydrolysis of the respective precursor fractions (Abbott et al. 1990). Previous studies of the sensory properties of precursor hydrolysates from non-floral grapes have shown that only the acid hydrolysates could be detected when these were back-added to a base wine (Williams et al. 1989). Products given by glycosidase hydrolysis from Chardonnay (Noble et al. 1987, Williams et al. 1989) and from Sauvignon blanc and Semillon were not detectable when assessed at a similar concentration at which the precursor glycosides occurred in the original wine. In contrast, most of the Shiraz samples examined by Abbott et al. (1991) gave both acid and enzyme hydrolysates with sensory properties detectable at single strength in a base wine. The hydrolysis of glycoconjugates mainly by acids, enzymes or while wine is aging, can yield odor-active aglycones such as terpenes, C13-norisoprenoids, benzene derivatives, and aliphatic alcohols (Günata et al. 1985, Ribéreau-Gayon et al. 2000) that are not always present in all V. vinifera varieties. These compounds play a key role in the differentiation of the wines according to the different grape varieties used for winemaking (Günata et al. 1985). However, not all compounds contribute to the same extent to wine aroma. In fact, if the concentration/olfactory threshold ratio of each compound known as the “odor activity value” (OAV) is greater than one, this allows estimating the contribution of each compound to the wine aroma. According to Guth (1997) this concept is, therefore, necessary to quantify the levels of flavor differences between wines obtained from the different grape varieties or origins.

22
IX. LITERATURE CITED Abbott, N.A., B.G. Coombe, and P.J. Williams. 1991. The contribution of hydrolyzed flavor precursors to quality differences in Shiraz juice and wines: an investigation by sensory descriptive analysis. Am. J. Enol. Vitic. 42:167-174. Abbott, N.A., B.G. Coombe, M.A. Sefton, and P.J. Williams. 1990. Secondary metabolites of Shiraz grapes as an index of table wine quality. In Proceedings of the Seventh Australian Wine Industry Technical Conference, Adelaide, South Australia. P.J. Williams, D. Davidson, and T.H. Lee (eds.), pp. 117-120. Australian Industrial Publishers, Adelaide. Abbott, N.A., P.J. Williams, and B.G. Coombe. 1993. Measure of potential wine quality by analysis of glycosides. In Proceedings of the Eighth Australian Wine Industry Technical Conference. C.S. Stockley, R.S. Johnstone, et al. (eds.), pp. 72-25. Winetitles, Adelaide, South Australia. Adam, K.P., R. Thiel, and J. Zapp. 1999. Incorporation of 1-[1-13C] deoxy-D-xylose in chamomile sesquiterpenes. Arch. Biochem. Biophys. 369:127-132. Antonelli, A., L. Castellari, C. Zambonelli, and A. Carnacini. 1999. Yeast influence on volatile composition of wines. J. Agric. Food Chem. 47:1139-1144. Arigoni, D., S. Sagner, C. Latzel, W. Eisenreich, A. Bacher, and MH. Zenk. 1997. Terpenoid biosynthesis from 1-deoxy-D-xylulose in higher plants by intramolar skeletal rearrangement. Proc. Nat. Acad. Sci. USA 94:10600-10605. Barbagallo, R.N., G. Spagna, R. Palmeri, and S. Torriani. 2004. Assessment of β-glucosidase activity in selected wild strains of Oenococcus oeni for malolactic fermentation. Enzyme Microb. Technol. 34:292-296. Baumes, R., J. Wirth, S. Bureau, Y. Günata, and A. Razungles. 2002. Biogeneration of C13-norisoprenoid compounds: experiments supportive for an apo-carotenoid pathway in grapevines. Anal. Chim. Acta. 458:3-14. Bayonove, C., R. Cordonnier, and R. Ratier. 1971. Recherches sur l’aroma du Muscat. Etude de la fraction terpenique. Ann. Technol. Agric. 20:347-355. Bochar, D.A., J.A. Friesen, C.V. Stauffacher, and V.W. Rodwell. 1999. Isoprenoids including steroids and carotenoids. In Comprehensive Natural Product Chemistry. D.E. Cane (ed.), pp. 15-44. Pergamon Press, Tarrytown, NY. Boido, E., A. Lloret, K. Medina, F. Carrau, and E. Dellacassa. 2002. Effect of β-glycosidase activity of Oenococcus oeni on the glycosylated flavor precursors of Tannat wine during the malolactic fermentation. J. Agric. Food Chem. 50:2344-2349. Boido, E., A. Lloret, K. Medina, L. Farina, F. Carrau, G. Versini, and E. Dellacassa. 2003. Aroma composition of Vitis vinifera cv. Tannat: the typical red wine from Uruguay. J. Agric. Food Chem, 51:5408-5413.

23
Boninoa, M., R. Schellinoa, C. Rizzib, R. Aigottic, C. Delfinia, and C. Baiocchic. 2003. Aroma compounds of an Italian wine (Ruché) by HS–SPME analysis coupled with GC–ITMS. Food Chem. 80:125-133. Boss, P.K., and C. Davies. 2001. Molecular biology of sugar and anthocyanin accumulation in grape berries. In Molecular Biology and Biotechnology of the Grapevine, D.A. Roubelakis-Angelakis (ed.), pp. 1-33. Luwer Academic Publishers, Dordrecht, Netherlands. Boulton, R.B., V.L. Singleton , L.F. Bisson, and R.E. Kunkee. 1996. Principles and Practices of Winemaking, Chapman and Hall, NY. Bureau, S.M., A.J. Razungles, R.L. Baumes, and C.L. Bayonove. 1996. Glycosylated flavor precursor extraction by microwaves from grape juice and grapes. J. Food Sci. 61:557-560. Carrau, F.M. 2003. Characterization of yeast in relation to the ability to utilize nitrogen – studies of aroma compounds. PhD thesis, Food Science and Technology Department, Universidad de la Republica, Uruguay, p. 312. Carrau, F.M., E. Boido, and E. Dellacassa. 2007. Terpenoids in grapes and wines: origin and micrometabolism during the vinification process. Nat. Prod. Commun. 3: 577-592. Castro, R., R. Natera, E. Durán, and C. García-Barroso. 2008. Application of solid phase extraction techniques to analyse volatile compounds in wines and other enological products. Eur. Food Res. Technol. 228:1-18. Cheng, A.Z., Y.G. Lou, Y.B. Mao, S. Lu, L.J. Wang, and X.Y. Chen. 2007. Plant terpenoids: Biosynthesis and ecological functions. J. Integ. Plant Biol. 49:179-186. Chone, X., V. Lavigne-Cruège, T. Tominaga, C. Van Leeuwen, C. Castagnede, C. Saucier, and D. Dubourdieu. 2006. Effect of vine nitrogen status on grape aromatic potential: flavor precursors (S-cysteine conjugates), glutathione and phenolic content in Vitis vinifera L. cv. Sauvignon blanc grape juice. J. Int. Sci. Vigne Vin. 40:1-16. Ciani, M., and G. Piccioti. 1995. The growth kinetics and fermentation behavior of some non-Saccharomyces yeast associated with winemaking. Biotechnol. Lett. 17:1247-1250. Conde, C., P. Silva, N. Fontes, A.C.P. Dias, R. M. Tavares, M. Sousa, A. Agasse, S. Delrot, and H. Geros. 2007. Biochemical changes throughout grape berry development and fruit and wine quality. Food 1:1-22. Coombe, B.G. 1992. Research on development and ripening of the grape berry. Am. J. Enol. Vitic. 43:101-110. Coombe, B.G., and P.G. Iland. 1987. Grape berry development. In Proceedings of the 6th Australian Wine Industry Technology Conference, 14-17 July, Adelaide, South Australia. T. Lee (ed.), pp. 50-54. Australian Industrial Publishers, Adelaide, S. Australia. Coombe, B.G. and M.G. McCarthy. 1997. Identification and naming of the inception of aroma development in ripening grape berries. Aust. J. Grape Wine Res. 3:18-20.
24
Coombe, B.G., M. Bovio, and A. Schneider. 1987. Solute accumulation by grape pericarp cells V. Relationship to berry size and the effects of defoliation. J. Exp. Bot. 38:1789-1798. Cox, A., G.K. Skouroumounis, G. M. Elsey, M.V. Perkins, and M.A. Sefton. 2005. Generation of (E)-1-(2,3,6-trimethylphenyl)buta-1,3-diene from C13-norisoprenoid precursors. J. Agric. Food Chem. 53:6777-6783. Culleré, L., M. Aznar, J. Cacho, and V. Ferreira. 2003. Fast fractionation of complex organic extracts by normal-phase chromatography on a solid-phase extraction polymeric sorbent. Optimization of a method to fractionate wine flavor extracts. J. Chromatogr. A 1017:17-26. Darriet, P., T. Tominaga, E. Demole, and D. Dubourdieu. 1993. Evidence of the presence of a 4-mercapto-4-methylpentan-2-one precursor in Vitis vinifera Sauvignon blanc grape variety. C. R. Hebd. Seances Acad. Sci., Ser. III 316:1332-1335. Daudt, C.E., and C.S. Ough. 1973. Variations in some volatile acetate esters formed during grape juice fermentation. Effects of fermentation temperature, SO2 , yeast strain and grape variety. Am. J. Enol. Vitic. 24:130-135. Davis, C., N.F. Silveira, and G.H. Fleet. 1985. Occurrence and properties of bacteriophages of Leuconostoc oenos in Australian wines. Appl. Environ. Microbiol. 50:872-876. De la Calle García, D., M. Reichenbächer, K. Danzer, C. Hurlbeck, C. Bartzsch and K.-Heinz Feller. 1998. Use of solid-phase microextraction-capillary-gas chromatography (SPME-CGC) for the varietal characterization of wines by means of chemometrical methods.Fresenius J Anal Chem. 360:784–787 De la Calle García, D., M. Reichenb cher, K. Danzer, C. Hurlbeck, C. Bartzsch and K.H. Feller. 1997. Investigations on wine bouquet components by solid-phase microextration -capillary gas chromatography (SMPE-CGC) using different fibers. J. High Resol. Chromatogr. 20:665–668. De Freitas, V.A.P., P.S. Ramalho, Z. Azevedo, and A. Macedo. 1999. Role of polyphenols in copper complexation in red wines. J. Agric. Food Chem. 47:4327-4331. Delcroix, A., Z. Günata, J.C. Sapis, J.M. Salmon, and C. Bayonove. 1994. Glycosidase activities of three enological yeast strains during winemaking: effect on the terpenol content of Muscat wine. Am. J. Enol. Vitic. 45:291-296. Di Stefano, R. 1996. Metodi chimici nella caratterizzazione varietale. Gli aroma. Corso internaz. Di Ampelografia. Conegliano. 3-5 Settembre. Dimitriadis, E., and P.J. Williams. 1984. The development and use of a rapid analytical technique for estimation of free and potentially volatile monoterpene flavorants of grapes. Am. J. Enol. Vitic. 35:66-71. Drake, M.A., S.C. McIngvale, P.D. Gerard, K.B. Cadwallader, and G.V. Civille. 2001. Development of a descriptive language for cheddar cheese. J. Food Sci. 66:1422-1427.

25
Du, X.F., C.R. Ou, and M. Qian. 2008. Comparison of mild enzymatic hydrolysis and acidic hydrolysis on monoterpenoic and norisoprenoidic glycoconjugates in Pinot noir grapes. Am. J. Enol. Vitic. 59:332A Dubourdieu, D.P., P. Darriet, C. Oliver, J.N. Boidron, and P. Ribereau-Gayon. 1988. Role of the yeast Saccharomyces cerevisiae in enzymatic hydrolysis of terpenic heterosides of grape juice. Comptes rendus de séances de l’academie des Sciences. 3:489-493. Dubourdieu, D., T. Tominaga, I. Masneuf, C. Peyrot des Gachons, and M.L. Murat. 2006. The role of yeasts in grape flavor development during fermentation: the example of Sauvignon blanc. Am. J. Enol. Vitic. 57:81-88. Dudareva, N., F. Negre, D.A. Nagegowda, and I. Orlova. 2006. Plant volatiles: Recent advances and future perspectives. Handbook of Environmental Chemistry, volume 5: Water Pollution, T25. D. Barceló and A.G. Kostianoy (eds.), pp. 417-440. Springer -Verlag GmbH, Heidelberg, Germany. Dufourcq, T. 2006 Incidences du climat, du sol, se la date de recolte sur le potential aromatique du cepage Colombard en Gascogne. In Proceedings of the VIth International Terroir Congress. Bordeauz-Montpellier, 3-7 July. pp. 391-395. Syndicat Viticole des Coteaux du Languedoc, France. Eggers, N.J., K. Bohna, and B. Dooley. 2006. Determination of vitispirane in wines by stable isotope dilution assay. Am. J. Enol. Vitic. 57:226-232. Engel, K.H., and R. Tressl. 1983. Formation of aroma components from nonvolatile precursors in passion fruit. J. Agric. Food Chem. 31:998-1002. Enzell, C. 1985. Biodegradation of carotenoids - an important route to aroma compounds. Pure Appl. Chem. 57:693-700. Eschenbruch, R., R.E. Smart, B.M. Fisher, and J.G. Whittles. 1987. Influence of yield manipulations on the terpene content of juices and wines of Müller-Thurgau. In Proc. 6th Austral. Wine Ind. Tech. Conf., 14-17 July, 1986, Adelaide, South Australia. T. Lee (ed.), pp. 89-93. Australian Industrial Publishers, Adelaide, S. Australia. Falcão, L.D., G. de Revel, M.C. Perello. A. Moutsiou, M.C. Zanus, and M.T. Bordignon-Luiz. 2007. A Survey of Seasonal Temperatures and Vineyard Altitude Influences on 2-Methoxy-3-isobutylpyrazine, C13-Norisoprenoids, and the Sensory Profile of Brazilian Cabernet Sauvignon Wines. J. Agric. Food Chem. 55:3605-3612.
Fang, Y., and M.C. Qian. 2006. Quantification of selected aroma-active compounds in Pinot noir wines from different grape maturities. J. Agric. Food Chem. 54: 8567-8573. Favale, S., P. Tamborra, A. Farofolo, M.C. Comandini, and G. Ciolfi. 2006. Varietal aromatic compounds in berry skins of Cesanese d’Affile: glycosidase activity in skins and evolution during time in different conditions of conservation. Riv. Vitic. Enol. 4:15-22.

26
Ferreira, V., N. Ortin, A. Escudero, R. Lopez, and J. Cacho. 2002. Chemical characterization of the aroma of Grenache rosé wines: aroma extract dilution analysis, quantitative determination, and sensory reconstitution studies. J. Agric. Food Chem. 50:4048-4054. Francis, I.L., A.C. Noble, and P.J. Williams. 1996. The sensory properties of glycosidic flavor precursors from Cabernet Sauvignon and Merlot grapes. In Proceedings of the Ninth Australian Wine Industry Technical Conference, Adelaide, South Australia, 16-19 July 1995. C.S. Stockley et al. (eds.), pp. 87-90. Winetitles, Adelaide. Gershenzon, J., and W. Kreis. 1999. Biochemistry of terpenoids: Monoterpenes, sesquiterpenes, diterpenes, sterols, cardiac glycosides and steroid saponins. In Biochemistry of Plant Secondary Metabolism. M. Wink (ed.), pp. 222-299. CRC Press, Boca Raton, FL. Goodwin, T.W. 1980. The biochemistry of the carotenoids, plants. Vol 1. Chapman and Hall, London, UK. Grimaldi, A., H. McLean, and V. Jiranek. 2000. Identification and partial characterization of glycosidic activities of commercial strains of the lactic acid bacterium, Oenococcus oeni. Am. J. Enol. Vitic. 51:362-369. Grimaldi, A., E. Bartowsky, and V. Jiranek. 2005. A survey of glycosidase activities of commercial wine strains of Oenococcus oeni. Int. J. Food Micro. 105:233-244. Grimplet, J., L.G. Deluc, R. Tillett, M.D. Wheatley, K.A. Schlauch, G.R. Cramer, and J.C. Cushman. 2007. Tissue-specific mRNA expression profiling in grape berry tissues. BMC Genomics. 8:187-208. Guedes de Pinho, P., A.C. Silva Ferreira, M. Mendes-Pinto, J.G. Benitez, and A.T. Hogg. 2001. Determination of carotenoid profiles in grapes, musts, and fortified wines from Douro varieties of Vitis vinifera. J. Agric. Food Chem. 49:5484-5488. Guilloux-Benatier, M., H.S. Son, S. Bouhier, and M. Feuillat. 1993. Activites enzymatiques glycosidases et peptidase chez Leuconostoc oenos au cours de la croissance bacterienne. Influence des macromolecules de levures. Vitis 32:51-57. Guitart, A., P. Hernández Orte, V. Ferreira, C. Pena, and J. Cacho. 1999. Some observations about the correlation between the amino acid content of musts and wines of the Chardonnay variety and their fermentation aromas. Am. J. Enol. Vitic. 50:253-258. Günata, Y.Z., C. Bayonove, R. Baumes, and R. Cordonnier. 1985. Extraction and determination of free and glycosidically bound fractions of some grape aroma constituents. J. Chromatogr. A 331:83-90. Günata, Y.Z., S. Bitteur, J.M. Brillouet, C.L. Bayonove, and R.E. Cordonnier. 1988. Sequential enzymatic hydrolysis of potentially aromatic glycosides from grapes. Carbohydr. Res. 184:139-149. Günata, Y.Z., C. Biron, J.C. Sapis, and C. Bayonove. 1989. Glycosidase activities in sound and rotten grapes in relation to hydrolysis of grape monoterpenyl glycosides. Vitis 28:191-197.

27
Günata, Y.Z., C.L. Bayonove, C. Tapiero and R.E. Cordonnier. 1990. Hydrolysis of grape monoterpenyl β-D-glucosides by various β-glucosidases. J. Agric. Food. Chem. 38: 1232-1236. Günata, Y.Z., C. Blondeel, M.J. Vallier, J.P. Lepoutre, J.C. Sapis, and N. Watanabe. 1998. An endoglycosidase from grape berry skin of cv. M. Alexandria hydrolyzing potentially aromatic disaccharide glycosides. J. Agric. Food Chem. 46:2748-2753. Guth, H., 1997. Identification of character impact odorants of different white wine varieties. J. Agric. Food Chem. 45: 3022-3026. Henick-Kling, T. 1993. Malolactic fermentation. In Wine, Microbiology and Biotechnology. G.H. Fleet (ed.), pp. 289-326. Harwood Academic Publishers, Switzerland. Hunter, J.J., J. Volschenk, and G.W. Fouche. 2004. Composition of Sauvignon blanc grapes as affected by pre-véraison canopy manipulation and ripeness level. S. Afr. J. Enol. Vitic. 25:13-18. Iland, P.G., W. Cynkar, I.L. Francis, P.J. Williams and B.G. Coombe. 1996. Optimisation of method for the determination of total and red-free glycosyl-glucose in black grape berries of Vitis vinifera. Austral. J. Grape Wine Res. 2:171-178. Intrigliolo, D.S., and J.R. Castel. 2008. Effects of irrigation on the performance of grapevine cv. Tempranillo in Requena, Spain. Am. J. Enol. Vitic. 59:30-38. Janusz, A., D.L. Capone, C.J. Puglisis, M.V. Perkins, G.M. Elsey, and M.A. Sefton. 2003. (E)-1-(2,3,6-trimethylphenyl)buta-1,3-diene: a potent grape-derived odorant in wine. J. Agric. Food Chem. 51:7759-7763. Ji, T., and I.E. Dami. 2008. Characterization of free flavor compounds in Traminette grape and their relationship to vineyard training system and location. J. Food Sci. 73:C262-267. Johnsen, P.B. 1986. A lexicon of peanut flavor descriptors. U.S. Dept. Agriculture, Agricultural Research Service Publication ARS 52:3-7. Johnsen, P.B., G.V. Civille, and J.R. Vercellotti. 1987. A lexicon of pond-raised catfish flavor descriptors. J. Sensory Stud. 2:85-91. Kozina, B., M. Karoglan, S. Herjavec, A. Jeromel, and S. Orlic. 2008. Influence of basal leaf removal on the chemical composition of Sauvignon blanc and Riesling wines. J. Food Environ. 6: 28-33. Lacroux, F., O. Tregoat, C. Van Leeuwen, A. Pons, T. Tominaga, V. Lavigne-Cruège, and D. Dubourdieu. 2008. Effect of foliar nitrogen and sulfur application on aromatic expression of Vitis vinifera L. cv. Sauvignon blanc. J. Int. Sci. Vigne Vin. 42:125-132. Lambrechts, M.G., and I.S. Pretorius. 2000. Yeast and its importance to wine aroma – A review. S. Afr. J. Enol. Vitic. 21:97-129.

28
Lawless H.T., and H. Heymann. 1998. Sensory evaluation of food principles and practice. Kluwer Academic Publishers, New York. Lee, S.H., M.J. Seo, J.P. Cotta, D.E. Block, N.K. Dokoozlian, and S.Ebeler. 2007. Vine microclimate and norisoprenoid concentration in Cabernet Sauvignon grapes and wines. Am. J. Enol. Vitic. 58:291-301. Luan, F., and M. Wüst. 2002. Differential incorporation of 1-deoxy-D-xylulose into (3S)-linalool and geraniol in grape berry exocarp and mesocarp. Phytochem. 60:451-459. Maarse, H. 1993. Food flavors, ingredients and composition; developments in food science, Flavour Fragr. J. 9:90-91. Macaulay, L.E., and J. R. Morris. 1993. Influence of cluster exposure and winemaking processes on monoterpenes and wine olfactory evaluation of Golden Muscat. Am . J. Enol. Vitic. 44:198-204. Mallouchos A. , M. Komaitis , A. Koutinas , and M. Kanellaki. 2002. Investigation of volatiles evolution during the alcoholic fermentation of grape must using free and immobilized cells with the help of solid phase microextraction (SPME) headspace sampling. J. Agric. Food Chem. 50:3840-3848. Manitto, P. 1980. Biosynthesis of Natural Products. Ellis Horwood, Chichester. Mansfield, A.K., B.W. Zoecklein, and R.S. Whiton. 2002. Quantification of glycosidase activity in selected strains of Brettanomyces bruxellensis and Oenococcus oeni. Am. J. Enol. Vitic. 53:303-306. Manzanares, P., V. Rojas, S. Genoves, and S. Valles. 2000. A preliminary search for anthocyanin-β-D-glucosidase activity in non-Saccharomyces wine yeasts. Int. J. Food Sci. Technol. 35:95-103. Marais, J., C.J. van Wyk, and A. Rapp. 1989. Flavors and Off-flavors. In Proc. 6th Int. Flavor Conference, Rethymnon, Crete, Greece. G. Charalambous (ed.), pp. 71-85. Elsevier, Amsterdam. Marais, J., J.J. Hunter, and P.D. Haasbrock. 1999. Effect of canopy microclimate, season and region on Sauvignon blanc grape composition and wine quality. S. Afr. J. Enol. Vitic. 20:19-30. Marinos, V.A., M.E. Tate, and P.J. Williams. 1994. Protocol for FAB MS/MS characterization of terpene disaccharides of wine. J. Agric. Food Chem. 42:2486-2492. Mateo, J.J., and R. Di Stefano. 1997. Description of the β-glucosidase activity of wine yeast. Food Microbiol. 14:583-591. Mateo, J.J., and M. Jiménez. 2000. Monoterpenes in grape juice and wines. J. Chromatogr. A 881:557-567. McCarthy, M.G., and B.G. Coombe. 1985. Water status and winegrape quality. Acta Hortic. 171:447-456.
29
McMahon, H., B.W. Zoecklein, K. Fugelsang, and Y. Jasinski. 1999. Quantification of glycosidase activities in selected yeast and lactic acid bacteria. J. Ind. Microbiol. Biotechnol. 23:198-203. Meilgaard M., G.V. Civille, and B.T. Carr. 1999. Sensory evaluation techniques, 3rd edition. CRC Press, Boca Raton, Fla. Mendes-Pinto, M.M. 2009. Carotenoid breakdown products – the norisoprenoids in wine aroma. Arch. Biochem. Piophys. 483:236-245. Mendes-Pinto, M.M., A.C. Silva Ferreira, M.B.P.P. Oliveira, and P. Guedes de Pinho. 2004. Evaluation of some carotenoids in grapes by reversed- and normal-phase liquid chromatography: a qualitative analysis. J. Agric. Food Chem. 52:3182-3188. Mirarefi, S., S.D. Menke, and S.Y. Lee. 2004. Sensory profiling of Chardonel wine by descriptive analysis. J. Food Sci. 69: S211-S217. Noble, A.C., C.R. Strauss, P.J. Williams, and B. Wilson. 1987. Sensory evaluation of non-volatile flavor precursors in wine. In Flavor Science and Technology: Proceedings of the 5th Weurman Flavor Research Symposium. M. Martens, G.A. Dalen, and H. Russwurm Jr. (eds.), pp. 389-390. John Wiley and Sons, New York. Oliva, J., A. Zalacain, P. Paya, M. R. Salinas, and A. Barba. 2008. Effect of use of recent commercial fungicides (under good and critical agricultural practices) on the aroma composition of Monastrell red wines. Anal. Chim. Acta. 617:107-118. Oliveira, C., A.C. Silva Ferreira, M.M. Mendes-Pinto, T. Hogg, F. Alves, and P. Guedes de Pinho. 2003. Carotenoid compounds in grapes and their relationship to plant water status. J. Agric. Food Chem. 51:5967-5971. Oliveira, J.M., I.M. Araugo, O.M. Pereira, J.S. Main, A.J Amaral, and M.O. Main. 2004. Characterization and differentiation of five “Vinhos Verdes” grape varieties on the basis of monoterpenic compounds. Anal. Chim. Acta. 513:269-275. Page, J.E., G. Hause, and M. Raschke. 2004. Functional analysis of the final steps of the 1-deoxy-D-xylulose-5-phosphate (DXP) pathway to isoprenoids in plants using virus-induced gene silencing. Plant Physiol. 134:1401-1413. Paschold, A., R. Halitschke, and I.T. Baldwin. 2006. Using ‘mute’ plants to translate volatile signals. Plant J. 45:275-291. Pawliszyn, J., B. Pawliszyn, and M. Pawliszyn. 1997. Solid phase microextraction. Chem. Educ. 2:1-7. Peyrot des Gachons, C., T. Tominaga, and D. Dubourdieu. 2002. Localization of S-cysteine conjugates in the berry: effect of skin contact on aromatic potential of Vitis vinifera L. cv. Sauvignon blanc must. Am. J. Enol. Vitic. 53: 144-146.

30
Peyrot des Gachons, C., C.Van Leeuwen, T. Tominaga, J.P. Soyer, J.P. Gaudillere, and D. Dubourdieu. 2005. Influence of water and nitrogen deficit on fruit ripening and aroma potential of Vitis vinifera L. cv. Sauvignon blanc in field conditions. J. Sci. Food Agric. 85:73-85. Piel, J., J. Donath, D. Bandemer, and W. Boland. 1998. Mevalonate independent biosynthesis of terpenoid volatiles in plants: Induced and constitutive emission of volatiles. Angew. Chem. Int. Ed. 37:2478-2481. Piñeiro, Z., R. Natera, R. Castro, M. Palma, B. Puertas, and C.G. Barroso. 2006. Characterisation of volatile fraction of monovarietal wines: Influence of winemaking practices. Anal. Chim. Acta 563:165-172. Possner, D.R.E., and W.M. Kliewer. 1985. The localization of acids, sugars, potassium and calcium in developing grape berries. Vitis 24:229-240. Rapp, A., and Mandery, H. 1986. Wine aroma. Experientia 42:873-884. Rapp, A., and Güntert, M. 1985. Changes in aroma substances during the storage of white wines in bottles. In 4th International Flavor Conference, Shelf Life of Foods and Beverages. Untersuching and Forschung (ed.), pp.141-167. Rhodes, Greece. Rapp, A., Güntert, M., and Uh, Z., 1985. Changes in aroma substances during the storage in bottles of white wines of the Riesling variety. Z. Lebensm.-Unters.- Forsch. 180:109-116. Razungles, A., C.L. Bayonove, R.E. Cordonnier, and R. Baumes. 1987. Investigation on the carotenoids of the mature grape. Vitis 26:183-191. Razungles A. and C. Bayonove. 1996. Grape carotenoids and their aromatic potential. Journal International des Sciences de la Vigne et du Vin 1996 No. Special issue pp. 85-88 Razungles, A.J., R.L. Baumes, C. Dufour, C.N. Sznaper, and C.L. Bayonove. 1998. Effect of sun exposure on carotenoids and C13-norisoprenoid glycosides in Syrah berries (Vitis vinifera). Sci. Aliments 18:361-373. Reynolds, A.J., and D.A. Wardle. 1997. Flavour development in the vineyard: impact of viticultural practices on grape monoterpenes and their relationship to wine sensory response. S. Afr. J. Enol. Vitic. 18:3-18. Reynolds, A.G., C.G. Edwards, D.A. Wardle, D.R. Webster, and M. Dever. 1994. Shoot density affects Riesling grapevines. II. Wine composition and sensory response. J. Am. Soc. Hortic. Sci. 119:881-892. Reynolds, A.G., D.A. Wardle, J.W. Hall, and M. Dever. 1995. Fruit maturation of four Vitis vinifera cultivars in response to vineyard location and basal leaf removal. Am. J. Enol. Vitic. 46:542-558. Reynolds, A.G., D.A. Wardle, and M. Dever. 1996. Vine performance, fruit composition, and wine sensory attributes of Gewürztraminer in response to vineyard location and canopy manipulation. Am. J. Enol. Vitic. 47:77-92.
31
Reynolds, A.G., C.G. Edwards, M.A. Cliff, J.H. Thorngate III, and J.C. Marr. 2001. Evaluation of yeast strains during fermentation of Riesling and Chenin blanc musts. Am. J. Enol. Vitic. 52:336-344. Reynolds, A.J., J. Schlosser, R. Power, R. Roberts, J. Willwerth, and C. de Savigny. 2007. Magnitude and interaction of viticultural and enological effects: impact of canopy management and yeast strain on sensory and chemical composition of Chardonnay musqué. Am. J. Enol. Vitic. 58: 12-24. Ribéreau-Gayon, P., J.N. Boidron, and A. Terrier. 1975. Aroma of Muscat grape varieties. J. Agric. Food Chem. 23:1042-1047. Ribéreau-Gayon, P., Y. Glories, A. Naujean, and D. Dubourdieu. 2000. Handbook of Enology, Vol. 2. Wiley, UK. Riccio, P., R. Rossano, M. Vinella, P. Domizio, F. Zito, F. Sanseverino, A. D’Elia, and I. Rosi. 1999. Extraction and immobilization in one-step of two β-glucosidases released from a yeast strain of Debaromyces hansenii. Enzyme Microb. Technol. 24:123-129. Rocha, S.M., P. Coutinho, A. Barros, I. Delgadillo, and M.A. Coimbra. 2007. Establishment of the varietal volatile profile of musts from white Vitis vinifera L. varieties. J. Sci. Food Agric. 87:1667-1676. Rodriguez-Concepción, M., and A. Boronat. 2002. Elucidation of the methylerythritol phosphate pathway for isoprenoid biosynthesis in bacteria and plastids. A metabolic milestone achieved through genomics. Plant Physiol. 130:1079-1089. Rohmer, M. 1999. The discovery of a mevalonate-independent pathway for isoprenoid biosynthesis in bacteria, algae and higher plants. Nat. Prod. Rep. 16:565-574. Rohmer, M., M. Knani, P. Simonin, B. Sutter, and H. Sahm. 1993. Isoprenoid biosynthesis in bacteria: a novel pathway for the early steps leading to isopentenyl diphosphate. Biochem. J. 295:517-524. Rohmer, M., M. Seemann, S. Horbach, S. Bringer-Meyer, and H. Sahm. 1996. Glyceraldehyde-3-phosphate and pyruvate as precursors of isoprenic units in an alternative non-mevalonate pathway for terpenoid biosynthesis. J. Am. Chem. Soc. 118: 2564-2566. Romeyer, F.M., J.J. Macheix, J.P. Goiffon, C.C. Reminiac, and J.C. Sapis. 1983. The browning capacity of grapes. 3. Changes and importance of hydroxycinnamic acid-tartaric acid esters during development and maturation of the fruit. J. Agric. Food Chem. 31:346-349. Rosi, I., M. Vinella, and P. Domizio. 1994. Characterization of β-glucosidase activity in yeast of oenological origin. J.Appl. Bacteriol. 77:519-527. Sarry, J.E., and Y.Z. Günata. 2004. Plant and microbial glycoside hydrolases: Volatile release from glycosidic aroma precursors. Food Chem. 87: 509-521.

32
Schneider, R., F. Charrier, M. Moutounet, and R.Baumes. 2004. Rapid analysis of grape aroma glycoconjugates using Fourier-transform infrared spectrometry and chemometric techniques. Anal. Chim. Acta 513:91-96. Sefton, M.A. 1998. Hydrolytically released volatile secondary metabolites from a juice sample of Vitis vinifera grape cvs. Merlot and Cabernet Sauvignon. Aust. J. Grape Wine Res. 4:30-38. Sefton, M.A., I.L. Francis, and P.J. Williams. 1993. The volatile composition of Chardonnay juices: a study of flavor precursor analysis. Am. J. Enol. Vitic. 44:359-370. Sefton, M.A., I.L. Francis, and P.J. Williams. 1996. The free and bound volatile secondary metabolites of Vitis vinifera grape cv. Semillon. Aust. J. Grape Wine Res. 2:179-183. Skouroumounis, G.K., and M.A. Sefton. 2000. Acid-catalyzed hydrolysis of alcohols and their β-D-glucopyranosides. J. Agric. Food Chem. 48:2033-2039. Skouroumounis, G.K., R.A. Massy-Westropp, M.A. Sefton, and P.J. Williams. 1995. Synthesis of glucosides related to grape and wine aroma precursors. J. Agric. Food Chem. 43:974-980. Smith, S., I.C. Codington, M. Robertson, and R.E. Smart. 1988. Viticultural and oenological implications of leaf removal for New Zealand vineyards. In Proceedings of the 2nd International Symposium for Cool Climate Viticulture and Oenology, 11-15 January, 1988, Auckland, New Zealand. R.E. Smart, R. Thornton, S. Rodriguez, and J. Young (eds.), pp. 127-133. New Zealand Society for Viticulture and Oenology, Auckland. Soler, E., M. Clastre, B. Bantignies, G. Marigo, and C. Ambid. 1993. Uptake of isopentenyl diphosphate by plastids isolated from Vitis vinifera L. cell suspensions. Planta 191:324-329. Stone, H., J. Sidel, S. Oliver, A. Woolsey, and R.C. Singleton. 1974. Sensory evaluation by quantitative descriptive analysis. Food Technol. 11:24-34. Strauss, C.R., E. Dimitriadis, B. Wilson, and P.J. Williams. 1986. Studies on the hydrolysis of two megastigma-3,6,9-triols rationalizing the origins of some volatile C13 –norisoprenoids of Vitis vinifera grapes. J.Agric. Food Chem. 34:145-149. Strauss, M.L., N.P. Jolly, M.G. Lambrechts, and P. Renault. 2001. Screening for the production of extracellular hydrolytic enzymes by non-Saccharomyces wine yeasts. J. Appl. Microbiol. 91:182-190. Suomalainen, H. 1971. Yeast and its effect on the flavor of alcoholic beverages. J. Inst. Brew. 77:164-177. Swiegers, J.H., E.J. Bartowsky, P.A. Henschke, and I.S. Pretorius. 2005. Yeast and bacterial modulation of wine aroma and flavor. Aust. J. Grape Wine Res. 11:139-173. Tominaga, T., M. L. Murat, and D. Dubourdieu. 1998. Development of a method for analyzing the volatile thiols involved in the characteristic aroma of wines made from Vitis vinifera L. cv. Sauvignon blanc. J. Agric. Food Chem. 46:1044-1048.
33
Tominaga, T., R. Baltenweck-Guyot, C. Peyrot des Gachons, and D. Dubourdieu. 2000a. Contribution of volatile thiols to the aromas of white wines made from several Vitis vinifera grape varieties. Am. J. Enol. Vitic. 51:178-181. Tominaga, T., L. Blanchard, P. Darriet, and D. Dubourdieu. 2000b. A powerful aromatic volatile thiol, 2-furanemethanethiol, exhibiting roast coffee aroma in wines made from several Vitis vinifera grape varieties. J. Agric. Food Chem. 48:1799-1802. Ugliano, M., and L. Moio. 2008. Free and hydrolytically released volatile compounds of Vitis vinifera L. cv. Fiano grapes as odour-active constituents of Fiano wine. Analyt. Chim. Acta 621:79-85. Ugliano, M., A. Genovese, and L. Moio. 2003. Hydrolysis of wine aroma precursors during malolactic fermentation with four commercial starter cultures of Oenococcus oeni. J. Agric. Food Chem. 51:5073-5078. Ugliano, M., A. Rinaldi, A. Gambuti, and L. Moio. 2007. The role of Saccharomyces cerevisiae wine yeasts in the hydrolysis of glycoconjugated aroma precursors during winemaking. Acta Hortic. 754:155-159. Van Leeuwen, C., P. Friant, X. Chone, O. Tregoat, S. Koundouras, and D. Dubourdieu. 2004. Influence of climate, soil, and cultivar on terroir. Am J. Enol. Vitic. 55:207-217. Vas, G., K. Koteleky, M. Farkas, A. Dobo, and K.Vekey. 1998. Fast screening method for wine headspace compounds using solidphase microextraction (SPME) and capillary GC technique. Am. J. Enol. Vitic, 49, 100–104. Vasserot, Y., A. Arnaud, and P. Galzy. 1995. Monoterpenol glycosides in plants and their biotechnological transformation. Acta Biotechnol. 15:77-95. Verpoorte, R., and A.W. Alfermann. 2000. Metabolic Engineering of Plant Secondary Metabolism. Kluwer Academic Publishers, Dordrecht. Versini, G., I. Orriols, and A. Dalla Serra. 1994. Aroma components of Galician Albariño, Loureira and Godello wines. Vitis 33:165-170. Versini, G., S. Carlin, G. Nicolini, E. Dellacassa, and F. Carrau. 1999. Updating of varietal aroma components in wines. In Vitiviniculture in the Southern hemisphere: proceedings of the 7th Latin-American Congress of viticulture and winemaking., pp. 325-349. Mendoza, Argentina. Voirin, S.G., R.L. Baumes, S.M. Bitteur , Y.Z. Günata, and C. Bayonove. 1990. Novel monoterpene disaccharide glycosides of Vitis vinifera grapes. J. Agric. Food Chem. 38:1373-1378. Wahlberg, I., and A.M. Eklund. 1998. Degraded carotenoids. In Carotenoids, Volume 3: Biosynthesis and Metabolism. G. Britton, S. Liaasen-Jensen, and H. Pfander (eds.), pp. 195-216. Birkauser, Bassel.
34
Webster, D. R., C.G. Edwards, S.E. Spayd, J.C. Peterson, and B.J. Seymour. 1993. Influence of vineyard nitrogen fertilization on the concentration of monoterpenes, higher alcohols, and esters in aged Riesling wines. Am. J. Enol. Vitic. 44:275-284. Whiton, R.S., and B.W. Zoecklein. 2000. Optimization of headspace solid-phase microextraction for analysis of wine aroma compounds. Am. J. Enol. Vitic. 51:379-382. Whiton, R.S., and B.W. Zoecklein. 2002. Evaluation of glycosyl-glucose analytical methods for various glycosides. Am. J. Enol. Vitic. 53:315-317. Wibowo, D., R. Eschenbruch, C.R. Davis, G.H. Fleet, and T.H. Lee. 1985. Occurrence and growth of lactic acid bacteria in wine: a review. Am. J. Enol. Vitic. 36:302-313. Williams, P.J. 1993. Hydrolytic flavor release in fruit and wines through hydrolysis of nonvolatile precursors. In Flavor Science - Sensible Principles and Techniques. T.E. Acree and R. Teranishi (eds.), pp. 287-303. American Chemical Society, Washington, DC. Williams, P.J., C.R. Strauss, and B. Wilson. 1980. Hydroxylated linalool derivatives as precursors of volatile monoterpenes of Muscat grapes. J. Agric. Food Chem. 28:766-771. Williams, P.J., C.R.Strauss, B. Wilson, and R.A. Massy-Westropp. 1982. Novel monoterpene disaccharide glycoside of Vitis vinifera grapes and wines. Phytochem. 21:2013-2020. Williams, P.J., M.A. Sefton, and B. Wilson. 1989. Nonvolatile conjugates of secondary metabolites as precursors of varietal grape flavor components. In Flavor Chemistry: Trends and Developments. R. Teranishi, R.G. Buttery, and F. Shahidi (eds.) American Chemical Society, Washington, DC. Williams, P.J., M.A. Sefton, and F. Leigh. 1992. Glycosidic precursors of varietal grape and wine flavor. In Flavor Precursors: Thermal and Enzymatic Conversions. ACS Symposium Series 490. R. Teranishi, G.R. Takeoka, and M. Güntert (eds.), pp. 74-86. American Chemical Society, Washington, DC. Williams, P.J., W. Cynkar, I.L. Francis, J.D. Gray, P.G. Iland, and B.G. Coombe. 1995. Quantification of glycosides in grapes, juices, and wines through a determination of glycosyl glucose. J. Agric. Food Chem. 43:121-128. Williams, P.J., I.L. Francis, and S. Black. 1996. Changes in concentration of juice and must glycosides, including flavor precursors, during primary fermentation. Proceedings Fourth International Symposium on Cool Climate Enology and Viticulture, Rochester, NY. pp. VI-5–VI-9. (Communications Services New York State Agricultural Experiment Station: Geneva, NY). Winterhalter, P., and R. Rouseff. 2002. Carotenoid-Derived Aroma Compounds. American Chemical Society, Washington, DC. Winterhalter, P., and G.K. Skouromounis. 1997. Glycoconjugated aroma compounds: occurrence, role and biotechnological transformation. Adv. Biochem. Eng. Biotechnol. Vol 55:73-105.
35
Winterhalter, P., M.A. Sefton, and P.J. Williams. 1990. Volatile C13-norisoprenoid compounds in Riesling wine are generated from multiple precursors. Am. J. Enol.Vitic. 41:277-283. Wirth J., W. Guo, R. Baumes, and Z. Günata. 2001. Volatile compounds released by enzymatic hydrolysis of glycoconjugates of leaves and grape berries from Vitis vinifera Muscat of Alexandria and Shiraz cultivars. J. Agric. Food Chem. 49:2917-2923. Wolf, T. 2004. Viticulture Notes. Virginia Cooperative Extension. 19:6. Available at http://www.sites.ext.vt.edu/newsletter-archive/viticulture/04december/04december.html. Young A., and G. Britton. (1990) Carotenoids and stress. In: Alscher RG, Cummings JR (eds) Stress responses in plants: adaptation and acclimation mechanisms. Wiley-Liss, NY, pp 87-112 Young, A.J. 1993. Occurrence and distribution of carotenoids. In Carotenoids in Photosynthesis. A.J. Young and G. Britton (eds.), pp. 16-72. Chapman and Hall, London, UK. Zamuz, S., R. Díaz, and M. Vilanova de la Torre. 2006. Aromatic diversity of Vitis vinifera cv. Albariño .Quantification of aromatic potential. J. Int. Sci. Vigne Vin. 40:197-202. Zoecklein, B.W., T.K. Wolf, C. Yoder, and Y. Jasinski. Effect of crop level on Chardonnay and Cabernet Sauvignon (Vitis vinifera L.) glycosides. In Proceedings for the Fourth International Symposium on Cool Climate Viticulture and Enology, Rochester, NY, 16-20 July 1996. T. Henick-Kling et al. (Eds.), pp. 58-65. New York State Agricultural Experiment Zoecklein, B.W., T.K. Wolf, S.E. Duncan, J.E. Marcy, and Y. Jasinski. 1998. Effect of fruit zone leaf removal on total glycoconjugates and conjugate fraction concentration of Riesling and Chardonnay (Vitis vinifera L.) grapes. Am. J. Enol. Vitic. 49:259-265. Zoecklein, B.W., L.S. Douglas, and Y.W. Jasinski. 2000. Evaluation of the phenol-free glycosyl-glucose determination. Am. J. Enol. Vitic. 51:420-423. Zoecklein, B., A. Athamneh, and K. Mallikarjunan. 2007. Electronic nose evaluation of grape maturity. Wine Bus. Month. Dec:67-68. Zoecklein, B.W., T.K. Wolf, L. Pélanne, M.K. Miller, and S.S. Birkenmaier. 2008. Effect of vertical shoot-positioned, Smart-Dyson, and Geneva double-curtain training systems on Viognier grape and wine composition. Am. J. Enol. Vitic. 59:11-21.
36
Chapter Two Effect of Foliar and Soil Nitrogen and Sulfur Applications on Petit Manseng (Vitis vinifera
L.) Grape Composition Abstract: Nitrogen fertilization may positively impact grape composition. The effect of foliar nitrogen and sulfur applications on Petit Manseng vine nitrogen status and grape composition was evaluated over two seasons. Four treatments were applied annually in a randomized block design with six replicates of six vines each: control without fertilization, soil nitrogen at 30 kg/ha, foliar nitrogen at 15 kg/ha, and foliar applications of nitrogen plus sulfur at 15 kg/ha and 5 kg/ha, respectively. Point quadrat analysis demonstrated foliar nitrogen alone and nitrogen plus sulfur treatments had increased percent gaps and lowered leaf layer numbers. Berry juice samples differed in ammonia, arginine and yeast assimilable nitrogen concentrations in both seasons. Total glycosides were higher in the foliar nitrogen treatment. Electronic nose measurements on field clusters and laboratory berry analyses demonstrated differences among treatments in volatile content. Key words: nitrogen, sulfur, yeast assimilable nitrogen, Petit Manseng, glycosides, electronic nose
Introduction
Grape-derived secondary metabolites are a primary source of wine aroma, flavor, taste and color, and include monoterpenes, anthocyanins, norisoprenoids, tannins and volatile phenols (Hardie et al. 1996). Secondary metabolite type and concentration is influenced by many factors including region, soil, climate, viticultural practices, cultivar, and vine nitrogen status (Webster et al. 1993, Zoecklein et al. 1997, 2000, 2007). Grape-derived aroma and flavor compounds exist as free volatiles, which may contribute directly to aroma, and as non-volatile bound conjugates (Gunata et al. 1985). Many of the bound forms, that serve as aroma and flavor precursors (Mansfield and Zoecklein 2003), are in higher concentration than free volatiles in fruit (Sefton et al. 1994). Conjugates may undergo enzymatic or acid hydrolysis, which cleaves the aglycone, increasing aroma and flavor potential (Sefton 1998, Williams et al. 1992). Some volatile compounds are derived directly from the berry while others are products of metabolism of grape compounds, especially nitrogen and sugar (Bell and Henschke 2005). Nitrogen is the most plentiful soil-derived macronutrient found in grapevines and plays important roles in many biological functions (Bell and Henschke 2005). Nitrogen in the fruit is important since ammonia (as NH4
+) functions as one source of nitrogen used in yeast metabolism (Peynaud and Maurie 1953). Most of the 20 common amino acids can be found in must and wine, with amounts varying with cultivar and with viticultural and processing techniques (Sponholz 1991). Free alpha-amino acids (FAN) and ammonia, collectively referred to as YAN (yeast available nitrogen). are metabolically available to fermentative yeast (Bisson 1991). Low nitrogen may lead to stuck or sluggish fermentations (Bisson 1991), while excess available soil nitrogen can increase vegetative vigor (Spayd et al. 1993) and fruit rot incidence (Lacroux et al. 2008).

37
Vine nitrogen status may impact wine aroma and flavor (Keller 2005). Amino acids are precursors of some aroma and flavor compounds (Rapp and Versini 1991). Webster et al. (1993) demonstrated a positive correlation among total nitrogen, free amino nitrogen, and amino acid concentrations in juice with relation to higher alcohols. Wines produced from vines treated with foliar nitrogen and sulfur had improved aromatic potential and increased aromas (Dufourcq 2006; Lacroux et al. 2008) Studies on a variety of plant species reported nitrogen-sulfur fertilizer interactions on nutrient uptake in wheat (Rasmussen et al. 1975), yields in rapeseed (Janzen and Bettany 1984) and amino acid composition in wheat (Byers and Bolton 1979). These studies demonstrated a synergistic effect between nitrogen and sulfur assimilation rates on methionine and cysteine content, which may be explained by the interdependence of nitrogen and sulfur in several amino acid metabolic pathways (Giovanelli 1987). Although soil is the usual source of plant nutrients, foliar fertilization may be more efficient at supplying grapevine nutritional needs, especially during periods of critical growth (Mengel et al 2002). Foliar applications may also impact vegetative-to-reproductive growth ratio (Lasa et al. 2012). Schreiber et al. (2002) noted that 30% of foliar applied urea was absorbed by clusters compared with 2% of soil-applied nitrogen reaching the fruit. Lasa et al. (2012) found that 17-80% of foliar-applied urea nitrogen was absorbed by berries, with increases in the synthesis and concentration of amino acids. Traditionally, volatile aroma and flavor compounds are measured by gas chromatography and mass spectroscopy (Sánchez-Palomo et al. 2010, Sefton 1998,Toci et al. 2012). More recently electronic nose technology was used to evaluate grape maturity and various vineyard management strategies (Athamneh et al. 2008, Devarajan et al. 2011). This technology uses a conducting polymer multisensory array system to absorb volatiles that result in a physical or chemical change on the sensor (Mallikarjunan 2005). Each sensor type has an affinity for a particular chemical class or group of compounds. The change in the sensor allows a distinct pattern or “smellprint” of the volatiles to be acquired. Using chemometric techniques and multivariate statistical analysis, it is possible to distinguish among groups of samples. Petit Manseng (Vitis vinifera L.) may have potential as a commercial wine grape cultivar for the East Coast wine industry due to minimal fruit rot, relatively high concentrations of sugar and acid at harvest, and unique aromatics (Wolf 2010). Little is known with regard to the volatile composition of this cultivar and factors contributing to their concentration. The purpose of this study was to determine the influence of vine nitrogen and vine nitrogen plus sulfur levels on yield components and grape composition of Petit Manseng.
Materials and Methods Vineyard description: A two year study was conducted in 2011 and 2012 using vines of Petit Manseng on 101-14 MGT rootstock in Dobson, North Carolina ( 36° 23’ 3.90” N,-80° 43’ 12.20” W; elevation 2,000 feet). Vines were planted in 2008 with 1.83 meter intra-row and 2.74 meter inter-row spacing, cordon-trained, and spur-pruned on a vertically shoot positioned trellis. Rows oriented north-south. Vineyard soil was a Clifford sandy clay loam described as well drained with moderate available water capacity (0.21 m). (NRCS, http://soils.usda.gov ). Management practices: General viticulture practices and pest management was typical for the region (NC Winegrape Growers Guide, 2013) with the exception that no fertilizer, sulfur or

38
irrigation applications were made to the vines other than the experimental treatments during the course of this study. Shoots were thinned shortly after budbreak to 12 shoots per meter of cordon. Leaf-pulling was conducted in the fruit zone prior to E-L stage 31 (modified Eichorn-Lorenz growth stage system, Coombe 1995) and at véraison to obtain less than one leaf layer total in the fruit zone. Vines were manually hedged when shoot growth reached approximately 0.60 m above the top catch wire. Climatic conditions: Mean annual precipitation for the experimental site was 1.02 to 1.22 meters, mean annual air temperature ten to fifteen oC and frost-free period 160-200 days. In 2011 and 2012, minimum and maximum temperatures and weekly precipitation data were collected from April through October via a Watchdog® 2550 weather station (Spectrum Technologies Inc., Aurora, IL). In addition, heat summation, seasonal precipitation, number of days with temperatures exceeding 22°C, and precipitation for the last 30 days prior to harvest in the two growing seasons were collected. Total Nitrogen: Fifty petioles were collected from the leaf opposite an inflorescence at bloom (E-L stage 23) to determine mineral composition. .Analysis was conducted at the North Carolina Department of Agriculture and Consumer Services( Raleigh, NC). Vegetative measurements: Point quadrat analysis with fifty random insertions into the fruit zone per treatment replicate was performed in 2012 post-veraison to determine canopy density. A metal rod was inserted 100 times per replicate into the fruit zone and contacts with clusters, leaves or gaps counted (Smart and Robinson 1991). At harvest, cluster weights, fruit yield, berry weight and clusters per shoot were determined for individual vines. Weight of dormant one-year old wood was determined at pruning. Juice analysis: Berry samples (100 berries each) were randomly collected from each treatment replicate at harvest in 2011 and 2012. Berries were pressed in stomacher bags (Seward Stomacher Lab System, London, UK). Berry sugar was measured using a hand-held refractometer (Extech Instruments, Nashua, NH) standardized with distilled water. Titratable acidity was measured by titration to pH 8.20 with 0.1N NaOH, and pH was determined (Accumet® model 15, Fisher Scientific, Inc., Pittsburgh, PA). Due to limited juice availability, only Brix was measured in 2012. Juice ammonia, urea, and arginine were determined enzymatically and NOPA (primary amino nitrogen) was determined spectrophometrically at harvest in 2011 and 2012 (Megazyme, Bray, Ireland) both using a Genesys® 5 spectrophotometer (Spectronic, Leeds, UK). Total and phenol-free glycosides: The analyses of total glycosides (TGG) and phenol-free glycosides (PFGG) were performed as described by Williams et al. (1995) and modified by Zoecklein et al. (2000). Briefly, for TGG analysis, fluid from ethanol-extracted skins was adjusted to pH 2.25 with concentrated hydrochloric acid. Samples were loaded onto C18-T columns (Phenomenex, Torrance, CA) and rinsed with distilled water. Glycosides were eluted with ethanol and hydrolyzed with 2.25 M sulfuric acid for one hour, cooled, and the hydrolysates were passed through the reconditioned (using methanol and distilled water) columns. Samples were then neutralized with 3.0 N sodium hydroxide and triethanolamine buffer, and total glycosyl-glucose measured using an R-Biopharm Glucose/Fructose enzyme kit (Boehringer Mannheim, Indianapolis, IN) and a Genesys® 5 spectrophotometer (Spectronic). For PFGG analysis, juice was adjusted to pH 13.0 using 10 N sodium hydroxide. Samples were loaded onto

39
prepared Fit Strata™ X Solid Phase Extraction plates (Phenomenex), rinsed with distilled water, and eluted with ethanol. Samples were hydrolyzed with sulfuric acid as described above and analyzed enzymatically. Electronic nose: A 32-sensor conducting polymer electronic nose (ENose®, Cyranose 320, Smiths Detection, Watford, England) was used to measure volatile compounds emitted by grape clusters in the field and berries in the laboratory, as described by Devarajan et al. (2011). At harvest, two clusters from each of six treatment replicates were chosen at random, bagged with polyethylene, equilibrated for 45 minutes and analyzed. In the laboratory, berries (50 g) were placed in 200-mL glass jars, incubated at 30°C for 20 min and analyzed for volatiles using the electronic nose. Experimental Design and Treatments: A randomized complete block design consisting of six replications of four treatments was used. Each replicate plot consisted of six test vines in interior rows. Treatment plots within the row were separated by 3 guard vines and there were three guard vines at the row ends. Treatments consisted of (1) control with no nitrogen or sulfur applications, (2) nitrogen at 30 kg/ha (Viking Ship® calcium nitrate 15.5-0-0, Yara North America, Inc., Tampa, FL) applied to soil just after flowering, (3) 15 kg/ha of urea nitrogen (Coron®, Helena Chemical Co., Collierville, TN) in two foliar applications prior to véraison and (4) 15 kg/ha of nitrogen (as urea) and 5 kg of micronized sulfur (Microthiol Disperss®, United Phosphorus Inc., King of Prussia, PA) in two applications prior to véraison. Foliar treatments were applied twice, at post-berry set and immediately pre-véraison. For treatment two, 98 g of calcium nitrate was dissolved in 473 mL of water and evenly distributed by hand on the soil surface in a 0.46 m circle from the trunk around each vine. Data was subjected to ANOVA and discriminant analysis with JMP® Pro (version 10.0, SAS Institute, Cary, NC). Mean separation was by t-test (p < 0.05).
Results and Discussion Vineyard Climate: The heat summation for the vineyard site averaged 2056 degree-C days for 2010-2011 (Table 1). This site is in region IV in the classification system of Amerine and Winkler (1994) and described as a warm growing region. Rainfall during the 2011 growing season was average with 84 mm of precipitation in the last thirty days prior to harvest (Figure 1). The average temperature was approximately 27°C. In 2012, the last 30 days before harvest had 306 heat summation degree-C days, compared to 254 in 2011. The precipitation during the 2012 growing season was 712 mm, making this a wet season, especially in July and September (Figure 2). It is possible that the increased precipitation impacted soil nitrogen uptake in 2012 compared to 2011. Nitrogen availability is directly linked to soil water content, with water stress decreasing inorganic nitrogen mobility and its uptake by the vine (Barber 1995, Guswa 2005). It is therefore possible that increased water availability may increase nitrogen uptake, impacting the formation of secondary metabolites. The wet season in September may have impacted reserves of nitrogen and sugar because most of the grapes (sinks) had been harvested. High rainfall in the fall combined with better water infiltration may have allowed for increased nitrogen accumulation. Vine Characteristics. In 2012, total petiole N concentrations differed between the control (0.68%) and soil applied N (0.60%) treatments. Both foliar applied N treatments were intermediate in petiolar total N concentration and did not differ from the other treatments. The

40
target value for bloom petiole samples is 1.2 to 2.2% and 0.8 to 1.2% for late-summer petiole samples (Wolf 2010). Therefore, vines in this study were of low nitrogen status. Bell and Henschke (2005) reported that applying nitrogen to vines in the deficient to marginal range increases nitrogen status. They also noted that nitrogen applications can result in increased root growth that promote water and nitrogen uptake, positively impacting fruit composition. Although Bell and Henschke (2005) noted that total yields and some components of yield are also expected to increase. In the present study, yield differences due to N application were not observed (Table 2). Perhaps the nitrogen levels were marginal for the cultivar.
Number of clusters/vine in the present study were maintained at two to three clusters/shoot and shoot number/vine was also restricted by shoot thinning to 22 shoots/vine. Therefore, the opportunity for yield impact had to be through either alteration in berry weight or the number of berries/cluster. Berry weight differed by 0.14 g/berry (about a 1% reduction) between treatments with the two most extreme berry weights in 2011, but did not differ between treatments in 2012. Coincidently, cluster weight did not differ between treatments in either year of the study. Soil applied nitrogen fertilization prior to bloom was shown to increase cluster weight through more and larger berries/cluster in some vintages (Spayd et al. 1993). In the present study, N was applied post bloom to the canopy in a vineyard of low nitrogen status at a relatively low rate with little to no impact on either yield and its components or pruning weights.
In 2012 foliar nitrogen plus sulfur treatment had 51 percent increased gaps and 35 percent lower leaf layer number by point quadrat analysis, compared to the control. (Table 3). Morrison and Noble (1990) noted that berry size increased with fruit or leaf shading, therefore, the converse may be true. Treatments had similar percentages of interior clusters and interior leaves. The more open canopy obtained with nitrogen plus sulfur applications may impact fruit-zone light intensity and, possibly, fruit composition and yield (Dokoozlian and Kliewer 1995, Smart and Robinson 1991). Foliar nitrogen application may have an advantage over soil application because it may increase effectiveness of fertilizer use and reduce physiological stress (Gooding and Davies 1992, Gray and Aiken 1984). However, foliar urea nitrogen application has resulted in phytotoxicity in other plants, including leaf tip necrosis in soybeans (Gray and Aiken 1984). It is believed that phytotoxic effects depend on the form of nitrogen used and that urea is less prone to cause burn compared to other forms. This may be due to its low salt index and ability to be absorbed quickly by the leaf (Harper 1984, Hinsvark et al. 1953). We did not observe any phytotoxicity of foliar treated vines in this study. Juice composition. In 2011, oBrix and titratable acidity concentrations did not differ among treatments (Table 4). In 2012, foliar nitrogen plus sulfur-treated berries had higher oBrix (24.6± 0.03) compared to the control treatment (23.8± 0.02). Slight pH elevation was demonstrated for nitrogen (0.09 increase in pH units) and nitrogen plus sulfur treatments(0.09 increase in pH units) compared to the control treatment. The slight pH elevation may also be due to the smaller berry size in these treatments, resulting in increased potassium concentrations (not determined) in the juice. In 2011 and 2012, juice samples did not differ in urea nitrogen concentration (data not shown). Differences in the concentration of the other N components in juices from the four treatments were not consistent between years. In 2011, juice from the two foliar nitrogen applications contained higher concentrations of ammonia and arginine than the control or the soil applied N treatment with the foliar N plus sulfur-treated vines producing juice with the highest ammonia

41
and arginine concentrations of the four treatments (Table 5). Yeast assimilable nitrogen (YAN) levels in foliar nitrogen plus sulfur-treated vines were almost 4 times higher than YAN concentrations in the control treatment in 2011, but concentrations did not differ between these two treatments in 2012.
In 2012, the foliar nitrogen treatments displayed differences in ammonia nitrogen, arginine and YAN levels. Consistent with the findings of Lacroux et al. (2008), soil nitrogen treatments did not differ from the control vines. They attributed this to either late application or limited absorption in clay soils. YAN levels were increased with foliar nitrogen alone and foliar nitrogen plus sulfur applications in 2011, demonstrating the possible ability of vines to redistribute nitrogen to the grapes prior to véraison.
Nitrogen compounds are transported into the berry mostly as nitrate and glutamine prior to véraison. In the berry, glutamine is converted into amino acids, including arginine and proline (Keller 2005). The synthesis of arginine is increased with increasing nitrogen supply, but is limited by water and nitrogen deficits (Keller 2005). Treeby et al. (2000), found that YAN is increased as nitrogen availability is increased as demonstrated in this study.
Glycosides: Foliar nitrogen application alone resulted in increased total glycosides (TGGs) in juice compared to other treatments (Table 6). Phenol-free glycosides (PFGGs) in juice did not differ due to treatments. The increased TGG concentrations in the foliar nitrogen-treated vines may indicate an increase in flavor and aroma precursors in these treatments. The increased total glycosides in the foliar nitrogen treatment may be a function of lower average berry weight. In grape varieties, there is an increased concentration of free and bound aroma compounds in the skin. In this study, TGGs were measured in skins, while PFGGs were measured on juice. Therefore, the increased TGGs may be a function of sample matrix (skins) versus the lower PFGGs found in the juice. The relationship between vineyard nitrogen and the development of aroma and flavor compounds was evaluated previously, and amino acids are well-known precursors of aroma and flavor compounds (Bisson 1991, Castor and Guymon 1952, Chen 1978). The increased TGGs in the fruit from vines with foliar nitrogen applications may indicate an increase in the pool of potential aroma compounds in this cultivar. Electronic nose: Canonical plots of both clusters analyzed in the field, and berry samples analyzed in the lab, demonstrated that the electronic nose could distinguish among treatments (Figures 3 and 4). Treatment differences are indicated in the plots by non-intersecting circles. The same separation of treatments was achieved in the field and the lab, suggesting the volatile compositions of the berries were different. The distinct patterns of the volatiles for the four treatments indicated that treatments may have lead to different volatile aroma profiles in each. Further analysis using GC/MS would help elucidate these preliminary results.
Conclusions
Vineyard nitrogen applications were compared for two seasons on Petit Manseng (Vitis vinifera L.) to determine the impact on selected grape berry compositional parameters. Vine vigor, pruning weights and vegetative vigor, as determined by point quadrat analysis, differed among treatments, with foliar nitrogen and nitrogen plus sulfur treatments showing increased percent gaps and lower leaf layer percentages.
42
Juice samples differed in ammonia nitrogen, arginine and yeast assimilable nitrogen. In 2011, total glycosides were 25 percent higher in vines treated with foliar nitrogen versus control vines. Electronic nose measurements on field clusters and laboratory fruit differed among treatments in volatile content. These results suggest that grape berry composition of Petit Manseng was impacted by soil nitrogen, foliar nitrogen and foliar nitrogen plus sulfur applications. Because Petit Manseng grape quality, in part, depends on aroma potential, fertilization practices could possibly be optimized to produce Petit Manseng wines with increased aromatics.

43
Literature Cited Amerine, M.A., and A.J. Winkler. 1994. Composition and quality of musts and wines of California grapes. Hilgardia 15:493-675. Athamneh, A., B. Zoecklein, and K. Mallikarjunan. 2008. Electronic nose evaluation of Cabernet Sauvignon fruit maturity. J. Wine Res. 19:69-80. Barber, S.A. 1995. Soil Nutrient Bioavailability: A Mechanistic Approach. Wiley, New York. Bell, S.J., and P.A. Henschke. 2005. Implications of nitrogen nutrition for grapes, fermentation and wine. Austr. J. Grape Wine Res. 11:242-295. Bisson, L.F. 1991. Influence of nitrogen on yeast and fermentation of grapes. In Proceedings of the International Symposium on Nitrogen in Grapes and Wine. J.M. Rantz (ed.), pp. 78-89. American Society for Enology and Viticulture, Davis, CA. Byers, M., and J. Bolton. 1979. Effect of nitrogen and sulfur fertilizers on the yield, N and S content, and amino acid composition of the grain of spring wheat. J. Sci. Food Agric. 30:251-263. Castor, J.G.B., and J.F. Guymon. 1952. On the mechanism of formation of higher alcohols during alcoholic fermentation. Sci. 115:147-149. Chen, E.C.H. 1978. The relative contribution of Ehrlich and biosynthetic pathways to the formation of fusel alcohols. Am. Soc. Brew. Chem. 36:39-43. Coombe, B.G. 1995. Grapevine phenology. In Viticulture volume I-Resources. Coombe, B.G. and P. Dry (eds), pp 150-166.Winetitles, Adelaide. Devarajan, Y.S., B.W. Zoecklein, K.M. Mallikarjunan, and D.M. Gardner. 2011. Electronic nose evaluation of the effects of canopy side on Cabernet franc (Vitis vinifera L.) grape and wine volatiles. Am. J. Enol. Vitic. 62:73-80. Dokoozlian, N.K., and W.M. Kliewer. 1995. The light environment within grapevine canopies. I. Description and seasonal changes during fruit development. Am. J. Enol. Vitic. 46:209-218. Dufourcq, T. 2006. Incidences du climat, du sol, se la date de récolte sur le potential aromatique du cepage Colombard en Gascogne. In Proceedings of the VIth International Terroir Congress, Bordeaux-Montpellier, 3-7 July, pp. 391-395. Giovanelli, J. 1987. Sulfur amino acids of plants: an overview. In Methods in Enzymology. W.B. Jakoby and O.W. Griffith (eds.), pp. 419-426. Academic Press, New York. Gooding, M.J. and W.P. Davies. 1992.Foliar fertilization of cereals; a review. Fert. Res. 32:209-222. Gray, R.C. and G.W. Akin. 1984. Foliar fertilization. In Hauck RD (ed) Nitrogen in Crop Production. Am. Soc. Agron., Madison, WI. pp.551-560.
44
Gunata, Y.Z., C. Bayonove, R. Baumes, and R. Cordonnier. 1985. Extraction and determination of free and glycosidically bound fractions of some grape aroma constituents. J. Chromatogr. A. 331:83-90. Guswa, A.J. 2005. Soil-moisture limits on plant uptake: an upscaled relationship for water-limited ecosystems. Adv. Water Resources 28:543-552. Hardie, W.J., T.P. O’Brien, and V.G. Jaudzems. 1996. Cell biology of grape secondary metabolism - a viticultural perspective. In Proceedings of the Ninth Australian Wine Industry Technical Conference. S.S. Stockley, et al. (eds.), pp. 78-82. Winetitles, Adelaide, South Australia. Harper, J.E. 1984. Uptake of organic nitrogen forms by roots and leaves. In: Hanck RD (ed) Nitrogen in Crop Production. Am. Soc. Agron., Madison, WI. pp.165-182. Hinsvark, O.N., S.H. Wittwer and H.B. Tukey. 1953. The metabolism of foliar applied urea. Relative rates of C14 O2 production by certain vegetable plants treated with labeled urea. Plant Physiol. 28:70-76. Jackson, R. 2000. Wine Science, Principles, Practices, Perception. Academic Press, San Diego. Janzen, H.H., and J.R. Bettany. 1984. Sulfur nutrition of rapeseed. I. Influence of nitrogen and sulfur rates. Soil Sci. Soc. Amer. J. 48:100-107. Keller, M. 2005. Deficit Irrigation and vine mineral nutrition. In ASEV Soil Environment and Vine Mineral Nutrition Symposium. Am. J. Enol. Vitic. 56:267-283. Lacroux, F., O. Tregoat, C. Van Leeuwen, A. Pons, T. Tominaga, V. Lavigne-Cruege, and D. Dubourdieu. 2008. Effect of foliar nitrogen and sulfur application on aromatic expression of Vitis vinifera L. cv. Sauvignon blanc. J. Int. Sci. Vigne Vin. 42:125-132. Lasa, B., S. Menendez, K. Sagastizabal, M. Erendira Calleja Cervanter, I. Irigoyen, J. Muro, P.M. Aparicio-Tejo, and I. Ariz. 2012. Foliar application of urea to Sauvignon blanc and Merlot vines: doses and time application. Plant Growth Regul. 67:73-81. Mallikarjunan, P. 2005. Electronic nose applications in the food industry. In Nondestructive Testing of Food Quality. J. Irudayaraj et al. (eds.), pp. 237-284. Wiley-Blackwell, Ames. Mansfield, A.K., and B.W. Zoecklein. 2003. Effect of fermentation, postfermentation, and post-bottling heat treatment on Cabernet sauvignon grape glycoconjugates. Am. J. Enol. Vitic. 54:99-104. Mengel, K.; M. Tagliavini, M. Toselli, L. Bertschinger, P. Brown, D. Neilsen, and M.Thalheimer. 2002. Alternative or complementary role of foliar supply in mineral nutrition.International Society for Horticultural Science (ISHS), Leuven, Belgium, Acta Horticulturae. 594:33-47.

45
Morrison, J.C., and A.C. Noble. 1990. The effects of leaf and cluster shading on the composition of Cabernet Sauvignon grapes and on fruit and wine sensory properties. Am J. Enol. Vitic. 41:199-200. North Carolina winegrape growers guide. North Carolina Cooperative Extension. 2013. E. B. Poling (ed.). pp. 1-196. NC State University, Raleigh. Peynaud, E., and A. Maurie. 1953. Sur l’evolution de l’azote dans les differentes parties du raisin au cours de le maturation. Ann. Technol. Agr. 2:15-25. Rapp, A. and G. Versini. 1991. Influence of nitrogen compounds in grapes on aroma compounds of wines. In Proceedings of the International Symposium on Nitrogen in Grapes and Wine. J.M. Rantz (ed.), pp. 156-164. American Society for Enology and Viticulture, Davis, CA. Rasmussen, P.E., R.E. Ramig, R.R. Allmaras, and C.M. Smith. 1975. Nitrogen-sulfur relations in soft winter wheat. II. Initial and residual effects of sulfur application on nutrient concentration, uptake, and N/S ratio. Agron. J. 67:224-228. Sánchez-Paloma, E., E. Gómez Garcia-Carpintero, R. Alonso-Villegas and M.A. González-Viñas. 2010. Characterization of aroma compounds of Verdejo white wines from the La Mancha region by odour activity values. Flavour Fragr. J. 25:456-462. Schreiber, A.T., N. Merkt, R. Blaich, and R. Fox. 2002. Distribution of foliar applied labeled nitrogen in grapevines (Vitis vinifera L., cv. Riesling). Proceedings of the International Symposium on Foliar Nutrition of Perennial Fruit Plants. Acta Hort. 594:139-148. Sefton, M.A. 1998. Hydrolytically released volatile secondary metabolites from a juice sample of Vitis vinifera grape cvs. Merlot and Cabernet Sauvignon. Aust. J. Grape Wine Res. 4:30-38.
Sefton, M. A., Francis, I. L. and P. J. Williams. 1994. Free and bound volatile secondary metabolites of Vitis Vhifera grape cv. Sauvignon Blanc. J. Food Sci. 59: 142–147.
Smart, R.E., and M. Robinson. 1991. Sunlight into Wine: A Handbook for Winegrape Canopy Management. Winetitles, Adelaide, Australia. Spayd, S.E., R.L. Wample, R.G. Stevens, R.G. Evans, and A.K. Kawadami. 1993. Nitrogen fertilization of white Riesling in Washington. Effects on petiole nutrient concentration, yield, yield components, and vegetative growth. Am. J. Enol. Vitic. 44:378-386. Sponholz, W.R. 1991. Nitrogen compounds in grape, must and wine. In Proceedings of the International Symposium on Nitrogen in Grapes and Wine. J.M. Rantz (ed.), pp. 67-77. American Society for Enology and Viticulture, Davis, CA Toci, A.T., P. Crupi, G. Gambacorta, T. Dipalmo, D. Antonacci and A. Coletta. 2012. Free and bound aroma compounds characterization by GC-MS of Negroamaro wine as affected by soil management. J. Mass Spectrom. 47:1104-1112. Treeby, M.T., B.P. Holzapfel, G.J. Pickering and C.J. Frierich. 2000. Vineyard nitrogen supply and Shiraz grape and wine quality. Acta Hortic. 512:77-92.

46
Webster, D. R., C.G. Edwards, S.E. Spayd, J.C. Peterson, and B.J. Seymour. 1993. Influence of vineyard nitrogen fertilization on the concentration of monoterpenes, higher alcohols, and esters in aged Riesling wines. Am. J. Enol. Vitic. 44:275-284. Williams, P.J., M.A. Sefton, and F. Leigh. 1992. Glycosidic precursors of varietal grape and wine flavor. In Flavor Precursors: Thermal and Enzymatic Conversions. ACS Symposium Series 490. R. Teranishi, G.R. Takeoka, and M. Guntert (eds.) pp. 74-86. American Chemical Society, Washington, D.C. Williams, P. J., W. Cynkar, I.L. Francis, J.D. Gray, P.G. Iland, and B.G. Coombe. 1995. Quantification of glycosides in grapes, juices, and wines through a determination of glycosyl glucose. J. Agric. Food Chem. 43:121-128. Wolf, T. 2010. Viticulture Notes. Virginia Cooperative Extension. 25:3. Available at www.arec.vaes.vt.edu/alson-h-smith/grapes/.../news/.../vn-june-2010.pdf. Accessed 7 May 2013 Zoecklein, B.W., J.E. Marcy, J.M. Williams, and Y. Jasinski. 1997. Effect of native yeasts and selected strains of Saccharomyces cerevisiae on glycosyl glucose, potential volatile terpenes, and selected aglycones of white Riesling (Vitis vinifera) wines. J. Food Comp. Anal. 10:55-65. Zoecklein, B.W., L.S. Douglas, and Y.W. Jasinski. 2000. Evaluation of the phenol-free glycosyl-glucose determination. Am. J. Enol. Vitic. 51:420-423. Zoecklein, B., A. Athamneh, and K. Mallikarjunan. 2007. Electronic nose evaluation of grape maturity. Wine Bus. Monthly Dec:67-68.

47
Table 1 Heat summation for the 2011 and 2012 growing season, heat summation for the 30 days before harvest, days exceeding 22°C 30 days prior to harvest and precipitation at the experimental vineyard site, Dobson, North Carolina.
Heat summation (10°C base) Precipitation (mm)
Year
Apr through
Oct
Last 30 days
before harvest
Days in last 30 that
temp exceeded
22°C
Jan through
Dec
Apr through
Oct
Last 30 days
before harvest
2011 2094 254 25 992 559 84 2012 2017 306 28 1027 712 156 Average 2056 280 27 1010 636 120

48
Table 2 Effect of soil and foliar applications of nitrogen and sulfur on components of yield in 2011 and 2012 Petit Manseng vines.(n=6)
Controla Soil
Nitrogen Foliar
Nitrogen
Foliar Nitrogen
and Sulfur p value 2011 Yield (kg/vine) 1.40a 1.53a 1.55a 1.39a 0.64 Clusters/Shoot 2.00a 2.00a 2.00a 2.00a 0.60 Berry Wt (g) 1.06ab 1.09a 0.95c 1.03b <0.0001 Cluster Wt (g) 84.32a 88.33a 89.57a 83.12a 0.61 Pruning Wt
(kg/vine)
0.18ab 0.18a 0.19a 0.19a 0.89c Yield (kg/vine) 1.71a 2.54a 2.58a 2.33a 0.15 2012 Clusters/Shoot 2.00a 3.00a 3.00a 3.00a 0.15 Berry Wt (g) 1.11a 1.07a 1.05a 1.03a 0.37 Cluster Wt (g) 142.63a 113.67a 104.33a 103.85a 0.06 Pruning Wt
(kg/vine)
0.16a 0.16a 0.17a 0.17a 0.64
aControl: no treatment; Soil Nitrogen: nitrogen 30 kg/ha after flowering; Foliar Nitrogen: nitrogen 15 kg/ha (two applications prior to véraison); Foliar Nitrogen and Sulfur: nitrogen 15 kg/ha and sulfur 5 kg/ha. bDifferent letters within rows indicate significant differences at p<0.05 (ANOVA and LSD). cp<0.05 is considered significantly different.

49
Table 3 Effect of soil and foliar applications of nitrogen and sulfur on point quadrat analysis of percentages per treatment in 2012 Petit Manseng vines.
Controla Soil Nitrogen Foliar Nitrogen Foliar Nitrogen and Sulfur
p value
Interior Clusters (%)
19.73±0.46ab 23.62±0.59a 25.77±0.71a 16.46±0.54a 0.41c
Gaps (%) 8.50±0.55b 9.41±0.52b 16.00±0.90a 17.33± 0.43a 0.0011 Leaf Layer Number (%)
1.66±0.15a 1.42±0.27ab 1.29±0.25bc 1.07±0.22c 0.0031
Interior Leaves (%)
19.30±0.26a 17.38±0.35a 15.46±0.36a 14.82±0.77a 0.4
aControl: no treatment; Soil Nitrogen: nitrogen 30 kg/ha after flowering, Foliar Nitrogen: nitrogen 15 kg/ha (2 applications prior to véraison); Foliar Nitrogen and Sulfur: nitrogen 15 kg/ha and sulfur 5 kg/ha. bDifferent letters within rows indicate significant differences at p<0.05 (Student’s t-test). cp<0.05 is considered significantly different.

50
Table 4 Effect of soil and foliar applications of nitrogen and sulfur on juice chemistries of 2011 Petit Manseng berries (n=6).
Controla Soil Nitrogen Foliar
Nitrogen Foliar Nitrogen
and Sulfur oBrix 23.9ac 23.60a 23.60a 24.10a pH 3.23b 3.24ab 3.32a 3.32a Titratable Acidity (g/ L) b 7.0a 6.0a 6.3a 6.4a aControl: no treatment; Soil Nitrogen: nitrogen 30 kg/ha after flowering, Foliar Nitrogen: nitrogen 15 kg/ha (2 applications prior to véraison); Foliar Nitrogen and Sulfur: nitrogen 15 kg/ha and sulfur 5 kg/ha. bExpressed as g tartaric acid/L cDifferent letters within rows indicate significant differences at p<0.05 (Student’s t-test LSD).
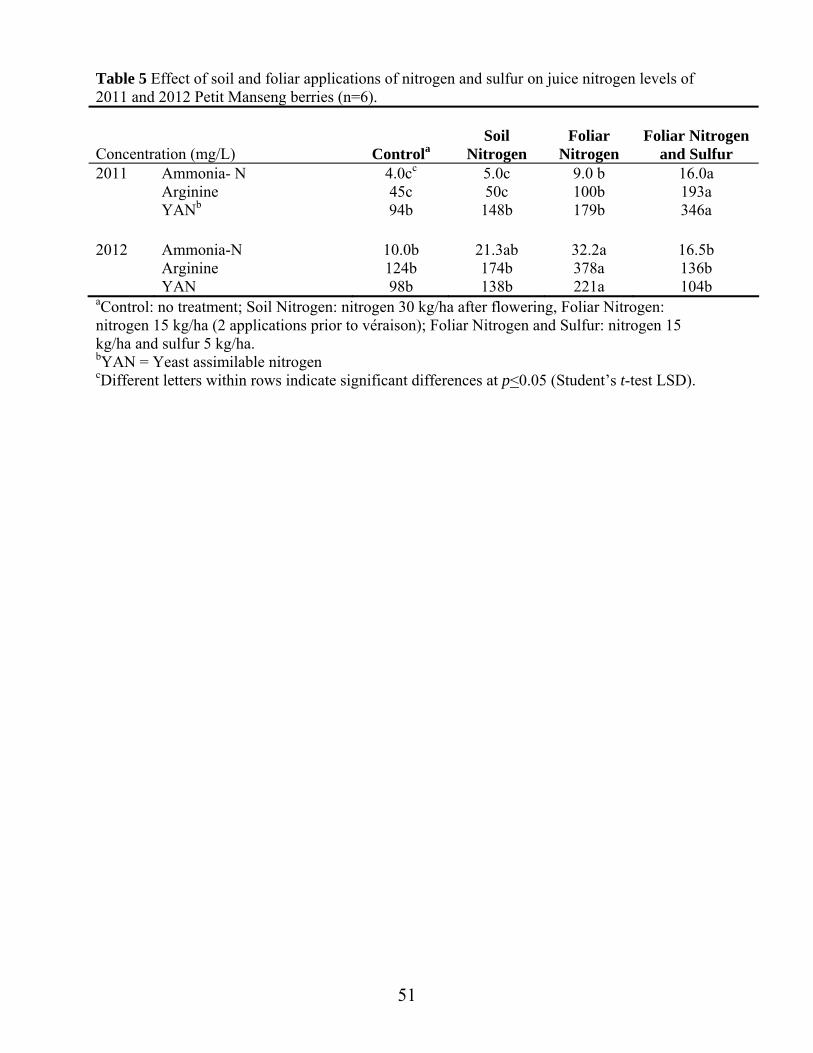
51
Table 5 Effect of soil and foliar applications of nitrogen and sulfur on juice nitrogen levels of 2011 and 2012 Petit Manseng berries (n=6). Concentration (mg/L) Controla
Soil Nitrogen
Foliar Nitrogen
Foliar Nitrogen and Sulfur
2011 Ammonia- N 4.0cc 5.0c 9.0 b 16.0a Arginine 45c 50c 100b 193a YANb 94b 148b 179b 346a 2012 Ammonia-N 10.0b 21.3ab 32.2a 16.5b Arginine 124b 174b 378a 136b YAN 98b 138b 221a 104b aControl: no treatment; Soil Nitrogen: nitrogen 30 kg/ha after flowering, Foliar Nitrogen: nitrogen 15 kg/ha (2 applications prior to véraison); Foliar Nitrogen and Sulfur: nitrogen 15 kg/ha and sulfur 5 kg/ha. bYAN = Yeast assimilable nitrogen cDifferent letters within rows indicate significant differences at p<0.05 (Student’s t-test LSD).
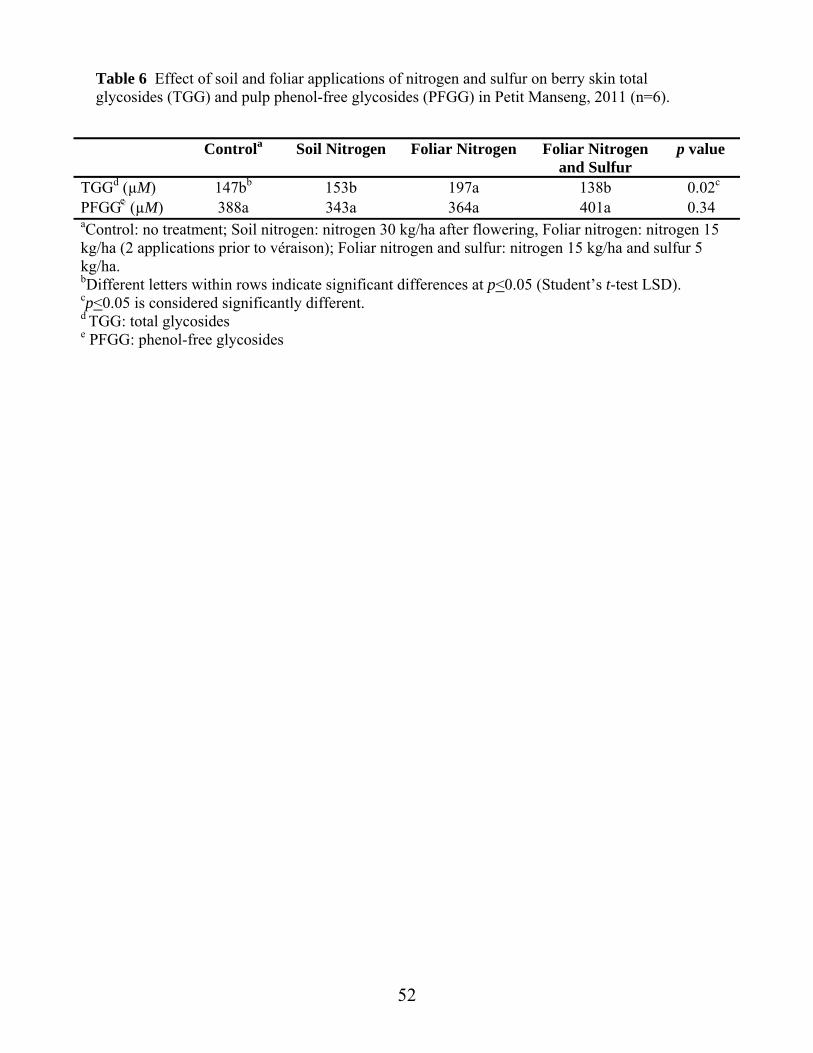
52
Table 6 Effect of soil and foliar applications of nitrogen and sulfur on berry skin total glycosides (TGG) and pulp phenol-free glycosides (PFGG) in Petit Manseng, 2011 (n=6).
Controla Soil Nitrogen Foliar Nitrogen Foliar Nitrogen and Sulfur
p value
TGGd (µM) 147bb 153b 197a 138b 0.02c
PFGGeee (µM) 388a 343a 364a 401a 0.34 aControl: no treatment; Soil nitrogen: nitrogen 30 kg/ha after flowering, Foliar nitrogen: nitrogen 15 kg/ha (2 applications prior to véraison); Foliar nitrogen and sulfur: nitrogen 15 kg/ha and sulfur 5 kg/ha. bDifferent letters within rows indicate significant differences at p<0.05 (Student’s t-test LSD). cp<0.05 is considered significantly different. d TGG: total glycosides e PFGG: phenol-free glycosides

53
0
5
10
15
20
25
30
35
1‐Apr 1‐Jun 1‐Aug 1‐Oct
Temperature (o C)
0
10
20
30
40
50
60
70
80
90
100
Weekly precipitation (m
m)
2011
Figure 1 Average daily temperature (line graph) and precipitation (bar graph) April through October, 2011, at experimental vineyard site, Dobson, North Carolina.

54
0
5
10
15
20
25
30
35
1‐Apr 1‐Jun 1‐Aug 1‐Oct
Temperature (o C)
0
10
20
30
40
50
60
70
80
90
100
Weekly precipitation (m
m)
2012
Figure 2 Average daily temperature (line graph) and precipitation (bar graph) April through October, 2012, at experimental vineyard site, Dobson, North Carolina.

55
Figure 3 Canonical plots of volatile differences in Petit Manseng berry samples in 2012 from four treatments as detected by conducting polymer-based electronic nose in the laboratory. Trt. 1: control, no treatment; Trt. 2: soil nitrogen 30 kg/ha after flowering; Trt. 3: foliar nitrogen 15 kg/ha, 2 applications prior to véraison; and Trt. 4: foliar nitrogen 15 kg/ha and sulfur 5 kg/ha. Significant differences at p<0.05 are indicated by non-intersecting circles.
Trt. 1
Trt. 2Trt. 3
Trt. 4

56
Figure 4 Canonical plots of volatile differences in Petit Manseng cluster samples in 2012 from four treatments as detected by conducting polymer-based electronic nose in the field. Trt. 1: control, no treatment; Trt. 2: soil nitrogen 30 kg/ha after flowering; Trt. 3: foliar nitrogen 15 kg/ha, 2 applications prior to véraison; Trt. 4: foliar nitrogen 15 kg/ha and sulfur 5 kg/ha. Significant differences at p<0.05 are indicated by non-intersecting circles.
Trt. 4
Trt. 3
Trt. 2
Trt. 1
57
Chapter Three Influence of nitrogen fertilization on grape-derived volatiles of Petit Manseng (Vitis vinifera L.) Abstract: Petit Manseng aroma and flavor compounds were evaluated over two seasons from vines with four treatments applied annually in a randomized block design: control without fertilization, soil nitrogen at 30 kg/ha, foliar nitrogen at 15 kg/ha, and foliar nitrogen plus sulfur at 15 kg/ha and 5kg/ha, respectively. Harvest samples underwent acid or enzyme hydrolysis of aroma/flavor precursor fractions. Solid phase microextraction (SPME) and gas chromatography-mass spectrometry (GC-MS) analysis identified 27 free aroma and flavor compounds and 52 bound compounds. Lactones and carboxylic acids were the major components of the free fractions, while bound fractions had increased concentrations of alcohols, esters and terpenes compared to the free fraction. Acid hydrolysis released more terpenes with nitrogen treatments versus enzymatic hydrolysis. Ester content was increased in both acid and enzyme hydrolysis fractions in vines receiving nitrogen treatments. Key words: nitrogen, sulfur, solid-phase microextraction, Petit Manseng, glycosides, acid hydrolysis, enzyme hydrolysis
Introduction
Some grape-derived aroma and flavor compounds exist as free volatiles that possibly contribute to aroma and flavor, and as non-volatile bound conjugates. Bound components include terpenes, lactones, C-13 norisoprenoids, alcohols, esters and shikimic acid compounds (Ibarz et al. 2006). These precursors (including glycosides) can release and form aroma and flavor compounds by different mechanisms. Bound glycosides can be cleaved enzymatically (Allen et al. 1991), resulting from the action of enzymes that are endogenous in the fruit and/or added during processing. Additionally, acid-catalyzed reactions during winemaking can result in the formation of various aroma and flavor compounds such as norisoprenoids and terpenes (Ugliano et al. 2006). Sensory analysis of acid and/or enzyme hydrolysates has shown their impact on aroma and flavor profiles (Webster et al. 1993). Odorless grape-derived conjugates exist as glucosides, disaccharides or trisaccharides (Williams et al. 1982). Aroma and flavor compounds are conjugated to glucose as β-D-glucopyranosides, or form more complex disaccharides with glucose conjugated to a second sugar unit. In grapes and wine, 6-O-α-L-arabinofuranosyl-β-D-glucopyranosides, 6-O-α-L-rhamnopyranosyl-β-D-glucopyranosides and 6-O-β-D-apiofuranosyl-β-D-glucopyranosides have been identified (Williams et al. 1992, Marinos et al. 1994, Vasserot et al. 1995, Winterhalter and Skouroumounis 1997). Enzymatic hydrolysis of disaccharide glycosides occurs as a two-step process. With monoglucosides, β-glucosidases act directly (Dubourdieu et al. 1988). Hydrolysis of disaccharide glycosides requires the sequential activity of an exo-glycosidase to cleave the outermost sugar, followed by a β-glucosidase to remove the remaining glucose (Günata et al. 1988). An endo-glycosidase alone is also capable of hydrolyzing this linkage, freeing the disaccharide and aglycon (non-sugar portion) (Günata et al. 1998).

58
Enzymatic hydrolysis cleaves the glycosidic bond without altering the chemical structure of the released aglycone (Sefton 1998). Conversely, acid-catalyzed hydrolysis cleaves the ether linkage between glucose and the aglycon, resulting in a reactive carbocation, creating a variety of products (Sefton 1998, Skouroumounis and Sefton 2000). Acid hydrolysis can result in acid-catalyzed cyclations, rearrangements and dehydrations (Williams et al. 1982, Sefton et al. 1989), with rates increased at increased temperatures (Strauss et al. 1986). Acid hydrolysis may be more efficient at releasing bound norisoprenoids than is enzymatic hydrolysis (Sefton et al. 1989, 1993, 1998). Although acid hydrolysis products are not directly indicative of the composition of the precursor fraction (Williams et al. 1982), it is a major contributor to wine varietal aroma and flavor (Ugliano and Moio 2008). Sefton (1998) noted that mild acid hydrolysis yields increased volatile compounds compared to enzymatic hydrolysis, which may yield flavorless products (Francis et al. 1992, 1996, 1998, Abbott et al. 1991). In contrast, Abbott et al. (1991) found that both enzyme- and acid-released compounds could contribute to wine aroma and flavor. Enzymatic hydrolysis is highly correlated with most volatile phenols and benzyl alcohol, while acid hydrolysis is correlated with most of the norisoprenoids and some terpenes (Loscos et al. 2009). However, enzymatic hydrolysis is more efficient at releasing most terpenes and benzyl alcohol (Ugliano and Moio 2008). Alcohols of more than two carbons are also known as fusel oils. They may be synthesized from grape-derived aldehydes via reductive denitrification of amino acids or from the synthesis of sugars (Jackson 2000). They are mainly formed during alcoholic fermentation, and their concentration is affected by factors such as chemical composition of the must, grape cultivar and fermentation conditions. These compounds have strong and pungent aromas and tastes, and have been described as herbaceous. Grape terpenes include monoterpene diols, nerol, citronellol, linalool, geraniol, α-terpineol and oxides (Strauss et al. 1986). They are found in the berry mainly as glycosides, with a small portion in the free form. Because they are not changed by yeast metabolism during fermentation, they can be used for varietal characterization of grapes and wines (Rapp 1990). Berries of other aromatic varieties, such as Muscat of Alexandria, have been shown to have high concentrations of monoterpenes (Sefton et al. 1989, Günata et al. 1985, 1993). Cordonnier and Bayonove (1974) found that most compounds derived under acid hydrolysis (pH 3.2) of juice were free terpenes. Esters are produced in grapes in small amounts, but the fruity aromas they contribute to wines are mainly derived from the metabolism of sugars and amino acids by yeast (Sweigers et al. 2005). In fruit, they may exist as glycosides. Some, mainly those that are derived from acetate and ethanol, have floral and fruity aromas and flavors (Zoecklein 1995). C-13 norisoprenoids are volatile compounds that may be the result of direct degradation of carotenoids, such as lutein and β-carotene (Marais et al. 1992), or they can be stored as glycoconjugates. They can impact varietal character due to their low odor threshold (Ferreira et al. 2002). They are found mainly in bound form, occurring in juice and/or wine after hydrolytic release (Wilson et al. 1986). In addition to the glycoside-bound fraction found in Petit Manseng, some sulfur compounds with thiol functions have been identified in this cultivar and others, mainly Sauvignon blanc

59
(Tominaga et al. 1998). These compounds are found in grapes in S-cysteine conjugate form, and are released during fermentation by an enzyme such as tryptophanase (Conde et al. 2007). Chone et al. (2006) found that an increase in wine nitrogen supply results in higher cysteine precursor levels in grape juice. The volatile thiols that result include 4-mercapto-4-methylpentan-2-one (4MMP), 3-mercaptohexan-1-ol (3MH), 3-mercapto-3-methylbutan-1-ol (3MMB) and 3-mercaptohexyl acetate (A3MH) (Tominaga et al. 2000). 4MMP and A3MH have strong box-tree aromas; 3MH, aromas of grapefruit; 4MMPOH, aromas of citrus; and 3MMB, aromas of cooked leeks (Tominaga et al. 2000). These compounds were not evaluated in this study. The formation of free and bound aromas and flavors may be influenced by nitrogen fertilization (Bell and Henschke 2005, Webster et al. 1993). The relationships between vineyard nitrogen and development of aroma and flavor compounds was evaluated previously, but not for the cultivar Petit Manseng (Castor and Guymon 1952, Chen 1978). Webster et al. (1993) demonstrated that nitrogen application had a mixed effect on free and bound aroma compounds. Wines from nitrogen-treated vines had higher levels of free linalool, but lower levels of linalool oxide and citronellol compared to control vines. In contrast, nitrogen-treated vines produced wines with higher concentrations of bound linalool oxide and citronellol. In another study, higher-alcohol concentrations were decreased in wines from nitrogen-treated vines (Ough and Bell 1980). However, Webster et al. (1993) demonstrate that some fruit from nitrogen-treated vines had increased higher-alcohol concentrations. It should be noted that higher-alcohol formation in wine depends on other factors as well, including availability of carbohydrates, oxygen and yeast cell growth (Ayrapaa 1971). Nitrogen application in the vineyard resulted in increased wine ester concentration (Ough and Lee 1981, Webster et al. 1993). Studies on a variety of plant species have reported nitrogen-sulfur fertilizer interactions on nutrient uptake (Rasmussen et al. 1975), yields (Janzen and Bettany 1984) and amino acid composition (Byers and Bolton 1979). These studies demonstrated a synergistic effect between nitrogen and sulfur assimilation rates on methionine and cysteine content, which may be explained by the interdependence of nitrogen and sulfur in several amino acid metabolic pathways (Giovanelli 1987). Lasa et al. (2012) noted that with foliar nitrogen applications, there were significant increases in the synthesis and concentration of amino acids, known precursors to some aroma and flavor compounds. Catabolism of amino acids usually begins with removal of the amino group by aminotransferases (Ardo 2006). A specific α-keto acid is produced from each amino acid; for example, leucine will form α-keto-isocaproate, the precursor for 3-methylbutanol. Further metabolism of the α-keto acid results in aroma and flavor compounds such as aldehydes, carboxylic acids and alcohols (Ardo 2006). The objective of this study was to determine the influence of vineyard nitrogen fertilization on the concentration of free and bound volatiles in Petit Manseng fruit by acid and enzymatic hydrolysis. This information may assist in identifying potential volatile aroma compounds in this cultivar and lead to methods to optimize vineyard fertilization practices.
Materials and Methods A two year study (2011 and 2012) was conducted using Petit Manseng (Vitis vinifera L.) grown in North Carolina ( 36° 23’ 3.90” N,-80° 43’ 12.20” W), elevation 2,000 feet, planted in 2008 on
60
rootstock 101-14 with 1.83 meter intra-row and 2.74 meter inter-row spacing. Vines were spur-pruned and cordon-trained, with upright shoots vertically shoot-positioned. Vineyard soil was a Clifford sandy clay loam described as, well drained, with moderate available water capacity (0.21 m). (NRCS, http://soils.usda.gov 2011). Treatments: A randomized complete block design consisting of six replications of four treatments was used. Treatments consisted of (1) control with no nitrogen or sulfur applications, (2) nitrogen at 30 kg/ha (Viking Ship® calcium nitrate 15.5-0-0, Yara North America, Inc., Tampa, FL) applied to soil just after flowering, (3) 15 kg/ha of urea nitrogen (Coron®, Helena Chemical Co., Collierville, TN) in two foliar applications prior to véraison and (4) 15 kg/ha of nitrogen (urea) and 5 kg/ha of micronized sulfur (Microthiol Disperss®, United Phosphorus Inc, King of Prussia, PA) in two applications prior to véraison. Treatments were applied to six randomized replicates of six vines each. Each replicate plot had six test vines with 3 vines per panel (separated by line posts) Treatment plots within the row were separated by 3 guard vines. Row end panels were not used as treatment panels. Foliar treatments were applied twice, at post-berry set and immediately pre-véraison. For treatment two, 98 g of calcium nitrate was dissolved in 473 mL of water and evenly distributed on the soil surface in a 0.46 m circle from the trunk around each vine. Seventy-five mL of Coron was dissolved in 6.82 L of water to spray one panel of three vines. A 22.7-L backpack sprayer was used (Solo®, Newport News, VA). No other soil amendment, fertilizer, sulfur sprays or irrigation was applied to the vines during the course of this study. Isolation of glycosides: Berry samples (50 berries each) were randomly collected from each treatment replicate at harvest in 2011 and 2012 and frozen at -18°C until processed. Samples were thawed and pressed in Seward® stomacher bags (Seward Stomacher Lab System, London, UK). Total juice volumes were measured for each treatment replicate. Juice was analyzed for selected free volatiles and glycosides by selective retention on Amberlite XAD-2 resin (Rohm-Hass, Philadelphia, PA) as described by Günata et al. (1985). The resin was suspended in methanol and poured into a glass column (35x1cm i.d.) fitted with a PTFE tap and a glass-wool stopper to produce a 10-cm column of resin. Several 25-mL volumes of methanol and diethyl ether were passed through, followed by 50 mL of water. Juice samples were diluted to 50 mL with distilled water and contained 10 µL of internal standard (0.1% 2-octanol in ethanol). Fractionation and determination of free and bound fractions: A juice sample (50 mL) was passed through the column at a flow rate of 2.0-2.5 mL/min. The column was rinsed with 50 mL distilled water. Free volatiles were eluted with 50 mL pentane at a flow rate of 2.0-2.5 mL/min. The pentane eluate was dried with anhydrous sodium sulfate. Samples were placed in separatory funnels and the organic phase collected. Samples were concentrated to a final volume of 50 µL under vacuum at 40°C prior to SPME (solid-phase microextraction) GC-MS. Fractionation of bound fraction: Columns were washed with 50 mL ethyl acetate to obtain the bound fraction at a flow rate of 2.0-2.5 mL/min. Eluate was divided into two 50 mL round-bottom flasks (one for enzymatic and one for acid hydrolysis). Eluate was dried with anhydrous sodium sulfate and concentrated, first to 1 mL under vacuum at 40°C, and then to dryness at 45°C using a nitrogen stream.

61
Enzymatic hydrolysis of glycosides: The eluate was dissolved in 0.2 mL of 0.2 M citrate-phosphate buffer, pH 5.0, washed four times with 0.1 mL pentane, and the pentane layer was removed, as described by Günata et al. (1985). To the organic layer, 0.4 mg enzyme (Lallzyme Beta®, Lallemand, Montreal, Canada) in 0.1 mL 0.2 M citrate phosphate buffer, pH 5.0, was added to the extract. The mixture was incubated at 40°C for 16 hr. Released aglycones were extracted with pentane five times. Samples were concentrated at 40°C to give a final volume of 40 µL. Diluent (3.96 mL of 10% reagent ethanol and 1 mM tartaric acid in HPLC-grade water) was placed in an SPME vial, with 1.6 µL propyl benzoate as an internal standard. Volatiles were identified and quantified using SPME and GC-MS, as described by Whiton and Zoecklein (2000) using a Hewlett Packard (Palo Alto, CA) model 5790 GC, model 5972 mass selective detector, and a Carbowax® 65 µm fiber (Supelco, Bellefonte, PA). Acid hydrolysis of glycosides: Dried eluate underwent acid hydrolysis as described by Sefton et al. (1993) and was analyzed for acid-released volatile aglycones. Acid hydrolysates were obtained by heating isolates in 4 mL 0.2 M citric acid, pH 2.5. Vials were incubated in a heat block for one hour at 100°C, cooled to room temperature, and stored at -80°C prior to analysis. Samples were placed in SPME vials with 1.6 microliters propyl benzoate added as an internal standard. Volatiles were identified and quantified using SPME and GC-MS. GC-MS conditions: Samples for GC-MS were prepared using 4mL samples with 1.0 g NaCl in 10-mL clear glass vials sealed with a septum (MicroLiter Analytical Supplies, Suwanee, GA). Vials were preincubated for 30 sec at 30°C with agitation at 250 rpm. A CAR/DVB/PDMS grey SPME fiber (Supelco Sigma-Aldrich, St. Louis, MO) penetrated the vial to a 32 mm depth into the headspace and equilibrated for 30 min. The SPME fiber was injected into a 6890N Network GC System, 5975B inert MSD GC-MS (Agilent Technologies, Santa Clara, CA). The fiber was desorbed for 90 sec with an inlet temperature of 250°C into DB-wax column (30 m x 2 mm). Helium carrier gas flow rate was 1 mL/min. Initial oven temperature was 40°C, ramped at 6°C/min to 230°C. To assess the influence of the isolated compounds on aroma, odor activity values (OAV) were determined by dividing the concentration of each compound by its perception threshold. Those compounds with OAVs greater than one may contribute to aroma (Guth 1997). Statistical analysis: Data was analyzed by ANOVA with JMP® Pro (version 10.0, SAS Institute, Cary, NC) and mean separation conducted using a protected LSD (version 10.0, SAS Institute, Cary, NC).
Results and Discussion
This study isolated and identified 56 compounds, using both enzyme and acid hydrolysis, from seven major groups: higher alcohols, terpenes, esters, carboxylic acids, aldehydes and ketones, C-13 norisoprenoids, and lactones.
Free aroma compounds: Mean concentrations of free aroma compounds from the four treatments in 2011 are shown in Table 1. In 2011, five alcohols, three terpenes, four esters, nine carboxylic acids, five aldehydes/ketones and one lactone were detected; six compounds were

62
found to differ among treatments. Decreases were noted in 2-ethyl-hexanol (0.20µg/L) versus the control treatment (3.24 µg/L) and 2-phenethyl alcohol (none detected) compared to the control treatment (228.10 µg/L) with foliar nitrogen plus sulfur fertilization. Some higher alcohols in wine are reduced by increased nitrogen fertilization (Ough and Bell 1980), but there are few studies that examined the impact of nitrogen fertilization on free and bound aroma compounds in fruit. Decanal, an aldehyde, differed among treatments, showing a decrease (3.23 µg/L in the control treatment) with soil nitrogen treatments (0.83 µg/L). Gamma-butyrolactone was lower in both foliar nitrogen (1.42e4 µg/L) and foliar nitrogen plus sulfur-treated vines (1.49e4 µg/L) compared to the control treatment (2.17e4 µg/L) Figure 1 shows the total amount of each major free aroma compound category in 2011, and the overall treatment effect on each. There was a decrease in total esters with foliar nitrogen applications, with lowest values observed in foliar nitrogen treatments (0.08 µg/L) versus the control (2.24 µg/L). Perhaps when assimilable nitrogen is not limited, amino acids may be utilized for cellular processes that do not involve ester formation (Ancin-Azpilicueta et al. 2012). Lacroux (2008) found that grape juice with adequate nitrogen content in the form of amino acids led to increased ethyl esters. A total of three terpenes were identified and quantified in the free fraction, (citronellol, linalool oxide isomer 2 and p-cymene). Citronellol and p-cymene contribute to the floral and fruity aromas and flavors in juice and wine, while linalool oxide contributes floral and herbal notes (Marais 1983). However, no differences were observed in the free aroma fraction in terpene content among treatments. Compounds with odor activity values (OAVs) greater than one are noted in Tables 1 through 6 (with an asterisk) for compounds detected by SPME GC-MS. Compounds with OAVs greater than one may contribute to the overall aroma of the juice samples analyzed in this study. In 2011, n-butanol had an OAV greater than one in both the control and soil nitrogen-treated vines, but not the other treatments (Table 1). In grape must with relatively low α-amino nitrogen needed for amino acid synthesis, surplus α-keto acids form higher alcohols (Vilanova et al. 2007). However, increased nitrogen levels may provide sufficient nitrogen for amino acid biosynthesis, reducing α-keto acids and, therefore, higher alcohols produced (Vilanova et al. 2007). These compounds are described as having medicinal notes. Isovaleric acid was above the odor detection threshold in both the control and sulfur-plus-nitrogen treatment. Isovaleric acid is described as fruity, cheesy and pungent (Etievant 1991). In 2012, free aroma compounds did not differ among treatments (Table 2), possibly as a result of climate conditions. There were above-average temperatures (23.4°C) in the thirty days prior to harvest compared to the 19.7°C average, with 28 out of 30 days prior to harvest exceeding 22°C. 2011 had average temperatures (19.44°C) and precipitation (559 mm) during the growing season (data not shown). In 2012, there was also above-average rainfall (712 mm, compared to 636 mm average) with prolonged rains both at bloom and in the last 30 days prior to harvest (156 mm, data not shown). The increased precipitation prior to harvest, when most aroma compounds are accumulating, may have also have had an impact. Ethyl hexanoate, with apple/apple peel and fruit notes (Escudero et al. 2007, Li et al. 2008 as cited by Villamor and Ross 2013), was above the threshold of detection in the foliar nitrogen-treated vines in 2012 only. Isovaleric acid was above the threshold in the 2011 foliar nitrogen-

63
plus-sulfur-treated vines. These compounds may produce wines with fruity/cheesy/pungent aromas and flavors. The γ-Butyrolactone levels, with buttery, caramel and burnt aromas (Maga 1987), were above the sensory threshold in all treatments in 2012 except the foliar nitrogen-plus-sulfur treatment (Figure 2). In 2012, γ-butyrolactone levels decreased with nitrogen treatments, and were lowest in the foliar nitrogen-plus-sulfur treatments (9.00 µg/L) compared to the control treatment (8.86e3 µg/L). This may be due to the fact that when assimilable nitrogen is not limited, amino acids may be utilized for alternative processes that do not involve formation of these compounds. Glycosidic aroma compounds liberated by acid hydrolysis: In 2011, bound fractions that underwent acid hydrolysis yielded eight alcohols, five terpenes, six esters, eight carboxylic acids, six aldehydes/ketones, one C-13 norisoprenoid, and three lactones (Table 3). In 2012, acid hydrolysis data had an increased number of volatiles detected, with some present in higher concentrations than 2011. Twelve alcohols, 6 terpenes, 2 lactones, 14 esters, 9 carboxylic acids, 8 aldehydes/ketones and 1 C-13 norisoprenoid were identified and quantified (Table 4). In 2011, differences among treatments were shown for both 2-ethyl hexanol and n-hexanol. In the control treatment, 2-ethyl hexanol was highest (16.11 µg/L), compared to soil nitrogen (8.39 µg/L), foliar nitrogen (4.22 µg/L) and foliar nitrogen plus sulfur treatments (9.13 µg/L). The foliar nitrogen-plus-sulfur treatment had increased levels of n-hexanol (28.69 µg/L) compared to the control treatment (5.16 µg/L). In 2012, 3-methyl-1-pentanol levels increased in the foliar nitrogen-treated vines (571.70 µg/L) and foliar plus sulfur treatment (131.70 µg/L), while not detected in the control and soil nitrogen treatments. Two alcohols in 2011 were above their aroma threshold: 1-octen-3-ol and 2-phenethyl alcohol. The compound 2-phenethyl alcohol contributes rose, lilac, spice and honey notes (Francis and Newton 2005). Foliar nitrogen-plus-sulfur treatment had increased 1-octen-3-ol (202.52 µg/L) compared to the control treatment (107.43 µg/L) and has earthy and fresh mushroom notes (Etievant 1991). The 2-phenethyl alcohol level increased in both the control (1.49e3 µg/L) and foliar nitrogen-plus-sulfur treatment (1.14e3 µg/L), with both above the OAV. Higher alcohols are formed by two different pathways: one-fourth due to catabolism of sugars, and the remainder to amino acid degradation (Bidan 1975). It is possible that the amino acids available due to nitrogen treatments contributed to observed increases. In 2011, most of the terpenes detected did not differ among treatments (Figure 3). But in 2012, foliar nitrogen-plus-sulfur treatments had increased p-cymene (20.30 µg/L) compared to the control (6.96 µg/L) and soil nitrogen treatments (3.40 µg/L). The compound p-Cymene can provide citrus aroma and flavors (Miyazawa et al. 2011). Foliar nitrogen treatments also demonstrated increased levels (39.55 µg/L). In 2012, total terpenes (Figure 4) were higher in the foliar nitrogen-plus-sulfur treated vines (1.10e4 µg/L) compared to the control treatment (8.29 µg/L). In 2011, total terpenes were higher (129.05 µg/L) compared to 2011 concentrations found in the free fraction (23.41 µg/L). The presence of these compounds in nitrogen treatments, at higher OAV levels, may indicate a treatment effect due to nitrogen applications. Esters in 2011, with the exception of hexyl acetate, did not differ among treatments. The total levels were higher in both foliar nitrogen (2.23e3 µg/L) and foliar nitrogen-plus-sulfur treatments (1.93e3 µg/L) versus the control treatment (397.62 µg/L). Hexyl acetate can contribute fruity, green apple, and herbal notes (Dennis et al. 2012).Total ester concentration was greater in the nitrogen-treated vines than the control in both 2011 and 2012 (Figures 3 and 4). In 2012, two ester compounds differed among treatments: both ethyl hexanoate and hexyl acetate were higher

64
in vines treated with foliar nitrogen alone (0.39 µg/L and 699.50 µg/L, respectively) compared to control vines (none detected and 284.50 µg/L, respectively). Foliar nitrogen-plus-sulfur treatments also had increased concentrations of ethyl hexanoate (0.05µg/L) and hexyl acetate (359.20 µg/L) versus the control treatment. Ethyl hexanoate has aromas of sweet, fruity pineapple and is positively correlated with both total nitrogen and free amino nitrogen (Webster et al. 1993). In 2012, two esters, ethyl octanoate and hexyl acetate, were above the sensory threshold of detection. Hexyl acetate was above threshold in all treatments, with foliar nitrogen treatments demonstrating the highest levels. Ethyl octanoate, which has fruity notes, was above threshold in the soil nitrogen treatment alone. This may be due to soil or climatic conditions at critical compound accumulation times. Most of the carboxylic acids did not differ among treatments. In 2011, 2-ethylhexanoic acid was highest (80.47 µg/L) in the control treatment, followed by the foliar nitrogen-plus-sulfur treatment (51.26 µg/L). The foliar nitrogen-plus-sulfur treatment demonstrated the highest total carboxylic acids (2.41e3 µg/L) compared to control (2.26e3 µg/L), soil nitrogen (1.44e3 µg/L) and foliar nitrogen (1.81e3 µg/L) treatments. There were few differences in aldehydes/ketones among treatments in 2011. Grapes produce few aldehydes and ketones that are important in generating varietal aromas (Jackson 2000). The most significant aldehydes are those not metabolized to alcohols during fermentation, mainly hexanals and hexenals, which may contribute herbaceous or grassy aromas to wine (Francis and Newton 2005). In 2012, decanal levels decreased with soil (8.39 µg/L), foliar nitrogen (4.22 µg/L), and foliar nitrogen plus sulfur (9.13 µg/L) applications compared to the control treatment (16.11 µg/L). β-Damascenone, a C-13 norisoprenoid, was found only in the foliar nitrogen-and-sulfur treatment (12.02 µg/L) in 2011. Others found that acid hydrolysates contained higher norisoprenoids than samples from fermentations (Loscos et al. 2009). β-Damascenone has sweet, apple, rose, and honey aromas (Francis and Newton 2005). In 2012, β-damascenone was detected in both the foliar nitrogen treatments (1.02 µg/L) and the foliar nitrogen-plus-sulfur treatments (0.61 µg/L). Sefton (1998) also found β-damascenone to be a major component of acid hydrolysis. The fact that this compound was found in nitrogen treatments only indicates a possible treatment effect due to nitrogen applications. Among the lactones, no differences were found among treatments. Lactones may come from grapes or may be formed during fermentation. Those derived from grapes do not usually contribute to varietal aromas (Jackson 2000), an exception being the γ-lactones (Rapp and Versini 1991). In 2012 there were no differences among treatments in lactone concentrations. However, in both 2011 and 2012, γ-butyrolactone was above its OAV in all treatments. In 2011 it decreased in soil (9.91e3 µg/L), foliar (1.11e4 µg/L) and in foliar nitrogen plus sulfur-treatments (8.55e3 µg/L) compared to the control (1.92e4 µg/L). In 2012 it decreased in soil (8.62e3 µg/L), foliar (915.05 µg/L ) and in foliar nitrogen plus sulfur-treatments (353.00 µg/L) compared to the control (3.62e3 µg/L).Gamma-butyrolactone contributes caramel, sweet aromas and fruity peach-like after notes (Lytra et al. 2012). Aroma compounds liberated by enzyme hydrolysis: 2011 bound fractions that underwent enzymatic hydrolysis yielded six alcohols, five terpenes, five esters, nine carboxylic acids, eight aldehydes/ketones and one lactone. No C-13 norisoprenoids were detected (Table 5). In 2012 (Table 6), there were increased numbers of aroma compounds and some increased concentrations

65
compared to 2011. Ten alcohols, 7 terpenes, 14 esters, 1 lactone, 8 carboxylic acids, 8 aldehydes/ketones and 1 C-13 norisoprenoid were detected and quantified. In 2011 alcohols, only 1-octen-3-ol levels differed among treatments, with the control being highest (154.18 µg/L) compared to soil (136.49 µg/L), foliar (31.61 µg/L) and foliar nitrogen plus sulfur (65.27 µg/L) treatments. Benzyl alcohol was found in the foliar nitrogen alone and nitrogen-plus-sulfur treatments. In 2012, 1-octen-3-ol again differed among treatments, showing decreasing levels with nitrogen fertilization (control 37.34 µg/L, soil nitrogen 24.64 µg/L, foliar nitrogen 22.65 µg/L and foliar nitrogen plus sulfur 7.77 µg/L). OAV values were greater than one for n-butanol in 2011 in both the control and sulfur-plus-nitrogen treatment. In 2012, n-hexanol was above the sensory detection threshold in all three nitrogen treatments, but not the control. Resin, flower, green and sweet are descriptors used for n-hexanol (Francis and Newton 2005). The various responses for the higher alcohols may be due to the fact that they also are produced during the metabolism of sugars, and not just from metabolism of amino acids (Ancin-Azpilicueta et al. 2012). There were no differences among treatments for terpenes in 2011, but total terpenes (Figure 5) decreased with nitrogen treatments (control 63.27 µg/L, soil nitrogen 58.85 µg/L, foliar nitrogen 5.42 µg/L and foliar nitrogen plus sulfur treatment 9.96 µg/L) and were lower than concentrations observed in 2011 acid hydrolysates (control 29.06 µg/L, soil nitrogen 22.31 µg/L, foliar nitrogen 43.15 µg/L and foliar nitrogen plus sulfur treatment 34.53 µg/L). This is in contrast to Loscos et al. (2009) who reported that enzymatic hydrolysis was more efficient than acid hydrolysis at releasing terpenes in grape varieties (other than Petit Manseng). 2012 total terpene levels (Figure 6) were lower than those for acid hydrolysates across all treatments. In 2012, p-Cymene differed among treatments, with all nitrogen treatments having increased levels (soil nitrogen 20.45 µg/L, foliar nitrogen 39.55 µg/L and foliar nitrogen plus sulfur treatment 20.30 µg/L) compared to the control (none detected), but still below the odor detection threshold. Nitrogen applications may have contributed to this increase across treatments. The esters differed among treatments in 2011. Hexyl acetate increased in both foliar nitrogen (626.8 µg/L) and foliar nitrogen-plus-sulfur applications (1.78e3 µg/L) compared to soil nitrogen (345.9 µg/L) and control treatments (227.70 µg/L). It was also above the sensory threshold of detection in all treatments, but highest in the foliar nitrogen-plus-sulfur treatment. 2011 and 2012 total ester concentrations increased across all treatments and increased with nitrogen applications. 2012 hexyl acetate was increased in all nitrogen treatments (soil nitrogen 361.60 µg/L, foliar nitrogen 700.90 µg/L and foliar nitrogen plus sulfur treatment 359.60 µg/L) compared to the control (298.60 µg/L). Levels were highest in the foliar nitrogen-treated vines. All treatments had OAVs greater than one (control 149.30, soil nitrogen 180.80, foliar nitrogen plus sulfur 179.80), with the foliar nitrogen treatment (OAV 350.45) being the highest. Total esters were increased in both acid and enzyme hydrolysis treatments compared to the free fraction. These findings are in agreement with Gardner et al. (results not yet published) that identified Petit Manseng as an ester-based cultivar. Foliar nitrogen-treated vines may have increased esters due to higher levels of absorbed nitrogen by the berries. Lasa et al. (2012) found that between 17 and 80% of the nitrogen applied to leaves was absorbed by the berries. Others found that 30% of the nitrogen absorbed by leaves was transported to the berry, compared to only 2% of root-absorbed nitrogen (Schreiber et al. 2002). In 2011, some carboxylic acids differed among treatments. Decanoic acid concentration decreased with nitrogen applications (soil nitrogen 1.33 µg/L, foliar nitrogen 0.14 µg/L and

66
foliar nitrogen plus sulfur treatments 0.22 µg/L) compared to the control treatment (0.44 µg/L). 2012 fatty acid measurements had differences in two compounds. Both 2-ethylhexanoic acid and decanoic acid decreased with nitrogen treatments. In soil nitrogen (0.62 µg/L), foliar nitrogen (0.26 µg/L) and foliar nitrogen plus sulfur (0.14 µg/L) treatments, 2 ethylhexanoic acid levels decreased compared to the control (25.99 µg/L). Soil nitrogen (183.30 µg/L), foliar nitrogen (236.60 µg/L) and foliar nitrogen plus sulfur (123.30 µg/L) treatments were decreased for decanoic acid compared to the control (442.50 µg/L), indicating that excess nitrogen may be detrimental to certain aroma compounds. Nonyl aldehyde differed among treatments in 2011. Foliar nitrogen-plus-sulfur treatments had the highest concentration (7.03 µg/L), with foliar nitrogen treatments demonstrating increases as well (2.23 µg/L), compared to the control and soil nitrogen treatments with no nonyl-aldehyde detected. 2012 nonyl aldehyde levels varied among treatments with none detected in the control, 1.15 µg/L in the soil nitrogen, 0.48 µg/L in the foliar nitrogen and 0.46 µg/L in the foliar nitrogen plus sulfur treatment. This may indicate that nitrogen is not the only factor in determining aroma and flavor content. No C-13 norisoprenoids were detected in 2011. Others reported that norisoprenoids were hydrolyzed better by harsh acid hydrolysis compared to enzymatic hydrolysis (Sefton et al. 1993). β-damascenone was found in 2012 hydrolysates, but may have been formed by unwanted acid hydrolysis during sample manipulation, as suggested by Loscos et al. (2009). S-cysteine conjugates were not measured in this study. However, in a separate study, 3MMB, 3MH and A3MH were identified in four different Virginia Petit Manseng wines (data not shown). It should be noted that wine is a complex matrix, with wine and juice aromas and flavors resulting from many interactions among a large number of compounds. Compounds may show synergistic (one compound enhances the perception of another) and/or antagonistic (one compound suppresses the perception of another) interactions (Gustav et al. 2011). These interactions can determine the overall aroma and flavor of wine, without being recognized for their OAV (Etievant 1991). Aroma and flavor compounds in mixtures almost always show reciprocal suppression, in which each compound decreases the perceived intensity of the others (Laing et al. 1984). Some aroma and flavor increases may be due to volatiles binding to proteins, resulting in a decrease in their suppressive effect on other free volatiles (Jones et al. 2008).
Conclusions
To our knowledge, this is the first study to examine the free and bound aroma compounds of the cultivar Petit Manseng. The concentrations of free and bound terpenes, higher alcohols, and esters in Petit Manseng juice from grapes harvested from a vineyard nitrogen fertilization study in 2011 and 2012 demonstrated significant differences, depending on the application of nitrogen, the compound and the year. Both acid and enzymatic hydrolysis demonstrated potential to release bound aroma and flavor compounds. Acid hydrolysis released more terpenes with nitrogen applications than did enzymatic hydrolysis, while ester content increased in both treatments with nitrogen-treated vines.

67
This study demonstrated that seven major groups of aroma and flavor compounds are potentially responsible for the varietal aroma and flavor of Petit Manseng. The use of various winemaking practices to release glycosidically-bound aroma and flavor compounds may be needed for expression of full aroma and flavor potential. Data presented in this study may be useful in establishing recommendations for vineyard nitrogen fertilization for Petit Manseng.
68
Literature Cited Abbott, N.A., B.G. Coombe, and P.J. Williams. 1991. The contribution of hydrolyzed flavor precursors to quality differences in Shiraz juice and wines: an investigation by sensory descriptive analysis. Am. J. Enol. Vitic., 42:167-174. Allen, M.S., M.J. Lacy, R.N. Harris, and W.V. Brown. 1991. Contribution of methoxypyrazines to Sauvignon blanc wine aroma. Am. J. Enol. Vitic. 42:109-112. Ancin-Azpilicueta, C., R. Nieto-Rojo, and J. Gomez-Cordon. 2012. Effect of foliar urea fertilization on volatile compounds in Tempranillo wine. J. Sci. Food Agric. 93:1485-1491. Ardo, Y. 2006. Flavour formation by amino acid catabolism. Biotechnology Advances. 24:238-242. Ayrapaa, T. 1971. Biosynthetic formation of higher alcohols by yeast. Dependence on the nitrogenous nutrient level of the medium. J. Inst. Brew. 77:266-75. Bell, S.J., and P.A. Henschke. 2005. Implications of nitrogen nutrition for grapes, fermentation and wine. Austr. J. Grape Wine Res. 11:242-295. Bidan, P. 1975. Relation entre la teneur des vins en alcools duperieurs et la teneur des mouts en substances azotees, en particulier en acides amines. Bull. O.I.V. 48:842-867. Byers, M., and J. Bolton. 1979. Effect of nitrogen and sulfur fertilizers on the yield, N and S content, and amino acid composition of the grain of spring wheat. J. Sci. Food Agric. 30:251-263. Castor, J.G.B. and J.F. Guymon. 1952. On the mechanism of formation of higher alcohols during alcoholic fermentation. Science 115:147-9. Chen, E.C.H. 1978. The relative contribution of Ehrlich and biosynthetic pathways to the formation of fusel alcohols. Am. Soc. Brew. Chem. 36:39-43. Chone, X., V. Lavigne-Cruege, T. Tominaga, C. Van Leeuwen, C. Castagnede, C. Saucier, and J.D. Dubourdieu. 2006. Effect of vine nitrogen status on grape aromatic potential: flavor precursors (S-cysteine conjugates), glutathione and phenolic content in Vitis vinifera L. cv. Sauvignon blanc grape juice. J. Int. Sci. Vigne Vin. 40:1-16. Conde, C., P. Silva, N. Fontes, A.C.P. Dias, R. M. Tavares, M. Sousa, A. Agasse, S. Delrot, and H. Geros. 2007. Biochemical changes throughout grape berry development and fruit and wine quality. Food 1: 1-22. Cordonnier, R., and C.Bayonove. 1974. Mise en evidence dans le baie de raisin variete Muscat d’Alexandria de monoterpernes lies revelables par une ou plusieurs enzymes du fruit. Comptes Rendus de l’Academie des Sciences. 278:3387-3390. Dennis, E.G., R.A. Keyzers, C.M. Kalua, S.M. Maffei, E.L. Nicholson and P.K. Boss. 2012. Grape contribution to wine aroma: production of hexyl acetate, octyl acetate, and benzyl acetate

69
during yeast fermentation is dependent upon precursors in the must. J. Agric. Food Chem. 60:2638-2646. Dubourdieu, D.P., P. Darriet, C. Oliver, J.N. Boidron, and P. Ribereau-Gayon. 1988. Role of the yeast Saccharomyces cerevisiae in enzymatic hydrolysis of terpenic heterosides of grape juice. Comptes rendus de séances de l’academie des Sciences. 3:489-493. Escudero A., B. Gogorza, M.A. Melus, N. Ortin, J. Cacho, and V. Ferreira. 2004. Characterization of the aroma of a wine from Maccabeo. Key role played by compounds with low odor activity values. J. Agric. Food Chem. 52:35116-3524. Etievant, P. 1991.Wine. In Volatile compounds in foods and beverages. H. Maarse, (Ed) TNO-CIVO Food Analysis Institute. Zeist, the Netherlands. Marcel Dekker, Inc., New York. pp483-546. Ferreira, V., N. Ortin, A. Escudero, R. Lopez, and J. Cacho. 2002. Chemical characterization of the aroma of Grenache rosé wines: aroma extract dilution analysis, quantitative determination, and sensory reconstitution studies. J. Agric. Food Chem. 50:4048-4054. Francis, I.L. and J.L. Newton. 2005. Determining wine aroma from compositional data. Aus. J. Grape Wine Res. 11:114-126. Francis, L., M.A. Sefton, and P.J. Williams. 1992. Sensory descriptive analysis of the aroma of hydrolyzed precursor fractions from Sémillon, Chardonnay and Sauvignon blanc grape juices. J. Sci. Food Agric. 59:511-512. Francis, I.L., A.C. Noble, and P.J. Williams. 1996. The sensory properties of glycosidic flavor precursors from Cabernet Sauvignon and Merlot grapes. In Proceedings of the Ninth Australian Wine Industry Technical Conference, Adelaide, South Australia, 16-19 July 1995. C.S. Stockley et al. (eds.), pp. 87-90. Winetitles, Adelaide. Francis, I.L., S. Kassara, A.C. Noble, and P.J. Williams. 1998. The contribution of glycosidic precursors to Cabernet sauvignon and Merlot aroma; sensory and compositional studies. In The Chemistry of Wine Flavor. Eds A.L. Waterhouse and S.E. Ebeler (American Chemical Society, Washington, DC) Giovanelli, J. 1987. Sulfur amino acids of plants: an overview. In Meth. Enzymol. Vol. 143.W.B. Jakoby and O.W. Griffith (eds.) , pp.419-426. Academic Press, New York. Günata, Y.Z., C. Bayonove, R. Baumes, and R. Cordonnier. 1985. Extraction and determination of free and glycosidically bound fractions of some grape aroma constituents. J. Chromatogr. A. 331:83-90. Günata, Y.Z., S. Bitteur, J.M. Brillouet, C.L. Bayonove, and R.E. Cordonnier. 1988. Sequential enzymatic hydrolysis of potentially aromatic glycosides from grapes. Carbohydr. Res. 184:139-149.

70
Günata, Y.Z., I. Dugelay, R. Sapis, R.L. Baumes, and C.L. Bayonove. 1993. Role of enzymes in the use of the flavor potential for grape glycosides in winemaking. In Progress in Flavor Precursor Studies. P. Schreaier and P. Winterhalter (eds), pp. 57-70. Allured, Carol Stream, IL. Günata, Y.Z., C. Blondeel, M.J. Vallier, J.P. Lepoutre, J.C. Sapis, and N. Watanabe. 1998. An endoglycosidase from grape berry skin of cv. M. Alexandria hydrolyzing potentially aromatic disaccharide glycosides. J.Agric. Food Chem. 46:2748-2753. Gustav, S., B. Prior, and F.F. Bauer. 2011. Wine flavor and aroma. J. Ind. Microbiol. Biotechnol. 38:1145-1159. Guth, H., 1997. Identification of character impact odorants of different white wine varieties. J. Agric. Food Chem. 45: 3022-3026. Ibarz, M., V. Ferreira, P. Hernandez-Orte, N. Loscos, and J. Cacho. 2006. Optimization and evaluation of a procedure for the gas chromatographic-mass spectrometric analysis of the aromas generated by fast acid hydrolysis of flavor precursors extracted from grapes. J. Chromatog. A. 1116:217-229. Jackson, R. 2000. Wine Science, Principles, Practices, Perception. Academic Press, San Diego. Janzen, H.H., and J.R. Bettany. 1984. Sulfur nutrition of rapeseed. I. Influence of nitrogen and sulfur rates. Soil Sci. Soc. Am. J. 48:100-107. Jones, P.R., R. Fawel, I.L. Francis, and E.J. Waters. 2008. The influence of interactions between major white wine components on the aroma, flavour and texture of model white wine. Food Quality and Preference. 19:596-607. Lacroux, F., O. Tregoat, C. Van Leeuwen, A. Pons, T. Tominaga, V. Lavigne-Cruege, and D. Dubourdieu. 2008. Effect of foliar nitrogen and sulfur application on aromatic expression of Vitis vinifera L. cv. Sauvignon blanc. J. Int. Sci. Vigne Vin. 42:125-132. Laing, D.G., H. Panhuber, M. Wilcox, and E.A. Pittman. 1984. Quality and intensity of binary odor mixtures. Physiology and Behavior. 33:309-319. . Lasa, B., S. Menendez, K. Sagastizabal, M. Erendira Calleja Cervanter, I. Irigoyen, J. Muro, P.M. Aparicio-Tejo, and I. Ariz. 2012. Foliar application of urea to Sauvignon blanc and Merlot vines: doses and time application. Plant Growth Regul. 67:73-81. Li, H., Y.S. Tao and H. Wang. 2008. Impact odorants of Chardonnay dry white wine. Eur. Food Res. Technol. 227:287-292. Loscos, N.,P.Hernández-Orte , J. Cacho and V. Ferreira. 2009. Comparison of the Suitability of Different Hydrolytic Strategies To Predict Aroma Potential of Different Grape Varieties. J. Agric. Food Chem. 57:2468-2480. Lytra, G., S. Tempere, G. de Revel and J. C. Barbe. 2012. Impact of perceptive interactions on red wine fruity aroma. J. Agric. Food Chem. 60:12260-12269.
71
Maga, J.A. 1987 The flavor chemistry of wood smoke. Food Reviews International 3, 139–183. Marais, I. 1983. Terpenes in the aroma of grapes and wines: a review. South African J for Enology and Vitic. 4:49-60. Marais, J., C. Van Wik, and A. Rapp. 1992. Effect of sunlight and shade on norisoprenoid levels in maturing Weisser Riesling and Chenin blanc wines. South African J. of Enol. Vitic. 13:23-32. Marinos, V.A., M.E. Tate, and P.J. Williams. 1994. Protocol for FAB MS/MS characterization of terpene disaccharides of wine. J. Agric. Food Chem. 42:2486-2492. Miyazawa, M., S. Hashidume, T. Takahashi and T. Kikuchi. 2011. Aroma evaluation of gamazumi (Viburnum dilatatum) by aroma extract dilution analysis and odour activity value. Phytochem. Anal. 23:208-213. Ough, C.S., and A.A. Bell. 1980. Effect of vineyard nitrogen fertilization level on the formation of some fermentation esters. Am. J. Enol. Vitic. 32:125-7. Ough, C.S., and T.H. Lee. 1981. Effect of vineyard nitrogen fertilization level on the formation of some fermentation esters. Am. J. Enol. Vitic. 32:125-7. Rapp, A. 1990. Natural flavours of wine: correlation between instrumental analysis and sensory perception. J. Anal. Chem. 337:777-85. . Rapp, A., and G. Versini. 1991. Influence of nitrogen compounds in grapes on aroma compounds in wines. In Proceedings of the International Symposium on Nitrogen in Grapes and Wine. J.M.Rantz (ed.), pp. 156-164. Am. Soc. Enol. Vitic., Davis, CA. Rasmussen, P.E., R.E. Ramig, R.R. Allmaras, and C.M. Smith. 1975. Nitrogen-sulfur relations in soft winter wheat. II. Initial and residual effects of sulfur application on nutrient concentration, uptake, and N/S ratio. Agron. J. 67:224-228. Schreiber, A.T., N. Merkt, R. Blaich, and R. Fox. 2002. Distribution of foliar applied labeled nitrogen in grapevines (Vitis vinifera L., cv. Riesling). Proceedings of the International Symposium on Foliar Nutrition of Perennial Fruit Plants. Acta Hort. 594:139-148. Sefton, M.A. 1998. Hydrolytically released volatile secondary metabolites from a juice sample of Vitis vinifera grape cvs. Merlot and Cabernet Sauvignon. Aust. J. Grape Wine Res. 4:30-38. Sefton, M.A., G. Skouroumounis, R.A. Massy-Westropp, and P.J. Williams. 1989. Norisoprenoids in Vitis vinifera white wine grapes and the identification of a precursor of damascenone in these fruits. Austral. J. Chem. 42: 2071-2084. Sefton, M.A., I.L. Francis, and P.J. Williams. 1993. The volatile composition of Chardonnay juices: a study of flavor precursor analysis. Am. J. Enol. Vitic. 44: 359-370. Sefton, M.A. 1998. Hydrolytically released volatile secondary metabolites from a juice sample of Vitis vinifera grape cvs. Merlot and Cabernet Sauvignon. Aust. J. Grape Wine Res. 4:30-38.
72
Skouroumounis, G.K., and M.A. Sefton. 2000. Acid-catalyzed hydrolysis of alcohols and their β-D-glucopyranosides. J. Agric. Food Chem. 48:2033-2039. Strauss, C.R., E. Dimitiadis, B. Wilson, and P.J. Williams. 1986. Studies on the hydrolysis of two megastigma-3,6,9-triols rationalizing the origins of some volatile C13 –norisoprenoids of Vitis vinifera grapes. J. Agric. Food Chem. 34:145-149. Sweigers, J.H., E.J. Bartowsky, P.A. Henschke, and I.S. Pretorius. 2005. Yeast and bacterial modulation of wine aroma and flavor. Austral. J. Grape Wine Res. 11:139-173. Tominaga, T., M. L. Murat, and D. Dubourdieu. 1998. Development of a method for analyzing the volatile thiols involved in the characteristic aroma of wines made from Vitis vinifera L. cv. Sauvignon blanc. J. Agric. Food Chem. 46:1044-1048. Tominaga, T., R. Baltenweck-Guyot, C. Peyrot des Gachons, and D. Dubourdieu. 2000. Contribution of volatile thiols to the aromas of white wines made from several Vitis vinifera grape varieties. Am. J. Enol. Vitic. 51:178-181. Ugliano, M., and L. Moio. 2008. Free and hydrolytically released volatile compounds of Vitis vinifera L. cv. Fiano grapes as odour-active constituents of Fiano wine. Analyt. Chim. Acta 621:79-85. Ugliano, M., E. J. Bartowsky, J. McCarthy, L. Moio , and P.A. Henschke. 2006. Hydrolysis and transformation of grape glycosidically bound volatile compounds during fermentation with three Saccharomyces yeast strains. J. Agric. Food Chem. 54:6322-6331. Vasserot, Y., A. Arnaud, and P. Galzy. 1995. Monoterpenol glycosides in plants and their biotechnological transformation. Acta Biotechnol. 15:77-95. Vilanova, M., M. Ugliano, C. Varela, T. Siebert, I.S. Pretorius, and P.A. Henschke. 2007. Assimilable nitrogen utilization and production of volatile and non-volatile compounds in chemically defined medium by Saccharomyces cerevisiae wine yeasts. Appl. Microbiol. Biotechnol. 77:145-157.
Villamor R.R. and C.F. Ross. 2013. Wine matrix compounds affect perception of wine aromas. Annu. Rev. Food Sci. Technol. 4:1-20.
Webster, D. R., C.G. Edwards, S.E. Spayd, J.C. Peterson, and B.J. Seymour. 1993. Influence of vineyard nitrogen fertilization on the concentration of monoterpenes, higher alcohols, and esters in aged Riesling wines. Am. J. Enol. Vitic. 44:275-284. Whiton, R.S., and B.W. Zoecklein. 2000. Optimization of headspace solid-phase microextraction for analysis of wine aroma compounds. Am. J. Enol. Vitic. 51:379-382. Williams, P.J., C.R. Strauss, B. Wilson, and R.A. Massy-Westropp. 1982. Studies on the hydrolysis of Vitis vinifera monoterpene precursor compounds and model monoterpene β-D glucosides rationalizing the monoterpene composition of grapes. J. Agric. Food Chem. 30:1219-1223.

73
Williams, P.J., M.A. Sefton, and F. Leigh. 1992. Glycosidic precursors of varietal grape and wine flavor. In Flavor Precursors: Thermal and Enzymatic Conversions. ACS Symposium Series 490. R. Teranishi, G.R. Takeoka, and M. Guntert (eds.), pp. 74-86. American Chemical Society, Washington, D.C. Wilson, B., C.R. Strauss, and P.J. Williams. 1986. The distribution of free and glycosidically bound monoterpenes among skin, juice, and pulp fractions of some white grape varieties. Am. J. Enol Vitic. 37:107-111. Winterhalter, P. and G.K. Skouromounis. 1997. Glycoconjugated aroma compounds: occurence, role and biotechnological transformation. In Advances in Biochemical Engineering/Biotechnology, Vol. 55. R.G. Berger (ed.), pp. 73-105. Springer-Verlag, Berlin. Zoecklein, B.W., K.C. Fugelsang, B.H. Gump, and F.S. Nury. 1995. Wine Analysis and Production. Chapman and Hall, New York.

74
Table 1 Effect of soil and foliar applications of nitrogen and sulfur on free aroma compounds (means of six replicates in µg/L) in 2011 Petit Manseng juice.
Controla Soil
Nitrogen Foliar
Nitrogen
Foliar Nitrogen
and Sulfur2-Ethyl-1-hexanol
3.24ab 0.83b ndc 0.20b
Benzyl alcohol 0.04
nd nd nd
cis-3-Hexenol nd
nd nd 0.21°
n-Butanol 2.94e4a*d ° 3.03e4a*°
nd nd
Alcohols
Phenethyl alcohol
228.10a nd 3.33b nd
Citronellol 2.59a°
nd 0.37a° nd
Linalool oxide isomer 2
5.73a 4.09a° 2.86a 4.09a
Terpenes
p-Cymene nd nd 2.06a
1.63a
Ethyl dodecanoate
2.24°
nd nd nd
Ethyl palmitate nd 43.61°
nd nd
Isoamyl acetate nd 1.62a° nd 0.14a°
Esters
Isoamyl octanoate
nd nd 0.084
nd
2-Ethylhexanoic acid
39.53a 20.47a 25.35a 28.34a
Benzoic acid 52.68a
25.27a° nd nd
Decanoic acid 186.00a 216.20a 142.40a 142.70a
Dodecanoic acid 5.81a 6.67a° 2.97a° 1.01a°
Carboxylic Acids
Hexanoic acid 284.00
nd nd nd
Isovaleric acid 6.07e3a*° nd nd 3.06e3a*°
Nonanoic acid 0.23
nd nd nd
Octanoic acid 233.30
nd nd nd
trans-2- 39.53a 20.47a 25.35a 28.34a

75
Hexenoic acid
2-Acetylfuran 2.86°
nd nd nd
Benzaldehyde nd nd nd nd Decanal 3.23a 0.83b nd 0.20b
Furfural nd
nd nd nd
Aldehydes/ Ketones
Nonyl aldehyde 33.76a° nd
nd 6.80a°
C-13 norisoprenoids
nd nd nd nd
Lactones γ-Butyrolactone 2.17e4a 2.00e4ab 1.42e4c
1.49e4bc
aControl: no treatment; Soil Nitrogen: nitrogen 30 kg/ha after flowering; Foliar Nitrogen: nitrogen 15 kg/ha (two applications prior to véraison); Foliar Nitrogen and Sulfur: nitrogen 15 kg/ha and sulfur 5 kg/ha. bDifferent letters within rows indicate significant differences at p<0.05 (Student’s t-test). cnd = none detected. d* = odor activity value > 1. e ° = compound detected in 1 out of 6 replicates

76
Table 2 Effect of soil and foliar applications of nitrogen and sulfur on free aroma compounds (means of six replicates in µg/L) in 2012 Petit Manseng juice.
Controla Soil
Nitrogen Foliar
Nitrogen
Foliar Nitrogen
and Sulfur1-Octanol 0.50°
nd 12.43°
nd
1-Propanol 125.00°
16.00°
17.00
297.00°
2-Ethyl-1-hexanol
nd nd 0.16
nd
3-Methyl-1-pentanol
nd 51.00°
114.00°
nd
Benzyl alcohol nd 0.62°
0.48°
nd
Alcohols
Phenethyl alcohol
nd nd 28.00
nd
Terpenes Linalool oxide
isomer 2 3.37°
2.25
4.08°
2.76
Ethyl decanoate nd nd 6.00°
0.14°
Ethyl hexanoate nd nd 180.77*d °
nd
Ethyl lactate 5.05°
2.82
3.40
nd
Ethyl nonanoate nd nd nd 0.35°
Isoamyl octanoate
nd nd 0.58°
nd
Esters
Methyl salicylate nd nd nd 20.89°
2-Ethylhexanoic acid
0.21
0.18
23.39 26.02
Decanoic acid 159.00
67.00
426.00
448.00
Dodecanoic acid nd nd 2.63
7.42
Isovaleric acid nd nd nd
1.14e6*°
Myristic acid 209.53
74.20
268.20
98.81
Nonanoic acid nd nd nd 0.06
Carboxylic Acids
Octanoic acid nd nd nd 70.0
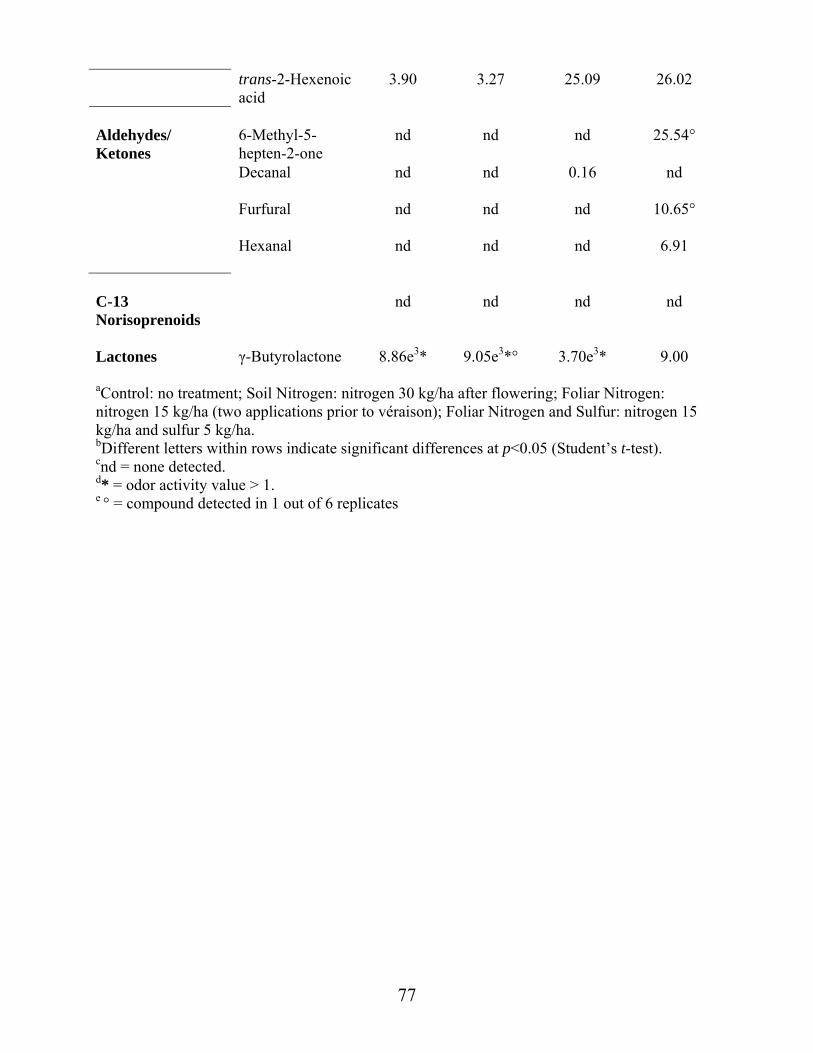
77
trans-2-Hexenoic acid
3.90
3.27
25.09
26.02
6-Methyl-5-hepten-2-one
nd nd nd 25.54°
Decanal nd nd 0.16
nd
Aldehydes/ Ketones
Furfural nd nd nd 10.65°
Hexanal nd nd nd 6.91
C-13 Norisoprenoids
nd nd nd nd
Lactones γ-Butyrolactone 8.86e3* 9.05e3*° 3.70e3* 9.00
aControl: no treatment; Soil Nitrogen: nitrogen 30 kg/ha after flowering; Foliar Nitrogen: nitrogen 15 kg/ha (two applications prior to véraison); Foliar Nitrogen and Sulfur: nitrogen 15 kg/ha and sulfur 5 kg/ha. bDifferent letters within rows indicate significant differences at p<0.05 (Student’s t-test). cnd = none detected. d* = odor activity value > 1. e ° = compound detected in 1 out of 6 replicates

78
Table 3 Effect of soil and foliar applications of nitrogen and sulfur on acid hydrolysis products (means of six replicates in µg/L) in 2011 Petit Manseng juice.
Controla Soil
Nitrogen Foliar
Nitrogen
Foliar Nitrogen
and Sulfur1-Octanol 57.02a° nd nd 86.34a 1-Octen-3-ol 107.43a 139.20a 145.50a
202.52a*
1-Propanol nd 181.00a
37.20a° 23.50a°
2-Ethyl-1-hexanol
16.11a 8.39ab 4.22b 9.13ab
2-Methyl propanol
nd nd 0.57°
nd
3-Methyl-1-pentanol
nd
383.00
nd
nd
n-Hexanol 5.16b 9.17b 9.54b
28.69a
Alcohols
Phenethyl alcohol
1.49e3a* nd 543.00a 1.14e3a
α-Terpineol nd nd nd 19.75°
Linalool oxide isomer 2
22.82a 22.31a 17.08a 12.57a
Linalool nd
nd nd nd
p-Cymene 6.24a nd
nd
2.21ab
Terpenes
Terpinene-4-ol nd nd 26.07°
nd
Diethyl succinate nd 2.71e3 °
nd nd
Ethyl decanoate nd nd 9.13°
nd
Ethyl heptanoate 3.32°
nd nd nd
Ethyl hexanoate 0.18
nd nd nd
Ethyl nonanoate
nd
nd
nd
0.12
Esters
Hexyl acetate 394.30b 838.40b 1.92e3a 2.23e3a°

79
2-Ethylhexanoic acid
80.47a
28.29b
35.96b
51.26ab
Benzoic acid 42.20a 19.03a
nd 2.25a°
Decanoic acid 344.00a 303.00a
201.00a 334.00a
Dodecanoic acid 8.81a 35.78a°
1.39a° 8.74a
Hexanoic acid 619.00a
387.00a 488.00a 625.00a
Nonanoic acid 0.80a
0.61a 0.16a 0.56a
Octanoic acid 1.08e3a
638.00a 1.044e3a° 1.34e3a
Carboxylic Acids
trans-2-Hexenoic acid
80.47a 28.29a 35.96a 51.26a
Benzaldehyde 0.80a 0.52a
nd 7.80a
Decanal 16.11a 8.39ab 4.22b
9.13ab
Furfural nd 2.80°
nd nd
Hexanal 25.30a nd
66.87a 41.80a
Nonyl aldehyde 40.90a 38.26a 31.63a° nd
Aldehydes/ Ketones
Octanal 92.20a 27.16a 19.47a 112.16a C-13 Norisoprenoids
β-Damascenone
nd nd nd 12.02°
Acetophenone 8.53a 10.17a
nd nd
γ-Butyrolactone
1.92e4a*
9.91e3a*
1.11e4a*
8.55e3a*
Lactones
γ-Nonalactone nd nd 0.52a°
0.50a°
aControl: no treatment; Soil Nitrogen: nitrogen 30 kg/ha after flowering; Foliar Nitrogen: nitrogen 15 kg/ha (two applications prior to véraison); Foliar Nitrogen and Sulfur: nitrogen 15 kg/ha and sulfur 5 kg/ha. bDifferent letters within rows indicate significant differences at p<0.05 (Student’s t-test). cnd = none detected. d* = odor activity value > 1. e ° = compound detected in 1 out of 6 replicates

80
Table 4 Effect of soil and foliar applications of nitrogen and sulfur on acid hydrolysis products (means of six replicates in µg/L) in 2012 Petit Manseng juice.
Controla Soil
Nitrogen Foliar
Nitrogen
Foliar Nitrogen
and Sulfur1-Octanol ndb nd
1.29ac 0.41a
1-Octen-3-ol 49.91a
55.81a 29.99a 19.88a
1-Propanol nd nd nd 0.01
2-Ethyl-1-hexanol
1.93ab 2.98a 1.65ab 0.45b
2-Methyl propanol
nd nd nd 0.03
3-Methyl butanol nd nd
44.00a 42.00a
3-Methyl-1-pentanol
nd nd 571.70a 131.70b
Benzyl alcohol nd nd
2.29a 1.08a
cis-3-Hexenol nd nd
1.60e3a 1.42e3a
n-Butanol nd nd
46.00a° 14.00a°
n-Hexanol 1.50e5ad 1.17e5a* 2.33e5a*
1.21e5a*
Alcohols
Phenethyl alcohol
472.00a 566.00a 327.00a 174.00a
α-Terpineol nd nd
0.06a 0.04a
Citronellol nd nd 0.09a
0.04a
Linalool oxide isomer 2
1.34a 1.29a° 0.05a 1.10e4a
Linalool nd nd
0.03a 0.02a
p-Cymene 6.96bc 3.40c
39.55a 20.30b
Terpenes
Terpinene-4-ol nd
5.38a 0.07a 0.05a
Diethyl succinate nd nd
4.16e3a° 2.01e3a Esters
Ethyl decanoate nd nd
0.35a 2.73a
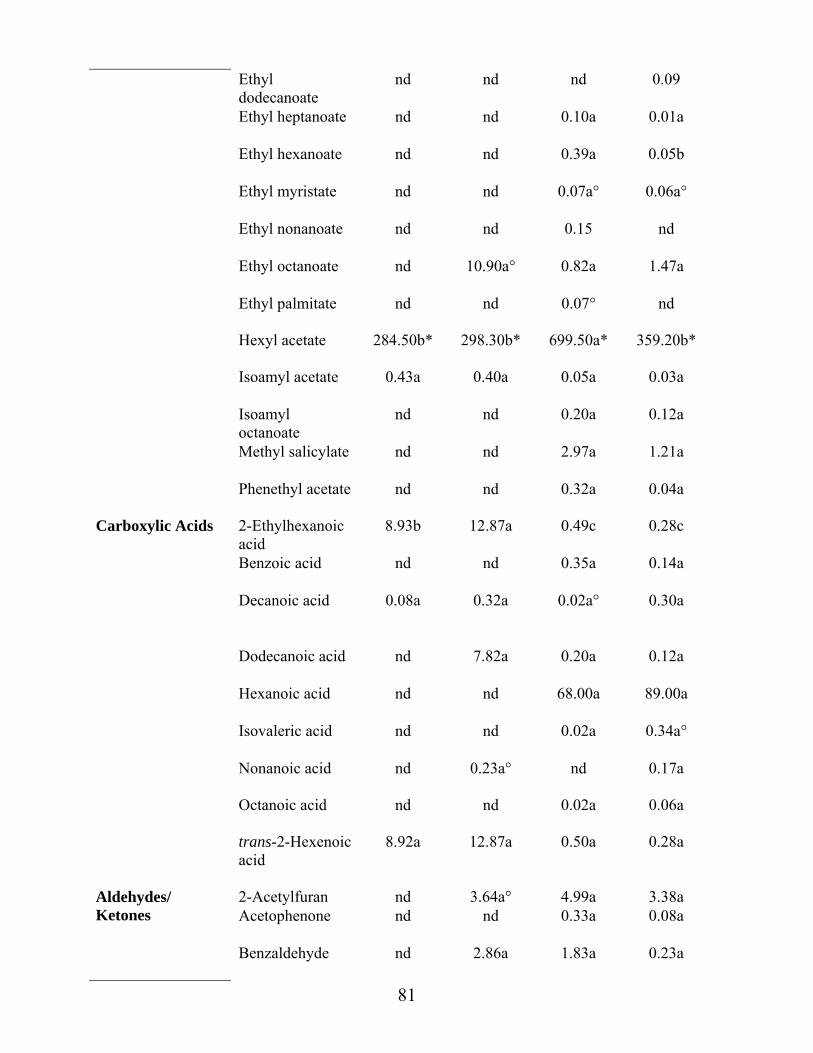
81
Ethyl dodecanoate
nd nd nd 0.09
Ethyl heptanoate nd nd
0.10a 0.01a
Ethyl hexanoate nd nd 0.39a
0.05b
Ethyl myristate nd nd 0.07a°
0.06a°
Ethyl nonanoate nd nd 0.15
nd
Ethyl octanoate nd 10.90a°
0.82a 1.47a
Ethyl palmitate nd nd 0.07°
nd
Hexyl acetate 284.50b* 298.30b*
699.50a* 359.20b*
Isoamyl acetate 0.43a 0.40a
0.05a 0.03a
Isoamyl octanoate
nd nd 0.20a 0.12a
Methyl salicylate nd nd
2.97a 1.21a
Phenethyl acetate nd nd 0.32a 0.04a
2-Ethylhexanoic acid
8.93b 12.87a 0.49c 0.28c
Benzoic acid nd nd
0.35a 0.14a
Decanoic acid 0.08a 0.32a
0.02a° 0.30a
Dodecanoic acid
nd
7.82a
0.20a
0.12a
Hexanoic acid nd nd
68.00a 89.00a
Isovaleric acid nd nd
0.02a 0.34a°
Nonanoic acid nd 0.23a° nd
0.17a
Carboxylic Acids
Octanoic acid nd nd
0.02a 0.06a
trans-2-Hexenoic acid
8.92a 12.87a 0.50a 0.28a
2-Acetylfuran nd 3.64a° 4.99a 3.38a Acetophenone nd nd
0.33a 0.08a
Aldehydes/ Ketones
Benzaldehyde nd 2.86a
1.83a 0.23a
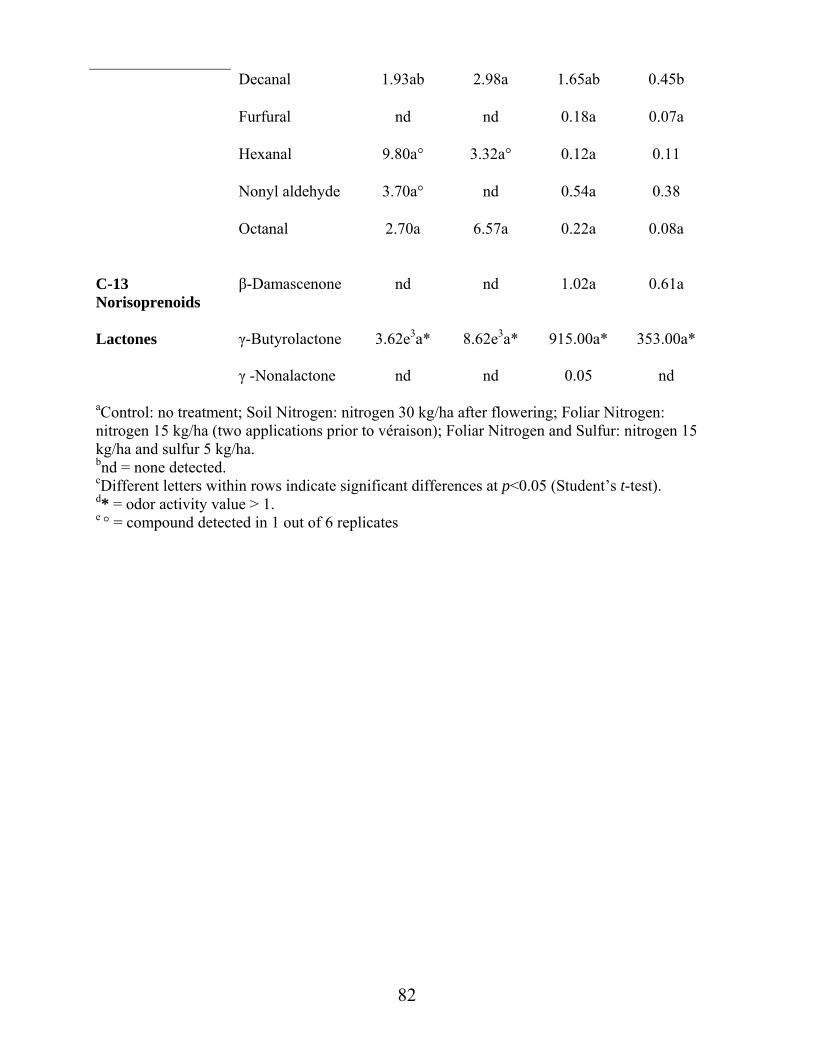
82
Decanal 1.93ab 2.98a
1.65ab 0.45b
Furfural nd nd
0.18a 0.07a
Hexanal 9.80a° 3.32a°
0.12a 0.11
Nonyl aldehyde 3.70a° nd 0.54a 0.38
Octanal 2.70a 6.57a 0.22a
0.08a
C-13 Norisoprenoids
β-Damascenone nd nd 1.02a 0.61a
Lactones γ-Butyrolactone 3.62e3a* 8.62e3a*
915.00a* 353.00a*
γ -Nonalactone nd nd 0.05
nd
aControl: no treatment; Soil Nitrogen: nitrogen 30 kg/ha after flowering; Foliar Nitrogen: nitrogen 15 kg/ha (two applications prior to véraison); Foliar Nitrogen and Sulfur: nitrogen 15 kg/ha and sulfur 5 kg/ha. bnd = none detected. cDifferent letters within rows indicate significant differences at p<0.05 (Student’s t-test). d* = odor activity value > 1. e ° = compound detected in 1 out of 6 replicates
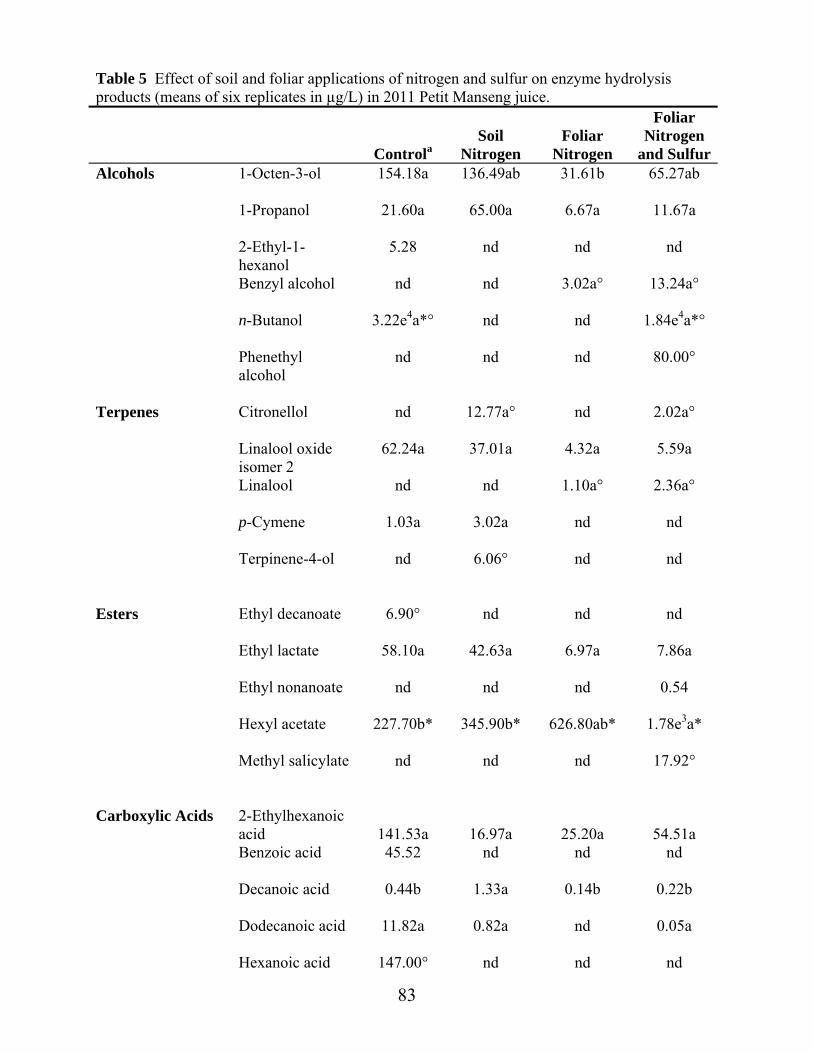
83
Table 5 Effect of soil and foliar applications of nitrogen and sulfur on enzyme hydrolysis products (means of six replicates in µg/L) in 2011 Petit Manseng juice.
Controla Soil
Nitrogen Foliar
Nitrogen
Foliar Nitrogen
and Sulfur1-Octen-3-ol 154.18a
136.49ab 31.61b 65.27ab
1-Propanol 21.60a
65.00a 6.67a 11.67a
2-Ethyl-1-hexanol
5.28
nd nd nd
Benzyl alcohol nd nd 3.02a°
13.24a°
n-Butanol 3.22e4a*° nd nd
1.84e4a*°
Alcohols
Phenethyl alcohol
nd nd nd 80.00°
Citronellol nd
12.77a° nd 2.02a°
Linalool oxide isomer 2
62.24a 37.01a 4.32a 5.59a
Linalool nd nd
1.10a° 2.36a°
p-Cymene 1.03a
3.02a nd nd
Terpenes
Terpinene-4-ol nd 6.06°
nd nd
Ethyl decanoate 6.90°
nd nd nd
Ethyl lactate 58.10a 42.63a
6.97a 7.86a
Ethyl nonanoate nd nd nd 0.54
Hexyl acetate 227.70b*
345.90b* 626.80ab* 1.78e3a*
Esters
Methyl salicylate nd nd nd 17.92°
2-Ethylhexanoic acid
141.53a
16.97a
25.20a
54.51a Benzoic acid 45.52
nd nd nd
Decanoic acid 0.44b 1.33a 0.14b
0.22b
Dodecanoic acid 11.82a
0.82a nd 0.05a
Carboxylic Acids
Hexanoic acid 147.00° nd nd nd

84
Isovaleric acid nd 15.38a nd
7.75a°
Myristic acid 423.60a
467.30a 116.50b 133.0b
Nonanoic acid 0.61
nd nd nd
trans-2-Hexenoic acid
141.53a 19.72a 25.20a 54.51a
Benzaldehyde nd nd nd nd Decanal 5.28
nd nd nd
Furfural 2.63a° 2.71a° nd nd Hexanal 119.87a° 20.99a°
5.28a° 64.56a
Nonyl aldehyde nd nd
2.22ab 7.03a
Octanal nd nd nd nd trans-2-cis-6-Nonadienal
nd 6.87a 0.59b nd
Aldehydes/ Ketones
trans-2-Nonenal nd nd 4.70a
5.47a
C-13 Norisoprenoids
nd nd nd nd
Lactones γ-Butyrolactone 18.25a 11.24a 8.83a
8.32a
aControl: no treatment; Soil Nitrogen: nitrogen 30 kg/ha after flowering; Foliar Nitrogen: nitrogen 15 kg/ha (two applications prior to véraison); Foliar Nitrogen and Sulfur: nitrogen 15 kg/ha and sulfur 5 kg/ha. bDifferent letters within rows indicate significant differences at p<0.05 (Student’s t-test). cnd = none detected. d* = odor activity value > 1. e ° = compound detected in 1 out of 6 replicates

85
Table 6 Effect of soil and foliar applications of nitrogen and sulfur on enzyme hydrolysis products (means of six replicates in µg/L) in 2012 Petit Manseng juice.
Controla Soil
Nitrogen Foliar
Nitrogen
Foliar Nitrogen
and Sulfur1-Octanol nd
0.44a 0.31a 0.17a
1-Octen-3-ol 37.34a 24.64ab
22.65ab 7.77b
1-Propanol 600.00a
67.00b nd nd
2-Ethyl-1-hexanol
6.30a 2.63a 0.37a 0.34a
3-Methyl-1-pentanol
896.00a° 732.00a° 1.14e3a° 641.00a°
Benzyl alcohol nd 2.19a 0.26a
nd
cis-3-Hexenol 1.27e3a° 1.43e3a 2.48e3a 1.43e3a n-Butanol nd 336.00a°
57.00a° nd
n-Hexanol nd 1.29e5a*°
1.64e5a*° 1.21e5a*°
Alcohols
Phenethyl alcohol
nd 62.00a 78.00a nd
α-Terpineol nd 0.04
nd nd
Citronellol nd nd
0.01a 0.03a
Linalool oxide isomer 1
nd 0.02°
nd nd
Linalool oxide isomer 2
nd 0.25a 0.08a 0.03a
Linalool nd 0.06a
0.06a 0.03a
p-Cymene nd 20.45b
39.55a 20.30b
Terpenes
Terpinene-4-ol nd 0.46a 0.11a 0.15a
Diethyl succinate nd 4.17e3a 7.36e3a 4.18e3a Ethyl decanoate nd 0.60a
0.63a 0.35a
Ethyl dodecanoate
nd 0.31a 0.11a 0.05a
Ethyl heptanoate nd 0.01a 0.06a 0.01a Ethyl hexanoate nd 0.04a°
0.03a 0.02a°
Esters
Ethyl myristate nd 0.19a
0.12a 0.09a
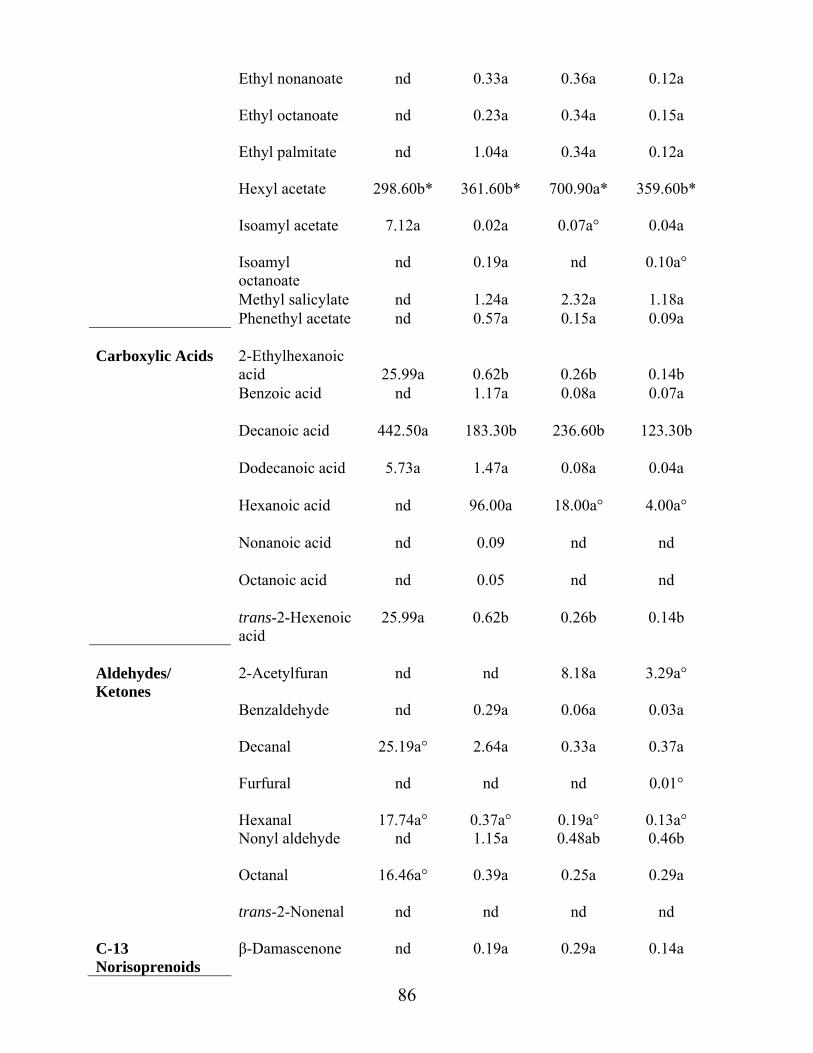
86
Ethyl nonanoate nd 0.33a
0.36a 0.12a
Ethyl octanoate nd 0.23a
0.34a 0.15a
Ethyl palmitate nd 1.04a
0.34a 0.12a
Hexyl acetate 298.60b* 361.60b*
700.90a* 359.60b*
Isoamyl acetate 7.12a 0.02a 0.07a°
0.04a
Isoamyl octanoate
nd 0.19a nd 0.10a°
Methyl salicylate nd 1.24a 2.32a 1.18a
Phenethyl acetate nd 0.57a 0.15a 0.09a
2-Ethylhexanoic acid
25.99a
0.62b
0.26b
0.14b
Benzoic acid nd 1.17a
0.08a 0.07a
Decanoic acid 442.50a 183.30b
236.60b 123.30b
Dodecanoic acid 5.73a 1.47a
0.08a 0.04a
Hexanoic acid nd 96.00a 18.00a°
4.00a°
Nonanoic acid nd 0.09
nd nd
Octanoic acid nd 0.05
nd nd
Carboxylic Acids
trans-2-Hexenoic acid
25.99a 0.62b 0.26b 0.14b
2-Acetylfuran nd
nd 8.18a 3.29a°
Benzaldehyde nd 0.29a
0.06a 0.03a
Decanal 25.19a° 2.64a
0.33a 0.37a
Furfural nd nd nd 0.01°
Hexanal 17.74a° 0.37a° 0.19a° 0.13a° Nonyl aldehyde nd 1.15a
0.48ab 0.46b
Octanal 16.46a°
0.39a 0.25a 0.29a
Aldehydes/ Ketones
trans-2-Nonenal nd nd nd nd C-13 Norisoprenoids
β-Damascenone nd 0.19a 0.29a 0.14a

87
Lactones γ-Butyrolactone 2.01e4 a* 3.82b*
593.00b* 238.00b*
aControl: no treatment; Soil Nitrogen: nitrogen 30 kg/ha after flowering; Foliar Nitrogen: nitrogen 15 kg/ha (two applications prior to véraison); Foliar Nitrogen and Sulfur: nitrogen 15 kg/ha and sulfur 5 kg/ha. bDifferent letters within rows indicate significant differences at p<0.05 (Student’s t-test). cnd = none detected. d* = odor activity value > 1. e º = compound detected in 1 out of 6 replicates
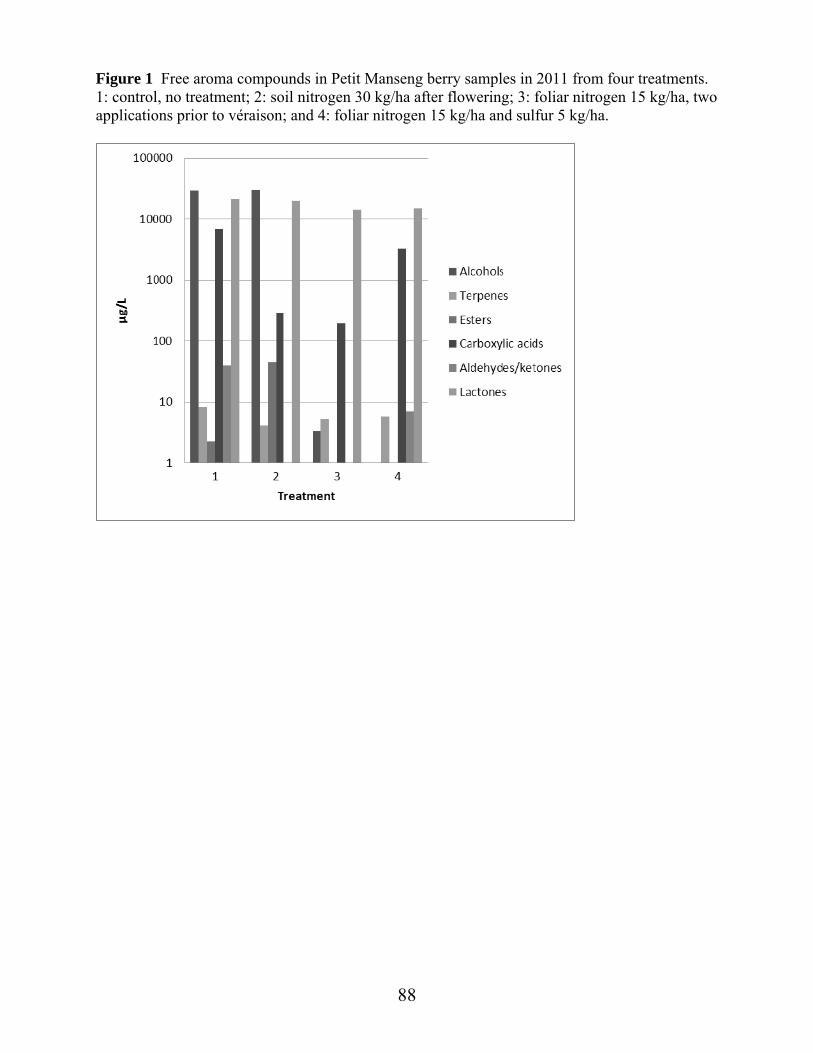
88
Figure 1 Free aroma compounds in Petit Manseng berry samples in 2011 from four treatments. 1: control, no treatment; 2: soil nitrogen 30 kg/ha after flowering; 3: foliar nitrogen 15 kg/ha, two applications prior to véraison; and 4: foliar nitrogen 15 kg/ha and sulfur 5 kg/ha.

89
Figure 2 Free aroma compounds in Petit Manseng berry samples in 2012 from four treatments. 1: control, no treatment; 2: soil nitrogen 30 kg/ha after flowering; 3: foliar nitrogen 15 kg/ha, two applications prior to véraison; and 4: foliar nitrogen 15 kg/ha and sulfur 5 kg/ha.

90
Figure 3 Acid hydrolysis products in Petit Manseng berry samples in 2011 from four treatments. 1: control, no treatment; 2: soil nitrogen 30 kg/ha after flowering; 3: foliar nitrogen 15 kg/ha, two applications prior to véraison; and 4: foliar nitrogen 15 kg/ha and sulfur 5 kg/ha.

91
Figure 4 Acid hydrolysis products in Petit Manseng berry samples in 2012 from four treatments. 1: control, no treatment; 2: soil nitrogen 30 kg/ha after flowering; 3: foliar nitrogen 15 kg/ha, two applications prior to véraison; and 4: foliar nitrogen 15 kg/ha and sulfur 5 kg/ha.
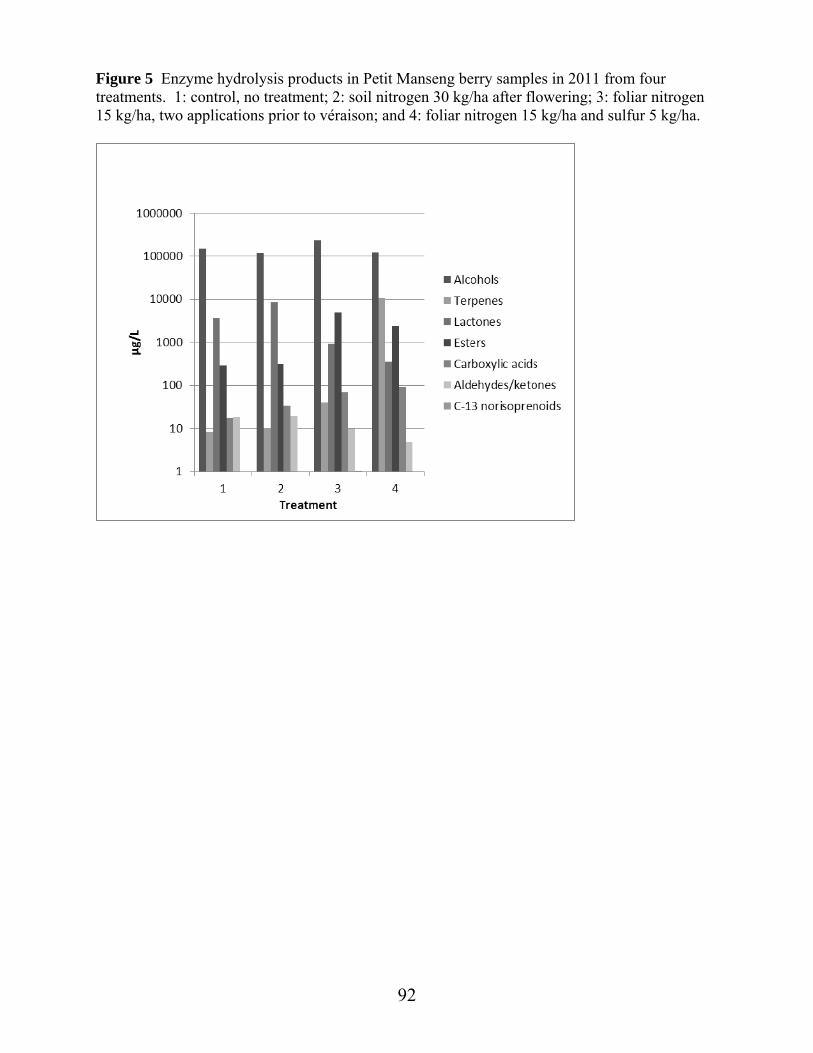
92
Figure 5 Enzyme hydrolysis products in Petit Manseng berry samples in 2011 from four treatments. 1: control, no treatment; 2: soil nitrogen 30 kg/ha after flowering; 3: foliar nitrogen 15 kg/ha, two applications prior to véraison; and 4: foliar nitrogen 15 kg/ha and sulfur 5 kg/ha.

93
Figure 6 Enzyme hydrolysis products in Petit Manseng berry samples in 2012 from four treatments. 1: control, no treatment; 2: soil nitrogen 30 kg/ha after flowering; 3: foliar nitrogen 15 kg/ha, two applications prior to véraison; and 4: foliar nitrogen 15 kg/ha and sulfur 5 kg/ha.
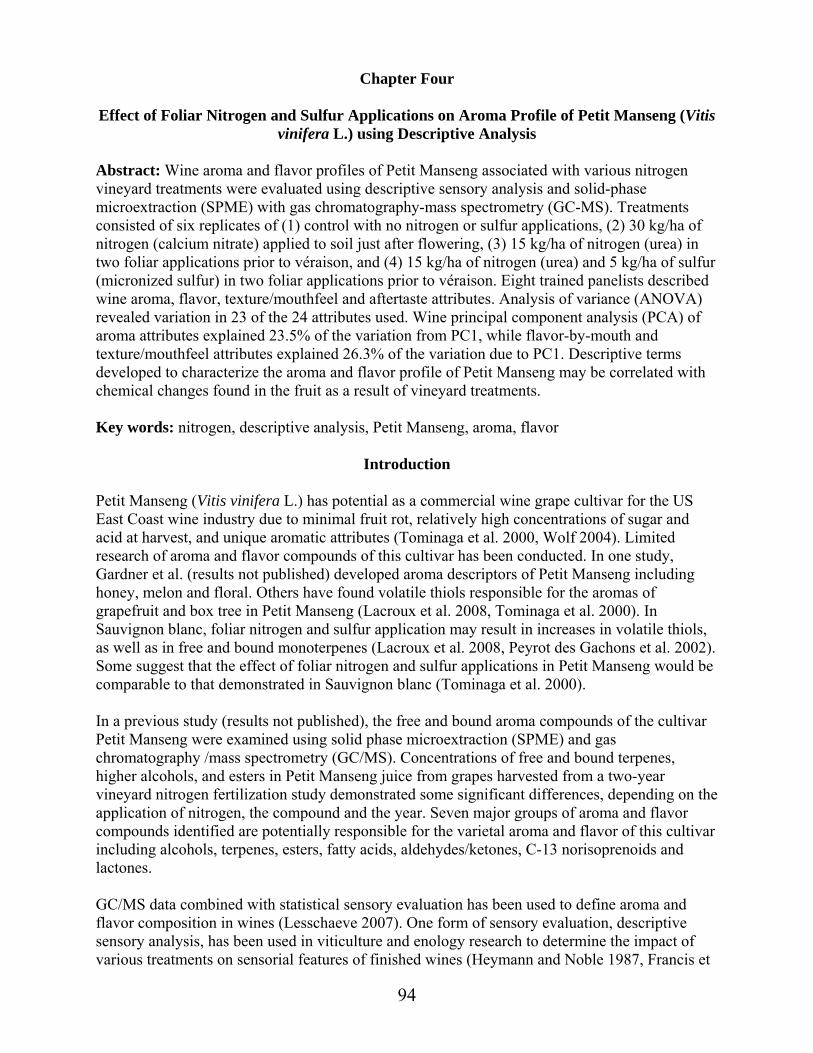
94
Chapter Four Effect of Foliar Nitrogen and Sulfur Applications on Aroma Profile of Petit Manseng (Vitis
vinifera L.) using Descriptive Analysis Abstract: Wine aroma and flavor profiles of Petit Manseng associated with various nitrogen vineyard treatments were evaluated using descriptive sensory analysis and solid-phase microextraction (SPME) with gas chromatography-mass spectrometry (GC-MS). Treatments consisted of six replicates of (1) control with no nitrogen or sulfur applications, (2) 30 kg/ha of nitrogen (calcium nitrate) applied to soil just after flowering, (3) 15 kg/ha of nitrogen (urea) in two foliar applications prior to véraison, and (4) 15 kg/ha of nitrogen (urea) and 5 kg/ha of sulfur (micronized sulfur) in two foliar applications prior to véraison. Eight trained panelists described wine aroma, flavor, texture/mouthfeel and aftertaste attributes. Analysis of variance (ANOVA) revealed variation in 23 of the 24 attributes used. Wine principal component analysis (PCA) of aroma attributes explained 23.5% of the variation from PC1, while flavor-by-mouth and texture/mouthfeel attributes explained 26.3% of the variation due to PC1. Descriptive terms developed to characterize the aroma and flavor profile of Petit Manseng may be correlated with chemical changes found in the fruit as a result of vineyard treatments. Key words: nitrogen, descriptive analysis, Petit Manseng, aroma, flavor
Introduction
Petit Manseng (Vitis vinifera L.) has potential as a commercial wine grape cultivar for the US East Coast wine industry due to minimal fruit rot, relatively high concentrations of sugar and acid at harvest, and unique aromatic attributes (Tominaga et al. 2000, Wolf 2004). Limited research of aroma and flavor compounds of this cultivar has been conducted. In one study, Gardner et al. (results not published) developed aroma descriptors of Petit Manseng including honey, melon and floral. Others have found volatile thiols responsible for the aromas of grapefruit and box tree in Petit Manseng (Lacroux et al. 2008, Tominaga et al. 2000). In Sauvignon blanc, foliar nitrogen and sulfur application may result in increases in volatile thiols, as well as in free and bound monoterpenes (Lacroux et al. 2008, Peyrot des Gachons et al. 2002). Some suggest that the effect of foliar nitrogen and sulfur applications in Petit Manseng would be comparable to that demonstrated in Sauvignon blanc (Tominaga et al. 2000). In a previous study (results not published), the free and bound aroma compounds of the cultivar Petit Manseng were examined using solid phase microextraction (SPME) and gas chromatography /mass spectrometry (GC/MS). Concentrations of free and bound terpenes, higher alcohols, and esters in Petit Manseng juice from grapes harvested from a two-year vineyard nitrogen fertilization study demonstrated some significant differences, depending on the application of nitrogen, the compound and the year. Seven major groups of aroma and flavor compounds identified are potentially responsible for the varietal aroma and flavor of this cultivar including alcohols, terpenes, esters, fatty acids, aldehydes/ketones, C-13 norisoprenoids and lactones. GC/MS data combined with statistical sensory evaluation has been used to define aroma and flavor composition in wines (Lesschaeve 2007). One form of sensory evaluation, descriptive sensory analysis, has been used in viticulture and enology research to determine the impact of various treatments on sensorial features of finished wines (Heymann and Noble 1987, Francis et

95
al. 1992, Reynolds et al. 1996), to develop descriptive terms (Mirarefi et al. 2004) and to characterize wines by region (Sanchez-Palomo et al. 2010). Gardner et al (results not published) used sensory consensus training and SPME GC/MS to evaluate Petit Manseng wine. Sensory data demonstrated that wines differed in intensities of citrus fruits and honey aromas. GC/MS data showed differences in wines that were not observed in the sensory analysis. Thus, the coupling GC/MS with sensory evaluation may enhance volatile aroma and flavor analysis. Numerous studies involving sensory profiling and lexicon development of wines exist (Gutierrez Afonso et al. 1998, Mirarefi et al. 2004, Stone et al. 1974). The objectives of this study were to identify descriptive terms that characterize Petit Manseng wines and to determine whether vineyard nitrogen treatments impact wine aroma and flavor in this cultivar.
Materials and Methods
This study was conducted using Petit Manseng (Vitis vinifera L.) grapes grown in a North Carolina vineyard (lat. 36°23’3.90”N; long. 80°43’12.20”W). Vines were planted in 2008 on rootstock 101-14 with 1.83 m intra-row and 2.74 m inter-row spacing. Vines were spur-pruned and cordon-trained, with upright shoots vertically shoot-positioned. The soil on the site is described as a clay-loam. The experiment was set up as a randomized complete block design with six replications of four treatments. Two panels of three vines made up each replication. Treatments: Treatments were: (1) control with no nitrogen or sulfur applications, (2) nitrogen at 30 kg/ha (Viking Ship® calcium nitrate 15.5-0-0, Yara North America, Inc., Tampa, FL) applied immediately post-bloom, (3) urea nitrogen at 15 kg/ha (Coron®, Helena Chemical Co., Collierville, TN) in two foliar applications prior to véraison and (4) nitrogen (urea) at 15 kg/ha plus 5 kg/ha of micronized sulfur (Microthiol Disperss®, United Phosphorus Inc, King of Prussia, PA) in two applications prior to véraison. For foliar applications, the first spray was applied post-berry set, prior to véraison. The second spray was applied just prior to véraison. Seventy-five mL of Coron was dissolved in 6.82 L of water to spray one panel of three vines. A 22.7-L backpack sprayer (Solo®, Newport News, VA) was used. For soil treatment, 98 g of calcium nitrate were dissolved in 473 mL of water and evenly distributed on the soil surface in a 0.46 m circle from each trunk. No other soil amendment, fertilizer or irrigation was applied to the vines during the course of the study. Harvest and fermentation: Petit Manseng grapes from the six replicates of four treatments were hand-harvested on August 19, 2011 at 24 ±1 Brix. Grapes from replicates one and two, three and four, and five and six were combined to create fermentation replicates one, two and three, respectively. Grapes were crushed and destemmed (Jolly®-30-A/R crusher/destemmer, St. Patrick’s of Texas, San Antonio, TX). Musts were pressed (BP-80 S/S press, St. Patrick’s of Texas) to a pressure of one bar. Juice was evenly distributed to create three replicates per treatment into 18.9-L fermentation buckets (Carolina Wine Supply, Yadkinville, NC) and 20
96
mg/L sulfur dioxide added. Must was cooled to 12°C and allowed to settle overnight. Juice from each of 4 treatments was racked into 4 carboys (18.9 L) per treatment and inoculated with VIN 13 wine yeast (Scott Laboratories, Petaluma, CA) at a rate of 25 g/100 L, following hydration, as per supplier recommendations. Superfood® (Lesaffre Yeast Co., Milwaukee, WI) was added at a rate of 1 g/3.78 L. Fermentation took place at 12°C in 18.9-L glass carboys and was monitored daily by hydrometry. Upon completion of fermentation, wines were racked, SO2 levels were adjusted to 0.80 ppm molecular sulfur dioxide, wines were filtered using 0.45 µm pads (Buon Vino® Super Jet Filter, Cambridge, ON, Canada), then bottled into 750-mL glass bottles with natural cork closures (Twin Top® 1+1 corks, Portocork, Napa, CA). Due to variation in harvest yields, treatments one and two yielded 45 bottles each while treatments three and four yielded 37 and 27, respectively. Wines were stored at 7°C. Wine chemistries: Samples from each of the 4 carboys per treatment were tested prior to bottling. Residual sugar measured was using AOAC method 920.57(Cunniff 2005). Titratable acidity was measured by titration with 0.1 N NaOH, to 8.20 pH endpoint (Accumet® model 15 pH meter, Fisher Scientific, Pittsburgh, PA). Total sulfur dioxide was measured using the aeration/oxidation TTB official method (SSD:TM:500, revision 3) with revisions for free sulfur dioxide (Zoecklein et al. 1995). Ethanol was measured using AOAC method 920.57 (Cunniff 2005). Panelist training: Lexicon development with subsequent intensity training used a combination of the Spectrum™ Descriptive Analysis method (Muñoz and Civille 1992, Lawless and Heymann 1998, Meilgaard et al. 2007) and Quantitative Descriptive Analysis method™ (Stone et al. 1974, Stone and Sidel 1992). A 15.2 cm unstructured line scale was used for intensity rating. Eleven aroma attributes, ten flavor-by-mouth attributes, two texture attributes, and aftertaste attributes were assessed. Eight panelists were recruited based on interest and availability. Institutional Review Board approval was obtained for this project through Virginia Tech. Panelists were commercial winemakers, four men and four women, with ages ranging from 22 to 70 years of age. Seven two-hour training sessions were conducted. Two sessions were for term generation, using four different commercial 2010 Virginia Petit Manseng wines. This provided diversity in aroma, flavor and texture profiles. Five sessions were devoted to intensity ratings of the terms generated by the panelists. During the initial training session, 52 descriptive terms were generated in the following classes: aroma, flavor-by-mouth, texture/mouthfeel and aftertaste. Aroma was defined as the odor of the wine perceived by the olfactory system (Meilgaard et al. 2007). Flavor-by-mouth was defined as the aromatics perceived by the posterior nares when the wine was held in the mouth (Mirarefi et al. 2004). Texture/mouthfeel was defined as the characteristic identified by tactile senses resulting from expectorating the wine. Mouthfeel was defined as in-mouth sensations (e.g., coating), as opposed to texture in which the perceived sensations are related to the food itself (e.g., firmness) (Lawless and Heymann 1998, Mirarefi et al. 2004). Aftertaste was defined as the final flavor or texture impressions immediately after expectorating the wine. Finish was described in terms of length – a short finish as one lasting less than 10 sec (“low” on line scale), a medium finish 10 to 30 sec (middle of line scale), and a long finish greater than 30 sec (“strong” on line scale).
97
During the two initial training sessions, panelists defined the descriptors generated and identified possible references for the terms. Panelists eliminated terms that were either present in low concentrations or those that were present in most wines at uniform levels of intensity. Finally, the panelists reached consensus for 24 descriptive attributes (Table 1). The rinsing protocol recommended by Mirarefi et al. (2004) was utilized as follows: chewing unsalted oyster crackers (The Kroger Company, Cincinnati, OH), followed by rinsing with warm spring water (40°C) and room temperature spring water (22°C). All samples were expectorated. A neutral base wine (Paul Masson Chablis), presented in 60-mL plastic cups with lids at room temperature, was used to produce aroma, flavor-by-mouth, texture/mouthfeel and aftertaste references for the terms generated. Reference standards were prepared for each of the 24 attributes in varying intensities (low, medium and high). Panelists completed five sessions and in the first three sessions discussed their impressions of the intensity of the various standards. During the final two sessions, results were not discussed. Panelists’ ability to rate intensities and discriminate among attributes was validated by providing three commercial wines (two Petit Manseng and one Petit Manseng/LaCrescent blend) at the final training session. Wines were presented in triplicate. Using a 15 cm line scale, the panelists were asked to rate the intensity of attributes by marking a line on the scale, relating to the perceived intensity of that term. The scale had end-word anchors of “low” and “strong” at the left and right end of the scale (1.0 cm from the terminus), respectively (Anderson 1970, Meilgaard et al. 2007, Stone and Sidel 1992). Reference standards were available for panelists to utilize if needed. Samples were presented as described above. In the first sensory session four test wines were evaluated using touch-screen monitors with an unstructured line scale of 0 to 15. Sensory Information Management System (SIMs) software was used (SIMs® Sensory Software, Berkeley Heights, NJ) to construct the intensity line scale, with 1 being “low” and 14 being “strong.” The eight trained panelists evaluated the experimental Petit Manseng wines in individual booths with white lighting in the Food Science Sensory Lab (Virginia Tech, Blacksburg, VA) under standard conditions prior to experimental data being collected. Each panelist was served the four treatment wines in duplicate, 4 treatment wines at two separate seatings, with a 30 min rest in between. From the three replicates of each treatment, 333.3 mls of each was combined to obtain the test wine for that treatment. This was done to preserve the amount of experimental wine for further sessions. Wines were served in ISO glasses covered with plastic lids. Each glass was filled with 60 mL of wine, coded with a three-digit random code, and served at room temperature (22°C). The rinse protocol detailed above was used for all sessions. All samples were expectorated. Two additional sensory sessions took place at a North Carolina winery using cardboard booths and the same 15-cm line scale, this time using paper ballots.The location was changed to decrease travel time for the mostly NC panel and to increase chance of panelist participation. A separate room off of the tasting room was used with white-lighting and free of noise and aromas. In these last two sessions, four experimental wines, three replications each, were evaluated as described above and experimental data was collected. The two additional sessions were needed as two panelists requested additional training using reference standards after session two. An additional hour was spent reviewing intensity levels of three to four attributes with the two panelists, respectively.

98
GC-MS: Wine samples for GC-MS were prepared using 4-mL samples with 1.0 g NaCl in 10-ml glass vials sealed with a septa top (MicroLiter® Analytical Supplies, Inc., Suwanee, GA). Preincubation time was 30 seconds at 30°C and vials were agitated at 250 rpm. A CAR/DVB/PDMS grey SPME fiber (Supelco Sigma-Aldrich, St. Louis, MO) penetrated the vial at a 32-mm depth into the headspace and was equilibrated for 30 min. The SPME fiber was injected into a 6890N Network GC System, 5975B inert MSD GC-MS (Agilent Technologies, Santa Clara, CA). The fiber was desorbed for 90 seconds with an inlet temperature of 250°C into a DB-Wax column (30 m x 2 mm). Helium carrier gas flow rate was 1 mL/min. Initial oven temperature was 40°C, ramped at 6°C/min to 230°C. To assess the influence of the isolated compounds on aroma, odor activity values (OAVs) were determined by dividing the concentration of each compound by its sensory perception threshold. Those compounds with OAVs greater than one may contribute to the aroma (Guth 1997). Statistical analysis: The four treatment wines and 3 replicates of each, were analyzed using ANOVA with JMP® Pro (version 10.0, SAS Institute, Cary, NC). Attributes that were differed were further analyzed using least significant difference (LSD) and Student’s t-test procedures (α=0.05). Principal component analysis (PCA) in JMP was used for multivariate statistics. Interactions of treatment by judge, judge by replication and treatment by replication were analyzed by fit least squares in JMP.
Results and Discussion
Table 2 shows kilograms harvested for the three replicates for the four treatments and juice yields for each. There were no significant differences in either among treatments (data not shown). Wine chemistries for wine produced from each treatment (Table 3) were not different in pH, total sulfur dioxide or free sulfur dioxide. The foliar nitrogen-plus-sulfur treatment wine differed from other treatments in percent residual sugar, with 0.30%. A “dry” wine is traditionally defined as having a residual sugar of less than 0.20% (Zoecklein et al. 1995). Both foliar-applied treatments had lower residual sugar concentration than control and soil applications. The control wine differed from nitrogen-treated wines in alcohol percentage. The control wine had the lowest percentage, while the nitrogen-plus-sulfur treatment had the highest. Titratable acidity differed among wines. Soil-nitrogen treatment wines had higher concentrations. Training validation results revealed a high degree of variation (87.5%) among judges. Of the 24 attributes evaluated, wines were a significant source of variation for 3 attributes. However, training results demonstrated that judges could qualitatively identify the characteristics and replicate their individual assessments (Table 4). The judge by replicate interaction had only two significant attributes indicating consistency in judge ratings across replications. Among replicates, no attributes were a significant source of variation. Judge by treatment interactions had four attributes that demonstrated panelist variability in intensity. Through this training, the judges gained sensory experience, but the variability was high. Therefore, any significant differences among wine attributes likely demonstrate actual differences among wines. However, slight differences may not have been detected. A more completely trained panel with more experience may better recognize differences than were noted in this study.

99
Judges were a significant source of variation in 20 of the 24 attributes (Table 5). The significant judge by treatment interaction in 17 attributes indicated panelists did not agree on the intensity across wines for these attributes. However, this is not an atypical occurrence in descriptive analysis (Meilgaard et al. 2007). Of the 24 attributes evaluated, treatment wines were a significant source of variation for 18 attributes. Attributes that did not differ were lemon and lime (aroma), and sweet, orange and honeysuckle (flavor) and astringency. Significant judge by replicate interactions occurred for only five attributes, with lower degrees of significance, indicating reproducibility and precision among samples for each panelist. These five attributes included honey aroma and flavor, lemon aroma, and grapefruit and pear flavor. Honey aroma and flavor, as well as pear flavor were highly influenced by judge. Lemon aroma was influenced by both replicate and judge while grapefruit flavor was highly influenced by both treatment and treatment by judge interactions. Spider plots were created to demonstrate the mean intensities of aroma attributes (Figure 1), and flavor-by-mouth and texture/mouthfeel (Figure 2). The foliar nitrogen plus sulfur treatment had greater melon and grapefruit aromas versus other treatments, while foliar nitrogen demonstrated greater pear, honey and pineapple aromas. The soil nitrogen treatment had greater peach and green apple aromas versus other treatments. In contrast, the control had greater honeysuckle aromas compared to the soil nitrogen treatment. However, the control wine had decreased peach, pear, pineapple, melon, lime, lemon, floral and grapefruit compared to treatment wines. This may indicate an enhancement in volatile aromas due to nitrogen and nitrogen plus sulfur treatments. Lime, lemon and floral aromas had little impact on the Petit Manseng treatment wines. Foliar nitrogen plus sulfur treatment had increased astringency and grapefruit flavors, while the foliar nitrogen treatment had increased grapefruit flavors and increased viscosity. The grapefruit flavors and increased viscosity are potentially important characteristics in a commercial wine. The astringency found in the foliar nitrogen plus sulfur treatment was at a low enough level that panelists did not deem it undesirable. The soil nitrogen treatment had increased apple and sweet flavors, both of which are desirable flavors. The control treatment had increased levels of sour, bitter (undesirable flavors) and pear flavors. These differing results among treatments demonstrate that nitrogen applications may improve aromas and flavors in this cultivar. In a study by Gardner et al. (results not published) four different Petit Manseng wines were evaluated for aroma differences. Similar descriptors for aromas of this cultivar were named in the study including honey, melon and exotic fruit and citrus fruit aromas. Principle component analysis (PCA) is a multivariate statistical technique that can be used in sensory analysis to describe relationships among multiple variables and objects (Lawless and Heymann 1998). PCA results in highly correlated variables (principle components) being close to one another in graphical representation that is easy to interpret (Lawless and Heymann 1998). PCA of significant aroma attributes (Figure 3) demonstrated that PC1 explained 23.5% of the variance in treatment wines, while PC2 explained an additional 21.1% of the variance. PC1 explained pineapple, pear, honey and honeysuckle aroma to be separating factors. PC2 contrasted wines high in melon aroma to those with floral, lime, peach and green apple aromas. The length of each vector indicates the degree of influence that attribute had on the variation among sample wines. Therefore, floral and lime may have influenced sample variation. This was unexpected since these attributes were not statistically significant and both had low aroma intensities across treatments.

100
There were a number of attributes that were influential in distinguishing among treatments explained by PC1. The control treatment had moderate (>3-7 on intensity scale) levels of honeysuckle and honey aromas, and levels of pineapple aroma approaching moderate. Soil nitrogen treatment had low levels ( 0-3 on intensity scale) of pear, honeysuckle and pineapple, while approaching moderate levels of honey aroma. Foliar nitrogen treatment wines had moderate pear, pineapple and honey aromas but were low in honeysuckle aromas. Foliar nitrogen plus sulfur treatment were approaching moderate levels of pear and pineapple, and low levels of honeysuckle aroma. Attributes that were influential in distinguishing among treatments explained by PC2 included: both the control and foliar nitrogen treatment had low levels of all attributes; soil nitrogen treatment had moderate peach aroma levels and was low in floral, lime and melon aromas; foliar nitrogen plus sulfur treatment had moderate melon aroma levels and low floral lime and peach aroma levels. The attributes associated with PC1 are comparable to those descriptors associated with commercial Petit Manseng wines. PCA of significant flavor-by-mouth and texture/mouthfeel attributes (Figure 4) demonstrated that PC1 explained 26.3% of variance in treatment wines, while PC2 accounted for an additional 17.2%. PC1 explained wines high (>7 on intensity scale) in orange and honey flavors to be separating factors. Correlation among attributes can be seen in vectors that have a small angle between them. Orange and honey flavors were closely correlated. PC2 revealed grapefruit and pear flavors to be separating factors with both having a large influence on variation, as demonstrated by vector length. Attributes that were influential in distinguishing between treatment wines explained by PC1 included: the control had moderate honey flavor and viscosity but low orange flavor; soil nitrogen treatment was approaching moderate levels of honey flavor with low orange flavor; foliar nitrogen treatment had low honey and orange flavor, with moderate viscosity; foliar nitrogen plus sulfur treatment had both low levels of honey and orange flavor. There were a number of attributes that were influential in distinguishing among treatment flavor/mouthfeel explained by PC2. The control wine had moderate pear flavor and low grapefruit flavor. Soil nitrogen treatment wines were low in both pear and grapefruit flavor. Foliar nitrogen treatment had moderate grapefruit flavor and pear flavor. Foliar nitrogen plus sulfur treatment had low pear flavor and moderate grapefruit flavor. Attributes associated with PC1 are comparable to those descriptors associated with commercial Petit Manseng wines. The effect of soil and foliar nitrogen and sulfur applications on aroma and flavor compounds in treatment wines were determined by GC-MS (Table 6). Three compounds were different among treatments, including 2-phenethyl alcohol, decreasing with nitrogen treatments compared to the control. This result is in agreement with Ough and Bell (1980) who demonstrated that some higher alcohols in wine are reduced by increased nitrogen fertilization. All samples were above their OAV, with the soil nitrogen treatment having the highest level. The compound 2-phenethyl alcohol contributes rose, lilac, spice and honey notes (Francis and Newton 2005). Isoamyl acetate demonstrated some differences between treatments, with the highest level in the control samples. This is in contrast to an additional study (data not shown) in which acid and enzyme hydrolysis of precursor fractions had ester content increase in both treatments with nitrogen-treated vines. The winemaking process for these treatment wines may not have been optimal to release those esters that are glycosidically bound. Furfural exhibited some differences, with the
101
control and nitrogen-plus-sulfur treatments showing increased levels, however none were above their OAVs. Cis-3-hexenol had increased levels in all nitrogen treatments. They were also over the odor detection threshold, while the control was not. Cis-3-hexenol is described as having fresh notes (Perestrelo et al. 2006). This may have contributed to some of the perceived aromas and flavors in the treatment wines, such as melon, pear and lemon. Decanoic acid was increased the most in the nitrogen-plus-sulfur treatment. It also had the only OAV over sensory threshold. This compound is described as having fatty and citrus notes (Perestrelo et al. 2006). This may have contributed to the increased pineapple flavors and grapefruit aromas perceived in the wine from the nitrogen-plus-sulfur treatment. Ethyl octanoate levels were highest in the nitrogen-plus-sulfur treatment and also had the highest OAV. Ethyl octanoate, which has fruity notes (Perestrelo et al. 2006), may explain the pineapple, melon, and grapefruit aromas, and the grapefruit and pineapple flavors observed in this treatment. Phenethyl acetate demonstrated increased levels in the nitrogen-plus-sulfur treatment, as well. All four treatments had OAVs above the sensory threshold, however the nitrogen-plus-sulfur treatment had the highest, with over twice the value of the other three treatments. Phenethyl acetate has floral aromas and flavors and may be responsible for some of the aromas and flavors described as honey flavors and melon aromas (Sanchez-Palomo et al. 2010).
Conclusions Results obtained by GC-MS related with aroma and flavor descriptors generated by the panelists for some compounds. Vineyard nitrogen and nitrogen-plus-sulfur treatments may be a means to alter the aroma and flavor profile of Petit Manseng. The descriptive sensory terms generated in this study could be used to standardize future sensory analysis of this cultivar.
102
Literature Cited Anderson, N.H. 1970. Functional measurement and psychological judgment. Psychol. Rev. 77:153-170.
Cunniff, P. 2005. Official methods of analysis of AOAC International. AOAC International. Arlington, VA.
Francis, I.L., and J.L. Newton. 2005. Determining wine aroma from compositional data. Austral. J. Grape Wine Res. 11:114-126. Francis, I.L., M.A. Sefton, and P.J. Williams. 1992. A study by sensory descriptive analysis of the effects of oak origin, seasoning, and heating on the aromas of oak model wine extracts. Am. J. Enol.Vitic. 43:23-30. Guth, H. 1997. Identification of character impact odorants of different white wine varieties. J. Agric. Food Chem. 45:3022-3026. Gutierrez Afonso, V.L., J. Darias, R. Armas, M.R. Medina, and M.E. Diaz. 1998. Descriptive analysis of three white wine varieties cultivated in the Canary Islands. Am J. Enol. Vitic. 49:440-444. Heymann, H., and A.C. Noble. 1987. Descriptive analysis of commercial Cabernet Sauvignon wines from California. Am. J. Enol. Vitic. 38:41-44. Lacroux, F., O. Tregoat, C. Van Leeuwen, A. Pons, T. Tominaga, V. Lavigne-Creuge, and D. Dubourdieu. 2008. Effect of foliar nitrogen and sulfur application on aromatic expression of Vitis vinifera L. cv. Sauvignon blanc. J. Int. Sci. Vigne Vin 42:125-132. Lawless, H.T., and H. Heymann. 1998. Sensory Evaluation of Food: Principles and Practices. Kluwer Academic Publishers, New York. Lesschaeve, I. 2007. Sensory evaluation of wine and commercial realities: review of current practices and perspectives. Am. J. Enol. Vitic. 58:252-258. Meilgaard, M.C., G.V. Civille, and B.T. Carr. 2007. Sensory Evaluation Techniques, 4th ed. CRC Press, New York. Mirarefi, S., S.D. Menke, and S.Y. Lee. 2004. Sensory profiling of Chardonel wine by descriptive analysis. J. Food Sci. 69: S211-S217. Muñoz, A.M., and G.V. Civille. 1992. The Spectrum descriptive analysis method, In ASTM Manual Series. MNL 13. Manual on Descriptive Analysis Testing. RC Hootman (ed.), pp. 22-34. ASTM International, West Conshohocken, PA. Ough, C.S., and A.A. Bell. 1980. Effect of vineyard nitrogen fertilization level on the formation of some fermentation esters. Am. J. Enol. Vitic. 32:125-127.

103
Perestrelo, R., A. Fernandes, F.F. Albuquerque, J.C. Marques and J.S. Camara. 2006. Analytical characterization of the aroma of Tinta Negra Mole red wine: identification of the main odorants compounds. Anal. Chimica Acta. 563:154-164. Peyrot des Gachons, C., C. Van Leeuwen, T. Tominaga, J.P. Soyer, J. Gaudillere, and D. Dubourdieu. 2002. Influence of water and nitrogen deficit on fruit ripening and aroma potential of Vitis vinifera L. cv. Sauvignon blanc in field conditions. J. Sci. Food Agric 85:73-85. Sánchez-Palomo,E., E. Gómez García-Carpintero, R. Alonso-Villegas, and M. A. González-Viñas. 2010. Characterization of aroma compounds of Verdejo white wines from the La Mancha region by odour activity values. Flavor and Fragrance Journal. 25:456-462. Stone, H., and J.L. Sidel. 1992. Sensory Evaluation Practices, 2nd ed. Academic Press, Orlando, FL. Stone, J., S. Oliver, A. Woolsey, and Singleton RC. 1974. Sensory evaluation by quantitative descriptive analysis. Food Tech. 28(11):24-34. Tominaga, T., R. Baltenweck-Guyot, C. Peyrot des Gachons, and D. Dubourdieu. 2000. Contribution of volatile thiols to the aromas of white wines made from several Vitis vinifera grape varieties. Am. J. Enol. Vitic. 51:178-181. Wolf T. 2004. Viticulture Notes. Virginia Cooperative Extension 19:6. [Accessed 2008 Sept 15]. Available from www.ext.vt.edu/new/periodicals/viticulture/04december.html. Zoecklein, B.W., K.C. Fugelsang, B.H. Gump, and F.S. Nury. 1995. Wine Analysis and Production. Chapman and Hall, New York.

104
Table 1 Attributes, definitions, and references applied to Petit Manseng wine. Descriptor Definition and reference standard preparation
Peacha 7 mLs canned peaches liquid in 25 mLs base wine
Peara 3 mLs canned pear liquid in 25 mLs base wine
Honeysucklea 2 mL honeysuckle essence in 25 mls base wine (Virginia Dare, Bronx, NY)
Pineapplea 1 mL canned pineapple juice in 25 mLs base wine
Cantaloupe/Melona 2 g fresh cantelope in 25 mL base wine. Honeya 25 g honey in 25 mL base wine Florala 0.25 mL linalool + 0.5 mL geraniol in 100 mL
diH2O - spike one mL of solution into base wine
Lemona 3 mLs lemon juice in 25 mLs base wine Applea 4.5 g crushed Granny Smith apple in 25 mls
base wine Grapefruita 3mLs fresh grapefruit juice in 25 mLs base
wine
Aroma
Limea 3mLs lime juice in 25 mLs base wine
Sweet Fundamental taste sensation elicited by sucrose. No reference.
Bitter Fundamental taste sensation elicited by caffeine. No reference.
Sour Fundamental taste sensation elicited by acids. No reference.
Orangea 1.5 mLs orange concentrate in 25 mls base wine
Flavor by Mouth
Grapefruita 3mLs fresh grapefruit juice in 25 mLs base wine
Honeya 25 g honey in 25 mL base wine Pineapplea 1 mL canned pineapple juice in 25 mLs base
wine
Peara 3 mLs canned pear liquid in 25 mLs base wine
Apple: Golden Deliciousa
4mLs apple juice concentrate in 25 mLs base wine
Honeysucklea 0.3% essence of honeysuckle in base wine (Virginia Dare, Brooklyn, NY).
Astringent Chemical feeling factor characterized by
puckering drying sensation in the mouth before and after swallowing. 1/2 tsp of grape tannin diluted in 1000 mL water.
Texture/Mouthfeel
Viscosity Texture of either water (not viscous at all) or tomato juice. 1 tbsp of water (not viscous) and tomato juice (very viscous).

105
Long Aftertaste lasting 30 seconds or more. Medium Aftertaste lasting 10 - 30 seconds.
Aftertaste
Short Aftertaste lasting 0 - 10 seconds. aReference was prepared in Chablis base wine (Paul Masson, Madera, CA). High standard: concentration as indicated above Medium standard: High standard diluted 50% with base wine Low standard: High standard diluted 75% with base wine

106
Table 2 Harvest weights (kg) and juice yields (L) for different soil and foliar applications of nitrogen and sulfur 2011 Petit Manseng (3 replicates each treatment)
Controla Soil Nitrogen Foliar
Nitrogen
Foliar Nitrogen and
Sulfur kg/replicate 1 35.33 35.63 34.27 35.03 kg/replicate 2 38.37 38.21 41.87 34.64 kg/replicate 3 27.20 35.96 35.26 37.47 L/replicate 1 151.20 151.20 151.20 132.30 L/replicate 2 151.20 151.20 151.20 151.20 L/replicate 3 94.50 151.20 151.20 151.20 aControl: no treatment; Soil Nitrogen: nitrogen 30 kg/ha after flowering; Foliar Nitrogen: nitrogen 15 kg/ha (two applications prior to véraison); Foliar Nitrogen and Sulfur: nitrogen 15 kg/ha and sulfur 5 kg/ha.
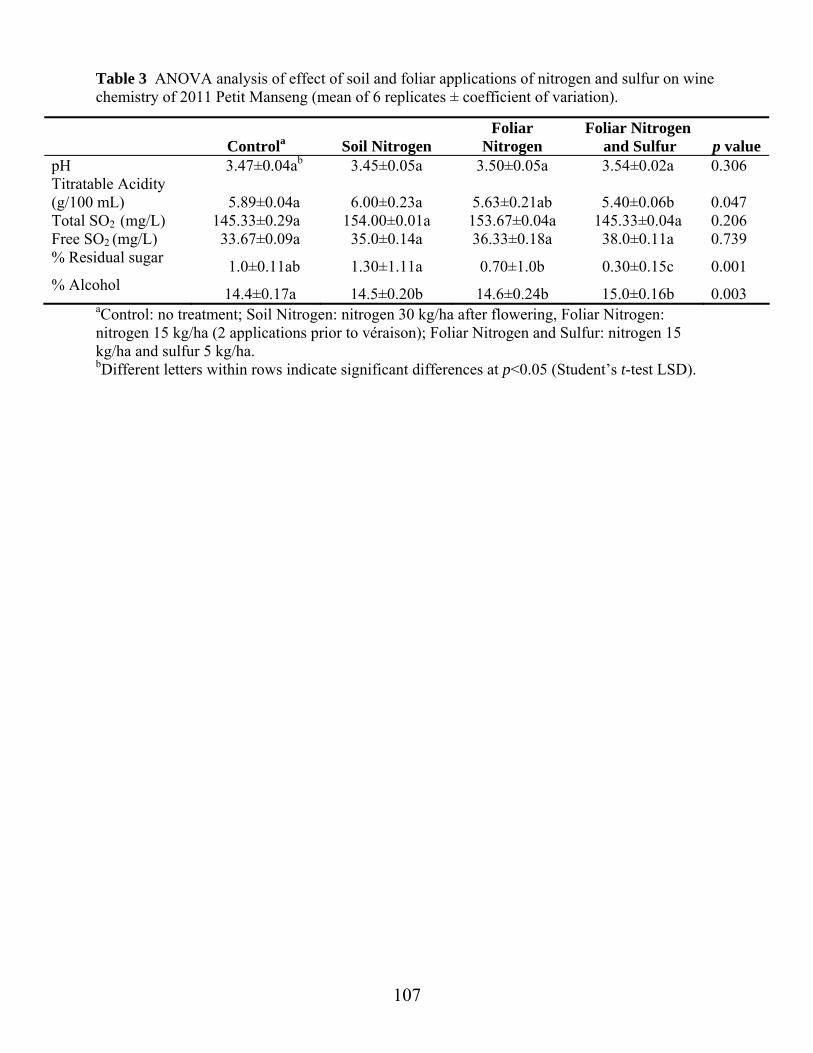
107
Table 3 ANOVA analysis of effect of soil and foliar applications of nitrogen and sulfur on wine chemistry of 2011 Petit Manseng (mean of 6 replicates ± coefficient of variation).
aControl: no treatment; Soil Nitrogen: nitrogen 30 kg/ha after flowering, Foliar Nitrogen: nitrogen 15 kg/ha (2 applications prior to véraison); Foliar Nitrogen and Sulfur: nitrogen 15 kg/ha and sulfur 5 kg/ha. bDifferent letters within rows indicate significant differences at p<0.05 (Student’s t-test LSD).
Controla Soil Nitrogen
Foliar Nitrogen
Foliar Nitrogen and Sulfur p value
pH 3.47±0.04ab 3.45±0.05a 3.50±0.05a 3.54±0.02a 0.306 Titratable Acidity (g/100 mL) 5.89±0.04a 6.00±0.23a 5.63±0.21ab 5.40±0.06b 0.047 Total SO2 (mg/L) 145.33±0.29a 154.00±0.01a 153.67±0.04a 145.33±0.04a 0.206 Free SO2 (mg/L) 33.67±0.09a 35.0±0.14a 36.33±0.18a 38.0±0.11a 0.739 % Residual sugar 1.0±0.11ab 1.30±1.11a 0.70±1.0b 0.30±0.15c 0.001 % Alcohol 14.4±0.17a 14.5±0.20b 14.6±0.24b 15.0±0.16b 0.003

108
Table 4 . Aroma attributes and significance for wines, judges, replications, and their interactions for sensory training Attribute Judge Trtb Rep Trt
×Judge Judge ×Rep
Peach 17.8461* 0.1921 0.870 0.2882 1.0036 Pear 9.3069* 0.9623 0.950 1.1016 0.7225 Honeysuckle 30.8993* 0.9103 0.2371 0.7738 0.6873 Pineapple 18.5807* 2.6613 0.0398 1.3336 0.4838 Melon 41.5705* 1.6704 2.6889 2.7263* 2.6103* Honey 15.4280* 1.0078 3.2509 1.0575 1.2288 Floral 4.9848* 4.7273* 0.8305 2.1055* 1.6220 Lemon 27.5521* 0.7874 0.0517 0.3281 0.5256 Lime 1.8277 0.8738 1.0588 1.3705 0.6341 Green Apple 70.5033* 1.4728 0.4560 1.1552 1.2385
Aroma
Grapefruit 33.9163* 0.4739 1.4090 0.7329 1.1131
Pear 2.0052 1.2518 1.9345 0.7998 1.4627 Sweet 7.2348* 2.0513 0.0146 0.8673 0.3297 Sour 45.2117* 1.3062 2.3351 1.6764 0.8393 Bitter 14.2154* 4.0655* 0.6552 1.3398 0.5853 Orange 1.3266 1.3022 1.8946 1.2372 0.9068 Apple 4.6772* 0.0881 0.0831 0.6232 0.9233 Grapefruit 35.0793* 0.9004 0.2583 1.1319 1.3867 Honey 10.8324* 2.6723 0.0579 3.5948* 0.4947 Pineapple 33.9589* 0.8129 0.0457 1.3762 2.0556
Flavor by Mouth
Honeysuckle 20.5758* 0.5159 1.3180 1.2017 1.6779
Viscosity 48.8855* 4.2697* 1.1618 2.2797* 2.8446* Aftertaste 3.7102* 1.4988 2.4365 1.6645 1.3013
Texture/ Mouthfeel
Astringency 10.2077* 0.2651 0.1781 0.5775 0.9410 bTreatment noted as Trt, Replications as Rep. Trt×Judge, Judge×Rep indicate treatment by judge interaction and judge by replication interaction. aF ratios are shown for sources of variation. c * indicate significance at p < 0.05

109
Table 5 Aroma attributes and significance for wines, judges, replications, and their interactions for Petit Manseng treatment wines
Attribute F value/ p > Fa
Judge Trtb Rep Trt ×Judge
Judge ×Rep
Trt ×Rep
Peach 8.19***c 4.66** 3.48* 11.43** 5.41*** 0.83 10.82*** Pear 3.67** 4.09** 26.04*** 4.05 2.16* 1.4 2.55 Honeysuckle 9.56*** 28.58** 43.74*** 0.68 4.50*** 0.53 0.49 Pineapple 2.95** 10.02*** 6.14** 5.91* 1.18 0.68 2.35 Melon 8.85*** 5.13*** 49.52*** 13.80*** 1.75 0.813 3.96** Honey 11.20** 34.41*** 17.88*** 0.836 6.58*** 2.14* 4.03*** Floral 15.52*** 60.56*** 11.13*** 0.0031 11.38*** 0.288 0.9144 Lemon 3.85** 9.26*** 1.49 10.97** 3.41** 2.17* 4.92** Lime 3.40** 14.47*** 2.21 0.456 1.44 0.125 1.17 Green Apple 7.19*** 9.89*** 10.79*** 0.054 4.47*** 1.12 1.78
Aroma
Grapefruit 2.08** 1.74 11.38** 2.15 1.16 1.12 2.86*
Pear 3.91*** 5.59*** 6.60** 0.602 3.03* 3.06** 0.67 Sweet 2.44** 3.26** 2.31 12.22** 1.52 0.61 1.36 Sour 3.67** 2.07 30.87*** 2.32 2.93** 0.581 1.49 Bitter 2.58** 4.14** 4.57** 0.0348 1.99* 0.744 1.59 Orange 2.299** 7.80*** 0.1203 0 2.23* 0.897 0.468 Apple 5.38*** 10.02*** 6.12** 3.35 4.43*** 0.795 3.38** Grapefruit 6.97*** 2.79* 42.10*** 7.15** 4.18*** 2.29* 9.30*** Honey 5.51*** 11.31*** 6.04** 0.042 4.37*** 3.85** 1.89 Pineapple 2.06* 1.78 7.84** 3.45 2.30* 1.189 0.899
Flavor by Mouth
Honeysuckle 1.16 2.26 1.4 0.083 1.34 0.696 0.92
Viscosity 3.45*** 7.72*** 12.04*** 0.89 1.14 1.21 1.53 Aftertaste 5.43*** 3.44** 76.28*** 4.50* 2.43* 1.6 2.32
Texture/ Mouthfeel Astringency 2.50** 3.46** 0.504 4.15 2.78** 0.524 0.709
bTreatment noted as Trt, Replications as Rep. Trt×Judge, Judge×Rep, and Trt×Rep indicate treatment by judge interaction, judge by replication interaction, and treatment by replication interaction. aF ratios are shown for sources of variation. c *,**,*** indicate significance at p < 0.05, 0.01, 0.001, respectively.
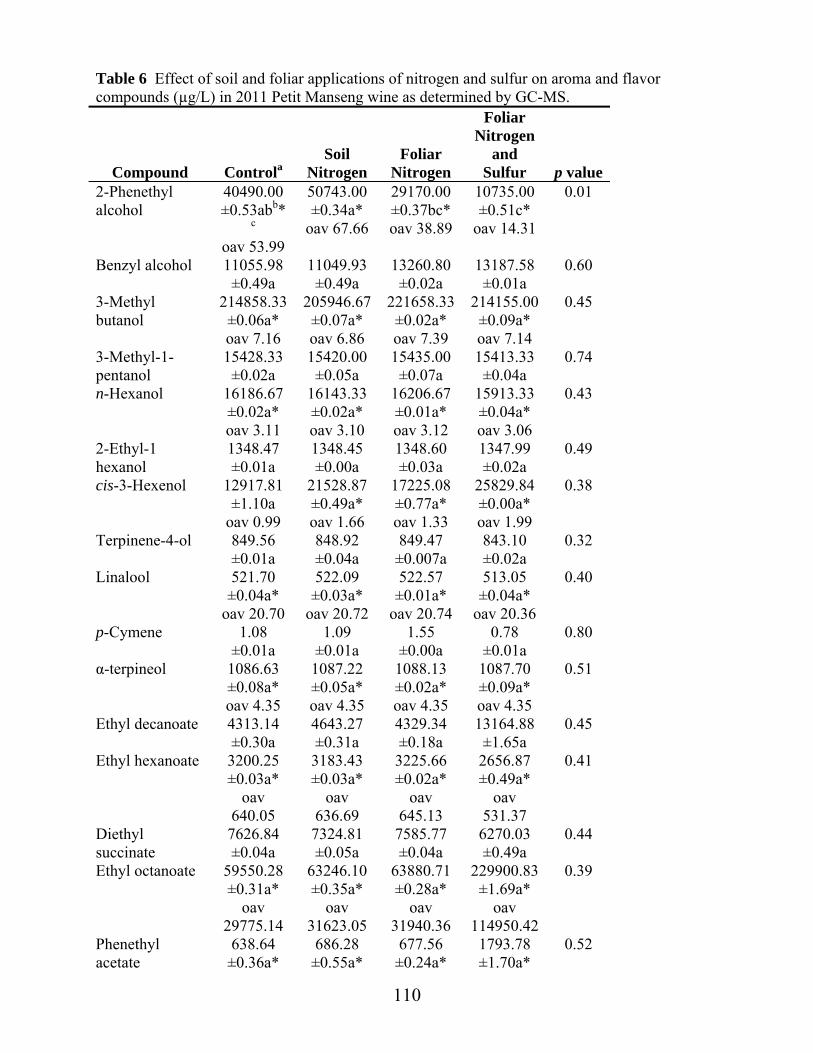
110
Table 6 Effect of soil and foliar applications of nitrogen and sulfur on aroma and flavor compounds (µg/L) in 2011 Petit Manseng wine as determined by GC-MS.
Compound Controla Soil
Nitrogen Foliar
Nitrogen
Foliar Nitrogen
and Sulfur p value
2-Phenethyl alcohol
40490.00 ±0.53abb*
c oav 53.99
50743.00 ±0.34a*
oav 67.66
29170.00 ±0.37bc* oav 38.89
10735.00 ±0.51c*
oav 14.31
0.01
Benzyl alcohol 11055.98 ±0.49a
11049.93 ±0.49a
13260.80 ±0.02a
13187.58 ±0.01a
0.60
3-Methyl butanol
214858.33 ±0.06a* oav 7.16
205946.67 ±0.07a* oav 6.86
221658.33 ±0.02a* oav 7.39
214155.00 ±0.09a* oav 7.14
0.45
3-Methyl-1-pentanol
15428.33 ±0.02a
15420.00 ±0.05a
15435.00 ±0.07a
15413.33 ±0.04a
0.74
n-Hexanol 16186.67 ±0.02a* oav 3.11
16143.33 ±0.02a* oav 3.10
16206.67 ±0.01a* oav 3.12
15913.33 ±0.04a* oav 3.06
0.43
2-Ethyl-1 hexanol
1348.47 ±0.01a
1348.45 ±0.00a
1348.60 ±0.03a
1347.99 ±0.02a
0.49
cis-3-Hexenol 12917.81 ±1.10a
oav 0.99
21528.87 ±0.49a* oav 1.66
17225.08 ±0.77a* oav 1.33
25829.84 ±0.00a* oav 1.99
0.38
Terpinene-4-ol 849.56 ±0.01a
848.92 ±0.04a
849.47 ±0.007a
843.10 ±0.02a
0.32
Linalool 521.70 ±0.04a*
oav 20.70
522.09 ±0.03a*
oav 20.72
522.57 ±0.01a*
oav 20.74
513.05 ±0.04a*
oav 20.36
0.40
p-Cymene 1.08 ±0.01a
1.09 ±0.01a
1.55 ±0.00a
0.78 ±0.01a
0.80
α-terpineol 1086.63 ±0.08a* oav 4.35
1087.22 ±0.05a* oav 4.35
1088.13 ±0.02a* oav 4.35
1087.70 ±0.09a* oav 4.35
0.51
Ethyl decanoate 4313.14 ±0.30a
4643.27 ±0.31a
4329.34 ±0.18a
13164.88 ±1.65a
0.45
Ethyl hexanoate 3200.25 ±0.03a*
oav 640.05
3183.43 ±0.03a*
oav 636.69
3225.66 ±0.02a*
oav 645.13
2656.87 ±0.49a*
oav 531.37
0.41
Diethyl succinate
7626.84 ±0.04a
7324.81 ±0.05a
7585.77 ±0.04a
6270.03 ±0.49a
0.44
Ethyl octanoate 59550.28 ±0.31a*
oav 29775.14
63246.10 ±0.35a*
oav 31623.05
63880.71 ±0.28a*
oav 31940.36
229900.83 ±1.69a*
oav 114950.42
0.39
Phenethyl acetate
638.64 ±0.36a*
686.28 ±0.55a*
677.56 ±0.24a*
1793.78 ±1.70a*
0.52

111
oav 2.55 oav2.75 oav2.71 oav 7.18 Isoamyl acetate 14070.30
±0.23a* oav
469.01
12014.96 ±0.48ab*
oav 400.50
11579.82 ±0.32ab*
oav 385.99
7667.91 ±0.62b*
oav 255.60
0.06
Methyl salicylate
63.19 ±0.03a* oav 1.58
62.28 ±0.01a* oav 1.56
62.62 ±0.00a* oav 1.57
63.68 ±0.06a* oav 1.59
0.66
Hexyl acetate 613.55 ±0.03a*
oav 306.78
599.94 ±0.07a*
oav 299.97
607.54 ±0.02a*
oav 303.77
485.12 ±0.49a*
oav 242.56
0.26
Ethyl dodecanoate
368.30 ±0.38a
464.45 ±0.66a
496.87 ±0.28a
1259.13 ±1.51a
0.41
Hexanoic acid 50750.00 ±0.02a*
oav 16.92
50580.00 ±0.02a*
oav 16.86
50285.00 ±0.02a*
oav 16.76
41656.67 ±0.49a*
oav 13.89
0.38
Decanoic acid 8400.00 ±1.34a
oav 0.56
8030.00 ±1.19a
oav 0.54
6823.33 ±0.92a
oav 0.45
34185.00 ±2.30a* oav 2.28
0.60
2-Ethylhexanoic acid
0.01 ±0.00a
0.01 ±0.38a
0.01 ±0.34a
0.03 ±1.48a
0.43
Nonanoic acid 4.69 ±0.49a
3.75 ±0.78a
5.63 ±0.00a
4.67 ±0.49a
0.59
Octanoic acid 9788.33 ±0.09a* oav 3.26
9718.33 ±0.11a* oav 3.24
9421.67 ±0.08a* oav 3.14
7966.67 ±0.49a* oav 2.66
0.42
Benzaldehyde 4324.30 ±0.00a*
oav 12.36
3824.10 ±0.32a*
oav 10.93
4323.98 ±0.00a*
oav 12.35
4323.94 ±0.20a*
oav 12.35
0.43
Furfural 0.75 ±0.78ab
0.93 ±0.49a
0.19 ±0.44a
0.75 ±0.77ab
0.07
γ-Butyrolactone 3375.00 ±1.41a*
oav 112.50
4178.33 ±1.10a*
oav 139.28
3398.33 ±0.77a*
oav 113.28
2485.00 ±1.06a*
oav 82.83
0.89
aControl: no treatment; Soil Nitrogen: nitrogen 30 kg/ha after flowering; Foliar Nitrogen: nitrogen 15 kg/ha (two applications prior to véraison); Foliar Nitrogen and Sulfur: nitrogen 15 kg/ha and sulfur 5 kg/ha. bDifferent letters within rows indicate significant differences at p<0.05 (Student’s t-test). c* = odor activity value (oav) > 1.

112
Figure 1 Mean intensities of aroma attributes in Petit Manseng wines in 2011 from four treatments. 1: control, no treatment; 2: soil nitrogen 30 kg/ha after flowering; 3: foliar nitrogen 15 kg/ha, two applications prior to véraison; and 4: foliar nitrogen 15 kg/ha and sulfur 5 kg/ha.
0
1
2
3
4
5
6
peach aroma*
pear aroma*
honeysuckle aroma*
pineapple aroma*
melon aroma*
honey aroma*green apple aroma*
grapefruit aroma*
floral aroma
lemon aroma
lime aroma
Trt 1
Trt 2
Trt 3
Trt 4
a* Indicates significant differences at p<0.05 (Student’s t-test).

113
Figure 2 Mean intensities of flavor-by-mouth and texture/mouthfeel attributes in Petit Manseng wines in 2011 from four treatments. 1: control, no treatment; 2: soil nitrogen 30 kg/ha after flowering; 3: foliar nitrogen 15 kg/ha, two applications prior to véraison; and 4: foliar nitrogen 15 kg/ha and sulfur 5 kg/ha.
0
1
2
3
4
5
6
pear flavor*
sweet flavor*
sour flavor*
bitter flavor*
grapefruit*
pineapple*
apple*astringency*
viscosity*
aftertaste*
orange flavor
honey flavor
honeysuckle flavor
Trt 1
Trt 2
Trt 3
Trt 4
a* Indicates significant differences at p<0.05 (Student’s t-test).
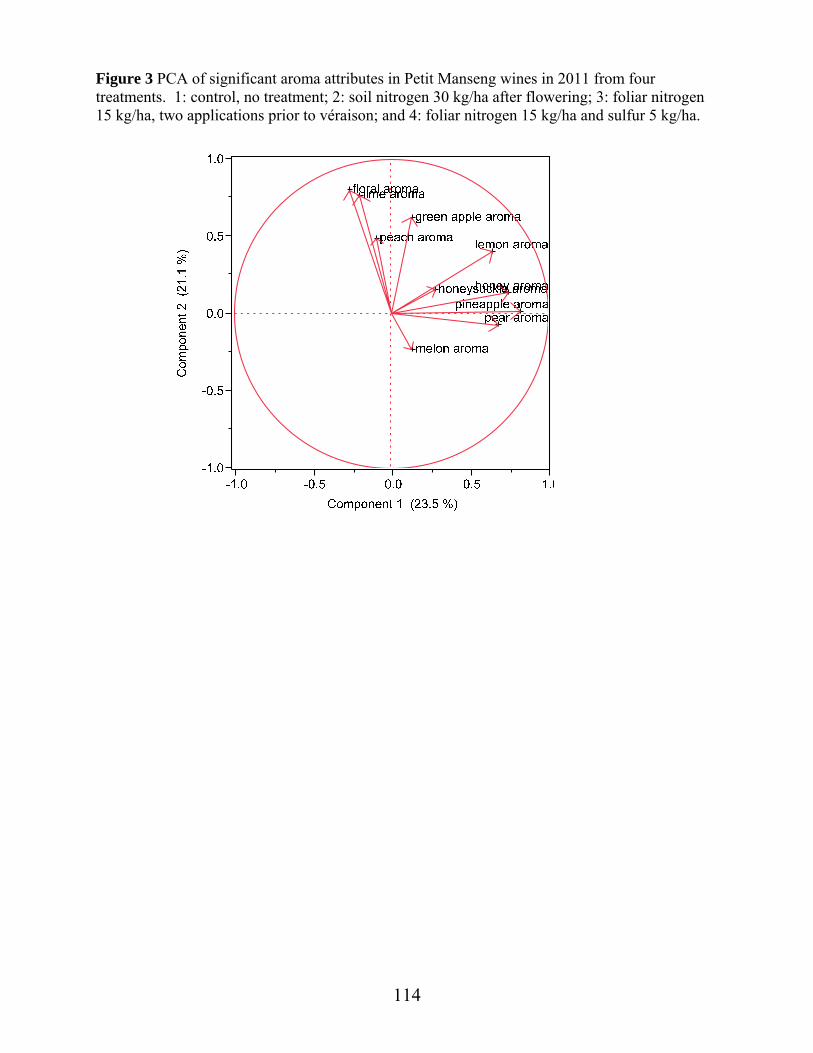
114
Figure 3 PCA of significant aroma attributes in Petit Manseng wines in 2011 from four treatments. 1: control, no treatment; 2: soil nitrogen 30 kg/ha after flowering; 3: foliar nitrogen 15 kg/ha, two applications prior to véraison; and 4: foliar nitrogen 15 kg/ha and sulfur 5 kg/ha.
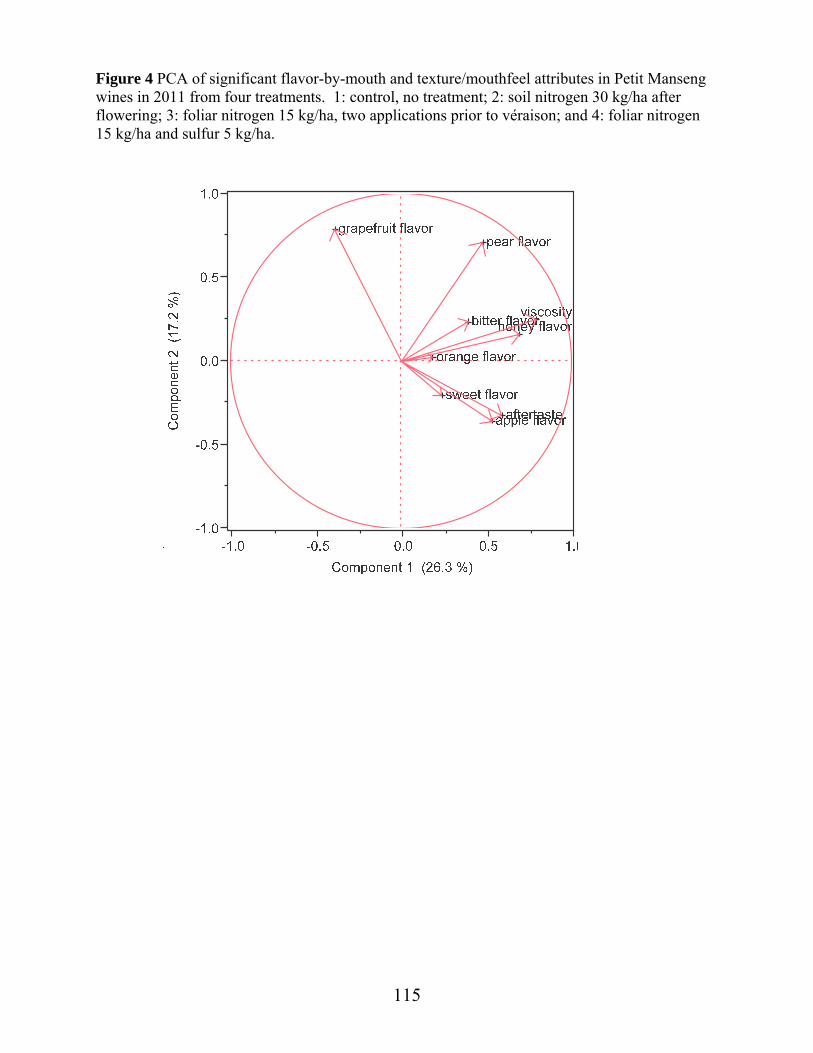
115
Figure 4 PCA of significant flavor-by-mouth and texture/mouthfeel attributes in Petit Manseng wines in 2011 from four treatments. 1: control, no treatment; 2: soil nitrogen 30 kg/ha after flowering; 3: foliar nitrogen 15 kg/ha, two applications prior to véraison; and 4: foliar nitrogen 15 kg/ha and sulfur 5 kg/ha.
116
Appendix A
Virginia Polytechnic Institute and State University
Informed Consent for Participants in Research Projects Involving Human Subjects (Sensory Evaluation)
Title Project: Petit Manseng Descriptive Analysis Investigators: Susan E. Duncan, PhD, MK Kelly, Virginia Fernandez-Plotka I. Purpose of this Research/Project You are invited to participate in a study to rate the intensity of various attributes in Petit Manseng wines produced from grapes that have received various vineyard treatments. II. Procedures Training sessions: You will be asked to participate in five one-hour training sessions. In these sessions, two will be held for the term generation (using four commercial Petit Manseng wines). Three sessions will be spent on standard identification and intensity ratings of the attributes generated by the panelists. Further retraining on term standard identification and intensity ratings will be provided if needed. During initial training sessions, descriptive terms will be generated by panelists in the following classes: aroma, flavor-by-mouth, texture/mouthfeel and aftertaste. These attribute classes are defined as follows: Aroma: the odor perceived via orthonasal olfaction Flavor-by-mouth: the aromatics perceived via the retronasal pathway when the wine is held in the mouth for 20 seconds Texture/mouthfeel: characteristic of a product perceived by the tactile or visual senses following chewing, swallowing or expectoration Mouthfeel: sensations occurring in the oral cavity (ex. drying or coating) as opposed to texture, in which the sensations are related to the food itself as in firmness and hardness (Lawless 1998) During the initial training sessions, panelists will define the descriptors generated and identify possible references for the terms. Panelists will eliminate terms that are either difficult to detect in wines (ie. present in low concentrations) or those that were present in most wines at a constant level of intensity. Rather than have panelists decide on a rinsing protocol, that recommended by Mirarefi et al will be utilized in the interest of time. This protocol is as follows: First rinse with unsalted Matzo crackers (Manischewitz Co, Jersey City, NJ), followed by warm spring water (40C) and then room temperature spring water (22C). All samples will be expectorated. The line scale to be used will also be prechosen: a 15 cm line scale with end word anchors “none” to “extreme”. Final training sessions will be used to study individual intensities of various attributes.
Appendix A
117
Reference Samples: A neutral base wine will be used to produce flavor-by-mouth, texture/mouthfeel and aftertaste references for the terms generated. For aroma references, the scent kit Le Nez Du Vin (Wine Aromas, Las Vegas NV) will be used. This commercial kit provides 54 reference samples associated with various wines. At the end of the five training sessions, panelists will be assessed on their ability to identify key attributes as well as identify intensity ratings. Verification will be achieved by providing individual base wines to panelists with reference compounds or wine kit reference standards and asking them to assess the standards using the 15 cm line scale. This will be conducted in duplicate to ensure consistency. Expectations are that the panelists will be consistent in their responses for identical wines and be able to identify each attribute correctly. After five training sessions, panelists will then assess the four test Petit Manseng wines using a 15 cm line scale (anchors “none” to “extreme”). Trained panelists will evaluate the Petit Manseng wines in individual booths in the Food Science Sensory Lab FST 127. Each panelist will be served four of the wines in duplicate each day (one hour break in between). The rinse protocol detailed above will be used for all sessions. All samples will be expectorated. Time commitment/panelist: Five training sessions-1 hr each/total 5 hrs Final assessment with test wines: approximately 1.5 hr/panelist Total hrs/panelist: approximately 6.5 hrs
III. Risks There are only minimal risks associated with this study. Individuals with allergies or unknown sensitivity to sulfites may be at risk. Those with adverse reactions to ingesting small volumes of alcohol will be asked to not participate. All samples will be expectorated. IV. Benefits The goal of this research is to determine if various vineyard treatments impact Petit Manseng wine aroma and flavor. Because wine aromas are a dominant factor in wine marketability, this study will potentially maximize the quality and marketability of Petit Manseng. V. Extent of Anonymity and Confidentiality The results of your performance as a panelist will be kept strictly confidential except to the investigator. Individual panelists will be referred to by a code number for data analyses and for any publication of the results. VI. Compensation There will be no formal compensation for participation in this project. VII. Freedom to Withdraw If you agree to participate in this study, you are free to withdraw from the study at any time without penalty. VIII. Subject’s Responsibilities I voluntarily agree to participate in this study. I have the following responsibilities:
• Participate in 5 training sessions (1 hr each) to develop terms and identify references for terms generated. Training will include individual attribute intensity ratings for each attribute.
•
118
• Evaluate 2 sets (4 samples each) of wine, as presented, and provide answers using scoresheet provided. Samples are as follows: Six replications each of the four individual treatments will be combined to yield four test wines total. Treatments I-IV include: I- control vines with no addition of nitrogen or sulfur, II- soil nitrogen applies at a rate of 30 kg/ha after flowering, III- leaf nitrogen applied at a rate of 15 kg/ha in two applications prior to véraison and IV- leaf nitrogen (15kg/ha) and sulfur (5kg/ha) applied in two applications prior to véraison. IX. Subject’s Permission I have read the consent form and conditions of this project. I have had all my questions answered. I hereby acknowledge the above and give my voluntary consent: By signing, I also verify that I am 21 years of age or older, in good health and have no known adverse reactions to sulfites or ingesting small volumes of alcohol. Date: _____________________ Subject Signature: _____________________________________________ Subject Printed Name: _________________________________________
Form of proof of age 21 years or older (drivers license or other id)_____________________________________
119
- - - - - - - - - - - For Human Subject to Keep - - - - - - - - - - - - Should I have any pertinent questions about this research or its conduct, and research subjects’ rights, and whom to contact in the event of a research-related injury to the subject. I may contact: Susan Duncan, Faculty/Investigator (540) 231-8675; [email protected] Molly Kelly, Graduate Student/Investigator (540) 231-9843 [email protected] Virginia Fernandez-Plotka, Research Associate, (540) 231-9843; Investigator [email protected] David Moore Chair, Virginia Tech Institutional Review (540) 231-4991; Board for the Protection of Human Subjects [email protected] Office of Research Compliance 2000 Kraft Drive, Suite 2000 (0497) Blacksburg, VA 24061
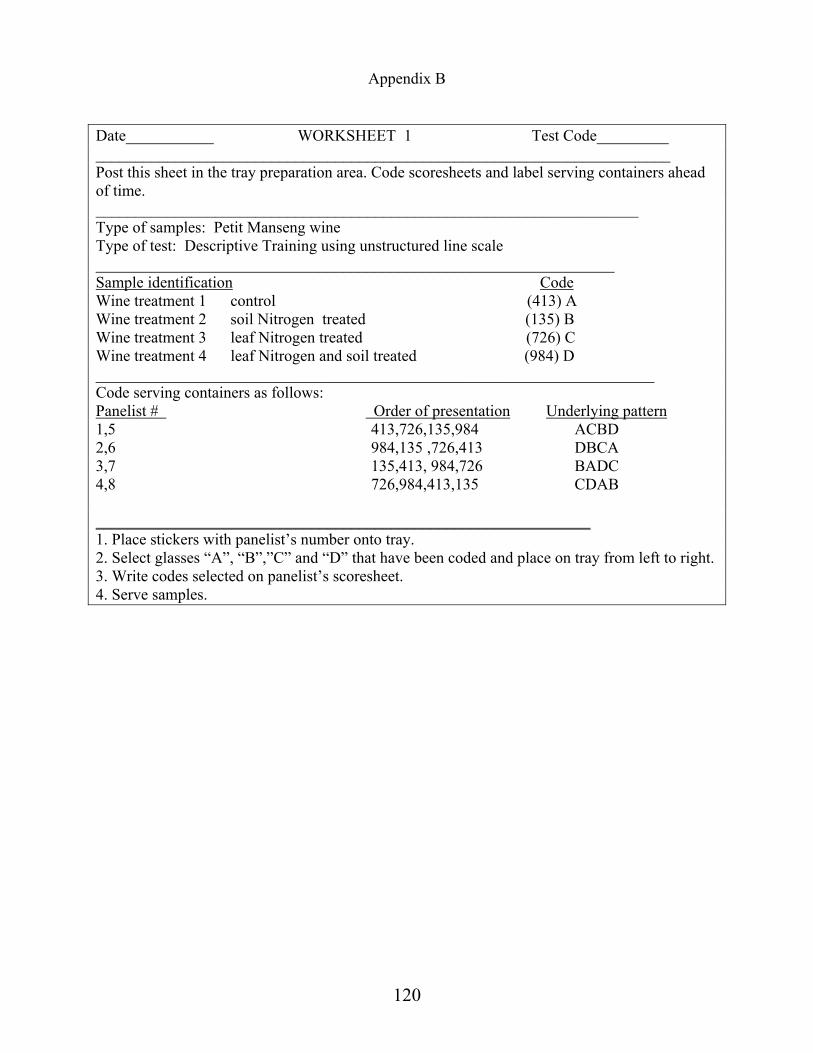
120
Appendix B
Date___________ WORKSHEET 1 Test Code_________ ________________________________________________________________________ Post this sheet in the tray preparation area. Code scoresheets and label serving containers ahead of time. ____________________________________________________________________ Type of samples: Petit Manseng wine Type of test: Descriptive Training using unstructured line scale _________________________________________________________________ Sample identification Code Wine treatment 1 control (413) A Wine treatment 2 soil Nitrogen treated (135) B Wine treatment 3 leaf Nitrogen treated (726) C Wine treatment 4 leaf Nitrogen and soil treated (984) D ______________________________________________________________________ Code serving containers as follows: Panelist # Order of presentation Underlying pattern 1,5 413,726,135,984 ACBD 2,6 984,135 ,726,413 DBCA 3,7 135,413, 984,726 BADC 4,8 726,984,413,135 CDAB ______________________________________________________________ 1. Place stickers with panelist’s number onto tray. 2. Select glasses “A”, “B”,”C” and “D” that have been coded and place on tray from left to right. 3. Write codes selected on panelist’s scoresheet. 4. Serve samples.
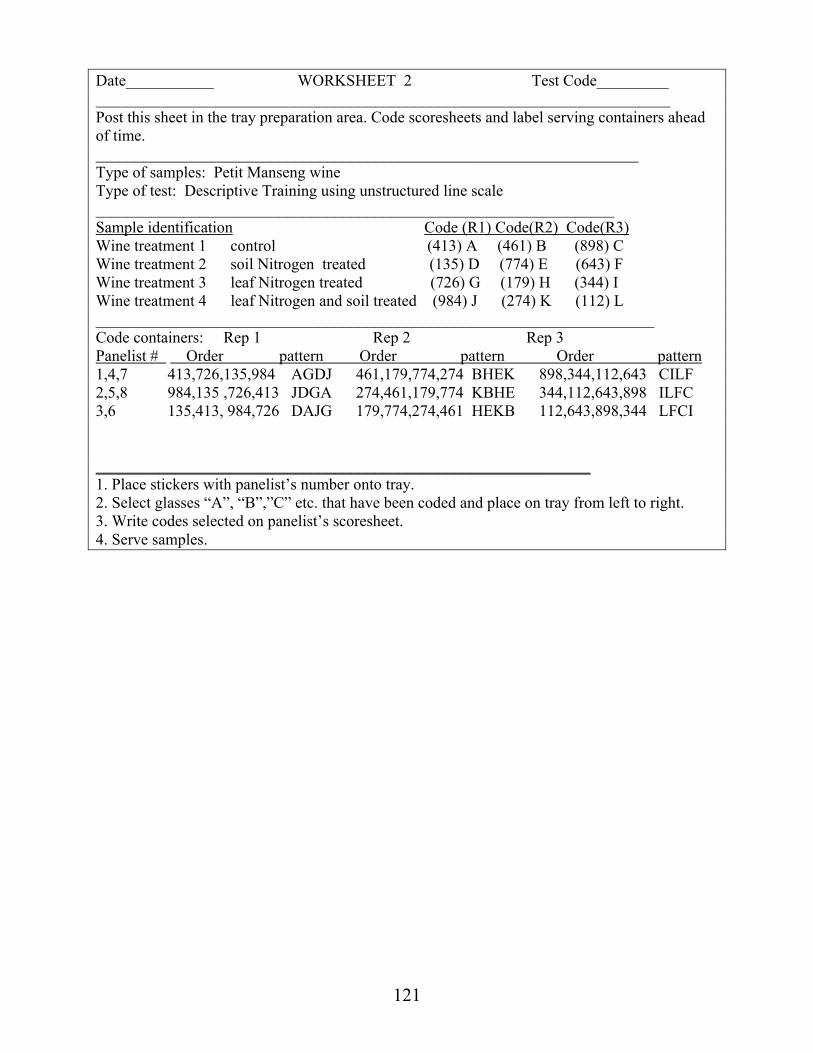
121
Date___________ WORKSHEET 2 Test Code_________ ________________________________________________________________________ Post this sheet in the tray preparation area. Code scoresheets and label serving containers ahead of time. ____________________________________________________________________ Type of samples: Petit Manseng wine Type of test: Descriptive Training using unstructured line scale _________________________________________________________________ Sample identification Code (R1) Code(R2) Code(R3) Wine treatment 1 control (413) A (461) B (898) C Wine treatment 2 soil Nitrogen treated (135) D (774) E (643) F Wine treatment 3 leaf Nitrogen treated (726) G (179) H (344) I Wine treatment 4 leaf Nitrogen and soil treated (984) J (274) K (112) L ______________________________________________________________________ Code containers: Rep 1 Rep 2 Rep 3 Panelist # Order pattern Order pattern Order pattern 1,4,7 413,726,135,984 AGDJ 461,179,774,274 BHEK 898,344,112,643 CILF 2,5,8 984,135 ,726,413 JDGA 274,461,179,774 KBHE 344,112,643,898 ILFC 3,6 135,413, 984,726 DAJG 179,774,274,461 HEKB 112,643,898,344 LFCI ______________________________________________________________ 1. Place stickers with panelist’s number onto tray. 2. Select glasses “A”, “B”,”C” etc. that have been coded and place on tray from left to right. 3. Write codes selected on panelist’s scoresheet. 4. Serve samples.

122
Appendix C
Petit Manseng wine Instructions
1. Evaluate the wine for aroma, flavor by mouth, texture and aftertaste by placing a mark on each line below. Lines should be 15 cm in length.
Aroma Peach ----low-----------------------------------------------------------------extreme-- Pear --- low-----------------------------------------------------------------extreme-- Honeysuckle --- low-----------------------------------------------------------------extreme-- Pineapple --- low-----------------------------------------------------------------extreme-- Cantelope ---low-----------------------------------------------------------------extreme-- Honeydew ---low-----------------------------------------------------------------extreme-- Honey ----low-----------------------------------------------------------------extreme-- Floral ----low-----------------------------------------------------------------extreme-- Lemon -----low-----------------------------------------------------------------extreme-- Lime -----low-----------------------------------------------------------------extreme-- Green apple -----low-----------------------------------------------------------------extreme-- Grapefruit ----low-----------------------------------------------------------------extreme-- Flavor-by-mouth Sweet ----low-----------------------------------------------------------------extreme---- Sour ----low-----------------------------------------------------------------extreme---- Bitter ----low-----------------------------------------------------------------extreme---- Orange --- low-----------------------------------------------------------------extreme---- Pear ----low-----------------------------------------------------------------extreme---- Grapefruit ----low-----------------------------------------------------------------extreme---- Honey ----low-----------------------------------------------------------------extreme---- Pineapple ----low-----------------------------------------------------------------extreme--- Golden Delicious apple--low-----------------------------------------------------------------extreme— Honeysuckle ----low-----------------------------------------------------------------extreme---- Texture/mouthfeel Astringent ----low-----------------------------------------------------------------extreme---- Viscosity ----low-----------------------------------------------------------------extreme---- Aftertaste Long -----low-------------------------------------------------------------------extreme---- Medium -----low-------------------------------------------------------------------extreme---- Short ----low-------------------------------------------------------------------extreme----