Embed Size (px)
Citation preview
J.Agric.&Env.Sci.Alex.Univ.,Egypt Vol.6 (2)2007
291
EFFECT OF DIFFERENT BIOFERTILIZER TYPES AND
NITROGEN FERTILIZER LEVELS ON GROWTH,
YIELD AND CHEMICAL CONTENTS OF PEA PLANTS
(PISUM SATIVUM L.)
*GABR,S.M, *H.A.ELKHATIB AND
**A. M.EL-KERIAWY
*Horticulture Dept. Faculty of Agriculture, Damanhour Branch Alex. Univ. ** Agricultural research center, Alex. Egypt
ABSTRACT
The current study was carried out to investigate the
effects of seed inoculation with five different biofertilizer
types (Azotobacter, Azospirillum, Rhizobium, a mixture of
the previous types of the biofertilizers and uninoculated
control) and four different fertilization levels of mineral
nitrogen (0, 30, 60 and 90 Kg N fed- 1
. ) as well as their
interactions on the vegetative growth characters, flowering
traits , green pods yield and its components and some
chemical contents of pea plants (Pisum sativum L.) cv.
"Victory Freezer ".Two field experiments were carried out
during the winter seasons of 2003 and 2004 at EL-
Mahmodia region, Behera Governorate, Egypt. A factorial
experiment in a randomized complete blocks design was
used, with three replications. The obtained results indicated
that inoculation of pea seeds with any utilized biofertilizer
type significantly, increased all studied vegetative growth
characters and yield components ( plant height, number of
leaves, number of branches, plant fresh weight , plant dry
weigh , green pods yield fed-1
, number of pods plant-1
,
number of seeds pod-1
, and shelling % ).Also leaves contents
of N, K and chlorophyll were increased compared to the
uninoculated control, in both seasons. The mixed
biofertilizer was the most effective one on all studied
vegetative growth characters and yield components. The
application of mineral nitrogen at the rates of 30, 60 and 90
Kg N fed-1
to the growing pea plants, significantly, increased
J.Agric.&Env.Sci.Alex.Univ.,Egypt Vol.6 (2)2007
291
plant height, number of leaves and branches plant-1
, plant
fresh weight, plant dry weight, yield of green pods fed-1
,
number of green pods plant-1
, number of seed pod-1
. Also
leaves N, K and chlorophyll contents were increased over
the control treatment, in both seasons. The highest two
nitrogen levels (60 and 90 Kg N fed-1.) were remarkable and
associated with the highest mean values in this concern. The
interaction effects of biofertilizer types and nitrogen levels
on most studied characters were found significant in both
seasons. The combined treatment of mixed biofertilizer and
60 or 90 Kg N fed-1
together, were considered the best
treatment combinations, as they gave the highest mean
values of most studied characters.
INTRODUCTION
Pea (Pisum sativum L.) is one of the major winter crops grown
in Egypt for local consumption and export. Pea seeds, fresh or dry,
had a high nutritional values due to their high contents of
carbohydrates, proteins, vitamins and minerals (Smart, 1990).
Nitrogen nutrition is one of the paramount factors which
influence growth and yield potential of many different vegetable
crops. Suitable application of nitrogen to the growing pea plants was
extensively studied by many investigators to attain favorable
enhancing effects on growth, yield and quality. However, the
excessive use of nitrogen fertilizers increased the total costs of crop
production, created pollution of agro-ecosystem and increased
deterioration of soil fertility (Marschner, 1995). Therefore, it became
essential for us to evolve and adopt a strategy of supplementing or
substituting the inorganic nitrogen with organic sources, especially
those of microbial origin.
Nitrogen fixing microorganisms are either symbiotic of the
genous Rhizobium; which associate with plant and form nodules, or
non-symbiotic as bacteria of the genera Azotobacter, Azospirillum
and Klebsiella; that generate ammonia for their own use and provide
the plant with nitrogen as an exchange for carbon and protected
habitat (Marschner, 1995).
J.Agric.&Env.Sci.Alex.Univ.,Egypt Vol.6 (2)2007
291
Accordingly, the present study was conducted to investigate the
influence of seed inoculation with different biofertilizer types and
various nitrogen fertilizer levels as well as their different interactions
on vegetative growth, flowering traits, green pods yield and its
components, and chemical composition of pea plants.
METERIALS AND METHODS
This study was carried out during the two winter seasons of 2003
and 2004 at El-Mahmodia region, Behera Governorate, A.R.E.
Preceding the initiation of each experiment, soil samples of 25
cm depth, from each experimental site, were collected and analyzed
for some important physical and chemical features, according to the
standard and published procedures, reported by Page et al. (1982).
The results of these analyses are shown in Table (1).
There were 20 treatment combinations consisting of 4 nitrogen
levels (0, 30, 60 and 90 kg N fed-1
) and 5 biofertilizer treatments
(uninoculated control, Azotobacter chroococcum , Azospirillum
lipoferium , Rhizobium Leguminsarum and a Mixed biofertilizer
containing equal parts of the single aforementioned biofertilizers).
Bacterial population of the inoculants used was1.2 x 108 cell/cm3
obtained from the Biofertilizer Unit, Faculty of Agriculture, Ain
Shams University.The biofertilizer were supplied by the Biofertilizer
Unit, Faculty of Agriculture, Ain Shams University, Cairo.
The seeds were surface sterilized with 1% sodium hypochlorite
for 20 min, then rinsed with water several times. The surface of
disinfected seeds was coated by soaking seeds in a liquid culture
medium of each organism for 15 minutes using 10% arabic gum as
Adhesive. For combined inoculations, the liquid cultures of the three
organisms were mixed in equal proportions and the seeds were then
dipped in it(Fernandez and Miller, 1986). Uninoculated seeds (control)
were soaked in distilled water for 15. minutes also.

J.Agric.&Env.Sci.Alex.Univ.,Egypt Vol.6 (2)2007
291
Table (1). Physical and chemical properties of the experimental
sites during 2003 and 2004 seasons.
Parameters Seasons
2003 2004
Physical properties
Clay% 44.00 44.00
Silt% 40.00 40.00
Sand% 16.00 16.00
Soil texture Silty clay Silty clay
Chemical properties
PH 8.3 7.6
EC(dsm-1
) soil paste 2.4 2.6
CaCO3% 2.00 2.1
Macro-elements (ppm)
Total N 85.00 90.00
Total P 29.00 27.00
Total K 316.16 416.00
The equivalent amount of each mineral N rate, in the form of
ammonium sulphate (20.5% N), was side banded at two equal
portions, after 3 and 5 weeks from seed sowing. All treatments
received 200 kg of calcium superphosphate (15.5 % P2O5) and 50 kg
potassium sulphate (48% K2O) fed-1
. Superphosphate was applied pre-
sowing date, whereas, potassium sulphate was added in two equal
portions at 3 and 5 weeks after sowing date.
A factorial experiment in a randomized complete blocks design
of twenty treatments combinations replicated three times was
conducted each season. The experimental unit consisted of 5 rows, 4
meters long and 0.6 meter wide. The adjacent experimental units were
separated by a guard row. Seeds of pea (Pisum sativum L.) Victory
Freezer cultivar were inoculated and directly sowed on one side of the
row at 15 cm apart on October 30, 2003 and October 26, 2004. Ten
J.Agric.&Env.Sci.Alex.Univ.,Egypt Vol.6 (2)2007
291
random chosen plants from each plot, at 60 days from seed sowing
were used to measure the following :
1-Vegetative growth characters: Plant height, Number of leaves
and branches plant-1, Plant fresh weight, Plant dry weight.
2-Flowering traits: Earliness of flowering( the number of days
from seed sowing till 25 % full blooming of pea plants) and Fruit set
percentage( calculated as A/Bx100; where, A denotes number of
setted pods plant-1
throughout the entire season and B denotes number
of flowers plant-1 throughout the entire flowering period).
3-Green pods yield and its components: Number of green pods
plant-1
, number of seeds pod-1
, total green pods yield feddan-1
and
Shelling ratio calculated as:
010plotper podsgreen ofweight
plotper seedsgreen ofweight
4- Leaves chemical contents : Total chlorophyll content (in SPAD
unit) using digital chlorophyll meter (model minolta
chlorophyll meter SPAD-502);Nitrogen content, according to
Chapman and Pratt (1961);Phosphorus content according to
the procedure of John (1970) and Potassium content as
described by Jackson(1973).
All obtained data were statistically analyzed using SAS software
program (1996). Comparisons among the means of different
treatments were achieved using the New Least Significant Difference
procedure at P=0.05 level, as illustrated by Al-Rawy and Khalf-Allah
(1980).
RESULTS AND DISCUSSION
The main effects of nitrogen and biofertilizers and the interaction
on vegetative growth:
The main effects of the biofertilizers on the various studied
vegetative growth characters of pea plants, in both seasons of 2003and
2004, are illustrated in Table (2). Inoculation of pea seeds either with
a single biofertilizer of Azotobacter, Azospirillum and Rhizobium or
the mixture of them resulted in significant increments on plant height,

J.Agric.&Env.Sci.Alex.Univ.,Egypt Vol.6 (2)2007
291
J.Agric.&Env.Sci.Alex.Univ.,Egypt Vol.6 (2)2007
291
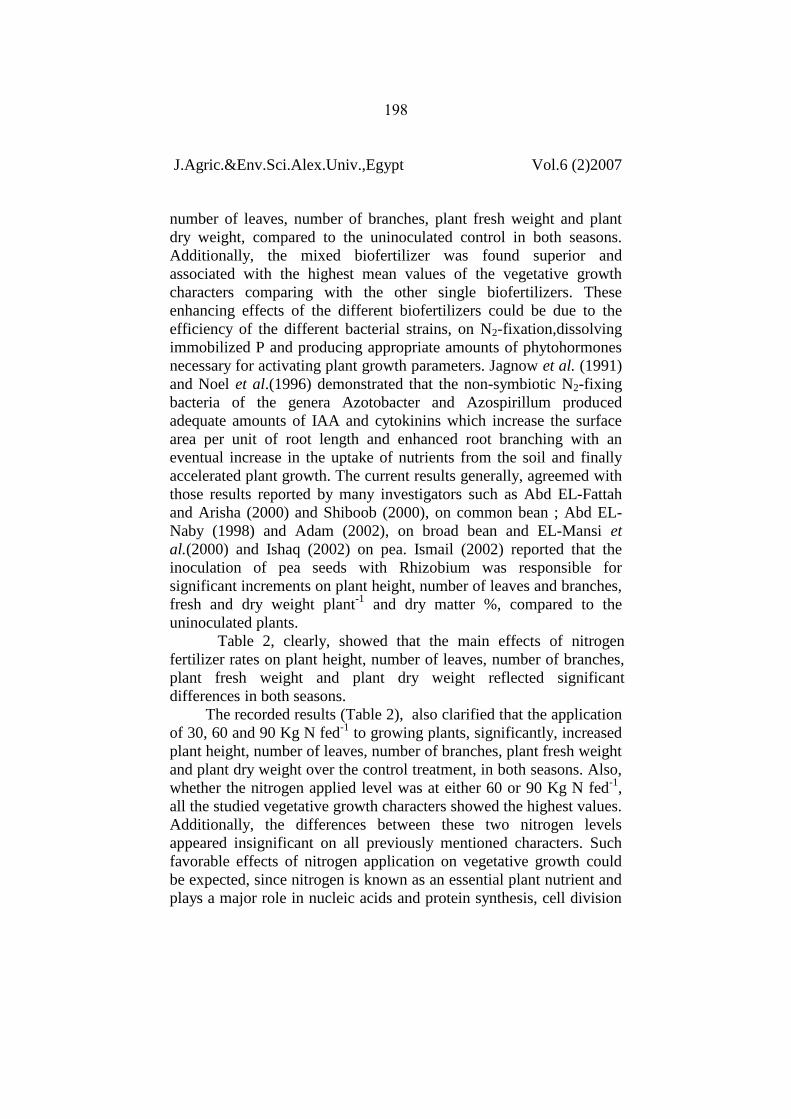
number of leaves, number of branches, plant fresh weight and plant
dry weight, compared to the uninoculated control in both seasons.
Additionally, the mixed biofertilizer was found superior and
associated with the highest mean values of the vegetative growth
characters comparing with the other single biofertilizers. These
enhancing effects of the different biofertilizers could be due to the
efficiency of the different bacterial strains, on N2-fixation,dissolving
immobilized P and producing appropriate amounts of phytohormones
necessary for activating plant growth parameters. Jagnow et al. (1991)
and Noel et al.(1996) demonstrated that the non-symbiotic N2-fixing
bacteria of the genera Azotobacter and Azospirillum produced
adequate amounts of IAA and cytokinins which increase the surface
area per unit of root length and enhanced root branching with an
eventual increase in the uptake of nutrients from the soil and finally
accelerated plant growth. The current results generally, agreemed with
those results reported by many investigators such as Abd EL-Fattah
and Arisha (2000) and Shiboob (2000), on common bean ; Abd EL-
Naby (1998) and Adam (2002), on broad bean and EL-Mansi et
al.(2000) and Ishaq (2002) on pea. Ismail (2002) reported that the
inoculation of pea seeds with Rhizobium was responsible for
significant increments on plant height, number of leaves and branches,
fresh and dry weight plant-1
and dry matter %, compared to the
uninoculated plants.
Table 2, clearly, showed that the main effects of nitrogen
fertilizer rates on plant height, number of leaves, number of branches,
plant fresh weight and plant dry weight reflected significant
differences in both seasons.
The recorded results (Table 2), also clarified that the application
of 30, 60 and 90 Kg N fed-1
to growing plants, significantly, increased
plant height, number of leaves, number of branches, plant fresh weight
and plant dry weight over the control treatment, in both seasons. Also,
whether the nitrogen applied level was at either 60 or 90 Kg N fed-1
,
all the studied vegetative growth characters showed the highest values.
Additionally, the differences between these two nitrogen levels
appeared insignificant on all previously mentioned characters. Such
favorable effects of nitrogen application on vegetative growth could
be expected, since nitrogen is known as an essential plant nutrient and
plays a major role in nucleic acids and protein synthesis, cell division
J.Agric.&Env.Sci.Alex.Univ.,Egypt Vol.6 (2)2007
299
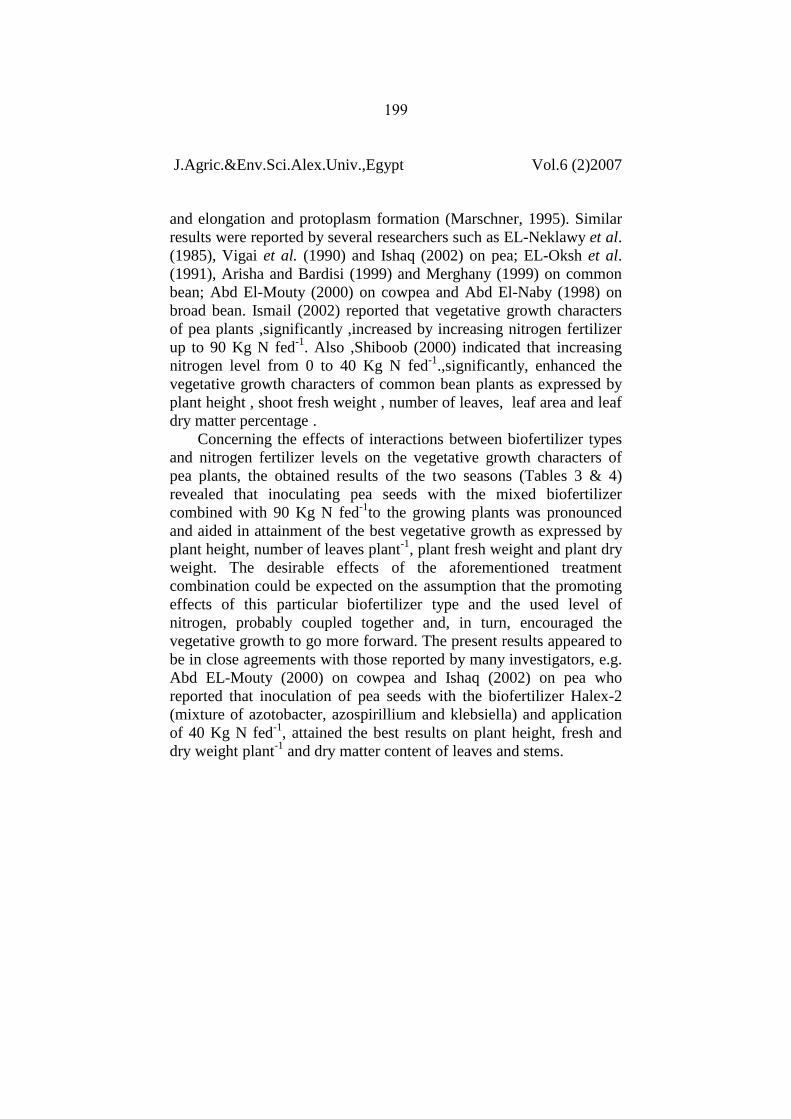
and elongation and protoplasm formation (Marschner, 1995). Similar
results were reported by several researchers such as EL-Neklawy et al.
(1985), Vigai et al. (1990) and Ishaq (2002) on pea; EL-Oksh et al.
(1991), Arisha and Bardisi (1999) and Merghany (1999) on common
bean; Abd El-Mouty (2000) on cowpea and Abd El-Naby (1998) on
broad bean. Ismail (2002) reported that vegetative growth characters
of pea plants ,significantly ,increased by increasing nitrogen fertilizer
up to 90 Kg N fed-1
. Also ,Shiboob (2000) indicated that increasing
nitrogen level from 0 to 40 Kg N fed-1
.,significantly, enhanced the
vegetative growth characters of common bean plants as expressed by
plant height , shoot fresh weight , number of leaves, leaf area and leaf
dry matter percentage .
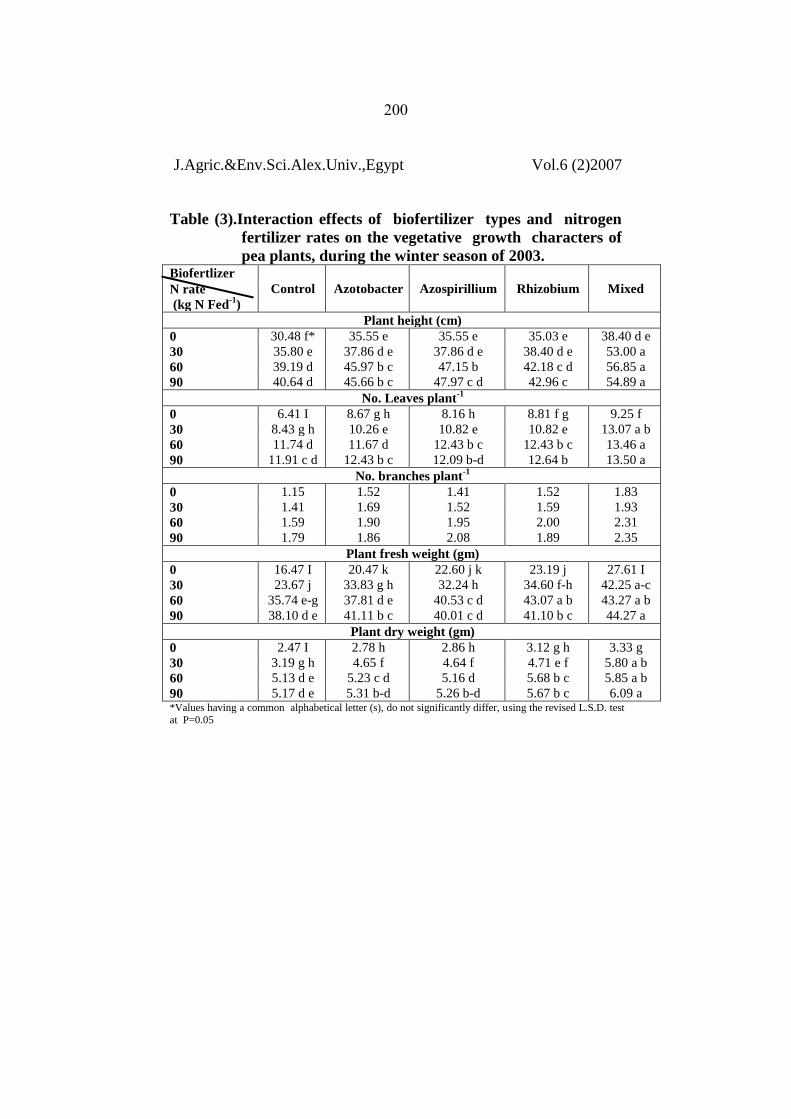
Concerning the effects of interactions between biofertilizer types
and nitrogen fertilizer levels on the vegetative growth characters of
pea plants, the obtained results of the two seasons (Tables 3 & 4)
revealed that inoculating pea seeds with the mixed biofertilizer
combined with 90 Kg N fed-1
to the growing plants was pronounced
and aided in attainment of the best vegetative growth as expressed by
plant height, number of leaves plant-1
, plant fresh weight and plant dry
weight. The desirable effects of the aforementioned treatment
combination could be expected on the assumption that the promoting
effects of this particular biofertilizer type and the used level of
nitrogen, probably coupled together and, in turn, encouraged the
vegetative growth to go more forward. The present results appeared to
be in close agreements with those reported by many investigators, e.g.
Abd EL-Mouty (2000) on cowpea and Ishaq (2002) on pea who
reported that inoculation of pea seeds with the biofertilizer Halex-2
(mixture of azotobacter, azospirillium and klebsiella) and application
of 40 Kg N fed-1
, attained the best results on plant height, fresh and
dry weight plant-1
and dry matter content of leaves and stems.
J.Agric.&Env.Sci.Alex.Univ.,Egypt Vol.6 (2)2007
122
Table (3).Interaction effects of biofertilizer types and nitrogen
fertilizer rates on the vegetative growth characters of
pea plants, during the winter season of 2003. Biofertlizer
Control Azotobacter Azospirillium Rhizobium Mixed N rate
(kg N Fed-1
)
Plant height (cm)
0 30.48 f* 35.55 e 35.55 e 35.03 e 38.40 d e
30 35.80 e 37.86 d e 37.86 d e 38.40 d e 53.00 a
60 39.19 d 45.97 b c 47.15 b 42.18 c d 56.85 a
90 40.64 d 45.66 b c 47.97 c d 42.96 c 54.89 a
No. Leaves plant-1
0 6.41 I 8.67 g h 8.16 h 8.81 f g 9.25 f
30 8.43 g h 10.26 e 10.82 e 10.82 e 13.07 a b
60 11.74 d 11.67 d 12.43 b c 12.43 b c 13.46 a
90 11.91 c d 12.43 b c 12.09 b-d 12.64 b 13.50 a
No. branches plant-1
0 1.15 1.52 1.41 1.52 1.83
30 1.41 1.69 1.52 1.59 1.93
60 1.59 1.90 1.95 2.00 2.31
90 1.79 1.86 2.08 1.89 2.35
Plant fresh weight (gm)
0 16.47 I 20.47 k 22.60 j k 23.19 j 27.61 I
30 23.67 j 33.83 g h 32.24 h 34.60 f-h 42.25 a-c
60 35.74 e-g 37.81 d e 40.53 c d 43.07 a b 43.27 a b
90 38.10 d e 41.11 b c 40.01 c d 41.10 b c 44.27 a
Plant dry weight (gm)
0 2.47 I 2.78 h 2.86 h 3.12 g h 3.33 g
30 3.19 g h 4.65 f 4.64 f 4.71 e f 5.80 a b
60 5.13 d e 5.23 c d 5.16 d 5.68 b c 5.85 a b
90 5.17 d e 5.31 b-d 5.26 b-d 5.67 b c 6.09 a *Values having a common alphabetical letter (s), do not significantly differ, using the revised L.S.D. test
at P=0.05
J.Agric.&Env.Sci.Alex.Univ.,Egypt Vol.6 (2)2007
122
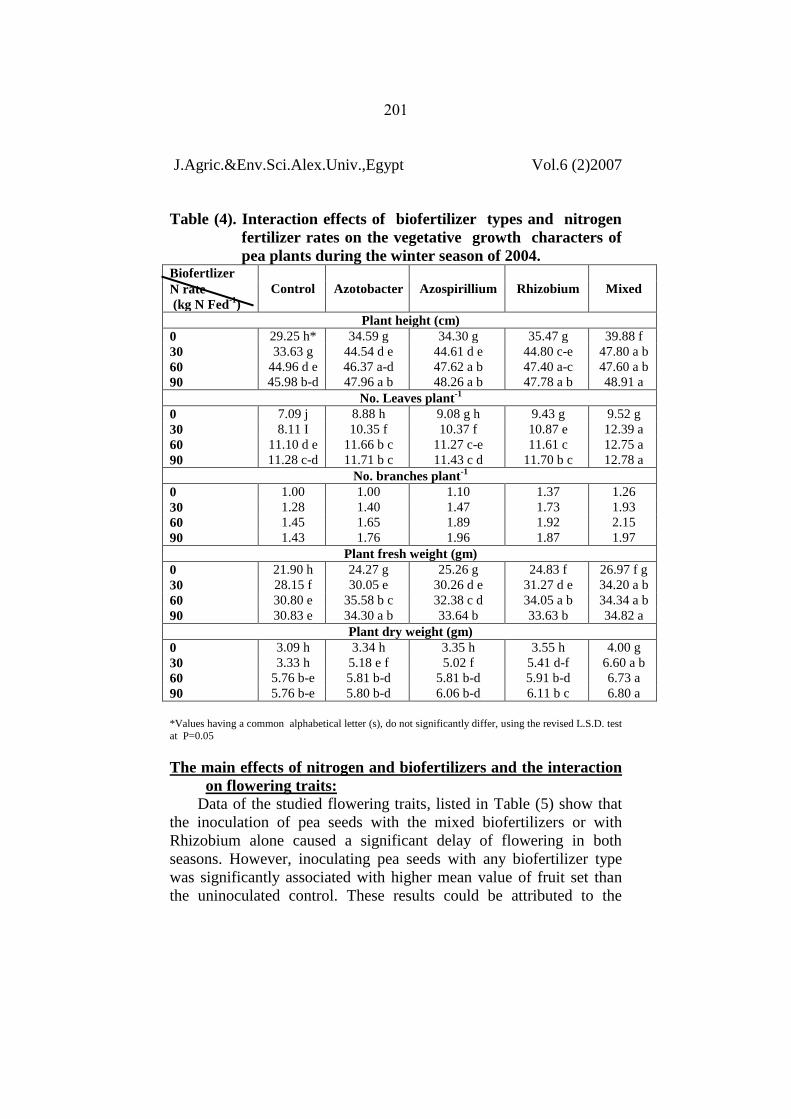
Table (4). Interaction effects of biofertilizer types and nitrogen
fertilizer rates on the vegetative growth characters of
pea plants during the winter season of 2004. Biofertlizer
Control Azotobacter Azospirillium Rhizobium Mixed N rate
(kg N Fed-1
)
Plant height (cm)
0 29.25 h* 34.59 g 34.30 g 35.47 g 39.88 f
30 33.63 g 44.54 d e 44.61 d e 44.80 c-e 47.80 a b
60 44.96 d e 46.37 a-d 47.62 a b 47.40 a-c 47.60 a b
90 45.98 b-d 47.96 a b 48.26 a b 47.78 a b 48.91 a
No. Leaves plant-1
0 7.09 j 8.88 h 9.08 g h 9.43 g 9.52 g
30 8.11 I 10.35 f 10.37 f 10.87 e 12.39 a
60 11.10 d e 11.66 b c 11.27 c-e 11.61 c 12.75 a
90 11.28 c-d 11.71 b c 11.43 c d 11.70 b c 12.78 a
No. branches plant-1
0 1.00 1.00 1.10 1.37 1.26
30 1.28 1.40 1.47 1.73 1.93
60 1.45 1.65 1.89 1.92 2.15
90 1.43 1.76 1.96 1.87 1.97
Plant fresh weight (gm)
0 21.90 h 24.27 g 25.26 g 24.83 f 26.97 f g
30 28.15 f 30.05 e 30.26 d e 31.27 d e 34.20 a b
60 30.80 e 35.58 b c 32.38 c d 34.05 a b 34.34 a b
90 30.83 e 34.30 a b 33.64 b 33.63 b 34.82 a
Plant dry weight (gm)
0 3.09 h 3.34 h 3.35 h 3.55 h 4.00 g
30 3.33 h 5.18 e f 5.02 f 5.41 d-f 6.60 a b
60 5.76 b-e 5.81 b-d 5.81 b-d 5.91 b-d 6.73 a
90 5.76 b-e 5.80 b-d 6.06 b-d 6.11 b c 6.80 a
*Values having a common alphabetical letter (s), do not significantly differ, using the revised L.S.D. test
at P=0.05
The main effects of nitrogen and biofertilizers and the interaction
on flowering traits:
Data of the studied flowering traits, listed in Table (5) show that
the inoculation of pea seeds with the mixed biofertilizers or with
Rhizobium alone caused a significant delay of flowering in both
seasons. However, inoculating pea seeds with any biofertilizer type
was significantly associated with higher mean value of fruit set than
the uninoculated control. These results could be attributed to the
J.Agric.&Env.Sci.Alex.Univ.,Egypt Vol.6 (2)2007
121
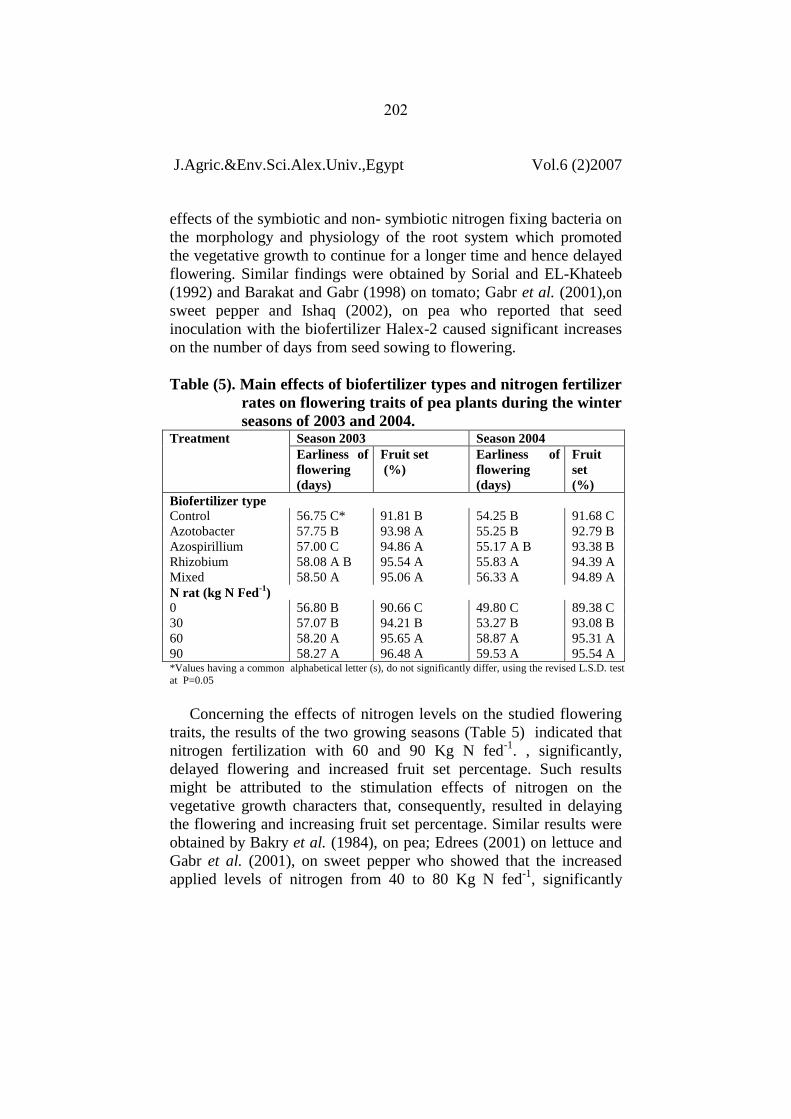
effects of the symbiotic and non- symbiotic nitrogen fixing bacteria on
the morphology and physiology of the root system which promoted
the vegetative growth to continue for a longer time and hence delayed
flowering. Similar findings were obtained by Sorial and EL-Khateeb
(1992) and Barakat and Gabr (1998) on tomato; Gabr et al. (2001),on
sweet pepper and Ishaq (2002), on pea who reported that seed
inoculation with the biofertilizer Halex-2 caused significant increases
on the number of days from seed sowing to flowering.
Table (5). Main effects of biofertilizer types and nitrogen fertilizer
rates on flowering traits of pea plants during the winter
seasons of 2003 and 2004. Treatment Season 2003 Season 2004
Earliness of
flowering
(days)
Fruit set
(%)
Earliness of
flowering
(days)
Fruit
set
(%)
Biofertilizer type
Control 56.75 C* 91.81 B 54.25 B 91.68 C
Azotobacter 57.75 B 93.98 A 55.25 B 92.79 B
Azospirillium 57.00 C 94.86 A 55.17 A B 93.38 B
Rhizobium 58.08 A B 95.54 A 55.83 A 94.39 A
Mixed 58.50 A 95.06 A 56.33 A 94.89 A
N rat (kg N Fed-1
)
0 56.80 B 90.66 C 49.80 C 89.38 C
30 57.07 B 94.21 B 53.27 B 93.08 B
60 58.20 A 95.65 A 58.87 A 95.31 A
90 58.27 A 96.48 A 59.53 A 95.54 A *Values having a common alphabetical letter (s), do not significantly differ, using the revised L.S.D. test
at P=0.05
Concerning the effects of nitrogen levels on the studied flowering
traits, the results of the two growing seasons (Table 5) indicated that
nitrogen fertilization with 60 and 90 Kg N fed-1
. , significantly,
delayed flowering and increased fruit set percentage. Such results
might be attributed to the stimulation effects of nitrogen on the
vegetative growth characters that, consequently, resulted in delaying
the flowering and increasing fruit set percentage. Similar results were
obtained by Bakry et al. (1984), on pea; Edrees (2001) on lettuce and
Gabr et al. (2001), on sweet pepper who showed that the increased
applied levels of nitrogen from 40 to 80 Kg N fed-1
, significantly
J.Agric.&Env.Sci.Alex.Univ.,Egypt Vol.6 (2)2007
121
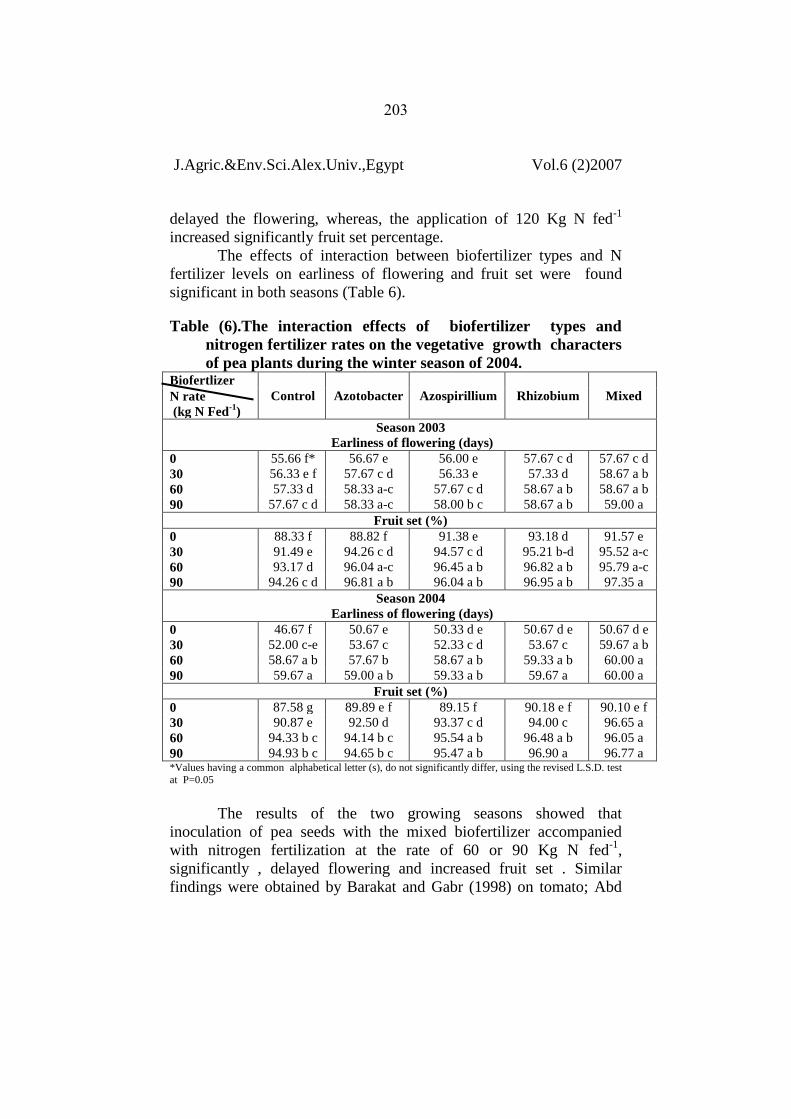
delayed the flowering, whereas, the application of 120 Kg N fed-1
increased significantly fruit set percentage.
The effects of interaction between biofertilizer types and N
fertilizer levels on earliness of flowering and fruit set were found
significant in both seasons (Table 6).
Table (6).The interaction effects of biofertilizer types and
nitrogen fertilizer rates on the vegetative growth characters
of pea plants during the winter season of 2004. Biofertlizer
Control Azotobacter Azospirillium Rhizobium Mixed N rate
(kg N Fed-1
)
Season 2003
Earliness of flowering (days)
0 55.66 f* 56.67 e 56.00 e 57.67 c d 57.67 c d
30 56.33 e f 57.67 c d 56.33 e 57.33 d 58.67 a b
60 57.33 d 58.33 a-c 57.67 c d 58.67 a b 58.67 a b
90 57.67 c d 58.33 a-c 58.00 b c 58.67 a b 59.00 a
Fruit set (%)
0 88.33 f 88.82 f 91.38 e 93.18 d 91.57 e
30 91.49 e 94.26 c d 94.57 c d 95.21 b-d 95.52 a-c
60 93.17 d 96.04 a-c 96.45 a b 96.82 a b 95.79 a-c
90 94.26 c d 96.81 a b 96.04 a b 96.95 a b 97.35 a
Season 2004
Earliness of flowering (days)
0 46.67 f 50.67 e 50.33 d e 50.67 d e 50.67 d e
30 52.00 c-e 53.67 c 52.33 c d 53.67 c 59.67 a b
60 58.67 a b 57.67 b 58.67 a b 59.33 a b 60.00 a
90 59.67 a 59.00 a b 59.33 a b 59.67 a 60.00 a
Fruit set (%)
0 87.58 g 89.89 e f 89.15 f 90.18 e f 90.10 e f
30 90.87 e 92.50 d 93.37 c d 94.00 c 96.65 a
60 94.33 b c 94.14 b c 95.54 a b 96.48 a b 96.05 a
90 94.93 b c 94.65 b c 95.47 a b 96.90 a 96.77 a *Values having a common alphabetical letter (s), do not significantly differ, using the revised L.S.D. test
at P=0.05
The results of the two growing seasons showed that
inoculation of pea seeds with the mixed biofertilizer accompanied
with nitrogen fertilization at the rate of 60 or 90 Kg N fed-1
,
significantly , delayed flowering and increased fruit set . Similar
findings were obtained by Barakat and Gabr (1998) on tomato; Abd
J.Agric.&Env.Sci.Alex.Univ.,Egypt Vol.6 (2)2007
121
EL-Fattah and Sorial (2000), on summer squash and Gabr et al.
(2001),on sweet pepper.
The main effects of nitrogen and biofertilizers and the interaction
on green pods yield and its components:
The recorded results of the two growing seasons( Table 7)
showed that the yield of green pods fed-1
, number of pods plant-1
,
number of seeds pod-1
, and shelling % of the inoculated plants with
any biofertilizer types were comparatively higher than those of the
uninoculated ones and the mixed biofertilizer treatment was the most
pronounced in this concern. These results might be expected on the
basis that the different studied bacterial inoculants, probably, favoured
one or more of the following beneficial influences; N2 fixation,
acquisition of P and various micro-nutrients due to production of
chelators and organic acids, producing adequate amounts of indole
acetic acid, cytokinins and abscisic acid which affect growth,
morphology and physiology of roots and secretion of fungistic
substances responsible for the inhibition of some pathogens like
Alternaria and Fusarium (Martin et al.,1989 and Jagnow et al.,1991).
The present results are in line with those of Dejensen et al.(2002) and
EL-Bassiony (2003) on beans; Gabr et al. (2001) on sweet pepper and
Ismail (2002), on pea. Shiboob (2000) indicated significant positive
effects on green pods yield and its components of bean due to the
inoculation of seeds with different biofertilizer types.
The effects of nitrogen levels on the studied green pods yield
and its components are illustrated in Table 7. The results of the two
growing seasons, clarified that increasing the application of nitrogen
from 30 to 90 Kg N fed-1
, caused significant increase in yield of green
pods fed-1
, number of green pods plant-1
, number of seeds pod-1
over
the control treatment. The higher two nitrogen doses (60 and 90 Kg N
fed-1
.) were remarkable in this concern, but the difference between
them did not appear to be significant. However, shelling % was not
significantly responded to nitrogen application. The obtained
increments of green pods yield fed-1
as a result of nitrogen application
might be directly attributed to the increased pods number plant-1
and
number of seeds pod-1
. The enhancing effects of nitrogen may be
related to the role of nitrogen in activating the vegetative growth
which was reflected as significant increases on the different studied

J.Agric.&Env.Sci.Alex.Univ.,Egypt Vol.6 (2)2007
121
J.Agric.&Env.Sci.Alex.Univ.,Egypt Vol.6 (2)2007
121
growth parameters (Tables 3 and 4). It is also possible that the
sufficient quantity and perhaps the efficient absorption of nitrogen
coupled together promoted the production of more photosynthates
required for pea seed production. The present results agreed to a great
extent with those reported by Arisha and Bardisi (1999), who reported
that the number and yield of green pods plant-1
as well as the total
yield fed-1
were significantly increased with increasing the applied
nitrogen up to 80 Kg N fed-1
. Ismail (2002) indicated that the addition
of 90 Kg N fed-1
., to the growing pea plants, was sufficient for the
plants to express their best performance on green pods yield and its
components.
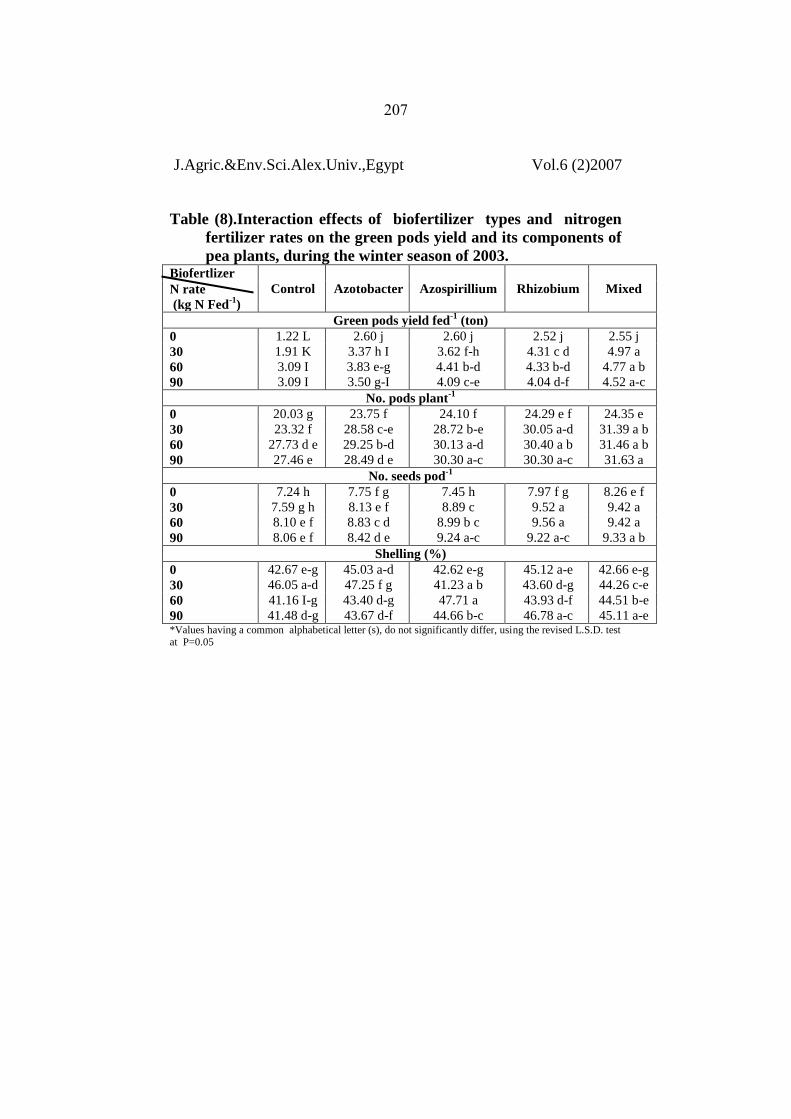
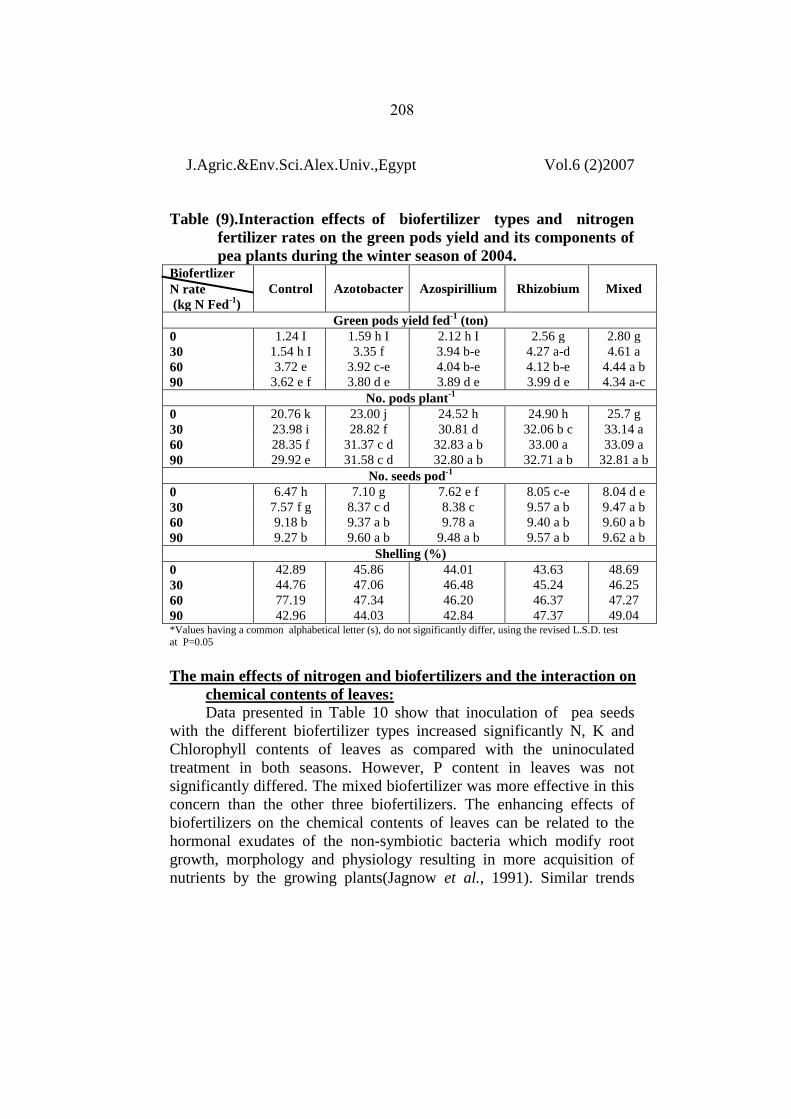
The interaction effects of biofertilizer types and N fertilizer
rates on green pods yield and its components, in the two seasons of
2003 and 2004 are presented in Tables (8 & 9). the results of the two
growing seasons indicated that green pods yield fed-1
, number of pods
plant-1
, number of seeds pod-1
were significantly increased through the
inoculation of seeds with different biofertilizers and different N levels,
relative to the control treatment. The combined treatment of mixed
biofertilizer and 30 or 60 Kg N fed-1
., gave the highest mean values of
green pods fed-1
in both seasons. These results might be explained on
the basis that the promoting effects of biofertilizer and nitrogen
together on growth of pea plants were reflected on the increased of
green pods yield and its components. Many investigators, working on
different vegetable crops, emphasized the beneficial effects of the
interaction between inoculation with biofertilizers and mineral
nitrogen application on yield and its components as El-Araby et al.
(2003) on peas; Abd EL-Mouty (2000) on cowpea; Shiboob (2000) on
common bean; Elkhatib et al.(2004) on onion.
J.Agric.&Env.Sci.Alex.Univ.,Egypt Vol.6 (2)2007
121
Table (8).Interaction effects of biofertilizer types and nitrogen
fertilizer rates on the green pods yield and its components of
pea plants, during the winter season of 2003. Biofertlizer
Control Azotobacter Azospirillium Rhizobium Mixed N rate
(kg N Fed-1
)
Green pods yield fed-1
(ton)
0 1.22 L 2.60 j 2.60 j 2.52 j 2.55 j
30 1.91 K 3.37 h I 3.62 f-h 4.31 c d 4.97 a
60 3.09 I 3.83 e-g 4.41 b-d 4.33 b-d 4.77 a b
90 3.09 I 3.50 g-I 4.09 c-e 4.04 d-f 4.52 a-c
No. pods plant-1
0 20.03 g 23.75 f 24.10 f 24.29 e f 24.35 e
30 23.32 f 28.58 c-e 28.72 b-e 30.05 a-d 31.39 a b
60 27.73 d e 29.25 b-d 30.13 a-d 30.40 a b 31.46 a b
90 27.46 e 28.49 d e 30.30 a-c 30.30 a-c 31.63 a
No. seeds pod-1
0 7.24 h 7.75 f g 7.45 h 7.97 f g 8.26 e f
30 7.59 g h 8.13 e f 8.89 c 9.52 a 9.42 a
60 8.10 e f 8.83 c d 8.99 b c 9.56 a 9.42 a
90 8.06 e f 8.42 d e 9.24 a-c 9.22 a-c 9.33 a b
Shelling (%)
0 42.67 e-g 45.03 a-d 42.62 e-g 45.12 a-e 42.66 e-g
30 46.05 a-d 47.25 f g 41.23 a b 43.60 d-g 44.26 c-e
60 41.16 I-g 43.40 d-g 47.71 a 43.93 d-f 44.51 b-e
90 41.48 d-g 43.67 d-f 44.66 b-c 46.78 a-c 45.11 a-e *Values having a common alphabetical letter (s), do not significantly differ, using the revised L.S.D. test at P=0.05
J.Agric.&Env.Sci.Alex.Univ.,Egypt Vol.6 (2)2007
121
Table (9).Interaction effects of biofertilizer types and nitrogen
fertilizer rates on the green pods yield and its components of
pea plants during the winter season of 2004. Biofertlizer
Control Azotobacter Azospirillium Rhizobium Mixed N rate
(kg N Fed-1
)
Green pods yield fed-1
(ton)
0 1.24 I 1.59 h I 2.12 h I 2.56 g 2.80 g
30 1.54 h I 3.35 f 3.94 b-e 4.27 a-d 4.61 a
60 3.72 e 3.92 c-e 4.04 b-e 4.12 b-e 4.44 a b
90 3.62 e f 3.80 d e 3.89 d e 3.99 d e 4.34 a-c
No. pods plant-1
0 20.76 k 23.00 j 24.52 h 24.90 h 25.7 g
30 23.98 i 28.82 f 30.81 d 32.06 b c 33.14 a
60 28.35 f 31.37 c d 32.83 a b 33.00 a 33.09 a
90 29.92 e 31.58 c d 32.80 a b 32.71 a b 32.81 a b
No. seeds pod-1
0 6.47 h 7.10 g 7.62 e f 8.05 c-e 8.04 d e
30 7.57 f g 8.37 c d 8.38 c 9.57 a b 9.47 a b
60 9.18 b 9.37 a b 9.78 a 9.40 a b 9.60 a b
90 9.27 b 9.60 a b 9.48 a b 9.57 a b 9.62 a b
Shelling (%)
0 42.89 45.86 44.01 43.63 48.69
30 44.76 47.06 46.48 45.24 46.25
60 77.19 47.34 46.20 46.37 47.27
90 42.96 44.03 42.84 47.37 49.04 *Values having a common alphabetical letter (s), do not significantly differ, using the revised L.S.D. test at P=0.05
The main effects of nitrogen and biofertilizers and the interaction on
chemical contents of leaves:
Data presented in Table 10 show that inoculation of pea seeds
with the different biofertilizer types increased significantly N, K and
Chlorophyll contents of leaves as compared with the uninoculated
treatment in both seasons. However, P content in leaves was not
significantly differed. The mixed biofertilizer was more effective in this
concern than the other three biofertilizers. The enhancing effects of
biofertilizers on the chemical contents of leaves can be related to the
hormonal exudates of the non-symbiotic bacteria which modify root
growth, morphology and physiology resulting in more acquisition of
nutrients by the growing plants(Jagnow et al., 1991). Similar trends
J.Agric.&Env.Sci.Alex.Univ.,Egypt Vol.6 (2)2007
129
were reported by Choudhary et al. (1984) and Solieman et al.(2003)on
pea; and Gabr et al. (2001), on sweet pepper.
Regarding the effects of nitrogen levels on the various studied
chemical contents of leaves of pea plants (Table10) the recorded results
clarified some significant increments on leaves N, K and chlorophyll
contents due to increasing N fertilizer from 30 to 90 Kg N fed-1
.,
compared with the control treatment. However, P content was not
significantly affected. The application of 60 Kg N fed-1
seemed to be
sufficient and pronounced in this concern. The improving effects of
nitrogen fertilizer on leaves and seeds chemical contents might be
related to the vital role of nitrogen, for the formation of chlorophyll
pigments and stimulation of photosynthesis process (Marschner,1995).
Similar trends were reported by several researchers such as Merghany
(1999), Shiboob (2000) and Nassar et al. (2001) on common bean; Abd
EL-Mouty (2000), on cowpea; Solieman et al. (2003) and Ishaq (2002),
on pea.
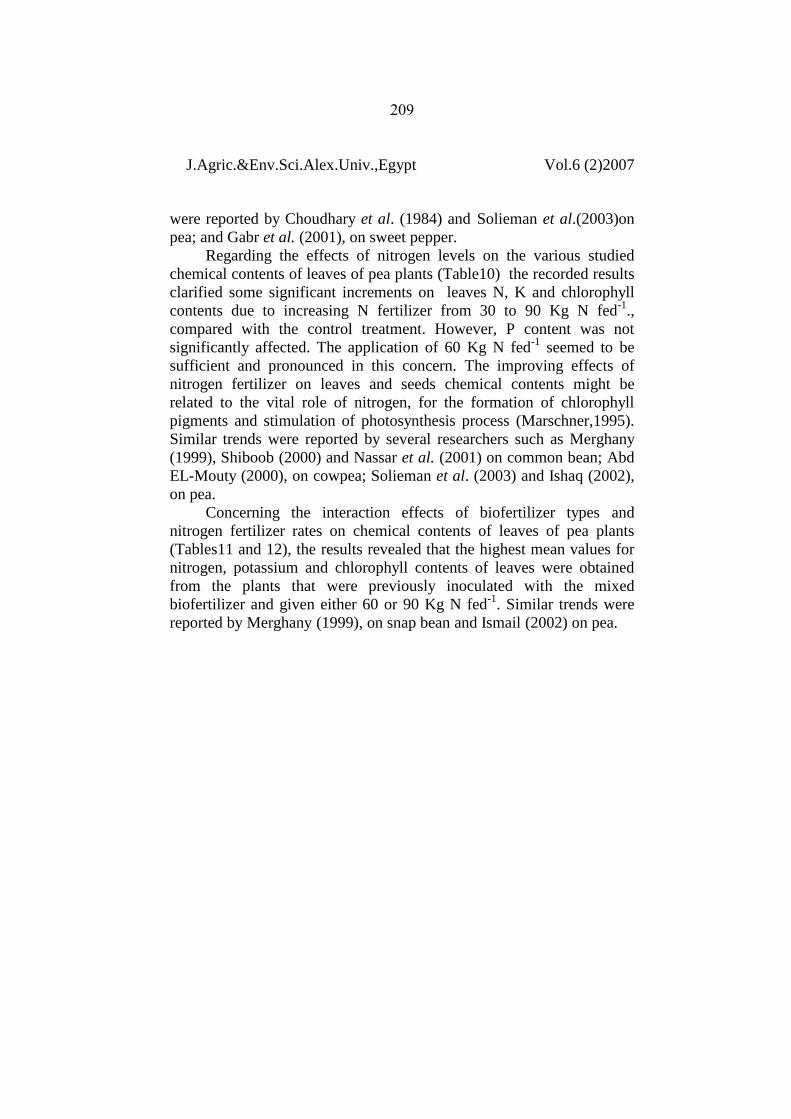
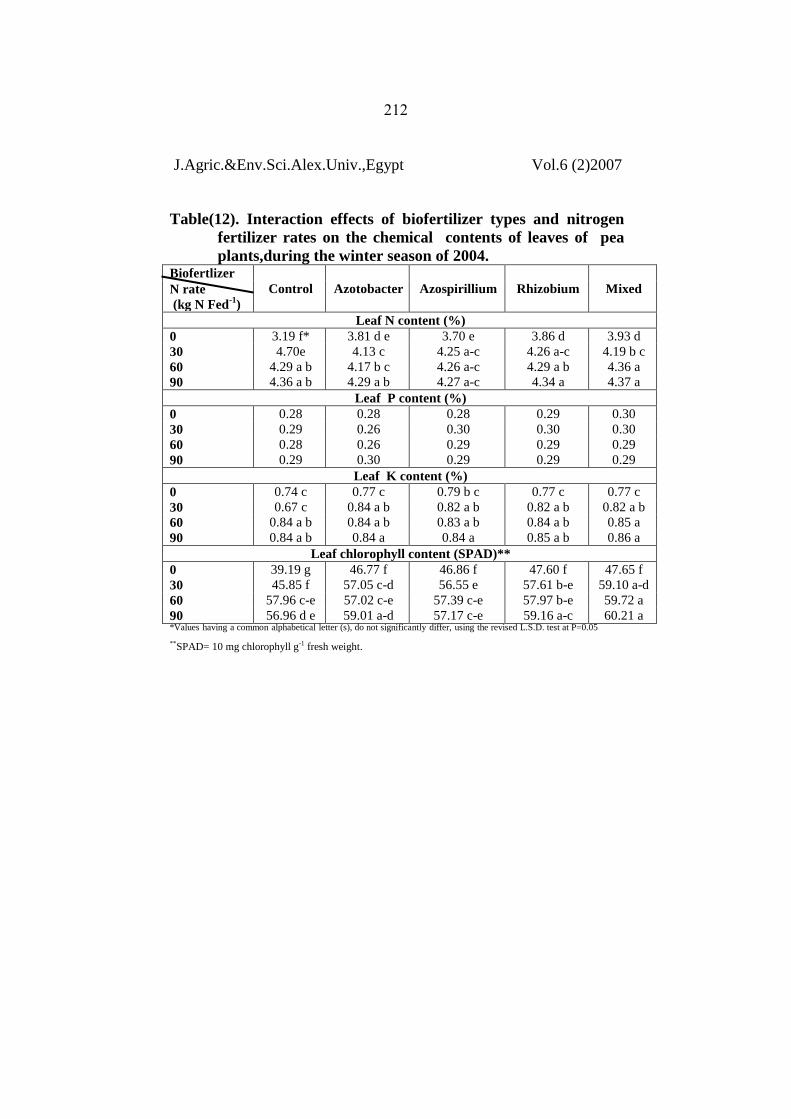
Concerning the interaction effects of biofertilizer types and
nitrogen fertilizer rates on chemical contents of leaves of pea plants
(Tables11 and 12), the results revealed that the highest mean values for
nitrogen, potassium and chlorophyll contents of leaves were obtained
from the plants that were previously inoculated with the mixed
biofertilizer and given either 60 or 90 Kg N fed-1
. Similar trends were
reported by Merghany (1999), on snap bean and Ismail (2002) on pea.

J.Agric.&Env.Sci.Alex.Univ.,Egypt Vol.6 (2)2007
122
J.Agric.&Env.Sci.Alex.Univ.,Egypt Vol.6 (2)2007
122
Table(11). Interaction effects of biofertilizer types and nitrogen
fertilizer rates on the chemical contents of leaves of pea
plants, during the winter season of 2003. Biofertlizer
Control Azotobacter Azospirillium Rhizobium Mixed N rate
(kg N Fed-1
)
Leaf N content (%)
0 3.11 g* 3.44 f 3.60 f 3.90 e 3.85 e
30 3.50 f 4.17 d 4.21 c d 4.31 a-d 4.28 b-d
60 4.29 b-d 4.34 a-d 4.36 a-c 4.49 a b 4.45 a b
90 4.28 b-d 4.37 a-c 4.38 a-c 4.43 a b 4.48 a
Leaf P content (%)
0 0.23 0.25 0.24 0.26 0.26
30 0.27 0.24 0.28 0.27 0.29
60 0.27 0.23 0.27 0.27 0.29
90 0.28 0.30 0.27 0.27 0.27
Leaf K content (%)
0 0.72 f 0.77 e f 0.77 e f 0.77 d-f 0.78 c d
30 0.75 f 0.84 a-d 0.82 b-e 0.83 b-e 0.85 a b
60 0.85 a b 0.85 a b 0.84 a-b 0.87 a b 0.91 a
90 0.85 a b 0.85 a b 0.85 a b 0.87 a b 0.89 a
Leaf chlorophyll content (SPAD)**
0 39.02 g 46.36 f 45.87 f 48.07 e f 48.90 e
30 47.63 e f 56.33 c d 57.21 c d 58.10 a-c 57.71 a-d
60 57.61 b-d 59.06 a b 57.58 b-d 59.49 a b 57.98 a-c
90 55.57 d 59.27 a b 59.06 a b 59.21 a b 59.99 a *Values having a common alphabetical letter (s), do not significantly differ, using the revised L.S.D. test at P=0.05
**SPAD= 10 mg chlorophyll g-1 fresh weight.
J.Agric.&Env.Sci.Alex.Univ.,Egypt Vol.6 (2)2007
121
Table(12). Interaction effects of biofertilizer types and nitrogen
fertilizer rates on the chemical contents of leaves of pea
plants,during the winter season of 2004. Biofertlizer
Control Azotobacter Azospirillium Rhizobium Mixed N rate
(kg N Fed-1
)
Leaf N content (%)
0 3.19 f* 3.81 d e 3.70 e 3.86 d 3.93 d
30 4.70e 4.13 c 4.25 a-c 4.26 a-c 4.19 b c
60 4.29 a b 4.17 b c 4.26 a-c 4.29 a b 4.36 a
90 4.36 a b 4.29 a b 4.27 a-c 4.34 a 4.37 a
Leaf P content (%)
0 0.28 0.28 0.28 0.29 0.30
30 0.29 0.26 0.30 0.30 0.30
60 0.28 0.26 0.29 0.29 0.29
90 0.29 0.30 0.29 0.29 0.29
Leaf K content (%)
0 0.74 c 0.77 c 0.79 b c 0.77 c 0.77 c
30 0.67 c 0.84 a b 0.82 a b 0.82 a b 0.82 a b
60 0.84 a b 0.84 a b 0.83 a b 0.84 a b 0.85 a
90 0.84 a b 0.84 a 0.84 a 0.85 a b 0.86 a
Leaf chlorophyll content (SPAD)**
0 39.19 g 46.77 f 46.86 f 47.60 f 47.65 f
30 45.85 f 57.05 c-d 56.55 e 57.61 b-e 59.10 a-d
60 57.96 c-e 57.02 c-e 57.39 c-e 57.97 b-e 59.72 a
90 56.96 d e 59.01 a-d 57.17 c-e 59.16 a-c 60.21 a *Values having a common alphabetical letter (s), do not significantly differ, using the revised L.S.D. test at P=0.05
**SPAD= 10 mg chlorophyll g-1 fresh weight.
J.Agric.&Env.Sci.Alex.Univ.,Egypt Vol.6 (2)2007
121
REFERENCES
Abd EL-Fattah, H.I. and H.M. Arisha. (2000). Effect of
Rhizobium inoculation and vitamin B12 on growth, yield and
quality of common bean under sandy soil conditions. Zagazig J.
Agric. Res. 27 (1): 59 - 76.
Abd EL-Fattah, M.A. and M.E .Sorial. (2000). Sex expression and
productivity responses of summer squash to biofertilizer
application under different nitrogen levels. Zagazig J. Agric. 27
(2): 255 - 281.
Abd El-Mouty, M.M. (2000). Effect of chemical and bio- nitrogen
fertilizer on the growth and yield of cowpea plant (Vigna
sinensis savi.). J. Agric. Sci. Mansoura Univ. 25 (7): 4437-
4450.
Abd EL-Naby, H.M. (1998). Response of broad bean plants to
bacterial inoculation and different nitrogen and phosphorus
fertilizer levels. J. Agric. Sci. Mansoura Univ. 23 (4): 1699 -
1707.
Adam, S.M. (2002).Growth and productivity of Vicia faba plants as
influenced by some different bio and chemical nitrogen
fertilizers. Egypt J. Hort. 29 (1): 83 - 98.
Al-Rawy, K.M. and A.M. Khalf-Allah. (1980). Design and
Analysis of Agricultural Experiments. Text book. El-Mousil
Univ. press Ninawa, Iraq.pp. 487.
Arisha, H.M. and A. Bardisi.(1999).Effect of nitrogen fertilization
and plant spacing on growth, yield and pod quality of common
bean under sandy soil conditions. Zagazig J. Agric. Res. 26 (2):
407 - 419.
Bakry, M.O., M.M. Abou EL-Magd and A.M. Shaheen. (1984).
Response of Growth and yield of pea (Pisum Sativum L.) to
plant population and NPK fertilization. Egypt J. Hort.11 (2):
151 - 161.
Barakat, M.A.S and S.M. Gabr. (1998). Effect of different
biofertilizer types and nitrogen fertilizer levels on tomato
plants. Alex. J. Agric. Res. 43(1): 149 -160
Chapman, H.D. and P.P. Pratt. (1961). Methods of analysis for
soil, plants and water. Univ. Calif. Div. Agric. Sci., USA. Pp
60-61, 159-179.
J.Agric.&Env.Sci.Alex.Univ.,Egypt Vol.6 (2)2007
121
Choudhary, M.L., C.B. Rajput and H. Ram. (1984). Effect of
Azotobacter and Rhizobium treatment on growth, yield and
quality of garden pea (Pisum sativum L.). Haryana. J. Hort.
Sci.11 (3/4): 231 - 234 (c.a. Hort. Abst. 55(3): 1917, 1985).
Dejensen, C.E., J.A. Percich and P.H. Graham. (2002). Integrated
management strategies of bean root rot with Bacillus subtilis
and Rhizobium in Minnesota. Field Crop Research 47: 107 -
1 1 5 .
Edrees, A.A. (2001). Studies on the effects of planting dates,
population density and nitrogen fertilization on the
improvement of growing and seed production of lettuce
(Lactuca sativa L.). M.Sc.Thesis. Fac. Agric., Alex. Univ.
Egypt.
El-Araby, S. M., H. A. ElKhatib and T. H. Solieman. (2003).
Effects of organic manure, mineral nitrogen and bio-fertilizer
application on yield, quality and chemical composition of pea
(Pisum sativum, L.). Zagazig J. Agric. Res. 30 (3): 769 -782.
El-Bassiony, A.E. (2003). Response of some bean (Phaseolus
vulgaris L.) cultivars to organic and biofertilizer. Ph. D. Thesis,
Fac. Agric. Alex. Univ. Egypt.
Elkhatib, H. A., S. M. Gabr, M. A. Barakat and E. A. Bedawy
(2004). Statistical models for predicting Yield response of
onion (Allium cepa L) to Applied Nitrogen and Bio-fertilizers.
J. Agric. Sci. Mansoura Univ. 29 (1): 263-275..
El-Mansi, A.A., A. Bardisi and S.A. El-Atabany. (2000).Effect of
Rhizobium inoculum and soil plastic mulch on nodulation,
plant growth and yield of pea under sandy soil conditions.
Zagazig J. Agric. Res. 27 (4): 899 - 912.
El-Neklawy, A. S., H. K. Abd-Elmaksoud and A. M. Selim.
(1985). Yield response of pea (Pisum sativum L.) to N P K
fertilization and to inoculation with rhizobia in a sandy soil.
Ann. Agric. Sci., Moshtohor 23 (2): 1365 -1373.
El-Oksh, I.I., M.M. Soliman, M.H. El-Demerdash and S.M. El-
Gizy.(1991).Effect of rhizobial inoculation and nitrogen
supplementation on growth and yield of common bean
(Phaseolus vulgaris L.). Ann. Agric. Sci., Ain Shams Univ. 36
(2): 599 - 607.
J.Agric.&Env.Sci.Alex.Univ.,Egypt Vol.6 (2)2007
121
Fernandez, G.J and J.C. Miller. (1986). Interaction between
Rhizobial inoculation and fertilizer nitrogen in five cowpea
cultivars. Hort Science. 21(6): 1345 - 1348.
Gabr, S.M., I.M. Ghoneim and H.M. Hassan. (2001). Effect of
bio-and nitrogen-fertilization on growth, flowering, chemical
contents, yield and quality of sweet pepper. J. Adv. Agric. Res.
6 (4):939-955.
Ishaq, M. S. (2002).Comparisons among the effect of bio-fertilizer,
nitrogen and boron on growth, seed production and seed quality
of peas (Pisum sativum L.).Ph.D.Thesis, Fac. Agric., Alex.
Univ. Egypt.
Ismail, R .H. (2002).Physiological studies on biofertilization in pea
plants (Pisum sativum L.) under calcareous soil conditions .Ph.
D. Thesis, Fac. Agric., Ain Shams. Univ., Egypt.
Jackson, M.L. (1973). Soil Chemical Analysis. Prentice-Hall of
India, Private New Delhi. Pp 9-82.
Jagnow, G.; G. Hoflich and K.H. Haffmann. (1991). Inoculation
of non-symbiotic rhizosphere bacteria: Possibilities of
increasing and stabilizing yields. Angew. Botanik. 65:97-126
(C.A. Hort. Abst. 44 (2): 433, 1993).
John, M.K. (1970). Colorimetric determination of phosphorus in soil
and materials with ascorbic acid. Soil Sci. 109: 214-220.
Marschner, H. (1995). Mineral nutrition of higher plants (2nd ed).
Academic Press, London.
Martin, P., A. Glatzle, W. Klob, H. Omay and W. Schmidt.
(1989). N2-fixing bacteria in rhizosphere: Quantification and
hormonal effects on root development. Z. Pflanzenernuhr
Bodenk .152: 237 - 245.
Merghany, M.M. (1999).Response of snap bean to different
Rhizobium inoculation methods and nitrogen levels under two
drip irrigation regimes in new reclaimed sandy soil. Zagazig J.
Agric. Res. 26(4): 1091 - 1123.
Nassar, H.H., M.A. Badawy., T.A. El-Masry and N.A. El-Sawah.
(2001). Quantitative and qualitative response of dry bean to
nitrogen nutrition under field conditions. Egypt J. Hort. 28 (1):
131 -147
Noel, T. C., C. Sheng, C.K. Yost, R.P. Pharis and M.E. Hynes.
(1996). Rhizobium Leguminosarum as a plant growth –
J.Agric.&Env.Sci.Alex.Univ.,Egypt Vol.6 (2)2007
121
promoting rhizobacterium: direct growth promotion of canola
and lettuce. Can. J. Microbial 42 (3): 270 – 283.
Page, A. L., R. H. Miller and D. R. Keeny. (ed.) (1982). Methods
of soil analysis, part2. Chemical and Microbiological
properties. Amer. Soc. of Agronomy. Madison, Wisconsin,
USA.
SAS. (1996). Software program. Cary, North Carolina State. Univ.,
Karl M Glsener. USA.
Shiboob, R.M. (2000).Effects of nitrogen fertilizer levels and
biofertilizer types on growth, yield and quality of common bean
(Phaseolus vulgaris L.).M. Sci. Thesis, Fac. Agric., Alex.
Univ., Egypt.
Smart, J. (1990). Grain legumes. Evolution and genetic resources.
Cambridge University press, Cambridge, U. K.pp. 200.
Solieman, T. H., H. A. ElKhatib and S. M. El-Araby. (2003).
Effects of organic manure, mineral nitrogen and bio-fertilizer
application on vegetative growth and chemical composition of
pea (Pisum sativum, L.). Zagazig J. Agric. Res. 30 (3): 751-767
Sorial, M.E and S.R. EL-Khateeb. (1992). Synergistic effect of
Azotobacter on the growth, N, P and K contents of tomato and
activity of some pathogenic fungi. Menofiya J. Agric. Res.
17(4): 1999 - 2014.
Vigai, B., T. Singh and V. Bahadur. (1990).Yield and growth
response of garden pea (Pisum sativum L.) to nitrogen and
phosphorus application. Veg. Sci. 17(2): 205-209.
J.Agric.&Env.Sci.Alex.Univ.,Egypt Vol.6 (2)2007
121
الملخص العربى
تأثير أنواع مختلفة من األسمدة الحيوية و معدالت التسميد النتروجينى على النمو والمحصول والمحتوى الكيماوى للبسلة
@أمال ممدوح القرياوى– حسن احمد الخطيب* -سعيد محمد جبر*
جامعة اإلسكندرية–*كلية الزراعة بدمنهور مصر -مركز البحوث الزراعية @
بلربع ة أن وات مأثلن ة م البس لة ت ه ا الدراس ة به دا اأثبارث لقيرات ثل ي ب ورأجري
Azotobacter ،Azospirillum،Rhizobiumاألسمدة الحيوية، قالقة منهم منن ردة م أجن ا
المل وأربع ة الغي رل ، سماد حي و مأ ثلم م األجن ا القالق ة الس اب ة باإلل ااة نل و الكنث روكج م للن دا ل والث داأالت ٠٣، ٠٣، ٠٣لثس ميد النيثروجين و المع دنو ص نر،مس ثويات م ا
علو صنات النمو الألر ، اإلزهار، و المحصول الكلو لل رو الأل را و مكوناث و لك بينهم و ك لك بعض المكونات الكيماوية ألوراق البسلة صنا اكثورى اريزر
م ا ش منم ة المحمودي ة ٣٣٣٢و ٣٣٣٠ أجريت ثجربث ا ح ليث ا أ الل موس مش ال ثا الع وايية ماع اتال مصر نن ت الثجارب باسثأدام ثجربة عاملي ا ش ثص ميم –بمحااظة البحيرة
قالث مكرارات ب كاملةال يمكن تلخيص النتائج المتحصل عليها على النحو التالى :
ثن ات النب ات، ع دد أدى ثل ي ب ور البس لة ب ل س ماد حي و نل و زي ادة معنوي ة ا و ار -2األوراق، ع دد الن روت، ال وز الم ازذ و الج اا وك لك أعم و زي ادة معنوي ة ا و
المحصول الكلو م ال رو الألرا و ع دد ال رو ن نب ات و ع دد الب ور ا و ال ر و زي ادة معنوي ة ا و محث وى األوراق م نل و أدى أيل ا ت و ل كللنب ا الثص ااشنس بة
و موسميال ل م وم والكلوروايل م ارنة بالب ور الغير مل حة او كالنيثروجي و البوثاسي ثنوق السماد الحيوى الأليم او كل الصنات الساب ة قد
كج م للن دا ، لنباث ات ٠٣و ٠٣، ٠٣أدت نلااة السماد النيث روجي المع دنو بمع دل -1وت ، ال وز الم ازذ البسلة ، نلو زيادة معنوية او ارثنات النبات،عدد األوراق ،عدد الن ر
زيادة معنوية او المحصول الكلو م ال رو الأل را أيلا لالوراق وأعموو الجاا نل و أدىوك لك الثص ااشو عدد ال رو ن نب ات و ع دد الب ور ا و ال ر و نس بة للندا
زي ادة معنوي ة ا و محث وى األوراق م النيث روجي و النوس نور و الكلورواي ل م ارن ة قد ارثبمت أعلو ال يم المسجلة له ا الصنات بإلااة السماد ه ا واو الموسمي بالكنثرول
˝معنويا ماأ النرق بينه ولم يك كجم للندا ٠٣، ٠٣بمعدالت المعدنشالنيثروجينو
ث لقيرات معنوي ة للث داأل ب ي الثس ميد الحي وى و وج ود أظهرت نث اي موس مش الدراس ة -1و الث و ث م دراس ثهام ص نات النم و الأل رى والمحص ول النيثروجينو المعدنو ا و معظ
ثس ميد النباث ات م كانت أالل النثاي عن د ثل ي ب ور البس لة بالس ماد الحي وى المأ ثلم كجم للندا 92أو 12بالنثروجي المعدنو بمعدل

J.Agric.&Env.Sci.Alex.Univ.,Egypt Vol.6 (2)2007
121