Embed Size (px)
Citation preview

EFFECT OF DIETARY ALUMINUM ON IRON ANDFERRITIN METABOLISM
A THESIS SUBMITTED TO THE GRADUATE DIVISION OF THEUNIVERSITY OF HAWAI'I IN PARTIAL FULFILLMENT OF THE
REQUIREMENTS FOR THE DEGREE OF
MASTER OF SCIENCE
IN
NUTRITIONAL SCIENCES
DECEMBER 2004
ByJoyceKR Wu
Thesis Committee:
Michael A. Dunn, ChairpersonYong Soo Kim
C Alan Titchenal
3CJ47

ACKNOWLEDGEMENTS
My thesis and master studies could not be completed without the help and time of several
special people. I am sincerely grateful for their support and encouragement.
My heart-felt thanks goes to my advisor Dr. Michael Dunn for his guidance and for
giving me the opportunity to work in his laboratory. Also I want to thank him for being
so patient with me through my thesis project and master studies.
Also my sincere gratitude goes to Dr. Titchenal for his encouragement; Dr. Yong Soo
Kim for allowing me to use his equipment; Mr. Steve Speilman for his support and
encouragement; Mr. Wayne Toma and Mr. Min Lim for their generous help in
computers; and to Soccoro Tauyan for her help in animal care, as well as her generosity
and kindness.
Lastly, I'm grateful for the unconditional love and support from my family. I am blessed
to have such a wonderful family.
111

ABSTRACT
Aluminum (AI) toxicity is known to cause microcytic anemia, osteomalacia, and
encephalopathy, but the mechanisms are poorly understood. Although Al is a
neurotoxicant, its role in Alzheimer's disease remains controversial. One hypothesis for
the toxicity of Al is that it disrupts cellular iron (Fe) homeostasis, causing iron to become
cytotoxic. Cell culture studies have shown that Al suppresses the synthesis of ferritin,
inhibits iron uptake into this important Fe sequestering protein, and increases oxidative
damage. No studies have been done to investigate if these results occur in vivo. The
objectives of this study were to determine if dietary Al alters the regulation of tissue iron
and ferritin levels and inhibits iron sequestration by ferritin in an animal model. Because
the kidney accumulates Al faster than the brain, kidneys were studied as a model tissue.
Groups of day-old chicks were fed diets containing one of three levels of Fe (control,
intermediate, or high Fe) with and without added AI. After 4-weeks, the blood, liver and
kidneys were removed. Kidneys were fractioned into debris pellet, mitochondrial pellet,
and supernatant (cytosol) by differential centrifugation. The Fe concentrations in tissues
and in each subcellular fraction were measured by ICP emission spectroscopy. Ferritin
protein and ferritin-bound iron in kidney cytosol were measured by native-PAGE. All
data were analyzed by ANOVA and subsequently, analysis of covariance was used to
examine the effect of Al on ferritin protein, ferritin bound iron and iron in subcellular
fractions independent of effects due to changes in kidney Fe concentration. Results from
ANOVA showed that kidney, liver, and serum Fe concentrations were lower in the Al
treated group; this indicated that Al inhibited Fe absorption. Analysis of covariance
indicated that Al increased the Fe concentration in the debris pellet, but had no effect on
IV
mitochondrial and supernatant iron. Regression ofkidney Fe concentration versus kidney
ferritin protein levels showed that Al did not inhibit the upregulation of ferritin by Fe.
However, high dietary Al strongly inhibited iron uptake by kidney ferritin. These results
confirm that Al disrupts iron homeostasis and suggests that AI-loaded animals have
higher concentrations of reactive free iron in tissues. Potentially, this may increase the
risk ofFe-induced oxidative stress.
v
TABLE OF CONTENTS
ACKNOWLEDGEMENTS.................................................................. 111
ABSTRACT..................................................................................... IV
LIST OF TABLES , VI11
LIST OF FIGURES ,. .. . .. . .. . .. . .. . . .. . .. . IX
LIST OF ABBREVIATIONS................................................................ X
CHAPTER 1 LITERATURE REVIEWINTRODUCTION......................................................................... 1PART 1 IRON METABOLISM
SOURCES OF IRON.... .. . .. . . . .. . .. . .. .. . .. .. 3BIOAVAILABILITY.... . .. . . .. . .. . .. . . .. . . 3IRON ABSORPTION MECHANISM
Heme Absorption....... . .. .. . .. . 4Nonheme Iron Absorption........ 4Heme and Nonheme Iron Metabolism in the Enterocytes................. 5Regulation of Intestinal Iron Absorption. .. . . .. . .. . .. . .. . .. . . . . .. . .. . .. . ... .. . .. 6
DISTRIBUTION OF IRON IN THE BODy.................................. ..... 7INTRACELLULAR IRON METABOLISM....................................... 7FERRITIN
Structure '" .. . . .. . .. . .. . .. . .. . 8Ferritin Subunits..................................................................... 8Ferritin Synthesis................................................................... 9
CELLULAR IRON HOMEOSTASIS............................................... 10IRON TOXICITy...................................................................... 12CONCLUSIONS. . .. . . .. . . . .. . . .. . .. . . .. . .. . .. .. 15
PART II ALUMINUM TOXICITY AND ITS EFFECT ON IRONMETABOLISM
SOURCES OF ALUMINUM......................................................... 16Dietary Exposure................................................................. 16Medication/Pharmaceutical Exposure.......... . . .. . .. . 17Drinking Water Exposure......................................................... 17Environmental Exposure. . .. . .. . .. ... . .. . .. ... . . . . .. . .. . .. . .. . .. . .. . .. . .. . .. . .. . 18Occupational Exposure....... . .. . .. . . .. 18
GROUPS AT RISK FOR ALMINUM TOXICITy............. . .. . .. . .. . 19ABSORPTION AND TRANSPORT OF ALUMINUM.......................... 19ALUMINUM METABOLISM....................................................... 20ALUMINUM DISTRIBUTION.................................................. 21ALUMINUM TOXICITy , ,. . . 21EFFECTS OF ALUMINUM ON ERYTHROPOESIS.... 23EFFECTS OF ALUMINUM ON IRON METABOLISM.................... 24CONCLUSIONS ,. .. . .. . .. . .. . .. . .. . .. . .. . .. . .. . .. 25
CHAPTER 2 DIETARY ALUMINUM ALTERS IRON HOMEOSTASIS ANDFERRITIN FUNCTION IN THE CHICK
INTRODUCTION.............................................................................. 27
VI
MATERIALS AND METHODSANIMALS, DIETS, AND EXPERIMENTAL DESIGN .
Experiment 1 .Experiment 2 .
SAMPLING AND PROCESSING OF TISSUES .IRON AND PROTEIN ASSAyS .FERRITIN PROTEIN AND IRON CONTENT BY NATIVE-PAGE ..STATISTICAL ANALySIS ..
RESULTSFOOD INTAKE AND BODY WEIGHT GAIN .WEIGHT OF LIVER, KIDNEYS, AND KIDNEY SUBCELLULARFRACTIONS
Kidney and Liver. ..Subcellular Fractions .
IRON CONTENT OF SERUM, LIVER, KIDNEYS, AND KIDNEYSUBCELLULAR FRACTIONS
Serum, Liver, and Kidneys ..Subcellular Fractions
Debris Pellet .Mitochondrial Pellet .Supernatant. ..
KIDNEY FERRITIN AND FERRITIN BOUND IRON .DISCUSSION ..CONCLUSIONS AND SIGNIFICANCE. .
FUTURE STUDy .APPENDIX A: NATIVE-PAGE GEL ASSAYS FOR FERRITIN BOUND
IRON IN KIDNEY SUPERNATANTS ..APPENDIX B: NATIVE-PAGE GEL ASSAYS FOR FERRITIN PROTEIN IN
KIDNEY SUPERNATANTS .REFERENCES .
VB
30303232333436
37
3740
40
4444474757
6567
69
7683

TableI
2
3
4
5
LIST OF TABLES
Composition ofExperiment Diets .Body Weight Gain and Food Intake of Chicks Fe Various Levels ofFeand Al in Diets .Effects ofDietary Fe and Al Intake on Kidney Weight, Liver Weight,and the Weight and Protein Concentration ofKidney SubcellularFractions .Effects ofDietary Fe and Al intake on Liver, Kidney, and Serum FeConcentrations, and the Distribution ofFe in Kidney SubcellularFractions ..Effects ofDietary Fe and Al Intake on Ferritin Bound Fe, FerritinProtein, and the Ratio ofFerritin Bound Fe: Ferritin Protein in ChickKidney .
V1l1
Page31
38
39
41
51
Figure
1
2
3
4
5
6
LIST OF FIGURES
Effects of Dietary Treatments on the Relationship Between Serum Feand Kidney Fe .Effects of Dietary Treatments on the Relationship Between Kidney Feand the Concentration of Fe in the Debris Pellet, Mitochondrial Pellet,and Supernatant ..Representative Native-PAGE Gels Showing the Assays for RelativeAmounts ofFerritin Fe and Ferritin Protein in Kidney Supernatants ....Effects of Dietary Treatments on the Relationship Between Kidney Feand Ferritin Protein ..Effects ofDietary Treatments on the Relationship Between Kidney Feand Ferritin Bound Fe ..Effects of Dietary Treatments on the Relationship Between Kidney Feand the Ratio of Ferritin Fe to Ferritin Protein .
IX
43
45
48
52
53
55
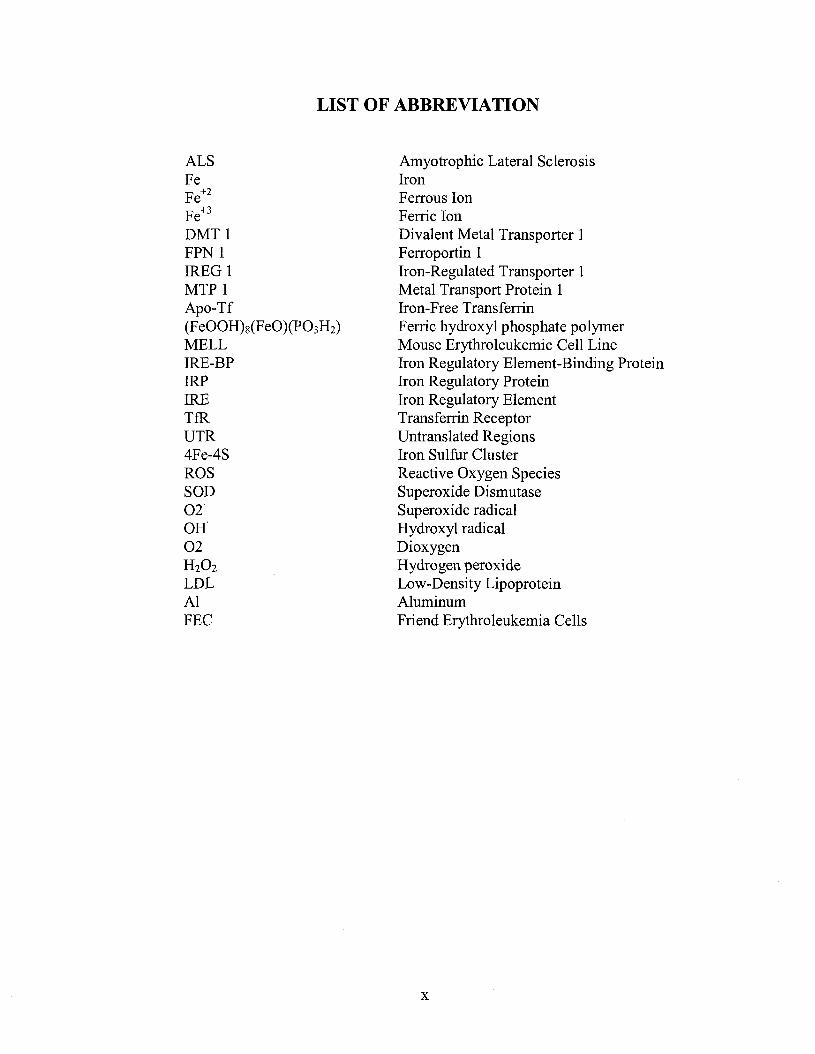
LIST OF ABBREVIATION
ALSFeFe+2
Fe+3
DMTIFPN 1lREG 1MTP 1Apo-Tf(FeOOH)s(FeO)(P03H2)
MELLIRE-BPIRPIRETfRUTR4Fe-4SROSSOD02"on02H20 2
LDLAlFEC
Amyotrophic Lateral SclerosisIronFerrous IonFerric IonDivalent Metal Transporter 1Ferroportin 1Iron-Regulated Transporter 1Metal Transport Protein 1Iron-Free TransferrinFerric hydroxyl phosphate polymerMouse Erythroleukemic Cell LineIron Regulatory Element-Binding ProteinIron Regulatory ProteinIron Regulatory ElementTransferrin ReceptorUntranslated RegionsIron Sulfur ClusterReactive Oxygen SpeciesSuperoxide DismutaseSuperoxide radicalHydroxyl radicalDioxygenHydrogen peroxideLow-Density LipoproteinAluminumFriend Erythroleukemia Cells
x

CHAPTERl
LITERATURE REVIEW
INTRODUCTION
Iron toxicity nonnally does not pose a serious health hazard to the general
population because iron is not well absorbed into the body. However, when iron toxicity
does occur it could lead to detrimental or fatal consequences. Excess iron in cells can
result in acute myocardial infarction, atherosclerotic lesions and certain types of cancer
such as liver, renal, colorectal, lung, and stomach cancer (Candore et al. 2003,
Tuomainen et al. 2003, Waalen et al. 2002, Gaenzer et al. 2002, Lemmer et al. 1999,
Fracanzani et al. 2001, Ali et al. 2003, Stevens et al. 1988, Nelson et al. 2001, Chen et al.
1990, Pham et al. 1992, and Xu et al. 1996). Accumulation of iron in the brain is
associated with Parkinson's disease and Alzheimer's disease (Youdim et al. 1993, Harley
et al. 1993, and Bartzokis 2004). Increased levels of cellular free iron is correlated with
increased of oxidative damage in the cell (Harley et al. 1993, Jang and Surh 2002,
Youdim et al. 1993, and Walter et al. 2002). Iron toxicity occurs when iron homeostasis
is disturbed by genetics, excessive intakes, disease processes or some agent such as
aluminum.
Aluminum is extensively used in modem-day life. The sources of human intake
of aluminum include food, water, phannaceuticals, and environmental exposure. Despite
the abundance of aluminum in the environment and its presence in biological systems, it
has no known biological function. In fact, the accumulation of aluminum has been linked
1

to neurological disorders such as dialysis dementia, Alzheimer's disease and ALS
Parkinsonism dementia complex (Borenstein et al. 1990, Broe et al. 1990, Jansson 2001,
and Pratico et al. 2002). Aluminum toxicity also causes microcytic anemia,
osteomalacia, and neurological damage (Abreo and Glass 1993). However, the
mechanism leading to the toxicological consequences are poorly understood. Several
studies suggest that one way aluminum potentiates its toxic effect is by altering iron
metabolism and cellular iron homeostasis (Bondy and Kirstein, 1996 and Perez et al.
2001). One hypothesis is that aluminum can increase the synthesis of transferrin
receptors while suppressing the synthesis of the iron storage protein ferritin. This results
in the increase of intracellular "free" or reactive Fe that can be cytotoxic by inducing
oxidative stress.
In the following literature review, I will not discuss all ofthe many proposed
mechanisms for how aluminum can induce neurological disorders because they are
outside the scope of this thesis (reviewed by Exley, 2001). But, I will discuss
mechanisms related to aluminum's effect on iron metabolism with an emphasis on the
regulation of ferritin, transferrin receptors, and intracellular iron homeostasis.
2
PART 1 IRON METABOLISM
SOURCES OF IRON
Iron in the diet consists of heme and nonheme iron (iron not bound to heme).
Heme iron makes up 10 percent of the iron in the average American diet and is found
primarily in animal flesh. The other 90 percent is nonheme iron, which comes from
plants, meat, and diary products.
BIOVAILABILITY
The absorption of heme iron is twice as efficient as nonheme iron because it is
absorbed as an intact heme molecule and is not affected by inhibitory ligands or chelators
in the diet. Heme iron absorption is influenced by body iron status. Absorption may
range from 15% with normal iron stores to 35% in a deficiency state (Groff and Gropper
2000).
The bioavailability ofnonheme iron varies from 1% for rice and spinach, 3% for
maize and black beans, 4% for lettuce, 5% for wheat, to 7% for soybeans (Layrisse
1975). Inhibiting ligands and the low solubility of non-heme iron reduce its
bioavailability. Diets including protein factors along with vitamin C may enhance the
absorption ofnonheme iron. Non-heme iron absorption is also increased in iron
deficiency.
3

IRON ABSORPTION MECHANISM
Heme Absorption
Heme iron is absorbed along the small intestine, particularly in the duodenum and
jejunum. Little is known about the mechanism of transport of heme iron. It has been
suggested that heme iron is transported across the mucosal brush border as an intact
molecule via a heme transporter/receptor on the apical surface of duodenal absorptive
cells (Uc et al. 2004). After it enters the cell, heme is degraded by heme oxygenase-1 and
the iron is released. The released heme iron and nonheme iron are metabolized similarly
in the enterocytes as discussed below.
Nonheme Iron Absorption
How nonheme iron crosses from the small intestine into the enterocytes and into
the blood is not well understood. Researchers have identified a divalent metal transport
protein 1 (DMT1; also known as DCT1 or Nramp 2) on the apical membrane and an iron
transport protein (ferroportin 1) on the basolateral surfaces of the mucosal cell (Ke et al.
2003, Le and Richardson 2002, Abboud and Haile 2000, Mckie et al. 2000, and Conrad et
al. 2000). Nonheme iron exists as ferrous (Fe2+) or ferric (Fe3+) ions in food. Hydroc
hloric acid and pepsin from gastric secretions hydrolyze the food components and
release the nonheme iron. The high H+ concentrations in the stomach convert the iron to
the ferric ion. As the Fe3+ ion reaches the small intestine a proportion of it will be
reduced back to Fe2+, the more soluble form of iron, by the enzyme ferric reductase
located on the apical (luminal) enterocytes membrane. The ion then enters the cell
through the DMT1 transporter (Hentze et al. 2004). DMT1 has also been identified on
4
brain (Jeong and David 2003) and kidney cell membranes (Ferguson et al. 2001 and
Hubert & Hentze 2002).
Reducing agents such as ascorbic acids and chelators such as citric acid, lactic
acid, malic acid, tartaric acid, and the acidic amino acids can help increase dietary iron
absorption by keeping the iron in a soluble form so the iron can enter through DMT1. A
diet high in these agents can enhance nonheme iron absorption (Guthrie and Picciano
1995). However, if the iron forms insoluble aggregates in the small intestine the ion will
be excreted in the feces along with other undigested food components. Low gastric acid,
high dietary fiber, high phosphorus intakes, certain proteins (milk, cheese, and eggs),
polyphenols (tannins in coffee and tea), phytates (whole grains, brans, and soy products),
and oxalates (spinach, rhubarb, and chocolate) can decrease the bioavailability of iron.
Therefore, the absorption of iron from eggs, milk, and spinach is less efficient because of
the inhibitory ligands present in these foods that inhibit the absorption of iron into the
mucosal cells. Calcium and zinc may also inhibit iron absorption, but the mechanisms
are not well understood.
Heme and Nonheme Iron Metabolism in the Enterocytes
Once the iron (heme or nonheme) is absorbed into the enterocytes, part of the
absorbed iron (in the Fe2+ form) can be use for normal cellular function. Depending on
the body iron status, a varied amount of iron will translocate across the basolateral
membrane of the enterocytes into the blood via ferroportin. Several studies suggested
that ferroportin 1 (also called Fe-regulated transporter 1 (IREG 1) or metal transport
protein 1 (MTP 1) is the molecule involved in the export of iron into the circulation
5
(Hentze et al. 2004, Le and Richardson 2002, and Abboud and Haile 2000). After iron
enters the circulation it is oxidized to Fe3+ by ceruloplasmin, a copper containing plasma
protein, or by hephaestin, a membrane-bound multicopper containing ferroxidase.
Oxidized Fe3+ is quickly loaded onto transferrin, the iron transport protein in the plasma.
Iron not transported into the blood remains in the enterocytes bound to ferritin, the iron
storage protein. Iron trapped in ferritin is eliminated along with the sloughing of the old
mucosal cells. These intestinal cells provide a barrier to help regulate the level of iron
absorbed from diets to prevent the body from iron overload.
Regulation of Intestinal Iron Absorption
Absorbed iron is not easily eliminated from the body. Because of this reason,
controlling the absorption of iron is crucial to prevent iron overloads. A proposed model
by Nicolas et al. (2001) suggests that the iron regulatory peptide, hepcidin, produced in
the liver, appears to modulate intestinal iron absorption. This model proposes that
increased iron uptake by the liver increases the synthesis and secretion ofhepcidin.
During high iron status, the number of transferrin-transferrin receptors complexes are
increased in the liver. This stimulates the production and release ofhepcidin by the liver
into the plasma. Hepcidin modulates intestinal iron absorption by modifying the crypt
cells to produce a low level of duodenal ferric reductase expression and iron transport
proteins [(Ferroportin 1 (FPNl), and divalent metal transport protein I (DMTl)] (Leong
and LonnerdaI2004). When the old enterocytes are sloughed off, these new crypt cells
differentiate into mature enterocytes, resulting in decreased amounts of ferric reductase
enzymes and iron transport proteins. As a result, there is a decrease in dietary iron
6

absorption (Leong and Lonnerda12004). Leong and Lonnerdal's (2004) observation
agrees with Nicolas's (2001) model in that they observed an inverse correlation between
hepcidin, duodenal iron transporter expression, and iron absorption.
DISTRIBUTION OF IRON IN THE BODY
Transferrin delivers iron in the plasma to tissues for use or storage. Transferrin is
a single polypeptide chain around 80 kDaltons with two iron-binding sites on both ends
ofthe protein (Crichton 1991). Each transferrin can hold up to two ferric ions. The
major function of transferrin is to transport extracellular iron into the cell and to maintain
plasma iron in a soluble non-reactive form that is suitable for cellular uptake. It acts
almost like an antioxidant that houses the iron in a safe form to prevent iron-induced
oxidative stress in the circulation.
A large quantity of the plasma iron is taken up by bone marrow for hemoglobin
synthesis and smaller quantities are taken up by other tissues for use in myoglobin or
iron-dependent enzymes. The excess iron in cells is stored in the proteins ferritin and/or
hemosiderin, primarily found in liver, bone marrow, and spleen.
INTRACELLULAR IRON METABOLISM
Cellular iron uptake and metabolism requires multiple steps. First, the iron
containing transferrin molecule in the plasma binds to the transferrin receptor molecule
on the tissue cell surface, the complex is internalized into the cell by receptor-mediated
endocytosis. Then, the endocytotic vesicle fuses with lysosomes and matures into a
proton-pumping endosome. When the interior of the endosome reaches a pH of5.5, the
7

transferrin-transferrin receptor complex dissociates, the transferrin receptor is released
back to the cell surface and the Fe3+ ions are released from transferrin. The iron-free
transferrin (Apo-Tf) is recycled back into the circulation (Crichton et al. 2002). Ferric
ion is reduce to ferrous ion by ferrireductase prior to its transport out of the endosome by
the transmembrane iron transporter, divalent metal transporter (DMT1)/Nramp2, and
translocates into the cytosol (Crichton et al. 2002). The new, cytosolic, free Fe2+ can
enter the available iron pool for use by the cell. The excess free iron within the cell can
be stored in ferritin.
FERRITIN
Structure
Ferritin, the iron sequestering and storage protein, is synthesized in most tissues,
especially those with high iron contents such as liver, bone marrow, and spleen (Crichton
1971). Ferritin consists of24 protein subunits forming a hollow core with a molecular
weight around 450,000 Da (Groff and Gropper 2000). Each ferritin molecule can hold up
to 4,500 iron atoms within its core (Groff and Gropper 2000). Ferrous iron enters
through one of eight channels in the ferritin molecule. Ferroxidase enzymes are located
along the ferritin pores to oxidize Fe2+ to ferric oxyhydroxide crystals or ferrihydrite, the
stored form of iron within the ferritin core (Orino et al. 2004).
Ferritin Subunits
The subunit composition of ferritin varies from tissue to tissue within the same
species. Ferritin contains two different subunits, the relative proportions of which vary
8
with tissue type. The H-subunit is a 22-kDa protein which predominates in heart ferritin.
The L-subunit is a 20-kDa protein which predominates in liver and spleen. The H
subunit is 50% identical to the L-subunit and both have similar structures. The
composition of subunits may influence the functional properties of ferritin (Jacob 1975).
The H-subunit contains the enzyme ferroxidase to convert ferrous ions into ferric
hydroxides. The L-subunit lacks this ferroxidase activity and is thought to playa role in
nucleation and mineralization of the iron core. Ferroxidase in H-subunits has a central
role in regulating free iron availability in the cell and, therefore, resistance to iron
induced oxidative damage (Arosio and Levi 2002). A large increase ofH-subunits results
in an iron-deficient phenotype in mouse erythroleukemic (MELL) cell line and a
resistance to oxidative stress (Picard et al. 1998). High amounts of L-subunits have no
effect on iron metabolism (Corsi et al. 2002).
Ferritin Synthesis
Ferritin expression is regulated at the level of transcription and translation. The
H-subunits are regulated at the translational level and the L-subunits at the transcriptional
and translational levels.
The regulation of ferritin synthesis at the transcriptional level is not well
understood. The expression of ferritin at the translational level is controlled by the level
of cytosolic iron. Under low intracellular iron conditions, Iron Regulatory Element
Binding Proteins (IRPs) are activated and bind to the Iron-Regulatory Elements (IRE) at
the 5' ends of the ferritin mRNA. The interaction ofIRPs and IRE inhibits initiation of
the translation of ferritin mRNA. On the other hand, under high iron levels, IRPs are
9

inactivated [become aconitase (IRP 1) or are degraded (IRP 2)], thus allowing the
initiation of ferritin mRNA translation to continue. By controlling the availability of
IRPs, cytosolic iron directly influences the synthesis of ferritin, an important molecule
crucial in maintaining cellular Fe homeostasis. The importance of ferritin is made clear
by the fact that ferritin knockout mice die during embryonic development.
CELLULAR IRON HOMEOSTASIS
Cellular iron homeostasis is regulated by balancing iron uptake by the cell, via the
transferrin receptor, with intracellular storage and utilization so that excessive "free" or
reactive iron does not accumulate. This balance is achieved by the coordinated
translation of transferrin receptor (TfR) and ferritin mRNAs. The mRNAs coding for
ferritin and the transferrin receptor contain similar stem-loop structures, IREs, on the 5'
and 3' untranslated regions (UTR), respectively. IRPs (as mentioned above) are cytosolic
RNA binding proteins that bind to IRE and control the translation or stability of the
mRNA. During low intracellular iron, IRP binds to IRE on the transferrin receptor
mRNA at its 3' UTR. This prevents access of endonucleolytic enzymes and protects the
mRNA from degradation. The result is increased TfR expression. The increase of TfRs
on cell membrane leads to increased iron uptake. Ferritin mRNA behaves differently
when IRP binds to IRE. When the IRP molecule binds to the IRE on the 5' end of ferritin
mRNA, it blocks the initiation factor complex (factor-4F) from binding to the 5' end of
ferritin mRNA, and inhibits the translation of the ferritin message. Less ferritin means
less Fe is sequestered and more is available for use in the cell.
10
As the cytosolic iron concentration increases, brought forth by TfRs as described
earlier, the two forms ofIRPs (IRPI & IRP2) behave differently as they come in contact
with the cytosolic iron. The binding of cytosolic Fe to IRPI forms a Fe-Sulfur cluster
(4Fe-4S) and converts IRPs into cytosolic aconitase in the TCA cycle. This prevents
IRPI binding to IRE on TfR or ferritin mRNA (Roy et al. 2002). Conversely, the binding
of iron to the cysteines-sulfur cluster region referred to as the "iron-dependent
degradation domain" on IRP2, leads to oxidative modification at that site and degradation
of the IRP2 protein (Bourdon et al. 2003). It was hypothesized that the cysteines could
ligate free iron which then mediates oxidation of IRP2 creating a recognition signal for
the protein ubiquitin that signals proteases to degrade the IRP2 protein (Bourdon et al.
2003, and Yamanaka et al. 1999). The degradation ofIRP2 or the conversion ofIRPl
into aconitase prevents the binding ofIRPs with IRE on mRNA. In the case ofTfR
mRNA, this allows the endonucleolytic enzymes to bind to the 3' UTR, and induce
transferrin receptor mRNA degradation. As a result, this leads to decreased TfR
expression. On the other hand, the 5' end of ferritin mRNA translocates to the ribosome
and initiates the translation of the ferritin message; therefore, there is an increase in
ferritin concentration to store the free iron.
Normally, the body is able limit the amount of reactive free Fe via regulating Fe
absorption by the enterocytes and, at the cellular level, by regulating the transferrin
receptor for cellular Fe uptake, and ferritin level for iron storage. However, sometimes
genetics, high iron intake, or high exposure to chemicals from the diet such as aluminum
can disrupt the normal function of these iron homeostasis molecules; as a result this can
lead to iron toxicity.
11

IRON TOXICITY
The toxicity of iron is well established both clinically and experimentally.
Symptoms ofmoderate cases of iron overload can range from nausea to diarrhea to
constipation. However, chronic iron toxicity has been correlated to certain forms of
cancer and atherosclerosis. Many studies also have linked iron as a potential culprit for
neurological disorders such as Alzheimer's and Parkinson's disease.
Results from clinical and epidemiologic studies demonstrated strong associations
between excess iron and the development of cancer (Deugnier 2003). Bhasin et al.
(2003) observed increased tumor response in mice when iron levels of 0.5, 1.0, and
1.Smg/mouse were injected once a week at the promotion stage of skin carcinogenesis.
Also, Adzersen et al. (2003) found an increased risk oflung cancer and other cancers of
the upper aero-digestive tract among foundry workers.
The best example to illustrate the effect of iron overload is hereditary
hemochromatosis. Hemochromatosis is a common, autosomal recessive genetic disorder
affecting approximately 1 in 200 individuals ofNorthem European ancestry (Davis and
Bartfay 2004). It is characterized by an increase in iron absorption and results in the
accumulation of iron in cells of the liver, pancreas, heart, and other organs (Davis and
Bartfay 2004). The accumulation of iron can cause organ injury, particularly to the liver,
heart, and endocrine pancreas (especially insulin-secreting ,B-cells) (Toyokuni 2002). A
study conducted in Denmark indicated that the major causes of death in hereditary
hemochromatosis are hepatic failure with cirrhosis and hepatocellular carcinoma
(Milamn et al. 2001). Three studies concluded that hemochromatosis patients have
12
greater risk for hepatocellular carcinoma than in the age-matched control population
(Niederau et al. 1985, Bradbear et al. 1985, and Hsing et al. 1995). Shaheen et al. (2003)
suggested that HFE gene mutations (the gene responsible for hereditary
hemochromatosis) are associated with an increased risk of colon cancer. Furthermore,
when HFE mutations coexist with mutations in the transferrin gene, the risk for
developing Alzheimer's disease increased; however, this concept is still controversial
(Robson et al. 2004).
Hemochromatosis cases have also been linked to heart disease. Three prospective
studies have observed an increased risk of cardiovascular disease incidence and deaths
among hemochromatosis subjects (Tuomainen et al. 1999, Rasmussen et al. 2001, and
Roest et al. 1999). However, other studies did not find any significant associations
between hemochromatosis populations and cardiovascular disease (Calado et al. 2000,
Hetet et al. 2001, and Franco et al. 1998).
The mechanism behind the devastating effect of excess iron is not well
understood. Researchers suggested iron is capable of mediating tissue damage by
promoting the production of reactive oxygen species (ROS) and free radicals in the body
(Harley et al. 1993, Jang and Surh 2002, Toyokuni 2002, Davis and Bartfay 2004, and
Cederbaum 2003). In normal healthy individuals, the levels ofROS in the body are
minimized by antioxidants (e.g., SOD, glutathione, vitamin E) to prevent the induction of
oxidative stress. However, iron overload can aggravate the level of free radicals (e.g.,
O2e- and OHe) via the FentoniHaber-Weiss reactions and increase the susceptibility of
cellular membranes, proteins, and DNA to attacks by ROS.
13
Redox cycling is a characteristic of iron, which underlies its toxicity (Aisen et al.
2001). The one-electron reduction of dioxygen (02) by Fe2+ results in superoxide
formation (02.-) which subsequently dismutates to hydrogen peroxide. The reaction
further proceeds to hydroxyl radical formation induced by the Fenton reaction:
The hydroxyl radical is possibly the most powerful oxidant. It will attack
proteins, nucleic acids and carbohydrates, and initiate chain-propagating lipid
peroxidations (Aisen et al. 2001). Whittaker and Chanderbhan (2001) observed that an
increase in non-heme iron in liver from 18 to 3500 /lg!g correlated with an increase in
lipid peroxidation, increase in serum phospholipids, and a change in the ratios of
saturated to unsaturated fatty acids. Studies indicated that iron loading results in an
increase in malonaldehyde production, a decrease in antioxidant levels such as gluthione,
a reduction of specific activity of complex I and IV of the respiratory chain in
,Parkinson's disease, and stimulation of lipid peroxidation in Parkinson's patients
(Youdim et al. 1993 and Harley et al. 1993).
Other studies suggested oxidative stress induced by ROS as the pathology of
Alzheimer's disease (lang and Surh 2002 and Ng 2004). lang and Surh (2002) suggested
that the production ofROS leads to beta-amyloid induced apoptotic cell death.
During the past decade, many studies have provided evidence to support the role
of oxidative stress in the development of cardiovascular diseases (Lieu et al. 2001, Emerit
et al. 2001, Chau 2000, and Martinet et al. 2002). It is hypothesized that the oxidation of
14
low-density lipoprotein (LDL) and lipid, induced by iron, is involved in the process of
plaque fonnation seen in atherosclerosis (Gurzau et al. 2003). Martinet et al. (2002)
observed elevated levels of oxidative DNA damage in human atherosclerotic plaques.
However, other studies found no association between the role ofbody iron stores and
cardiovascular disease risk (Moore et al. 1995 and Iribarren et al. 1998).
CONCLUSIONS
Maintaining cellular iron homeostasis is crucial to our daily lives. The disruption
of iron homeostasis can pose serious health problems and sometimes even death.
Elevated cellular iron concentrations can induce oxidative stress to the cell and are linked
to the pathology of diseases such as cancer, Alzheimer's, Parkinson's and heart-related
conditions (Jang and Surh 2002, Ng 2004, Harley et al. 1993, Rasmussen et al. 2001,
Hetet et al. 2001, Shaheen et al. 2003, Milman et al. 2001, Adzersen et al. 2003, and
Toyokumi 2002). Evidence suggests that iron overload results in increased lipid
peroxidation, DNA lesions, and apoptosis induced by ROS via the Fenton reaction. As a
result, it is critical that the body regulates iron absorption and cellular iron homeostasis.
In the nonnal individual, the concentration of free cellular iron is tightly
monitored by IRPs that regulate transferrin receptors and the iron storage protein, ferritin.
However, a small amount ofpeople with hemochromatosis, or overdose on iron
supplements can create difficulties in maintaining iron homeostasis. Recent studies have
proposed that aluminum is an agent that may also alter iron homeostasis. One of the
proposed hypotheses is that aluminum can decrease the synthesis of ferritin and increase
expression of transferrin receptors. The disruption of the nonnal synthesis of transferrin
15
receptors and ferritin could create increased amounts of reactive iron residing in the cell,
and result in an increase of oxidative stress induced by the Fenton reaction (Abreo et al.
1994 and Yamanaka et al. 1999).
PART II ALUMINUM TOXICITY AND ITS EFFECT ON IRON
METABOLISM
SOURCES OF ALUMINUM
Food, water, and pharmaceuticals are the most common sources of aluminum
exposure (Greger and Sutherland 1997). According to the 1984 U.S. Food and Drug
Administration Total Diet Study, the average daily intakes of aluminum for adult (25-30
years old) males and females were 13.8 and 8.7mg Allday, respectively (Greger and
Sutherland 1997). Aside from food and water, there are other important sources such as
pharmaceutical, environmental and occupational exposures.
Dietary Exposure
Aluminum is widely distributed in foods such as processed cheeses, baking
powders, cake mixes, frozen dough, pancake mixes, soy-based milk products, and food
additives (Nayak 2002). Aluminum can be absorbed by produce grown in soil that has a
pH lower than 4.5-5.0 (Nayak 2002). The concentration of aluminum in tea leaves
ranges from Img AlIg up to 17mg AlIg depending on the geographical location where it
was grown (Eden 1976). Leaching of aluminum from beverage cans and cook-wares can
16
also increase the amount of aluminum in the diet. The average concentration of
aluminum in canned soda is O.lmg AI/g (Nayak: 2002).
Medication/Pharmaceutical Exposure
Large oral doses of aluminum-containing phosphate binders, antacids, high
aluminum dialysates, and calcium supplements based on oyster shells can increase
aluminum intake (Greger and Sutherland 1997 and Nayak: 2002). Calcium supplements
based on oyster shells could contain 0.2% to 0.6% of aluminum (Bourgoin 1992). The
amount of Al in enteral nutrition formulas and parental solutions ranges from 87.6 to
961.2 ng AlIml and from 58.4 to 1232 ng AlIml, respectively (Nayak 2002).
Aluminum is present in vaccine products such as diphtheria, tetanus, hepatitis,
rabies, and anthrax (Nayak 2002). Nonprescription drugs such as antacids, buffered
aspirins, antidiarrheal products, and hemorroidal medications can also increase aluminum
exposure (Nayak 2002). Some individuals can consume as much as an additional 5 g of
aluminum daily from antacid products (Greger 1993 and Domingo 1993).
Drinking Water Exposure
Aluminum concentrations in natural water are normally small, but higher
concentrations are found in urban areas due to the increase of aluminum leached from
acid rain and the use of aluminum in municipal water treatment (Nayak 2002). Several
studies have found an association of aluminum in water to elevated the risk of AD and
elderly cognitive impairment. However, other studies have found no effect (Rondeau et
al. 2000, McLachlan et al. 1996, and Varner et al. 1998).
17

Certain factors may affect the absorption of aluminum in drinking water. In some
studies high water pH was shown to have a large significant effect on AD rates by
reducing aluminum absorption. Districts which consumed drinking water with a pH
higher than 7.85 had a 50% reduction in AD risk compared to the more acidic water
district (Rondeau et al. 2000). Another factor that may reduce aluminum absorption in
drinking water is silicon Drinking water with more than 10ppm of silicon helps
neutralize the effects of aluminum (Rondeau et al 2000 and Taylor et al. 1995).
Environmental Exposure
Aluminum makes up about 8% ofthe earth's crust and it occurs naturally in the
soil (Nayak 2002). Higher concentrations of aluminum are found in places with coal
combustion, such as aluminum mines and smelting industry. The ranges of aluminum
found in the atmosphere from both natural processes and human activities are about 0.005
to 0.18mg/m3 (Nayak 2002).
Occupational Exposure
Increased aluminum exposures are seen in groups who work in aluminum refining
and metal industry, printing and publishing, auto dealerships, service stations, and places
that produce metals (U.S. Public Health Services 1992). Studies reported cognitive
changes, possible impairments, and other occupational hazards that are related to
exposure to aluminum dusts and fumes (Nayak 2002).
18
GROUPS AT RISK FOR ALUMINUM TOXICITY
Renal disease patients on aluminum containing dialysis drugs are often the major
population with an increased risk of aluminum toxicity. Patients with reduced renal
function can sometimes ingest up to 10g AVday from aluminum-based phosphate binders
given to reduced phosphate absorption (Greger and Sutherland 1997). Any population
with reduced renal function tends to accumulate aluminum over time. Infants are also at
risk because they are fed with infant formulas, especially soy-based ones that may
contain high levels of aluminum (Greger and Sutherland 1997). People working in
aluminum refining, metal, printing, publishing, auto dealerships have increase exposure
of aluminum. Also, people with acid reflux disease often increase aluminum exposure
from chronic ingestion of antacids.
ABSORPTION AND TRANSPORT OF ALUMINUM
There are several locations in the body where aluminum can be absorbed; these
include the gastrointestinal tract, lungs, olfactory system, and the dermal layer of the skin
(Nayak 2002). The mechanism behind aluminum absorption at these sites is not well
understood (Nayak 2002). Aluminum absorption through the GI tract is about 0.1 %
however, absorption may be increased several fold by chelators of aluminum such as
citrate (Deng et al. 2000, Venturini-Soriano and Bertonn 2001, and Drueke 2002). In
young normal rats, 0.05%-0.1% of ingested aluminum is absorbed in the intestine; after 2
hours half of the ingested aluminum goes mostly to the skeleton and after 48 hours the
other half is excreted in the urine (Drueke 2002).
19
The process of how aluminum is absorbed is difficult to determine and no specific
transport system has been identified. The concentration of aluminum in the GI, the
solubility of aluminum, and the presence of other dietary factors affect its bioavailability
(Greger and Sutherland 1997). According to Van der Voet (1992), aluminum absorption
includes both paracellular passage of aluminum through tight junctions and transcellular
passage involving passive, facilitated, and active transport processes through the mucosal
cells. According to another study using in situ isolated duodenal segments at pH 2;
approximately 23% of aluminum absorption was through nonsaturable processes and the
rest was through saturable (active) processes (Greger and Sutherland 1997).
Once aluminum crosses the barrier of the mucosal cell and into the blood, it can
bind to empty iron-binding sites on transferrin. McGregor et al. (1991) observed that
lymphocytes and human erythroleukaemia K562 cells took up aluminum by transferrin.
In vitro studies have shown that between 60% and 90% of serum aluminum is associated
with transferrin (Fatemi and Moore 1991 and Soldado et al. 1997). Since aluminum and
iron share binding sites on transferrin, this suggests that aluminum can follow the
intracellular pathways of iron distribution.
ALUMINUM METABOLISM
The cellular uptake of aluminum-bound transferrin follows the same route as iron
bound transferrin. Transferrin receptors on the cell membrane recognize the metal-bound
transferrins and the complex is engulfed into a clathrin-coated pit by endocytosis. The
endocytotic vesicle then fuses with lysosomes to form an endosome. As soon as the
interior environment ofthe endosome reaches pH 5.5 by the action of a proton pump, the
20
aluminum is released from transferrin and moves into the cytosol (Bali et al. 1991 and
Sipe and Murphy 1991). How aluminum exits the endosome remains unknown, but iron
exits via the iron transporter DMTI.
ALUMINUM DISTRIBUTION
In normal healthy individuals, the total amount of aluminum in the body is
approximately 30-50mg distributed among various tissues (Nayak: 2002). Another study
suggests a body content of300 mg (Skalsky and Carchman 1983). Highest
concentrations of aluminum are found in the bone and the lungs (Ganrot 1986).
Presumably, lungs accumulate aluminum from inhalation exposure (Nayak: 2002).
Aluminum contents in the bone, kidneys, muscle, heart, and brain are accumulated from
oral exposure (Nayak 2002). Of these tissues, the brain has the least amount of
aluminum accumulation due to the partial exclusion by the blood-brain barrier (Yokel et
al. 1999). In general, the accumulation of aluminum due to oral exposure is in the order
bone> liver> kidney> testes> muscle> heart> brain. Increased aluminum
concentrations in the body are correlated with increased age (Nayak 2002). Aluminum
accumulation in the brain is estimated at a rate of 8 Ilg per year (Edwardson et al. 1991).
Low-level long-term exposure to aluminum may be a contributing factor in Alzheimer's
disease and related neurological diseases (Yokel and McNamara 2001).
ALUMINUM TOXICITY
Aluminum has been shown to be a toxicant to the central nervous system,
hematopoietic system, and skeleton in anim.als and humans (Yokel and McNamara 2001).
21

The classic example is aluminum toxicity observed in renal impaired patients consuming
high levels of aluminum hydroxide as a phosphate binder. Aluminum retention and
toxicity results because of decreased kidney function to eliminate aluminum (Abreo and
Glass 1993). Osteomalacia, bone pain, pathological fractures, proximal myopathy, and
failure to respond to vitamin D3 therapy are features of aluminum toxicity to the skeletal
system (Alfrey 1991, Kausz et al. 1999, and Rodrigues et al. 1990). Takeuchi et al.
(1997) demonstrated that Al has negative effects on osteoblast function and bone
formation in vivo and in vitro. In the presence of 10IlM Al cultured erythroleukemia
cells showed a reduction in heme synthesis (Perez et al. 2001). Aluminum toxicity has
also been found to induce microcytic anemia in individuals with normal renal function
and the mechanism involves inhibition ofFe incorporation into the heme molecule.
Aluminum is a well known neurotoxicant, causing encephalopathy in renal failure
patients, but the mechanism is unknown (Abreo and Glass 1993, Yokel and McNamara
2001, Kaiser et al. 1984, and Nasiadek and Chmielnicka 2000). Aluminum can alter the
function ofmembranes and a variety of enzymes and proteins, but the significance of
these effects to neurological disorders, Alzheimer's disease and ALS Parkinsonism
dementia complex is not clear (Borenstein et al. 1990, Pratico et al. 2002, Broe et al.
1990, Jansson 2001, and Abreo and Glass 1993). Some, but not all, studies have shown
an association between aluminum in drinking water and Alzheimer's disease (Rondeau et
al. 2000, McLachlan et al. 1996, Varner et al. 1998, and Taylor et al. 1995). Other
studies have indicated that Alzheimer's patients had higher levels ofbrain aluminum than
age-matched controls (Yokel et al. 1999). In experimental animals studies, aluminum
administered in the diet increased amyloid (3 plaques and neurofibrillary tangles, lesions
22

associated with Alzheimer's disease (Clauberg and Joshi 1993, and Van Rensburg et al.
1997). Several studies indicated aluminum has the potential to enhance iron-induced
oxidative stress to the cell (i.e., lipid & protein peroxidations) (Clauberg and Joshi 1993,
and Van Rensburg et al1997). Abreo and Glass (1993) suggested that aluminum could
induce lipid peroxidation by increasing the cellular iron uptake in association with
decreased iron entry into ferritin. This would result in an increased "labile" iron pool and
facilitate iron-induced oxidative stress via the Fenton reaction. This result can be further
supported by Xie et aI's. observation (1996). Xie et al. indicated that increased
intraneuronal Al concentration potentiates Fe-induced oxidative stress and neuronal
death.
EFFECTS OF ALUMINUM ON ERYTHROPOESIS
The effect of aluminum on iron utilization for red blood cell formation has been
investigated in vivo and in vitro. However, the mechanisms are not fully understood.
Human subjects exposed to moderately high serum aluminum concentrations show a
decrease in the mean corpuscular hemoglobin concentration, serum ferritin and
transferrin saturation (Gonzalez-Revalderia et al. 2000). Nasiadek & Chmielnicka (2000)
observed a decrease in iron concentration in erythrocytes, blood, and spleen, followed by
an increased in the level of free erythrocyte protoporphyrins in rats orally exposed to
aluminum. The mechanisms producing anemia are thought to involve inhibition of iron
incorporation into heme and/or interference with iron uptake, and utilization by immature
erythrocyte (Perez et al. 2001). Aluminum-induced anemia commonly occurs with
normal iron status suggesting that the toxic mechanism is at the level of iron use by the
23

erythrocyte. Inhibition of iron absorption by the intestine, however, may also be a factor
under conditions of high aluminum intake (Cannata et al. 1991). Studies of the effects of
dietary aluminum on iron absorption and tissue iron contents are contradictory, some
suggesting reduced iron status, some showing no effect or increased iron in tissues
(Turgut et al. 2004).
EFFECTS OF ALUMINUM ON CELLULAR IRON METABOLISM
Aluminum can modify cellular iron homeostasis by stabilizing the iron regulatory
protein 2 (IRP2) (Yamanaka et al. 1999). This would promote the binding ofIRP to IRE,
inducing TfR expression while blocking ferritin synthesis. Yamanaka et al. (1999)
demonstrated that aluminum induces the IRE binding activity of IRP2 by competitively
inhibiting the oxidative modification of IRP2 by iron. This prevents ubiquitination of the
IRP2 protein and proteasome degradation, leading to stabilization, and increased amounts
of the protein. Stabilization of the IRP2 protein promotes TfR expression and the
suppression of ferritin synthesis. This could lead to increased concentrations of
intracellular free iron. Alternatively, Abreo et al. (1994) proposed that aluminum caused
cytosolic iron to be partitioned into mitochondria or nuclei with the resulting reduction in
cytosolic iron leading to stabilization of IRPs and suppression of ferritin synthesis.
However, other studies found opposite results. San-Marina and Nicholls (1992) observed
increased ferritin synthesis in animals following intraperitoneal aluminum injections.
Oshiro et al. (1998) observed a decreased in the transferrin receptor mRNA level in cells
pretreated with aluminum.
24
Although studies did not show consistent results on ferritin synthesis, several
studies have shown an effect on iron uptake into ferritin. Fleming and Joshi (1991) found
decreased iron loading into isolated ferritin in vitro. This study is further supported by a
study using cultured Friend erythroleukemia cells (FEC). Abreo et al. (1994)
demonstrated that in aluminum-loaded FEC, ferritin content was reduced as was the
uptake of 59Fe by ferritin. These authors suggested that the decrease of ferritin and iron
uptake by ferritin can lead to an increase of reactive (labile) iron in the cell which could
result in iron-induced Fenton reactions and, therefore, increase ROS production in the
cell.
Aluminum's ability to promote iron-induced oxidative stress is generally
accepted, but not fully understood. Practico et al. (2002) observed that dietary aluminum
can enhance in vivo AD-like amyloidosis in transgenic mice bearing the Alzheimer's
gene, and that this was associated with increased brain oxidative stress. Bondy and
Kirstein (1996) observed that aluminum potentiates iron-induced ROS, but observed no
stimulation ofROS in the presence of aluminum alone. Also, increased Fe uptake in
aluminum-loaded mouse hepatocytes and Friend erythroleukemia cells showed
membrane lipid peroxidations (Abreo et al. 1990 and 1991). This has led to the
hypothesis that aluminum toxicity may be related to iron-induced oxidative stress.
CONCLUSIONS
Aluminum toxicity is well documented, but the mechanism of action is poorly
understood. Studies demonstrated that aluminum is a potential toxicant to the central
nervous system, hematopoietic system, and skeleton (Yokel and McNamara 2001, Kausz
25

et al. 1999, Alfrey 1991, Takeuchi et al. 1997, Perez et al. 2001, Abreo and Glass 1993,
Borenstein et al. 1990, and Practico et al. 2002). Cell culture studies have provided
evidence that the alteration of iron metabolism induced by aluminum may be the
mechanism of aluminum toxicity (Abreo et al. 1994, Oshiro et al. 1998, Yamanaka et al.
1999, Golub et al. 1996, and Perez et al. 2001). One hypothesis is that aluminum can
increase the level of reactive iron and induce oxidative stress to the cell. Aluminum has
an ionic structure similar to iron and is known to bind to transferrin. This concept
suggests that aluminum can bind to molecules that are intended for iron (e.g., IRP2) and
could disturb their normal functions. For example, evidence indicates that aluminum can
bind to IRP2 and disrupt the synthesis of ferritin and transferrin receptors; ultimately, this
could lead to increased ROS. Aluminum-induced oxidative damage via excess reactive
iron could result in Alzheimer's disease, as well as iron-induced diseases such as cancer
and heart disease. Since most of the information on the effects of aluminum on cellular
iron homeostasis have been done in cell culture, the purpose of the study described in
chapter II is to test some of these hypotheses in vivo, in animals exposed to dietary
aluminum.
26
CHAPTER 2
DIETARY ALUMINUM ALTERS IRON HOMEOSTASIS
AND FERRITIN FUNCTION IN THE CHICK
INTRODUCTION
Aluminum is extensively used in modem daily life and people are getting more
exposed to sources of aluminum. Sources of aluminum include food, water, and
environmental and occupational exposure. Aluminum is also present in many
commonly-used pharmaceuticals and cosmetics. Aluminum has no known to have no
biological function despite its abundance. However, in the past few decades, the toxic
impacts of aluminum on biological systems have been topics of considerable interest and
debate (Exley 2001).
Neurotoxic effects of aluminum have been observed in animal studies, but the
mechanism are poorly understood (Bondy and Kirstein 1996, Oteiza et al. 1993, and
Pratico et al. 2002). Other studies suggest that aluminum may be the cause of
neurological disorders such as Alzheimer's disease and ALS Parkinsonism dementia
complex (Crichton 2001, Whittaker and Chaderbhan 2001, Shaheen et al. 2003, and
Adzersen et al. 2003). In renal failure patients, a dementia similar to Alzheimer's disease
has been clearly linked to accumulation of aluminum in the brain (Alfrey et al. 1976).
Aluminum toxicity has also been shown to cause microcytic anemia and osteomalacia
(Nayak 2002). Despite a large body of literature on the pathological effects of aluminum,
the underlying causes of tissue damage remain largely unresolved.
27
One hypothesis for the neurotoxicity ofAl is that Al indirectly promotes its toxic
effect by altering iron metabolism (Abreo and Glass 1993, and D'Haese and DeBroe
2001). Early experimental studies indicated that aluminum has the potential to cause
iron-induced oxidative stress leading to cellular damage (Bondy and Kirstein 1996, and
Oteiza et al1993). One proposed mechanism is that aluminum can disturb cellular iron
homeostasis by increasing the translation of transferrin receptors and decreasing the
translation of ferritin. The increase in transferrin receptors would lead to an increase in
iron uptake into the cell; however, at the same time, a decrease in ferritin synthesis would
limit the ability to store the excess iron. Therefore, this would lead to an increase in
intracellular free (reactive) iron not stored in ferritin, which could cause oxidative stress
and cell damage (D'Haese and De Broe 2001, and Abreo et al. 1999).
There are two current hypotheses for how Al could alter the expression of iron
responsive proteins such as ferritin and the transferrin receptor. Yamanaka et al. (1999)
reported that aluminum stabilized the iron regulatory protein 2 (IRP2) in cell culture.
The stabilization of IRP2 increased the binding of IRP2 to iron response element (IREs)
in transferrin receptor and ferritin mRNA, promoting transferrin receptor expression and
suppressing ferritin synthesis. In support of this hypothesis, erythroleukaemia K562 cells
grown in an aluminum-supplemented medium displayed an increase in surface transferrin
receptors relative to controls (Perez et al. 2001). A second hypothesis is that aluminum
causes cellular iron to become trapped in a subcellular compartment such as mitochondria
or lysosomes, reducing the amount of cytosolic iron available to bind with IRP2 (Abreo
et al. 1999). The lack of iron in the cytosol would stabilize IRP2 and affect the synthesis
28
of transferrin receptors and ferritin (Zatta et al. 2000, Nesse and Garbossa 2001, and
Abreo and Glass 1993).
In order to better understand the effects of Al on iron metabolism, there is a need
to further characterize the effects of Al on tissue iron levels and the regulation ofproteins
involved in cellular iron homeostasis, especially in vivo, since all work to date has been
done in cell cultures. In previous studies, our laboratory observed that chicks fed
aluminum had reduced ferritin levels in liver, intestine, and kidney; however, the levels
of iron in these tissues and its subcellular distribution were not well characterized (Han et
al. 2000). The objectives of this study were to determine, in vivo, if aluminum alters
tissue iron levels and their relationship to ferritin protein expression, and the amount of
iron sequestered within ferritin. Kidney iron levels, the subcellular distribution of kidney
iron, kidney ferritin levels, and the amount of iron incorporated into ferritin were
measured in chicks fed diets that varied in iron and aluminum content. The kidney was
chosen as a model tissue in this study because it takes less time for aluminum to
accumulate in the kidney than in the brain, and the regulation of intracellular iron
homeostasis is similar in both tissues.
29
MATERIALS AND METHOD
ANIMALS, DIETS, AND EXPERIMENTAL DESIGN
Two experiments were conducted using 1 day old White Leghorn cockerels
(Asagi Hatchery, Honolulu, HI). Chicks with similar body weights were randomly
assigned to dietary treatment groups as describe below. The compositions of
experimental diets (Table 1) were based on the reference soy isolate diet for chicks set by
the National Research Council (National Research Council 1994). The chicks were
housed in stainless steel wire brooders in a room with a 12-hour light: dark cycle and
provided unlimited distilled water in stainless steel trays. Food intake per treatment
group was recorded daily and individual body weights were measured weekly. The
experimental protocol was approved by the University ofHawaii Animal Care Advisory
Committee.
Experiment 1
Forty eight chicks were evenly distributed into two dietary treatment groups,
control or control plus aluminum for four weeks (Table 1). The control diet contained
NRC recommended amounts of iron (0.011 % iron by weight) as Fez+3(S04-z)3. The
control plus aluminum diet contained 0.3% aluminum in the form of AICb-6HzO added
in place of dextrose. The chicks were pair-fed their experimental diets for four weeks
starting from day 1.
30
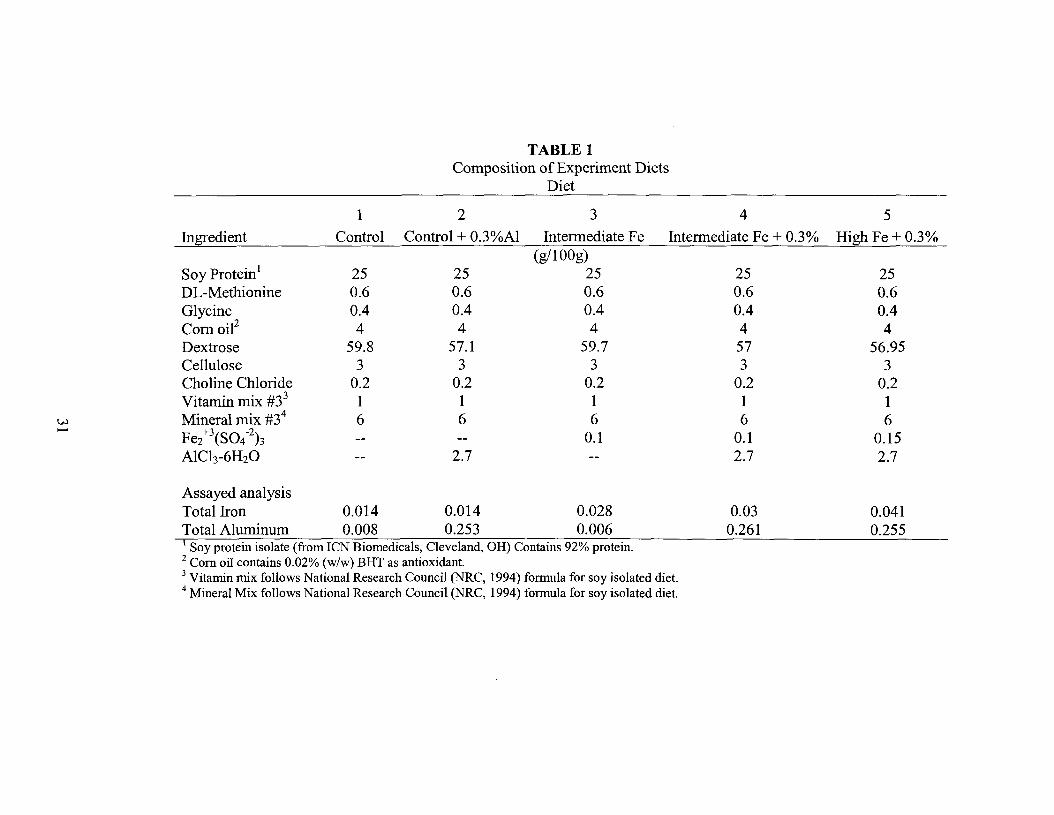
TABLE 1Composition of Experiment Diets
Diet
1 2 3 4 5
Ingredient Control Control + O.3%AI Intermediate Fe Intermediate Fe + 0.3% High Fe + 0.3%(g/100g)
Soy Protein1 25 25 25 25 25DL-Methionine 0.6 0.6 0.6 0.6 0.6Glycine 0.4 0.4 0.4 0.4 0.4Comoie 4 4 4 4 4Dextrose 59.8 57.1 59.7 57 56.95Cellulose 3 3 3 3 3Choline Chloride 0.2 0.2 0.2 0.2 0.2Vitamin mix #33 1 1 1 1 1
w Mineral mix #34 6 6 6 6 6......Fe2+\S04-2)3 0.1 0.1-- -- 0.15AICh-6H2O -- 2.7 -- 2.7 2.7
Assayed analysisTotal Iron 0.014 0.014 0.028Total Aluminum 0.008 0.253 0.0061 Soy protein isolate (from ICN Biomedicals, Cleveland, OR) Contains 92% protein.2 Com oil contains 0.02% (w/w) BRT as antioxidant.3 Vitamin mix follows National Research Council (NRC, 1994) formula for soy isolated diet.4 Mineral Mix follows National Research Council (NRC, 1994) formula for soy isolated diet.
0.030.261
0.0410.255
Experiment 2
Ninety four chicks were randomly assigned to three dietary treatment groups:
intermediate iron (N=30), intermediate iron plus aluminum (N=24), and high iron plus
aluminum (N=24) for four weeks (Table 1). The compositions of the diets were similar
to experiment 1 except for iron content. The intermediate iron diet contained 0.028%
iron and the high iron diet contained 0.042% iron. Fe/3(S04-2)3 was used as the iron
source. The iron and aluminum (0.3% as AICh-6H20) were added to the diet by weight
in place of dextrose. The three groups of chicks were pair-fed their experimental diets for
four weeks as in experiment 1.
SAMPLING AND PROCESSING OF TISSUES
The chicks were killed by carbon dioxide inhalation after an overnight fast and
blood was removed by heart puncture into additive-free vacutainers. Serum was obtained
by centrifugation at 2000 x g for 10 minutes at 4'C and stored frozen (-20'C). The liver
and both kidneys were excised. Upon removal the livers and samples of the right lobe
(0.5-1.0g) were weighed, frozen, and stored at -20'C. Kidneys were kept on ice until
processed as described below.
Kidneys from individual chicks were pooled (N= 3 chicks per pooled sample)
within treatment groups to yield about 6g of tissue per sample. The pooled samples were
fractionated by differential centrifugation into a nuclei/cell debris fraction, mitochondrial
fraction, and post-mitochondrial supernatant following established procedures (Lash and
Sall1993) as described next. The samples were homogenized (Dounce Homogenizer,
Fisher Science) in five volumes of isolation buffer (20 mM Tris-HCI, pH 7.4, 1 mM
32
phenylmethysulfonyl fluoride, 3 mM potassium phosphate, 225 mM sucrose, 5 mM
magnesium chloride, 20 mM potassium chloride) using seven up and down motions.
Aliquots of the homogenate were taken for protein and iron assays. The homogenate was
centrifuged at 600 x g for 10 minutes at 4·C (Avanti® J-301, Beckman Instruments). The
supernatant (la) and pellet fractions (debris pellet) were separated. The debris pellets
were resuspended in 10 ml of isolation buffer, vortexed, and recentrifuged at 600 x g for
10 minutes. The resulting supernatant was combined with supernatant 1a. The washed
debris pellets were mixed with I volume of isolation buffer, vortexed, and an aliquot was
taken for protein and iron assays. Supernatant la was fractionated further by
centrifugation at 15,000 x g for five minutes at 4·C. The resulting supernatant (lb) and
pellet fractions (mitochondria pellet) were separated. The mitochondrial pellets were
resuspended in 10 ml of isolation buffer, vortexed, and recentrifuged at 15,000 x g for
five minutes. The washed mitochondrial pellets were mixed with 1 volume of isolation
buffer, vortexed, and an aliquot taken for protein and iron assays. The supernatant was
combined with supernatant 1b and an aliquot was taken for protein and iron assays. The
remainder ofthis post-mitochondrial supernatant was stored at -80·C for subsequent
ferritin assays.
IRON AND PROTEIN ASSAYS
Liver samples (0.5-1 g), aliquots of serum (3-5 ml), kidney homogenate (3g),
nuclear pellets (10-12 g), mitochondrial pellets (2-4 g), and post-mitochondrial
supernatant (15 ml) were analyzed for iron content by first drying the samples overnight
in a vacuum oven. The next day, the samples were wet-ashed in 2 ml of 50% trace metal
33

grade nitric acid on a hot plate and diluted to 10 ml with 1% HCI. The samples were sent
to the University of Hawaii at Manoa Agricultural Diagnostic Service Center which
measured iron by ICP emission spectroscopy. Iron content in the liver and kidney was
expressed as Ilg Fe/g tissue and in the subcellular fractions as Ilg Fe/g pellet weight or Ilg
Fe/g supernatant. A bovine liver standard reference sample (National Institute of
Standards and Technology, SRM 1577b) prepared the same way as the samples was
assayed for iron to validate procedures. A recovery of 103±5% (n=6) was obtained. Iron
and aluminum contents of experimental diets were also measured by ICP emission
spectroscopy after dry-ashing overnight at 500'C followed by wet ashing, as above, then
diluted to 50 ml with 1% HCI.
The protein content of all fractions was quantified by absorption
spectrophotometry (Shimadzu UV-Visible Recording Spectrophotometer, UV-160) at
750 nm using the Modified Lowry Protein Assay (Pierce Biotechnology, Inc., Rockford,
IL).
FERRITIN PROTEIN AND IRON CONTENT BY NATIVE-PAGE
The post-mitochondrial supernatant was thawed, heat-treated at 100'C for five
minutes, cooled in ice, centrifuged for 30 minutes at 15,000 x g, and the supernatant
concentrated by centrifugal ultrafiltration at 4'C (Centricon 10, Millipore Corporation).
Protein analyses on the concentrated samples were performed using the Bio-Rad protein
assay (Bio-Rad Laboratories, Hercules, CA).
The relative amounts of ferritin protein in the kidney supernatants and the ratio of
ferritin protein to ferritin bound iron were determined from ferritin bands resolved by
34

native-PAGE. Aliquots of concentrated supernatant samples were diluted in equal
volumes of native-PAGE sample buffer (Bio-Rad Laboratories) and loaded onto a
discontinuous polyacrylamide gel (10% acrylamide separating and 4% acrylamide
stacking gel). Equal amounts of supernatant protein from each treatment group were
loaded onto the gels. The proteins were fractionated using a Mini-Protean® 3 vertical
slab gel (Bio-Rad Laboratories) performed at 15 mAmps per gel for 3.5 hours according
to the manufacture's instructions.
Identical gels were run to assay ferritin protein and ferritin bound iron. To
determine relative amounts of ferritin protein, protein bands in the gels were stained with
coomassie (0.0025% coomassie blue R-250, 40% methanol, 7% acetic acid) for 2 hours
and the gel was destained (40% methanol, 7% acetic acid for 1 hour and 7% acetic acid,
5% methanol until clear). Images of gels were taken after destaining using a Flour-S™
Multilmager (Bio-Rad Laboratories) and band intensities were analyzed by Bio-Rad
Quantity One Quantitation Software Version 4.2 (Bio-Rad Laboratories). The location of
the ferritin protein band on the gel was verified by comparison to 5/lg of a horse spleen
ferritin standard (Sigma, St. Louis, MO). Ferritin band intensities were normalized
across different gels by expressing band intensity as a ratio to an internal reference
sample chosen from the intermediate iron group. This reference standard was run on all
gels.
Iron containing protein bands in the gel were visualized using an iron staining
solution consisting ofamixture of 0.75 mM Ferene S (Sigma, St. Louis, MO) and 15 mM
thioglycolic acid in 2% (v/v) acetic acid (Chung 1985). For color development, each gel
was immersed in 50 ml of staining solution for 30 minutes. The gel background could be
35
cleared by destaining in 2% (v/v) acetic acid. Images of gels were taken after 15 minutes
of destaining and band intensities were analyzed using a Flour-S™ Multilmager (Bio-Rad
Laboratories). Locations of ferritin bands on the gel were verified by comparison to 2 I!g
of a horse spleen ferritin standard (Sigma, St. Louis, MO). The intensity of iron staining
was normalized across gels by expressing it as a ratio to the same internal reference
standard used above for protein.
STATISTICAL ANALYSIS
All analyses were conducted using SAS version 8 software (SAS Institute, Cary,
NC). Results were expressed as means ±SD. The effects of dietary treatments on all
measured parameters were analyzed by one-way ANOVA and when the ANOVA
indicated a significant effect (p<O.05), the Tukey's Studentized Range (HSD) test was
used to compare treatment means. Because dietary treatments were found to significantly
affect kidney iron levels and kidney iron is known to affect ferritin synthesis, ferritin
bound iron and the amount of iron in subcellular fractions, we further analyzed these data
using kidney iron as a covariable in an analysis of covariance. This allowed the effects of
aluminum to be analyzed independent of any effects due to kidney iron. Linear
regression analyses of the relationship between kidney iron and serum iron, ferritin
protein, ferritin bound iron, and iron in subcellular fractions were conducted using the
combined data from experiments I and II. One regression line was fit to data from the
AI-treated groups, another line was fit to the data from the non-AI treated groups. The
two regression lines (with aluminum treatment and without aluminum treatment) were
36

compared for treatment effects and differences in slope using analysis of covariance. A
value ofp<0.05 was considered significant in all analyses.
RESULTS
FOOD INTAKE AND BODY WEIGHT GAIN
Table 2 summarizes the data on food intake and body weight gain. Since
aluminum is known to reduce food intake in the chick (Dunn et al. 1993), pair-feeding
was conducted within each experiment to prevent large differences in food intake and
iron intake. Food intake was about 18% lower in experiment II than in experiment I,
apparently due to the combined effects of supplemental iron and aluminum.
Supplemental iron alone was found to reduce food intake, but the group consuming high
Fe plus 0.3% Al ate the smallest amount of food and was the group pair-feeding was
based on. Weight gain was about 37% lower in experiment II (250g vs. 158g) than
experiment I reflecting the reduced food intake and lower gain/food intake ratio of all
groups in experiment II. Within each experiment, aluminum did not have a significant
effect on body weight gain.
WEIGHT OF LIVER, KIDNEYS, AND KIDNEY SUBCELLULAR FRACTIONS
Kidney and Liver
Table 3 shows the effect of dietary iron and aluminum on the weights ofliver,
kidneys, and kidney subcellular fractions. No changes were detected in kidney weight
due to different levels of iron, but the weight increased with aluminum in the diet at the
control and intennediate levels of iron. Kidney weight in the high iron + Al group,
37
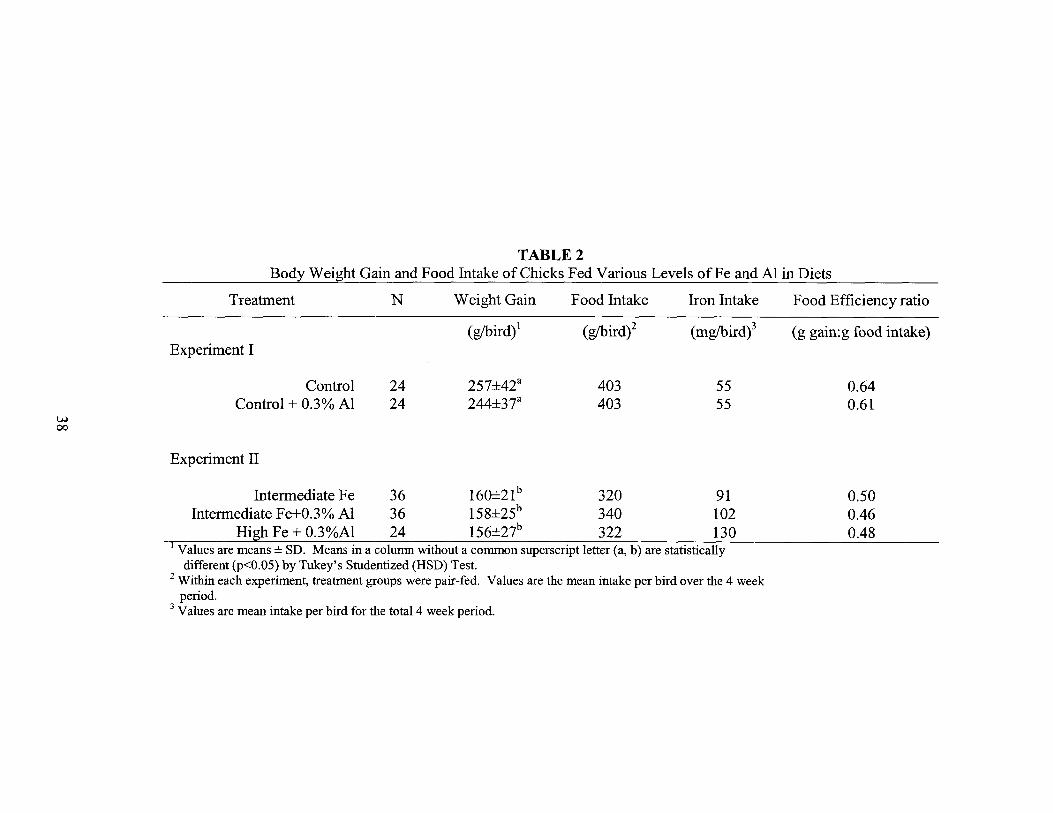
TABLE 2Body Weight Gain and Food Intake of Chicks Fed Various Levels ofFe and Al in Diets
Treatment N Weight Gain Food Intake Iron Intake Food Efficiency ratio
(gibird)1 (gIbird)2 (mglbird)3 (g gain:g food intake)Experiment I
Control 24 257±42a 403 55 0.64Control + 0.3% Al 24 244±37a 403 55 0.61
w00
Experiment II
Intermediate Fe 36 160±21b 320 91Intermediate Fe+0.3% Al 36 158±25b 340 102
High Fe + 0.3%Al 24 156±27b 322 130I Values are means ± SD. Means in a column without a common superscript letter (a, b) are statistically
different (p<O.05) by Tukey's Studentized (HSD) Test.2 Within each experiment, treatment groups were pair-fed. Values are the mean intake per bird over the 4 week
period.3 Values are mean intake per bird for the total 4 week period.
0.500.460.48

TABLE 3Effects of Dietary Iron and Aluminum Intake on Kidney Weight, Liver Weight, and the Weight and Protein Concentration of Kidney Subcellular Fractions l
Kidney Subcellular Fractions
lValues are means ±SD (n=7 for Control and Control+AI, n=8 for High Fe+AI, n=12 for Intermediate Fe and Intermediate Fe+AI).without a common superscript letter are significantly different (p<O.05).
2 Weight of both kidneys (pooled from 3 chicks divided by 3)3 % of kidney homogenate weight4mg protein/g wet weight of fraction
Weight Protein Weight Protein
(%)3 (mg/g)4 (%)3 (mg/g)4
11.8±1.rb 36.9±1.2a 3.9±O.9a 60.3±7Aa
12.0±lAb 37.3±1.8ac 4.l±O.3a 62.3±5Aa
11.5±O.6ab 41.3±1.2b 3.6±OS 64.4±4.7a
9.5±O.3c -- 5.5±O.7b
10A±O.3ac 39.5±1.7bc 4.2±OAa 65.2±2.8a
Kidney Weight Liver Weight
Diet Weighr% Body
Weight% Body
Weight Weight
(g) (%) (g) (%)
Control 2.O±O.2a O.7±O.la 6.5±O.7a 2.3±O.2a
Control + Al 2.8±OAb 1.0±O.lb 6A±1.0a 2.3±O.l ab
w Intermediate Fe 1.9±O.la 1.0±O.lb 5.0±O.lb 2.5±O.lbd\.Q
Intermediate Fe + Al 3.2±OAc 1.6±O.lc 6.5±O.9a 3.3±O.2c
High Iron + Al 1.9±O.2a 1.0±O.lb 5.0±O.5b 2.6±O.2d
Debris Pellet Mitochondrial Pellet Supernatant
Weight Protein
(%)3 (mg/g)4
84.3±1.3ab 9.7±1.2a
83.9±1.2b 10.9±O.8a
84.8±O.3ab 9.8±O.8a
85.O±O.6ab
85A±O.3a 9.7±O.7a
--
Means in a column

however, was not greater than the control group. This suggests that a high level of iron in
the diet counteracted the effect of aluminum on increasing kidney weight. Similar results
were found when kidney weight was expressed as % ofbody weight.
The weight of the liver was significantly reduced as the level of dietary iron
increased, possibly due to the smaller weight gain in experiment II since liver weight
expressed as % body weight was minimally effected by iron intake. Aluminum had no
effect on liver weight at the control level of iron intake, but increased liver weight at the
intermediate level. In the high iron + Al group the livers were again smaller. This
implied, as in the kidney, that aluminum may increase liver weight and that a high level
of iron counteracts the effects of aluminum.
Subcellular Fractions
Overall, neither increased iron intake nor aluminum intake greatly altered the
subcellular composition ofthe kidney (Table 3). Therefore, even though aluminum
increased kidney weight, it did not alter the composition of the kidney, nor did it alter the
protein content of the subcellular fractions.
IRON CONTENT OF SERUM, LIVER, KIDNEYS, AND KIDNEY
SUBCELLULAR FRACTIONS
Serum, Liver, and Kidneys
There was an increase in the concentration of iron in the liver and kidneys as the
iron concentration in the diet increased from control to intermediate levels (Table 4).
Adding aluminum to these diets, however, greatly reduced iron concentrations and
40
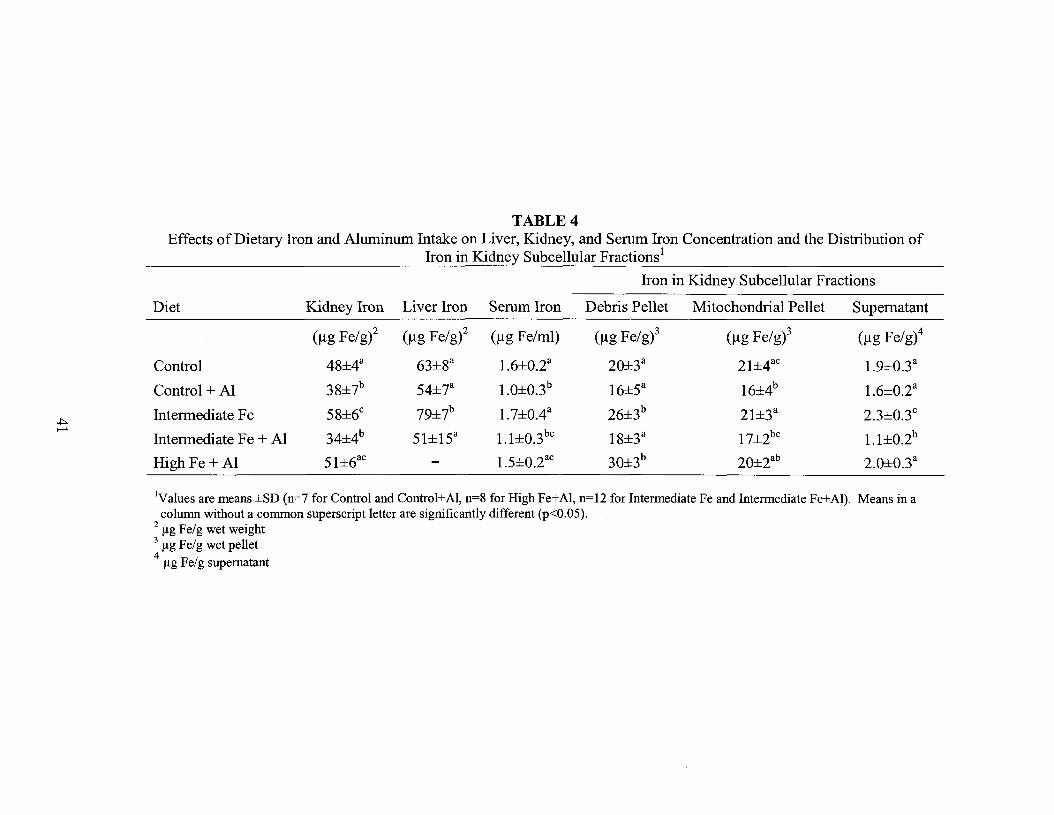
TABLE 4Effects of Dietary Iron and Aluminum Intake on Liver, Kidney, and Serum Iron Concentration and the Distribution of
Iron in Kidney Subcellular Fractions l
Iron in Kidney Subcellular Fractions
Diet Kidney Iron Liver Iron Serum Iron Debris Pellet Mitochondrial Pellet Supernatant
(Ilg Fe/g)2 (Ilg Fe/gi (Ilg Fe/ml) (Ilg Fe/g)3 (Ilg Fe/g)3 (Ilg Fe/g)4
Control 48±4a 63±8a 1.6±O.2a 20±3a 21±4ac 1.9±O.3a
Control + Al 38±7b 54±7a 1.0±O.3b 16±5a 16±4b 1.6±O.2a
.J:>. Intermediate Fe 58±6c 79±7b 1.7±OAa 26±3b 21±3a 2.3±O.3c
.......34±4b 51±15a 1.1±O.3bc 18±3a 17±2bc 1.1±O.2bIntermediate Fe + Al
High Fe + Al 51±6ac - 1.5±O.2ac 30±3b 20±2ab 2.O±O.3a
IValues are means ±SD (n=7 for Control and Control+AI, n=8 for High Fe+AI, n=12 for Intermediate Fe and Intermediate Fe+AI). Means in acolumn without a common superscript letter are significantly different (p<O.05).
2 flg Fe/g wet weight3 flg Fe/g wet pellet4
flg Fe/g supernatant
prevented the increase in tissue iron except in the high iron + Al group. Aluminum also
reduced serum iron concentrations, except in the high iron + Al group. This suggests that
reduced tissue iron may be related to reduced serum iron, and that high dietary iron
counteracts the ability of aluminum to reduce serum and tissue iron levels.
The effect of aluminum on the relationship between serum iron and kidney iron
was investigated using analysis of covariance on the combined data from experiments I
and II (Figure I). Serum iron was used as the covariable. The results showed that kidney
iron was significantly related to serum iron only in the aluminum treated group
(p=O.OOOI) with the slope being significantly larger than the iron group (slope p=O.03).
However, when just the data representing normal serum iron levels (above 1.25/lg/ml)
were compared (Figure 1, inset), there was no longer a difference in slope due to
aluminum, and no significant treatment effect due to aluminum was found. Therefore,
the regression lines were not different over this range of serum iron. This indicates that
above 1.25/lg Fe/ml serum, aluminum was not altering the relationship between serum
iron and kidney iron content. If aluminum is not directly affecting the uptake of serum
iron into the kidney, it suggests that decreases in kidney iron concentrations may be the
result of low serum iron levels possibly brought about by aluminum inhibiting intestinal
iron absorption. When dietary iron is high enough, it overcomes the inhibitory effect of
aluminum on iron absorption, and normal serum iron concentration and tissue levels are
obtained.
42
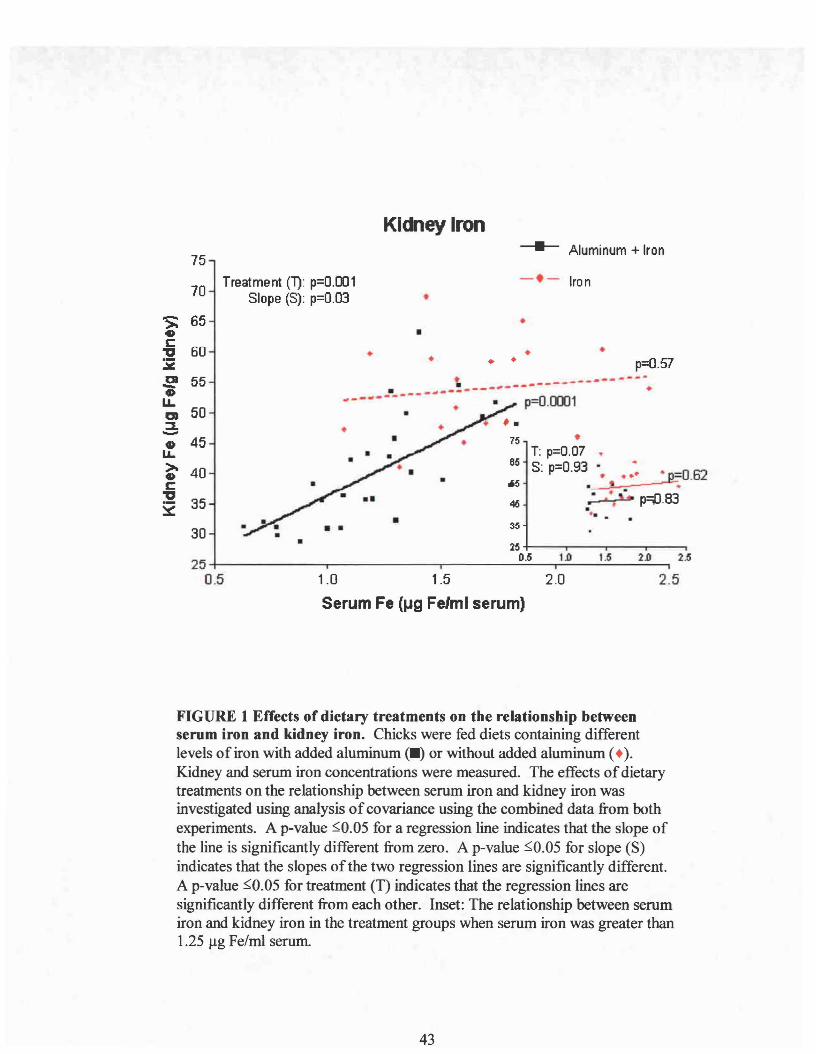
75
70 Treatment (1): p=0.OO1Slope (S): p=O.03
Kidney Iron
•
----- Aluminum + Iron
2.5
2.0 2.5
p=O.57
1.5
•
0. ,tk n=n 83·... '" ~.... .
•T: p=O.07 •S: p=0.93 •
p=0.OOO1
•
•
25 +--....,-----r-----,------,0.5 1.0
• •••
•_.- .-_.--------. _.----------- .----------
1.0 1.5 2.0
Serum Fe (IJQ Fe/ml serum)
•30
250.5
'>; 65G
i 60:x~ 55..LLa 50:l.-G 45u.
~ 40I::
" 35::s::
FIGURE 1 Effects of dietary treatments on the relationship betweenserum iron and kidney iron. Chicks were fed diets containing differentlevels of iron with added aluminum (.) or without added aluminum (• ).Kidney and serum iron concentrations were measured. The effects ofdietarytreatments on the relationship between serum iron and kidney iron wasinvestigated using analysis ofcovariance using the combined data from bothexperiments. A p-value ~O.05 for a regression line indicates that the slope ofthe line is significantly different from zero. A p-value ~O.05 for slope (8)indicates that the slopes of the two regression lines are significantly different.A p-value ~O.05 for treatment (T) indicates that the regression lines aresignificantly different from each other. Inset: The relationship between serumiron and kidney iron in the treatment groups when serum iron was greater than1.25 Jlg Fe/ml serum.
43
Subcellular Fractions
Debris Pellet. The level of iron in the debris pellet increased as the level of iron in the
diet and the concentration of iron in the kidney increased (Table 4). This indicated that
debris pellet iron concentrations were related to kidney iron content. Therefore, to
analyze the effects of aluminum on debris pellet iron concentrations independent of
aluminum's effect on kidney iron, analysis of covariance was used. Debris pellet iron
was plotted (as a dependent variable) against kidney iron content, and regression lines
fitted to the data from aluminum-treated and non-treated (iron) groups were compared
(Figure 2A).
The results indicated that debris pellet iron was significantly correlated with
kidney iron in both the aluminum treated (p<O.OOOI) and non-treated groups (p<0.0001).
The slope of the regression line was greater, however, for the AI-treated group (slope
p=0.028). This indicates that aluminum increased the rate of accumulation of iron in the
debris pellet resulting in higher concentrations of iron in this fraction, especially when
kidney iron content was in the higher range (e.g. above 50 /lg/g).
Mitochondrial pellet. Increasing the iron level in the diet did not affect the
concentration of iron in the mitochondrial pellet (Table 4). The mean iron concentration
in the mitochondrial fraction was reduced, however, by adding aluminum to the control
and intermediate iron diets, but this may have been related to the low concentration of
kidney iron in these groups (Table 4). When analyzed by analysis of covariance (Figure
2B) no difference was found between groups with and without aluminum in the
relationship of mitochondrial iron to kidney iron (slope p=0.24, treatment p=0.199).
44
FIGURE 2 Effects of dietary treatments on the relationship between kidney ironand the concentration of iron in the debris pellet, mitochondrial pellet, andsupernatant. Chicks were fed diets containing different levels of iron with or withoutadded aluminum. The debris pellet, mitochondrial pellet, and supernatant fractions wereisolated from the kidney and iron levels were measured in each fraction. The relationshipbetween kidney iron and the iron in each subcellular fraction was investigated usinganalysis ofcovariance on the combined data from both experiments. (A) Effects ofdietary treatments [(iron (.) or iron + AI (.))] on the relationship between kidney ironand debris pellet iron. (B) Effects ofdietary treatments on the relationship betweenkidney iron and mitochondrial pellet iron. Inset: the regression line fitted to thecombined data from both the iron and iron + Al groups. (C) Effects ofdietary treatmentson the relationship between kidney iron and supernatant iron concentration. A p-value~O.05 for the regression line, slope (S) and treatment (T) indicate respectively: that theslope ofthe line is different from zero, that the slope ofthe two lines are significantlydifferent from each other, and that the two regression lines are significantly different.
45

A. Debris Pellet
•
•
p=O.lDJ1
--.- Aluminum + Iron
..• •.. p=O.COl1..... _.....-
~ ..•-~ ..-.-. .. ...-..'.. ' .
- • • • .-.t'.~ .'
-.- .
Treatment: p=O.COl1Slope: p=O.03'='CD-CD
IL30m--CD~
~-c 20D.:~.aCD
Q 10
25 30 35 40 45 50 55 60Kidney Iron (pg Fe/g kidney)
65 70
B. Mitochondrial Pellet30
..•••
..
:.-~!-'~.~t'!;J-.~:;: .....-;•.~ p=O.cJX11~: :{..... "'4 ..
:a
• .0 .. u .. P=O·~.~--1FO.48.__......-~...--_.. .... ..
..
Treatment: p=O.20Slope: p=O.24
10
6535 40 45 50 55 60Kidney Iron (pg Fe/g kidney)
305+----r--...----.-----,---.-----r--...----.-----,
25
c. Supernatant3.0
'=' 2.5C CoS.. ta:: E 2.0c: CD
Se!-i -i 1.6
=~Cl)m
.= 1.0
Treatment: p=O.£l3Slope: p=O.27 _e=o.COl1.. ,.--
.. p=O.lllJ1
706535 40 "I) 50 55 60Kidney Iron (pg Fe/g Iddneyt
300.5+----r--...----.-----,---.-----r--r----.-----,
25
41\
Therefore, a regression line was fit to the combined data from all groups (Figure 2B
inset). The resulting slope indicated that mitochondrial iron had a small positive
relationship to kidney iron (p=O.OOOl) suggesting that the effects on mitochondrial iron
seen in Table 4 are not due to AI, but due to the changes in kidney iron concentrations.
Supernatant. The concentration of iron in the supernatant increased with the level of
iron in the diet and the level of iron in the kidney (Table 4). Adding aluminum to the
diets appeared to reduce supernatant iron, but this was found by analysis of covariance to
be related to the reduced kidney iron content in the aluminum groups (Figure 2C).
Supernatant iron was positively related to kidney iron in both the non-treated and AI
treated groups (p=O.OOOl), but aluminum had no significant effect on this relationship
(slope p=0.27, treatment p=O.08). This suggests that changes in supernatant iron are due
to changes in kidney iron and not direct effects of aluminum.
KIDNEY FERRITIN AND FERRITIN BOUND IRON
Representative native PAGE gels illustrating the assay for the relative amounts of
ferritin bound iron and ferritin protein in kidney supernatant fractions are shown in
Figures 3A and 3B, respectively. Shown are band intensities for 4 samples from the
intennediate iron group (samplesl-4) and 4 samples from the intennediate Fe + Al group
(samples 5-8). The same samples were run on gels A and B. Band intensities on both
gels were expressed as a ratio to the band intensity of sample #1 (the reference sample for
all gels). Also shown in Figure 3B is the ratio of ferritin bound iron to ferritin protein
expressed as the band intensity for ferritin iron divided by the band intensity for ferritin
47
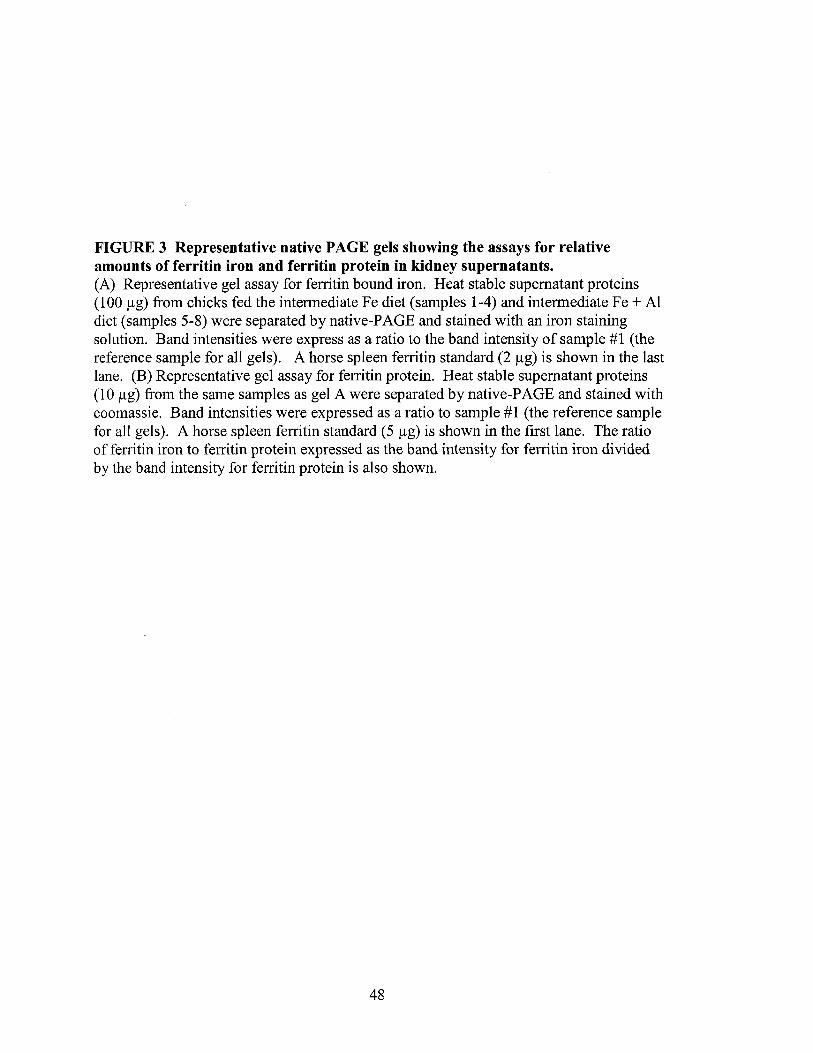
FIGURE 3 Representative native PAGE gels showing the assays for relativeamounts of ferritin iron and ferritin protein in kidney supernatants.(A) Representative gel assay for ferritin bound iron. Heat stable supernatant proteins(100 flg) from chicks fed the intermediate Fe diet (samples 1-4) and intermediate Fe + Aldiet (samples 5-8) were separated by native-PAGE and stained with an iron stainingsolution. Band intensities were express as a ratio to the band intensity of sample #1 (thereference sample for all gels). A horse spleen ferritin standard (2 flg) is shown in the lastlane. (B) Representative gel assay for ferritin protein. Heat stable supernatant proteins(10 flg) from the same samples as gel A were separated by native-PAGE and stained withcoomassie. Band intensities were expressed as a ratio to sample #1 (the reference samplefor all gels). A horse spleen ferritin standard (5 flg) is shown in the first lane. The ratioof ferritin iron to ferritin protein expressed as the band intensity for ferritin iron dividedby the band intensity for ferritin protein is also shown.
48
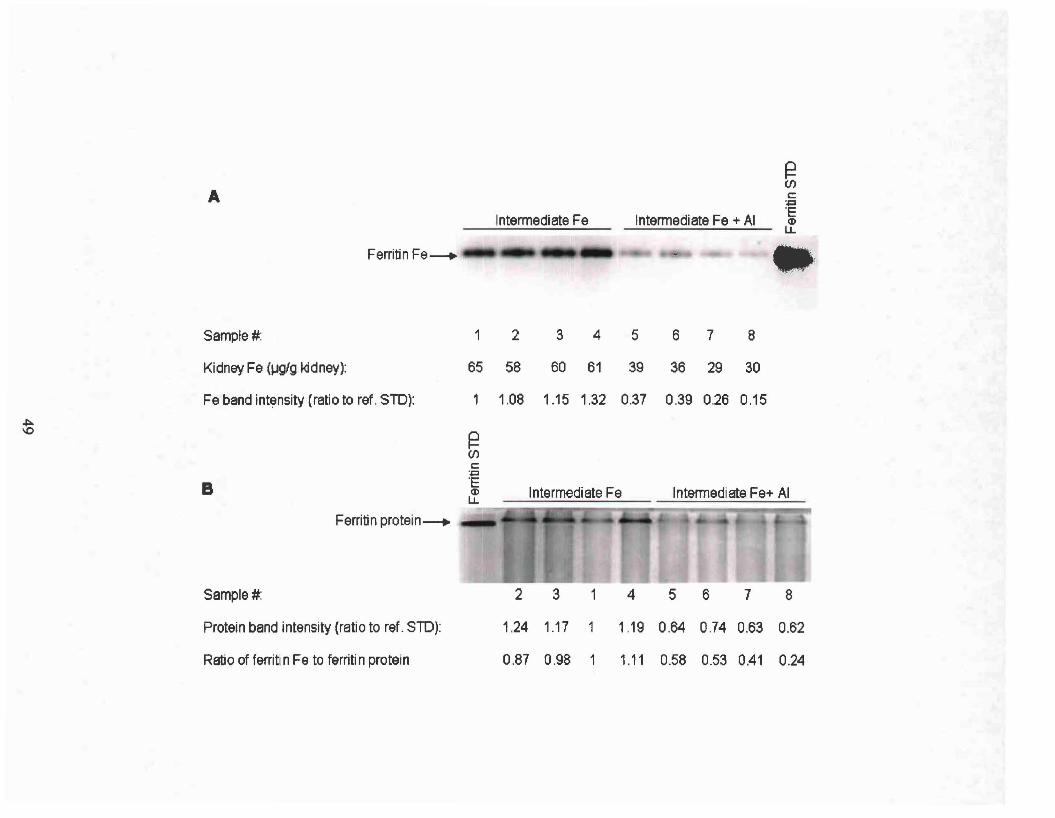
Ferritin Fe----+- oo
: t c.~ '~lt··5
AIntermediate Fe Intermediate Fe + AI
~(j)c:.~
'E(I)
LL
•. "C- .
Sample#: 1 2 3 4 5 6 7 8
Kidney Fe (lJglg kidney): 65 58 60 61 39 36 29 30
Fe band intensity (ratio to ref. STO): 1 1.08 1.15 1.32 0.37 0.39 0.26 0.15
~\0
~(j)c:.~
B 'EIntermediate Fe Intermediate Fe+ AIQ)
Ll.
Ferritin protein----+
1.24 1.17 1.19 0.64 0.74 0.63 0.62
Sample#:
Protein band intensity (ratio to ref. STD):
2 3 1 4 5 6 7 8
Ratio of ferritin Fe to ferritin proteIn 0.87 0.98 1 1.11 0.58 0.53 0.41 0.24

protein. These measurements were made on gels from all treatment groups and the
results are summarized in Table 5, and Figures 4-6 (individual gels are shown in
Appendix A).
The intermediate iron diet was found to increase kidney ferritin-bound iron 200%
relative to controls, while ferritin protein increased only 64% (Table 5). This resulted in
a 100% increase in the ratio of ferritin-bound iron to ferritin protein due to increased
levels of iron in the kidney. Aluminum appeared to reduce ferritin protein, ferritin-bound
iron, and ferritin iron to protein ratios in Table 5, especially at the intermediate iron level.
However, since kidney iron affects ferritin protein and ferritin iron levels, the effects of
aluminum on these parameters were investigated further by analysis of covariance using
kidney iron as the covariable (Figures 4-6).
Aluminum did not have an effect on the rate of increase in ferritin protein as
kidney iron increased (Figure 4). However, aluminum did affect the amount of iron
incorporated into ferritin (Figure 5). As kidney iron increased, the rate of increase in
ferritin iron was significantly less in the AI-treated group compared to the group without
Al (slope p=O.OOl, Figure 5A). When only the data from animals with kidney iron above
40llg/g were used in the analysis (to more directly compare the response over the range
where kidney iron levels were the same between treatments) the slopes became the same,
i.e., were parallel (Figure 5A, inset). However, there was a treatment effect indicating
that the regression lines were different and that, at the same concentration ofkidney iron,
less iron was taken up into ferritin in the aluminum group. This inhibiting effect of
aluminum on ferritin iron accumulation was also apparent when supernatant iron
concentrations were used as the covariable instead of kidney iron concentrations (Figure
50

TABLESEffects ofDietary Iron and Aluminum Intake on Ferritin Bound Iron, Ferritin Protein, and the Ratio of
Ferritin Bound Iron: Ferritin Protein in Chick Kidneyl
Relative Ferritin Relative Ferritin Ferritin Iron:Diet Bound Iron Levels2 Protein Levels3 Ferritin Protein4
Control O.31±O.OSab O.64±O.16a O.46±O.14bc
Control + Al O.lS±O.OSb O.S2±O.23a O.2S±O.lc
Intermediate Fe O.9S±O.24c 1.0S±O.OSb O.93±O.24a
Vl Intermediate Fe + Al O.43±O.14a O.66±O.19a O.61±O.27b.......
High Fe + Al O.43±O.lSa O.97±O.lb O.42±O.17bc
1 Values are means ±SD (n=7 for Control and Control+AI, n=8 for High Fe+AI, n=12 for IntermediateFe and Intermediate Fe+AI). Means in a column without a common superscript letter are different (psO.05).
2 Ratio of sample band intensity to reference sample band intensity (reference sample was from theIntermediate Fe group).
3 Ratio of sample band intensity to reference sample band intensity (reference sample was from theIntermediate Fe group).
4 The band intensity ratio for ferritin iron divided by the band intensity ratio for ferritin protein.
A Ferritin Protein
•• •
••
•
Treatment (1): p=O.98Slope (S): p=O.67
•
---- Aluminum + Iron
p=O.03• 1#"-
• :........... -p;O.02. ..-•
•.. .
• ••
65 15
• ••
•
211T: p=O.78
Hi S: p=O.78
111
OS
01125 J5 tS 55
••
2.0
-o!~ 1.5.=:1ii~c: 1.0..-fQ.
ci:i 0.5"ElDLL
-t- Iron
757040 45 50 55 60 65
Kidney Fe (lJg Fe/g kidney)
350.0 +--""T"'""----r----,------r--r---,...---r--"""T'"---,.--.,
25
FIGURE 4 Effects of dietary treatments on the relationship betweenkidney iron and ferritin protein. Chicks were fed diets containingdifferent levels of iron with or without added aluminum. Ferritin proteinlevels in kidney supernatant fractions were determined by native PAGEand plotted against kidney iron levels. The effects ofdietary treatmentson the relationship between kidney iron content and ferritin protein levelswere analyzed by analysis ofcovariance using the combined data fromboth experiments. A p-value ::;;0.05 for the regression line, slope (8) andtreatment (T), indicate respectively: that the slope ofthe line issignificantly different from zero, that the slopes of the two lines aresignificantly different from each other, and that the two regression linesare significantly different.
52
FIGURE 5 Effects of dietary treatments on the relationship between kidney ironand ferritin bound iron. Chicks were fed diets containing different levels of iron withor without added aluminum. Ferritin bound iron concentrations were measured in thekidney supernatant fractions by native PAGE and plotted against kidney iron levels. (A)Effects of dietary treatments on the relationship between kidney iron and ferritin boundiron analyzed by analysis of covariance using the combined data from both experiments.Inset: the relationship between kidney iron and ferritin iron when kidney iron was above40ug Fe/g kidney. (B) Effects of dietary treatments on the relationship between kidneysupernatant iron concentration and ferritin bound iron. Inset: the relationship betweensupernatant iron and ferritin iron when supernatant iron was above 1.4 Ilg Fe/gsupernatant. A p-value sO.05 for the regression line, slope (S) and treatment (T) indicaterespectively: that the slope of the line is different from zero, that the slope of the twolines are significantly different from each other, and that the two regression lines aresignificantly different.
53

--- Aluminum + Iron
A Ferritin Iron
2D
•
T: p=O.051.5 S: p=O.12
75
p=O.OOO1
70
Treatment (1'): p=O.12Slope (S): p=O.OO1
• ••
35 40 45 50 55 60 65
Kidney Iron (J.Ig Felg kidney)
• p=O.OOO1... ,-'............ ...~~.13
1D
0.5
I:0.!:i 0.5
•••
• •LL • •0.0
25 30
2.0
'0_ 1.5
!•:.'Iii-. 1.0~
B Ferritin Iron
2.0 2.0
p=O.OOO2
•p=O.95
••
Treatment (1): p=O.05Slope (8): p=O.OO2
•
• • ..-"'~'" ......-~"'..."
• ~rI' •.......1-#'"
..... .
•
.• •• •••
••
••
.4. e=O.OO1
.··t...~ "". p=O.17..J..~.
;~ ...1.5 2D 2.5 3D
•
.•• •
1DDJl+---.---.---r-.........._--.
0.5
T: p=O.051.5 S: p=O.41
'0- 1.0! 1.5• 0.6:>
'Iii..~1.0
I:,g
3.01.0 1.5 2.0 2.5
Supernatant Fe (ug Felg supernatant)
0.0 +---------r-----r---------r----.,------,0.5
54
FIGURE 6 Effects of dietary treatments on the relationship between kidney ironand the ratio of ferritin iron to ferritin protein. Chicks were fed diets containingdifferent levels of iron with or without added aluminum. The ratio of ferritin bound ironto ferritin protein in kidney supernatant fractions was determined by native PAGE andplotted against kidney iron levels. (A) Effects of dietary treatments on the relationshipbetween kidney iron and the ratio of ferritin iron: ferritin protein analyzed by analysis ofcovariance using the combined data from both experiments. Inset: the relationshipbetween kidney iron and the ratio of ferritin iron: ferritin protein when kidney iron wasabove 40 Ilg Fe/g kidney. (B) Effects of dietary treatments on the relationship betweenkidney supernatant iron and the ratio of ferritin iron: ferritin protein. Inset: therelationship between supernatant iron and the ratio of ferritin iron: ferritin protein whenthe kidney supernatant iron concentration was above 1.4 Ilg Fe/g supernatant. A p-valuesO.05 for the regression line, slope (S), and treatment (T) indicate respectively: that theslope of the line is significantly different from zero, that the slopes of the two lines aresignificantly different from each other, and that the two regression lines are significantlydifferent.
55

A Ratio of Ferritin Iron to Ferritin Protein
2.5 2S T: p=O.02 Aluminum + Iron:l:D s: p=O.071.5 -t- Iron
2.0 ID• : .•• p=O.OOO1.. '- ~,-..; .
.5 ...-i< II ~.p=O.42 Treatment (1): p=O.17D Slope (S): p=O.OO2
1.5 25 35 is 95 liS 15
..
..••
••
•
35 40 45 50 55 60 65 70 75Kidney Fe (lJ.g Felg kidney)
p=O.OOO3. ~~.".... .'"...'"", .. a. ."........ ,.,.... ........ .~-". ..-------=-....~-------- p=O 98.. . - ... ..••
• •lLc 0.5 -E~ • • •• •lL
0.025 30
o:Q..0::c
~0..c
~•lL 1.0
B Ratio of Ferritin Iron to Ferritin Protein
p=O.27
•
Treatment (1): p=O.llJSlope (S): p=O.oJ1
2.5 3.D
••
•
•
....p=O.OO03..~ .. ~, ..
':. _.-...~.~··p=O.37.-;>-,-
•. ..• ..••• p=O.OO1
."","....-.-.. .- ... -.... ""'~ ... . ~ .~--~;-:;.~~ ..• r-
•_ "';J .... .,: • ___
• • •
t.s
Oll +---,---,--.,.--.---..05 1.0 U 211
0.5
•lL~ 0.5
E•lL
o 2.5 25 T: p=O.01"Ii 211 s: p=O.160::~ 2.0 1lI
i...0..C 1.5
~•lL 1.0
3.01.0 1.5 2.0 2.5
Supernatant Fe (ug Fe/g supernatant)
O.O+------.-------y-----r------.-----,0.5
56

5B). Supernatant iron was used since it is presumably the source of ferrous ions for
uptake into cytosolic ferritin.
Since aluminum reduced iron uptake into ferritin, we also investigated the effect
of aluminum on the ratio of ferritin iron to ferritin protein (Figure 6). In the groups
without aluminum, the iron to protein ratio increased as kidney iron increased.
Aluminum, however, was found to reduce the iron to protein ratio in ferritin. This result
is analogous to aluminum's effect on iron uptake into ferritin and was also present when
supernatant iron was used as the covariable (Figure 6B).
DISCUSSION
This study demonstrated that dietary aluminum toxicity can negatively impact
iron metabolism in ways that could impair cell function, and that the effects differ
somewhat from those seen in cell culture studies. Dietary aluminum reduced iron
concentrations in tissues (serum, liver, and kidneys). When effects due to reduced tissue
iron were corrected for, aluminum was found to inhibit iron uptake into ferritin, but did
not alter total iron concentrations in the cytosol or ferritin protein levels. In contrast, cell
culture studies indicate that aluminum increases cellular iron concentrations, reduces both
ferritin protein levels and ferritin iron uptake, and causes iron to be partitioned out of the
cytosol accumulating in mitochondria and nuclei (Abreo et al. 1994, 1999, and
Yamanaka et al. 1999). These contrasting findings suggest that cell culture studies may
not fully reflect the effects of dietary aluminum toxicity in vivo. The possible reasons
behind these contrasting findings will be discussed below, as well as the potential
57
mechanisms for the effects of aluminum on Iron metabolism III VIVO and their
significance.
Our results indicate that high intakes of aluminum most likely decrease tissue iron
levels because aluminum inhibits non-heme iron absorption by the intestine. Non-heme
iron (ferric sulfate) was the only source of dietary iron used in our study. A reduction in
non-heme iron absorption would reduce serum iron levels and, therefore, delivery of iron
to tissues. Cell culture studies would not be exposed to this effect. Apparently, reduced
delivery of iron to tissues outweighed any stimulatory effect aluminum may have had on
transferrin receptor expression and tissue iron uptake shown to occur in tissues based on
cell cultures studies (Abreo et al. 1999 and Yamanaka et al. 1999).
We did not measure intestinal iron absorption directly, so our conclusion that
dietary aluminum inhibits non-heme iron absorption is based on the fact that there are
few apparent reasons, other than reduced iron absorption, for serum iron to be low. Other
causes of reduced serum iron are excessive iron loss from the body, an expanded plasma
volume, and increased uptake of serum iron into tissues or erythrocytes. Our data do not
support increased tissue uptake of iron since liver and kidney iron concentrations were
reduced by aluminum and previous studies in the chick suggest that intestinal iron levels
are also reduced by dietary aluminum (Han et al. 2000). With respect to iron loss from
the body, the only significant route of iron loss is blood loss, which was not seen in this
study. In regard to increased plasma volume, aluminum toxicity is known to cause
microcytic anemia and reduced hematocrits by mechanisms involving reduced heme
synthesis (Nayak 2002). Reduced size and numbers of erythrocytes could be associated
with increased plasma volumes and decreased serum iron concentrations. However, in
58
order to cause serum iron to decrease by 33% (from 1.6J.lg/mL to 1.0J.lg/mL) as seen in
this study, plasma volume would have to increase by 60%. This large increase in plasma
volume seems unrealistic and, therefore, we are left to conclude that aluminum intake
inhibits non-heme iron absorption causing reduced serum and tissue iron contents.
The mechanism by which aluminum might inhibit non-heme iron absorption is
not known. The fact that serum iron was not reduced when high iron plus aluminum
diets were fed suggests that high dietary iron can overcome the inhibitory effects of
aluminum on iron absorption. This could result from competition between the metals for
binding to iron transporters or oxidation/reduction enzymes in enterocytes that are
required in the iron absorption process. Previous studies indicate that dietary aluminum
reduces the amount of iron that accumulates within intestinal mucosal cells when a high
iron diet is fed (Han et al. 2000). This suggests that aluminum prevents dietary iron from
entering the enterocytes, and may indicate that aluminum competes with iron for uptake
by the brush border divalent metal ion transporter 1 (DMT 1) or access to the ferric
reductase needed to convert Fe+3 to Fe+2 prior to DMT 1 transport. Alternatively, high Al
concentrations in the enterocytes may damage or down regulate components of the iron
transport system (e.g., DMT1). High iron diets may mitigate this effect because high
levels of iron in the intestinal lumen or a higher body iron status may inhibit the intestinal
absorption of aluminum (Cannata et al. 1991) and prevent aluminum from reaching toxic
concentrations in the enterocytes that would disrupt iron absorption.
Our hypothesis that aluminum reduces iron absorption is consistent with other
studies where reduced tissue iron levels were found in experimental animals fed
aluminum. Nasiadek and Chmieknicka (2000) observed a decrease in iron concentrations
59
III the spleen, erythrocytes, and blood of rats orally administered AICh and FeCh
together. Ecelbarger and Greger (1991) reported a 40% reduction in apparent iron
absorption in rats fed aluminum hydroxide In further support of our view, Alvarez
Hernandez et al. (1994) found that aluminum loading of intestinal-derived Caco-2 cells
inhibited iron transport, and Kooistra et al. (1998) reported 59Fe absorption was reduced
in iron-deficient hemodialysis patients when co-ingested with aluminum hydroxide. Not
all studies, however, have found that oral aluminum reduces tissue iron levels (Morgan &
Redgrave 1998 and Turgut et al. 2004). This may be due to the amount or species of
aluminum compound used as well as the form of iron in the diet. In our studies,
relatively high levels (0.3% AI) of a soluble inorganic form of aluminum (AICh) were
fed with ferric iron. The high ratio of AI+3: Fe+3 in our diets may promote AlxFe
interactions in the intestine more than lower ratios, or organically bound forms of
aluminum (e.g., aluminum citrate), or when ferrous or heme iron constitute the iron
source. In addition, our studies were done in rapidly growing chicks which may put a
larger demand on iron absorption to supply tissue iron than in adult or slower growing
animals. Further studies are needed to determine the mechanisms and extent of
aluminum's potential to inhibit intestinal iron absorption.
In contrast to studies using oral aluminum administration, aluminum toxicity
produced by intraperitoneal injections has been shown to increase tissue iron levels
(Abreo et al. 1994 and Ward et al. 2001) and reduce serum iron (Farina et al. 2002).
These effects are consistent with aluminum-loaded cell culture studies that show
increased cellular uptake of transferrin-bound iron due to increased transferrin receptor
expression (Abreo et al. 1994, 1999, Perez et al. 2001, and Yamanaka et al. 1999).
60
Therefore, it appears that the route of aluminum exposure influences aluminum's effect
on tissue iron content. In the absence of dietary aluminum-induced reductions III
intestinal iron absorption and serum iron concentrations, intraperitoneal injections of
aluminum may enhance cellular iron uptake from the serum possibly by increased
transferrin receptor expression, as supported by cell culture studies.
In addition to aluminum decreasing iron concentrations III the kidney, we
observed that the aluminum-treated control and intermediate Fe groups had heavier
kidneys. The composition of the kidney weight, however, was not greatly effected by
aluminum since the distribution of weight among the subcellular fractions was similar
among groups. How aluminum can increase the weight of the kidney is not known. The
kidney weight in the high Fe + Al group was not significantly different from the
nontreated groups, nor was kidney iron concentration. This may suggest that normalizing
iron concentration, or limiting aluminum absorption by high iron intakes, could prevent
aluminum-induced increases in kidney weight. Gomez et al. (1997) also found that
aluminum intake increased kidney weight in rats, but the mechanism for this effect was
not discussed.
Although neither dietary iron nor aluminum greatly altered the subcellular
composition of the kidney, they did effect the accumulation of iron in these fractions. As
dietary iron intake and kidney iron increased, the concentration of iron in the debris
fraction and supernatant increased several fold. Much smaller increases were found in
mitochondrial iron. Adding aluminum to the diets significantly increased the rate of
accumulation of iron in the debris pellet, but had no effect on supernatant or
mitochondrial iron accumulation (Figure 2). The lack of an effect of aluminum on
61
supernatant and mitochondrial iron concentrations have implications for the regulation of
ferritin protein synthesis and will be discussed below. The accumulation of iron in the
debris pellet may imply increased uptake by nuclei, a major component of this fraction,
but our data do not indicate where this additional iron came from since both supernatant
iron and iron in the mitochondrial fraction were not reduced by aluminum. However,
accumulation of iron in the debris pellet agrees, in part, with results from cell culture
studies. Aluminum-loaded erythroleukemia cells exposed to 59Fe-transferrin showed
increased accumulation of 59Fe in both the nuclear and mitochondrial fractions (Abreo et
al. 1994).
The accumulation of iron in the debris pellet could increase the risk of oxidative
stress in this subcellular fraction. The debris pellet contains unbroken cells and nuclei.
The nuclei produce the important information molecules DNA and RNA. Reactive or
"free" iron that is not sequestered by ferritin, or safely bound to its normal cellular
components, can increase the risk of oxidative stress. Reactive ferrous iron may catalyze
the production of superoxide radicals from oxygen, and hence hydrogen peroxide via the
action of superoxide dismutase. Free iron also promotes the Fenton reaction in which
ferrous iron reacts with hydrogen peroxide to generate ferric iron and the hydroxyl free
radical. The hydroxyl free radical is a highly reactive species which can attack nearby
DNA and RNA producing modifications (Meneghini 1988). These modifications may
effect gene transcription and reduce mRNA abundance. Major products of oxidative
damage to DNA are 8-hydroxyguanine and 8-oxo-7,8-dihydro-2'-deoxyguanosine
(Chatgilialoglu and O'Neill 2001, and Cheng et al. 1992). These free radical induced
62

DNA modifications have been shown to be mutagenic (Cheng et al. 1992). Oxidative
damage due to increased iron in the debris pellet could be hazardous to the cell.
Our results also indicate that aluminum increases the concentration of
unsequestered, reactive iron in the supernatant (i.e., cytosolic) fraction. This occurred
because aluminum strongly inhibited iron uptake and storage in cytosolic ferritin. As
kidney iron increased with added iron in the diet, a much smaller proportion of that iron
was bound by ferritin in the aluminum treated groups (Figure 5). Since aluminum had no
effect on supernatant iron concentrations, a decrease of iron bound within cytosolic
ferritin would result in increased amounts of unsequestered iron in the cytosolic fraction.
Cell culture studies support this conclusion. Abreo et al. (2004) showed that aluminum
increased the "labile" or chelatable iron pool in cultured hepatocytes and that this was
associated with increased oxidative stress. This group also showed reduced 59Fe uptake
into ferritin in aluminum-treated erythroleukemia cells, again accompanied by increased
lipid peroxidation (Abreo et al. 1994). The only other study to address the issue of iron
uptake into ferritin is the in vitro study of Fleming and Joshi (1991) who showed reduced
uptake of iron into purified apo-ferritin preincubated with aluminum. Our study, then, is
the first to demonstrate, in vivo, that aluminum can inhibit iron sequestration by ferritin.
Little is known about how aluminum can impair iron sequestration by ferritin.
Small amounts of aluminum have been shown to bind to ferritin (Sakamoto et al. 2004).
The in vitro study mentioned above (Fleming and Joshi 1991) suggested that aluminum
does not affect iron release from ferritin, but affects the loading of iron into the ferritin
molecule. The author's proposed that aluminum interferes with oxidation of Fe+z to Fe+3
needed to load iron into ferritin as FeZ03eHzO. Abreo et al. (1994) suggested that bound
63
aluminum could change the conformation of ferritin resulting in impaired oxidation of
Fe+z. Aluminum may also obstruct or plug the pores in ferritin that allow entry of ferrous
iron into the protein's core. Iron uptake into ferritin has been shown to be blocked by a
chromium analogue of hydrated Fe+z (Barnes et al. 2002). The chromium analogue was
of similar size, shape, and charge as [Fe(HzO)6tZ and appeared to bind to negatively
charged groups at the pore's entrance. Aluminum and iron have similar ionic radis, form
hexahydrates, and bind to the same iron binding sites in transferrin. It is tempting to
speculate that, as with Cr+++, a form of AI+++ may bind to and block the entrance to pores
in ferritin.
In addition to impaired uptake of iron into ferritin molecules, cell culture studies
have shown that aluminum decreases the amount of ferritin protein. Yamanaka et al.
(1999) demonstrated that aluminum increases IRP2 binding to the iron response elements
of ferritin mRNA, inhibiting ferritin synthesis. They postulated that aluminum stabilized
IRP2 by competing with iron for binding sites on IPR2, thereby preventing iron-induced
oxidation and degradation of the regulatory protein. Alternatively, Abreo et al. (1994)
proposed that aluminum caused cellular iron to be partitioned into parts of the cell
(possibly mitochondria or nuclei) that are not sensed by IRPs. In this situation IRP2
would be stabilized, as if it were in an iron deficient cell, leading to down regulation of
ferritin synthesis.
In vivo, however, we did not find that aluminum reduced ferritin protein levels
(Figure 4). In regard to Abreo et ai's. (1994) hypothesis, we were unable to show that
aluminum caused iron to be partitioned out of the cytosol (the cell compartment where
cytosolic IRPs presumably sense cellular iron content). Rather, we found that aluminum
64

had no effect on the total concentration of iron in the supernatant. Aluminum did,
however, reduce the amount of supernatant iron sequestered within ferritin. This
unsequestered iron in the supernatant should have increased the amount of reactive iron
available to destabilize IRP2, and increase ferritin protein synthesis. The fact that ferritin
protein levels were not increased may indicate that aluminum counteracted the effects of
unsequestered iron, possibly as Yamanaka et al. (1999) proposed, by competing with iron
for binding to IRPs. Our in vivo results, then, may be consistent with Yamanaka's
hypothesis. Because the ratio of aluminum to iron within cells may be higher in cell
culture studies than in vivo, this may explain the different responses seen between these
experimental designs. In cell culture, aluminum levels may be high enough to enhance
the stabilization of IRP2 to the point where ferritin synthesis becomes reduced.
CONCLUSIONS AND SIGNIFICANCE
The high levels of dietary aluminum used in this study (0.3g AlII00g diet)
significantly reduced body iron status, mostly likely by inhibiting iron absorption. This
level of aluminum intake is at the upper range of human intakes e.g., individuals
consuming excessive amounts of aluminum containing antacids who may ingest 1-5g of
the metal daily. It is unlikely that the relatively small intakes of aluminum in typical
diets «125mg/day) have a significant effect on iron absorption (Greger and Baier 1983).
Our study is the first to show that dietary aluminum can inhibit iron uptake into
ferritin. Since the sequestration of reactive iron is an important antioxidant function of
ferritin, inhibition of this protective function may be a mechanism of aluminum toxicity.
We do not know at what level of dietary aluminum exposure inhibition of iron uptake by
65

ferritin occurs. Since aluminum may accumulate in tissues with age (Yokel and
McNamara 2001) even typical exposures may eventually disrupt ferritin function. It may
be that it takes only a few aluminum ions bound to ferritin to disrupt iron sequestration.
In contrast to cell culture studies, we did not find that dietary aluminum reduced
ferritin protein levels. However, we believe our data support the conclusion that
aluminum can stabilize IRP2 and down regulate ferritin synthesis (Yamanaka et al.
1999). The magnitude of this effect, however, may depend on the ratio of aluminum to
reactive iron in the cell. Under the physiological conditions used here, kidney aluminum
may not have been high enough to reduce ferritin levels below that in the control groups.
Lastly, it is interesting to speculate that the effects of aluminum on iron
metabolism reflect an interaction at iron binding sites. Aluminum is known to bind to
iron binding sites in transferrin and is postulated to compete with iron for binding to
IRP2. In our study, competition with iron for binding to ferric reductase in the intestine
or transport by DMT1 could explain reduced iron absorption and tissues iron levels. The
binding of aluminum to iron sites on ferritin (e.g., entrance pores) could explain reduced
iron sequestration. If this interaction with iron is a common mechanism of aluminum
toxicity it could have broader implications by interfering with other aspects of iron
utilization in biological systems.
FUTURE STUDY
In this study we found that high dietary aluminum suppressed tissue iron levels
possibly by inhibiting intestinal iron absorption. We also showed that aluminum
inhibited iron uptake and storage in ferritin without inhibiting ferritin protein synthesis
66

and increased the rate of accumulation of iron in the debris pellet. This suggests that
aluminum may increase the concentration of unsequestered, reactive iron in the cytosol
and possibly nuclei. Based on these findings, future studies in animal models or in cell
cultures may focus on these aspects to further understand the effect of aluminum on iron
metabolism.
There are many possible aspects that need to be examined in order to understand
the effect ofaluminum on intestinal absorption. The effects ofAl on the expression of
DMT1, ferric reductase, and ferroportin 1 in the intestine could be done at the mRNA and
protein level. Aluminum can bind to iron binding sites such as transferrin. This indicates
that aluminum may bind to DMT1, ferric reductase, and ferroportin 1. The binding of
aluminum to these molecules could inhibit iron absorption via the competition of
aluminum with iron on these sites or the alteration of these molecules by aluminum.
Competition studies in cell culture systems designed to monitor iron absorption could be
done. Also, interference with the newly discovered regulator for iron absorption,
hepcidin, is another possible mechanism that might decrease intestinal iron absorption by
aluminum. Al could increase production and release ofhepcidin by the liver. The
release of hepcidin can then modify the crypt cells to produce a low level of duodenal
ferric reductase, ferroportin 1, and DMT1. Therefore, the interaction of aluminum with
DMT1, ferroportin, ferric reductase, and hepcidin are all possible mechanisms that can
have an affect on intestinal iron absorption.
Decreased uptake of iron by ferritin due to aluminum could be studied by testing
the mechanism of incorporation of iron into ferritin. Ferrioxidase enzYmes are located
along the ferritin pores to oxidize Fe+2 to the stored form of iron within the ferritin core.
67
Its activity might change due to the toxicity of aluminum resulting in the inhibition of
iron uptake into ferritin. Besides the enzyme activities, aluminum may obstruct or plug
the pores in ferritin that allow entry of ferrous iron into the protein's core. The site of Al
binding to ferritin needs to be identified.
Yamanaka et al. (1999) demonstrated that aluminum increases IRP2 binding to
the iron response elements of ferritin and transferrin receptor mRNA, inhibiting ferritin
synthesis and increasing transferrin receptor. However, the level of ferritin protein
remained unchanged in our study. Our study was conducted using live animals and
Yamanaka's study was in cell cultures, it is possible that in vivo and in vitro may have
different responses due to different concentrations of Al in cells. In this respect it would
be helpful to measure Al and free iron levels. Also, to understand what is really going
on, the level of tranferrin receptor, ferritin protein, and the mRNA for transferrin
receptor, and ferritin need to be examined in vivo.
The accumulation of iron in the debris pellet and increased of unsequestered iron
in the cytosol might increase the risk of oxidative stress to DNA and cells. In the future,
studies need to be conducted to investigate if there is an increase in reactive iron and
oxidative stress in these fractions. To measure the relationship of an increased iron to
oxidative damage, oxidative products such as malondialdehyde, and 8-hydroxyguanine,
and 7,8-dihydro-8-oxo-2' -deoxyguanosine could be tested in tissues.
68

Appendix A. Native PAGE gel assays for ferritin bound iron in kidney
supernatants.
Figures 7-12 illustrate the native-PAGE gels stained for iron from experiments I and II.
A horse spleen ferritin standard (2 ).lg) was loaded along with samples to identify the
location of ferritin on the gel. Ferritin bound iron band intensities were expressed as a
ratio to the band intensity of the reference sample (R1) present on all gels. Also shown
for each sample are the concentrations of iron in both the kidney and kidney supernatant
fractions. Figures 7-8: Heat stable proteins (100 ).lg) from kidney supernatant ofthe
control group (samples #1-4 & 12-14) and control + Al group (samples #5-11). Figures
9-10: Heat stable proteins (l00 ).lg) from kidney supernatant of the intermediate iron
group (samples #1-2 & 4) and intermediate iron + Al group (samples #5-16). Figures 11
12: Heat stable proteins (40 ).lg) from kidney supernatant of the high Fe group (samples
#1-4 & 9-12) and high Fe + Al group (samples #5-8 & 13-16).
69
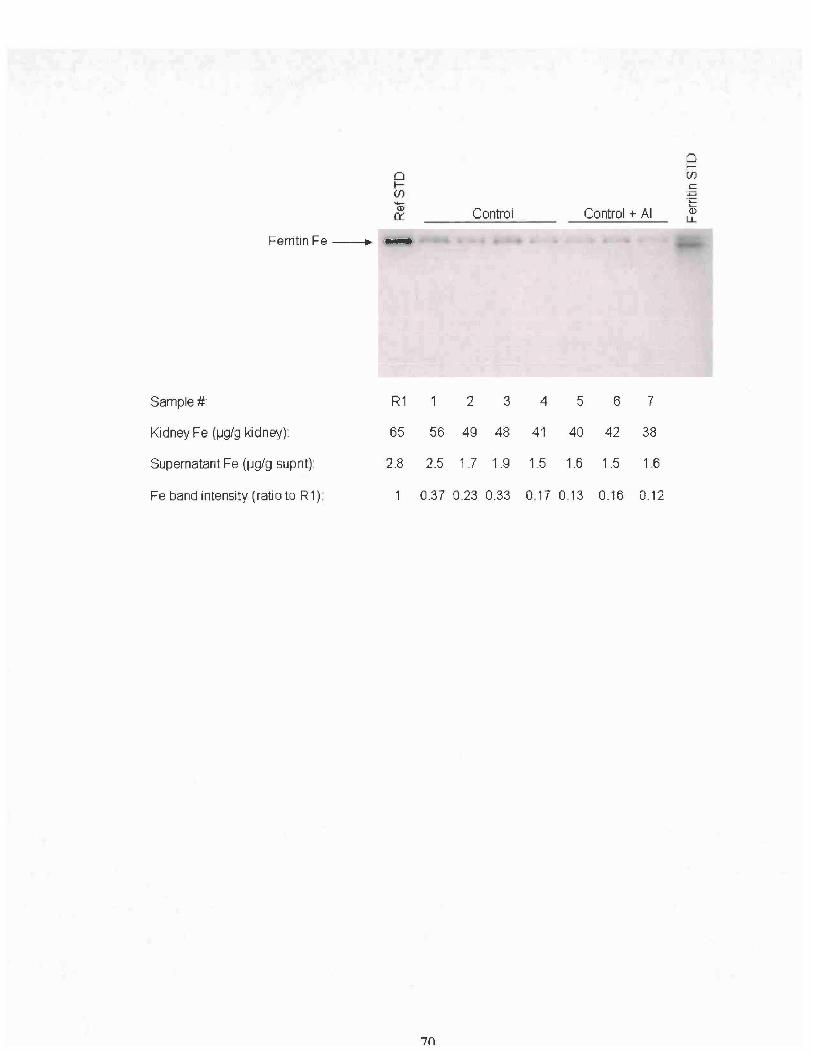
oIif)())
IX
Ferritin Fe --. ...
Control Control + AI
~if)
cpT::'-Q)
l.L
Sample#: R1 2 3 4 5 6 7
Kidney Fe (I-lg/g kidney):
Supernatant Fe (I-lg/g 5upnt):
Fe band intensity (ratio to R1):
65 56 49 48 41 40 42 38
28 2.5 1.7 19 1.5 1.6 1.5 1.6
0.37 0.23 0.33 0.17 0.13 0.16 0.12
7()

--Q)
0:::
Ferritin Fe ---+ _
Control + AI Control
o~(J)C
'-i=l'1::.....())
L.L
Sample#: R1 8 9 10 11 12 13 14
Kidney Fe (lJglg kidney):
Supernatant Fe (lJglg supnt):
Fe band intensity (ratio to R1):
65 50 31 36 31 46 48 45
2.8 2.0 1.3 1.6 1.3 2.0 1.8 2.0
1 0.22 0.09 0.2 008 0.28 0.28 0.32
71

Ferritin Fe
Lane:
KidneyFe (lJg/g kidney):
Supernatant Fe (lJgl9 supnt):
Fe band intensity (ratio to R1):
~(f)
G> Intermediate Fe Intermediate Fe +AI0:::
R1 1 2 4 5 6 7 8
65 58 60 61 39 36 29 30
2.8 2.4 2.3 2.5 1.1 1.0 1.0 0.9
1 1.08 1.15 1.32 0.37 0.39 0.26 0.15
72
~(f)c::'.."'EQ)
u...

oI(f)
<D0::
Ferritin Fe -----. _
Intermediate Fe + AI -of(f)
c'P'CL..
<Dl..L
Sample #:
Kidney Fe (1J9/g kidney):
R1 9 10 11 12
65 31 32 43 36
13 14 15 16
32 31 38 36
Supernatant Fe (lJg/g supnt)
Fe band intensity (ratio to R1):
2.8 '1.0 '1.0 '1:1 '1.2 '1.0'1.'1 1.6 '1."1
0.31 0.33 0.43 0.49 0.46 0.51 0.98 0.55
73

'!'C. •. ..----FerritinFe_
of(f)c
~'-(J)
Ll.Intermediate Fe
••••••High Fe + AI
oI(f)
Q50::
Sample #: 2 3 4 5 6 7 8 R1
Kidney Fe (lJglg kidney)
Supernatant Fe (jJg/g supnt)
Fe band intensity (rati 0 to R1)
47 59 54 69 52 55 53 63 65
1.9 2.5 2.3 2.3 1.8 20 2.4 2.3 28
056 0.89 0.86 0.74 072 0.44 056 0.59
74
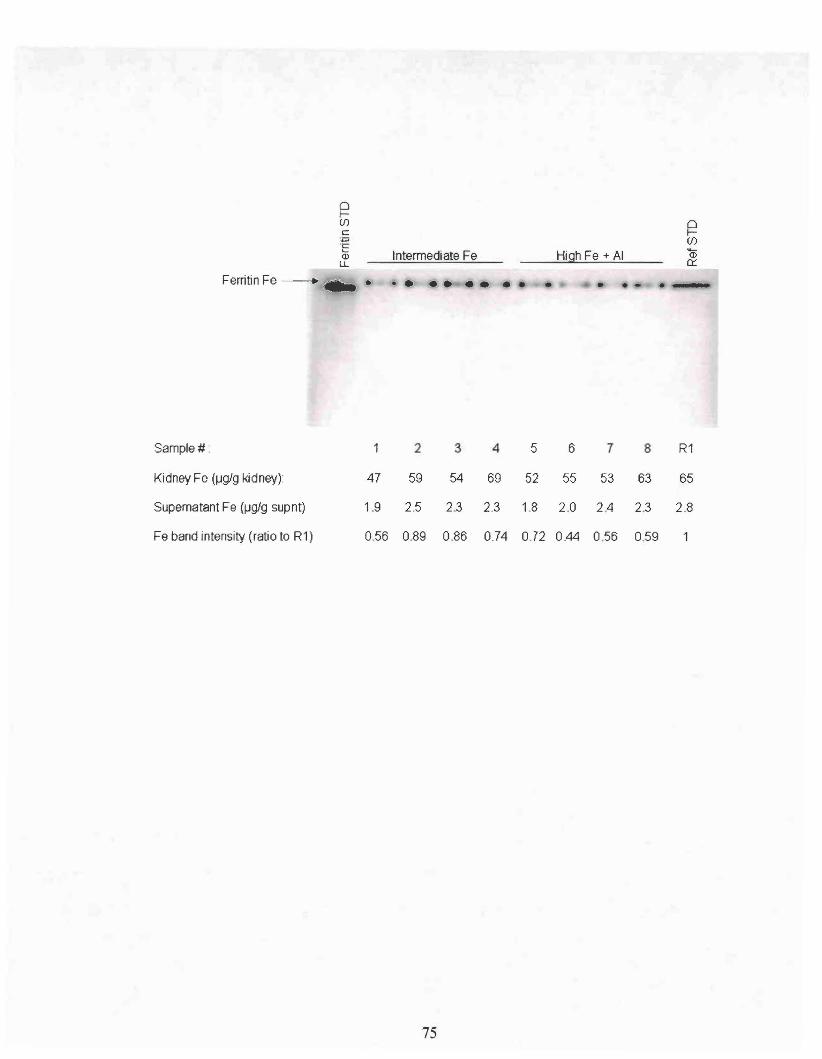
of(J)
C"P'c....Q)
l.LIntermediate Fe High Fe + AI
Ferritin Fe _,... •• •• •• •• • .. - ..-.
Sample#: 2 3 4 5 6 7 8 R1
Kidney Fe (~gJg kidney):
Supernatant Fe (~gJg supnt)
47
1.9
59 54 69 52 55 53 63
2.5 2.3 2.3 1.8 2.0 2.4 2.3
65
2.8
Fe band intensity (ratio to R1) 0.56 0.89 0.86 0.74 0.72 0.44 0.56 0.59
75

Appendix B. Native PAGE gel assays for ferritin protein in kidney supernatants.
Figures 13-18 illustrate the native-PAGE gels from experiments I and II stained for
ferritin protein. A horse spleen ferritin standard (5 Jlg) was loaded to identify the
location of ferritin protein on the gel. Ferritin band intensities are express as a ratio to the
band intensity of the reference sample (R2). Also shown for each sample are the
concentrations of iron in both the kidney and kidney supernatant fractions, and the ratio
of ferritin iron to ferritin protein. Figures 13-14: Heat stable proteins (10 Jlg) from
kidney supernatant of the control group (samples #1-4 & 12-14) and control + Al group
(samples #5-11). Figures 15-16: Heat stable proteins (10 Jlg) from kidney supernatant.
Samples #1-4 & 9-12 were from the intermediate Fe group and samples #5, 7-8 & 13-16
were from the high Fe plus aluminum group. Figure 17-18: Heat stable proteins (10 Jlg)
from kidney supernatant. Samples #1 & 3-4 were from the intermediate iron group and
samples #5-16 were from the intermediate iron plus aluminum group.
76

oI(f)
(j)cr::
Fernlmprotein- .......
Control + AI
" 'r
Control
oI(f)
~§........(])
LL
Sarnple#: R2 7 6 5 4 3 2
Kidney Fa (lJg Fe/g ~dnay) 60 38 42 40 41 48 49 56
Supernatant Fe (lJg Fe/g supnt): 2.3 1.6 1.5 1.6 1.5 1.9 1.7 2.5
Protein band intensity (ratio to R2): 0.36 0.48 0.51 0.62 0.54 0.35 0.68
Ratio ferritin Fe : ferritin protein 0.33 0.33 025 027 061 066 0.5
77
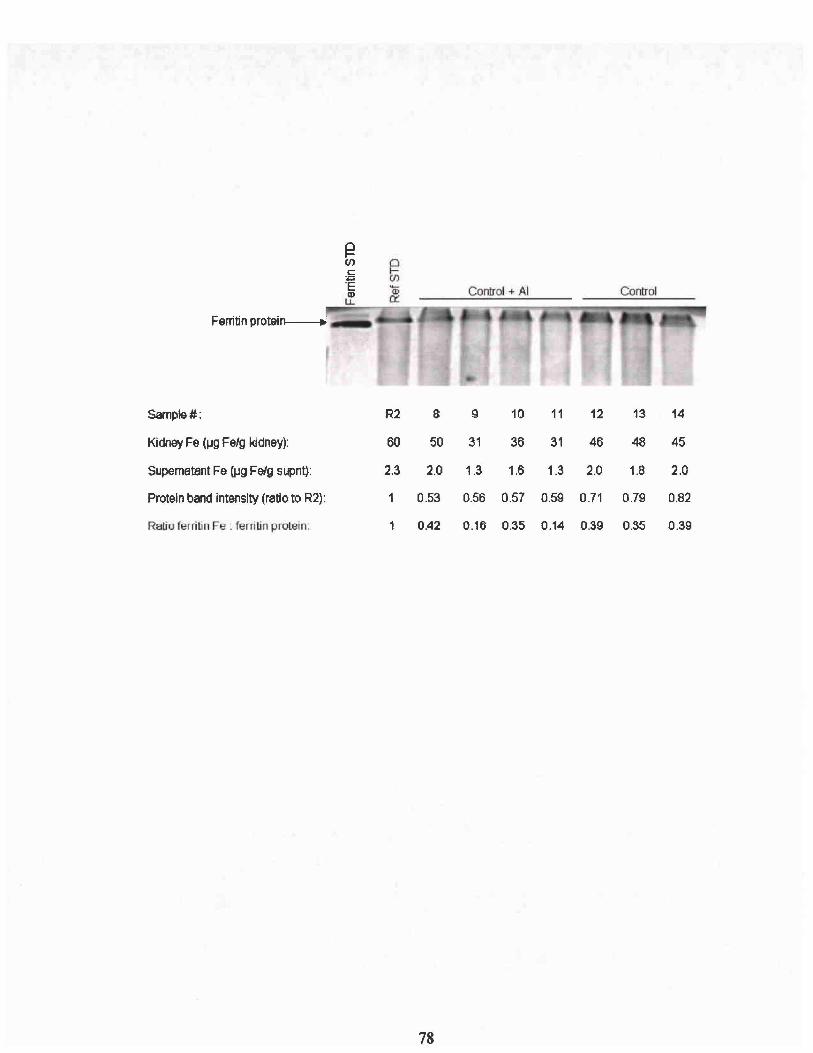
Ferritin proteinl----+ , _
Sample#: R2 8 9 10 11 12 13 14
Kidney Fe (1..19 Fe/g kidney): 60 50 31 36 31 46 48 45
Supernatant Fe (lJg FeJg supnt): 2.3 2.0 1.3 1.6 1.3 2.0 1.8 2.0
Protein band intensity (ratio to R2): 1 0.53 0.56 0.57 0.59 0.71 0.79 0.82
Ratio ferritin Fe: ferritin protein. 0.42 0.16 0.35 0.14 0.39 0.35 0.39
78
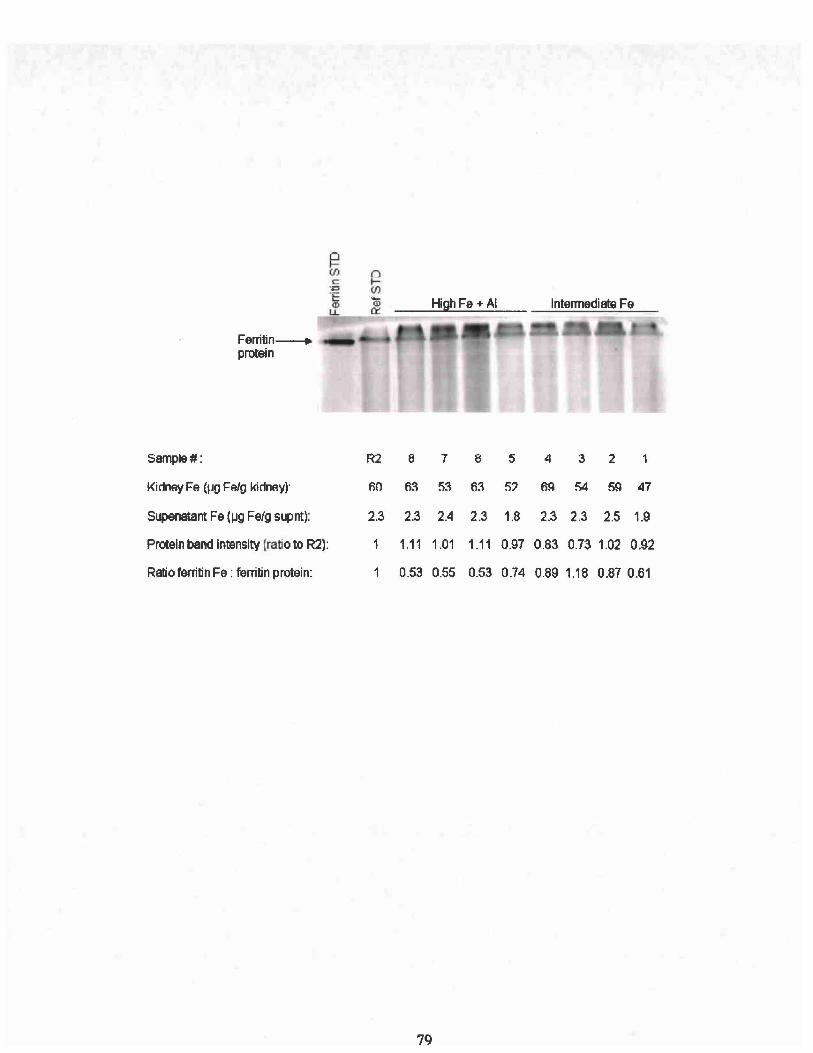
~(J)co
+:>'ECDu..
Ferrilin--. .I_e=-
protein
Sample#: R2 8 7 8 5 4 3 2 1
Kidney Fe (pg FAlg kidney)" 60 63 53 63 5? 69 54 59 47
Supenalant Fe (l.Ig Felg supnt): 2.3 2.3 2.4 2.3 1.8 2.3 2.3 2.5 1.9
Protein band intensity (ratio to R2): 1 1.11 1.01 1.11 0.97 0.83 0.73 1.02 0.92
Ratio ferritin Fe : ferritin protein: 1 0.53 0.55 0.53 0.74 0.89 1.18 0.87 0.61
79

High Fe + AIIntermediate Fe
~Ulc"P;::....<DLL
Ferritin protein---. _ ..'•• <il1IiiiiIiiI1."1
Sample#: 9 10 11 12 13 14 15 16 R2
Kidney Fe (~g Felg kidney): 59 60 51 48 48 43 46 49 60
SUpematant Fe (JJg Felg supnt): 2.6 1.7 2.3 2.4 1.7 1.7 1.9 2.0 2.3
Protein band intensity (ratio to R2): 1.54 1.41 1.14 1.03 0.93 1 1.01 0.79 1
Ratio ferritin Fe : ferritin protein: 0.62 0.76 0.73 0.8 0.35 0.31 017 0.32 1
RO
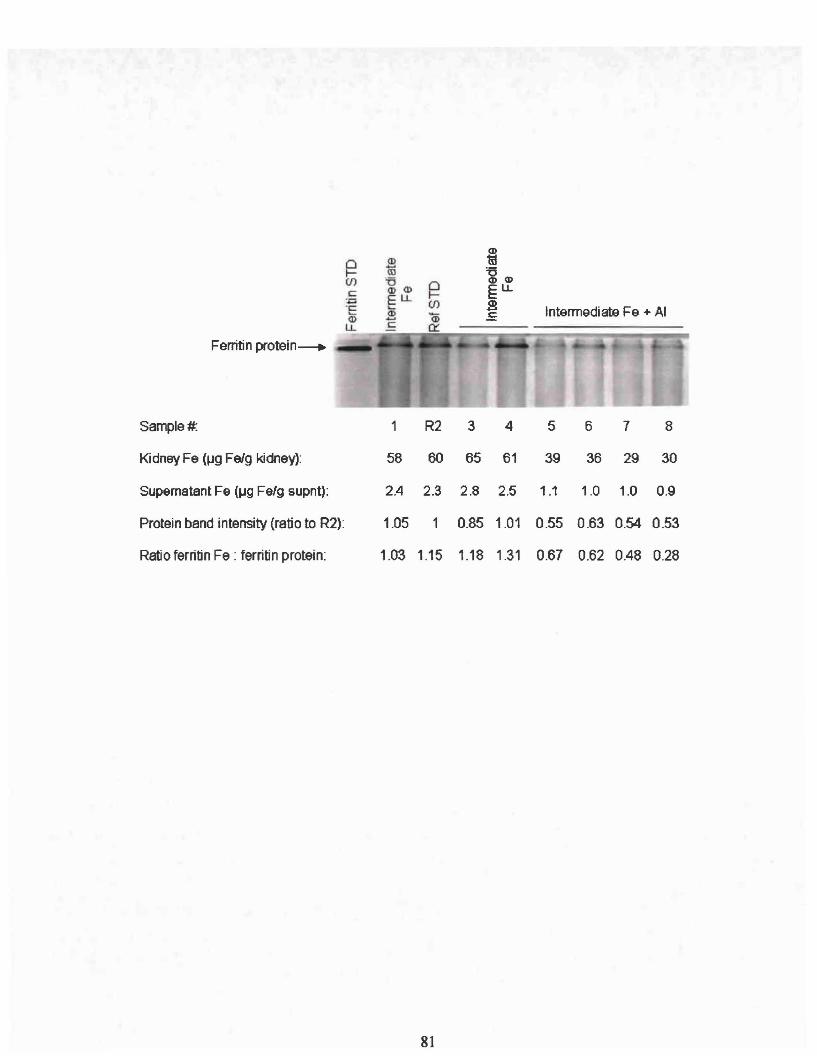
Ferritin protein--+
~(f)
c:
Intermediate Fe + AI
Sample#. 1 R2 3 4 5 6 7 8
Kidney Fe (~g FeJg kidney): 58 60 65 61 39 36 29 30
Supernatant Fe (~g Felg supnt): 2.4 2.3 2.8 2.5 1.1 1.0 1.0 0.9
Protein band intensity (ratio to R2): 1.05 1 0.85 1.01 0.55 0.63 0.54 0.53
Ratio ferritin Fe : ferritin protein: 1.03 1.15 1.18 1.31 0.67 0.62 0.48 0.28
81
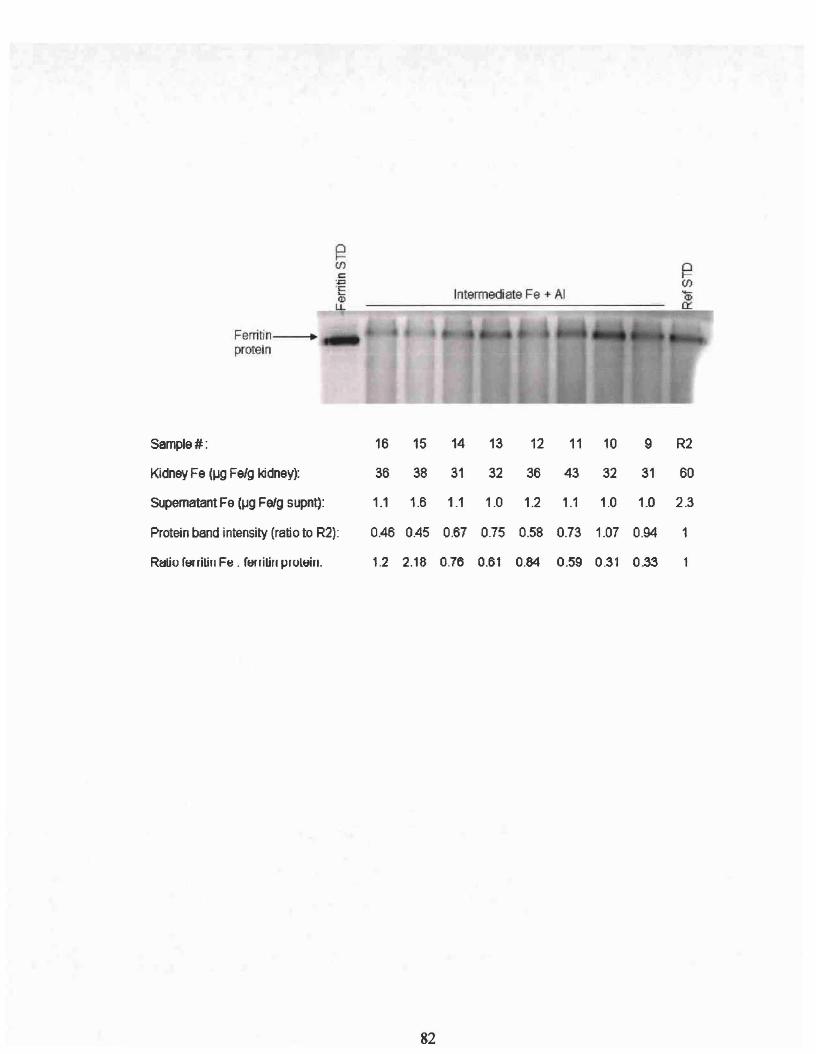
Intermediate Fe +- AI
Ferritin ~
protein
Sarnple#: 16 15 14 13 12 11 10 9 R2
Kidney Fe (~ FeJg kidney): 36 38 31 32 36 43 32 31 60
Supernatant Fe (~g FeJg supnt): 1.1 1.6 1.1 1.0 1.2 1.1 1.0 1.0 2.3
Protein band intensity (ratio to R2): 0.46 0.45 0.67 0.75 0.58 0.73 1.07 0.94 1
R~o ferritill Fti . ferritill proltJin. 1.2 2.18 0.76 0.61 0.84 0.59 0.31 0.33
82

REFERENCE
Abboud, S. and Haile, D.J. (2000) A Novel Mammalian Iron-Regulated Protein Involvedin Intracellular Iron Metabolism. The Journal ofBiological Chemistry 275(926): 1990619912.
Abreo, K, Glass, J., and Sella, M. (1990) Aluminum Inhibits Hemoglobin Synthesis butEnhances Iron Uptake in Friend Erythroleukemia Cells. Kidney Intemational37:677681.
Abreo, K, Jangula, 1., Jain, S., and Glass, J. (1991) Aluminum Uptake and Toxicity inCultured Mouse Hepatocytes. Journal ofthe American Society ofNephrology 1:12991304.
Abreo, K. and Glass, J. (1993) Cellular, Biochemical, and Molecular Mechanisms ofAluminum Toxicity. Nephrology Dialysis Transplantation 1:5-11.
Abreo, K, Glass, J., Jain, S., and Sella, M. (1994) Aluminum Alters theCompartmentalization ofIron in Friend Erythroleukemia Cells. Kidney International44:636-41.
Abreo, K, Abreo, F., Sella, M., and Jain, S. (1999) Aluminum Enhances Iron Uptakeand Expression ofNeurofibrillary Tangle Protein in Neuroblastoma Cells. Journal ofNeurochemistry 72:2059-2064.
Abreo, K, Sella, M., Alvarez-Hernandez, x., and Jain, S. (2004) Antioxidants Preventaluminum-Induced Toxicity in Cultured Hepatocytes. Journal of Inorganic Biochemistry98:1129-134.
Adzersen, KB., Becker, N., Steindorf, K, and Frentzel-Beyme, R. (2003) CancerMortality in a Cohort of Male German Iron Foundry Workers. American Journal ofIndustrial Medicine 43:295-305.
Aisen, P., Enns, C., and Wessling-Resnick, M. (2001) Review: Chemistry and Biology ofEukaryotic Iron Metabolism. The International Journal ofBiochemistry and Cell Biology33:940-959.
Alfrey, A C. (1991) Aluminum Intoxication, Recognition and Treatment. In: Aluminumin Chemistry, Biology and Medicine, pp73-84. Cortina International, Verona.
Alfrey, AC., leGendre, G.R. and Kaehny, W.D. (1976) The Dialysis EncephalopathySyndrome-Possible Aluminum Intoxication. New England Joumal of Medicine 294: 184188.
83
Ali, M.A., Akhmedkhanov, A., Zeleniuch-Jaquotte, A., Toniolo, P., Frenkel, K., andHuang, X. (2003) Reliability of Serum Iron, Ferritin, Nitrite, and Association with RiskofRenal Cancer in Women. Cancer Detection and Prevention 27:116-121.
Alvarez-Hernandez, X., Madigosky, S.R., Stewart, B., and Glass, J. (1994) Iron StatusAffects Aluminum Uptake and Transport by Caco-2 Cells. Journal ofNutrition 124:15741580.
Arosio, P. and Levi, S. (2002) Ferritin, Iron Homeostasis, and Oxidative Damage. FreeRadical Biology and Mecidine 33:457-63.
Bali, P.K., Zak, 0., and Aisen, P. (1991) A New Role for the Transferrin Receptor in theRelease of Iron from Transferrin. Biochemistry 30:324-328.
Barnes, C.M., Theil, B.C., and Raymond, K.N. (2002) Iron Uptake in Ferritin is Blockedby Binding of [Cr(TREN)(H20)(OH)]2+, A Slow Dissociating Model for [Fe(H20)6]2+.Proceedings of the National Academy of Sciences 99(8):5195-5200.
Bartzokis, G. (2004) Brain Ferritin Iron as a Risk Factor for Age at Onset inNeurodegenerative Diseases. Annals of the New York Academy of Sciences 1012:22436.
Bhasin, G., Kauser, H., Sarwar, A.M. and Athar, M. (2003) Progressive Iron OverloadEnhances Chemically Mediated Tumor Promotion in Murine Skin. Archives ofBiochemsitry and Biophysics. 409:262-73.
Bondy, S.C. and Kirstein, S. (1996) The Promotion ofIron-induced Generation ofReactive Oxygen Species in Nerve Tissue by Aluminum. Molecular and ChemicalNeuropathology 2:185-94.
Borenstein, A, White, E., Koepsell, T.D., Reifler, B.V., Van Belle, G., and Larson, B.B.(1990) The Association Between Aluminum-Containing Products and Alzheimer'sDisease. Journal of Clinical Epidemiology 43:35-44.
Bourdon, E., Kang, D.K., Ghosh, M.C., and Drake, S.K. (2003) The Role of EndogenousHeme Synthesis and Degradation Domain Cysteines in Cellular Iron-DependentDegradation ofIRP2. Blood Cells, Molecules, and Diseases 31 :247-255.
Bourgoin, B.P. (1992) Alumino-Silicate Content in Calcium Supplements Derived fromVarious Carbonate Deposits. Bullutin of Environmental Contamination Toxicology48:803-8.
Bradbear, R.A., Bain, C., and Siskind, V. (1985) Cohort Study ofInternal Malignancy inGenetic Hemochromatosis and Other Chronic Non-Alcoholic Liver Diseases. Journal ofthe National Cancer Institute 75:81-84.
84
Broe, G.A, Henderson, AS., Creasey, H., McCusker, E., Korten, AE., Jorm, AF.,Longley, and Anthony, J.C. (1990) A Case-Control Study ofAlzheimer's Disease inAustralia. Neurology 40:1698-1707.
Calado, RT., Franco, RF., Pazin, A (2000) HFE Gene Mutations in CoronaryAtherothrombotic Disease. Brazilian Jouranl of Medical Biological Research 33:301306.
Candore, G., Balistreri, C.R, Lio, D., Mantovani, V., Colonna-Romano, G., Chiappelli,M., Tampieri, C., Licastro, F., Branzi, A, Vema, M., Caruso, M., Hoffmann, E., andCaruso, C. (2003) Association Between HFE Mutations and Acute Myocardial Infarction:A Study in Patients from Northern and Southern Italy. Blood Cells, Molecules, andDiseases 31 :57-62.
Cannata, lB., Gomez, Alonso, c., Fernandez, Menendez, M.J., Fernandez, Soto, I.,McGregor, S., Menendez-Fraga, P., and Brock, J.H. (1991) Iron Uptake in AluminumOverload: In Vivo and In Vitro Studies. Nephrology Dialysis Transplantation 6(9):63742.
Cederbaum, AI. (2003) Iron and CYP2E1-Dependent Oxidative Stress and Toxicity.Alcohol 30:115-120.
Chatgilialoglu, C. and O'Neill, P. (2001) Free Radicals Associated with DNA Damage.Experimental Gerontology 36:1459-1471.
Chau, L.Y. (2000) Iron and Atherosclerosis. Proceedings of the National ScienceCouncil, Republic of China. Part B, Life Sciences 24(4) 151-155.
Chen, S.Y. Hayes, RB., Liang, S.R., Li, Q.G.. Stewart, P.A, and Blair, A (1990)Mortality Experience of Haematite Mine Workers in China. British Journal of IndustrialMedicine 47: 175-181.
Cheng, K.C., Cahill, D.S., Kasai, H., Nishimura, S., and Loeb, L.A (1992) 8Hydroxyguanine, an Abundant Form of Oxidative DNA Damage, Causes~ T andA~ C Substitutions. Journal ofBiological Chemistry 267:166-172.
Chung, M.C.-M. (1985) A Specific Iron Stain for Iron-Binding Proteins inPolyacrylamide Gels: Application to Transferrin and Lactoferrin. AnalyticalBiochemistry 148:498-502.
Clauberg, M. and Joshi, J.G. (1993) Regulation of Serine Protease Activity byAluminum: Implications for Alzheimer's Disease. Proceedings ofthe National AcademySciences 90:1009-1012.
85

Conrad, M.E., Umbreit, IN., Moore, E.G., Nainsworth, L.N. Porubcin, M., Simovich,MJ., Nakada, M.T., Dolan, K., and Garrick, M.D. (2000) Separate Pathways for CellularUptake ofFerric and Ferrous Iron. American Journal ofPhysiology: GastrointestinalLiver Physiology 279:G767-G774.
Corsi, B., Cozzi, A, Arosio, P., Drysdale, J., Santombrogio, P., and Campanellas, A(2002) Human Mitochondrial Ferritin Expressed in HeLa Cells Incorporates Iron andAffects Cellular Iron Metabolism. The Journal ofBiological Chemistry 277:2243022437.
Crichton, RR (1991) Chapter 6: Chemistry and Biology of the Transferrins. In:Inorganice Biochemistry of Iron Metabolism, pp101-119. Ellis Horwood Limited,Chichester, West Sussex, England.
Crichton, R.R (1971) Medical Progress. Ferritin: Structure, Synthesis and Function. TheNew England Journal ofMedicine 284:1413-1422.
Crichton, RR. (200 I) Inorganice Biochemistry of Iron Metabolism. In: MolecularMechanisms to Clinical Consequences, 2nd Edition. Wiley, Chichester, New York.
Crichton, R.R., Wilmet, S., Legssyer, R, and Ward, Rl (2002) Molecular and CellularMechanisms of Iron Homeostasis and Toxicity in Mammalian Cells. Journal ofInorganic Biochemistry 91(1):9-18.
Davis, M.T. and Bartfay, W.J. (2004) Ebselen Decreases Oxygen Free RadicalProduction and Iron Concentrations in the Hearts of Chronically Iron-Overloaded Mice.Biological Research For Nursing 6(1):37-45.
Deng, Z., Coudray, c., Gouzoux, L., Mazur, A, Royssiguier, Y., and Pepin, D. (2000)Effects of Acute and Chronic Coingestion of AICh with Citrate or Polypheolic Acids onTissue Retention and Distribution of Aluminum in Rats. Biological Trace ElementResearch 76:245-256.
Deugnier, Y. (2003) Iron and Liver Cancer. Alcohol 30:145-150.
D'Haese, P.C and De Broe, M.E. (2001) Chapter 11: Aluminum and Iron: Implicationsfor Alzheimer's Disease. In: Aluminum and Alzheimer's Disease the Science thatDescribes the Link, pp221-231. Elsevier Science B.V., Amsterdam, Netherlands.
Domingo, J.L. (1993) Aluminum: Toxicology. In: Encyclopedia ofFood Science, FoodTechonology and Nutrition, vol. 1, 130-53. Academic Press, London.
Drueke, T.B. (2002) Intestinal Absorption of Aluminum in Renal Failure. NephrologyDialysis Transplantation 17(2):13-16.
86
Dunn, M.A, Johnson, N.E., Lieu, M.Y., and Ross, E. (1993) Dietary AluminumChloride Reduces the Amount of Intestinal Calbindin D-28K in Chicks Fed Low Calciumor Low Phosphorus Diets. Journal ofNutrition 123(11):1786-93.
Ecelbarger, C.A and Greger, J.L. (1991) Dietary Citrate and Kidney Function AffectAluminum, Zinc and Iron Utilization in Rats. Journal Nutrition 121: 1755-1762.
Eden T. (1976) Tea. Pp8-15. Longman, London.
Edwardson, lA, Ferrier, LN., McArthur, F.K., McKeith, LG., McLaughlin, L, Morris,C.M., Mountfort, S.A, Oakley, AE., Taylor, G.A, Ward, M.D., and Candy, J.M. (1991)Alzheimer's Disease and the Aluminum Hypothesis. In: Aluminum in Chemistry,Biology and Medicine, pp84-96. Raven Press, New York.
Emerit, J., Beaumont, D., and Trivin, F. (2001) Iron Metabolism, Free Radicals, andOxidative Injury. Biomedicine Pharmocotherapy 55(6)333-339.
Exley, C. (2001) Preface: Why is Research into Aluminum and Life Important? In:Aluminum and Alzheimer's Disease The Science that Describes the Link, pp V-VIII.Elsevier, Amsterdam, The Netherlands.
Farina, M., Lara, P.S., Brandao, R., Jacques, R, Rocha, J.B.T. (2002) Effects ofAluminum Sulfate on Erythropoiesis in Rats. Toxicology Letters 132:131-9.
Fatemi, S.J., and Moore, G.R (1991) Aluminum Transport in Blood Serum. Binding ofAluminum by Human Transferrin in the Presence ofHuman Albumin and Citrate.Biochemical Journal 280:527-32.
Ferguson, C.J., Wareing, M., Ward, D.T., Green,R, Smith, C.P., and Riccardi, D. (2001)Cellular Localization ofDivalent Metal Transporter DMT-1 in Rat Kidney. AmericanJournal Physiology-Renal Physiology 280:F803-F814.
Fleming, J.T. and Joshi, J.G. (1991) Ferritin: The Role of Aluminum in Ferritin Function.Neurobiology of Again. 12:413-418.
Francanzani, AL., Conte, D., Fraquelli, M., Taioli, E., Mattioli, M., Losco, A, andFargion, S. (2001) Increased Cancer Risk in a Cohort of230 Patients with Hereditaryhemochromatosis in Comparison to Matched Control Patients with Non-Iron RelatedChronic Liver Disease. Hepathology 33:647-651.
Franco, RF. Zago, M.A, Trip, M.D. (1998) Prevalence of Hereditary Hemochromatosisin Premature Atherosclerotic Vascular Disease. British Journal Haematology 102:11721175.
Gaenzer, H., Marschang, P., Sturm, W., Neumayr, G., Vogel, W., Patsch, J., Weiss, G.(2002) Journal of the American College of Cardiology 40:2189-2194.
87
Gamot, P.O. (1986) Metabolism and Possible Health Effects of Aluminum.Environmental Health Perspectives 65 :363-441.
Golub, M.S., Han, B., and Keen, c.L. (1996) Aluminum Alters Iron and ManganeseUptake and Regulation of Surface Transferrin Receptors in Primary Rat OligodendrocyteCultures. Brain Research 719:72-77.
Gomez, M., Sanchez, D.l, Llobet, lM., Corbella, J., & Domingo, J.L. (1997) TheEffect of Age on Aluminum Retention in Rats. Toxicology 116:1-8.
Gonzalez-Revalderia, J., Casares, M., de Paula, M., Pasucual, T., Giner, V., andMiravalles, E. (2000) Biochemical and Hematological Changes in Low-LevelAluminum Intoxication. Clinical Chemistry and Laboratory Medicine 38(3):221-5.
Greger, J.L. (1993) Aluminum Metabolism. Annual Review Nutrition 13:43-63.
Greger, lL and Sutherland, lE. (1997) Aluminum Exposure and Metabolism. CriticalReviews in Clinical Laboratory Sciences 34(5): 439-474.
Greger, J.L. and Baier, MJ. (1983) Effect ofDietary Aluminum on Mineral Metabolismof Adult Males. The American Journal of Clinical Nutrition 38:411-419.
Groff, J.L. and Gropper, S.S. (2000) Chapter 12: Microminerals. In: AdvancedNutrition and Human Metabolism 3rd Edition, pp402-417. Wadsworth, Belmont, CA
Gurzau, B.S. Corneliu, N., and Gurzau, AE. (2003) Essential Metals-Case Study on Iron.Ecotoxicology and Environmental Safety 56:190-200.
Guthrie, H.A and Picciano, M.F. (1995) Chapter 10: Micronutrient Minerals. In:Human Nutrition, pp334-35l. Mosby, St. Louis, Missouri.
Han, l, Han, l, and Dunn, M.A (2000) Effect ofDietary Aluminum on TissueNonheme Iron and Ferritin Levels in the Chick. Toxicology 142: 97-109.
Harley, A, Cooper, J.M., Schapira, AH. (1993) Iron Induced Oxidative Stress andMitochondrial Dysfunction: Relevance to Parkinson's Disease. Brain Research 627(2):349-53.
Hentze, M.W., Muchenthaler, M.D., and Andrews, N.C. (2004) Balancing Acts:Molecular Control ofMammalian Iron Metabolism. Cell 117:285-297.
Hetet, G., Elbaz, A, Gariepy, J. (2001) Association Studies BetweenHaemochromatosis Gene Mutations and the Risk of Cardiovascular Diseases. EuropeanJournal of Clinical Investigation 31: 382-388.
88
Hsing, AW., McLaughlin, J.K, Olsen, J.H., Mellemkjar, L., Wacholder, S., Fraumeni,J.FJ. (1995) Cancer Risk Following Primary Hemochromatosis: A Population-BasedCohort Study in Denmark. International Journal of Cancer 60: 160-162.
Hubert, N., and Hentze, M.W. (2002) Previously Uncharacterized Isoforms ofDivalentMetal Transporter (DMT1): Implications for Regulation and Cellular Function.Proceedings ofthe National Academy of Sciences 99:12345-12350.
Iribarren, C., Sempos, C.T., Eckfeldt, J.H., and Folsom, A.R. (1998) Lack of AssociationBetween Ferritin Level and Measured ofLDL Oxidation: The ARIC Study.Atherosclerosis Risk in Communities. Atherosclerosis 139:189-95.
Jacobs, A (1975) Iron Deficiency: Effects on Tissues and Enzymes In: Iron Metabolismand Its Disorders, pp135-145. Exerpta Medica, Amsterdam, Oxford.
Jang, J.B., and Surh, YJ. (2002) Beta-Amyloid Induces Oxidative DNA Damage andCell Death Through Activation of c-Jun N Terminal Kinase. Annals of the New YorkAcademy of Sciences 973: 228-36.
Jansson, E.T. (2001) Aluminum Exposure and Alzheimer's Disease. Journal ofAlzheimer's Disease 3: 541-549.
Jeong, S.Y, and David, S. (2003) Glycosylphosphatidylinositol-AnchoredCeruloplasmin is Required for Iron Efflux from Cells in the Central Nervous System.Journal ofBiological Chemistry 278:27144-27148.
Kaiser, L., Schwartz, K, Burnatowska-Hledin, M.A, and Mayor G. (1984) MicrocyticAnemia Secondary to Intraperitoneal Aluminum in Normal and Uremic Rats. KidneyInternational 26: 269-274.
Kausz, A.T., Antonsen, lE., Hercz, G., Pei, Y., Weiss, N.S., Emerson, S., and Sherrard,DJ. (1999) Screening Plasma Aluminum Levels in Relation to Aluminum Bone Diseaseamong asymptomatic Dialysis Patients. American Journal Kidney Diseases 34: 688-693.
Ke, Y, Chen, Y.Y, Chang, YZ., Duan, x.L., Ho, KP., Jiang, D.H., Wang, K, and Qian,Z.M. (2003) Post-Transcriptional Expression ofDMT1 in the Heart of Rat. Journal ofCellular Physiology 196: 124-130.
Kooistra, M.P., Niemantsverdriet, E.c., van Es, A, Mol-Beer-mann, N.M., Struyvenberg,A, Marx, II (1998) Iron Absorption in Erythropoietin-treated Haemodialysis patients:Effects of Iron Availability, Inflammation and Aluminum. Nephrology, Dialysis,Transplantation 13:82-88.
Lash, L.H. and Sall, J.M. (1993) Chapter 1: Mitochondrial Isolation from Liver andKidney: Strategy, Techniques, and Criteria for Purity. In: Methods in Toxicology, pp828. Academic Press. Inc., San Diego, California.
89

Layrisse, M. (1975) Dietary Iron Absorption. In: Iron Metabolism and Its Disorders,pp25-34. Exerpta Medica, Amsterdam, Oxford.
Le, N.T.V. and Richardson, D.R.R (2002) Ferroportin 1: A New Iron ExportMolecule? The International Journal of Biochemistry & Cell Biology 34: 103-108.
Leong, W.I., and Lonnerda1, B. (2004) Hepcidin, the Recently Identified Peptide thatAppears to Regulate Iron Absorption. 134:1-4.
Lemmer, E.R, Ge1derb10m, W.C.A, Shephard, E.G., Abel, S., Seymour, B.L., Cruse,J.P., Kirsch, RE., Marasas, W.F.O., and Hall, P.M. (1999) The Effects ofDietary IronOverload on Fumonisin B1-Induced Cancer Promotion in the Rat Liver. Cancer Letters146:207-215.
Lieu, P.T., Heiska1a, M. Peterson, P.A, and Yang, Y. (2001) The Roles ofIron in Healthand Disease. Molecular Aspects ofMedicine 22(1-2)1-87.
Martinet, W., Knaapen, M.W.M., De Meyer, G.RY. (2002) Elevated Levels ofOxidative DNA Damage and DNA Repair Enzymes in Human Atherosclerotic Plaques.Circulation 106:927-932.
McGregor, SJ., Naves, M.L., Birly, AK., Russell, N.H., Halls, D., Junor, B.J., andBrock, lH. (1991) Interaction ofAluminum and Gallium with Human Lymphocytes:The Role of Transferrin. Biochimica et Biophysica ACTA/General Subjects 1095:196200.
McKie, AT., Marciani, P., Rolfs, A, Bernnan, K., Wehr, K., Barrow, D., Miret, S.,Bomford, A, Peters, T.l, Farzaeh, F., Hediger, M.A, Hentze, M.W., and Simpson, RJ.(2000) A Novel Duodenal Iron-Regulated Transporter, IREG1, Implicated in theBaso1ateral Transfer ofIron to the Circulation. Molecular Cell 5:299-309.
McLachlan, D.RC., Bergeron, C., Smith, lE., Boomer, D., and Rifat, S.L. (1996) Riskfor Neuropathologically Confirmed Alzheimer's Disease and Residual Aluminum inMunicipal Drinking Water Employing Weighted Residential Histories. Neurology 46:401-405.
Meneghini, R (1988) Genotoxicity of Active Oxygen Species in Mammalian Cells.Mutation Research/DNA Repair 195:215-230.
Milman, N., Pedersen, P., Steig, T., Byg, K., Graudal, N., Fenger, K. (2001) ClinicallyOvert Hereditary Hemochromatosis in Denmark 1948-1985: Epidemiology, Factors ofSignificance for Long-Term Survival, and Causes of Death in 179 patients. Annals ofHematology 80:737-744.
90
Moore, M., Folsom, AR., Barnes, RW., and Eckfeldt, lH. (1995) No AssociationBetween Serum Ferritin and Asymptomatic Carotid Atherosclerosis. The AtherosclerosisRisk in Communities (ARIC) Study. American Journal Epidemiology 141(8):719-23.
Morgan, E.H. and Redgrave, T.G. (1998) Effects ofDietary Supplementation withAluminum and Citrate on Iron Metabolism in the Rat. Biological Trace ElementResearch 65: 117-131.
Nasiadek, M. and Chmielnicka, J. (2000) Interaction of Aluminum with Exogenous andEndogenous Iron in the Organism of Rats. Ecotoxicology and Environmental Safety. 45:284-290.
Nayak, P. (2002) Aluminum: Impacts and Disease. Environmental Research Section A89: 101-115.
Nelson, RL. (2001) Iron and Colorectal Cancer Risk: Human Studies. NutritionReview 59:140-148.
Nesse, A and Garbossa, G. (2001) Chapter 13: Aluminum Toxicity in Erythropoiesis.Mechanisms Related to Cellular Dysfunction in Alzheimer's Disease. In: Aluminum andAlzheimer's Disease. The Science that Describes the Link, pp261-277. Elsevier ScienceRV., Amsterdam, The Netherlands.
Ng, M. (2004) Role ofHydrogen Peroxide in the Aetiology of Alzheimer's Disease:Implications for Treatment. Drugs Aging 21(2):81-100.
Nicolas,G., Bennoun, M., Devaux, I., Beaumont, C., Grandchamp, R, Kahn, A., andVaulont, S. (2001) Lack ofHepcidin Gene Expression and Severe Tissue Iron Overloadin Upstream Stimulatory Factor 2 (USF2) Knockout Mice. Proceedings NationalAcademy of Sciences 98:8780-8785.
Niederau, C., Fischer, R, Sonnenberg, A, Stremmel, W., Trampisch, H.J., Strohmyer, G.(1985) Survival and Causes ofDeath in Cirrhotic and in Noncirrhotic Patients withPrimary Hemochromatosis. New England Journal ofMedicine 313: 1256-1262.
Grino, K., Harada, S., Natsuhori, M., Takehara, K., and Watanabe, K. (2004) KineticAnalysis of Bovine Spleen Apoferritin and Recombinant Hand L Chain Homopolymers:Iron Uptake Suggests Early Stage H Chain Ferroxidase Activity and Second Stage LChain Cooperation. BioMetals 17(2):129-34.
Oshiro, S., Kawahara, M., Mika, S., Muramoto, K., Kobayashi, K, Ishige, R, Nozawa,K., Hori, M., Yung, C., Kitajima, S., & Kuroda, Y. (1998) Aluminum Taken Up byTransferrin-Independent Iron Uptake Affects the Iron Metabolism in Rat Cortical Cells.Journal ofBiochemistry 123:42-46.
91
Oteiza, P.I., Fraga, e.G., and Keen, C.L. (1993) Aluminum Has Both Oxidant andAntioxidant Effects in Mouse Brain Membranes. Archives ofBiochemistry andBiophysics 300: 517-521.
Perez, G., Garbossa, G., and Nesse, A (2001) Disturbance of Cellular Iron Uptake andUtilisation by Aluminum. Journal of Inorganic Biochemistry 87:21-27.
Pham, Q.T., Teculescu, D., Bruant, A, Chau, N., Viaggi, M.N., and Rebstock, E. (1992)Iron Miners-a 10 Year Follow-Up. European Journal ofEpidemiology 8:594-600.
Picard, V., Epsztejn, S., Santambrogio, P., Cabantchik, Z.I., and Beaumont, C. (1998)Role of Ferritin in the Control of the Labile Iron Pool in Murine Erthroleukemia Cells.Journal ofBiological Chemistry 273(25):15382-15386.
Pratico, D., Uryu, K., Sung, S., Tang, S., Trojanowski, J.Q., and Lee, V.M.Y (2002)Aluminum Modulates Brain Amyloidosis through Oxidative Stress in APP TransgenicMice. The Federation ofAmerican Societies for Experimental Biology Journal16(9): 1138-40.
Rasmussen, M.L., Folsom, AR., Catellier, D.J. (2001) A Prospective Study of CoronaryHeart Disease and the Hemochromatosis Gene (HFE) C282Y Mutation: TheAtherosclerosis Risk in Communities (ARIC) Study. Atherosclerosis 154:739-746.
Robson, K.J., Lehmann, DJ., Wimhurst, V.L., Livesey, K.J., Combrinck, M.,Merryweather-Clarke, AT., Warden, D.R., and Smith, AD. (2004) Synergy Between theC2 Allele of Transferrin and the C282Y Allele of the Haemochromatosis gene (HFE) asRisk Factors for Developing Alzheimer's Disease. Journal of Medical Genetics41(4):261-5.
Roest, M., van der Schouw, YT., and de Valk, B. (1999) Heterozygosity for a Hereditarywith Cardiovascular Death in Women. Circulation 100:1268-1273.
Rodrigues, M., Felsenfeld, AI., and Lalch, F. (1990) Aluminum Administration in theRat Separately Affects the Osteoblast and Bone Mineralization. Journal ofBone MineralResearch 5: 59-67.
Rondeau, V., Commenges, D., Jacqmin-Gadda, H., and Dartigues, J.F. (2000) Relationbetween Aluminum Concentrations in Drinking Water and Alzheimer's Disease: An 8year Follow-up Study. American Journal of Epidemiology 152(1): 59-66.
Roy, A, Solodovnikova, N., Nicholson, T., Anotholine, W., and Walden, W.E. (2003)A Novel Eukaryotic Factor for Cytoso1ic Fe-S Cluster Assembly. The EuropeanMolecular Biology Organization Journal 22: 4826-4835.
Sakamoto, T., Ogasawa, Y, Ishii, K., Takahashi, H., & Tanabe, S. (2004) AccumulationofAluminum in Ferritin Isolated from Rat Brain. Neuroscience Letter 366(3):264-7.
92
San-Marina, S., and Nicholls, D.M. (1992) Some Effects of Aluminum on Rat BrainProtein Synthesis. Comparative Biochemistry and Physiology 103(3):585-591.
Shaheen, N.J., Silverman, L.M., Keku, T., Lawrence, L.R, Rohlfs, E.M., Martin, C.F.,Galanko, J., and Sandler, RS. (2003) Association Between Hemochromatosis (HFE)Gene Mutation Carrier Status and the Risk of Colon Cancer. Journal of the NationalCancer Institute 95: 154-9.
Skalsky, M.L., and Carchman RA (1983) Aluminum Homeostasis in Man. Jouranlofthe American College Toxicology 2: 405-423.
Sipe, D.M. and Murphy, RF. (1991) Binding to Cellular Receptors results in IncreasedIron Release from Transferrin at Mildly Acidic pH. Journal ofBiological Chemistry 266:8002-8007.
Soldado, Cabezuelo, AB., Blancogonzalez, E., and Sanz Medel, A (1997) QuantitativeStudies of Aluminum Binding Species in Human Uremic Serum by Fast Protein LiquidChromatography with Electrothermal Atomic Absorption. Analyst 122: 573-77.
Stevens, RG., Jones, D.Y, Micozzi, M.S. and Taylor, RR (1988) Body Iron Storesand the Risk of Cancer. New England Journal of Medicine 319:1047-1052.
Takeuchi, K., Okada, S., Yukihiro, S., and Inoue, H. (1997) The Inhibitory Effects ofAluminum and Fe on Bone Formation, in Vivo and in Vitro Study. Pathophysiology 4:97-104.
Taylor, G.A, et al. (1995) Alzheimer's Disease and the Relationship between Siliconand Aluminum in Water Supplies in Northern England. Journal of EpidemiologyCommunity Health 49: 323-324.
Toyokuni, S. (2002) Iron and Carcinogenesis: From Fenton Reaction to Target Genes.Redox Report 7: 189-97.
Tuomainen, T.P., Diczfalusy, u., Kaikkonen, J., Nyyssonen, K., and Solenen, J.T.(2003) Serum Ferritin Concentration is Associated With Plasma Levels of CholesterolOxidation Products in Man. Free Radical Biology & Medicine 35 :922-928.
Tuomainen, T.P., Kontula, K., Nyyssonen, K. (1999) Increased Risk of AcuteMyocardial Infarction in Carriers of the Hemochromatosis Gene Cys282Tyr Mutation: AProspective Cohort Study in Men in Eastern Finland. Circulation 100: 1274-1279.
Turgut, G., Kaptonaglu, R, Turgut, S., Enli, Y, and Gene, O. (2004) Effects of ChronicAluminum Administration on Blood and Liver Iron-Related Parameters in Mice. YonseiMedical Journal 45(1):135-139.
93
Dc, A, Strokes, J.R, and Britigan, RE. (2004) Heme Transport Exhibit Polarity inCaCo-2 Cells: Evidence for an Active and Membrane Protein-Mediated Process.American Journal ofPhysiology: Gastrointestinal Liver PhysiologyDoi: 10.1152/ajpgi.00157.2004
U.S. Public Health Service. (1992) "Toxicological Profile for Aluminum &Compounds." (Contact No. 205-88-0608). Prepared by Clement International Corp.
Van der Voet, G.B. (1992) Intestinal Absorption of Aluminum. In: Aluminum inBiology and Medicine. (Ciba Foundation Symposium 169), pp107-17. John Wiley andSons, Chichester.
Varner, J.A, Jensen, K.F., Horvath, W., Isaacson, RL. (1998) Chronic Administrationof Aluminum-Fluoride or Sodium-Fluoride to Rats in Drinking Water: Alterations inNeuronal and Cerebravascular Integrity. Brain Research. 784: 284-298.
Venturini-Soriano, M., and Berthon, G. (2001) Aluminum speciation studies inbiological fluids. Part 7. A Quantitative Investigation of Aluminum (III)-MalateComplex Equilibria and their Potential Implications for Aluminum Metabolism andToxicity. Journal of Inorganic Biochemistry 85: 143-154.
Van Rensburg, S.1., Daniels, W.M., Potocnik, F.e., Van Zyl, J.M., Taljaard, J.J., Emsley,RA (1997) A New Model for the Pathophysiology ofAlzheimer's Disease. AluminumToxicity is Exacerbated by Hydrogen Peroxide and Attenuated by An Amyloid ProteinFragment and Melatonin. South Africa Medical Journal 87(9): 1111-5.
Waalen, l, Felitti, V., Gelbart, T., Ho, N.J., and Beutler, E. (2002) American Journal ofMedicine 113:472-479.
Walter, P.R, Knutson, M.D., Paler-Martinez, A, Lee, S., Xu, Y, Viteri, F.E., and Ames,RN. (2002) Iron Deficiency and Iron Excess Damage Mitochondria and MitochondrialDNA in Rats. Proceedings of the National Academy Sciences. 99(4):2264-9.
Ward, RJ., Zhang, Y, and Crichton, RR (2001) Aluminum Toxicity and IronHomeostasis. Journal ofInorganic Biochemistry 87: 9-14.
Whittaker, P. and Chanderbhan, RF. (2001) Effect of Increasing Iron Supplementationon Blood Lipids in Rats. British Journal ofNutrition 86: 1-11.
Xie, C,x., Mattson, M.P., Lovell, M.A, and Yokel, R.A. (1996) IntraneuronalAluminum Potentiates Iron-Induced Oxidative Stress in Cultured Rat HippocampalNeurons. Brain Research. 743:271-277.
94
Xu, Z., Pan, G.W., Liu, L.M., Brown, L.M., Guan, D.X., Xiu, Q., Sheng, J.H., Stone,B.J., Dosemeci, M., Fraumeni Jr, J.F., and Blot, W.J. (1996) Cancer Risks Among Ironand Steel Workers in Anshan, China. Part 1. Proportional Mortality Ratio Analysis.American Journal ofIndustrial Medicine 30:1-6.
Yamanaka, K., Minato, N., Iwai, K. (1999) Stabilization of iron regulatory protein 2,IRP2, by aluminum. Federation of European Biochemical Societies Letters 462: 216220.
Yokel, RA., Allen, D.D., and Ackley, D.C. (1999) The Distribution ofAluminum Intoand Out of the Brain. Journal ofInorganic Biochemistry 76: 127-132.
Yokel, R and McNamara, P.l (2001) Aluminum Toxicokinetics: An UpdatedMiniReview. Pharmacology & Toxicology 88: 159-167.
Youdim, M.B., Ben-Shachar, D., Riederer, P. (1993) The Possible Role ofIron in theEtiolpathology ofParkinson's Disease. Movement Disorders 8(1): 1-12.
Zatta, P., Taylor, A., Zambenedetti, P., Milacic, Rand dell'Antone, P. (2000)Aluminum Inhibits the Lysosomal Proton Pump from Rat Liver. Life Sciences 66:22612266.
95