Embed Size (px)
Citation preview

EFFECT OF CROSS-ROLLING ON MICROSTRUCTURE, TEXTURE AND
MAGNETIC PROPERTIES OF COLD ROLLED NON-ORIENTED
ELECTRICAL STEELS
A thesis submitted to the
National Institute of Technology Rourkela
In partial fulfilment of the requirements
Of the degree of
Masters of Technology
In
Metallurgical and Materials Engineering
By
Jitendra Kumar Mishra
(Roll no. 214MM2501)
DEPARTMENT OF METALLURGICAL AND MATERIALS ENGINEERING
NATIONAL INSTITUTE OF TECHNOLOGYROURKELA

EFFECT OF CROSS-ROLLING ON MICROSTRUCTURE, TEXTURE AND
MAGNETIC PROPERTIES OF COLD ROLLED NON-ORIENTED
ELECTRICAL STEELS
A thesis submitted to the
National Institute of Technology Rourkela
In partial fulfilment of the requirements
Of the degree of
Masters of Technology
In
Metallurgical and Materials Engineering
By
Jitendra Kumar Mishra
(Roll no. 214MM2501)
Under the supervision of
Prof. Santosh Kumar Sahoo
DEPARTMENT OF METALLURGICAL AND MATERIALS ENGINEERING
NATIONAL INSTITUTE OF TECHNOLOGYROURKELA
May, 2016

ii
May 26, 2016
Certificate of Examination
Roll Number: 214MM2501
Name: Jitendra Kumar Mishra
Title of Thesis: Effect of cross-rolling on microstructure, texture and magnetic
properties of cold rolled non-oriented electrical steels.
I, the below signed, after checking the dissertation mentioned above and the official record
book(s) of the student, hereby state our approval of the dissertation submitted in partial
fulfillment of the requirements of the degree of Master Of Technology in Department of
Metallurgical and Materials Engineering at National Institute of Technology Rourkela.
I am satisfied with the volume, quality, correctness, and originality of the work.
……………………………
Prof. Santosh Kumar Sahoo
Principle supervisor
Department of Metallurgical and Materials Engineering
National Institute of Technology Rourkela

iii
Prof. Santosh Kumar Sahoo
Department of Metallurgical and Materials Engineering
May 26, 2016
Supervisor's Certificate
This is to certify that the work presented in this dissertation entitled “Effect of cross-
rolling on microstructure, texture and magnetic properties of cold rolled non-
oriented electrical steels.” by “Jitendra Kumar Mishra” Roll Number 214MM2501 is
a record of original research carried out by him under my supervision and guidance in
partial fulfillment of the requirements of the degree of Master Of Technology in
Department of Metallurgical and Materials Engineering. Neither this dissertation nor
any part of it has been submitted for any degree or diploma to any institute or university in
India or abroad.
………………………………
Prof. Santosh Kumar Sahoo
Department of Metallurgical and Materials Engineering
National Institute of Technology Rourkela

iv
DECLARATION OF ORIGINALITY
I, Jitendra Kumar Mishra, roll no. 214MM2501 hereby declare that this dissertation
entitled “Effect of cross-rolling on microstructure, texture and magnetic
properties of cold rolled non-oriented electrical steels”. Represents my original
work carried out as a postgraduate student of NIT Rourkela and, to the best of my
knowledge, it contains no material previously published or written by another person,
nor any material presented for the award of any other degree or diploma of NIT Rourkela
or any other institution. Any contribution made to this research by others, with whom I
have worked at NIT Rourkela or elsewhere, is explicitly acknowledged in the dissertation.
Works of other authors cited in this dissertation have been duly acknowledged under the
section ''References''. I have also submitted my original research records to the scrutiny
committee for evaluation of my dissertation.
I am fully aware that in case of any non-compliance detected in future, the Senate of NIT
Rourkela may withdraw the degree awarded to me on the basis of the present dissertation.
May26, 2016
NIT Rourkela Jitendra Kumar Mishra
v
ACKNOWLEDGEMENTS
This thesis is a result of research that has been carried out at National Institute of
Technology, Rourkela. During this period, I came across with a great number of people
whose contributions in various ways helped my field of research and they deserve special
thanks. It is a pleasure to convey my gratitude to all of them.
In the first place, I would like to express my deep sense of gratitude and indebtedness to
my supervisors Prof.Santosh Kumar Sahoo for his advice, and guidance from early stage
of this research and providing me extraordinary experiences throughout the work. Above
all, he provided me unflinching encouragement and support in various ways which
exceptionally inspire and enrich my growth as a student, a researcher. His involvement
with originality has triggered and nourished my intellectual maturity that will help me for
a long time to come. I am proud to record that I had opportunity to work with an
exceptionally experienced scientist like him.
I am grateful to, and Prof. S.C. Mishra, former Head of Department Metallurgical and
Materials Engineering, National Institute of Technology, Rourkela, for their kind support
and concern regarding my academic requirements.
I want to thank Mr. Sandeep Kumar Sahni for helping me throughout my project work.
My parents deserve special mention for their inseparable support and prayers. They are
the persons who show me the joy of intellectual pursuit ever since I was a child. I thank
them for sincerely bringing up me with care and love.
Place: NIT Rourkela
Date: Jitendra Kumar Mishra

vi
ABSTRACT
Cross rolled non-oriented (CRNO) electrical steel have uniform magnetic properties in all
angular direction. However, controlling the texture for uniform magnetic properties of
these steels has been investigated by many researchers. In the present thesis effect of
cross-rolling and subsequent annealing of CRNO steels on their texture and magnetic
properties have been investigated. Hot rolled non-oriented electrical steel samples were
subjected to multi-step cross rolling of 80% reduction in thickness. The rolled samples
were then annealed at 650, 750 and 850 oC for 1, 2 and 4hrs respectively. Two different
types of samples were used for the present study: one had higher amount of aluminum
(sample 1) and another had higher carbon, silicon, manganese, Sulphur and phosphorus
content (sample 2). Sample1 had higher grain size as compare to that of sample2 after
annealing. Average grain size was increased with increasing the temperature and soaking
time of annealing. It was also observed that the various textures (111) <uvw> fiber,
(001)<uvw> fiber, (110)<uvw> fiber {110} <100> Goss orientation and {100} <001>
cubic orientation which were uniform along different directions of the samples. The
magnetic property (in terms of core losses) was found to be lower for samples having
higher grain sizes.
Keywords: electrical steel, microstructure, multi-step cross rolling, annealing, texture,
core loss.

vii
CONTENT
Certificate of Examination ii
Supervisor's Certificate iii
Declaration of Originality iv
Acknowledgment v
Abstract vi
List of Figures ix
List of Tables xi
1. INTRODUCTION 1
1.1 Background 2
1.2 Objective 3
1.3 Framework of the thesis 3
2. LITERATURE REVIEW 4
2.1 Electrical steels 5
2.1.1Factor affecting the Properties of electrical steel. 5
2.1.2 Type of electrical steel 6
2.1.2.1 Grain oriented electrical steel 7
2.1.2.2 Grain non-oriented electrical steel. 7
2.2 Texture 7
2.2.1 Grain orientations 8
2.2.2 Pole figure 9
2.2.3 Euler angle 11
2.2.4 Euler space 12
2.2.5 Orientation distribution function 13
2.3 effect of texture and magnetic properties in electrical steel. 14
3. EXPERIMENTAL DETAILS 16
3.1 Material and Working Procedure 17
3.2 Texture characteristic 17
viii
3.3 Magnetic Properties. 18
4. RESULTS AND DISCUSSION 19
4.1 Results 20
4.1.1 Microstructure and grain size 20
4.1.2 Texture 27
4.1.3 Magnetic properties 38
4.2 Discussion 40
5. CONCLUSION 43
REFERENCES
ix
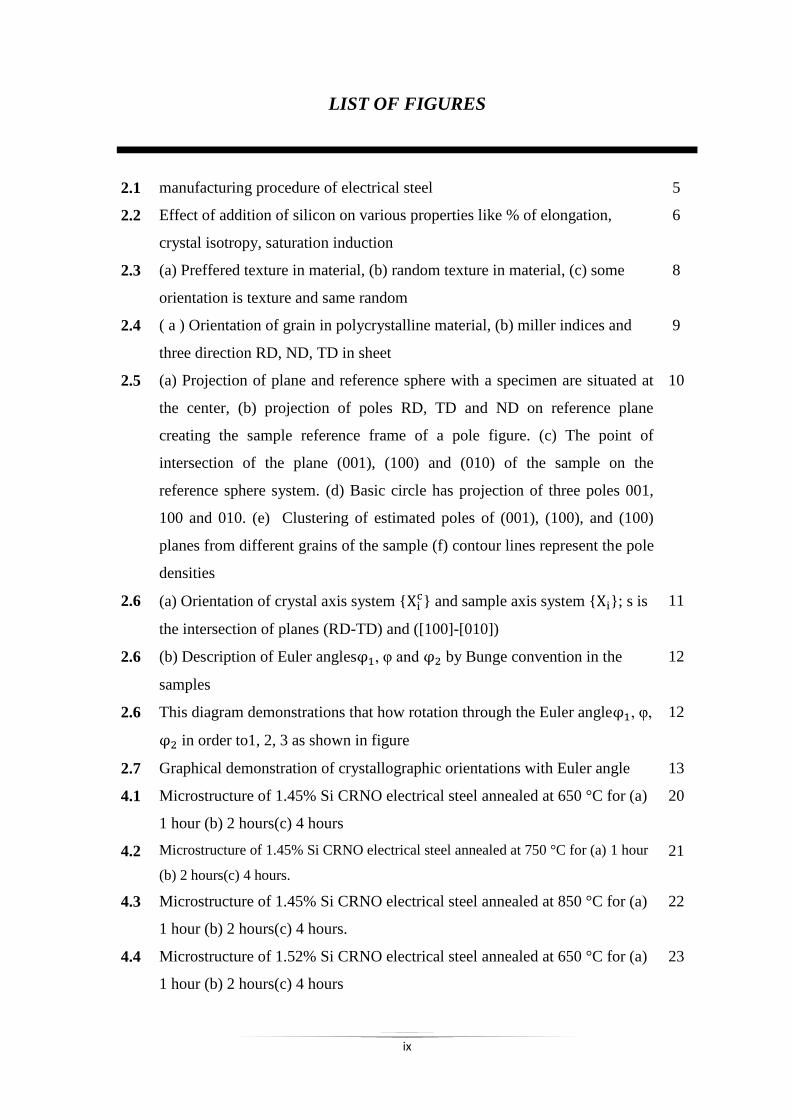
LIST OF FIGURES
2.1
2.2
manufacturing procedure of electrical steel
Effect of addition of silicon on various properties like % of elongation,
crystal isotropy, saturation induction
5
6
2.3 (a) Preffered texture in material, (b) random texture in material, (c) some
orientation is texture and same random
8
2.4 ( a ) Orientation of grain in polycrystalline material, (b) miller indices and
three direction RD, ND, TD in sheet
9
2.5 (a) Projection of plane and reference sphere with a specimen are situated at
the center, (b) projection of poles RD, TD and ND on reference plane
creating the sample reference frame of a pole figure. (c) The point of
intersection of the plane (001), (100) and (010) of the sample on the
reference sphere system. (d) Basic circle has projection of three poles 001,
100 and 010. (e) Clustering of estimated poles of (001), (100), and (100)
planes from different grains of the sample (f) contour lines represent the pole
densities
10
2.6 (a) Orientation of crystal axis system {Xic} and sample axis system {Xi}; s is
the intersection of planes (RD-TD) and ([100]-[010])
11
2.6 (b) Description of Euler anglesφ1, φ and φ2 by Bunge convention in the
samples
12
2.6 This diagram demonstrations that how rotation through the Euler angleφ1, φ,
φ2 in order to1, 2, 3 as shown in figure
12
2.7 Graphical demonstration of crystallographic orientations with Euler angle 13
4.1 Microstructure of 1.45% Si CRNO electrical steel annealed at 650 °C for (a)
1 hour (b) 2 hours(c) 4 hours
20
4.2 Microstructure of 1.45% Si CRNO electrical steel annealed at 750 °C for (a) 1 hour
(b) 2 hours(c) 4 hours.
21
4.3 Microstructure of 1.45% Si CRNO electrical steel annealed at 850 °C for (a)
1 hour (b) 2 hours(c) 4 hours.
22
4.4 Microstructure of 1.52% Si CRNO electrical steel annealed at 650 °C for (a)
1 hour (b) 2 hours(c) 4 hours
23

x
4.5 Microstructure of 1.52% Si CRNO electrical steel annealed at 750 °C for (a)
1 hour (b) 2 hours(c) 4 hours.
24
4.6 Microstructure of 1.52% Si CRNO electrical steel annealed at 850 °C for (a)
1 hour (b) 2 hours(c) 4 hours.
25
4.7 Variation of average grain size of (a) 1.45% Si and (b) 1.52% Si CRNO
electrical steel with annealing time at different temperature.
27
4.8 φ2=45° sectionODFs of 1.45% Si CRNO electrical steel 27
4.9 φ2=45° sectionODFs of 1.45% Si CRNO electrical steel annealed at 650 °C for (a)
1 hour (b) 2 hours(c) 4 hours
28
4.10 φ2=45° sectionODFs of 1.45% Si CRNO electrical steel annealed at 750 °C for (a)
1 hour (b) 2 hours(c) 4 hours.
29
4.11 φ2=45° sectionODFs of 1.45% Si CRNO electrical steel annealed at 850 °C for (a)
1 hour (b) 2 hours(c) 4 hours
30
4.12 φ2=45° sectionODFs of 1.52% Si CRNO electrical steel annealed at 650 °C for (a)
1 hour (b) 2 hours(c) 4 hours.
31
4.13 φ2=45° sectionODFs of 1.52% Si CRNO electrical steel annealed at 750 °C for (a)
1 hour (b) 2 hours(c) 4 hours.
32
4.14 φ2=45° sectionODFs of 1.52% Si CRNO electrical steel annealed at 850 °C for (a)
1 hour (b) 2 hours(c) 4 hours.
33
4.15 variation of volume fraction of (111) <uvw> {γ fiber}, (110)<uvw> {α fiber},
(100)<uvw> {θ fiber}, (100)<001>{cube orientation},(110)<001>{Goss
orientation} with annealing time annealed at (a) 650°C (b) 750°C (c) 850°C.
36
4.16 variation of volume fraction of (111) <uvw> {γ fiber}, (110)<uvw> {α fiber},
(100)<uvw> {θ fiber}, (100)<001>{cube orientation},(110)<001>{Goss
orientation} with annealing time annealed at (a) 650°C (b) 750°C (c) 850°C.
38
4.17 Variation core loss (W/kg) with respect to time (hr.) at various temperature (℃) for
sample 1 and 2 in figure (a) and (b).
40
xi
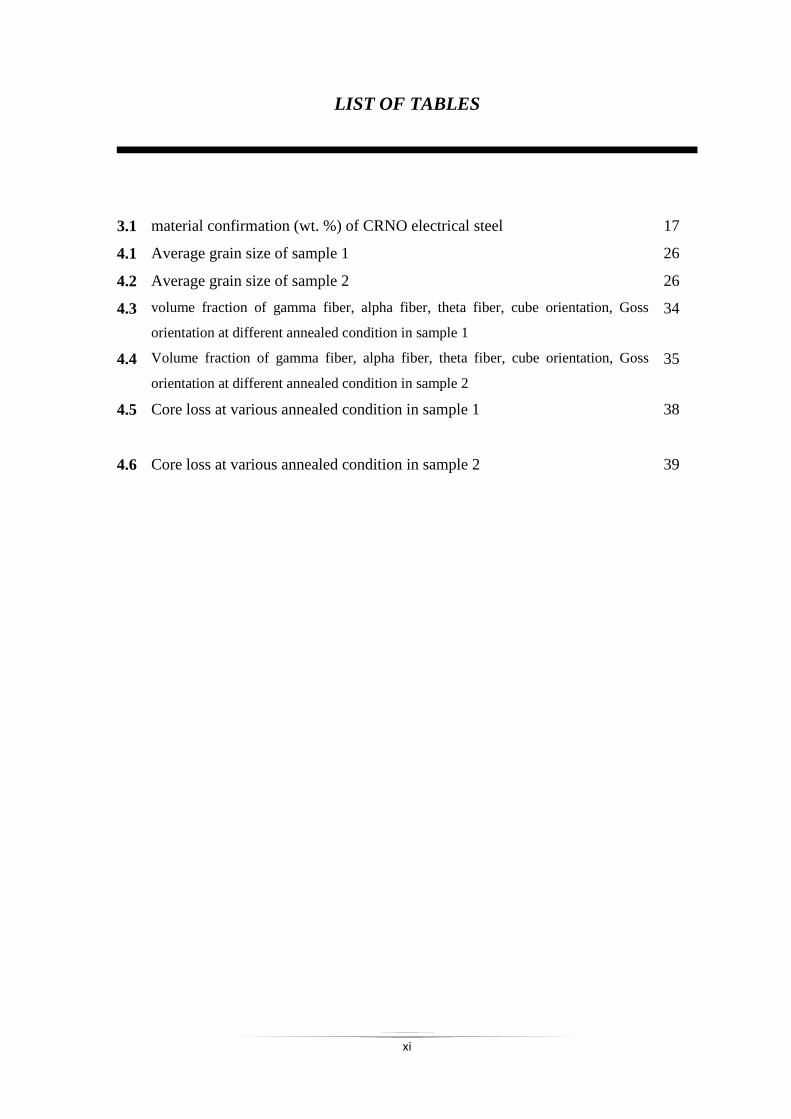
LIST OF TABLES
3.1 material confirmation (wt. %) of CRNO electrical steel 17
4.1 Average grain size of sample 1 26
4.2 Average grain size of sample 2 26
4.3 volume fraction of gamma fiber, alpha fiber, theta fiber, cube orientation, Goss
orientation at different annealed condition in sample 1
34
4.4 Volume fraction of gamma fiber, alpha fiber, theta fiber, cube orientation, Goss
orientation at different annealed condition in sample 2
35
4.5
Core loss at various annealed condition in sample 1 38
4.6 Core loss at various annealed condition in sample 2 39
1
CHAPTER 1
2
1. INTRODUCTION
1.1 Background:
Electrical steels are predominantly used as core material for generators, transformers and
motors. Two types of electrical steels have been developed: CRGO (cold rolled grain
oriented) and CRNO (cold rolled non-oriented) electrical steels. The grain oriented steels
typically contain large grains with a typical orientation of {110}<001> type Goss
orientation and these steels are used in applications involving unidirectional flux paths
such as transformer cores. However, non-oriented steels are being used in electrical
motors where the flux direction may change or rotate [1, 2].
The magnetic behavior of this material is mainly dependent on two microstructural
characteristics: texture and the average grain size [3-5]. Although the chemical
composition has also significant effect on the magnetic properties of these steels [3-5].
Various types of textures found in electrical steels are: Goss {110} <100>, cube {100}
<001> and eta {hkl} <100> [6-7]. (001) <uvw> and (111) <uvw> fiber have good and bad
texture from magnetic point of view [8, 10].Optimum grain size has to be maintained for
minimum core loss in the electrical steels. Average grain sizesof 100 µm and 150 µm for
1.85% and3.2% Si in steel respectively has been found to be adequate good magnetic
property of these steels [11, 12].
Instead of obtaining uniform texture in all directions of the CRNO steels,
randomization texture may be more beneficial for obtaining uniform magnetic properties
in these steels. Multi-step cross rolling (MSCR) has been proved to be an efficient method
for weakening the texture of the material [13-14]. Material is rotated by 90° in each step of
rolling process during MSCR [15]. Keeping this in mind the present study was aimed to
find out the effect of multi-step cross rolling of the CRNO steels on the texture,
microstructure and magnetic properties of these steels.
3
1.2 Objectives:
The following objectives are planned for the present study:
i. Effect of cross-rolling on the texture, microstructure and magnetic properties of
the CRNO steels.
ii. Investigation of above (i) for two different compositions of CRNO steels
iii. Effect of annealing of cross-rolled CRNO steels on their texture, microstructure
and magnetic properties
iv. Correlation of texture, microstructure and magnetic properties of the above (i, ii
and iii) processed samples.
1.3 Framework of the Thesis:
Five chapters are discussed in this thesis. Chapter I discusses mainly about the
introduction of the project work. Chapter II gives a general outline of electrical steels
including the factors important in deciding the electrical properties of these steels,
followed by texture of materials and their representation. Subsequently the role of texture
in improving the magnetic properties of electrical steels has been discussed based on
available literature. Chapter III includes the detailed information about the CRNO steel,
the material used in the present study and methods of sample preparation followed by their
characterization by different techniques. Chapter IV gives information about the results of
the characterizations mainly done for the measurement of the texture and the magnetic
properties of the samples and then the discussion of the result obtained. Chapter V
concludes the present project work.
4
CHAPTER 2

5
2. LITERATURE REVIEW
2.1 Electrical steels:
Electrical steel is a soft magnetic material which is manufactured by an optimum
amount of Silicon and Carbon mixture. Apart from these certain other metals are added to
enhance the property of this steel, like Aluminium, Manganese, etc. Electrical steel sheets
are functional materials prepared by adjusting the magnetic behavior of steel for proficient
magnetism and electricity translation. It is extensively used in electrical applications such
as core material like transformer cores, motor and generator preferably [16]. A flow sheet
is shown in Figure 2.1 [17] for the production steps generally adopted in the production of
electrical steels.
Fig.2.1 manufacturing procedure of electrical steel [17].
2.1.1Factor affecting the Properties of electrical steel:
Electrical steel has three factors: i.e. composition, texture and grain size which are
responsible for variation in properties. In electrical steel, silicon increases the resistivity
which helps to decreases the eddy current loss. 0 to 6.5% of silicon is used in electrical
steel making process but at commercial level, 3.0% of silicon is allowed because if silicon

6
content is higher than 3%, cold deformability is considerably afflicted and brittleness
during cold rolling operation. Al and Mn are allowed up to 0.5% in electrical steel. Al and
Mn both act as a growth inhibitors up to 0.5% in electrical steel and if Al and Mn increase
more than 0.5% then formation of grain growth is abnormal at lower temperature. Carbon
percentage is not exceeded to 0.8 % because beyond this of carbon, ductility of electrical
steel decreases [18]. Except (111) <uvw> fiber, all fibers improve the magnetic properties
and (100) <uvw> is the most fiber for electrical steel. Hysteresis loss decreases with
increasing magnetic domain size and domain size increases with increasing grain size in
electrical steel. When grain size increases in electrical steel then eddy current component
of core loss also increases. Permeability is also a factor which effects the material, higher
permeability is required in electrical steel because permeability direct affect the core loss
of material. Formability of electrical steel should be maintain after thermo-mechanical
processing, good formability is required for soft magnetic material.
2.1.2 Type of electrical steels:
Grain-oriented electrical steel (GO).
Grain-non-oriented electrical steel (GNO).
Fig.2.2Effect of addition of silicon on various properties like % of elongation, crystal isotropy,
saturation induction [18]

7
2.1.2.1 Grain oriented electrical steel:
The term grain oriented is used to appoint electrical steels that possess magnetic
properties which are strongly oriented along the rolling direction. Electrical steel having a
huge amount of Goss texture (110) [001] are called GO, and it is utilized where
unidirectional magnetic flux is required. We know that the magnetization direction whose
Goss texture is<100>is parallel to rolling direction [19]. The Goss texture of GO is
controlled to minimize the core loss. Grain-oriented electrical steel is produced at very
low level due to its economical factor, but its positive point is its attractive properties e.g.,
its unidirectional magnetic property and mechanical property. CRGO Grain Oriented
Laminations are so huge that good physical nature would be difficult to retain after an
843°C stress relief anneal [20].
2.1.2.2 Non-oriented electrical steel:
GNO are electrical steels in which high amount of Goss texture is absent and its
main technological use is the advancement in rotary electrical machinery like stator and
rotor which has its magnetic field in the same plane that the sheet has, but the angle
connecting the electric field, magnetic field, and rolling direction always alters while
performing operation. In non-oriented electrical steel, there is no possibility of
magnetization in the direction of <111> fiber, while the same can be achieved easily in the
direction parallel to rolling direction for material, i.e. <100>, and suitable texture would be
{100} <uvw>, also called <100> fiber texture, where most of the grains would have their
{100} planes parallel to the plane of the sheet [20]. Non-Grain Oriented Electrical steel
comprises between 0.5 and 3.25% Si and up to 0.5% Al, added to increase resistivity and
lower the temperature of primary recrystallization [21]. For getting the random texture
and uniform magnetic properties, we go for annealing operation. Production of non-
oriented electrical steel is very high tonnage level today.
2.2 Texture:
If material shows crystallographic texture then it means grains are not randomly
distributed. Texture is one of the parameters which affect the magnetic properties [22]. If
the material has good texture then it is easily magnetized otherwise if the material has bad
texture then magnetization of material faces difficulty. The crystallographic texture could

8
be illustrated by Orientation Distribution Function (ODF) or Pole Figure (PF).
Morphological texture is explained in figure 2.2 [23]. When all possible orientations of the
crystallites occur with equivalent frequency, the orientation requirement of properties will
disappear due to averaging, and the polycrystalline material can be said isotropic.
Complete isotropic characteristics are difficult to achieve, sometimes desirable and
sometimes undesirable. All grains are oriented so that the {0 0 1} planes lie nearly parallel
to the plane of the sheet and the <100> directions point almost in the rolling direction. The
texture {0 0 1} <100> is highly necessary in substrates for high Tc superconductors [24].
Goss textures {1 0 0} <001> are usually preferred in magnetic materials, in which it is
easier to magnetize in the cube edge<100> direction. The texture is easily described by a
set of pole figures with the help of X-ray diffraction technique.
Fig.2.3 (a)preffered texture in material, (b) random texture in material, (c) some orientation is
texture and same random [24]
2.2.1 Grain orientation:
The theory of grain orientation is very significant for us because it has the direct
relation with Pole figure and Orientation distribution function. The grains’ orientation is
always represented relative to the coordinate system. The exterior reference plane is

9
having three directions: (rolling direction (RD), normal direction (ND), and transverse
direction (TD)) as in the flat products like a plate or sheet. The grain orientation for a sheet
is shown in the below figure 2.3 [18]. Grain orientation is defined by Miller indices which
are formulated as (hkl) [uvw]. (hkl) Shows the plane and [uvw] shows the direction. It
shows that the direction [uvw] is parallel to the rolling direction, and a plane (hkl) is
parallel to the rolling plane [25]. Crystal orientation is explained by a set of Miller indices
for axisymmetric products like extruded bar and wire which indicates that this
crystallographic direction is parallel to the sample axis.
Fig.2.4 :( a) orientation of grain in polycrystalline material, (b) miller indices and three
direction RD, ND, TD in sheet [25].
2.2.2 Pole Figure:
The pole figure is the two-dimensional representation of stereographic projection,
with crystal orientation defined relative to the specimen geometry, which shows the
change of pole density with pole orientation for a chosen set of crystal plane {hkl}. For
analysis the pole figure for rolled sheet of cubic material is explained below: A rectangular
portion of sheet material is correlated with three mutually perpendicular specimen
parameters perpendicular to the sheet plane, the rolling direction (RD), the transverse
direction (TD), and normal direction (ND). When specimen (part of the sample) is too
small like point and is placed at the center of the large reference sphere then the following
procedure is performed for drawing stereographic projection, where ND is situated at
center and TD and RD are on the periphery of the sphere [26]. The three mutually
perpendicular planes (100), (010), and (001) of a rectangular specimen are considered to
be in the sphere as shown in the figure 2.4(c), which are perpendicular to each other.
Points 100, 010, and 111 in figure are poles of planes with these three set of Miller
10
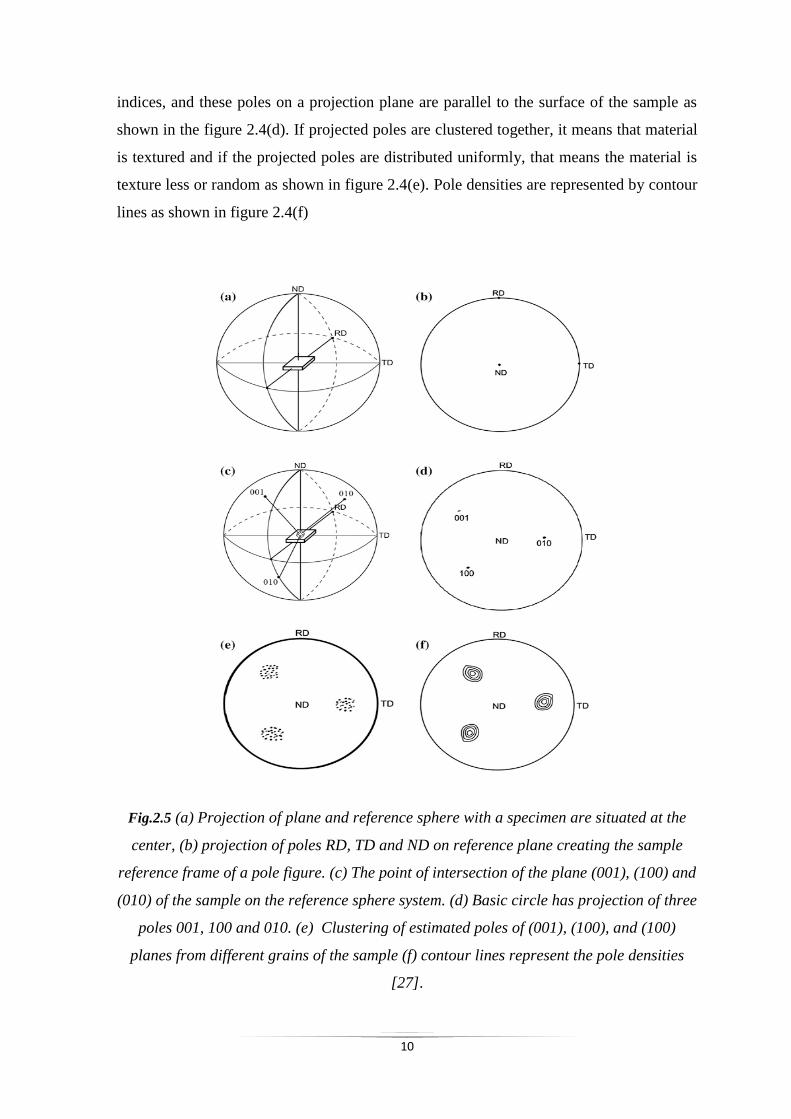
indices, and these poles on a projection plane are parallel to the surface of the sample as
shown in the figure 2.4(d). If projected poles are clustered together, it means that material
is textured and if the projected poles are distributed uniformly, that means the material is
texture less or random as shown in figure 2.4(e). Pole densities are represented by contour
lines as shown in figure 2.4(f)
Fig.2.5 (a) Projection of plane and reference sphere with a specimen are situated at the
center, (b) projection of poles RD, TD and ND on reference plane creating the sample
reference frame of a pole figure. (c) The point of intersection of the plane (001), (100) and
(010) of the sample on the reference sphere system. (d) Basic circle has projection of three
poles 001, 100 and 010. (e) Clustering of estimated poles of (001), (100), and (100)
planes from different grains of the sample (f) contour lines represent the pole densities
[27].
11
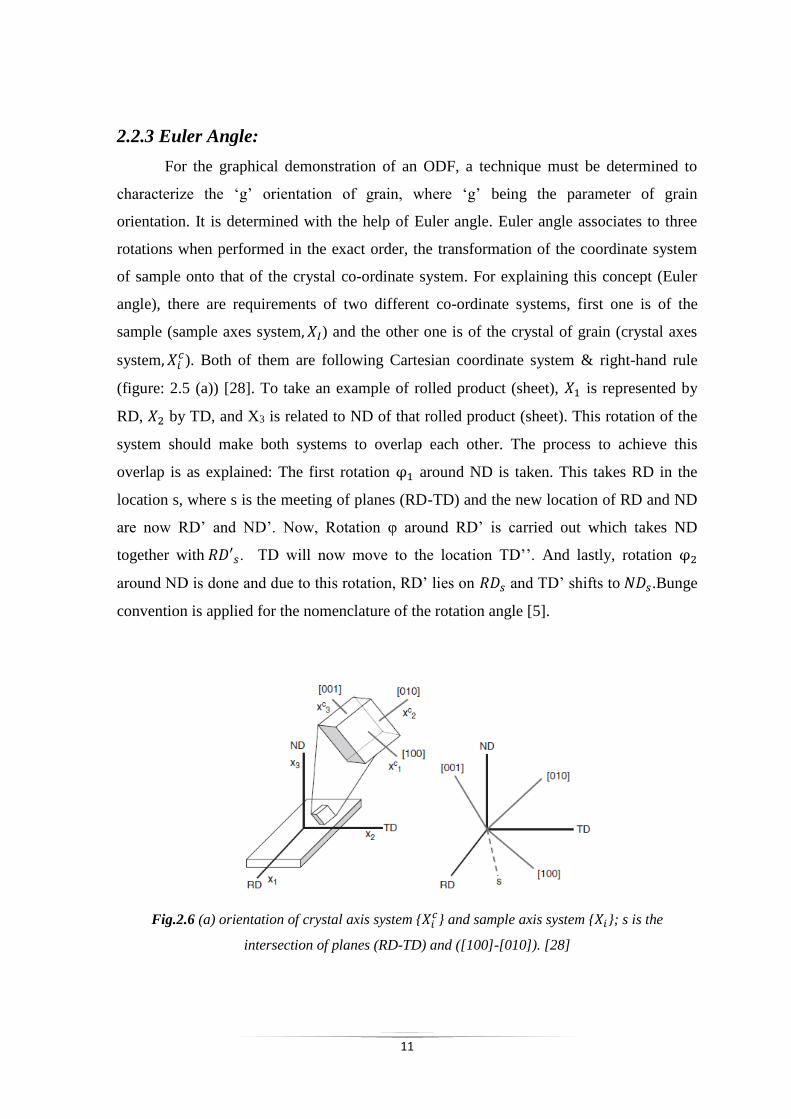
2.2.3 Euler Angle:
For the graphical demonstration of an ODF, a technique must be determined to
characterize the ‘g’ orientation of grain, where ‘g’ being the parameter of grain
orientation. It is determined with the help of Euler angle. Euler angle associates to three
rotations when performed in the exact order, the transformation of the coordinate system
of sample onto that of the crystal co-ordinate system. For explaining this concept (Euler
angle), there are requirements of two different co-ordinate systems, first one is of the
sample (sample axes system, 𝑋𝐼) and the other one is of the crystal of grain (crystal axes
system, 𝑋𝑖𝑐). Both of them are following Cartesian coordinate system & right-hand rule
(figure: 2.5 (a)) [28]. To take an example of rolled product (sheet), 𝑋1 is represented by
RD, 𝑋2 by TD, and X3 is related to ND of that rolled product (sheet). This rotation of the
system should make both systems to overlap each other. The process to achieve this
overlap is as explained: The first rotation φ1 around ND is taken. This takes RD in the
location s, where s is the meeting of planes (RD-TD) and the new location of RD and ND
are now RD’ and ND’. Now, Rotation φ around RD’ is carried out which takes ND
together with 𝑅𝐷′𝑠. TD will now move to the location TD’’. And lastly, rotation φ2
around ND is done and due to this rotation, RD’ lies on 𝑅𝐷𝑠 and TD’ shifts to 𝑁𝐷𝑠.Bunge
convention is applied for the nomenclature of the rotation angle [5].
Fig.2.6 (a) orientation of crystal axis system {𝑋𝑖𝑐} and sample axis system {𝑋𝑖}; s is the
intersection of planes (RD-TD) and ([100]-[010]). [28]

12
Fig. 2.6(b) description of Euler angles𝜑1, φ and 𝜑2 by Bunge convention in the samples [29].
The first rotation 𝜑1 around ND is taken; this takes RD in the location s, where s is the
meeting of planes (RD-TD) and ([100]-[010]). The new locations of RD and ND are now
RD’ and ND’.
Rotation φ around RD’; this takes ND together with [001]; TD will move to the location
TD’’.
A rotation 𝜑2 around ND (which is now equal to [001]); due to this rotation, RD’ lies on
[100] and TD’’ shifts to [010].
Fig. 2.6. (c): this diagram demonstrations that how rotation through the Euler angle𝜑1, φ, 𝜑2 in
orderto1, 2, 3 as shown in figure [5].
2.2.4. Euler Space:
Every orientation in space is represented with the help of three Euler angles or two
Euler angles and keeping the other one constant. Three Euler angle system is used in large
sphere, referred in Pole Figure subsection, but it is cannot be used for analysis of texture
data. Two Euler angle system is used for 2D representation of texture data, keeping the
other Euler angle constant and it is normally used in real condition. Euler angles are

13
plotted in Cartesian coordinate system and separating space among them is called as Euler
space. This space is limited for𝜑1 and 𝜑2 between 0° and 360° and φ is varied from 0° to
180° (fig.) [5].
Fig. 2.7: graphical demonstration of crystallographic orientations with Euler angle [7].
2.2.5 Orientation Distribution Function:
Pole figure provides limited information due to its 3-D representation. Because of
this, we study texture through orientation distribution function (ODF) which is plotted in a
2-D manner .The ODF method is based on explaining a crystal arrangement in a process
which is entirely changed from the general explanation of a direction in the form {hkl}
⟨uvw⟩. The ODF is a mathematical function that relates the time of appearance of
particular crystal orientations in a 3-D Euler space whose coordinates are determined by
three Euler angles. These angles result from three consecutive rotations which are required
to be given to every crystallite in the specimen, in order to produce its crystallographic
axes to coincide with the specimen axes. The complete classification of orientation will
then consist of the sets of rotations described to all the crystallites in the specimen. Several
mathematical formulations have been structured which permit a mathematical function to
be resolute from the numerical data collected from PF’s that could explain the orientation
of all the crystallites in a polycrystalline material collectively in a more appropriate
manner. Such procedures have been proposed independently by Bunge [30], Roe [31].
There are two principal techniques for reconstructing an orientation distribution function
based on PF data: (i) harmonic technique which fits the coefficients of spherical harmonic
functions to the data, and (ii) discrete technique which calculates orientation distribution

14
directly in separate representation via an iterative process. If the grain orientation is
denoted by a parameter ‘g’, then the expression of ODF series is given below:
dV
V= f(g)d(g) (1)
2.3 Effect of texture on magnetic properties of Electrical Steels
Magnetic properties are controlled by cross rolling operation because cross rolling
directly affects the textural component. Thermomechanical process is required to control
the properties of materials which include hot rolling, cross rolling and annealing [7, 18,
and 28]. Non-oriented electrical steels are generally used in smaller electrical machines
likes rotor and stator, requires low and high permeability to provide low core loss. Core
loss are basically of two types, hysteresis loss and eddy current loss. Eddy current loss is
associated to resistivity and can be controlled by the composition of the material but the
hysteresis loss depends on the magnetic anisotropy, which depends on the orientation or
texture of the material and can be improved during the treating of the material [32].Cross-
cold rolling changes the initial hot-rolling texture components and produces a strong
{001}<110> component. The texture data were correlated to the magnetic properties, and
found that, hysteresis loss was 80 % of the total loss and it was due to texture and grain
size [32].
Mainly, seven type of texture components are found in cubic materials (non-oriented
electrical steel), cube {100} <001>, rotated cube {110} <110>, Goss {110} <100>, theta
{100} <uvw>, <uvw> and alpha {hkl} <110>, eta {hkl} <100>, gamma {111} [24, 33].
To compare with seven texture, cube texture is most favorable because {100} planes have
many numbers of <100> axes which can be easily magnetized. On the other hand, texture
with {111} planes does not contain <100> axes and texture with {112} planes including
<111> axes are undesirable and should not be utilized for non-oriented electrical steel.
The final texture is influenced by all processing steps which are used in the investigation
like, hot rolling, hot band annealing, cross rolling (below the recrystallization
temperature), recrystallization annealing. The texture with low intensity of {112} <111>
and {110} <001> are obtained in hot rolling, meaning that this type of textures are formed
at above recrystallization [34]. Low core loss and magnetic induction are obtained in
effective manner by using hot band annealing with high temperature. The increase in
15
planar anisotropy by hot-band annealing can be closely associated to decrease in the {211}
and {222} components and an increase in the {110} component. Recrystallization of
texture is a very important phase because new strain free grain is introduced in the region
from the strained lattice. Gamma fiber {111} <uvw>, Goss {110}<100> and cube
{100}<001> components decrease during annealing operation by recrystallization [35].

16
CHAPTER: 3

17
3.EXPERIMENTAL DETAILS
3.1 Material and Working Procedure:
2.3 mm thick sheets of materials, chemical compositions as shown in table 3.1,
were used for the present investigation. Two different samples were used for the
investigation. Sample 1 had the higher amount of aluminum as compared to sample 2
whereas sample 2 had the high amount of carbon, silicon, phosphorous and manganese.
Rolling was done to reduce the thickness of samples up to 0.5 mm by multi-step cross
rolling in the laboratory rolling mill. Throughout each pass of the samples, the true strain
was preserved 10%. After MSCR operation, samples were taken to perform an annealing
operation at 650℃, 750℃, and 850℃ for 1hr, 2hrs, and 4hrs respectively in tubular
furnace. During annealing operation, argon gas was used to create inert atmosphere, and
heat rate was maintained at 15℃/minute. Standard operations were followed to polish the
samples for the visualization of microstructure. Etching was done prior to microstructure
visualization through optical microscope and nital solution was used for etching the
samples. Average grain size was measured by Axiovision release 4.8.2 Software. This is
an image processing software by which study of high resolution microstructure can be
done.
Table 1 material confirmation (wt. %) of CRNO electrical steel.
C% Si% Mn% P% S% Cr% Ni% Mo% Al% Cu%
Sample1 0.0376 1.45 0.305 0.0201 0.018 0.007 0.0097 0.0021 0.0965 0.0120
Sample2 0.039 1.52 0.35 0.0216 0.020 0 0 0 0.0525 0
3.2 Texture characteristic:
Bruker D8 advance system was used for the characterization of bulk texture. Three
different types of pole figure (110), (200), and (211) were dignified which had normal
plane with rolling direction and transverse direction. (110), (200) and (211) planes were
interacted on the sphere in pole figure. These three points 110, 200 and 211 are referred to
as set of miller indices. These projected planes are clustered tougher and formed contour

18
due to pole intensities. ODFs were estimated using an academic software Labotex 3.0
[36]. Using this software, volume fraction was measured at different-different angles. In
present study, value of 𝜑 2was kept at a constant value of 45°while𝜑 1 was varied from 0°
to 360° and φ was varied from 0° to 360°.
3.3Magnetic Properties:
Magnetic property (core loss) was measured by Brockhaus MPG 200 machine
[37]. Core loss depends on both composition of a material and annealing condition. When
magnetic properties increase, cost of production increases in similar way, and that is why
we maintain optimum condition for manufacturing.
19
CHAPTER: 4

20
4.RESULTS AND DISCUSSION
4.1 RESULT:
4.1.1. Microstructure and grain size:
Microstructure of sample 1, which have 1.45% Si content, annealed at 650 °C for
(a) 1 hour (b) 2 hour (c) 4 hour are shown in figure 4.1. It may be observed from the figure
4.1 with increase in soaking time of annealing the grain size was increased.
Figure 4.1 microstructure of 1.45% Si CRNO electrical steel annealed at 650 °C for (a) 1 hour (b)
2 hours(c) 4 hours.
(a) (b)
(c)
100µm
100µm 100µm

21
Figure 4.2 represents the microstructures of 1.45% Si CRNO electrical steel
(sample 1) which were annealed at 750°C for (a) 1 hour, (b) 2 hours, and (c) 4 hour. This
condition had coarse grains as compared to previous conditions of annealing (i.e. 650 °C).
Also abnormal grain growth of the sample was observed at 4 hrs of annealing time.
Figure 4.2 microstructure of 1.45% Si CRNO electrical steel annealed at 750 °C for (a) 1 hour (b)
2 hours(c) 4 hours.
Figure 4.3 represents microstructure of sample 1 which contains 1.45% Si
annealed at 850°C for (a) 1 hour, (b) 2 hours, and (c) 4 hours. In these conditions, the
grain size was observed to be higher than that of previous conditions of annealing. The
abnormality of grain growth was also observed in this condition of annealing.
(a) (b)
(c)
100µm
100µm 100µm

22
Figure 4.3 microstructure of 1.45% Si CRNO electrical steel annealed at 850 °C for (a) 1 hour (b)
2 hours(c) 4 hours.
Figure 4.4 represents microstructure of sample 2 which contains 1.52% Si
annealed at 650°C for (a) 1 hour, (b) 2 hours, and (c) 4 hours. Figure indicates that the
grain size increased with increasing the soaking time of annealing of the samples.
(a) (b)
(c)
100µm
100µm 100µm

23
Figure 4.4 microstructure of 1.52% Si CRNO electrical steel annealed at 650 °C for (a) 1 hour (b)
2 hours(c) 4 hours.
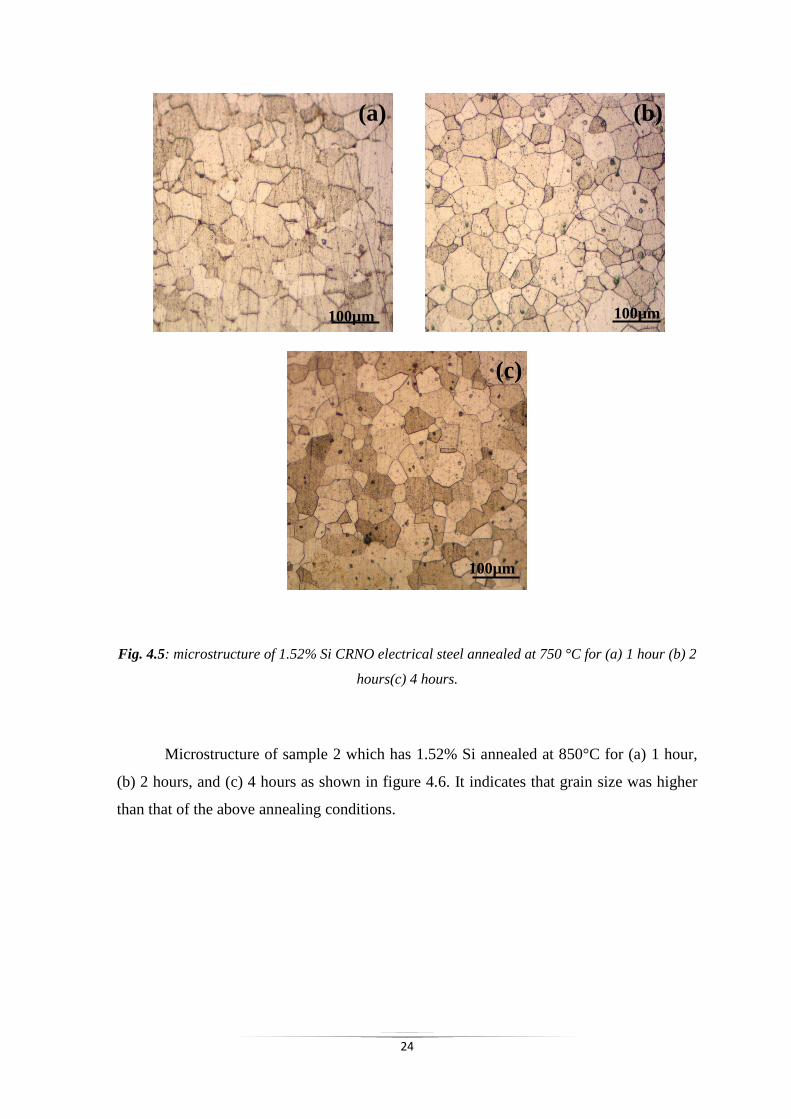
Microstructure of sample 2 which has 1.52% Si content annealed at 750°C for (a) 1
hour, (b) 2 hours, and (c) 4 hours are shown in figure 4.5. An insignificant increase in
grain size with increase in soaking time of annealing was observed.
(a) (b)
(c)
100µm
100µm 100µm
24
Fig. 4.5: microstructure of 1.52% Si CRNO electrical steel annealed at 750 °C for (a) 1 hour (b) 2
hours(c) 4 hours.
Microstructure of sample 2 which has 1.52% Si annealed at 850°C for (a) 1 hour,
(b) 2 hours, and (c) 4 hours as shown in figure 4.6. It indicates that grain size was higher
than that of the above annealing conditions.
(a) (b)
(c)
100µm
100µm 100µm

25
Figure4.6 microstructure of 1.52% Si CRNO electrical steel annealed at 850 °C for (a) 1 hour (b)
2 hours(c) 4 hours.
Formation of equiaxed grains were observed in both samples. Grain size was
dependent on temperature and time. Normal grain growth took place at 650°C for less
duration (1 hr and 2 hrs) in sample 1 but when the soaking time was increased to 4 hours,
the abnormal grain growth was observed. However, the normal grain growth was
observed in the sample 2 during different conditions of annealing. Average grain size of
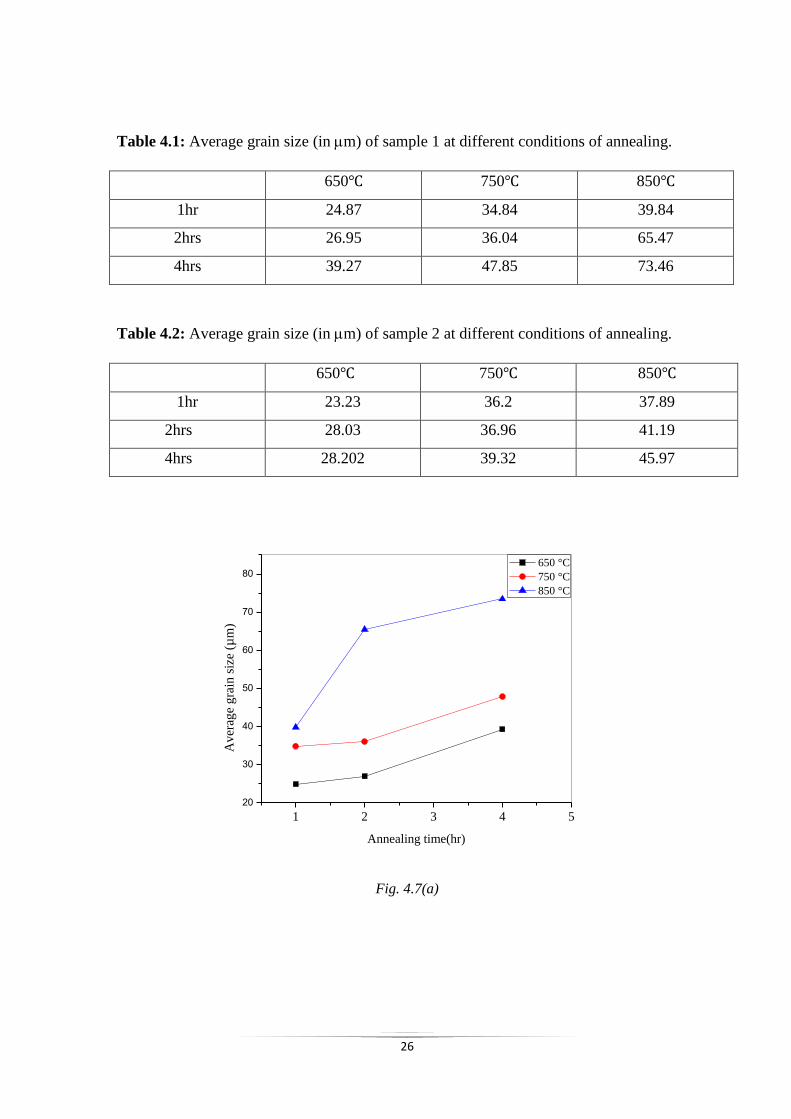
sample 1 and sample 2 are shown in figure 4.7(a) and 4.7(b) respectively and reading of
average grain size are given in table no 4.1 and 4.2 respectively. From figure 4.7 (a) and
4.7 (b), it was observed that the average grain size increased with increasing the time and
temperature of annealing.
(a) (b)
(c)
100µm
100µm 100µm
26
Table 4.1: Average grain size (in m) of sample 1 at different conditions of annealing.
650℃ 750℃ 850℃
1hr 24.87 34.84 39.84
2hrs 26.95 36.04 65.47
4hrs 39.27 47.85 73.46
Table 4.2: Average grain size (in m) of sample 2 at different conditions of annealing.
650℃ 750℃ 850℃
1hr 23.23 36.2 37.89
2hrs 28.03 36.96 41.19
4hrs 28.202 39.32 45.97
1 2 3 4 5
20
30
40
50
60
70
80
Av
erag
e g
rain
siz
e (µ
m)
Annealing time(hr)
650 °C
750 °C
850 °C
Fig. 4.7(a)

27
1.0 1.5 2.0 2.5 3.0 3.5 4.0
20
30
40
50
60
70
80
Av
erag
e gra
in s
ize(
µm
)
Annealing time(hr)
650 °C
750 °C
850 °C
Fig.4.7 (b)
Fig.4.7: variation of average grain size of (a) 1.45% Si and (b) 1.52% Si CRNO electrical steel
with annealing time at different temperature.
4.1.2 TEXTURE:
Orientation distribution function (ODF) of sample1 and sample 2 are given in
figure 4.8 to figure 4.14, where φ2is kept constant at 45o. Texture formation in contur
form are shown in these figures.
Fig.4.8: φ2=45° section ODFs of 1.45% Si CRNO electrical steel (before annealing).

28
Fig.4.9: φ2=45° section ODFs of 1.45% Si CRNO electrical steel annealed at 650 °C for (a) 1
hour (b) 2 hours(c) 4 hours.
(a) (b)
(c)
29
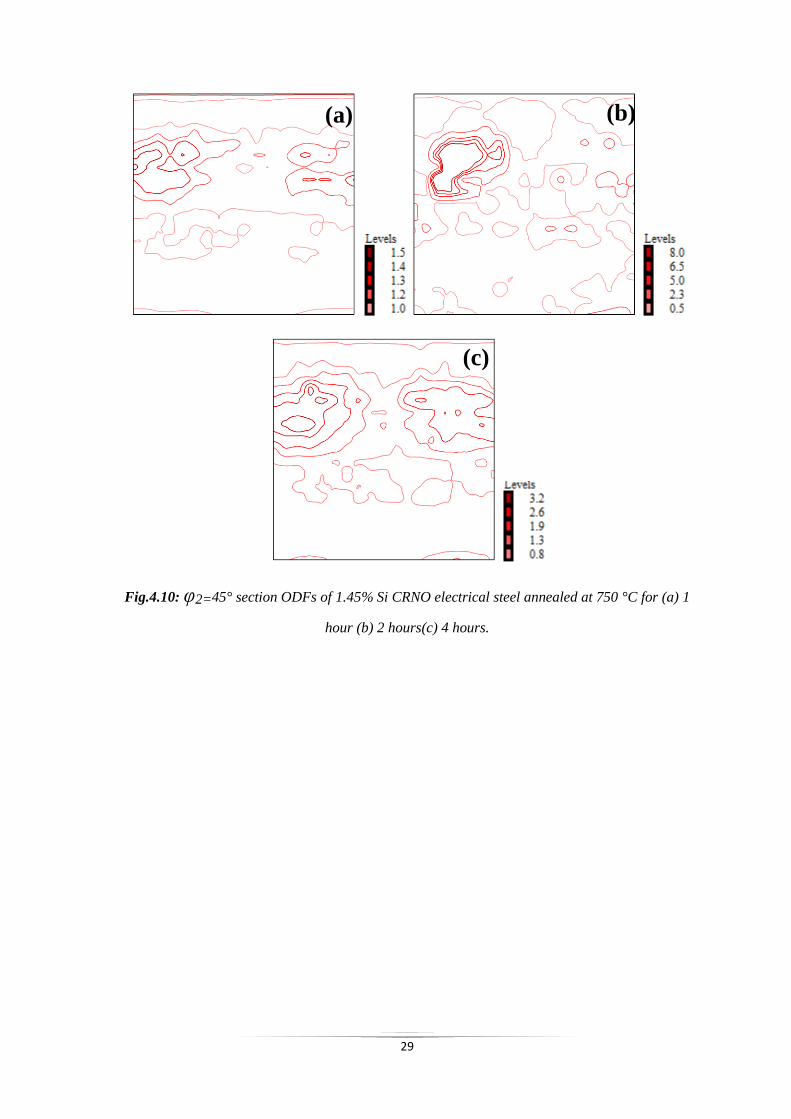
Fig.4.10: φ2=45° section ODFs of 1.45% Si CRNO electrical steel annealed at 750 °C for (a) 1
hour (b) 2 hours(c) 4 hours.
(a) (b)
(c)

30
Fig.4.11: φ2=45° section ODFs of 1.45% Si CRNO electrical steel annealed at 850 °C for (a) 1
hour (b) 2 hours(c) 4 hours
.
(a) (b)
(c)

31
Fig. 4.12: φ2=45° section ODFs of 1.52% Si CRNO electrical steel annealed at 650 °C for (a) 1
hour (b) 2 hours(c) 4 hours.
(a) (b)
(c)

32
Fig. 4.13: φ2=45° section ODFs of 1.52% Si CRNO electrical steel annealed at 750 °C for (a) 1
hour (b) 2 hours(c) 4 hours.
(a) (b)
(c)

33
Fig. 4.14: φ2=45° section ODFs of 1.52% Si CRNO electrical steel annealed at 850 °C for (a) 1
hour (b) 2 hours(c) 4 hours.
The volume fraction of sample 1 and sample 2 are shown in figure 4.15 and figure
4.16 and volume fractions are given in tabular form in table no 4.3 and 4.4 at different
temperature and time. It has come to notice that at different annealing conditions the γ-
fiber was distinct. The figure shows that volume fraction (VF) of (111) <uvw> fiber
decreases at 650°C in sample 1and increases in sample 2 during 1hr to 2hrs. At same
condition, volume fraction of (110) fiber is increasing in sample 1, little higher than
volume fraction of (111) <uvw> fiber and volume fraction of (110) <uvw> fiber is also
increasing in sample 2 but less than volume fraction of (111) <uvw> fiber. At 650°C and
4hrs, (111) <uvw> fiber and (110) <uvw> fiber are almost same in sample 1 and sample 2
but VF is different for both samples. VF of (110) <uvw> fiber is higher at 750°C in
sample 1 and VF of (110) <uvw> fiber is also higher from VF of (111) <uvw> fiber but
both are decreasing for 1hr and 2hrs conditions in sample 2. At 850°C, VF of (110)
(a) (b)
(c)
34
<uvw> fiber is increasing till 2hrs then after decreasing and VF of (111) <uvw> fiber is
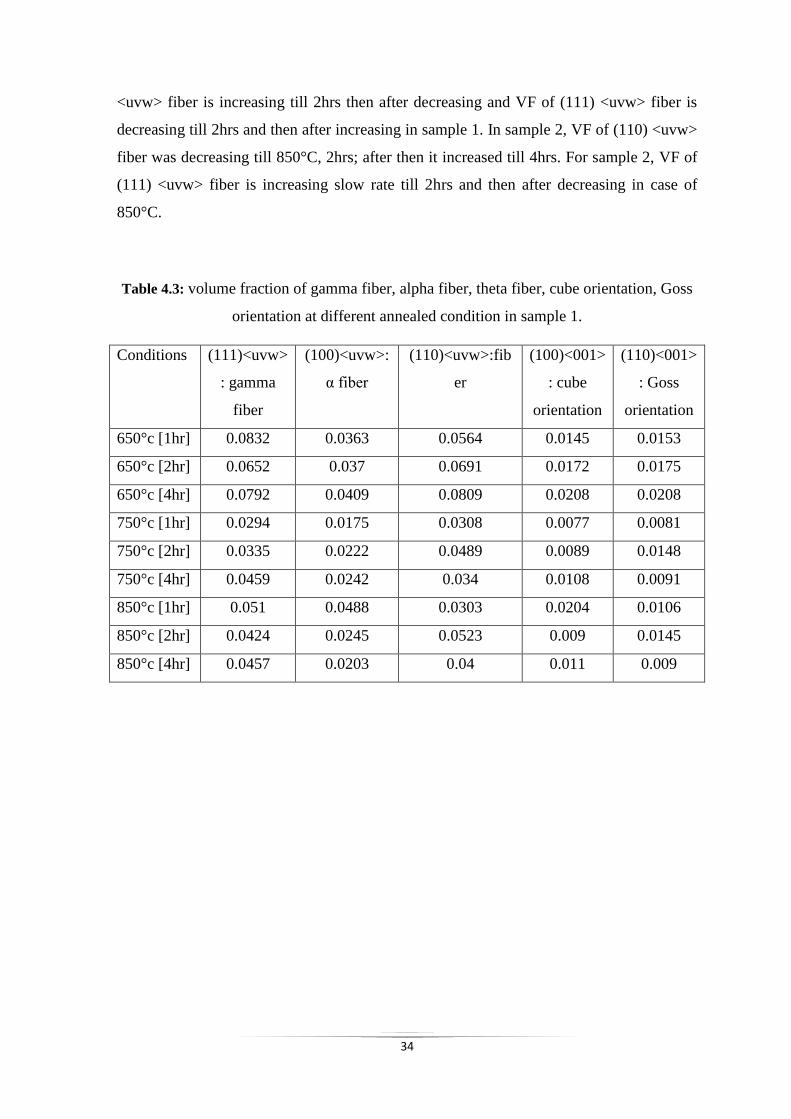
decreasing till 2hrs and then after increasing in sample 1. In sample 2, VF of (110) <uvw>
fiber was decreasing till 850°C, 2hrs; after then it increased till 4hrs. For sample 2, VF of
(111) <uvw> fiber is increasing slow rate till 2hrs and then after decreasing in case of
850°C.
Table 4.3: volume fraction of gamma fiber, alpha fiber, theta fiber, cube orientation, Goss
orientation at different annealed condition in sample 1.
Conditions (111)<uvw>
: gamma
fiber
(100)<uvw>:
α fiber
(110)<uvw>:fib
er
(100)<001>
: cube
orientation
(110)<001>
: Goss
orientation
650°c [1hr] 0.0832 0.0363 0.0564 0.0145 0.0153
650°c [2hr] 0.0652 0.037 0.0691 0.0172 0.0175
650°c [4hr] 0.0792 0.0409 0.0809 0.0208 0.0208
750°c [1hr] 0.0294 0.0175 0.0308 0.0077 0.0081
750°c [2hr] 0.0335 0.0222 0.0489 0.0089 0.0148
750°c [4hr] 0.0459 0.0242 0.034 0.0108 0.0091
850°c [1hr] 0.051 0.0488 0.0303 0.0204 0.0106
850°c [2hr] 0.0424 0.0245 0.0523 0.009 0.0145
850°c [4hr] 0.0457 0.0203 0.04 0.011 0.009

35
Table 4.4: volume fraction of gamma fiber, alpha fiber, theta fiber, cube orientation, Goss
orientation at different annealed condition in sample 2.
conditions (111)<uvw>
: gamma
fiber
(100)<uvw>
:α fiber
(110)<uvw>:fib
er
(100)<001>
: cube
orientation
(110)<001>
: goss
orientation
650°c [1hr] 0.0714 0.0723 0.0539 0.0299 0.0093
650°c [2hr] 0.1017 0.0392 0.0853 0.0163 0.013
650°c [4hr] 0.074 0.0431 0.0752 0.0195 0.0144
750°c [1hr] 0.0657 0.0394 0.0751 0.0174 0.0156
750°c [2hr] 0.0568 0.0395 0.0685 0.0147 0.0119
750°c [4hr] 0.0584 0.0384 0.07 0.0139 0.0131
850°c [1hr] 0.0505 0.0266 0.0693 0.0122 0.0138
850°c [2hr] 0.0618 0.0273 0.0421 0.0113 0.0062
850°c [4hr] 0.0703 0.0317 0.0842 0.0163 0.0152
Fig 15(a)

36
Fig 15(b)
Fig 15(c)
Fig. 4.15: variation of volume fraction of (111) <uvw> {γ fiber}, (110)<uvw> {α fiber},
(100)<uvw> {θ fiber}, (100)<001>{cube orientation},(110)<001>{Goss orientation} of sample 1
annealed at (a) 650°C (b) 750°C (c) 850°C.

37
Fig 16(a)
Fig 16(b)
38
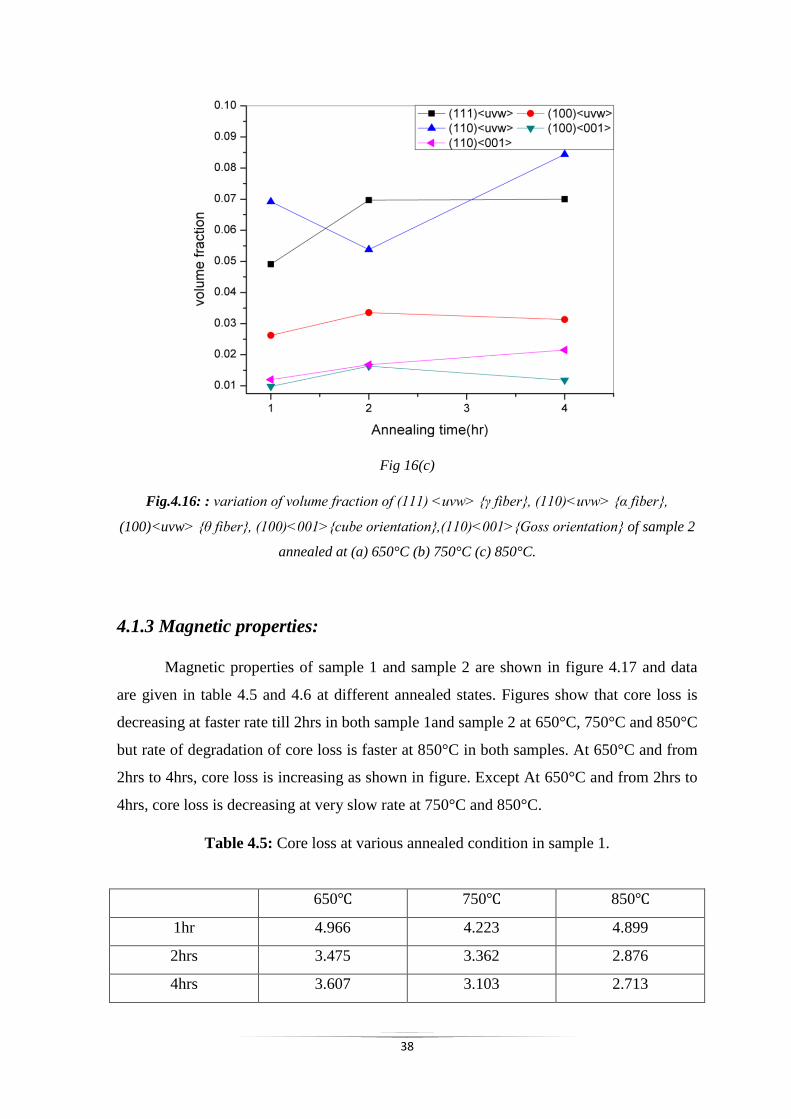
Fig 16(c)
Fig.4.16: : variation of volume fraction of (111) <uvw> {γ fiber}, (110)<uvw> {α fiber},
(100)<uvw> {θ fiber}, (100)<001>{cube orientation},(110)<001>{Goss orientation} of sample 2
annealed at (a) 650°C (b) 750°C (c) 850°C.
4.1.3 Magnetic properties:
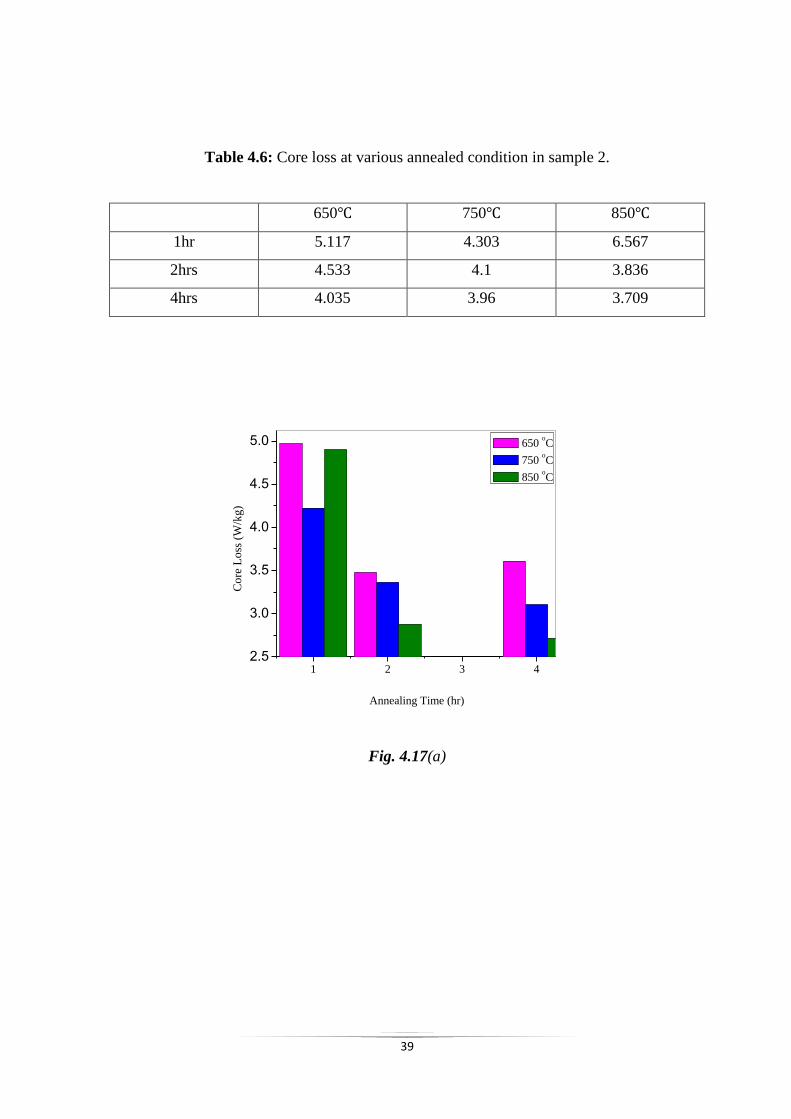
Magnetic properties of sample 1 and sample 2 are shown in figure 4.17 and data
are given in table 4.5 and 4.6 at different annealed states. Figures show that core loss is
decreasing at faster rate till 2hrs in both sample 1and sample 2 at 650°C, 750°C and 850°C
but rate of degradation of core loss is faster at 850°C in both samples. At 650°C and from
2hrs to 4hrs, core loss is increasing as shown in figure. Except At 650°C and from 2hrs to
4hrs, core loss is decreasing at very slow rate at 750°C and 850°C.
Table 4.5: Core loss at various annealed condition in sample 1.
650℃ 750℃ 850℃
1hr 4.966 4.223 4.899
2hrs 3.475 3.362 2.876
4hrs 3.607 3.103 2.713
39
Table 4.6: Core loss at various annealed condition in sample 2.
650℃ 750℃ 850℃
1hr 5.117 4.303 6.567
2hrs 4.533 4.1 3.836
4hrs 4.035 3.96 3.709
Fig. 4.17(a)
1 2 3 42.5
3.0
3.5
4.0
4.5
5.0
Co
re L
oss
(W
/kg
)
Annealing Time (hr)
650 oC
750 oC
850 oC

40
1 2 3 43.5
4.0
4.5
5.0
5.5
6.0
6.5
7.0
Co
re L
oss
(W
/kg
)
Annealing Time (hr)
650 oC
750 oC
850 oC
Fig. 4.17(b)
Fig.4.17 Variation core loss (W/kg) with respect to time (hr.) at various temperature (℃) for
sample 1 and 2 in figure (a) and (b).
4.2 Discussion:
Chemical composition, crystallographic texture and grain size are the three major
factors which are responsible for the magnetic properties of the electrical steels [19, 20,
38, 39]. To increase the resistivity of the steel some elements like P, Si, Al, Mn are mixed
with it [40, 41]. The magnetic property of the steels is affected by the major elements i.e.,
Carbon and Sulfur and that is why the content of these elements should be less in steel for
better magnetic properties although this effect can be recovered by second phase
precipitation [42, 43]. The alloying elements help in controlling the texture by preventing
the growth. Manganese is the best example of growth inhibitor generator for non-oriented
steels during annealing [44]. Manganese form MnS during heat treatment of the samples
which is helpful to reduce inclusion. This may be the reason for sample 2 of having lower
grain size than sample1 in all annealing conditions. It has also come to notice that
although sample 1 contains Al which is also a growth inhibitor generator, it shows
abnormality in grain growth at high temperature [45]. However, Al has been observed to
be harmful for the working efficiency of the samples and this could be resulting in energy

41
loss during cold rolling which in turn affects the grain growth. Sample 1 has higher grain
size and due to this, permeability increases.
During production of steels the thermo-mechanical processes help to control the
crystallographic texture and grain size. It has been found that for better magnetic
properties of steels, an optimum grain size, lower (111) <uvw> fiber and higher other
fibers are required [1, 33, 34, 39,]. When VF of (111) <uvw> fiber decreases and other
fiber increase then samples provide lower core loss. Annealing at longer duration in given
temperature, variation in texture is not much more but degradation in core loss happens in
slow manner. Because of this reason the produced samples via this process (annealing for
the longer time) affect cost economy. Higher grain size means having lower core losses
[46]. From the point of view of magnetic property, it was indicated that the abnormality of
grain growth was not harmful for sample 1. It has been found that randomized texture is
formed in all directions in both samples.
42
CHAPTER: 5

43
5.CONCLUSION
5.1 Conclusion:
Microstructure, texture and magnetic properties of CRNO steel having different
compositions have been studied and following conclusions can be drawn:
A sample having higher amount of Aluminium produces abnormal grain growth
during annealing of the material.
A sample having higher amount of Manganese produces normal grain growth
during annealing process of the material.
MSCR and annealing process had significant impact on texture development in
the sample. A near equal texture was observed in the samples.
With an increase in grain size of the samples decreased the core losses in the
samples.

44
REFERENCES
1. B. Verlinder, J. Driver, I. Samajdar, R. D. Doherty, (2007) Thermo-Mechanical
Processing Of Metallic Materials, Elsevier Ltd, UK, pp. 428-439.
2. H.Heydari A.Lzadiam, (2008) Phenomena of forward and backward rotation fields
respect of localized flux distribution and core losses in single phase induction motor,
IEEE Trans. Magn. 58, pp. 255-265.
3. C.M.B. Bacaltchuk et al, (2003) Effect of magnetic field applied during secondary
annealing on texture and grain size of silicon steel, scriptamaterialia, 85, pp. 1343-
1347.
4. R. Prem Kumar, I. Samajdar, N.N. Viswanathan, V. Singal, V. Seshadri (2003)
Relative effect(s) of texture and grain size on magnetic properties in a low silicon
non-grain oriented electrical steel, J. Magn. & Magn. Mater. 264, pp. 75-85.
5. V. Randle and O. Engler, (2000) Introduction to Texture Analysis: Macrotexture,
Micro Texture and Orientation Mapping, Gordon and Breach Science Publishers. pp.
15-59.
6. A. De Paepe, K. Eloot, J. Dilewijns, and C. Standaert, (1996) Effect of hot rolling
parameterson the magnetic properties of a low-silicon ultralow- carbon steel, J.
Magn. &Magn. Mater. 160, pp. 125-135.
7. Amar JaspritDungdung and Rakesh Kumar Sethy, (2014) Textural and Magnetic
Properties of Cross-Rolled Silicon Steels, NIT Rourkela.
8. G. Lyudkoushy, P.K. Rastogi, M. Bala, (1986), Non-oriented electrical steel, J.
Metals. 22, pp. 15-24.
9. G. Lyudkoushy, J.M. Shapiro, (1985), J. Appl. Phys. 57 (1), pp. 4235.
10. B. Cornut, A. Kedous-Lebouc, (1996), Th. Waeckerle, J. Magn. Magn. Mater.160
pp. 98-109.
11. T. Ros-Yanez, Y. Houbaert, (2003), O. Fischer and J. Schneider: Production of High
Silicon Steel for Electrical Applications by Thermomechanical Processing, J. Mater.
Process. Tech. 141, pp. 252-259.
12. F. J. G. Landgraf, J. R. F. da Silveira, D Rodrigues-Jr, (2011), determining the effect
of grain size and maximum induction upon coercive field of electrical steels,
Elsevier, J. Magn. Magn. Mater, 368, pp. 2335-2339.

45
13. S.M.Shin, S.Birosca, S.K.Chang, (2008), texture evolution in grain oriented
electrical steel during hot band annealing and cold rolling, IEEE Trans. Magn. pp.
460-474.
14. Youliang He, Erik J. Hilinski, (2016), Texture and magnetic properties of non-
oriented electrical steels processed by an unconventional cold rolling scheme, J.
Magn.&Magn. Mater, 204, pp. 337-352.
15. M. Rout, S. K. Pal and S. B. Singh, (2015), Cross Rolling: A Metal Forming
Process, pp. 41-64.
16. Steel statistical yearbook, (2009), World Steel Association, World steel Committee
on Economic Studies, Brussels, pp. 50-64.
17. B. D. Cullity, C.D. Graham, (2009), Introduction to Magnetic Materials, 2nd
Edition, John Wiley & Sons, 23, pp. 432-447.
18. D. Prusty, H.K. Pradhan, (2012), An Investigation on Texture Property Correlation
in Cold Oriented Silicon Steels, National Institute of Technology, Rourkela.
19. Jae Kyoum Kim, (2014), the evolution of the goss and cube textures in electrical
steel, materials letters, 56, pp. 110-113.
20. Wenk H.-R., (1985), Preferred Orientation in Deformed Metals and Rocks: An
Introduction to Modern Texture Analysis, Academic Press, and Orlando 24, pp.
54-68.
21. http://crgosteel.com/index.htm.
22. Roger D. Doherty and Surya R. Kalidindi, (2008), Microstructure Evolution in
Deformed and Recrystallized Electrical Steel, Dejan Stojakovic, 33, pp. 325-389.
23. Aernoudt E., Van Houtte P. Leffers T., (1993), Deformation and textures of metals
large strain, in Materials Science and Technology, R.W. Cahn (ed.), 6, pp. 74-89.
24. Satyam Suwas AND Nilesh P. Gurao, (2008), Crystallographic texture in Materials,
journal.lib.IIsc, pp. 224-238.
25. C. Maddison, (2008), Generators: Improvements and New Developments –
Requirements on Electrical Steels, Proceedings of 3rd International, Conference on
Magnetism and Metallurgy, Ghent University, Gent-Zwijnaarde, pp. 35-38.
26. Ray RK, Jonas JJ, (1990), Transformation textures in steels, Int Mater, 35, pp. 1–36.
27. S. Suwas and R. K. Ray, (2014), Crystallographic Texture of Materials, Springer, pp.
10-22.
28. J.A. Szpunar, in: H.J. Bunge (Ed.), (1988), Texture, Anisotropy in Magnetic Steels,
Direction Properties of Materials, CuvllierVerlag, Gttingen, 13, pp. 124-134.

46
29. Bessieres, J., Heizmann, J.J. and Eberhardt, A, (1991), Textures and Microstructures,
23, pp. 153-159.
30. Bunge HJ, (1965) Zurdarstellungallgemeiner texture. Z Metallkd, 5, pp. 872–874.
31. Roe RJ, (1965), Description of crystallite orientation in polycrystalline materials. III.
General solution to pole figure inversion. J Appl Phys. 8, pp. 2024–2031.
32. M. Rout, S. K. Pal and S. B. Singh, (2015), Cross Rolling: A Metal Forming
Process, pp. 41-64.
33. Yasihiki H. Okamoto, (1987), Effect of hot band grain size on magnetic properties of
non-oriented electrical steels, IEEE Trans Magn, 23, pp. 3086–3088.
34. H. Yasihiki and Okamoto, (2002), Effect of hot band grain size on magnetic
properties of nonoriented electrical steels, IEEE Trans. Magn. 23, pp. 3086.
35. B. Verlinder, J. Driver, I. Samajdar, R. D. Doherty, (2007) Thermo-Mechanical
Processing Of Metallic Materials, Elsevier Ltd, UK, pp. 428-439
36. K.Pawlik, P.Ozga, (1999), LaboTex: the texture analysis software, Gottinger
Arbeitenzur Geologie und Palaontologie, SB4.
37. Helmut Brockhaus, Dinslaken, (2007), Method for Operating a Measuring
Instrument, patent no: US7171336 B6.
38. K. Matsumura, B. Fukuda, (1984), Magnetic Materials in Japan: Research,
Applications and Potential IEEE Trans. Magn. MAG-20, 5, pp. 1533-1554.
39. M.F. de Campos, J.C. Teixeira, F.J.G. Landgraf, (2006), the optimum grain size for
minimizing energy losses in iron, J. Magn. & Magn. Mater. 235, pp. 94-99.
40. C. J. Van Tyne, (2014), Comprehensive Materials Processing, 13, pp. 198-208.
41. Yuqing Weng, (2011), Advanced Steels: The Recent Scenario in Steel Science and
Technology, the Chinese society for metals, Beijing, pp. 116-128.
42. S. Nishijima and S. lwata, (1997), computerization and networking of material
databases, 4, pp. 8-13.
43. K. C. Liao, (1986), the effect of manganese and sulfur contents on the magnetic
properties of cold rolled lamination steels, Technical Centers, National Steel
Corporation, 18, pp. 1259-1266.
44. Taisei Nakayama, Noriyuki Honjou, Takashi Minaga, Hiroyoshi Yashiki, (2001),
Effects of manganese and sulfur contents and slab reheating temperatures on the
magnetic properties of non-oriented semi-processed electrical steel sheet, J. Magn. &
Magn. Mater, 123, pp. 55-61.

47
45. Rodrigo Felix de Araujo Cardoso, Luiz Brandao, Marco Antônio da Cunha, (2008),
Influence of Grain Size and Additions of Al and Mn on The Magnetic Properties of
Non-Oriented Electrical Steels With 3 wt. (%) Si, Materials Research, 68, pp. 51-55.
46. A.C. Marco and C.P. Sebastian, (2003), Effect of the Annealing Temperature on the
Structure and Magnetic Properties of 3% Si Non-oriented Steel, J. Magn. Magn.
Mater, 145, pp. 379–381.