Embed Size (px)
Citation preview

Department of Chemical EngineeringMaster Thesis 2020
Astrid Hermansson
Effect of biofilm thickness & carrier type on the performance of anaerobic moving
bed biofilm reactors (AnMBBRs)

Postal address Visiting address Telephone
P.O. Box 124 Naturvetarvägen 14 +46 46-222 82 85
SE-221 00 Lund, Sweden +46 46-222 00 00
Web address
http://www.lth.se/chemeng/
Effect of biofilm thickness & carrier type on the performance of anaerobic moving bed
biofilm reactors (AnMBBRs)
by
Astrid Hermansson
Master Thesis number: 2020-05
Water and Environmental Engineering
Department of Chemical Engineering
Lund University
June 2020
Supervisor: Associate Professor Åsa Davidsson
Co-supervisors: MASc. PhD. Fernando Morgan & MSc. Susanne Jacobsson,
AnoxKaldnes AB.
Examiner: Associate Professor Karin Jönsson
Picture on front page: Cross-section of an AnoxKTM Z-1000 carrier with biofilm. Picture by Astrid Hermansson.

2

3
Acknowledgment
This Master Thesis was carried out at AnoxKaldnes AB (Veolia Water Technologies), Lund. I want
to thank everyone at Veolia Water Technologies for all the help I have received with my Thesis. It
has been rewarding working at your company and I have learned a lot. I want to give a special
thanks to my supervisors at AnoxKaldnes, Fernando Morgan and Susanne Jacobsson. Fernando
gave me valuable support and guidance and his detailed review and constructive criticism helped
me greatly during the writing process. Susanne was of great support, especially in the lab where her
expertise has been invaluable when operating the AnMBBRs in this study.
I also owe a special thanks to my supervisor at LTH, Åsa Davidsson. Without her, this Master
Thesis would not have been possible. She gave me valuable advice throughout the whole process
and I always felt more confident after our meetings.
I would like to thank all the wonderful people I have come to know during my years as a student
at LTH. A special thanks to all the people at the Department of Chemical Engineering, and also to
all my fellow students at Environmental engineering (I am sorry I abandoned you for
Biotechnology).
Finally, I would like to thank my family, boyfriend, and friends (and my cat). They have given me
support and love when things have been difficult, and I would never have accomplished this
without you.
Lund, June 2020
Astrid Hermansson

4

5
Summary
Anaerobic wastewater treatment for removal of organic matter has gained interest as a complement
to conventional aerobic wastewater treatment because of its capacity to treat wastewaters at a high
loading rate and its ability to produce energy in the form of biogas. The anaerobic moving bed
biofilm reactor (AnMBBR) is an anaerobic wastewater treatment process that has shown effective
for the treatment of industrial wastewaters. It consists of a reactor with a freely moving support
material (“carriers”) on which a biofilm grows. The microorganisms in the biofilm can effectively
remove organic material from the wastewater whilst producing biogas which can be used as an
energy source. As the AnMBBR is a biofilm process, nutrients, products, etc. must be transported
through the biofilm. The thickness of the biofilm may, therefore, impact the process.
The objectives of this study were (1) to evaluate the effect of the biofilm thickness and carrier type
on the performance (in terms of soluble organic removal, “sCOD removal”, and biogas
production) of AnMBBRs and (2) to assess the effect of the different carriers on biofilm
development and accumulation. Three continuous lab-scale AnMBBRs were operated in this study,
fed with an industrial wastewater from food processing. The reactors were filled with two different
carrier types allowing for different maximal biofilm thickness. Reactor “R200” was filled with
AnoxKTM Z-200 carriers (a commercial carrier made of recycled HDPE with a maximum biofilm
thickness of 200 μm), “R1000” was filled with AnoxKTM Z-1000 carriers (a prototype made of
virgin HDPE with a maximum biofilm thickness of 1000 μm) and reactor “RMIX” was filled with
a mix of the two carriers.
The results from this study suggested that the biofilm thickness and type of carrier influence the
performance of AnMBBRs. R200 showed a low performance with a fluctuating sCOD removal
not exceeding 73% and a methane content in the biogas of 63 ± 2%. The fluctuating sCOD
removal together with high and fluctuating levels of volatile fatty acids (VFAs) indicated process
imbalance with regard to the microbial community in this reactor, possibly as a result of more
exposed microorganisms in the thinner biofilm or that the amount of biomass was simply not
enough in this reactor. The results from R1000 and RMIX were comparable to other studies made
on AnMBBRs treating industrial wastewaters from food processing. Both reactors had high sCOD
removal efficiencies of over 90% and a methane content in the biogas of 69 ± 2% for R1000 and
68 ± 2% for RMIX.
Furthermore, the rate of biofilm accumulation was considerably higher for the Z-1000 carriers, as
compared to the Z-200 carriers, possibly as a result of the biofilm being less exposed to hydraulic
shear in the deeper Z-1000 carriers. At the end of this study, R200 had a low amount of biofilm
(5.8 ± 1.1 g VS/m2 PSA) but a high specific removal rate (3.7 g sCOD removed/g VS/day) while
R1000 had a higher amount of biofilm (54.2 ± 12.8 g VS/ m2 PSA) but a lower specific removal
rate (0.64 g sCOD removed/g VS/day). This suggests that the biofilm on the Z-200 carriers was
more active or specialized compared to the biofilm on the Z-1000 carriers.
Although this study made interesting findings with regard to biofilm thickness and carrier type,
future studies should focus on characterising the microbial community of the biofilm as well as to
characterise the surface properties of the carrier material. This to gain deeper understanding
concerning how the microbial composition depends on the biofilm thickness and the carrier type,
and how this may influence the performance of the AnMBBR.
Key words: Anaerobic, wastewater treatment, AnMBBR, MBBR, biofilm thickness, carrier,
organic removal

6
Sammanfattning
Anaerob avloppsrening för organisk avskiljning har erhållit ökat intresse som ett komplement till
konventionell aerob avloppsvattenrening. Detta på grund av dess kapacitet att behandla
avloppsvatten med en hög belastningsgrad och dess förmåga att producera energi i form av biogas.
Den så kallade Anaerobic Moving Bed Biofilm Beactor (AnMBBR) är en avloppsreningsprocess som
visat sig vara effektiv för behandling av industriellt avloppsvatten. Den består av en reaktor med
ett material (”bärare”), som rör sig fritt i reaktorn, på vilket en biofilm växer. Mikroorganismerna i
biofilmen avlägsnar organiskt material från avloppsvattnet, samtidigt som de producerar energi i
form av biogas. Eftersom AnMBBR är en biofilmsprocess måste näringsämnen, produkter etc.
transporteras genom biofilmen. Tjockleken på biofilmen kan därför påverka processen.
Målen med denna studie var (1) att utvärdera effekten av biofilmtjocklek och bärartyp med
avseende på reaktorprestanda (med hänsyn till avlägsnande av lösligt organiskt material, ”sCOD”,
och biogasproduktion) i AnMBBR:er och (2) att bedöma effekten av olika bärare med avseende på
biofilmutveckling och -ackumulering. Tre kontinuerliga AnMBBR:er i laboratorieskala användes
med ett industriellt avloppsvatten från livsmedelsindustrin som substrat. Reaktorerna var fyllda
med två olika bärartyper vilka möjliggjorde olika maximal biofilmtjocklek. Reaktor “R200” fylldes
med AnoxKTM Z-200-bärare (en kommersiell bärare tillverkad av återvunnen HDPE med en
maximal biofilmtjocklek på 200 μm), ”R1000” fylldes med AnoxKTM Z-1000-bärare (en prototyp
tillverkad av ny HDPE med en maximal biofilmtjocklek på 1000 μm) och "RMIX" fylldes med en
blandning av de två olika bärartyperna.
Resultaten från denna studie antydde att biofilmtjockleken och typen av bärare påverkar
AnMBBR:ens prestanda. R200 visade en låg prestanda med ett fluktuerande avlägsnande av sCOD
som inte översteg 73 %, och ett metaninnehåll i biogasen på 63 ± 2 %. Det fluktuerande sCOD-
avlägsnandet tillsammans med höga och fluktuerande nivåer av flyktiga fettsyror (VFA) indikerade
processobalans med avseende på det mikrobiella samhället, eventuellt till följd av mer exponerade
mikroorganismer i den tunnare biofilmen, eller att mängden biomassa inte var tillräcklig i denna
reaktor. Resultaten från R1000 och RMIX var jämförbara med tidigare studier gjorda på
AnMBBR:er som behandlade industriellt avloppsvatten från livsmedelsindustrin. Båda reaktorerna
hade hög sCOD-avskiljning på över 90 %, och ett metaninnehåll i biogasen på 69 ± 2 % för R1000
och 68 ± 2 % för RMIX.
Ackumuleringen av biofilm var avsevärt snabbare för Z-1000-bärarna, jämfört med Z-200-bärarna,
möjligen som resultat av att biofilmen var mindre utsatt för hydraulisk skjuvning i de djupare
Z-1000-bärarna. I slutet av denna studie hade bärarna i R200 en låg mängd biofilm (5,8 ± 1,1
g VS/m2 PSA), men en hög specifik avskiljningsgrad (3,7 g sCOD avskilt/g VS/dag) medan
bärarna i R1000 hade en högre mängd biofilm (54,2 ± 12,8 g VS/m2 PSA) men en lägre specifik
avskiljningsgrad (0,64 g sCOD avskilt/g VS/dag). Detta tyder på att biofilmen på Z-200-bärarna
var mer aktiv eller specialiserad jämfört med biofilmen på Z-1000-bärarna.
Även om denna studie gjorde intressanta upptäckter med avseende på biofilmtjocklek och bärartyp,
bör framtida studier fokusera på att även karakterisera biofilmens mikrobiella samhälle samt att
karakterisera ytan på bärarmaterialet. Detta för att få djupare förståelse för hur den mikrobiella
sammansättningen beror på biofilmtjockleken och bärartypen, och hur detta kan påverka
AnMBBR:ers prestanda.
Nyckelord: Anaerob, avloppsvattenrening, AnMBBR, MBBR, biofilmtjocklek, bärare, organisk
avskiljning

7
Populärvetenskaplig sammanfattning
Att rena avloppsvatten med mikroorganismer i en biofilm – Insikt i hur
tjockleken på biofilmen påverkar reningsprocessen
Biofilmer finns på ytor överallt runtomkring oss:
på våra tänder (plack), på våta ytor i t ex.
badrummet och på stenar i vattendrag. Biofilmer
är ytterst tunna (vanligtvis mindre än 1 mm) och
består av aggregat av mikroorganismer, såsom
bakterier, vilka omges av en skyddande hinna.
Dessa aggregat bildar ett ”supersamhälle” av
mikroorganismer som gör det möjligt för dem att
lättare samarbeta med varandra och utbyta
näringsämnen m.m. I vissa fall kan biofilmer vara av ondo men i andra fall kan de vara till
nytta för oss och naturen. Biofilmer kan nämligen användas för att rena avloppsvatten! Om
detta görs i en syrefri miljö produceras dessutom biogas vilket kan användas som bränsle.
I livsmedelsindustrin och liknande industrier används ofta vatten för framställning av produkter. I
och med denna användning produceras stora mängder avloppsvatten som är rikt på organiska
föreningar såsom kolhydrater, fett och proteiner. Om dessa näringsämnen kommer ut i naturen
kan detta leda till negativa konsekvenser för både miljö och människa, såsom övergödning och
fiskdöd. Avloppsvatten rikt på organiska föreningar måste alltså effektivt renas för att kunna
släppas ut i naturen eller för att återanvändas. En teknik, utvecklad av AnoxKaldnes AB, som har
visat sig effektivt för att rena avloppsvatten från organiska föreningar är den så kallade ”Anaerobic
Moving Bed Biofilm Reactor” (förkortat AnMBBR). ”Anaerobic” står för att processen görs utan
syre medan ”Moving Bed Biofilm” syftar till att tekniken använder sig av biofilm som växer på ett
material (så kallade ”bärare”) som rör sig fritt i reaktorn.
Näringsämnen m.m., som är nödvändiga för att mikroorganismerna ska kunna växa och vara
aktiva, måste kunna penetrera hela biofilmen. Detta betyder i sin tur att biofilmens tjocklek kan ha
betydelse för reningsprocessen. Syftet men denna studie var därför att undersöka hur tjockleken av
biofilmen påverkar reningsprocessen. Detta gjordes genom att driva tre stycken reaktorer i ett
labbskaleförsök. Dessa reaktorer var fyllda med två olika typer av bärare, en som tillåter en maximal
biofilmstjocklek på 200 mikrometer (”Z-200” bärare) och en som tillåter en maximal
biofilmstjocklek på 1000 mikrometer (”Z-1000” bärare). De två bärartyperna hade dessutom vissa
skillnader i form och material.
Studien visade att den AnMBBR som var fylld med Z-200-bärare hade en sämre prestanda jämfört
med den AnMBBR som var fylld med Z-1000-bärare, eftersom avlägsnandet av organiskt material
var lägre i denna reaktor och mer fluktuerande. Detta misstänks bland annat kunna bero på att den
tunna biofilmen på Z-200-bärarna är mer utsatt för förändringar i sin omgivning (såsom
förändringar i näringsinnehåll och sammansättning av avloppsvattnet), men även att det var en
obalans mellan de samarbetande mikroorganismerna i biofilmen. Dessutom var både mängden
biofilm mindre och ackumulationen av biofilm avsevärt långsammare på dessa Z-200-bärare, vilket
troligen beror på att ytan på dessa bärare var mindre skyddad och mikroorganismerna därför har
svårare att etablera sig. Alternativt skulle detta även kunna bero på skillnader i materialet på bärarna
vilket skulle kunna påverka hur mikroorganismerna interagerar med materialet och hur ”lätt” de

8
har för att fästa och bilda biofilm på ytan. Vad som dock var intressant var att, trots att
Z-200-bärarna hade en mindre mängd biofilm, så avlägsnade de mer organiskt material per gram
biofilm. Detta visar på att mikroorganismerna var mer aktiva på Z-200-bärarna jämfört med
Z-1000-bärarna, vilket skulle kunna vara en konsekvens av den tunnare biofilmen som gör det
möjligt för näringsämnen att penetrera hela biofilmens tjocklek.
Denna studie visar på vikten av att undersöka hur biofilmens tjocklek påverkar reningsprocessen,
för att kunna utvärdera vilka typer av bärare som lämpar sig bäst för att användas i AnMBBR
processen. Detta är av stor vikt för att man i framtiden mer effektivt ska kunna rena olika typer av
avloppsvatten. I framtiden skulle det dock även vara av intresse att med hjälp av genteknik
identifiera vilka typer av mikroorganismer som biofilmen består av och hur biofilmens tjocklek
påverkar detta mikrobiella samhälle.
9
List of abbreviations
AnMBBR Anaerobic Moving Bed Biofilm Reactor
AnWWT Anaerobic Wastewater Treatment
COD Chemical Oxygen Demand (mg/L)
EPS Extracellular Polymeric Substances
HDPE High-Density Polyethylene
HRT Hydraulic Retention Time (hr or days)
MBBR Moving Bed Biofilm Reactor
OLR Organic Loading rate (g COD/m2 carrier/day, or kg COD/m3/day)
PSA Projected Surface Area (m2)
SALR Surface Area Loading Rate (g COD/m2 carrier/day)
sCOD Soluble Chemical Oxygen Demand (mg/L)
tCOD Total Chemical Oxygen Demand (mg/L)
TS Total Solids (mg/carrier)
TSS Total Suspended Solids (mg/L)
UASB Upflow Anaerobic Sludge Blanket
VFA Volatile Fatty Acids (mg/L)
VLR Volumetric Loading Rate (kg COD/m3/day)
VMPR Volumetric Methane Production Rate (g CH4-COD eq./L/day)
VS Volatile Solids (mg/carrier)
VSS Volatile Suspended Solids (mg/L)

10

11
Table of content
1. Introduction ............................................................................................................................. 13
1.1. Research problem........................................................................................................... 13
1.2. Hypothesis ....................................................................................................................... 14
1.3. Objective and Approach ................................................................................................. 14
2. Theoretical background and Literature review ..................................................................... 15
2.1. Anaerobic wastewater treatment – Advantages and disadvantages ......................... 15
2.2. The microbiology of anaerobic digestion ...................................................................... 16
2.2.1. Hydrolysis – Bacteria .............................................................................................. 16
2.2.2. Acidogenesis – Primary fermentative bacteria ..................................................... 16
2.2.3. Acetogenesis – Secondary fermentative bacteria ................................................ 17
2.2.4. Methanogenesis – Methanogenic archaea ........................................................... 17
2.2.5. Protozoans ............................................................................................................... 18
2.3. Environmental factors in anaerobic wastewater treatment ......................................... 18
2.3.1. Organic content and composition of the wastewater ........................................... 18
2.3.2. Volatile fatty acids and pH ...................................................................................... 18
2.3.3. Temperature ............................................................................................................ 19
2.4. Anaerobic wastewater treatment systems .................................................................... 19
2.5. The anaerobic moving bed biofilm reactor ................................................................... 20
2.5.1. Carrier design and characteristics ......................................................................... 21
2.5.2. The biofilm and microbial community of AnMBBRs ............................................. 21
2.5.3. Operational parameters and performance of AnMBBRs ..................................... 22
3. Experimental approach .......................................................................................................... 25
3.1. Carriers ............................................................................................................................ 25
3.2. Reactor setup .................................................................................................................. 25
3.3. Reactor operation ........................................................................................................... 27
3.4. Wastewater characteristics ............................................................................................ 27
3.5. Sampling and Analysis ................................................................................................... 27
3.5.1. Reactor influent and effluent .................................................................................. 27
3.5.2. Carriers and biomass .............................................................................................. 28
4. Results and Discussion .......................................................................................................... 29
4.1. Reactor operation and performance ............................................................................. 29
4.1.1. COD removal with respect to HRT and VLR ........................................................ 29
4.1.2. VFAs, pH and alkalinity........................................................................................... 31
4.1.3. Biogas production and composition ....................................................................... 34
12
4.2. Biomass characterisation ............................................................................................... 35
4.2.1. Biofilm development and accumulation from TS and VS analyses .................... 35
4.2.2. Stereomicroscopy of the carriers ........................................................................... 38
4.2.3. VSS as an indicator of suspended biomass ......................................................... 40
4.2.4. Light microscopy of the suspended biomass ........................................................ 41
5. Conclusion .............................................................................................................................. 43
6. Recommendations for future work ........................................................................................ 45
7. References .............................................................................................................................. 47
Appendix A: Wastewater characteristics ...................................................................................... 49
Appendix B: TS and VS results from carrier samplings .............................................................. 49
Appendix C: Equations .................................................................................................................. 50

13
1. Introduction
The production and processing of food require large amounts of water, which in turn generates
wastewater rich in organic substances such as carbohydrates, proteins, fats and oils. Industrial
wastewaters from food processing are characterized by a high content of these organic components
and if this wastewater is not treated properly before disposal or reuse it may pose negative
environmental effects such as eutrophication of waterbodies and release of environmentally toxic
substances. It is therefore of great importance to effectively treat and handle the wastewater.
Anaerobic wastewater treatment (AnWWT) has shown to be effective for the removal of organic
matter in high-strength wastewaters. AnWWT has many advantages, including: low energy
requirements, energy production in the form of biogas, low sludge production and the ability to
treat wastewater at a high organic loading rate (OLR) (Giovanni et al., 2018).
One of the main disadvantages of AnWWT is the slow growth of anaerobic microbial cultures. As
a result, very high hydraulic retention times (HRT) are required to avoid wash-out of the microbes
if they are grown in suspension. To get around this problem, fixed-growth biofilm systems can be
used, where the biomass is retained in the reactor. One such system which has shown to be effective
is the anaerobic moving bed biofilm reactor (AnMBBR) ( Wang et al., 2009; di Biase et al.; 2016, di
Biase et al., 2018). In moving bed biofilm reactors (MBBRs), the biomass grows as a biofilm
attached to freely moving carriers with a large, protected surface area. The protected biofilm growth
allows for low HRT without wash-out occurring. A limiting factor for biofilm process, in contrast
to suspended growth processes, is that the substrate and products must be transported through the
biofilm by diffusion (The Water Environment Federation, 2010). The thickness of the biofilm
could, therefore, impact the process. However, as AnMBBRs is a novel technique that has only
been around for a few decades, very few studies have been made on how the thickness affects the
process, and up until now it has been difficult to study and control the biofilm thickness. A new
type of carrier, the AnoxKTM Z-carrier, recently developed by AnoxKaldnes has made it possible
to study the effect of the biofilm thickness in AnMBBRs.
The overall aim of this Master Thesis is to gain more insights into the treatment of industrial
wastewaters from food processing with the AnMBBR process, and to investigate the effect of the
biofilm thickness and carrier type. These insights will contribute to the optimization of AnMBBRs
and the development of more efficient wastewater treatment processes in the future.
1.1. Research problem
The AnMBBR process is a novel technique and the number of studies on AnMBBRs treating
industrial wastewaters are therefore limited. Very little is known about how the biofilm thickness
affects the process performance in terms of removal of organic matter, biogas production, and
resilience to environmental and operational changes of the process. Therefore, the research
questions this Master Thesis aims to answer are:
• How does the biofilm thickness affect the organic removal efficiency and biogas
production in AnMBBR treating an industrial effluent?
• How does changing environmental and operational conditions affect the resilience of the
process depending on the biofilm thickness?

14
1.2. Hypothesis
It is hypothesised that a thicker biofilm will allow for a more resilient process as the sensitive
methanogens are shielded from perturbations and toxins such as pH changes and exposure to
oxygen. This in turn will lead to a more efficient and stable process, in terms of organic removal
(measured as chemical oxygen demand, COD) and biogas production, when using carriers allowing
for a thicker biomass.
1.3. Objective and Approach
The overall objective of this Master Thesis was to investigate the effect of the biofilm thickness
and type of carrier used in AnMBBRs treating an industrial wastewater from food processing. The
specific objectives were as follows:
1. To evaluate the effect of biofilm thickness and carrier type on the performance (in terms
of organic removal and biogas production) of AnMBBRs
2. To assess the effect of different carriers on biofilm development and accumulation.
This was done by operating three lab-scale AnMBBRs and continuously analyse the performance
of these reactors. The first reactor contained commercial AnoxKTM Z-200 carriers made from
recycled HDPE (allowing for a maximum biofilm thickness of 200 μm), the second with a
prototype of AnoxKTM Z-1000 carriers made from virgin HDPE (allowing for a maximum biofilm
thickness of 1000 μm) and the third reactor contained a mixture of the two carriers.
Originally, the objective was also to characterise the microbial biomass composition on the carriers
and in suspension. This was to be done in order to evaluate how/if the microbial composition
differentiated between the two different carriers used and thereby evaluate how/if the biofilm
thickness affected the microbial community in the biofilms. The microbial community was to be
assessed with 16S rRNA gene sequencing. Due to travel restrictions as a consequence of the corona
pandemic, the characterisation of the biomass was not possible. However, this Master Thesis will
discuss the possible relations between microbial composition and performance based on the results
obtained from analysing the performance of the reactors, combined with existing literature on the
subject.
15
2. Theoretical background and Literature review
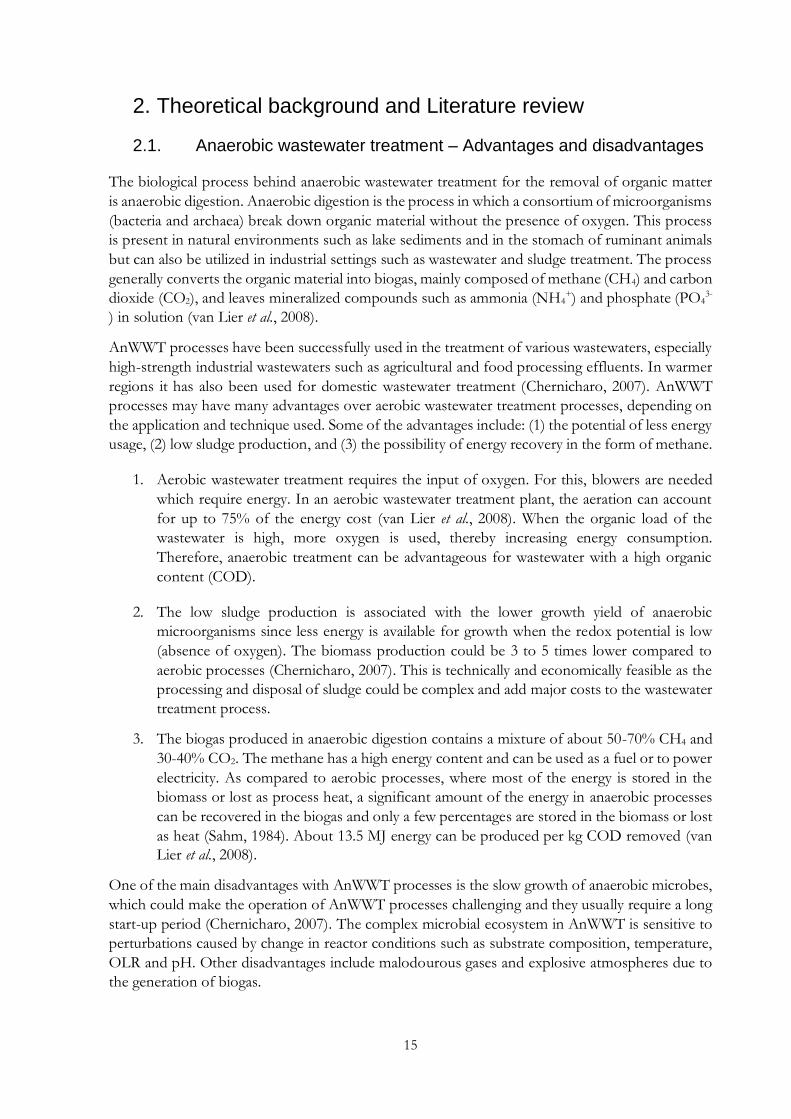
2.1. Anaerobic wastewater treatment – Advantages and disadvantages
The biological process behind anaerobic wastewater treatment for the removal of organic matter
is anaerobic digestion. Anaerobic digestion is the process in which a consortium of microorganisms
(bacteria and archaea) break down organic material without the presence of oxygen. This process
is present in natural environments such as lake sediments and in the stomach of ruminant animals
but can also be utilized in industrial settings such as wastewater and sludge treatment. The process
generally converts the organic material into biogas, mainly composed of methane (CH4) and carbon
dioxide (CO2), and leaves mineralized compounds such as ammonia (NH4+) and phosphate (PO4
3-
) in solution (van Lier et al., 2008).
AnWWT processes have been successfully used in the treatment of various wastewaters, especially
high-strength industrial wastewaters such as agricultural and food processing effluents. In warmer
regions it has also been used for domestic wastewater treatment (Chernicharo, 2007). AnWWT
processes may have many advantages over aerobic wastewater treatment processes, depending on
the application and technique used. Some of the advantages include: (1) the potential of less energy
usage, (2) low sludge production, and (3) the possibility of energy recovery in the form of methane.
1. Aerobic wastewater treatment requires the input of oxygen. For this, blowers are needed
which require energy. In an aerobic wastewater treatment plant, the aeration can account
for up to 75% of the energy cost (van Lier et al., 2008). When the organic load of the
wastewater is high, more oxygen is used, thereby increasing energy consumption.
Therefore, anaerobic treatment can be advantageous for wastewater with a high organic
content (COD).
2. The low sludge production is associated with the lower growth yield of anaerobic
microorganisms since less energy is available for growth when the redox potential is low
(absence of oxygen). The biomass production could be 3 to 5 times lower compared to
aerobic processes (Chernicharo, 2007). This is technically and economically feasible as the
processing and disposal of sludge could be complex and add major costs to the wastewater
treatment process.
3. The biogas produced in anaerobic digestion contains a mixture of about 50-70% CH4 and
30-40% CO2. The methane has a high energy content and can be used as a fuel or to power
electricity. As compared to aerobic processes, where most of the energy is stored in the
biomass or lost as process heat, a significant amount of the energy in anaerobic processes
can be recovered in the biogas and only a few percentages are stored in the biomass or lost
as heat (Sahm, 1984). About 13.5 MJ energy can be produced per kg COD removed (van
Lier et al., 2008).
One of the main disadvantages with AnWWT processes is the slow growth of anaerobic microbes,
which could make the operation of AnWWT processes challenging and they usually require a long
start-up period (Chernicharo, 2007). The complex microbial ecosystem in AnWWT is sensitive to
perturbations caused by change in reactor conditions such as substrate composition, temperature,
OLR and pH. Other disadvantages include malodourous gases and explosive atmospheres due to
the generation of biogas.
16
2.2. The microbiology of anaerobic digestion
Anaerobic digestion could be considered to contain 4 steps: (1) hydrolysis, (2) acidogenesis, (3)
acetogenesis, and (4) methanogenesis. These steps are performed by a consortium of different
microorganisms. Step 1-3 are performed by fermentative bacteria and step 4 by methanogenic
archaea. The interaction between these groups of microorganisms must be well balanced in order
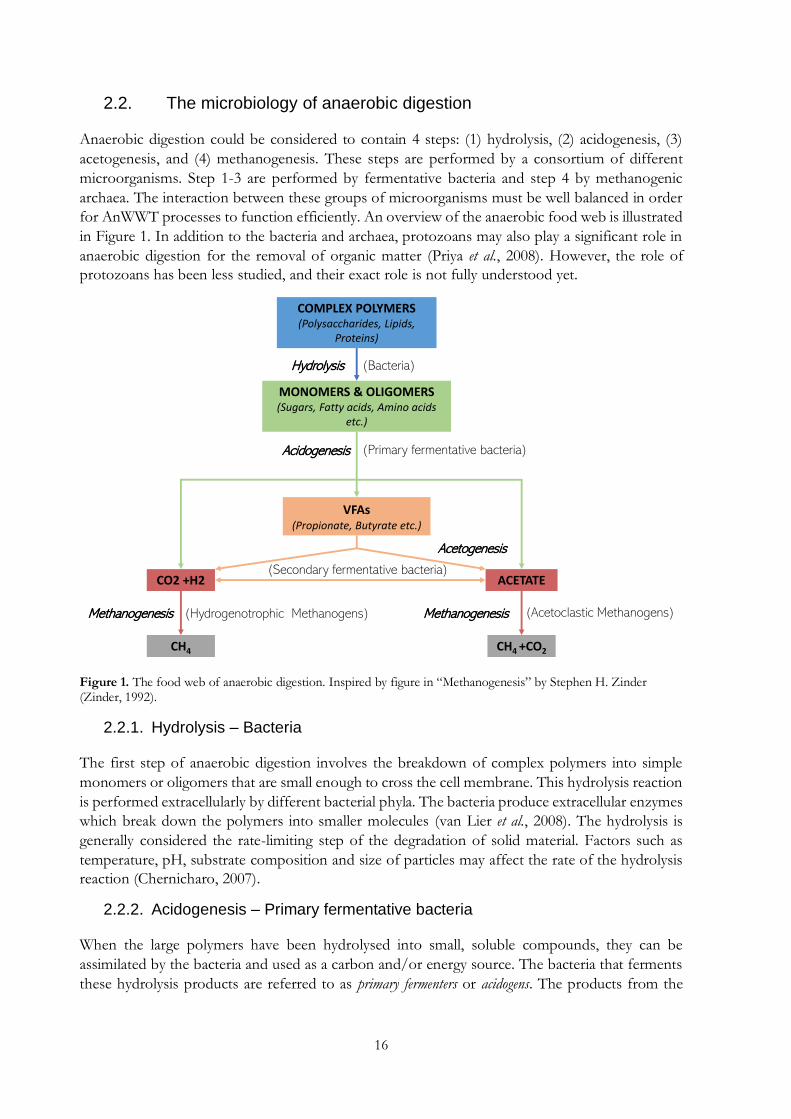
for AnWWT processes to function efficiently. An overview of the anaerobic food web is illustrated
in Figure 1. In addition to the bacteria and archaea, protozoans may also play a significant role in
anaerobic digestion for the removal of organic matter (Priya et al., 2008). However, the role of
protozoans has been less studied, and their exact role is not fully understood yet.
Figure 1. The food web of anaerobic digestion. Inspired by figure in “Methanogenesis” by Stephen H. Zinder (Zinder, 1992).
2.2.1. Hydrolysis – Bacteria
The first step of anaerobic digestion involves the breakdown of complex polymers into simple
monomers or oligomers that are small enough to cross the cell membrane. This hydrolysis reaction
is performed extracellularly by different bacterial phyla. The bacteria produce extracellular enzymes
which break down the polymers into smaller molecules (van Lier et al., 2008). The hydrolysis is
generally considered the rate-limiting step of the degradation of solid material. Factors such as
temperature, pH, substrate composition and size of particles may affect the rate of the hydrolysis
reaction (Chernicharo, 2007).
2.2.2. Acidogenesis – Primary fermentative bacteria
When the large polymers have been hydrolysed into small, soluble compounds, they can be
assimilated by the bacteria and used as a carbon and/or energy source. The bacteria that ferments
these hydrolysis products are referred to as primary fermenters or acidogens. The products from the
COMPLEX POLYMERS (Polysaccharides, Lipids,
Proteins)
MONOMERS & OLIGOMERS(Sugars, Fatty acids, Amino acids
etc.)
VFAs(Propionate, Butyrate etc.)
ACETATECO2 +H2
CH4 +CO2CH4
(Bacteria)Hydrolysis
(Primary fermentative bacteria)Acidogenesis
(Secondary fermentative bacteria)
Acetogenesis
Methanogenesis(Hydrogenotrophic Methanogens) (Acetoclastic Methanogens)Methanogenesis

17
acidogenesis include volatile fatty acids (VFAs, such as acetate, propionate, butyrate and other
higher organic acids) as well as alcohols, CO2, and H2.
2.2.3. Acetogenesis – Secondary fermentative bacteria
The products from the acidogenesis are further metabolised by a group of organisms referred to
as secondary fermenters or acetogens. In this pathway, the main products are acetate, CO2 and H2. The
H2 producing reactions in the acetogenic pathways are not energetically favourable at standard
conditions since they are accompanied by a large positive free energy change (a large positive ΔG).
However, a low partial pressure of H2 (generally 10-4 atm) makes these reactions energetically
favourable (results in a negative ΔG). Hence, these reactions can only occur when coupled with H2
consuming reactions (van Lier et al., 2008). The secondary fermenters are therefore in obligate
syntropy with H2 consuming microorganisms. In an anaerobic process where these H2 consuming
microorganisms effectively consume the H2, the acetogens will be active and, hence, acetate will be
the main VFA product.
There are also some acetogens that are capable of using H2 and CO2 as a substrate to synthesize
acetate. These H2 consuming acetogens, require a H2 partial pressure of approximately 10-3 atm
(Zinder, 1992). In a well-functioning AnWWT process, the H2 partial pressure usually drops below
or around 10-4 (van Lier et al., 2008). As a consequence, the H2 consuming acetogens are generally
outcompeted by other H2 consuming organisms (e.g. methanogens) (Zinder, 1992).
2.2.4. Methanogenesis – Methanogenic archaea
In the last step of anaerobic digestion, methanogenic archaea produce CH4. The methanogens are
obligate anaerobes, and most have doubling times of several hours to several days (Zinder, 1992).
The low growth rate of the methanogens is associated with the limited energy yield of
methanogenesis. The low growth rate of the methanogens is the main reason for the long start-up
of AnWWT processes (van Lier et al., 2008). The methanogens are only capable of using a limited
number of substrates, these substrates are mainly produced by the fermentative bacteria in
AnWWT processes. Most methanogens are capable of reducing CO2 and H2 into CH4
(hydrogenotrophic methanogens). Other substrates include acetate (CH3COO, acetoclastic
methanogens) and simple methylated compounds such as methanol and methylamine (Zinder,
1992). Two of the major reactions carried out by methanogenic archaea are shown in Table 1.
Table 1. Major methanogenesis reactions in AnWWT processes performed by methanogenic archaea. Free energy
change at standard conditions (25°C, pH 7) (Zinder, 1992).
Functional group Reaction ΔG° (kJ/mol)
Acetoclastic methanogens 𝐶𝐻3𝐶𝑂𝑂− + 𝐻2𝑂 → 𝐶𝐻4 + 𝐻𝐶𝑂3− -31
Hydrogenotrophic methanogens 𝐶𝑂2 + 4𝐻2 → 𝐶𝐻4 + 2𝐻2𝑂 -131
The methanogens are H2 consumers and are in a syntrophic relationship with the acetogens in
AnWWT. They keep the partial pressure of H2 at a level which makes the H2 producing acetogenic
reactions energetically favourable (Zinder, 1992).
The predominant methanogens found in mesophilic (20-45 °C) AnWWT belong to the genera
Methanosarcina and Methanosaeta. Methanosarcina is capable of using a relatively wide range of
substrates including: H2/CO2, acetate, methylamines, methanol and formate (van Lier et al., 2008).
They have a relatively high growth rate (doubling time of 1-2 days), but a low substrate affinity
(Zinder, 1992). Methanosaeta is mainly capable of using acetate as a substrate but may also be capable

18
of using the hydrogenotrophic pathway (De Vrieze, 2014) and has a low growth rate (doubling
time of 3-7 days) but a high affinity for acetate (Zinder, 1992). Due to the high affinity for acetate,
Methanosaeta is usually the dominant acetoclastic methanogen at low acetate concentrations not
exceeding 100 to 150 mg COD/L (De Vrieze, 2014).
2.2.5. Protozoans
Protozoans are single-celled eucaryotes which mainly feed on bacteria and organic debris. Their
role in anaerobic environments are not fully understood but studies suggests protozoans, in
particular ciliates, may enhance anaerobic degradation and increase methane production (Priya et
al., 2008; Prabhakaran et al., 2016).
2.3. Environmental factors in anaerobic wastewater treatment
The performance of AnWWT processes is mainly influenced by the composition of the wastewater,
the pH and the temperature.
2.3.1. Organic content and composition of the wastewater
Anaerobic cultures are able to form methane from a range of different organic materials, including
carbohydrates, proteins, lipids, alcohols, and even some petrochemicals and complex aromatic
compounds (Sahm, 1984). The organic content in the wastewater is commonly measured as
chemical oxygen demand (COD). The COD is the amount of oxygen required to oxidize the
organic compounds in the wastewater and is thus an indirect measurement of the concentration of
organic compounds. The tCOD is a measurement of the total organics while the sCOD is the
fraction of soluble organics, defined as the organic material that pass through a filter with a known
pore size (in this study defined as the COD that pass through a 0.45 μm filter). The sCOD generally
consists of organic compounds that are easily biodegradable. The type of organic material and its
degradability also influences the composition of the biogas (Sahm, 1984).
The amount of biogas produced is related to the organic content in the wastewater. Under normal
temperature and pressure (1 atm, 273 K), the theoretical maximum yield of methane is 350 Nml
CH4/g of tCOD degraded (Chernicharo, 2007).
2.3.2. Volatile fatty acids and pH
As mentioned in section 2.2., the interaction between the microbes in the anaerobic food web must
be well balanced in order for AnWWT processes to function efficiently. Imbalance of AnWWT
processes may eventually lead to reactor souring.
The acidogenesis is the most rapid step of the anaerobic food web (van Lier et al., 2008). Hence, if
an anaerobic system is subjected to perturbations, such as a sudden increase in easily degradable
organic matter, the acidogens will produce VFAs faster than the methanogens can consume these
acids. This will lead to a build-up of acids which could eventually lead to a pH drop. As the H2-
consuming methanogens have a narrow pH range, they will be inhibited, leading to a build-up of
H2. The build-up of H2 eventually leads to the acetogens being inhibited as the acetogenic reaction
is dependent on the low partial pressure of H2. This leads to a “positive feedback loop”, further
decreasing the pH and eventually leading to reactor souring (Zinder, 1992).
19
To prevent reactor souring it is therefore of major importance to have a good buffering system
and to closely monitor the pH and VFAs. The VFA levels have shown to be a good indicator of
process stability for anaerobic digestion processes (Ahring et al., 1995). The pH of AnWWT
processes should not drop below 6.8 (Björnsson et al., 2000). Even small accumulations of VFAs
have shown to lead to a decrease in pH for systems with poor buffering capacity (Murto et al.,
2004).
2.3.3. Temperature
The microbial activity of AnWWT is sensitive to temperature changes and lower temperatures
result in reduced microbial activity. At decreased temperatures, the conversion rate of COD
decreases, resulting in a higher fraction of COD in the effluent and consequently leads to a lower
biogas production (Van Haandel et al., 2018). A lower temperature also increases the solubility of
methane in water, thus leaving a larger fraction of the biogas in solution. This is undesirable as this
methane will finally end up in the atmosphere, contributing to the greenhouse effect.
Consequently, AnWWT processes may require heating, unless they are implemented in warmer
regions or on wastewater that is already heated. This may contribute to a significant operational
cost of the process. Thermophilic conditions usually favours the biogas production but are not
favourable from an economic perspective. Usually, the optimal operating temperature of AnWWT
processes lies in the higher mesophilic rage, around 35-37°C (Van Haandel et al., 2018). The heat
required may be supplied as energy obtained from the methane produced in the process, or from
a heat source in another process step. However, for dilute wastewaters (such as domestic
wastewaters), heating supplied from the methane may not be economically feasible due to a low
volumetric production rate of methane (Chernicharo, 2007).
The cost of reactor heating must be weighed against the benefits of the process. If the heating costs
are expected to be high, other systems, such as aerobic activated sludge processes may be more
feasible.
2.4. Anaerobic wastewater treatment systems
Conventional anaerobic digestion processes have been used for the treatment of sewage sludge
since the 19th century. These conventional anaerobic systems are mainly used for very concentrated
effluents (>30,000 mg COD/L) (Sahm, 1984) and are usually not feasible for liquid effluents as
they require very high hydraulic retention times (HRT). The development of high-rate systems,
however, has enabled anaerobic treatment of more dilute effluents, such as high-strength
wastewater from food processing, chemical industry, pulp and paper processing, etc. The high-rate
systems are characterized by their ability to treat wastewater at a high volumetric loading rate (VLR),
by uncoupling the solid retention time from the HRT. This is achieved by retaining the biomass in
the reactor, for example by the formation of highly-settleable sludge or by fixed biofilm growth.
As a result, high-rate processes can be made compact with a small footprint.
Some high-rate anaerobic reactors include: (1) anaerobic filter reactors (2) upflow anaerobic sludge
blanket reactors and (3) anaerobic moving bed biofilm reactors.
1. Anaerobic filter reactors are comprised of a stationary filter media on which the biofilm
grows. The filter media may be of various materials such as plastic, gravel, or pumice. The
filter reactors have the advantage of successfully retaining the biomass and therefore allow

20
for very high VLR. One of the main disadvantages of anaerobic filter reactors is that, due
to the stationary filter, they require a relatively large reactor volume compared to other
high-rate processes. Filter reactors are also subjected to clogging and may require
backwashing (Rajeshwari et al., 2000).
2. The upflow anaerobic sludge blanket (UASB) reactor is one of the most commonly used
reactors for anaerobic wastewater treatment and has been successful for the treatment of
carbohydrate-rich wastewaters (Daud et al., 2018). In UASB reactors, the wastewater flows
upwards from the bottom of the reactor and through an activated sludge blanket. The
activated sludge blanket is comprised of large biofilm granules with high density, preventing
the granules from being washed out. The granules are formed by the aggregation of
microbial flocs. The UASB has the advantage of high organic removal rates, even at high
VLR. It can handle loading rates of 10-15 kg COD/m3/day (The Water Environment
Federation, 2010). A disadvantage of UASB reactor is the potential occurrence of
degranulation, leading to wash-out of biomass (Macarie et al., 2018).
3. The AnMBBR is comprised of a reactor loaded with freely moving support material,
carriers, (usually plastic) on which a biofilm grows. The carriers provide a large surface area
available for biofilm growth and thereby enables high organic removal efficiencies. The
carriers are suspended in the reactor by mechanical mixers, thereby using the whole reactor
volume for wastewater treatment contrary to stationary fixed-film process. The AnMBBR
provides a compact treatment system which allows for a high removal capacity at high VLR.
It has gained attention over the years as it could be more stable compared to UASB
processes and requires less volume compared to stationary fixed-film processes. One
disadvantage of the AnMBBR system, compared to the other anaerobic systems
mentioned, is that some carriers may be washed out from the system over time, resulting
in the potential release of plastics into nature. Furthermore, the AnMBBR may not be
capable of treating wastewaters at as high VLRs as for the anaerobic filter. The AnMBBR
is further reviewed in the following section (section 2.5).
2.5. The anaerobic moving bed biofilm reactor
The moving bed biofilm reactor (MBBR) is well established for aerobic processes and has been
around for about 30 years. In MBBRs, the biomass grows on carriers that are held in suspension
in the reactor by aeration (aerobic MBBRs) or mechanical mixing (AnMBBRs). The MBBR is
compact, flexible, the amount of sludge produced is reduced, and biomass is retained in the reactor,
which reduces the need for solid separation steps. The MBBR process also eliminates the need of
sludge recycling (The Water Environment Federation, 2010). Moreover, it has been shown that the
MBBR can provide considerably higher removal rates per mg biomass compared to suspended-
growth systems, which can be partly attributed to the ability of MBBRs to develop highly
specialized microbial communities (The Water Environment Federation, 2010).
The AnMBBR is not as established as the aerobic MBBR but has gained more attention over the
last decade for the treatment of industrial wastewaters. It has shown to be effective when treating
industrial effluents such as winery wastewater (Chai et al., 2013), brewery wastewaters (di Biase et
al., 2018), and oil-contaminated petro-chemical wastewaters (Morgan-Sagastume et al., 2019). The
principle behind an AnMBBR is shown in Figure 2.

21
Figure 2. Schematic view of an AnMBBR and an example of a carrier type (the AnoxKTM carrier).
2.5.1. Carrier design and characteristics
The support material on which the biofilm grows, the carriers, are usually made of plastic material.
The carrier design should fulfil a number of criteria such as providing enough surface area for
biofilm development, have a density slightly lower than that of water to promote suspension, be
large enough to be retained in the reactor and it should be affordable (Morgan-Sagastume, 2018).
High-density polyethylene (HDPE) is commonly used as it has shown to be durable and provide a
good surface for microbial attachment (Morgan-Sagastume, 2018).
Most carrier designs focus on maximizing the protected surface area (the area on which biofilm
can grow protected from shear) to maximize biofilm growth, however, the thickness of the biofilm
itself may play a crucial role in the performance of MBBRs (Piculell, 2016). The Anox KTM Z is a
carrier design that allows for control of the maximum biofilm thickness and thereby allowing the
effect of biofilm thickness to be studied. For the Anox KTM Z-carrier, the maximum biofilm
thickness is determined by the height of the cell walls in the carrier. Excess biomass will be sloughed
off when carriers collide, thereby keeping the maximum biofilm thickness constant.
2.5.2. The biofilm and microbial community of AnMBBRs
Biofilm formation is essential in MBBRs and other biofilm processes. A biofilm is formed when
bacteria, archaea, and other microbes attach to a surface. The attachment of the microbes may be
initialised due to factors such as surface properties of the material (surface charge, surface free
energy, hydrophobicity, surface roughness, etc. (Morgan-Sagastume, 2018)), gravity and
chemoattraction (nutrients on the surface of the substrate) (Lappin-Scott et al., 1992). When the
first microbes attach, they start to produce a biofilm matrix consisting of extracellular polymeric
substances (EPS) in which the microbes become enclosed. The substrate properties of the carrier
material may play a major role in the initial attachment of the microbes, whereas the properties of
the young biofilm and its EPS components may determine the following development and
maturing of the biofilm (Morgan-Sagastume, 2018).

22
The biofilm has many advantages such as facilitating gene transfer and nutrient transfer between
microbes as well as protecting the microbes from toxins. The EPS matrix allows for symbiotic
cultures of microbes (such as acetogens and methanogens) to live in close proximity and to
exchange metabolites. The biofilm may also allow for microenvironments within the biofilm, which
in turn allows for different microbial niches in different layers of the biofilm. A study on the biofilm
in UASB reactors treating carbohydrate-rich wastewater showed a layered distribution of microbes.
Methanogens (predominantly Metanosaeta spp.) were mostly located in the interior, the syntrophic
colonies were located in a mid-layer, and the hydrolytic and fermentative bacteria in the outer layer
(Fang, 2000). Similar findings have been made in other studies on UASB reactor granules (MacLeod
et al., 1990). As of present, no studies on the microbial community layered structure of biofilms in
AnMBBRs could be found.
The biofilm characteristics and microbial community in an AnMBBR may be affected by a variety
of factors such as the composition of the feed, the composition of the inoculum used, the property
of the carrier material, the OLR and the HRT. A study by Habouzit et al. (2014) showed that the
archaeal community in an AnMBBR during start-up was highly dependent on the support material
while the bacterial community was more dependent on the composition of the inoculum used
(Habouzit et al., 2014). The HRT has been shown to affect the fraction of suspended biomass and
the formation of biofilms in anaerobic reactors. A study by Jensen et al. (2019) showed that the
biofilm biomass increased with a decreased HRT. It was suggested that the short HRT promoted
the growth of acetogens and methanogens able to form biofilms (Methanosaeta) due to wash-out of
competing planktonic species, which increased the amount of biomass growing as biofilm (Jensen
et al., 2019). To promote biofilm formation in AnMBBRs, it may, therefore, be desirable to operate
the reactors at a relatively short HRT. However, due to detachment of biomass from the carriers
(as a result of carrier collision, bulk liquid shear forces, sloughing of large biomass segments, etc.),
some biomass in suspension will always exist in MBBRs, even at very low HRT (Piculell, 2016).
The contribution to the COD removal from the suspended fraction should therefore be considered
in MBBR processes.
2.5.3. Operational parameters and performance of AnMBBRs
A number of parameters can be used to control and evaluate the performance of AnMBBRs. The
most commonly used parameters and their importance are described in this section.
2.5.3.1. Organic loading rate
The organic loading rate (OLR) is an important operational parameter in all wastewater treatment
processes. It could be defined as the amount of organic material added per unit volume (volumetric
loading rate, VLR) or when applied to biofilm processes, the amount of organic material added per
unit area available for biofilm growth (surface area loading rate, SALR). The OLR is thus related
to the hydraulic retention time (HRT) and the COD of the wastewater.
By measuring the tCOD and the sCOD in the influent as well as the effluent, the performance in
terms of organic removal efficiency can be estimated. It has been shown that AnMBBRs can reach
removal rates of above 90% sCOD (Wang et al., 2009; Chai et al., 2013; di Biase et al., 2018).
2.5.3.2. Biogas production and composition
When the microbes in anaerobic processes digest the organic material, they produce biogas. The
biogas production of anaerobic processes is, therefore, in direct relation to the COD removal rate
and it can therefore be monitored to evaluate the reactor performance in terms of COD removal.
Furthermore, it is also of interest to analyse the composition of the biogas. The methane in the
23
biogas has the highest energetic value and, therefore, it is desirable to have a high fraction of
methane in the biogas. Moreover, a high fraction of N2-gas may be an indication that the system is
not air-tight.
2.5.3.3. Volatile fatty acids, pH and alkalinity
It is of great importance to constantly monitor the VFAs in AnMBBRs as the VFA levels give an
indication of the balance between archaea, acidogenic and acetogenic bacteria in the reactor.
Moreover, it is also of interest to analyse the relative fraction of different VFAs in the AnMBBR.
It is desirable to have a high fraction of acetate as acetate is the main product from the acetogenesis
and the main VFA used by the methanogens. A relative increase in the concentration of other
VFAs such as butyrate, isobutyrate and propionate has shown to be signs of process imbalance as
this may indicate that acetogenic bacteria are inhibited (Sahm, 1984).
The buffering capacity (alkalinity) and the pH of the process should also be closely monitored in
order to avoid reactor imbalance, which could eventually lead to reactor souring. However, studies
have suggested that microbes growing in biofilm communities may be somewhat protected against
pH changes of the bulk liquid as the biofilm allows for microzonal pH variations (Vroom et al.,
1999) and the more sensitive microbes (archaea and syntrophic bacteria) has been shown to grow
in the inner layer of the biofilm in UASB reactors (MacLeod et al., 1990; Fang, 2000). Anaerobic
biofilm reactors, such as the AnMBBR, may therefore be more resistant to environmental
perturbations compared to suspended-growth processes.
2.5.3.4. Temperature
As discussed in section 2.3.3., the temperature has great influence on the process and must
therefore be monitored closely as a temperature drop may result in a reduced microbial activity.
2.5.3.5. Suspended Solids
The suspended solids may be measured as total suspended solids (TSS) and volatile suspended
solids (VSS). The TSS is a measurement of the total amount of non-soluble material (organic as
well as inorganic), while the VSS is a measurement of the non-soluble organic material in the
wastewater. VSS can be used as an indicator of the amount of suspended biomass in the wastewater.
The suspended biomass in MBBRs may be a result of detached biomass from the carriers or the
growth of planktonic species (especially at longer HRT) and are generally considered to be active
biomass contributing to the COD removal (Piculell, 2016). However, if there is a significant
amount of particulate COD in the wastewater that is not degraded, this will also contribute to the
VSS.

24

25
3. Experimental approach
This work included a laboratory study that involved operation and monitoring of three continuous
lab-scale AnMBBRs. Two of the reactors were loaded with different carriers, one which allowed
for a maximum biofilm thickness of 200 μm and the other 1000 μm. The third reactor was operated
as a reference and contained a mixture of the two carriers. The reactors treated an industrial
wastewater from a food processing facility and all reactors were subjected to similar operational
conditions (temperature, alkalinity, feed composition, HRT, and OLR). When this study started,
the reactors had already been operated for 123 days and some biofilm was already established on
the carriers. All laboratory work was performed at AnoxKaldnes´ facilities in Lund.
3.1. Carriers
The carriers used in this project were of two different designs, both designed and produced by
AnoxKaldnes. The first ones are commercial Anox KTM Z-200 carriers (referred to as “Z-200”)
(Figure 3 a) with a cell depth of 200 μm and a projected surface area (PSA) of 0.00128 m2 per
carrier. These carriers are saddle-shaped and made of HDPE from recycled material. The second
design are a prototype of Anox KTM Z-1000 carriers (referred to as “Z-1000”) (Figure 3 b) with a
cell depth of 1000 μm and a PSA of 0.00164 m2 per carrier. The Z-1000 carriers are flat and made
of virgin HDPE. The PSA in this study was defined as the summarized floor area of the cells on
the carrier (see Figure 3 a).
The difference in cell depth of the two designs would allow for the growth of biofilm of different
thicknesses.
Figure 3. a) AnoxKTM Z-200 carrier (diameter of 3.5 cm) with close-up of the defined “cell floor area”. b) prototype of AnoxKTM Z-1000 carrier (diameter of 4.5 cm).
3.2. Reactor setup
All three reactors were initially loaded with carriers so that all had the same total PSA. However, as
the reactors were of different volumes, it was decided on day 183 that the number of carriers should
be corrected so that all reactors had the same PSA per unit volume of reactor instead (according to
Table 2). The first reactor (“R200”) was loaded with Z-200 carriers and the second reactor
a) b)

26
(“R1000”) with Z-1000 carriers. The third reactor (“RMIX”) was loaded with a mixture of the two.
This reactor was operated as a reference as both types of carriers would be subjected to the same
conditions in this reactor.
Table 2. Carrier loading in the three lab-scale reactors used in this study.
Reactor Working volume (L)
Carrier type Number of carriers
Total PSA (m2) PSA per unit volume (m2/m3)
R200 4 Z-200 337 (320)* 0.431 (0.410)* 108 (102)*
R1000 3.8 Z-1000 250 0.410 108
RMIX 3.8 Z-200 160 0.205 Z-1000 125 0.205 Total 285 0.410 108
* The number was corrected from 320 carriers to 337 carriers on day 183 of operation to achieve the same PSA per
unit volume.
The reactors were made of glass, all were gas-tight and were equipped with an external heating
jacket, liquid inlet and outlet, liquid sampling outlet, gas outlet and a top-mounted mechanical 2-
bladed mixer. In each reactor, a baffle was installed at the liquid surface to prevent a stagnant layer
of carriers at the surface. One reactor had a slightly larger working volume of 4 L (R200) compared
to the other two which had working volumes of 3.8 L each (R1000 and RMIX).
Each reactor was connected to a feed pump (Watson Marlow 520S, Watson Marlow) which
continuously supplied the substrate. The substrate was refrigerated at a temperature between
approximately 3-15°C. In order to ensure that the system was gas-tight, the effluent of the reactor
was discharged into a water trap by overflow. The gas outlet from all AnMBBRs were connected
to a gas flow meter (AMPTS II, Bioprocess control) to monitor the biogas production. The heating
jacket was connected to a water-bath with a temperature of 37.5°C to maintain a reactor
temperature of approximately 36°C. The reactor set-up is shown in Figure 4.
Figure 4. Reactor set-up showing one of the reactors (1) and its effluent trap with overflow (2), feed pump (3) and mechanical stirrer (4).
27
3.3. Reactor operation
3.3.1. Previous study: Day 1-123
The initial start-up of the reactors (day 1 to day 123 of reactor operation) had been made by another
operator and is covered in the work by Emma Månsson (2020). During these days, the reactors
had been inoculated 10 times (between day 1 and day 93 of operation) with anaerobic granular
sludge and various operational temperatures had been tested (Månsson, 2020). The reactors were
otherwise subjected to similar operation conditions during this first start-up period as described in
the following section. At the end of this study, some biofilm was already established on the carriers.
3.3.2. This study: Day 124-238
The laboratory study for this Master Thesis was performed for a period of 114 days (day 124 to
238 of reactor operation). The reactors were operated in the mesophilic region, at a temperature
of approximately 36°C. The mixers were set to a stirring frequency of 25 Hz for R200 and RMIX
and 35 Hz for R1000. The stirring frequency was set to ensure good mixing in all reactors. The
frequency was set higher in R1000 since the reactor with Z-1000 carriers alone required a higher
frequency to avoid stagnation of the carriers and ensure good mixing.
The OLR had been continuously increased throughout the reactor operation to allow for biofilm
establishment (when this study started, at day 124 of reactor operation, there was already some
biofilm established on the carriers). The OLR was increased by either increasing the COD of the
substrate and/or by decreasing the HRT. During the last period of the study (day 215-238 of
operation), the reactors were operated at a constant VLR of 4.13 ± 0.14 kg sCOD/m3/day.
3.4. Wastewater characteristics
The substrate used in this project was wastewater from a food processing facility. The wastewater
had a tCOD concentration of 2367 ± 426 mg tCOD/L and a sCOD (filtered through a 0.45 μm
filter) concentration of 1830 ± 282 mg sCOD/L. The wastewater was collected in batches (13
different batches used, approximately one batch used per week) and therefore had daily variations
in characteristics. Analysis results from the batches can be found in table A1 in the Appendix A.
A trace element solution (Vithane, Biothane) and a FeCl solution was added to the wastewater to
provide micronutrients. NaHCO3 was added as a buffer to maintain a neutral pH and an alkalinity
of approximately 3000-5000 mg CaCO3/L. The addition of micronutrients and buffer was based
on the tCOD of the wastewater. When needed, the wastewater was diluted with tap-water as to not
overload the reactors when the sCOD of the wastewater was high.
3.5. Sampling and Analysis
3.5.1. Reactor influent and effluent
Substrate feed was prepared every, or every second day and the influent flow rate was estimated from measuring how much of the feed had been used in a certain time interval. The gas production

28
of each reactor was monitored daily1, except weekends. Grab samples of the effluent gas composition was analysed weekly (Gas chromatography, Clarus 450, Perkin Elmer). Grab samples of the liquid influent and liquid effluent were taken approximately 1 time a week for the influent and 3 times a week for the effluent. The liquid influent and liquid effluent samples were analysed according to the parameters given below.
• sCOD and tCOD (HACK LCK 114/814, Hach)
• Alkalinity, NH4-N and PO4-P (spectrophotometry by Gallery Plus, Thermo FisherScientific)
• pH (HQ11D, Hach)
• Organic acids (HACK LCK 365, Hach)
• VFA composition (Gas chromatography, Clarus 400, Perkin Elmer)
• TSS (SS-EN 872:2005, 2nd ed.)
• VSS (former SS028112, 3rd ed.)
Samples for sCOD, Alkalinity, Organic Acids, VFA, NH4-N and PO4-P were filtered through a
0.45 μm filter and VSS and TSS samples were filtered through a 1.6 μm glass fibre filter. The
organic acid analysis was done to monitor the VFAs on a regular basis as the analysis of the VFA
samples could not be made regularly due to time-consuming analysis method. VFA samples were
therefore taken on a weekly basis and frozen for later analysis. The analysis method for organic
acids (HACH LCK 365, Hach) may, however, overestimate the VFA levels as it detects other acids
than VFAs (etc. lactic acid).
3.5.2. Carriers and biomass
The reactors were opened on day 141, 169 and 232 for carrier sampling. 6 carriers (of each type of
carrier from each reactor) were removed for microscopy and biofilm quantification on the carriers,
and 2 carriers (of each type of carrier from each reactor) were also frozen for future microbial
community analysis. Virgin carriers were added to maintain the same number of carriers in the
reactors. To avoid inflow of oxygen, nitrogen gas was continuously added while the reactors were
open.
Carriers were photographed in a stereomicroscope (Nikon SMZ1270) to visually estimate the
amount of biofilm on the carriers. The carriers were also cut and photographed in the
stereomicroscope to visualize the cross-section of the biofilm and visually compare the thicknesses
of the biofilm.
Analysis of total solids (TS) and volatile solids (VS) on the carriers were performed in triplicates
with biofilm from 2 carriers in each sample (i.e. 6 carriers of each type from each reactor in total),
to get a representative sample. The biofilm was scrubbed off the carriers into distilled water and
put in a 105°C oven overnight, after which they were weighed. VS was measured by drying in a
550°C oven overnight and weighed.
Light microscopy (Nikon Eclipse Ni) was performed on liquid samples from each reactor on day
238 of operation in order to examine the suspended biomass and identify possible differences in
suspended biomass between the reactors.
1 Between day 187 and 235, the influent flow and the gas production was only monitored approximately 3 times a week due to limited access to the lab as a consequence of the corona pandemic.

29
4. Results and Discussion
This study was performed during 114 days on three lab-scale AnMBBRs treating an industrial
wastewater from food processing. The three reactors were loaded with different carriers. R200 was
loaded with commercial, saddle-shaped Anox KTM Z-200 made from recycled HDPE, R1000 was
loaded with a prototype of Anox KTM Z-1000 which were flat and made from virgin HDPE. RMIX
was loaded with a mix of the two carriers and operated as a reference. The reactors were operated
as described in section 3.3. They had already been operated for 123 days when the study of this
Master Thesis started. The results from this first period of reactor start-up are reported in the
Master Thesis “Considerations for the Establishment of an Anaerobic Biofilm in an AnMBBR” (Månsson,
2020).
The results and discussion from this study (day 124 to 238 of reactor operation) will focus on
comparing the reactor performance of R200, R1000 and RMIX in terms of sCOD removal and
biogas production and how this is influenced by parameters such as the VLR, HRT, VFA levels
and composition, pH, alkalinity, and the biomass in the reactors. It will also focus on the
characterisation of the biomass and development of biofilm on the carriers.
4.1. Reactor operation and performance
4.1.1. COD removal with respect to HRT and VLR
In this study, the COD removal (%) was used as an estimate of the organic removal efficiencies in the reactors. More specifically, the sCOD was used as this accounts for the easily degradable organic matter and most of the COD in the influent was soluble (78.0 ± 6.6%). Both R1000 (Figure 6) and RMIX (Figure 7) reached a stable sCOD removal of over 90%, while the sCOD removal ofR200 (Figure 5) fluctuated between 37% and 73% throughout the study. During the last period ofconstant VLR (4.13 ± 0.14 kg sCOD/m3/day) the sCOD removal was 57 ± 1 %, 93 ± 2% and 91± 1% for R200, R1000 and RMIX respectively. R200 thus showed significantly lower and morefluctuating sCOD removal compared to R1000 and RMIX. The sCOD removal in R1000 andRMIX are comparable to the sCOD removal obtained in similar studies of AnMBBRs treatingindustrial effluents from food processing (Wang et al., 2009; Chai et al., 2013; di Biase et al., 2016).For example, Wang et al. reached sCOD removal efficiencies of 98% at similar VLR, however, atsignificantly higher HRT (several days).
The VLR and HRT change over the timespan of this study (day 124 to day 238 of reactor operation) is also shown in Figure 5-7. The VLR was increased from approximately 1 to 4 kg sCOD/m3/day (which corresponded to a SALR between approximately 10 and 40 g sCOD/m2 PSA/day) while the HRT was decreased from approximately 1 day to 9 hours. R200 appeared to be more sensitive to changes in operational conditions. At day 138 and 152, the water-bath connected to the reactors dropped from 37.5°C to 21.5°C. The effect in all reactors was a sudden decrease in sCOD removal. R200 took a longer time to recover after the temperature drop, compared to R1000 and RMIX which both returned to their previous levels of sCOD removal the day, or a few days after the temperature drop. Increase in VLR as a consequence of decreasing the HRT also appeared to influence the sCOD removal of R200. During periods of constantly decreasing the HRT, the sCOD removal dropped. Whereas, during periods of more stable HRT, the sCOD removal increased. In R1000 and RMIX, no such behaviour could be observed. This suggests that the suspended biomass may contribute to the sCOD removal to a larger extent in R200 compared to the other two reactors. When the HRT is decreased, the suspended biomass is washed out, hence,

30
the sCOD removal drops. However, at constant HRT the suspended biomass has time to acclimatise to the new conditions, hence, resulting in a rise in sCOD removal. It may also be due to the increase in organic load, rather than the HRT, as a sudden increase in load may lead to the acidogenic bacteria producing acids faster than the methanogens can consume them, consequently leading to a lower sCOD removal and process imbalance in R200.
Figure 5. sCOD [%], HRT [h] and VLR [kg sCOD/m3/day] for R200 (containing Z-200 carriers).
Figure 6. sCOD [%], HRT [h] and VLR [kg sCOD/m3/day] for R1000 (containing Z-1000 carriers).
31
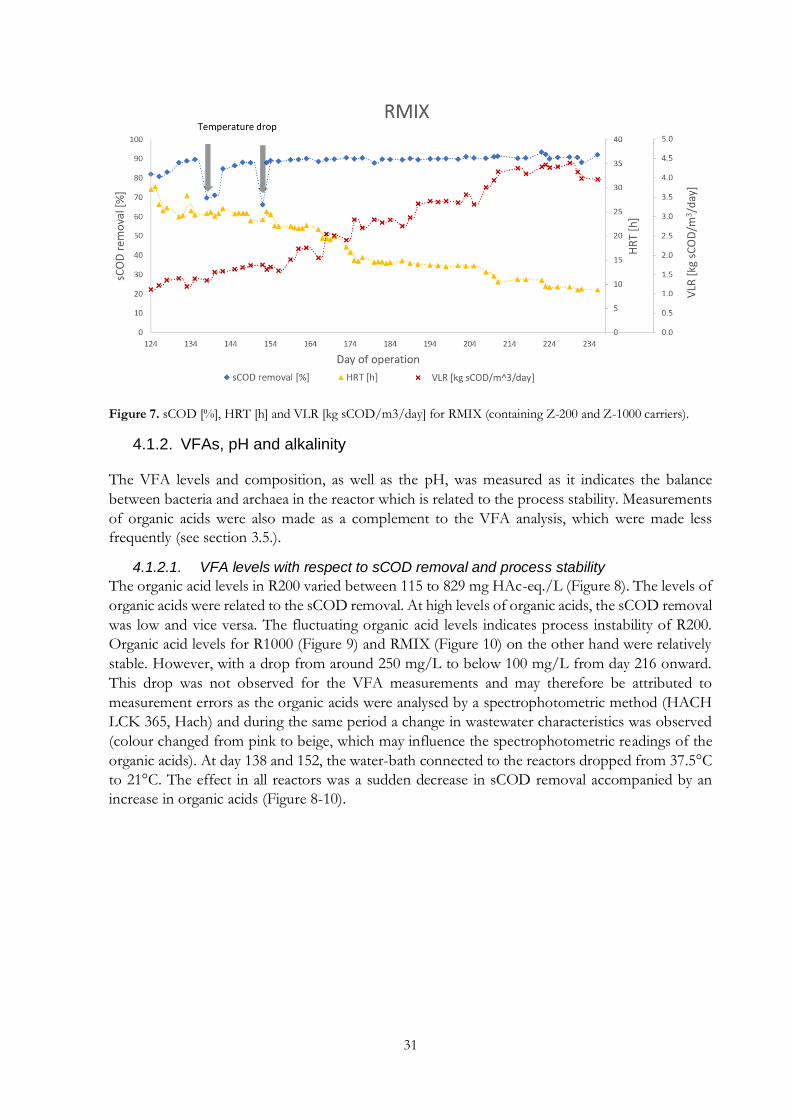
Figure 7. sCOD [%], HRT [h] and VLR [kg sCOD/m3/day] for RMIX (containing Z-200 and Z-1000 carriers).
4.1.2. VFAs, pH and alkalinity
The VFA levels and composition, as well as the pH, was measured as it indicates the balance
between bacteria and archaea in the reactor which is related to the process stability. Measurements
of organic acids were also made as a complement to the VFA analysis, which were made less
frequently (see section 3.5.).
4.1.2.1. VFA levels with respect to sCOD removal and process stability
The organic acid levels in R200 varied between 115 to 829 mg HAc-eq./L (Figure 8). The levels of
organic acids were related to the sCOD removal. At high levels of organic acids, the sCOD removal
was low and vice versa. The fluctuating organic acid levels indicates process instability of R200.
Organic acid levels for R1000 (Figure 9) and RMIX (Figure 10) on the other hand were relatively
stable. However, with a drop from around 250 mg/L to below 100 mg/L from day 216 onward.
This drop was not observed for the VFA measurements and may therefore be attributed to
measurement errors as the organic acids were analysed by a spectrophotometric method (HACH
LCK 365, Hach) and during the same period a change in wastewater characteristics was observed
(colour changed from pink to beige, which may influence the spectrophotometric readings of the
organic acids). At day 138 and 152, the water-bath connected to the reactors dropped from 37.5°C
to 21°C. The effect in all reactors was a sudden decrease in sCOD removal accompanied by an
increase in organic acids (Figure 8-10).

32
Figure 8. sCOD removal [%], Organic acid [mg HAc-eq./L] and VFA levels [mg COD/L] in R200. Due to complications with the GC apparatus, VFA results could only be obtained between day 173-231 of reactor operation.
Figure 9. sCOD removal [%], Organic acid [mg HAc-eq./L] and VFA levels [mg COD/L] in R1000. Due to complications with the GC apparatus, VFA results could only be obtained between day 173-231 of reactor operation.
Figure 10. sCOD removal [%], Organic acid [mg HAc-eq./L] and VFA levels [mg COD/L] in RMIX. Due to complications with the GC apparatus, VFA results could only be obtained between day 173-231 of reactor operation.
33
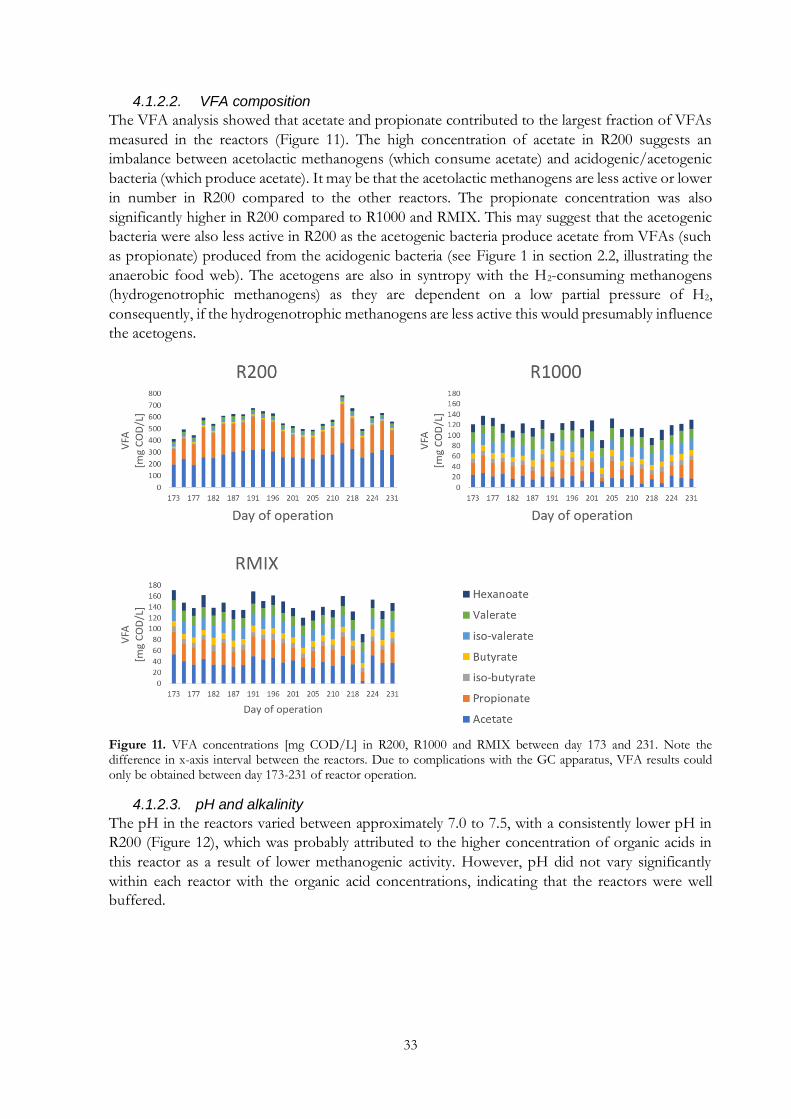
4.1.2.2. VFA composition
The VFA analysis showed that acetate and propionate contributed to the largest fraction of VFAs
measured in the reactors (Figure 11). The high concentration of acetate in R200 suggests an
imbalance between acetolactic methanogens (which consume acetate) and acidogenic/acetogenic
bacteria (which produce acetate). It may be that the acetolactic methanogens are less active or lower
in number in R200 compared to the other reactors. The propionate concentration was also
significantly higher in R200 compared to R1000 and RMIX. This may suggest that the acetogenic
bacteria were also less active in R200 as the acetogenic bacteria produce acetate from VFAs (such
as propionate) produced from the acidogenic bacteria (see Figure 1 in section 2.2, illustrating the
anaerobic food web). The acetogens are also in syntropy with the H2-consuming methanogens
(hydrogenotrophic methanogens) as they are dependent on a low partial pressure of H2,
consequently, if the hydrogenotrophic methanogens are less active this would presumably influence
the acetogens.
Figure 11. VFA concentrations [mg COD/L] in R200, R1000 and RMIX between day 173 and 231. Note the difference in x-axis interval between the reactors. Due to complications with the GC apparatus, VFA results could only be obtained between day 173-231 of reactor operation.
4.1.2.3. pH and alkalinity
The pH in the reactors varied between approximately 7.0 to 7.5, with a consistently lower pH in
R200 (Figure 12), which was probably attributed to the higher concentration of organic acids in
this reactor as a result of lower methanogenic activity. However, pH did not vary significantly
within each reactor with the organic acid concentrations, indicating that the reactors were well
buffered.

34
Figure 12. pH of R200, R1000 and RMIX4
4.1.3. Biogas production and composition
The biogas produced in the reactors had a methane content of 63 ± 2% in R200, 69 ± 2% in R1000
and 68 ± 2 % in RMIX (Table 4), with the remainder mainly being carbon dioxide. Wang et al.
reported similar results with mean methane contents of 66% and 68% (Wang et al., 2009) and di
Biase et al. reported a methane content varying between 60-70% (di Biase et al., 2016). The lower
methane content in R200 compared to R1000 and RMIX may be related to the lack of
hydrogenotrophic methanogens (as discussed in section 4.1.2.2.) as this would result in a higher
content of hydrogen in the biogas. However, the hydrogen content of the biogas was not measured
in this study. During the first period of reactor operation (made by another operator), the methane
content was reported to be 85 ± 5% in R200, 83 ± 4% in R1000 and 81 ± 4% in RMIX (Månsson,
2020). The higher methane content during the first period of reactor operation could be due to a
switch from a community consisting of more hydrogenotrophic methanogens that consume CO2
(mainly Methanosarcina) to acetoclastic methanogens which consume acetate (mainly Methanosaeta).
Methanosarcina is indeed reported to be the dominant methanogen at an early stage of AnWWT
processes, due to its higher growth rate and wider substrate spectrum, while Methanosaeta is reported
to be dominating later on in the process, at low and stable acetate concentrations, due to its low
growth rate and high substrate affinity (van Lier et al., 2008).
The methane yield was 257 ± 32, 243 ± 51 and 289 ± 25 Nml CH4/ g sCOD reduced for R200,
R1000 and RMIX respectively (Table 4). The methane yield was calculated based on the sCOD, as
the tCOD measurements were impacted by sedimentation of solids. However, as most of the COD
in the feed was sCOD (78.0 ± 6.6%), the results are comparable with the theoretical methane yield,
which is based on the tCOD. The results thus showed a somewhat lower methane yield than the
maximum theoretical methane yield of 350 Nml CH4/g tCOD reduced, which could possibly be
due to gas leaks or other losses. COD assimilated into biomass may also contribute to the lower
methane yield as this will add to sCOD removal without biogas being produced. It should be noted
that a gas leak was detected and resolved on day 175 in R1000, which probably has contributed to
the lower methane yield of R1000.
Table 4. Methane yield (Nml CH4/g sCOD reduced) and methane content (%) in the produced gas for the different
reactors. Calculations of the methane yield can be found in Appendix C.
Reactor
CH4 yield
(Nml CH4/g sCOD reduced)
CH4 content
(%)
R200 257 ± 32 63 ± 2
R1000 243 ± 51* 69 ± 2
RMIX 289 ± 25 68 ± 2
* Gas leak detected and solved on day 175.

35
The fraction of COD assimilated into biomass can be estimated by plotting the volumetric methane
production rate (VMPR, g CH4-COD equivalence/L/day) versus the sCOD removal rate (g sCOD
reduced/L/day) over time. The VMPR is calculated based on the assumption that 1 mole of
methane is equivalent to 64 grams of COD. The VMPR increased linearly with the sCOD removal
at a rate of 66%, 72% and 73% for R200, R1000 and RMIX respectively (Figure 13). The remainder
(37%, 28% and 27%) could be considered as biomass synthesis, assuming no gas leak of the system
(as a gas leak would result in a lower methane yield per sCOD reduced), or other losses. In a study
of an AnMBBR treating milk permeate, Wang et al. reported a rate of 89% (Wang et al., 2009).
Thus, this may indicate a higher rate of biomass synthesis in this study compared to the one made
by Wang et al., 2009. It should be noted that Wang et al. (2009) calculated the rate based on tCOD
removal while in this study it was based on sCOD removal.
Figure 13. Volumetric methane production rate (VMPR) as a function of sCOD removal rate with linear regression forced through the origin.
4.2. Biomass characterisation
The biofilm development and accumulation on the carriers were analysed by TS and VS
measurements of the biomass on the carriers, stereomicroscopy was performed to visually estimate
and compare the biofilm on the carriers. This was performed on day 141, 169 and 232 of reactor
operation. TSS and VSS analysis was used on as an indicator of the suspended biomass in the
reactors. Light microscopy was performed on the suspended biomass on day 238 of reactor
operation.
4.2.1. Biofilm development and accumulation from TS and VS analyses
The TS and VS analyses of the biomass attached to the carriers showed that the mass of biofilm
(as g VS/m2 PSA), was substantially higher on the Z-1000 carriers compared to the Z-200 carriers
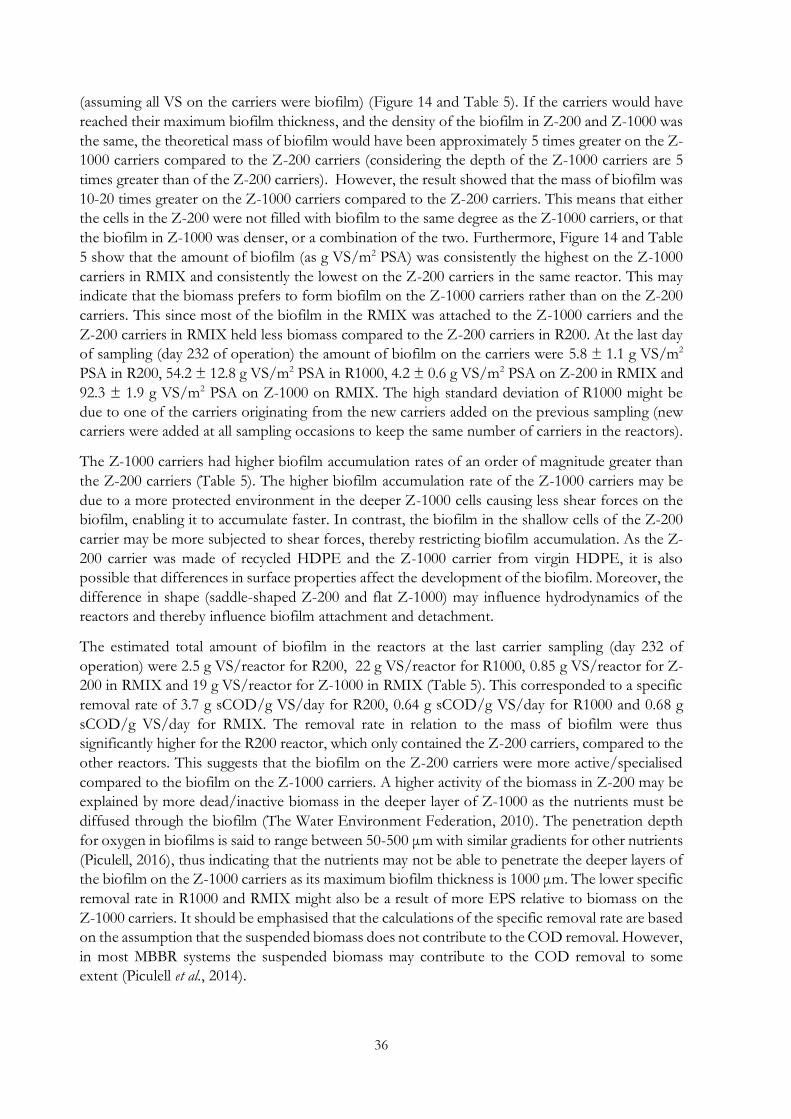
36
(assuming all VS on the carriers were biofilm) (Figure 14 and Table 5). If the carriers would have
reached their maximum biofilm thickness, and the density of the biofilm in Z-200 and Z-1000 was
the same, the theoretical mass of biofilm would have been approximately 5 times greater on the Z-
1000 carriers compared to the Z-200 carriers (considering the depth of the Z-1000 carriers are 5
times greater than of the Z-200 carriers). However, the result showed that the mass of biofilm was
10-20 times greater on the Z-1000 carriers compared to the Z-200 carriers. This means that either
the cells in the Z-200 were not filled with biofilm to the same degree as the Z-1000 carriers, or that
the biofilm in Z-1000 was denser, or a combination of the two. Furthermore, Figure 14 and Table
5 show that the amount of biofilm (as g VS/m2 PSA) was consistently the highest on the Z-1000
carriers in RMIX and consistently the lowest on the Z-200 carriers in the same reactor. This may
indicate that the biomass prefers to form biofilm on the Z-1000 carriers rather than on the Z-200
carriers. This since most of the biofilm in the RMIX was attached to the Z-1000 carriers and the
Z-200 carriers in RMIX held less biomass compared to the Z-200 carriers in R200. At the last day
of sampling (day 232 of operation) the amount of biofilm on the carriers were 5.8 ± 1.1 g VS/m2
PSA in R200, 54.2 ± 12.8 g VS/m2 PSA in R1000, 4.2 ± 0.6 g VS/m2 PSA on Z-200 in RMIX and
92.3 ± 1.9 g VS/m2 PSA on Z-1000 on RMIX. The high standard deviation of R1000 might be
due to one of the carriers originating from the new carriers added on the previous sampling (new
carriers were added at all sampling occasions to keep the same number of carriers in the reactors).
The Z-1000 carriers had higher biofilm accumulation rates of an order of magnitude greater than
the Z-200 carriers (Table 5). The higher biofilm accumulation rate of the Z-1000 carriers may be
due to a more protected environment in the deeper Z-1000 cells causing less shear forces on the
biofilm, enabling it to accumulate faster. In contrast, the biofilm in the shallow cells of the Z-200
carrier may be more subjected to shear forces, thereby restricting biofilm accumulation. As the Z-
200 carrier was made of recycled HDPE and the Z-1000 carrier from virgin HDPE, it is also
possible that differences in surface properties affect the development of the biofilm. Moreover, the
difference in shape (saddle-shaped Z-200 and flat Z-1000) may influence hydrodynamics of the
reactors and thereby influence biofilm attachment and detachment.
The estimated total amount of biofilm in the reactors at the last carrier sampling (day 232 of
operation) were 2.5 g VS/reactor for R200, 22 g VS/reactor for R1000, 0.85 g VS/reactor for Z-
200 in RMIX and 19 g VS/reactor for Z-1000 in RMIX (Table 5). This corresponded to a specific
removal rate of 3.7 g sCOD/g VS/day for R200, 0.64 g sCOD/g VS/day for R1000 and 0.68 g
sCOD/g VS/day for RMIX. The removal rate in relation to the mass of biofilm were thus
significantly higher for the R200 reactor, which only contained the Z-200 carriers, compared to the
other reactors. This suggests that the biofilm on the Z-200 carriers were more active/specialised
compared to the biofilm on the Z-1000 carriers. A higher activity of the biomass in Z-200 may be
explained by more dead/inactive biomass in the deeper layer of Z-1000 as the nutrients must be
diffused through the biofilm (The Water Environment Federation, 2010). The penetration depth
for oxygen in biofilms is said to range between 50-500 μm with similar gradients for other nutrients
(Piculell, 2016), thus indicating that the nutrients may not be able to penetrate the deeper layers of
the biofilm on the Z-1000 carriers as its maximum biofilm thickness is 1000 μm. The lower specific
removal rate in R1000 and RMIX might also be a result of more EPS relative to biomass on the
Z-1000 carriers. It should be emphasised that the calculations of the specific removal rate are based
on the assumption that the suspended biomass does not contribute to the COD removal. However,
in most MBBR systems the suspended biomass may contribute to the COD removal to some
extent (Piculell et al., 2014).
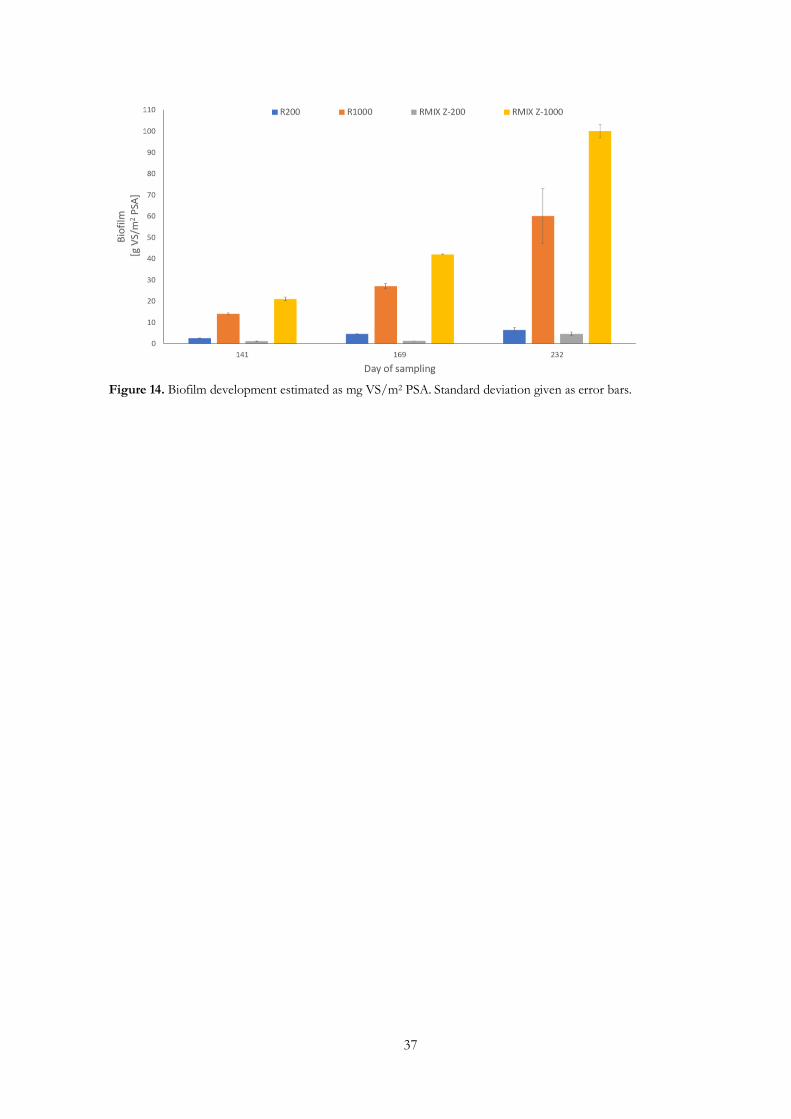
37
Figure 14. Biofilm development estimated as mg VS/m2 PSA. Standard deviation given as error bars.

38
Table 5. Biofilm results based on TS and VS from carrier samplings at day 141, 169 and 232 (found in Appendix B,
Table B1). The specific removal rates are calculated based on the sCOD removal at the time of sampling. Equations
can be found in Appendix C.
Day Reactor
VS/TS Biofilm [g VS/m2 PSA]
Total Biofilm [g VS/reactor]
Biofilm accumulation rate
[g VS/m2 PSA/ day]
Specific removal rate
[g sCOD/g VS/day]
141
R200 0.91 2.3 ± 0.1 0.94 2.0x10⁻² 3.0
R1000 0.87 12.8 ± 0.5 5.3 1.1x10⁻¹ 1.0
RMIX Z-200 0.95 1.0 ± 0.1* 0.21 8.3x10⁻³
1.0 RMIX Z-1000 0.88 18.8 ± 0.5 3.9 1.7x10⁻¹
169
R200 0.92 4.1 ± 0.1 1.7 7.4x10⁻² 4.5
R1000 0.87 24.6 ± 1.2 10 4.7x10⁻¹ 0.82
RMIX Z-200 0.73 1.3** 0.27 5.8x10⁻³
1.1 RMIX Z-1000 0.88 38.0 ± 0.1 7.8 7.6x10⁻¹
232
R200 0.82 5.8 ± 1.1 2.5 3.0x10⁻² 3.7
R1000 0.86 54.2 ± 12.8 22 5.1x10⁻¹ 0.64
RMIX Z-200 0.81 4.2 ± 0.6 0.85 1.3x10⁻²
0.68 RMIX Z-1000 0.88 92.3 ± 1.9 19 2.4x10⁻¹
* Only two out of three VS samples could be analysed.
** Only one out of three VS samples could be analysed.
4.2.2. Stereomicroscopy of the carriers
The stereopmicroscopy of the carriers confirmed that the amount of biofilm was considerably
higher on the Z-1000 carriers compared to the Z-200 carriers. Figures 15-18 shows typical carrier
samples from each day of sampling. Comparing Z-1000 carriers in R1000 and RMIX at the last day
of sampling, the structure of the biofilm appeared slightly different between the reactors. Z-1000
in RMIX (Figure 18 c)) had patches of light-coloured biofilm while Z-1000 in R1000 (Figure 16 c))
had more evenly distributed light-coloured biofilm. Figure 19 shows the cross-section of the
carriers on day 232. The Z-1000 carriers in both R1000 and RMIX appeared to almost have reached
the maximum biofilm thickness of 1000 μm (Figure 19 b) and d)), while the Z-200 carriers in R200
and RMIX had not quite reached the maximum biofilm thickness of 200 μm (Figure 19 a) and c)).
If the biofilm exhibits a layered structure with sensitive methanogens in the deeper layers, as shown
in studies of USAB reactors (MacLeod et al., 1990; Fang, 2000), the thicker biofilm in Z-1000 may
be more resistant to perturbations (such as changing VLR, composition of the feed etc) compared
to the Z-200.
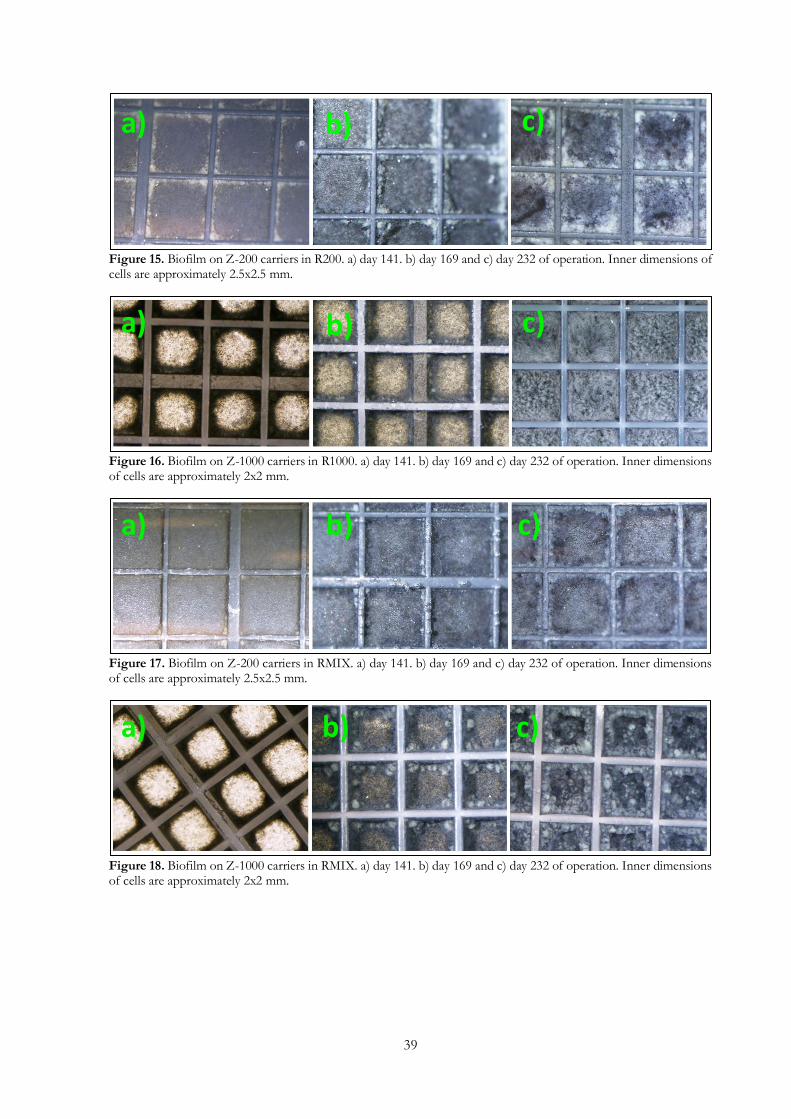
39
Figure 15. Biofilm on Z-200 carriers in R200. a) day 141. b) day 169 and c) day 232 of operation. Inner dimensions of cells are approximately 2.5x2.5 mm.
Figure 16. Biofilm on Z-1000 carriers in R1000. a) day 141. b) day 169 and c) day 232 of operation. Inner dimensions of cells are approximately 2x2 mm.
Figure 17. Biofilm on Z-200 carriers in RMIX. a) day 141. b) day 169 and c) day 232 of operation. Inner dimensions of cells are approximately 2.5x2.5 mm.
Figure 18. Biofilm on Z-1000 carriers in RMIX. a) day 141. b) day 169 and c) day 232 of operation. Inner dimensions of cells are approximately 2x2 mm.
a) b) c)
a) b) c)
a) b) c)
a) b) c)

40
Figure 19. Cross section of carriers with biomass at day 232 of operation. a) Z-200 from R200, b) Z-1000 from R1000, c) Z-200 from RMIX and d) Z-1000 from RMIX.
4.2.3. VSS as an indicator of suspended biomass
The VSS in the reactors during the time of operation were 271 ± 75, 194 ± 59 and 209 ± 74 mg/L
in R200, R1000 and RMIX respectively. As the amount of VSS was consistently higher in the R200
reactor (as shown in Figure 20), despite the reactors operating at similar HRT, it could be
hypothesized that the amount of suspended biomass was higher, and thus contributed to the COD
removal to a larger extent compared to the other two reactors. Which may also be the reason as to
why R200 was more sensitive to sudden decreases in HRT, as suspended biomass was being washed
out.
a) b)
c) d)

41
Figure 20. Volatile suspended solids in the reactors over the time of operation.
4.2.4. Light microscopy of the suspended biomass
The light microscopy (Figure 21) of the suspended biomass in the reactors on day 238 of operation
showed no noticeable difference in free-swimming microorganisms between the three reactors.
Rod-shaped, curved-shaped (spirillum/spirochete) and possibly coccoid-shaped bacteria/archaea
were observed in all reactors. What appeared to be free-swimming protozoans (probably flagellates)
were also observed in all reactors (Figure 21 d)). Small (<25 μm), medium (25-250 μm) and large
(>250 μm) microbial flocs were present in the reactors. Rounded, more dense flocs were observed
(Figure 21 a)), and larger irregularly shaped flocs were observed (Figure 21 c)). Some flocs appeared
to have oil-like droplets (Figure 21 b)). Piculell et al. (2014) found that most of the suspended
biomass in a study of aerobic MBBRs came from detached biofilm, it could therefore be expected
that the microbial flocs in this study mostly originated from detached biofilm as well. R200
appeared to have smaller, but an overall higher number of microbial flocs compared to R1000 and
RMIX which had fewer but larger microbial flocs.

42
Figure 21. Light microscopy of the suspended biomass in the reactors. a) A medium-sized (25-250 μm) microbial floc in R200 in 200x magnification. b) A medium-sized (25-250 μm) microbial floc in R200 in 1000x magnification, with oil-like droplets. c) A large (>250 μm), irregularly shaped microbial floc in RMIX. d) A protozoan in R1000 in 1000x magnification.
100 μm
100 μm

43
5. Conclusion
The first objective of this study was to evaluate the performance in terms of sCOD removal and
biogas production depending on the type of carrier and the biofilm thickness. R200 had a
fluctuating sCOD removal not exceeding 73% and a methane content of 63 ± 2%, while R1000
and RMIX reached a stable sCOD removal of above 90% with a methane content of 69 ± 2%
(R1000) and 68 ± 2% (RMIX). The results thus clearly showed that the reactor containing only Z-
200 carriers (R200) had lower and more fluctuating sCOD removal, as well as a lower methane
content of the biogas. The lower and more fluctuating sCOD removal in R200 compared to the
reactors which contained Z-1000 carriers (R1000 and RMIX) may be explained by a number of
reasons (not listed in order of relevance as this is not possible to pinpoint by this study):
• R200 may contain more suspended biomass which contributes to the COD removal.
Changes in HRT will thus influence the sCOD removal to a larger extent in R200 compared
to the other reactors.
• There is an imbalance between the methanogens and the bacteria in R200, indicated by the
high levels of VFAs, more specifically the high relative levels of acetate and propionate.
This imbalance decreases the performance of R200 in terms of sCOD removal and biogas
production. This could possibly be confirmed by analysis of the microbial composition in
the reactors.
• The amount of biomass in R200 is simply not sufficient (i.e. there is not enough surface
for enough biofilm to form) to reach sCOD removal rates of above 90% as for the other
two reactors.
• The sensitive methanogens on the Z-200 carriers may be less shielded from perturbations
such as changes in VLR, HRT, temperature, and composition of the feed due to a thinner
biofilm, leading to more fluctuating sCOD removal and a less resilient process.
Furthermore, the lower methane content of the biogas in R200 is likely related to the imbalance of
the syntrophic relationship between the hydrogen-consuming methanogens and the acetogens,
resulting in a relatively higher H2 content of the biogas. However, the H2 content of the biogas
should be measured to confirm this.
The other objective was to assess the effect of the different carriers on biofilm development and
accumulation. It was expected that the Z-1000 carriers would hold a greater mass of biofilm than
Z-200, as the Z-1000 has a higher maximum biofilm thickness. However, the result showed a
significantly greater mass of biofilm (as g VS/m2 PSA) on the Z-1000 carriers than expected. This
may be due to a more dense biofilm in Z-1000 and/or that the biofilm was closer to its maximum
biofilm thickness in Z-1000 (as confirmed by the light microscopy). Furthermore, the biofilm may
be more protected in the Z-1000 carriers, as the cells of these carriers are deeper, causing less shear
on the biofilm. However, even though the Z-1000 held more biofilm, the specific removal rate of
the Z-200 carriers was significantly higher. This result indicates that Z-200 carriers allow for a more
specialised/active biofilm. This may be due to (not listed in order of relevance):
• A larger fraction of inactive biomass and/or EPS in the thicker biofilm of the Z-1000
carriers, as a result of nutrients not being able to penetrate the deeper layers of the biofilm.
In R200, which has a thin biofilm, the nutrients would be available to the whole depth of
the biofilm.

44
• The difference in carrier design and material. This may influence the hydrodynamics in the
reactors and the surface properties of the carriers, leading to differences in the microbial
community of the biofilm.
In conclusion, this study suggests that the performance of AnMBBRs are largely influenced by the
biofilm thickness and that the carrier design and material may influence the biofilm development.
The reactor containing Z-1000 carriers showed a significantly higher sCOD removal efficiency
while the reactor containing only Z-200 carriers had a significantly higher specific removal rate. It
may therefore be preferable to use the design of the Z-200 carrier but instead use carriers allowing
for a slightly thicker biofilm, e.g. Z-400 carriers which allow for a maximum biofilm thickness of
400 μm. It may also be possible to use a higher number of these carriers to maximise the surface
area available for biofilm formation and thereby achieve better COD removal.

45
6. Recommendations for future work
One of the original objectives was to assess the microbial community with 16S gene analysis (carrier
samples and suspended biomass samples were collected in this study for future analysis of this) to
characterise the microbial community and evaluate if/how the microbial community differed
depending on the carrier type and biofilm thickness. As this was not possible to perform during
this study, and studies on the microbial community in AnMBBRs are few, it would be of interest
to analyse the microbial community in future work. Analysis of the microbial community could
reveal differences in the bacterial and archaeal community of the biofilm and the suspended
biomass and relate this to the difference in performance of the reactors. It would not only be
interesting to analyse the microbial community, but also the fraction of active/inactive biomass
depending on biofilm thickness to evaluate how nutrients may penetrate the deeper layers of the
biofilm.
It was mentioned that the lower methane content of R200 may be the result of a higher fraction of
H2 in the biogas. It would be of interest to measure the H2 content in the biogas to confirm this.
Furthermore, the carriers in this study were of different design and material (saddle-shaped versus
flat and recycled HDPE versus virgin HDPE). Studies have suggested that the archaeal community
in anaerobic processes may be dependent on the support material, while the bacterial community
may be more dependant on the inoculum used (Habouzit et al., 2014). By characterizing the surface
properties (surface charge, water contact angle, surface roughness, etc.) of the carriers together
with analysing the microbial community, it could be evaluated if the microbial community varies
depending on the surface properties of the carrier material.

46
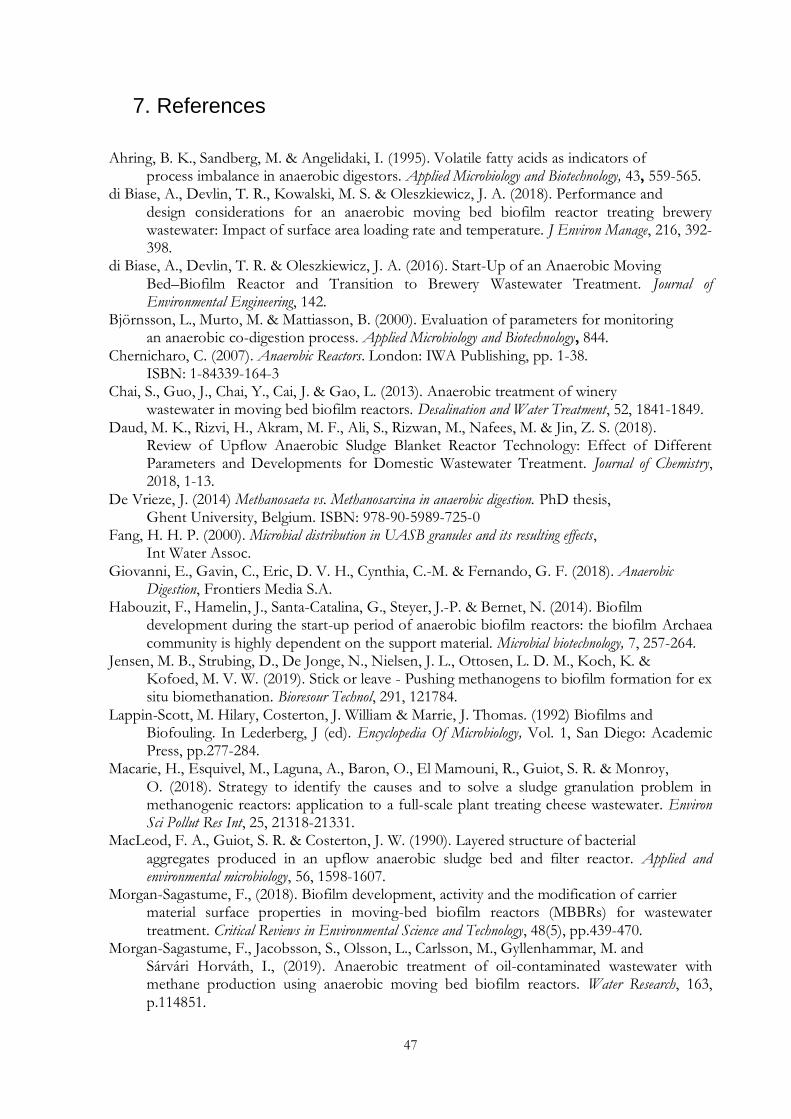
47
7. References
Ahring, B. K., Sandberg, M. & Angelidaki, I. (1995). Volatile fatty acids as indicators of process imbalance in anaerobic digestors. Applied Microbiology and Biotechnology, 43, 559-565.
di Biase, A., Devlin, T. R., Kowalski, M. S. & Oleszkiewicz, J. A. (2018). Performance and design considerations for an anaerobic moving bed biofilm reactor treating brewery wastewater: Impact of surface area loading rate and temperature. J Environ Manage, 216, 392-398.
di Biase, A., Devlin, T. R. & Oleszkiewicz, J. A. (2016). Start-Up of an Anaerobic Moving Bed–Biofilm Reactor and Transition to Brewery Wastewater Treatment. Journal of Environmental Engineering, 142.
Björnsson, L., Murto, M. & Mattiasson, B. (2000). Evaluation of parameters for monitoring an anaerobic co-digestion process. Applied Microbiology and Biotechnology, 844.
Chernicharo, C. (2007). Anaerobic Reactors. London: IWA Publishing, pp. 1-38. ISBN: 1-84339-164-3
Chai, S., Guo, J., Chai, Y., Cai, J. & Gao, L. (2013). Anaerobic treatment of winery wastewater in moving bed biofilm reactors. Desalination and Water Treatment, 52, 1841-1849.
Daud, M. K., Rizvi, H., Akram, M. F., Ali, S., Rizwan, M., Nafees, M. & Jin, Z. S. (2018). Review of Upflow Anaerobic Sludge Blanket Reactor Technology: Effect of Different Parameters and Developments for Domestic Wastewater Treatment. Journal of Chemistry, 2018, 1-13.
De Vrieze, J. (2014) Methanosaeta vs. Methanosarcina in anaerobic digestion. PhD thesis, Ghent University, Belgium. ISBN: 978-90-5989-725-0
Fang, H. H. P. (2000). Microbial distribution in UASB granules and its resulting effects, Int Water Assoc.
Giovanni, E., Gavin, C., Eric, D. V. H., Cynthia, C.-M. & Fernando, G. F. (2018). Anaerobic Digestion, Frontiers Media S.A.
Habouzit, F., Hamelin, J., Santa-Catalina, G., Steyer, J.-P. & Bernet, N. (2014). Biofilm development during the start-up period of anaerobic biofilm reactors: the biofilm Archaea community is highly dependent on the support material. Microbial biotechnology, 7, 257-264.
Jensen, M. B., Strubing, D., De Jonge, N., Nielsen, J. L., Ottosen, L. D. M., Koch, K. & Kofoed, M. V. W. (2019). Stick or leave - Pushing methanogens to biofilm formation for ex situ biomethanation. Bioresour Technol, 291, 121784.
Lappin-Scott, M. Hilary, Costerton, J. William & Marrie, J. Thomas. (1992) Biofilms and Biofouling. In Lederberg, J (ed). Encyclopedia Of Microbiology, Vol. 1, San Diego: Academic Press, pp.277-284.
Macarie, H., Esquivel, M., Laguna, A., Baron, O., El Mamouni, R., Guiot, S. R. & Monroy, O. (2018). Strategy to identify the causes and to solve a sludge granulation problem inmethanogenic reactors: application to a full-scale plant treating cheese wastewater. EnvironSci Pollut Res Int, 25, 21318-21331.
MacLeod, F. A., Guiot, S. R. & Costerton, J. W. (1990). Layered structure of bacterial aggregates produced in an upflow anaerobic sludge bed and filter reactor. Applied and environmental microbiology, 56, 1598-1607.
Morgan-Sagastume, F., (2018). Biofilm development, activity and the modification of carrier material surface properties in moving-bed biofilm reactors (MBBRs) for wastewater treatment. Critical Reviews in Environmental Science and Technology, 48(5), pp.439-470.
Morgan-Sagastume, F., Jacobsson, S., Olsson, L., Carlsson, M., Gyllenhammar, M. and Sárvári Horváth, I., (2019). Anaerobic treatment of oil-contaminated wastewater with methane production using anaerobic moving bed biofilm reactors. Water Research, 163, p.114851.

48
Murto, M., Bjornesson, L. & Mattiasson, B. (2004). Impact of food industrial waste on anaerobic co-digestion of sewage sludge and pig manure. J Environ Manage, 70, 101-7.
Månsson, Emma. (2020). Considerations for the Establishment of an Anaerobic Biofilm in an AnMBBR. Master Thesis, Lund: Department of Chemical Applied Microbiology, Lund University.
Piculell, Maria. (2016). New Dimensions of Moving Bed Biofilm Carriers: Influence of biofilm thickness and control possibilities. Lund: Department of Chemical Engineering, Lund University. ISBN: 978-91-7422-442-9.
Piculell, M., Welander, T. & Jönsson, K. (2014). Organic removal activity in biofilm and suspended biomass fractions of MBBR systems. Water Sci Technol, 69, 55-61.
Prabhakaran, P., Bhasi, A., Ali, S., Narayanan, N., Balakrishnan, M. V. & Bhaskaran, K. (2016). Community dynamics and significance of anaerobic protozoa during biomethanation of lignocellulosic waste. Renewable Energy, 98, 148-152.
Priya, M., Haridas, A. & Manilal, V. B. (2008). Anaerobic protozoa and their growth in biomethanation systems. Biodegradation, 19, 179-85.
Rajeshwari, K., Balakrishnan, M., Kansal, A., Lata, K. and Kishore, V., (2000). State-of-the-art of anaerobic digestion technology for industrial wastewater treatment. Renewable and Sustainable Energy Reviews, 4(2), pp.135-156.
Sahm, H. (1984) Anaerobic wastewater treatment. In: Fiechter A (ed) Adv in Biochem Eng/Biotechnol, Vol. 29, pp. 83–115. ISBN : 978-3-540-12860-1
Van Haandel, A., Chaves, S. R. M. & Dos Santos, S. L. 2018. Influence of temperature on the performance of anaerobic treatment systems of municipal wastewater. Water SA, 44.
Van Lier, J.B., Mahmoud, N. & Zeeman, G. (2008). Anaerobic Wastewater Treatment. In Morgens Henze, M. C. M. V. L., Georg A. Ekama, Damir Brdjanovic 2008. Biological Wastewater Treatment: Principles, Modelling and Design. IWA Publishing, pp. 413-451.
Vroom, J. M., De Grauw, K. J., Gerritsen, H. C., Bradshaw, D. J., Marsh, P. D., Watson, G. K., Birmingham, J. J. & Allison, C. (1999). Depth penetration and detection of pH gradients in biofilms by two-photon excitation microscopy. Applied And Environmental Microbiology, 65, 3502-3511.
Wang, S., Rao, N. C., Qiu, R. & Moletta, R. (2009). Performance and kinetic evaluation of anaerobic moving bed biofilm reactor for treating milk permeate from dairy industry. Bioresour Technol, 100, 5641-7.
The Water Environment Federation., 2010. Biofilm Reactors: WEF Manual Of Practice No. 35. Alexandria, Va: McGraw-Hill, pp. 2, 403 & 212-215. ISBN: 9780071737074
Zinder, H. S. (1992) Methanogenesis. In Lederberg, J (ed). Encyclopedia Of Microbiology, Vol. 3, San Diego: Academic Press, pp.81-96.

49
Appendix A: Wastewater characteristics
Table A1. Analysis results from the wastewater used as substrate. Average and standard deviation from 13 batches.
Analysis Average Std
pH 3.80 0.17
Alkalinity (mg CaCO3/L) 48.3 35.1
Ca2+ (mg/L) 28.8 6.1
Mg2+ (mg/L) 9.81 2.83
Hardness (°dH) 6.31 1.15
Cl- (mg/L) 180 180
SO4 (mg/L) 22.4 11.4
sCOD (mg/L) 1830 282
tCOD (mg/L) 2367 426
sCOD/tCOD 0.780 0.066
NH4-N (mg/L) 6.8 3.4
N-tot (mg/L) 46.7 18.4
PO4-P (mg/L) 11.7 4.5
P-tot (mg/L) 16.5 5.2
TSS (mg/L) 309 121
VSS (mg/L) 260 103
VSS/TSS 0.857 0.24
Appendix B: TS and VS results from carrier samplings
Table B2. TS and VS results from the carrier samplings on day 141, 169 and 232 of reactor operation.
Day Reactor TS
(mg/carrier) VS
(mg/carrier)
141 R200 3.2 ± 0.1 2.9 ± 0.1
R1000 24.1 ± 1.0 21.1 ± 0.8
RMIX Z-200 1.4 ± 0.2 1.3 ± 0.2*
RMIX Z-1000 34.9 ± 0.7 30.9 ± 0.8
169 R200 5.7 ± 0.4 5.3 ± 0.1
R1000 46.3 ± 2.1 40.4 ± 1.9
RMIX Z-200 2.1 ± 0.2 1.7**
RMIX Z-1000 70.8 ± 0.6 62.4 ± 0.2
232 R200 9.1 ± 1.1 7.5 ± 1.4
R1000 103.5 ± 22.4 88.9 ± 21.0
RMIX Z-200 6.6 ± 0.3 4.2 ± 0.8
RMIX Z-1000 171.7 ± 3.2 151.3 ± 3.1 * Only two out of three samples could be analysed.
** Only one out of three samples could be analysed.

50
Appendix C: Equations
Equations C1: Methane yield (Table 4)
The methane yield was calculated on a weekly basis, based on the volume of biogas per day
produced by the reactors (as normal (N) millilitres per day and the average methane content of the
biogas from the reactors. The methane yield given in Table 4 is thus the average from day 124-328
of reactor operation.
𝑀𝑒𝑡ℎ𝑎𝑛𝑒 𝑌𝑖𝑒𝑙𝑑 𝑅200 =𝑄𝑏𝑖𝑜𝑔𝑎𝑠 [
𝑁𝑚𝐿 𝑏𝑖𝑜𝑔𝑎𝑠
𝑑𝑎𝑦]∗0.63
𝑠𝐶𝑂𝐷𝑟𝑒𝑑 [𝑔 𝑠𝐶𝑂𝐷 𝑟𝑒𝑑𝑢𝑐𝑒𝑑
𝑑𝑎𝑦]
(Equation C1.1)
𝑀𝑒𝑡ℎ𝑎𝑛𝑒 𝑌𝑖𝑒𝑙𝑑 𝑅1000 =𝑄𝑏𝑖𝑜𝑔𝑎𝑠 [
𝑁𝑚𝐿 𝑏𝑖𝑜𝑔𝑎𝑠
𝑑𝑎𝑦]∗0.69
𝑠𝐶𝑂𝐷𝑟𝑒𝑑 [𝑔 𝑠𝐶𝑂𝐷 𝑟𝑒𝑑𝑢𝑐𝑒𝑑
𝑑𝑎𝑦]
(Equation C1.1)
𝑀𝑒𝑡ℎ𝑎𝑛𝑒 𝑌𝑖𝑒𝑙𝑑 𝑅𝑀𝐼𝑋 =𝑄𝑏𝑖𝑜𝑔𝑎𝑠 [
𝑁𝑚𝐿 𝑏𝑖𝑜𝑔𝑎𝑠
𝑑𝑎𝑦]∗0.68
𝑠𝐶𝑂𝐷𝑟𝑒𝑑 [𝑔 𝑠𝐶𝑂𝐷 𝑟𝑒𝑑𝑢𝑐𝑒𝑑
𝑑𝑎𝑦]
(Equation C1.1)
Where Qbiogas is the volumetric flow of biogas and sCODred is the removal rate of sCOD.
Equations C2: Biofilm development from TS and VS results
The biofilm results in Table 5 are based on the TS and VS results in Table B1.
The mass of biofilm per PSA was based on the PSA for the carriers, 0.00128 m2 for Z-200 and
0.00164 m2 for Z-1000, according to:
𝐵𝑖𝑜𝑓𝑖𝑙𝑚 𝑜𝑛 𝑍 − 200 𝑐𝑎𝑟𝑟𝑖𝑒𝑟𝑠 =𝑉𝑆𝑐𝑎𝑟𝑟𝑖𝑒𝑟 [𝑔 𝑉𝑆/𝑐𝑎𝑟𝑟𝑖𝑒𝑟]
0.00128 [𝑚2 𝑃𝑆𝐴/𝑐𝑎𝑟𝑟𝑖𝑒𝑟](Equation C2.1)
𝐵𝑖𝑜𝑓𝑖𝑙𝑚 𝑜𝑛 𝑍 − 1000 𝑐𝑎𝑟𝑟𝑖𝑒𝑟𝑠 =𝑉𝑆𝑐𝑎𝑟𝑟𝑖𝑒𝑟 [𝑔 𝑉𝑆/𝑐𝑎𝑟𝑟𝑖𝑒𝑟]
0.00164 [𝑚2 𝑃𝑆𝐴/𝑐𝑎𝑟𝑟𝑖𝑒𝑟](Equation C2.2)
The biofilm accumulation rate was based on Equation C2.1 and C2.2, divided on the number of
days between sampling.
The total amount of biofilm in the reactors was based on the amount of biofilm per carriers and
the number of carriers at the sampling occation, according to:
𝑇𝑜𝑡𝑎𝑙 𝑏𝑖𝑜𝑓𝑖𝑙𝑚 = 𝑉𝑆 [𝑔 𝑉𝑆/𝑐𝑎𝑟𝑟𝑖𝑒𝑟] ∗ 𝑛𝑢𝑚𝑏𝑒𝑟 𝑜𝑓 𝑐𝑎𝑟𝑟𝑖𝑒𝑟𝑠 (Equation C2.3)

51
The specific removal rate was calculated based on the sCOD removal rate (g sCOD
removed/day) and the total amount of biofilm in the reactors, according to:
𝑆𝑝𝑒𝑐𝑖𝑓𝑖𝑐 𝑟𝑒𝑚𝑜𝑣𝑎𝑙 𝑟𝑎𝑡𝑒 =𝑠𝐶𝑂𝐷𝑟𝑒𝑑 [
𝑔 𝑠𝐶𝑂𝐷 𝑟𝑒𝑚𝑜𝑣𝑒𝑑
𝑑𝑎𝑦]
𝑉𝑆𝑟𝑒𝑎𝑐𝑡𝑜𝑟 [𝑔 𝑉𝑆
𝑟𝑒𝑎𝑐𝑡𝑜𝑟]
(Equation C2.4)


![IP4309CX9 HDMI octal channel low capacitive high ... · Carrier tape antistatic[2] film thickness T 0.25 0.07 Cover tape[3] width W1 5.75 max film thickness T1 0.1 max Bending radius](https://img.dokumen.tips/doc/110x75/5fc0bf4b2a75ba11be7329db/ip4309cx9-hdmi-octal-channel-low-capacitive-high-carrier-tape-antistatic2.jpg)