Embed Size (px)
Citation preview

E L S E V I E R Global and Planetary Change 9 (1994) 275-288
GLOBAL AND PLANETARY CHANGE
Effect of altered Arctic sea ice and Greenland ice sheet cover on the climate of the GENESIS general circulation model
Thomas J. Crowley a, Kuor-Jier Joseph Yip b, Steven K. Baum a
a Department of Oceanography, Texas A &M University, College Station, Texas 77843 USA b Center for Ocean andAtmospheric Modeling, Mail Stop 5005, Stennis Space Center, MS 39529 USA
Received 14 July 1993; accepted 6 April 1994
Abstract
Previous studies have examined the effect of reduced Arctic sea ice cover on the circulation of climate models. Generally, the response is restricted to high northern latitudes. Here we examine a variant on those simulations, specifying both reduced Arctic sea ice cover and no Greenland ice sheet. The GENESIS general circulation model is used in these experiments. As in earlier studies, we find the effect limited primarily to the high latitudes of the northern hemisphere, being greater in winter than in summer. New results reported herein involve: (1) in winter reduced Arctic ice cover has a significantly greater effect than reduced Greenland ice cover; (2) reduced ice cover had little effect on location of the winter freezing line over North America and Eurasia; (3) removal of ice caused a 30-50% increase in precipitation in high northern latitudes; however there were no significant effects elsewhere. This result does not support the hypothesis that past changes in Arctic ice cover were responsible for significant changes in area of tropical rainforests; (4) there is a peculiar surface pressure anomaly that extends into the high latitudes of the southern hemisphere. This anomaly may be a spurious artifact of the effect of the removed Greenland ice sheet on the spherical harmonic expansion terms in the model. These sensitivity experiments should serve as a useful frame of reference for future Pliocene simulations with a more complete set of altered boundary conditions.
1. Introduction
Geologists have long been interested in the poten- tial effect of altered northern hemisphere ice cover on past climates, for evidence suggests that Arctic ice cover was significantly reduced prior to about 2.4 Ma. The effect of such changes on the atmospheric circulation has recently been examined in two sensi- tivity experiments with general circulation models (GCMs; Raymo et al., 1990; Royer et al., 1990). Both of these experiments indicated that the effect of reduced Arctic ice cover is restricted primarily to the high latitudes of the northern hemisphere, with the effect being greater in winter than in summer.
The limited range of the above temperature re- sponse can be attributed to the fact that a localized heat source (or sink) does not induce large changes in heat transport from lower latitudes (which in turn would cause temperature changes in those regions). This is because any changes in sensible heat trans- port are almost entirely offset by changes in latent heat transport of the opposite sign (cf. Manabe and Broccoli, 1985). For the case of reduced ice cover, an increase in incoming radiation is almost entirely compensated by an increase in outgoing longwave radiation.
The effective length scale of the temperature per- turbation in the above experiment is ~ 1500 km.
0921-8181/94/$07.00 © 1994 Elsevier Science B.V. All rights reserved SSDI 0921-8181(94)00004-W
276 T.J. Crowley et al. / Global and Planetary Change 9 (1994) 275-288
North (1984) has shown analytically that this dis- tance reflects a balance between the radiative damp- ing term and heat transport. In addition to the above cited experiments, the same length scale occurs in two other climate models (e.g., Lautenschlager and Santer, 1991; North et al., 1992). The thermal pertur- bation of the Gulf Stream also has this length scale - -even though western European coastal tempera- tures can remain quite mild in winter, significant subfreezing temperatures occur in eastern Europe.
In this paper we expand on the work of previous authors by investigating the combined effect of both reduced Arctic and Greenland ice cover. These con- ditions are somewhat closer to the actual differences that may have occurred in the Pliocene, which is a time interval presently being examined in greater detail (e.g., Dowsett and Poore, 1991; Poore, 1993). The reasons such ice cover may have changed are still uncertain, although there is some paleoceano- graphic evidence (Raymo et al., 1992) for an en- hanced level of thermohaline overturn in the Atlantic sector that could have caused the ice meltback. What triggered the thermohaline changes is unclear. Higher CO 2 levels is one possibility (Crowley, 1991; 1993). Additionally, the long-term movement of the conti- nents may have been responsible for formation of the Greenland Ice Sheet (Crowley et al., 1986).
2. Model
The GENESIS (version 1.02.A) GCM employed has recently been developed at the National Center for Atmospheric Research (NCAR) by D. Pollard and S. Thompson and is an updated, modified, and extended version of the NCAR CCM1 model (Wil- liamson et al., 1987). It has the same number of vertical levels (12) and horizontal resolution (4.5 ° × 7.5 °) as the CCM1. The horizontal and vertical vari- ables are discretized using spectral transform and finite-difference methods, respectively, but the meth- ods for handling most of the important physical processes in the model have been changed. There are certain other features which make the model user- friendly for paleoclimate adaptations. The section below briefly describes some of the more salient features of the model, although fuller description of
the model are provided by Thompson and Pollard (1994).
The updated and modified processes include the solar radiation package, which has been replaced by the scheme of Thompson et al. (1987). This scheme collapses all clouds into a single effective cloud layer for solar computations, thus simplifying calcu- lations, and also allows for the inclusion of atmo- spheric aerosol effects. The solar radiation package has been updated to include a diurnal cycle, with calculations performed every 1.5 hours.
The CCM1 convective and dry adiabatic adjust- ment has been replaced by a plume model similar to those of Anthes (1977) and Gregory and Rowntree (1990). A column model of subgrid rising thermals is solved, including saturation and precipitation, at each horizontal grid point and at each time step. The large-scale vertical fluxes, latent heating, and con- vective precipitation are diagnosed from these re- suits. The planetary boundary layer (PBL) is also simulated with this model by initiating dry PBL thermals at the center of the lowest model layer using scaled values from the constant-flux region immediately below. This scheme is related to those of Troen and Mahrt (1986) and Holtslag et al. (1990) but models the PBL thermals explicitly rather than implicitly.
A new cloud parameterization with three possible types of clouds (stratus, anvil cirrus, convective) is used. This method is similar to that of Slingo and Slingo (1991). A new constraint on stratus clouds has been added when the specific humidity is very low to achieve more realistically low amounts in the polar regions in winter, and the three-dimensional blocking effect of clouds at low zenith angles has been accounted for by adding a term that increases the effective cloud fraction in each layer depending on the instantaneous solar zenith angle.
A semi-Lagrangian method for transport of water vapor has been added (Williamson and Rasch, 1989; Rasch and Williamson, 1990; Williamson, 1990). This uses cubic interpolation in all directions and "operator splitting" between horizontal and vertical advection. This was added to avoid the unphysical holes and ripples produced by spectral advection of fields with large spatial gradients such as moisture.
An extension of the CCM1 is the inclusion of a surface package called the land-surface transfer
T.J. Crowley et al. / Global and Planetary Change 9 (1994) 275-288 2 7 7
90°N
7 0 ° N
50~N
30°N
10°N
10°8
30~8
SO°8
70~S
go~S~o~ w
l'l . . . . . , , , - : ' :~ ] . - ; : - - . ' . : . : . . . . - . . . . . .
::. ...... "-~/"\~:~,,'~:>' : ~, c~ ....... ., ..... .....
.., • ! ? . . : , . ..
f . .
• v , : j "
:.,:L: " . . . . : : i - ' " ,
,' "', : , " ' / "" / " 5 : I . . . . '- ........................ ...... ...................................
I , I I I ) I i
I20°W 6 0 ~ GM. 60~E 120~E 180~E
g0ON , - , - , - , - ) .
. . . : .......... ,,,...-~".:'"'v" • ~,~',,'e--',"-""~'.'-"' "" . . - " " .: ~ ""
~o~ +::!:+ +iii : , :i+:; .... /i ~!::i .:i:
lOOS : . ..: ...... ., ..::
• ...:
3o~s . : . .7
i
5 ~ 8 ': : l I . . . . . . . . 7
9 0 o 8 t , ) , L , i . . . . . , " J" . . . . . . . : . . . . . . . . [ ' " , " ' % 180°W t20°W 60°W " OU. 60°E 120 °~- 180°E
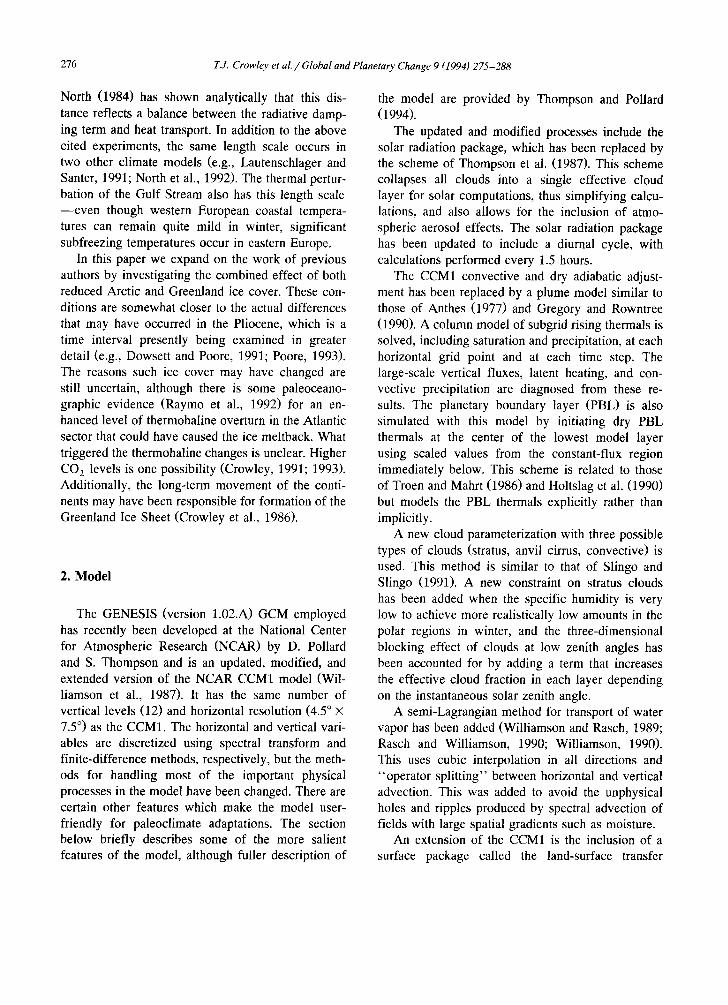
Fig. 1. Differences in temperatures at l o w e s t A G C M o - l c v e l ( a p p r o x i m a t e | y 70 m), J u n e - J u l y - A u g u s t b e t w e e n (a) C O N T R O L m i n u s G R E E N L A N D run; a n d (b) C O N T R O L m i n u s A R C T I C run .
278 T.J. Crowley et al. / Global and Planetary Change 9 (1994) 275-288
9 0 ° N
TO~N
50~N
30~N
10°N
lO*S
30*S
50~S
70*S
9 W 120°W 60':' ~( GM,
" - . . . . . : . . . . . . . . " . . . . . . ', , - : . . -;- . -:: -:-:=-'. . . . . . : : : - c - - S ; - : , . , - - - . . : . .- . . . . . . . . . . . . . . . . . ~ + , . ~ . ~ ~'~<?+:++.:, : , ' + . ~ : + j . + ~ . ' + ~ . ~ , ~o, "",,. " . . . . .
. . . . " , : : " - " 5 . [ : " : ¢ ~ ' . / , ' " ' • ........ "-:~.- . . . . ~ . . . . . . . . . . " . ' , :: ~,:,:. ,; " ; : / ; & ~ " ~ .'" ~ • ~ , . v . , " . ~ ,,,,....~, ,+,,:--~, . ~ J .... -,,, /,/
':: ~ ,:..".' ,'(':::~':~;-.',,..," - : .:" :: .
. : . . . :.. : .ii.!::.::: :.'!,:2....,:. ( D . . : ? . ...... . , . + . - .
+ : .: i i '
. . . . . . .
i : (
o
,>i. .:.!i . . . . . . . . . : . . . . . . . . . . . . . . . . .
+. .... :~.. ....... !i::' : . ..+ +" ......... ' ....... .,,...
.... , _...::.
800E I20*E 180*E
00~N
70*N
50"N
300N
I(Y'N
IO°S
30°S
. . . . ' . , . , . . ,.+:,~.k" . . . . .+":.:" , . - -~ .~-+ .+~ , .+..+.++-,. ,+'+
' :'.~., ," 0 . "~'.;.':...,- "~++-'-:,, ", . . . . . . . ".~- • ........ .-", . . . . , . : "~:~....,;~,~,;<rY . :......¢,p.¢;
: ~ + m + + ~ , m ++ .:,..+.,:--..~.+ ,,,,--;o ::+~;,:++'+' ' . . . . • f ~ + , : : . . / : : v,.::,+~+::.- ,,::, 5~+.::~+~:,,:+ -'
:+ + ~ + 2 : : . . ' ° + ,+? +i+:• : +
3
/
/
50*S ]
G.I
. . . . . . . . :..... I I I I , , ,
I:~O°W 80°VI GM, + P E I+OoE 180°E
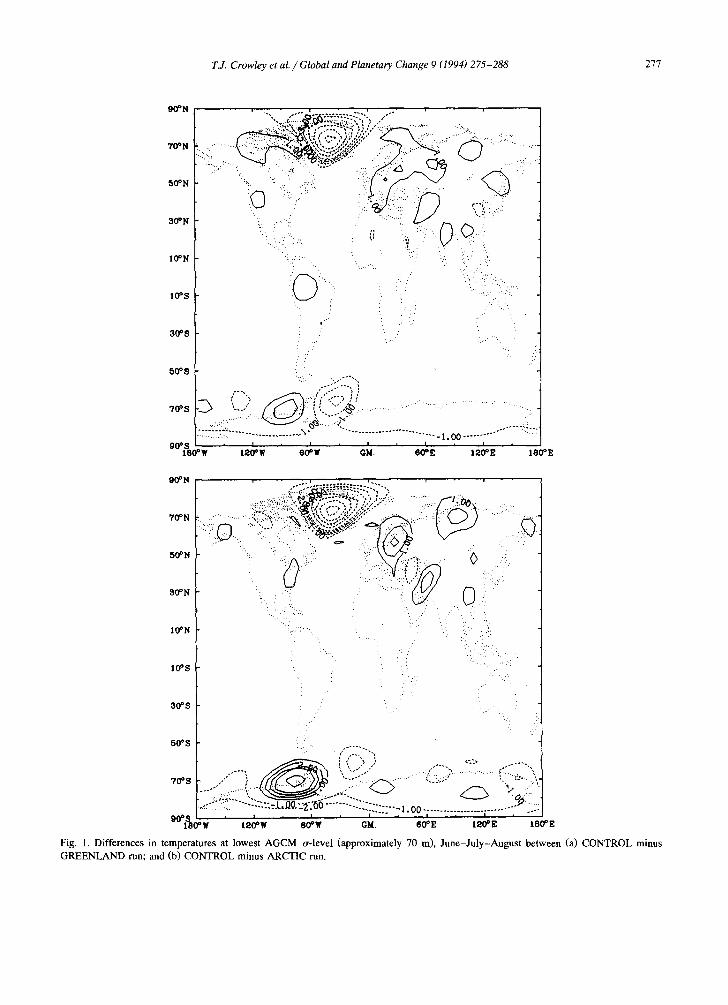
Fig. 2. D i f f e r e n c e s in t e m p e r a t u r e s at l owes t A G C M o+-level ( a p p r o x i m a t e l y 70 m) , D e c e m b e r - J a n u a r y - F e b r u a r y b e t w e e n (a) C O N T R O L
m i n u s G R E E N L A N D run; and (b) C O N T R O L m i n u s A R C T I C run.

T.J. Crowley et al. / Global and
model (Pollard and Thompson, 1994). This replaces the surface temperature calculation routine of the CCM1, including the computation of exchanges of momentum, thermal energy, and water mass between the atmosphere and land surface taking into account the effects of vegetation. LSX borrows heavily from the earlier biosphere-atmosphere transfer scheme (BATS; Dickinson et al., 1986) and simple biosphere model (SiB; Sellers et al., 1986) vegetation models and is intermediate in complexity between the two (Bonan et al., 1992). The surface package alsoin- cludes multilayer models of soil, snow, and sea ice. A related modification is that the GCM grid is now independent of the surface grid. This allows different sized grids for the GCM and LSX models. The fields are transferred by either bilinear interpolation or area averaging as is called for by the situation.
Because we are conducting a sensitivity experi- ment, we employed a lower resolution to the land surface (R15). The reduced geographic resolution resulted in almost a halving of the run time per day ( ~ 50 s). The model was run for 4 1 /4 years; this length of time was deemed sufficient for the most
Planetary Change 9 (1994) 275-288 279
important climate fields to settle into equilibrium when fixed sea surface temperatures (SSTs) are used.
3. Boundary conditions
The only changes in boundary conditions we made were in ice cover and regions affected by ice cover. In accordance with the earlier modeling studies, and in line with some paleoclimate observations (Cronin et al., 1993), summer sea ice cover was set to zero and winter ice cover set to the present summer value [as determined by the Alexander and Mobley (1976) data set]. Newly open areas of water had their SSTs set at - I ° C , in accordance with the experiment of Raymo et al. (1990). The Greenland Ice Sheet was completely removed, and a vegetation typical of northern Canada (tundra biome) placed in its stead. Results were compared to a control run with pre- scribed SSTs and sea ice from Alexander and Mob- ley (1976). Two experiments were run, one with only the Greenland Ice Sheet removed (termed GREENLAND experiment), the other with both the
I
I
A
r~
\
DJF
.. . . . . . . . . . . . . . . . . JJA
tt~
- 9 0 - 7 0 - 5 0 - 3 0 - 10 10 3 0 5 0 7 0 9 0
I .~TITUDE
Fig. 3. Zonal mean temperature differences (lowest A G C M o-level) be tween C O N T R O L and A R C T I C runs for DJF and JJA.

280 T.J. Crowley et aL / Global and Planetary Change 9 (1994) 275-288
O0°N
70°N
5 0 ° N
30°N
10°N
lo°s
30°S
" ' " ' " " 0 . . . . . . . . . . . . . . . • . . . . . . . " : " ' ' " ' . . . [ L . . . ' . . . . . . . .. . . . . . . .~,3,0,,,,,." ........... . : ; . , . . , . -7 .5 .J1 " r . . . . . . .~p ^ . , - ' " • : . . . . . . . ' . ' , *< , ; i ;% ;~ -~ . . . . . . . . . . . " ~ : ; ; . : : - : ~ . " . q ' : r . ' ~ C ' ; Y - : : - : :~. . "-~ ",~O:.E.'.:.:.."I: ~:".,'i(. ;;"-. ......... ",,'.).-¢~'~E'~L_"" " .'~"','...~...." .."...~.. '..::.'7
. . . . , ' , : " -~ , , 'h . ". ~:" .: '~"" ,-"~ . . . . . . . ~=~&%~..~z~ ; ;'-'~ .L-.," . . . . . . . .... , , . . < ; * " : - - - : " - , ' ~ ' ~ " ';' ~",~. "J~,~'~;?;..-. " ; , ' : . : ~ : ~ + . ' - r < " ' , ~ , . . . . . . . . ~ : , ' : . : . : . : . : . : ~ . " . : ~ . : ~ ' . . . . ; , ~ : , . : ~ . ~ " " .... . .": ! ; : ; , .z , . -" ,.. : . . . . . . . . . ' , . .~.:",,~:.. . .: .:::.
':i. .-'.."'.: " v. ;'. _ _ "" :
, . . ,,,,v:.,
• . . . : : i ! . .:~:.
• . ..
;
! ..
7
. . . . . .",
:" , ' i
:. .i :...
: i ' ; i . . . " . . . . ' " ! :.i:"":: i
" ' : ' : - . v . . "
. . ' : ' . i i. j. .
i ' . -" '" . ;
~o~s i.!i ' ]
," . . . . . . . . . . . . . . . . 7 ~ ' ~ : 0 o ' . ' ' .~':;:."3.;i ':3"r'~:.='~'-----~lR'g:':5"' ' ': . . . . . : : ;':.:"~".' ' ,4 70°S ", ' . - - - --:~.: . - . , , . , ~ , - ' - . . . - " . : . - ' ; . - * . . . . . J . 5 . ~ - ' : ; - ' - " ~ l ~ . u : . ; ~ ~ ; ' - - - ; ' . . " : ~ ' . J .. . . . . . C. ........ " ' " "'"' ' . . . . . . -E" n n . . . . . ::;~;~::: " . . '" "- - "* ; ; . . . . . . . . . " ; ' - ' - ~ " ; ' ~ ' ~ - ." "'- . "'- "" ~..:::1 . . . . - . . . . . . . . . . . . . . . . . . . . . ~ ; e . ~ . . . . . . . . . . . ~ . , , , ~ . . , . I
120~W 60~W GM, 80~E 1 2 C P E 181~E
90°N
70°N
50°N
30°N
IO°N
l O ° S
30~S
' ' . . . . ~ ' : : ~ : . - ' ..... . - m y , 5 . . . . . . . ~ . . . ' , : . . : : . . .2 : : ....... -. . • .,, ~ - . -~ , , , .. ,,, L~ . . . . . . . . . , ~ . a . ~ - . , . .... ~ ~ . . . . . O " .... ~ . . . . . " . . . . " " : ' : ; ' : " : ' " .... . , , ~ o ' . - . ,~.~ ~ : . ~ : . . . . . - ; , : . ~ . ' . - - ~ . ~ z o . ~ o < . . . . . '~'~,," :.~
,,, ' , , : , , - • •
" ' : .,. ,,,
)
i
! :
.: . . ,
'. ] " . :
: : : .i:: ':i;: " ::i". ,:.
: . • ; • ..:'
5°°s :,,}i. ]
. . . . oo . . . . ? ' ~ ~ ' ' , , . . . . ::- ; 2 . ~ B ~ ~ ' : , " ~ . ~ - 7 o o s . . . . . . . . . . . . . . . . ~ - . . _ ~ . ~ , , ", , . - : . C ~ : - - ; r ~ - . : . : ~ : : , , - : : : : : : : : : : : . . : L . ~ . - : . : ~ . ~ ", ",, .:.--'-~.y..;~...~ 6- ~ ",. ". . - ' . , . ' ; , : : ' . . ' . . . - r . l=~ . . . . . . . . . Z ~ ; o V : . 2 S . O . - - - . ' - - ; > l ; , ¢ . - . I
' - . . . . f , . ' " ' " ' , ; ' ........ . . " ~ , ' U ~ . . " = ; ; = ' ; : * - ' " o ' * - ' " . - ° 1 . . . . . . . . . . . . . : . . . . " ' . " ' . " ~ : . ' . ' 1 :::.:---.~-.::; . . . . . . . . . . . . . . . . . . . - 8 1 ~ ' , o : - : : : ~ : : ' : - - " . - " ' / " " ,~" . . . . . . . . . . . ' " ' - ' . o " ' i ::~!:~'~':--"::::~:'-::: ..... "~'-~- ...... --"" *, a--- " " : .......... ..: "'::1 . . . . . . . . . , . . . . . . [" , ' " J ' , " i . . . . . . . . ; ' " i " , " -
0 % % 0 ~ W t 2 0 ° W 6 0 P W GM. e 0 ° Z 1 2 0 ° z 1 8 0 ° Z
F i g . 4 . W i n t e r t e m p e r a t u r e s ( l o w e s t A G C M c r - | c v c l ) f o r ( a ) C O N T R O L ; a n d ( b ) A R C T I C runs .

T.J. Crowley et al. / Global and Planetary Change 9 (1994) 275-288 281
Greenland Ice Sheet removed and Arctic sea ice cover reduced (termed ARCTIC experiment).
4. Results
4.1. Temperature response
To assess the relative importance of Greenland and Arctic sea ice cover, we present some of the results separately. For the GREENLAND experi- ment, removal of the Greenland Ice Sheet resulted in a larger scale temperature perturbation in winter than in summer, most of the effect restricted to high latitudes (Figs. 1 and 2). These results are in accord with the length scale arguments discussed previ- ously. The seasonal differences in high latitudes may indicate that the summer response is a strict reflec- tion of the thermal perturbation, whereas the winter response suggests that the effect of the altered tem-
peratures field has been embedded into the high-lati- tude flow pattern. Other anomalies in northern mid- latitudes may be noise; longer runs would be re- quired to assess their significance. There is a moder- ate-sized temperature anomaly in the region of the Antarctic Peninsula region of opposite sign to that over Greenland during June-July-August. The sig- nificance of this anomaly will be discussed in the section on surface pressure changes.
The joint effect of removal of both Greenland and Arctic ice cover was significantly greater than for Greenland alone in the winter months (Fig. 2). The latitudes of affected temperature (Fig. 3) are similar for the two experiments and in line with the earlier modeling studies of Raymo et al. (1990) and Royer et al. (1990).
One field we studied that was not commented on in the earlier studies involves location of the winter freezing line in North America and Eurasia. Fig. 4 illustrates the summer and winter temperature fields
90*N
.,~::,~::::'i:~;:~iiiii~i ~'. :: . . - - ~ ..... ::?"ii ~ i,:~
50°N
30°N
", . , : : , " " : .. - .= .
IOos .. ;
30os - .. :
..... "., )i . . . . .? .~ . .
50OS . . . : . ".
. . . . . , , , . . . : . . : . .
% i I , I , I , I * I : 9 OO W 120o W 60oW GM. 60°E 120°E 160°E
Fig. 5. Location of the - 2°C isotherm (lowest AGCM o'-level) in DJF in the CONTROL (solid line) and ARCTIC (dashed line) runs.

282 T.J. Crowley et al. / Global and Planetary Change 9 (1994) 275-288
for the ARCTIC experiment. Note that we use tem- peratures at the lowest atmosphere general circula- tion model (AGCM) o--level height---about 70 m.
O Ol
o " t ' -
-gO
rO
o
:It
la,
o "1"-
- 9 0
This level was chosen because the experiment was run with prescribed SSTs, and the actual surface temperature in the models is too closely locked to
REDUCED ARCTIC ICE
.................. CONTROL RUN
~o-J
- 7 0 - 5 0 - 3 0 - 1 0 10 30 50 70 90
LATITUDE
REDUCED ARCTIC ICE
................. CONTROL RUN
- 7 0 - 5 0 - 3 0 - 1 0 10 30 50 70 go
LATFrUDE
Fig. 6. Zonal mean land precipitation for CONTROL and ARC'TIC runs for (a) DJF; and (b) JJA.

T.J. Crowley et al, / Global and Planetary Change 9 (1994) 275-288 283
9ooN
°E
7(Y'N
50~N
30°N
IO~N
lO~S
30°$
50oS
70°S
90°ISOQW 120°~ 80°~ Glg, 60°E 120°E 180~E
Fig. 7. Surface pressure (rob) differences (CONTROL-ARCTIC) for (a) JJA; and (b) DJF.
284 7"..I. Crowley et al. / Global and Planetary Change 9 (1994) 275-288
70°N
50°N
3teN
90~N
10~N
10*S
30°S
50°S
70°S
9001%0° W 120~W 80°W GM. 6 0 ° E 12(PE 1 8 0 ° E
I , , ~:~:~i~ili:~iii~i~!!:: ........ iil ~̧ ̧ ~?~ ii:~ ....... :::~:~.~ ......... :~,
~. :~ ~:,, ~:~i ~ii~i~ ~il/~~ ~ ~,,~~
30ON :.: : " ..:... :[
'. .': . :.: 10°N .,=. : :
10oS . :
• . . . • .. : . .. .
30 °S . " .......... ' i: . . . . . . :
_ . . . . : - - - " . , , , , .... ~ : , . .? .... . . . . . . . . . • ...... : . . . . . . . . . . . . . . . . . . . . . . . . . . . . . . . . . . . . . . . . . . . . .
........... 'b, . . . . . . . . jr- • 0°1% ' , , O~ ' , , , , , , 9 O~ w I S O * W 6 W GM. 60~E 120"E I 8 0 * E
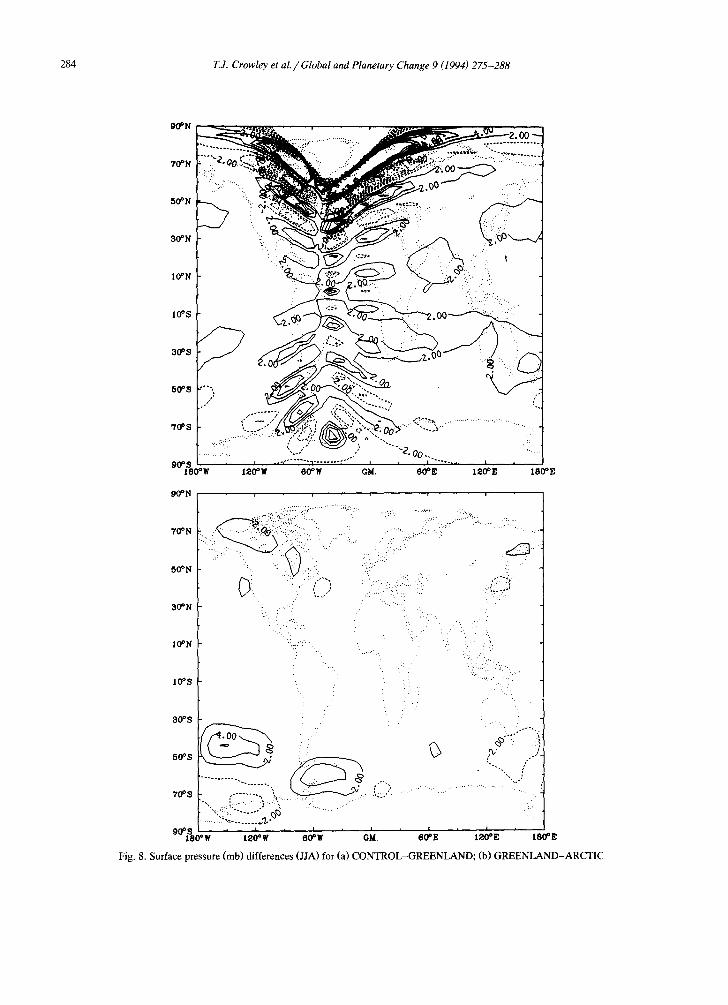
Fig. 8. Surface pressure (mb) differences (JJA) for (a) CONTROL-GREENLAND; (b) GREENLAND-ARCTIC
90°N

T.J. Crowley et al. / Global and Planetary Change 9 (1994) 275-288 285
the fixed SSTs. Examination of temperatures at the lowest height field in the atmospheric model should provide a better indication of how the near-surface atmosphere should respond to altered surface condi- tions.
Although there were large temperature changes in the highest latitudes (Fig. 4), there were only small changes in the actual location of the freezing line (Fig. 5). This result is explicable in terms of length- scale arguments discussed earlier. The result also has implications for explaining why the freezing line changed during past warm time periods. A substan- tial body of evidence suggests that in some cases it has moved at least 10-15 ° of latitude for other warm periods (e.g., Horrell, 1991; Wing and Greenwood, 1993), although we have not been able to determine whether such changes have been determined for the Pliocene. Our results suggest that removal of high- latitude ice cover is not sufficient in and of itself to raise continental interior temperatures. As the effects of any increased SSTs (Dowsett and Poore, 1991) due to heat transport changes would be mainly felt in coastal Europe, our results further suggest that some other factor is responsible for presumed freezing line movements in continental interiors. Two possibilities involve higher atmospheric CO 2 levels (Crowley, 1991) or significant atmospheric circulation changes, possibly triggered by CO 2 increases (Crowley, 1993).
4.2. Precipitation
Fig. 6 illustrates the zonal average precipitation (land) for JJA and DJF for the final three years of the simulation. In the highest northern latitudes, removal of ice cover increases precipitation 30-50%; however the absolute values of the precipitation in- crease are low (1-2 ram/day). Elsewhere zonally averaged precipitation changes are usually signifi- cantly less than 10%.
The far-field precipitation response is of some interest in evaluating causes for past precipitation changes in the tropics. Observations suggest that tropical rainforests were not nearly as extensive in equatorial regions during past warm time periods (e.g., Ziegler et al., 1987; Horrell, 1991), and there are several factors that might explain such changes. Continental positions were different, SSTs might have been different, or changing high-latitude ice
cover might have affected tropical precipitation (Zie- gler et al., 1987). Since we find no significant change in tropical precipitation, some other factor appears responsible for past changes in rainforest area in the tropics.
4.3. Surface pressure changes
A final field we examined were surface pressure differences between the ARCTIC and CONTROL runs. In this respect we found a very peculiar re- sponse in the Atlantic sector, extending nearly from pole-to-pole (Fig. 7). Alternating strips of high-and- low sea level (order 2 -4 mb) vary in a wave like band, with the qualitative features of the field sym- metric about the equator. Plots for individual years (not shown) indicate that the same pattern holds for each winter and summer of the three years analyzed and for sea level pressure. The anomaly is therefore not an artifact of averaging. Plots of 200 mb height anomalies (also not shown) suggest that there is a faint reflection of this pattern at height, thereby indicating a barotropic origin to the perturbation.
As the above circulation anomaly has not previ- ously been reported in the experiments with only sea ice altered, we tried to determine whether the re- sponse we see is a feature of the model or reflects changes in the Greenland Ice Sheet. Fig. 8 illustrates a difference field between ARCTIC and GREEN- LAND runs. It is evident that the removal of Arctic sea ice is not responsible for the changes, and that the effect may be primarily related to removal of the Greenland ice sheet. The response of the model therefore seems to reflect some adjustments to the Greenland topographic barrier in the model. Further indications that the surface pressure changes reflect some type of topographic forcing involve the lining up of the anomalies around the largest topographic change, in the region where the ice sheet itself was removed.
Although the pressure anomaly pattern is related to the Greenland topographic feature, it is not at all clear whether the anomaly represents a real feature of the circulation system or a numerical artifact. One would not expect from theory that wave disturbances move strictly along north-south lines. The anchoring of the southern hemisphere anomaly at the colatitude point of the Greenland Ice Sheet also raises suspi-

286 T.J. Crowley et al. / Global and Planetary Change 9 (1994) 275-288
cions about its numerical origin. To investigate this possibility we examined the spherical harmonic (Legendre) expansion of a 3-km topographic rise centered on Greenland (with an otherwise flat earth) in order to determine its potential effect on the circulation.
The results of the spherical harmonic expansion are illustrated in Fig. 9. There are several features of interest with respect to this figure: (1) the principal north-south axis of the topographic expansion is the same as the axis of the surface pressure anomaly; (2) the wavelength of the expansion is about the same as the wavelength of the surface pressure anomaly (i.e., ~ 10 ° latitude); (3) the amplitude of the expansion is on the order of 50-100 m in the southern hemi- sphere. This amplitude may be large enough to affect the pressure field.
There are also some significant differences be- tween the surface pressure anomaly and the ex-
panded topographic field: (1) maxima in the ex- panded field are about 45 ° off the main axis; a similar pattern is not seen in the surface pressure anomaly field; (2) the orientation of the surface pressure anomaly field "turns over" in the southern hemisphere (i.e., the "wave front" changes from concave up in the northern hemisphere to concave down in the southern hemisphere); (3) the longitude of the southern hemisphere maximum in the topo- graphic expansion is approximately 180 ° out of phase with the maximum in the surface pressure anomaly.
We tentatively interpret the above results as indi- cating that the far-field effects of the Greenland topographic barrier may involve a spurious response due to the influence of the topographic barrier on the spherical harmonic expansion field. However, the pressure effect is not a 1:1 translation of the topo- graphic barrier. We speculate that the differences between the two fields may reflect a subsequent
70°N
~O~N
30°N
IO°N
lO*S
SO*S
eO*S
7 ~ S
gO°ISSO°W 120°W 60°W GM. 60°E 120°E 180°E
Fig. 9. Spherical harmonic (Legendre) expansion (R15) of the effects of a three-km topographic barrier, located over Greenland, placed on an otherwise fiat earth. (Contour intervals are 1, 2, 3 krn and 50 m intervals between - 200 and 200 m.)

T.J. Crowley et aL / Global and Planetary Change 9 (1994) 275-288 287
circulation adjustment to the initial anomaly imposed by the topographic feature alone. This speculation obviously requires future testing.
Even though we cannot fully explain the origin of the far-field surface pressure anomalies, we believe the evidence discussed above provides some support for the conclusion that the effects are probably spuri- ous, in the sense that they have a numerical rather than a physical explanation. Nevertheless, such anomalies will appear in model fields, for both the control climate and paleo simulations. This conclu- sion suggests that some caution is required in inter- preting some of the far-field temperature responses to altered Greenland and Arctic ice cover. For exam- ple, the moderately large temperature anomalies that occur in the southern hemisphere (Fig. 1) may be a direct response to these "numerical teleconnec- tions". Such changes may also require reexamina- tion of far-field responses due to removal of other topographic barriers (e.g., Kutzbach et al., 1989).
5. Discussion and conclusions
Two experiments were conducted, one with only the Greenland Ice Sheet removed, the other with both the Greenland Ice Sheet removed and Arctic sea ice cover reduced. As with earlier studies, we found the response primarily restricted to the high latitudes of the northern hemisphere, being greater in winter than in summer.
New results from this study are: 1. In winter Arctic ice cover has a significantly
greater effect than reduced Greenland ice cover. 2. There was little effect on movement of the
freezing line over North American and Eurasia. 3. Although there were small increases in precipi-
tation in high northern latitudes, changes elsewhere were minimal. The latter result does not support the hypothesis that reductions in Arctic ice cover may have been responsible for reduced areas of tropical rainforest during past warm periods.
4. There is a peculiar adjustment of the surface pressure field when the Greenland Ice Sheet is re- moved, which is manifested in terms of a wavelike front in the Atlantic sector, extending nearly from pole-to-pole and reversing directions as it crosses the equator. The origin of this feature may be a numeri-
cal artifact related to removal of the Greenland Ice Sheet. This result implies that some caution is re- quired in interpreting far-field responses to altered topographic features.
Acknowledgements
This research was supported by NSF grant ATM- 9002808 and ATM-9396320 to TJC. We thank S. Thompson and D. Pollard for access to their model, K. Bowmann, P. Chang, and K.-Y. Kim for discus- sion and assistance, and the reviewers for their com- ments. Computing was done at NCAR; the National Center for Atmospheric Research is supported by the National Science Foundation.
References
Alexander, R.C. and Mobley, R.L., 1976. Monthly average sea- surface temperatures and ice-pack limits on a 1 ° global grid. Mon. Weather Rev., 104: 143-148.
Anthes, R.A., 1977. A cumulus parameterization scheme utilizing a one-dimensional cloud model. Mon. Weather Rev., 105: 270-286.
Bonan, G.B., Pollard, D. and Thompson, S.L., 1992. Effects of boreal forest vegetation on global climate. Nature, 359: 716- 718.
Cronin, T.M., Whatley, R., Wood, A., Tsukagoshi, A., Ikeya, N., Brouwers, E.M. and Briggs Jr., W.M., 1993. Microfaunal evidence for elevated Pliocene temperatures in the Arctic Ocean. Paleoceanography, 8: 161-173.
Crowley, T.J., 1991. Modeling Pliocene warmth. Quat. Sci. Rev., 10: 272-282.
Crowley, T.J., 1993. Geological assessment of the greenhouse effect. Bull. Am. Meteorol. Soc., 74: 2363-2373.
Crowley, T.J., Short, D.A., Mengel, J.G. and North, G.R., 1986. Role of seasonality in the evolution of climate over the last 100 million years. Science, 231: 579-584.
Dickinson, R.E., Henderson-Sellers, A., Kennedy, P.J. and Wil- son, M.F., 1986. Biosphere-atmosphere transfer scheme (BATS) for the NCAR community climate model. NCAR Tech. Note, NCAR/TN-275 + STR, 69 pp.
Dowsett, H.J. and Poore, R.Z., 1991. Pliocene sea surface temper- atures of the North Atlantic Ocean at 3.0 Ma. Quat. Sci. Rev., 10: 189-204.
Gregory, D. and Rowntree, P.R., 1990. A mass flux convection scheme with representation of cloud ensemble characteristics and stability-dependent closure. Mon. Weather Rev., 118: 1483-1506.
Holtslag, A.A.M., De Bruin, E.I.F. and Pan, H.-L., 1990. A high resolution air mass transformation model for short-range weather forecasting. Mort. Weather Rev., 118: 1561-1575.

288 T.J. Crowley et al. / Global and Planetary Change 9 (1994) 275-288
Horrell, M.A., 1991. Phytogeography and paleoclimatic interpreta- tion of the Maestrichtian. Palaeogeogr., Palaeoclimatol,, Palaeoecol., 86: 87-138.
Kutzbach, J.E., Guetter, P.J., Ruddiman, W.F. and Prell, W.L., 1989. Sensitivity of climate to late Cenozoic uplift in southern Asia and the American west: Numerical experiments. J. Geo- phys. Res., 94: 18,393-18,397.
Lautenschlager, M. and Santer, B.D., 1991. Atmospheric response to a hypothetical Tibetan ice sheet. J. Climatol., 4: 386-394.
Manabe, S. and Broccoli, A.J., 1985. The influence of continental ice sheets on the climate of an ice age. J. Geophys. Res., 90: 2167-2190.
North, G.R., 1984. The small ice cap instability in diffusive climate models. J. Atmos. Sci., 41: 3390-3395.
North, G.R., Yip, K.-J., Leung, L.-Y. and Chervin, R.M., 1992. Forced and free variations of the surface temperature field. J. Clim., 5: 227-239.
Pollard, D. and Thompson, S.L, 1994. Use of a land-surface- transfer scheme (LSX) in a global climate model: The re- sponse to doubling stomatal resistance. Global. Planet. Change, in press.
Poore, R.Z., 1993. Editorial. Paleoceanography, 8: 135-136. Rasch, P.J. and Williamson, D.L., 1990. Computational aspects of
moisture transport in global models of the atmosphere. Q. J. R. Meteorol. Soc., 116: 1071-1090.
Raymo, M.E., Rind, D. and Ruddiman, W., 1990. Climatic effects of variable Arctic sea ice in the GISS-II GCM: A possible analogy for the Pliocene. Paleoceanograpby, 5: 367-382.
Raymo, M.E., Hodell, D. and Jansen, E., 1992. Response of deep ocean circulation to initiation of northern hemisphere glacia- tion (3-2 Ma). Paleoceanography, 7: 645-672.
Royer, J.F., Planton, S. and D6qu6, M., 1990. A sensitivity experiment for the removal of Arctic sea ice with the French spectral general circulation model. Climate Dyn., 5: 1-17.
Sellers, P.J., Mintz, Y., Sud, Y.C. and Dalcher, A., 1986. A simple biosphere model (SiB) for use within general circula- tion models. J. Atmos. Sci., 43: 505-531.
Slingo, A. and Slingo, J.M., 1991. Response of the National Center for Atmospheric Research community climate model to improvements in the representation of clouds. J. Geophys. Res., 96: 15,341-15,357.
Thompson, S.L. and Pollard, D., 1994. A global climate model (GENESIS) with a land-surface-transfer scheme (LSX). 1. Present-day climate. J. Clim., in press.
Thompson, S.L., Ramaswamy, V. and Covey, C., 1987. Atmo- spheric effects of nuclear war aerosols in general circulation model simulations: Influence of smoke optical properties. J. Geophys. Res., 92: 10,942-10,960.
Troen, I. and Mahrt, L., 1986. A simple model of the atmospheric boundary layer: Sensitivity to surface evaporation. Boundary Layer Meteorol., 37: 129-148.
Williamson, D.L, 1990. Semi-Langrangian moisture transport in the NMC spectral model. Tellus, 42(A): 413-428.
Williamson, D.L. and Rasch, P.J., 1989. Two-dimensional semi- Lagrangian transport with shape-preserving interpolation. Mon. Weather Rev., 117: 102-129.
Williamson, D.L., Kiehl, J.T., Ramanathan, V., Dickinson, R.E. and Hack, J.J., 1987. Description of NCAR community cli- mate model (CCM1). NCAR Tech. Note, NCAR/TN-285 + STR, 112 pp.
Wing, S.L. and Greenwood, D.R., 1993. Fossils and fossil cli- mate: the case for equable continental interiors in the Eocene. Philos. Trans. R. Soc. London, 341: 243-252.
Ziegler, A.M., Raymond, A.L, Gierlowski, T.C., Horrell, M.A., Rowley, D.B. and Lottes, A.L., 1987. Coal, climate and terrestrial productivity: The present and early Cretaceous com- pared. In: A.C. Scott (Editor), Coal and Coal-Bearing Strata: Recent Advances. Geol. Soc. London Spec. Publ., 32: 25-49.