Embed Size (px)
Citation preview

EFCOG Best Practice #154
Best Practice Title: Solar Powered Radioactive Air Environmental Monitoring
Facility: Pacific Northwest National Laboratory (PNNL)
Points of Contact: J. Matthew Barnett (Radioactive Air Task Lead),
(509) 371-7774, [email protected]
Lynn E. Bisping (Scientist), (509) 371-7121, [email protected]
Todd L. Gervais (Environmental Protection Engineer), (509) 371-7767, [email protected]
Brief Description of Best Practice: Environmental monitoring of ambient air for radioactive material is required as stipulated in the site radioactive air license requirements
for PNNL. In 2010, a Data Quality Objectives supporting radiological air emissions from the PNNL Site identified preferred ambient air sampling locations; however, utilities were not
readily available at two locations on the site boundary. Therefore, solar powered environmental monitoring systems were considered as a possible option. PNNL purchased
two 24-V DC solar powered environmental monitoring systems which consisted of solar panels, battery banks, and sampling units. During an approximate four month performance
evaluation period, the solar stations operated satisfactorily at an on-site test location. They
were subsequently relocated to their preferred locations in June 2012 where they continue to function adequately under the conditions found in Richland, Washington.
The activity is in line with EFCOG Core Function 4: Perform Work Within Controls,
Principle 7: Operations Authorization
Why the Best Practice Was Used: In 2010, the preferred ambient air sampling at two of
the three identified locations were unavailable due to utility constraints. Therefore, two AC powered units (typically consisting of a small housed station containing an air volume
totalizer, flow controller, and a vacuum pump) were set up at nearby AC powered locations
until sampling at the preferred locations could commence. Because AC power was not readily available at the new locations, initial proposals involved trenching and laying power
lines to supply the needed electrical services. This option proved cost prohibitive as well as difficult since it involved the disturbance of biological/culturally sensitive land. The solar
powered option was evaluated as an effective alternative to AC powered systems based on available data including sun charts and weather patterns.
What are the Benefits of the Best Practice: The benefits of using the solar powered
option include its cost effectiveness compared to installing utilities, simplicity of deployment,
minimal environmental impact, and utilization of green technology. Each system cost roughly $30,000.
What Problems/Issues were Associated with the Best Practice: The solar powered
system has more components and electronics resulting in a greater opportunity for failure, and they require periodic maintenance and annual calibration. Solar influence and local
climate conditions can impact sampling. In particular, winter months result in a gradual loss of battery charge indicating a need for supplemental power or battery charging as
necessary. Other limitations include a small motor/fan unit which pulls air through the
sample filter, while smoke and dust can load the filter to the point that ambient air cannot be sampled at the established sample rate of 1.6 cfm over a two-week sample period.

EFCOG Best Practice #154
How the Success of the Best Practice was measured: During a four month test from February 2012 through June 2012, information was collected daily to determine system
performance and reliability. At the end of the test period, the solar powered systems were accepted for use and subsequently installed at the preferred sample monitor locations.
Operation over the past 18 months has shown these instruments to be as reliable as AC powered systems with operations exceeding 85% availability.
Description of Process Experience Using the Best Practice: See attached slide
presentation and technical report PNNL-22900.
September 26, 2012 1
Implementation of Solar Powered
Environmental Monitoring Stations
J. MATTHEW BARNETT & TODD L. GERVAIS
Effluent Management
Pacific Northwest National Laboratory
PNNL-SA-90725
EFCOG Best Practice #154
Attachment 1
September 26, 2012 2
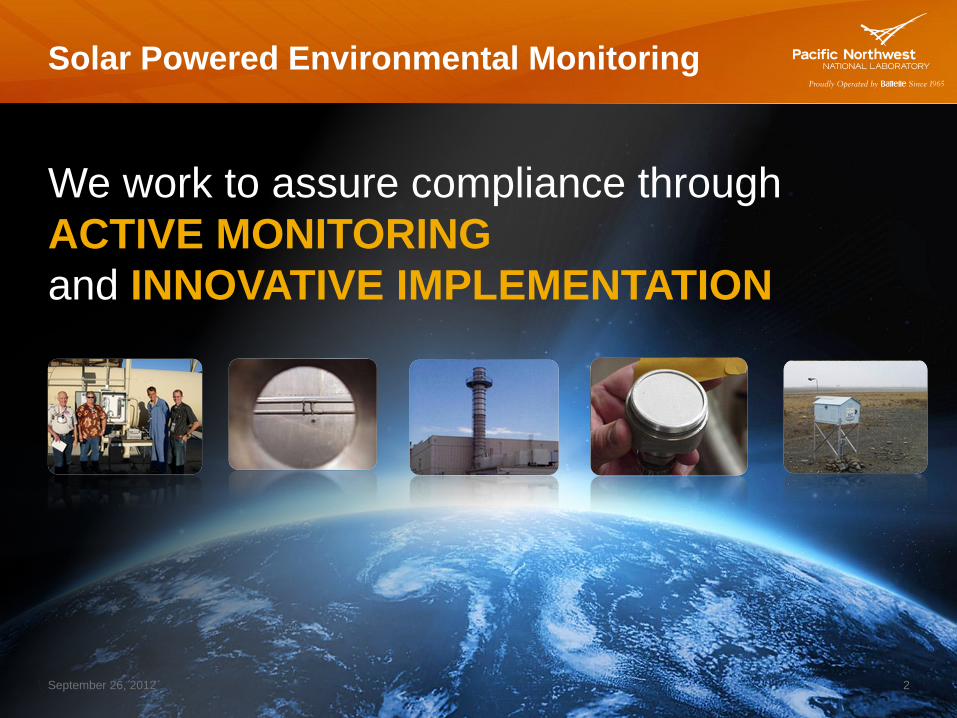
Solar Powered Environmental Monitoring
We work to assure compliance through
ACTIVE MONITORING
and INNOVATIVE IMPLEMENTATION

Introduction
Environmental monitoring of ambient air for
radioactive material is required as stipulated in our
site license
Using the DQO process, monitoring station
locations were identified
Monitoring at the site boundary was preferred;
however, utilities were not readily available
September 26, 2012 3
Solar powered environmental
monitoring stations were considered as
a possible option over installing utilities
Solar stations have been nominally
tested, installed at preferred locations,
and operational since June 2012

Site Description
The PNNL Site is located just
north of Richland, WA
It occupies less than one square
mile of land
Semi-arid desert situated at
approximately 50 degrees N
longitude
Offsite emissions are low
at < 2E-05 mrem for CY 2011
September 26, 2012 4
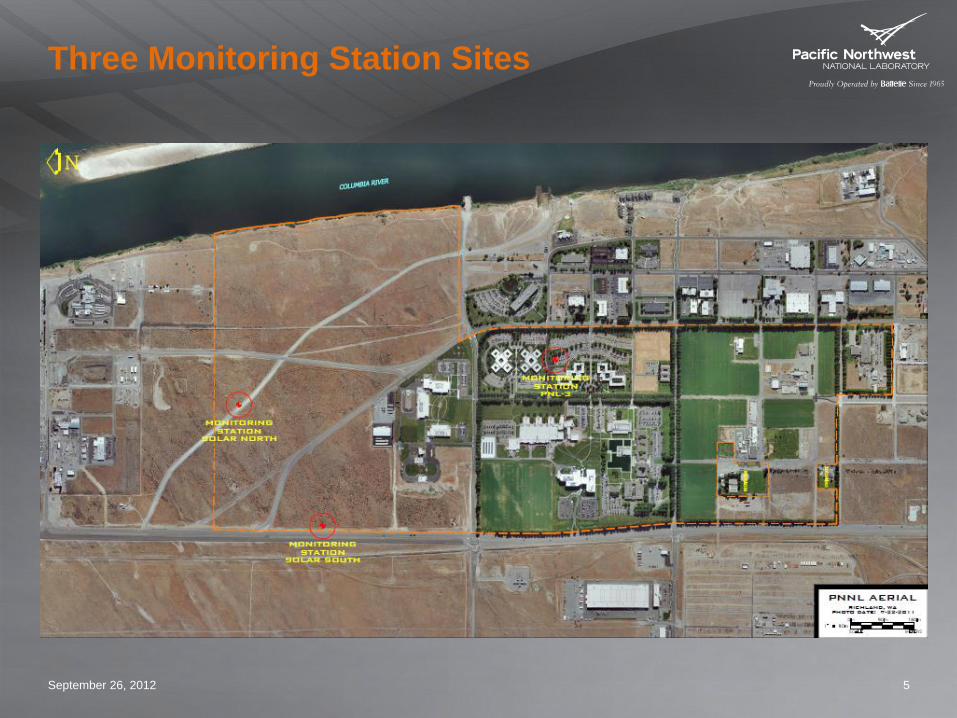
Three Monitoring Station Sites
September 26, 2012 5

Methods and Equipment
Two 24-V DC solar powered
stations were evaluated
One had a 2” sample filter
arrangement while the other had
a 4” filter
Field tested for ~4 months
Sample filter collected every 2
weeks followed by gross alpha
and beta analysis of the 2” filter
with the 4” filter held
Flow rate initially set at 1.5 cfm;
subsequently set at 1.6 cfm
September 26, 2012 6
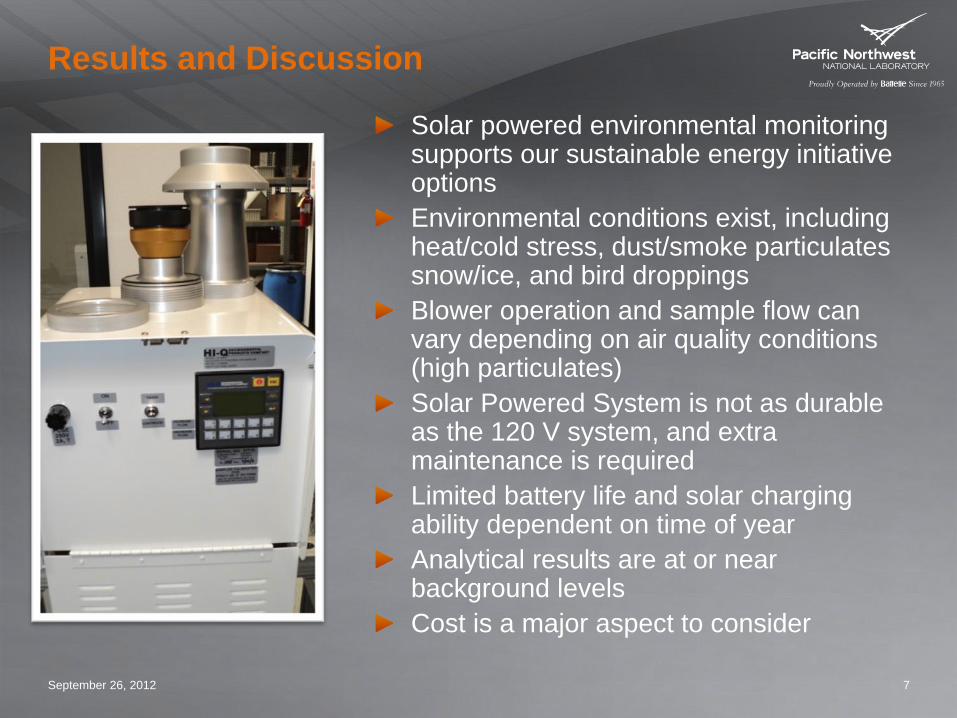
Results and Discussion
Solar powered environmental monitoring supports our sustainable energy initiative options
Environmental conditions exist, including heat/cold stress, dust/smoke particulates snow/ice, and bird droppings
Blower operation and sample flow can vary depending on air quality conditions (high particulates)
Solar Powered System is not as durable as the 120 V system, and extra maintenance is required
Limited battery life and solar charging ability dependent on time of year
Analytical results are at or near background levels
Cost is a major aspect to consider
September 26, 2012 7
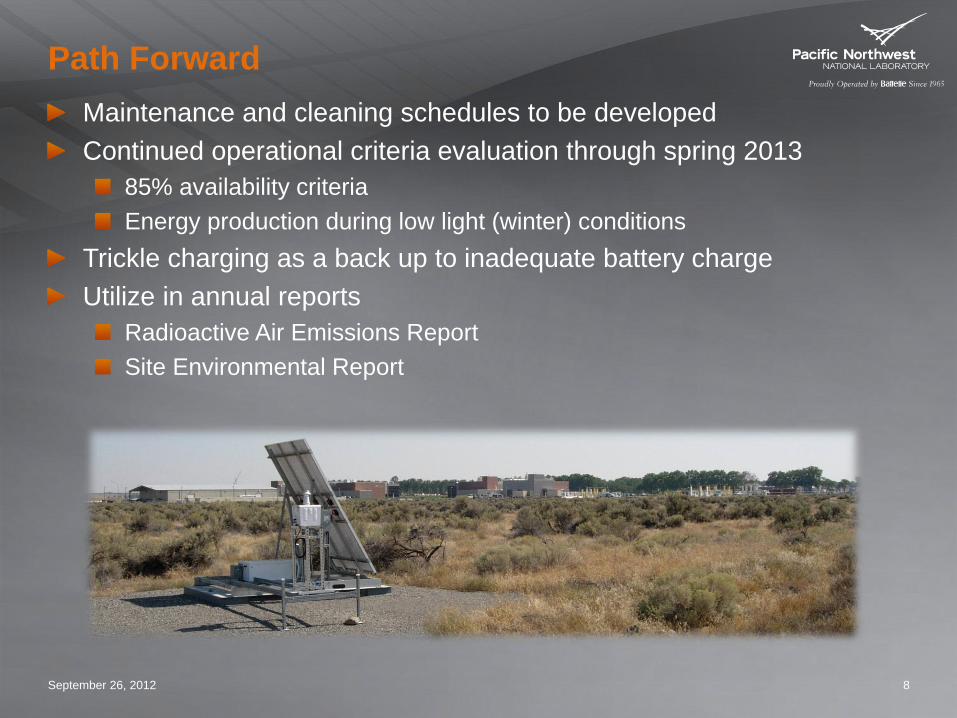
Path Forward
Maintenance and cleaning schedules to be developed
Continued operational criteria evaluation through spring 2013
85% availability criteria
Energy production during low light (winter) conditions
Trickle charging as a back up to inadequate battery charge
Utilize in annual reports
Radioactive Air Emissions Report
Site Environmental Report
September 26, 2012 8

September 26, 2012 9
QUESTIONS ???
PNNL-22900
Prepared for the U.S. Department of Energy under Contract DE-AC05-76RL01830
EFCOG Best Practice #154 Attachment 2
Solar Powered Radioactive Air Monitoring Stations JM Barnett TL Gervais LE Bisping October 2013
PNNL-22900
Solar Powered Radioactive Air Monitoring Stations
JM Barnett TL Gervais
LE Bisping
October 2013
Prepared for
the U.S. Department of Energy
under Contract DE-AC05-76RL01830
Pacific Northwest National Laboratory
Richland, Washington 99352

iii
Summary
Environmental monitoring of ambient air for radioactive material is required as stipulated in the PNNL
Site radioactive air license. Sampling ambient air at identified preferred locations could not be initially
accomplished because utilities were not readily available. Therefore, solar powered environmental
monitoring systems were considered as a possible option. PNNL purchased two 24-V DC solar powered
environmental monitoring systems which consisted of solar panels, battery banks, and sampling units.
During an approximate four month performance evaluation period, the solar stations operated
satisfactorily at an on-site test location. They were subsequently relocated to their preferred locations in
June 2012 where they continue to function adequately under the conditions found in Richland,
Washington.


v
Acronyms and Abbreviations
cfm cubic feet per minute
ft3 cubic feet
in inch(es)
m3 cubic meters
mm millimeter(s)
PLC programmable logic controller
PNNL Pacific Northwest National Laboratory
RAEL Radioactive Air Emissions License
RPT Radiation Protection Technologist

vii
Contents
Summary ........................................................................................................................................... iii
Acronyms and Abbreviations ............................................................................................................. v
1.0 Introduction ............................................................................................................................. 1.1
2.0 Test Description ....................................................................................................................... 2.1
3.0 Test Methods and Equipment .................................................................................................. 3.1
4.0 Test Results ............................................................................................................................. 4.1
5.0 Conclusions and Recommendations ........................................................................................ 5.1
Appendix A Daily Monitoring Checklist Data ............................................................................... A.1
Appendix B GEL Laboratories Analytical Results for 2-in Sample Filters .................................... B.1
Appendix C Daily Monitoring Checklist Sample Form ................................................................. C.1
Figures
Figure 2.1. 24-V Monitoring Station ............................................................................................... 2.1
Figure 2.2. AC Monitoring Station (TEST-A) ................................................................................. 2.2
Figure 2.3. Battelle Pacific Northwest Ball Field and Test Area ..................................................... 2.2
Figure 2.4. Permanent Locations for the Solar Monitoring Stations ............................................... 2.3
Figure 3.1. Solar Environmental Monitoring System with 2-in Sample Holder Exposed ............... 3.1
Figure 4.1. Results of Gross Alpha Analysis of Particulate Air Samples ........................................ 4.2
Figure 4.2. Results of Gross Beta Analysis of Particulate Air Samples .......................................... 4.3
Table
Table 2.1. Test System Configurations ............................................................................................ 2.1

1.1
1.0 Introduction
Pacific Northwest National Laboratory (PNNL) currently owns and operates four ambient radioactive air
environmental monitoring stations, two of which are solar powered. These stations are operated to comply
with the PNNL Site Radioactive Air Emissions License-05 (RAEL-05), which requires the monitoring of
ambient air concentrations to confirm low emissions of radionuclides in air. In 2010, a Data Quality
Objectives report1 that supported radiological air emissions from the PNNL Site located in Richland, WA
identified preferred ambient air sampling locations; however, utilities were not readily available at two
locations on the site boundary. Therefore, solar powered environmental monitoring systems were
considered as a possible option. PNNL purchased two 24-V DC solar powered environmental monitoring
stations which consisted of solar panels, battery banks, and sampling units. During an approximate 4-
month performance evaluation period, the solar stations operated satisfactorily at an on-site test location.
The stations were subsequently relocated to their preferred locations in June 2012, where they continue to
function normally.
1 Barnett, JM, KM Meier, SF Snyder, BG Fritz, TM Poston, and K Rhoads. 2010. “Data Quality Objectives
Supporting Radiological Air Emissions Monitoring for the PNNL Site,” PNNL-19427. Pacific Northwest National
Laboratory, Richland, Washington.

2.1
2.0 Test Description
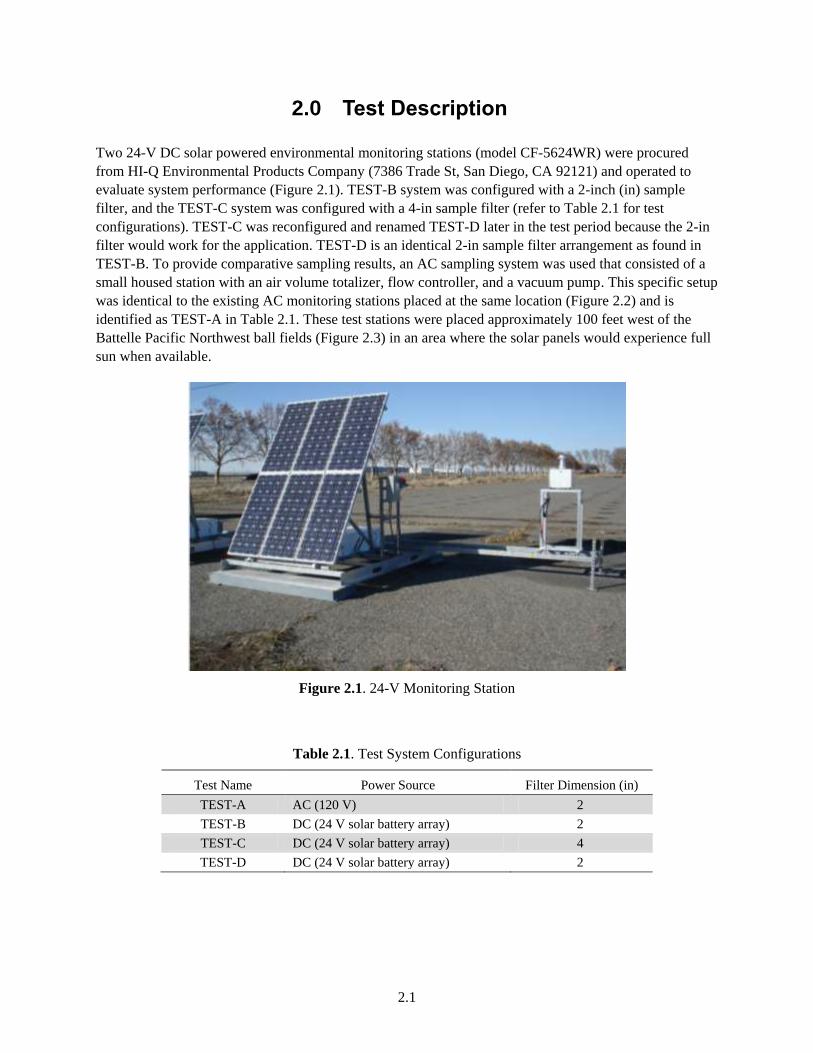
Two 24-V DC solar powered environmental monitoring stations (model CF-5624WR) were procured
from HI-Q Environmental Products Company (7386 Trade St, San Diego, CA 92121) and operated to
evaluate system performance (Figure 2.1). TEST-B system was configured with a 2-inch (in) sample
filter, and the TEST-C system was configured with a 4-in sample filter (refer to Table 2.1 for test
configurations). TEST-C was reconfigured and renamed TEST-D later in the test period because the 2-in
filter would work for the application. TEST-D is an identical 2-in sample filter arrangement as found in
TEST-B. To provide comparative sampling results, an AC sampling system was used that consisted of a
small housed station with an air volume totalizer, flow controller, and a vacuum pump. This specific setup
was identical to the existing AC monitoring stations placed at the same location (Figure 2.2) and is
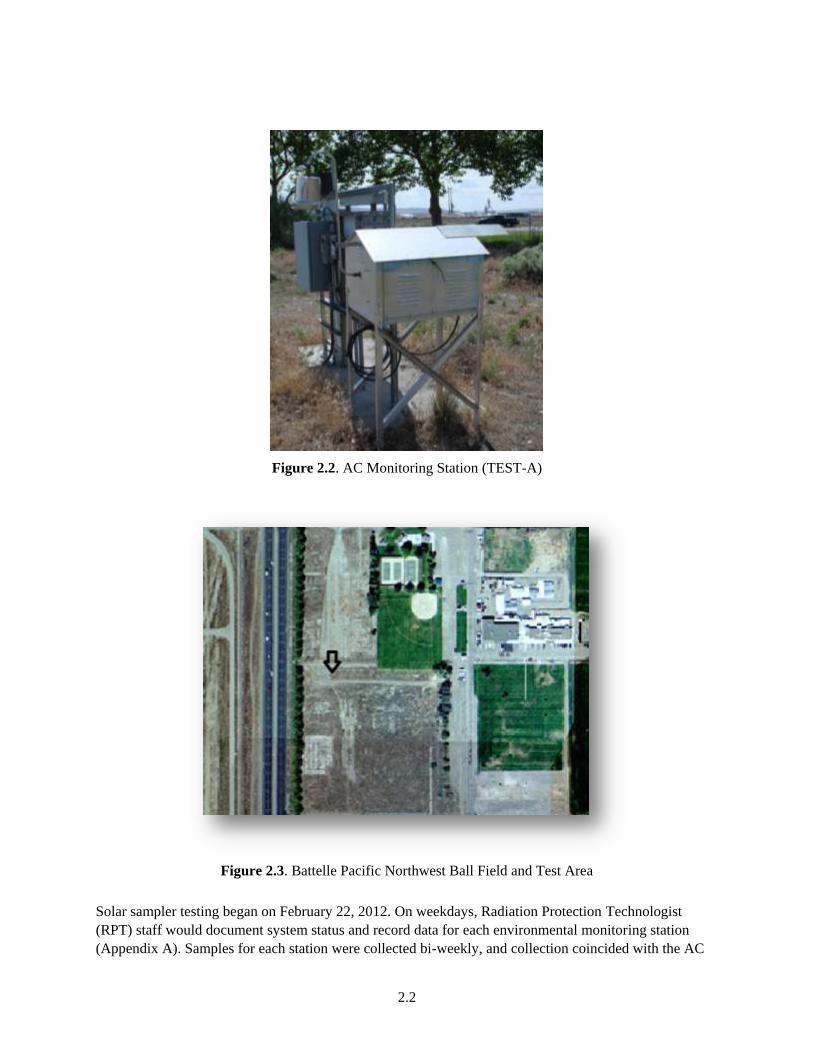
identified as TEST-A in Table 2.1. These test stations were placed approximately 100 feet west of the
Battelle Pacific Northwest ball fields (Figure 2.3) in an area where the solar panels would experience full
sun when available.
Figure 2.1. 24-V Monitoring Station
Table 2.1. Test System Configurations
Test Name Power Source Filter Dimension (in)
TEST-A AC (120 V) 2
TEST-B DC (24 V solar battery array) 2
TEST-C DC (24 V solar battery array) 4
TEST-D DC (24 V solar battery array) 2
2.2
Figure 2.2. AC Monitoring Station (TEST-A)
Figure 2.3. Battelle Pacific Northwest Ball Field and Test Area
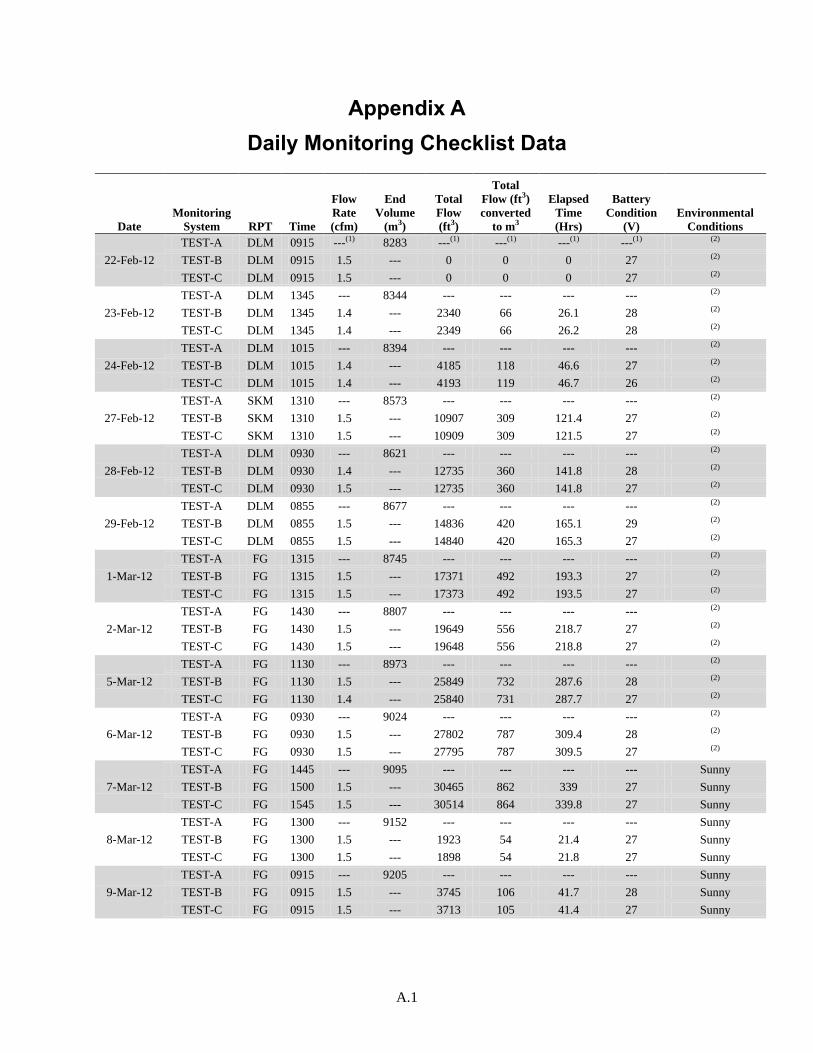
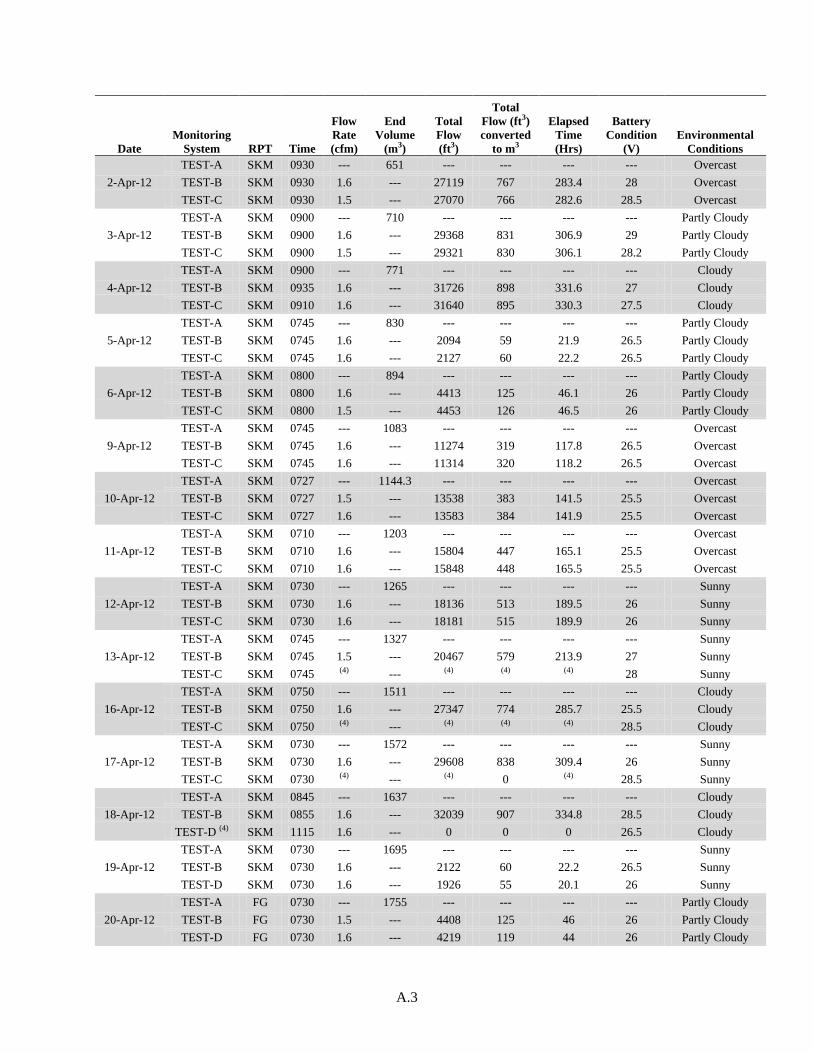
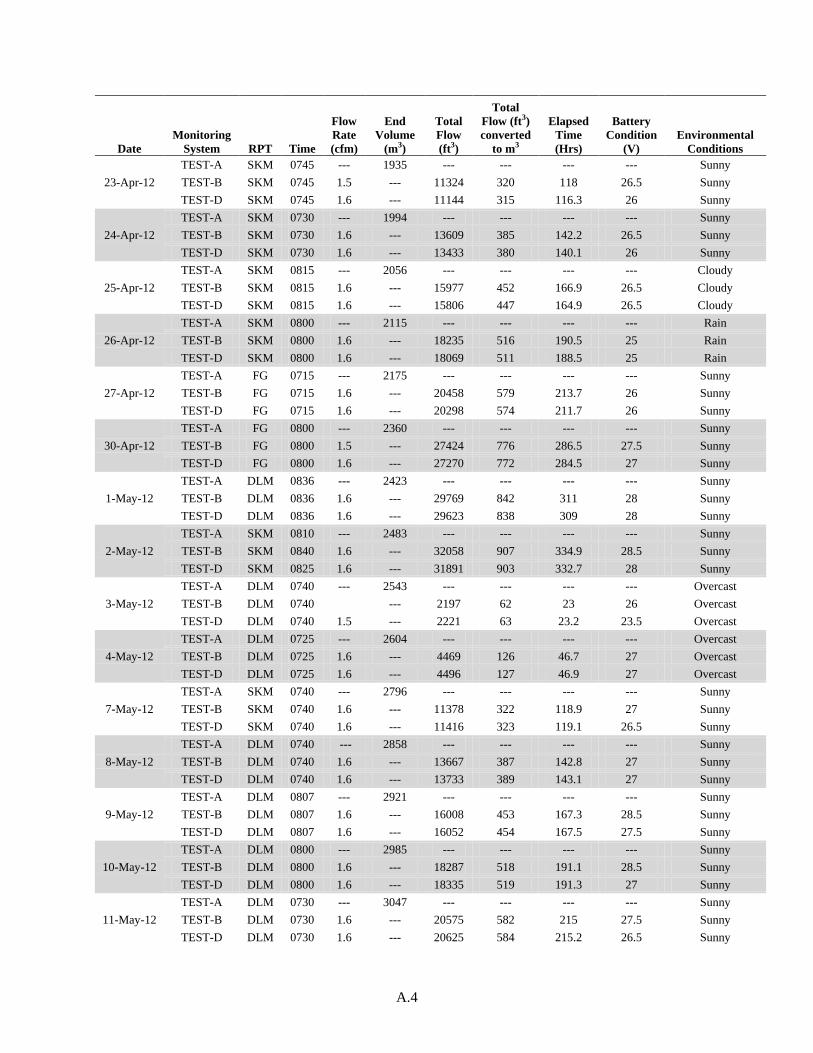
Solar sampler testing began on February 22, 2012. On weekdays, Radiation Protection Technologist
(RPT) staff would document system status and record data for each environmental monitoring station
(Appendix A). Samples for each station were collected bi-weekly, and collection coincided with the AC
2.3
monitoring stations. The 2-in sample filters collected from TEST-A, TEST-B, and TEST-D were
submitted for analyses; however, the 4-in filters collected from TEST-C were archived and not analyzed
because the filter size is larger than the standard 2 in detector size. The objectives of the testing were to
determine if the sampler was able to maintain a nominal sample flow of 1.5 cubic feet per minute (cfm),
to demonstrate if the environmental monitoring system would work under all weather conditions, to
determine if the power supplied by the solar panels would be adequate, and to determine if the analytical
results would be equivalent to the AC powered systems.
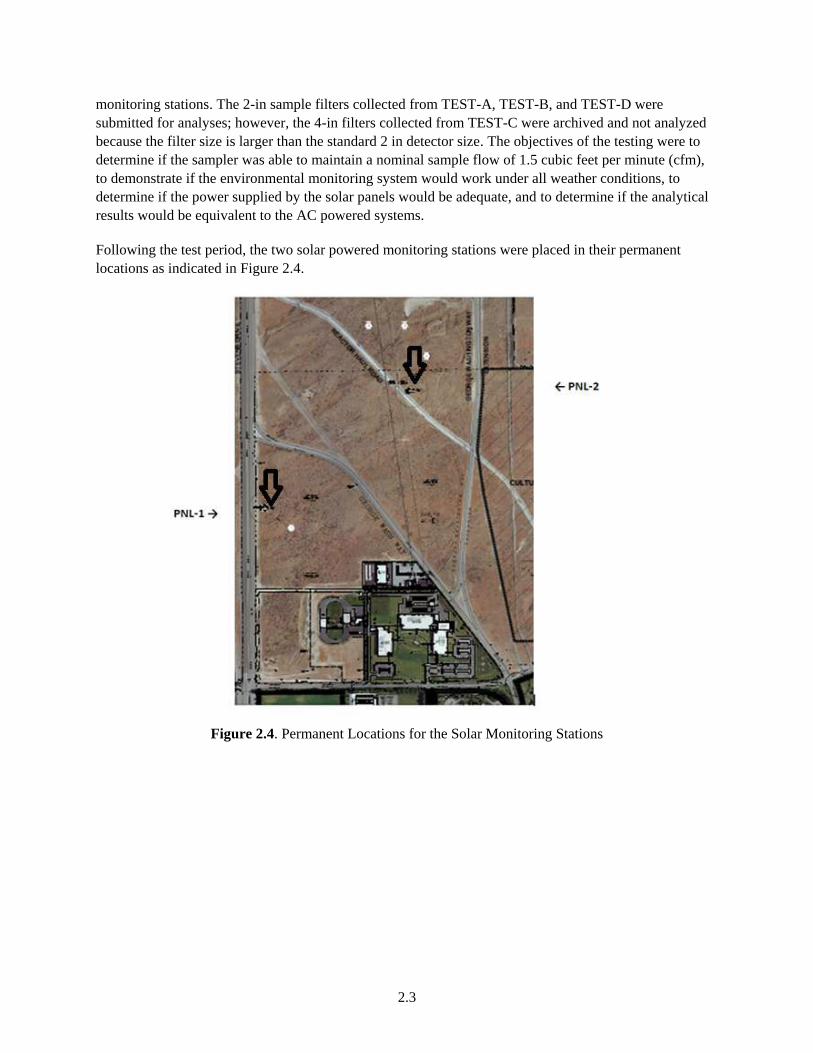
Following the test period, the two solar powered monitoring stations were placed in their permanent
locations as indicated in Figure 2.4.
Figure 2.4. Permanent Locations for the Solar Monitoring Stations

3.1
3.0 Test Methods and Equipment
The main components of the tested 24-V DC sampling systems included the sampling unit (CF-5624D
brushless, automatic flow control, DC-powered, low-volume air sampler), solar panels, and battery banks.
If any of these components were inadequate or failed, the system as a whole would not collect the sample
as required. The two sample systems tested (referred to as TEST-B and TEST-C) were set up west of the
ball fields. TEST-B was set up with the 2-in filter head, and TEST-C was outfitted with the 4-in filter
head. Though the 2-in is the standard filter size used for sampling systems, the 4-in filter head was
evaluated as an alternative sample method in the event that the 2-in filter could not pull the requisite
volume during the 2-week sample period. Midway into the test it was apparent that the 2-in filter could
be used and the second solar array was reconfigured as TEST-D with a 2-in filter head.
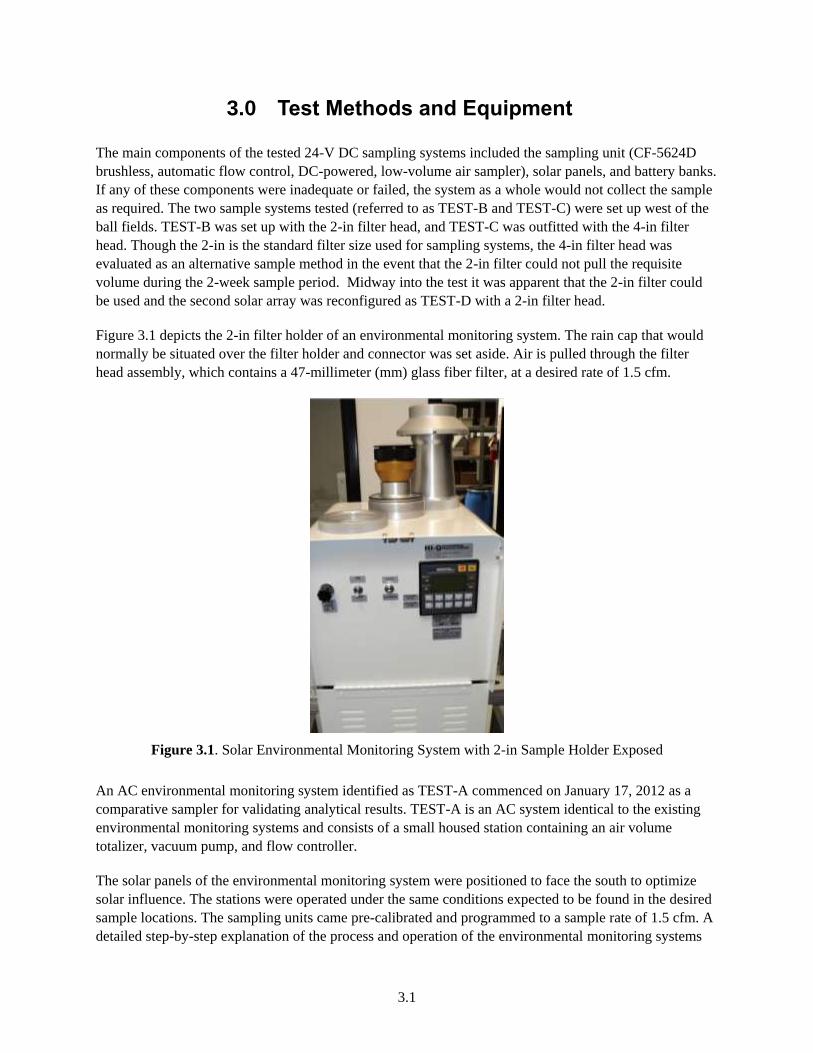
Figure 3.1 depicts the 2-in filter holder of an environmental monitoring system. The rain cap that would
normally be situated over the filter holder and connector was set aside. Air is pulled through the filter
head assembly, which contains a 47-millimeter (mm) glass fiber filter, at a desired rate of 1.5 cfm.
Figure 3.1. Solar Environmental Monitoring System with 2-in Sample Holder Exposed
An AC environmental monitoring system identified as TEST-A commenced on January 17, 2012 as a
comparative sampler for validating analytical results. TEST-A is an AC system identical to the existing
environmental monitoring systems and consists of a small housed station containing an air volume
totalizer, vacuum pump, and flow controller.
The solar panels of the environmental monitoring system were positioned to face the south to optimize
solar influence. The stations were operated under the same conditions expected to be found in the desired
sample locations. The sampling units came pre-calibrated and programmed to a sample rate of 1.5 cfm. A
detailed step-by-step explanation of the process and operation of the environmental monitoring systems

3.2
can be found in the test plan Evaluation and Operation of 24 V DC Powered Environmental Monitoring
Stations (EMPT-AIR-001). The solar environmental monitoring system testing began on February 22,
2012. The RPT collected the following data on scheduled workdays (Appendix A):
date
time
flow rate
total flow
elapsed time
battery condition
environmental conditions.
Issues with monitoring system performance were addressed as soon as practical after the problem was
discovered/identified. Sample filter collection was performed bi-weekly. The 2-in sample filters were sent
to GEL Laboratories for gross alpha/gross beta analyses. GEL retained the filters for radioisotope specific
composite analyses. The 4-in TEST-C filters were not analyzed, but were all archived locally for possible
later analyses.
The Test Plan outlined the basic qualification criteria pertaining to the HI-Q system. The specifications
necessary for the solar powered environmental monitoring systems to qualify as appropriate for sampling
are described in section 4.0.
The AC monitoring system (TEST-A) was operated and sampled using procedure Air Particulate
Sampling and Routine Maintenance of Environmental Monitoring Stations for the PNNL Site (EPRP-
AIR-029). Sample information from both the DC and AC systems is included with current sampling
documentation collected by RPT staff.
4.1
4.0 Test Results
The solar powered environmental monitoring systems were tested over an approximate 4-month period
(February 22, 2012 through June 27, 2012), during which time the environmental conditions were also
evaluated. Appendix A provides data collected by RPT staff over the test period and information about
the operational feasibility of system usage. Data evaluation was useful in optimizing the system and
verifying operational qualification. A detailed discussion about each specification is included in the
discussion below.
Specification 1: Sample Flow – Maintain flow through the sample head at 1.5 cfm without variation
throughout each 2-week sample period due to diurnal changes or other environmental conditions.
Maintaining a sample flow of 1.5 cfm is important because at this flow rate, the sample volume meets the
minimum detection and sample requirements. If the 1.5-cfm flow cannot be sustained, then the required
volume of sample required may not be attained resulting in a “no-sample.” Information received from
daily flow checks showed that instantaneous flow rates fluctuated between 1.4 and 1.5 cfm. The control
unit of the system constantly monitors the flow rate and adjusts the sample rate as necessary to maintain
the pre-set flow rate of 1.5 cfm, and the system is designed not to exceed the pre-set flow rate value.
Sample flow rate averages over the observed 2-week operating periods ranged from 1.489 to 1.497 cfm
for the sample periods in which the unit was pre-set to 1.5 cfm. On March 22, 2012, the pre-set flow rate
value increased to 1.6 cfm; for this setting, the flow rate averages over the 2-week operating period were
between 1.594 and 1.597 cfm.
Specification 2: Blower Operation – The blower on the environmental monitoring system must operate
under both hot and cold weather extremes. The blower must have the capacity to continue sampling at
1.5 cfm even if the filter contains an accumulation of dust or ice particles.
Sample collection depends on the ability of the air sampler to operate in adverse weather conditions. Over
the time period evaluated (February 22, 2012 through June 27, 2012), the following environmental
conditions existed: low-light conditions, temperatures below 32°F and greater than 90°F, overcast
conditions, rain, and dust. The environmental conditions experienced did not adversely affect the
environmental monitoring systems. Once it was apparent that the 2-in filter system operated normally
(e.g., it did not experience sample failure or excessive particulate buildup during the 2-week sample
period) the 4-in filter system (TEST-C) was replaced with a 2-in filter system and renamed TEST-D.
Blower/sample unit failure did occur for reasons other than environmental conditions. Both conditions
involved equipment failure. TEST-B had a system malfunction which involved a power disruption during
low light conditions. On May 18, 2012 and June 4, 2012, the environmental monitoring system shut down
due to the lack of power. Troubleshooting showed the power controller inside the battery box overheated
causing the controller to operate unpredictably. Corrective action included ordering additional power
controllers and replacing the failed power controller.
TEST-C ceased operation on March 21, 2012 and again on April 13, 2012. Both instances involved
problems with the programmable logic controller (PLC) on the system. The first time the blower stopped,
the issue was resolved by shutting down and re-booting the system. The second time the blower went
down, the system would not re-boot, so the unit was returned to the vendor for service. TEST-C operated

4.2
normally with the new blower installed. Despite these malfunctions, the system passed the specification
because the sample flow rate could be maintained.
Specification 3: Solar Panel Charging Ability and Battery Life – The charging system and battery
capacity must be adequate to run the monitoring system as desired for extended periods of low daylight
conditions, as overcast and foggy conditions may extend for multiple weeks at a time during the winter.
Low-light conditions experienced during winter months and during heavy overcast weather impacts the
ability of the solar powered system to charge the battery array and maintain a steady power source to the
environmental monitoring system. To obtain an accurate battery charge reading, RPTs made daily checks
before 8:00 am when possible. During the test period, the battery arrays remained charged and functional.
The environmental monitoring system ceases operation when the battery array charge drops below 20 V.
Overall, the solar charging ability and battery capacity were adequate under the environmental conditions
experienced during the test period; 23 V was the lowest battery charge reading
Specification 4: Uniform Analytical Results – Collect analytical samples from the HI-Q systems
equivalent to the AC powered systems.
The 2-in particulate sample filters for TEST-A, TEST-B, and TEST-D (TEST-D was started April 18,
2012) were sent off for gross alpha and gross beta analysis after each 2-week sample period. The 2-in
sample filters were analyzed at GEL Laboratories (2040 Savage Rd, Charleston, SC 29407) for non-
destructive gross alpha and gross beta analysis. Comparative plots of the gross alpha and gross beta
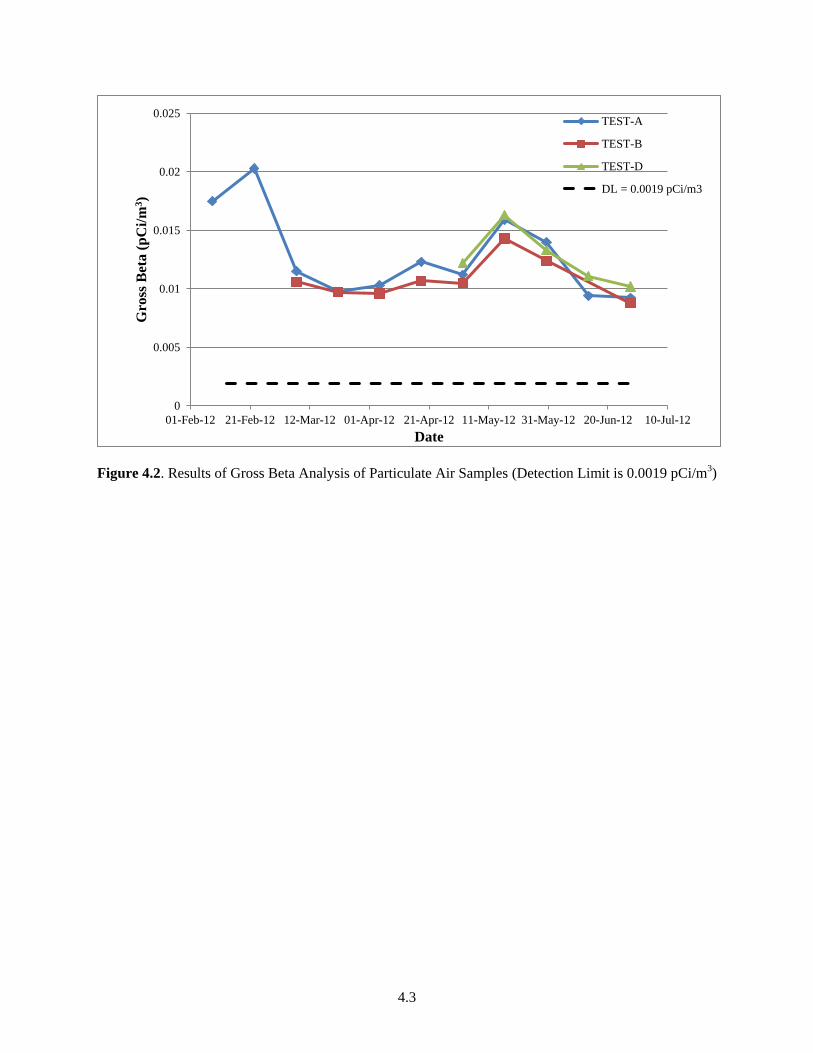
analytical results are shown in Figure 4.1 and Figure 4.2 and show a relative degree of similarity. The
samples were held and analytical composites for select nuclides were made at the end of June 2012. Data
composite results are also similar in that results were below detection limits for most radionuclides for all
systems and the few results above detection limits had similar values for all systems (see Appendix B).
Figure 4.1. Results of Gross Alpha Analysis of Particulate Air Samples (Detection Limit
is 0.0010 pCi/m3)
0
0.0003
0.0006
0.0009
0.0012
0.0015
01-Feb-12 21-Feb-12 12-Mar-12 01-Apr-12 21-Apr-12 11-May-12 31-May-12 20-Jun-12 10-Jul-12
Gro
ss A
lph
a (
pC
i/m
3)
Date
TEST-A
TEST-B
TEST-D
DL = 0.0010 pCi/m3
4.3
Figure 4.2. Results of Gross Beta Analysis of Particulate Air Samples (Detection Limit is 0.0019 pCi/m3)
0
0.005
0.01
0.015
0.02
0.025
01-Feb-12 21-Feb-12 12-Mar-12 01-Apr-12 21-Apr-12 11-May-12 31-May-12 20-Jun-12 10-Jul-12
Gro
ss B
eta (
pC
i/m
3)
Date
TEST-A
TEST-B
TEST-D
DL = 0.0019 pCi/m3


5.1
5.0 Conclusions and Recommendations
For the evaluation period, the solar powered monitoring stations meet the established qualification
criteria. Results show the solar powered system is a feasible alternative to current AC sampling systems.
Sample flows were maintained, and the required air volume sampled was met for each 2-week sample
period. The blower operation manages the environmental conditions experienced; however, the solar
environmental monitoring stations are more susceptible to failure from the many different components,
program software, and electrical connections. Replacement components should be available to maintain
the 85% or greater operability factor. The charging ability of the solar panels and battery capacity appear
to be sufficient for the power usage required at the 1.6 cfm sample rate. Finally, the test samples analyzed
for gross alpha/gross beta indicate similar results.
Based on the tests performed and observations made, the solar powered monitoring stations were
deployed to their permanent locations in June 2012 as a viable environmental monitoring method to
comply with the PNNL Site RAEL-05.


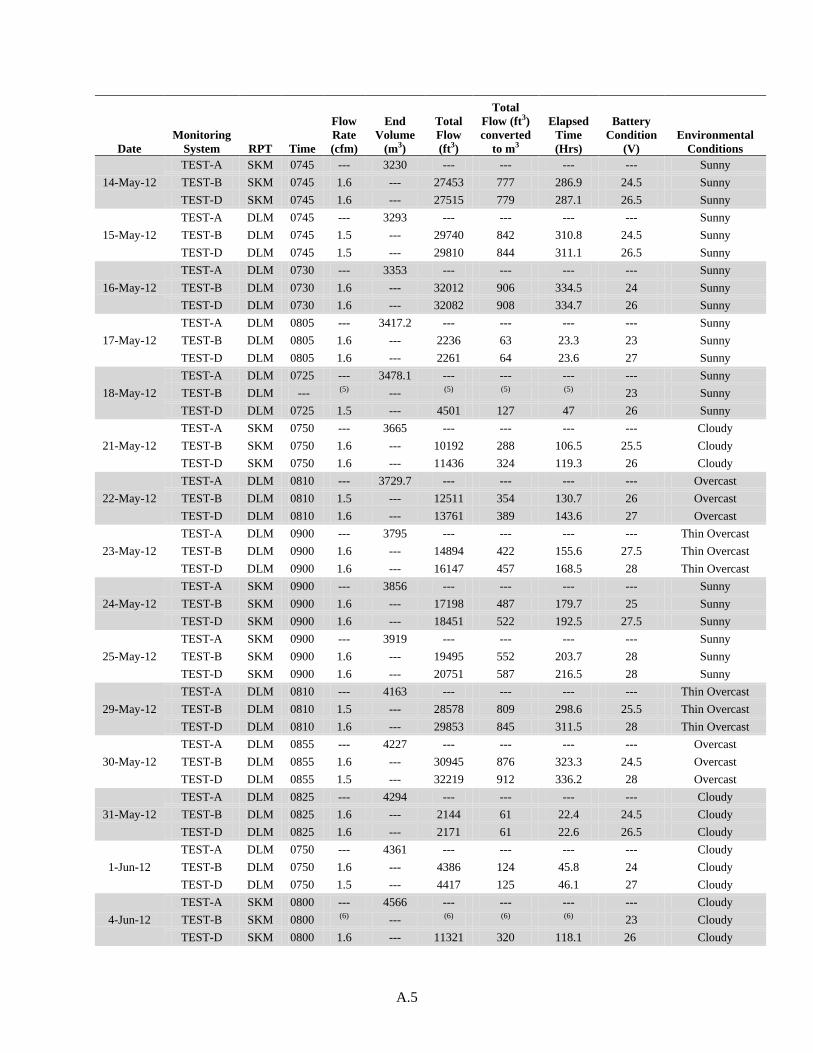
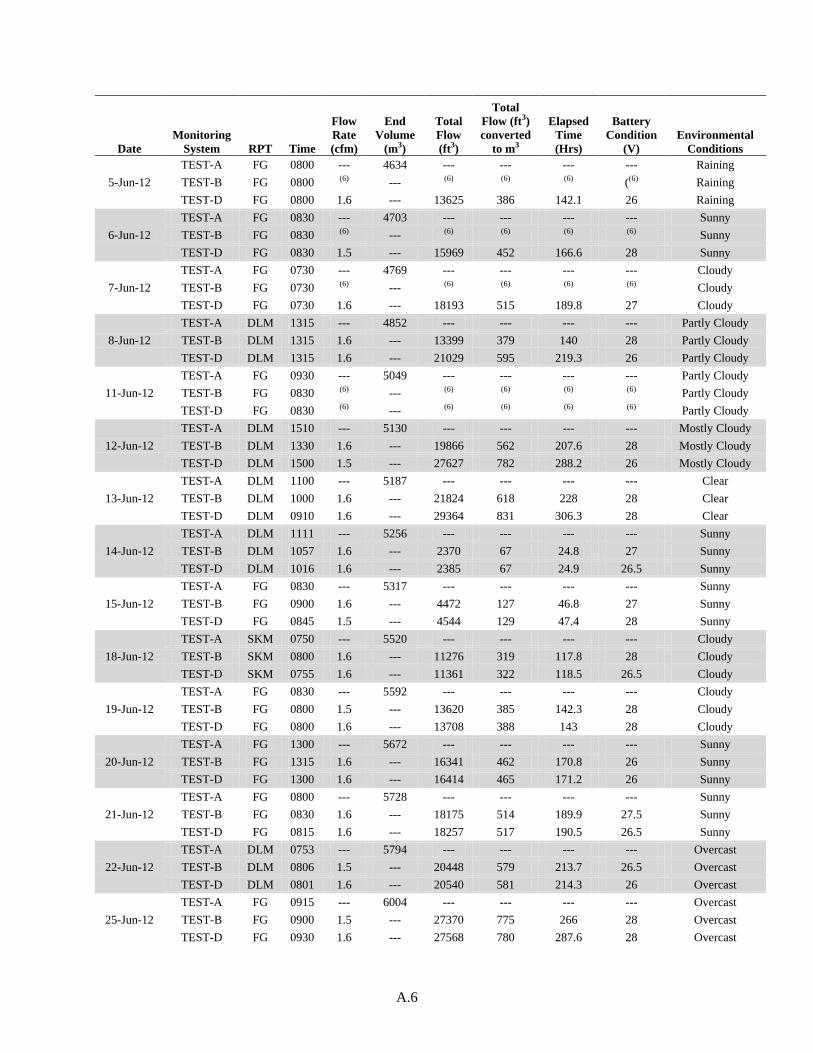
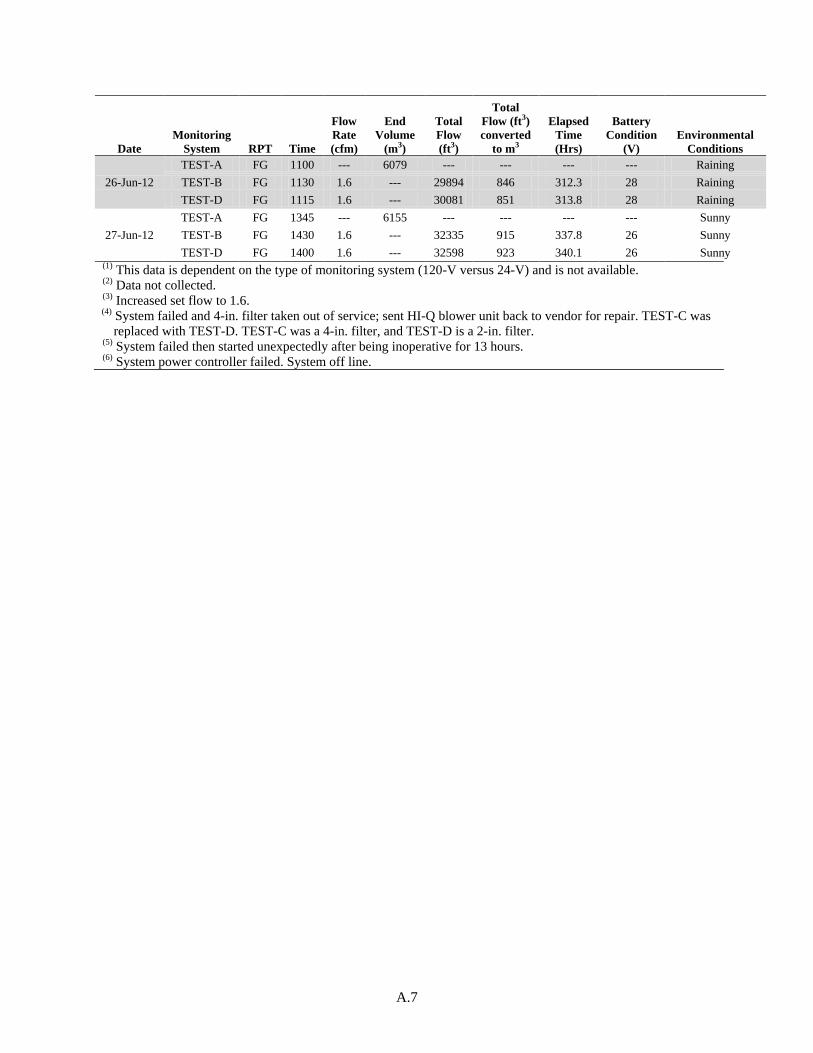
Appendix A
Daily Monitoring Checklist

A.1
Appendix A
Daily Monitoring Checklist Data
Date
Monitoring
System RPT Time
Flow
Rate
(cfm)
End
Volume
(m3)
Total
Flow
(ft3)
Total
Flow (ft3)
converted
to m3
Elapsed
Time
(Hrs)
Battery
Condition
(V)
Environmental
Conditions
22-Feb-12
TEST-A DLM 0915 ---(1) 8283 ---(1) ---(1) ---(1) ---(1) (2)
TEST-B DLM 0915 1.5 --- 0 0 0 27 (2)
TEST-C DLM 0915 1.5 --- 0 0 0 27 (2)
23-Feb-12
TEST-A DLM 1345 --- 8344 --- --- --- --- (2)
TEST-B DLM 1345 1.4 --- 2340 66 26.1 28 (2)
TEST-C DLM 1345 1.4 --- 2349 66 26.2 28 (2)
24-Feb-12
TEST-A DLM 1015 --- 8394 --- --- --- --- (2)
TEST-B DLM 1015 1.4 --- 4185 118 46.6 27 (2)
TEST-C DLM 1015 1.4 --- 4193 119 46.7 26 (2)
27-Feb-12
TEST-A SKM 1310 --- 8573 --- --- --- --- (2)
TEST-B SKM 1310 1.5 --- 10907 309 121.4 27 (2)
TEST-C SKM 1310 1.5 --- 10909 309 121.5 27 (2)
28-Feb-12
TEST-A DLM 0930 --- 8621 --- --- --- --- (2)
TEST-B DLM 0930 1.4 --- 12735 360 141.8 28 (2)
TEST-C DLM 0930 1.5 --- 12735 360 141.8 27 (2)
29-Feb-12
TEST-A DLM 0855 --- 8677 --- --- --- --- (2)
TEST-B DLM 0855 1.5 --- 14836 420 165.1 29 (2)
TEST-C DLM 0855 1.5 --- 14840 420 165.3 27 (2)
1-Mar-12
TEST-A FG 1315 --- 8745 --- --- --- --- (2)
TEST-B FG 1315 1.5 --- 17371 492 193.3 27 (2)
TEST-C FG 1315 1.5 --- 17373 492 193.5 27 (2)
2-Mar-12
TEST-A FG 1430 --- 8807 --- --- --- --- (2)
TEST-B FG 1430 1.5 --- 19649 556 218.7 27 (2)
TEST-C FG 1430 1.5 --- 19648 556 218.8 27 (2)
5-Mar-12
TEST-A FG 1130 --- 8973 --- --- --- --- (2)
TEST-B FG 1130 1.5 --- 25849 732 287.6 28 (2)
TEST-C FG 1130 1.4 --- 25840 731 287.7 27 (2)
6-Mar-12
TEST-A FG 0930 --- 9024 --- --- --- --- (2)
TEST-B FG 0930 1.5 --- 27802 787 309.4 28 (2)
TEST-C FG 0930 1.5 --- 27795 787 309.5 27 (2)
7-Mar-12
TEST-A FG 1445 --- 9095 --- --- --- --- Sunny
TEST-B FG 1500 1.5 --- 30465 862 339 27 Sunny
TEST-C FG 1545 1.5 --- 30514 864 339.8 27 Sunny
8-Mar-12
TEST-A FG 1300 --- 9152 --- --- --- --- Sunny
TEST-B FG 1300 1.5 --- 1923 54 21.4 27 Sunny
TEST-C FG 1300 1.5 --- 1898 54 21.8 27 Sunny
9-Mar-12
TEST-A FG 0915 --- 9205 --- --- --- --- Sunny
TEST-B FG 0915 1.5 --- 3745 106 41.7 28 Sunny
TEST-C FG 0915 1.5 --- 3713 105 41.4 27 Sunny

A.2
Date
Monitoring
System RPT Time
Flow
Rate
(cfm)
End
Volume
(m3)
Total
Flow
(ft3)
Total
Flow (ft3)
converted
to m3
Elapsed
Time
(Hrs)
Battery
Condition
(V)
Environmental
Conditions
12-Mar-12
TEST-A FG 1400 --- 9397 --- --- --- --- Cloudy
TEST-B FG 1400 1.5 --- 10552 299 117.4 28 Cloudy
TEST-C FG 1400 1.4 --- 10510 297 117.1 27 Cloudy
13-Mar-12
TEST-A FG 1400 --- 9457 --- --- --- --- Cloudy
TEST-B FG 1400 1.5 --- 12695 359 141.4 28 Cloudy
TEST-C FG 1400 1.5 --- 12668 359 141.1 27 Cloudy
14-Mar-12
TEST-A FG 0800 --- 9503 --- --- --- --- Cloudy
TEST-B FG 0800 1.5 --- 14303 405 159.3 26 Cloudy
TEST-C FG 0800 1.5 --- 14273 404 159 26 Cloudy
15-Mar-12
TEST-A FG 1230 --- 9574 --- --- --- --- Overcast
TEST-B FG 1230 1.5 --- 16835 476 187.8 27 Overcast
TEST-C FG 1230 1.5 --- 16836 476 187.6 27 Overcast
16-Mar-12
TEST-A FG 1245 --- 9636 --- --- --- --- Sunny
TEST-B FG 1245 1.5 --- 18969 537 212 27 Sunny
TEST-C FG 1245 1.5 --- 19005 538 211.7 27 Sunny
19-Mar-12
TEST-A FG 1000 --- 9810 --- --- --- --- Sunny
TEST-B FG 1000 1.5 --- 25147 712 281.2 28 Sunny
TEST-C FG 1000 1.5 --- 25217 714 280.9 27 Sunny
20-Mar-12
TEST-A FG 0800 --- 9868 --- --- --- --- Partly Overcast
TEST-B(3) FG 0800 1.4 --- 27104 767 303.2 25 Partly Overcast
TEST-C(3) FG 0800 1.4 --- 27192 770 302.9 25 Partly Overcast
21-Mar-12
TEST-A FG 1315 --- 9944 --- --- --- --- Overcast Raining
TEST-B FG 1330 1.5 --- 29799 843 332.6 27 Overcast Raining
TEST-C FG 1400 1.5 --- 29129 824 323.1 27 Overcast Raining
22-Mar-12
TEST-A FG 0745 --- 9987 --- --- --- --- Partly Overcast
TEST-B FG 0745 1.5 --- 1715 49 18 25 Partly Overcast
TEST-C FG 0745 1.5 --- 1647 47 17.2 25 Partly Overcast
23-Mar-12
TEST-A FG 0600 --- 42 --- --- --- --- Dark
TEST-B FG 0600 1.6 --- 3842 109 40.2 25 Dark
TEST-C FG 0600 1.6 --- 3776 107 39.4 25 Dark
26-Mar-12
TEST-A FG 0830 --- 228 --- --- --- --- Overcast
TEST-B FG 0830 1.5 --- 10964 310 114.6 26 Overcast
TEST-C FG 0830 1.6 --- 10898 308 113.8 26 Overcast
27-Mar-12
TEST-A FG 0730 --- 285 --- --- --- --- Overcast Raining
TEST-B FG 0730 1.6 --- 13150 372 137.5 25 Overcast Raining
TEST-C FG 0730 1.6 --- 10392 294 136.7 25 Overcast Raining
28-Mar-12
TEST-A FG 0730 --- 345 --- --- --- --- Overcast Raining
TEST-B FG 0730 1.6 --- 15459 437 161.6 25 Overcast Raining
TEST-C FG 0730 1.6 --- 15400 436 160.7 25 Overcast Raining
29-Mar-12
TEST-A FG 0830 --- 407 --- --- --- --- Partly Cloudy
TEST-B FG 0830 1.5 --- 17841 505 186.5 26 Partly Cloudy
TEST-C FG 0830 1.5 --- 17783 503 185.6 26 Partly Cloudy
30-Mar-12
TEST-A FG 1100 --- 473 --- --- --- --- Overcast Raining
TEST-B FG 1100 1.6 --- 20392 577 213.2 28 Overcast Raining
TEST-C FG 1100 1.5 --- 20344 576 212.4 28 Overcast Raining
A.3
Date
Monitoring
System RPT Time
Flow
Rate
(cfm)
End
Volume
(m3)
Total
Flow
(ft3)
Total
Flow (ft3)
converted
to m3
Elapsed
Time
(Hrs)
Battery
Condition
(V)
Environmental
Conditions
2-Apr-12
TEST-A SKM 0930 --- 651 --- --- --- --- Overcast
TEST-B SKM 0930 1.6 --- 27119 767 283.4 28 Overcast
TEST-C SKM 0930 1.5 --- 27070 766 282.6 28.5 Overcast
3-Apr-12
TEST-A SKM 0900 --- 710 --- --- --- --- Partly Cloudy
TEST-B SKM 0900 1.6 --- 29368 831 306.9 29 Partly Cloudy
TEST-C SKM 0900 1.5 --- 29321 830 306.1 28.2 Partly Cloudy
4-Apr-12
TEST-A SKM 0900 --- 771 --- --- --- --- Cloudy
TEST-B SKM 0935 1.6 --- 31726 898 331.6 27 Cloudy
TEST-C SKM 0910 1.6 --- 31640 895 330.3 27.5 Cloudy
5-Apr-12
TEST-A SKM 0745 --- 830 --- --- --- --- Partly Cloudy
TEST-B SKM 0745 1.6 --- 2094 59 21.9 26.5 Partly Cloudy
TEST-C SKM 0745 1.6 --- 2127 60 22.2 26.5 Partly Cloudy
6-Apr-12
TEST-A SKM 0800 --- 894 --- --- --- --- Partly Cloudy
TEST-B SKM 0800 1.6 --- 4413 125 46.1 26 Partly Cloudy
TEST-C SKM 0800 1.5 --- 4453 126 46.5 26 Partly Cloudy
9-Apr-12
TEST-A SKM 0745 --- 1083 --- --- --- --- Overcast
TEST-B SKM 0745 1.6 --- 11274 319 117.8 26.5 Overcast
TEST-C SKM 0745 1.6 --- 11314 320 118.2 26.5 Overcast
10-Apr-12
TEST-A SKM 0727 --- 1144.3 --- --- --- --- Overcast
TEST-B SKM 0727 1.5 --- 13538 383 141.5 25.5 Overcast
TEST-C SKM 0727 1.6 --- 13583 384 141.9 25.5 Overcast
11-Apr-12
TEST-A SKM 0710 --- 1203 --- --- --- --- Overcast
TEST-B SKM 0710 1.6 --- 15804 447 165.1 25.5 Overcast
TEST-C SKM 0710 1.6 --- 15848 448 165.5 25.5 Overcast
12-Apr-12
TEST-A SKM 0730 --- 1265 --- --- --- --- Sunny
TEST-B SKM 0730 1.6 --- 18136 513 189.5 26 Sunny
TEST-C SKM 0730 1.6 --- 18181 515 189.9 26 Sunny
13-Apr-12
TEST-A SKM 0745 --- 1327 --- --- --- --- Sunny
TEST-B SKM 0745 1.5 --- 20467 579 213.9 27 Sunny
TEST-C SKM 0745 (4) --- (4) (4) (4) 28 Sunny
16-Apr-12
TEST-A SKM 0750 --- 1511 --- --- --- --- Cloudy
TEST-B SKM 0750 1.6 --- 27347 774 285.7 25.5 Cloudy
TEST-C SKM 0750 (4) --- (4) (4) (4) 28.5 Cloudy
17-Apr-12
TEST-A SKM 0730 --- 1572 --- --- --- --- Sunny
TEST-B SKM 0730 1.6 --- 29608 838 309.4 26 Sunny
TEST-C SKM 0730 (4) --- (4) 0 (4) 28.5 Sunny
18-Apr-12
TEST-A SKM 0845 --- 1637 --- --- --- --- Cloudy
TEST-B SKM 0855 1.6 --- 32039 907 334.8 28.5 Cloudy
TEST-D (4) SKM 1115 1.6 --- 0 0 0 26.5 Cloudy
19-Apr-12
TEST-A SKM 0730 --- 1695 --- --- --- --- Sunny
TEST-B SKM 0730 1.6 --- 2122 60 22.2 26.5 Sunny
TEST-D SKM 0730 1.6 --- 1926 55 20.1 26 Sunny
20-Apr-12
TEST-A FG 0730 --- 1755 --- --- --- --- Partly Cloudy
TEST-B FG 0730 1.5 --- 4408 125 46 26 Partly Cloudy
TEST-D FG 0730 1.6 --- 4219 119 44 26 Partly Cloudy
A.4
Date
Monitoring
System RPT Time
Flow
Rate
(cfm)
End
Volume
(m3)
Total
Flow
(ft3)
Total
Flow (ft3)
converted
to m3
Elapsed
Time
(Hrs)
Battery
Condition
(V)
Environmental
Conditions
23-Apr-12
TEST-A SKM 0745 --- 1935 --- --- --- --- Sunny
TEST-B SKM 0745 1.5 --- 11324 320 118 26.5 Sunny
TEST-D SKM 0745 1.6 --- 11144 315 116.3 26 Sunny
24-Apr-12
TEST-A SKM 0730 --- 1994 --- --- --- --- Sunny
TEST-B SKM 0730 1.6 --- 13609 385 142.2 26.5 Sunny
TEST-D SKM 0730 1.6 --- 13433 380 140.1 26 Sunny
25-Apr-12
TEST-A SKM 0815 --- 2056 --- --- --- --- Cloudy
TEST-B SKM 0815 1.6 --- 15977 452 166.9 26.5 Cloudy
TEST-D SKM 0815 1.6 --- 15806 447 164.9 26.5 Cloudy
26-Apr-12
TEST-A SKM 0800 --- 2115 --- --- --- --- Rain
TEST-B SKM 0800 1.6 --- 18235 516 190.5 25 Rain
TEST-D SKM 0800 1.6 --- 18069 511 188.5 25 Rain
27-Apr-12
TEST-A FG 0715 --- 2175 --- --- --- --- Sunny
TEST-B FG 0715 1.6 --- 20458 579 213.7 26 Sunny
TEST-D FG 0715 1.6 --- 20298 574 211.7 26 Sunny
30-Apr-12
TEST-A FG 0800 --- 2360 --- --- --- --- Sunny
TEST-B FG 0800 1.5 --- 27424 776 286.5 27.5 Sunny
TEST-D FG 0800 1.6 --- 27270 772 284.5 27 Sunny
1-May-12
TEST-A DLM 0836 --- 2423 --- --- --- --- Sunny
TEST-B DLM 0836 1.6 --- 29769 842 311 28 Sunny
TEST-D DLM 0836 1.6 --- 29623 838 309 28 Sunny
2-May-12
TEST-A SKM 0810 --- 2483 --- --- --- --- Sunny
TEST-B SKM 0840 1.6 --- 32058 907 334.9 28.5 Sunny
TEST-D SKM 0825 1.6 --- 31891 903 332.7 28 Sunny
3-May-12
TEST-A DLM 0740 --- 2543 --- --- --- --- Overcast
TEST-B DLM 0740
--- 2197 62 23 26 Overcast
TEST-D DLM 0740 1.5 --- 2221 63 23.2 23.5 Overcast
4-May-12
TEST-A DLM 0725 --- 2604 --- --- --- --- Overcast
TEST-B DLM 0725 1.6 --- 4469 126 46.7 27 Overcast
TEST-D DLM 0725 1.6 --- 4496 127 46.9 27 Overcast
7-May-12
TEST-A SKM 0740 --- 2796 --- --- --- --- Sunny
TEST-B SKM 0740 1.6 --- 11378 322 118.9 27 Sunny
TEST-D SKM 0740 1.6 --- 11416 323 119.1 26.5 Sunny
8-May-12
TEST-A DLM 0740 --- 2858 --- --- --- --- Sunny
TEST-B DLM 0740 1.6 --- 13667 387 142.8 27 Sunny
TEST-D DLM 0740 1.6 --- 13733 389 143.1 27 Sunny
9-May-12
TEST-A DLM 0807 --- 2921 --- --- --- --- Sunny
TEST-B DLM 0807 1.6 --- 16008 453 167.3 28.5 Sunny
TEST-D DLM 0807 1.6 --- 16052 454 167.5 27.5 Sunny
10-May-12
TEST-A DLM 0800 --- 2985 --- --- --- --- Sunny
TEST-B DLM 0800 1.6 --- 18287 518 191.1 28.5 Sunny
TEST-D DLM 0800 1.6 --- 18335 519 191.3 27 Sunny
11-May-12
TEST-A DLM 0730 --- 3047 --- --- --- --- Sunny
TEST-B DLM 0730 1.6 --- 20575 582 215 27.5 Sunny
TEST-D DLM 0730 1.6 --- 20625 584 215.2 26.5 Sunny
A.5
Date
Monitoring
System RPT Time
Flow
Rate
(cfm)
End
Volume
(m3)
Total
Flow
(ft3)
Total
Flow (ft3)
converted
to m3
Elapsed
Time
(Hrs)
Battery
Condition
(V)
Environmental
Conditions
14-May-12
TEST-A SKM 0745 --- 3230 --- --- --- --- Sunny
TEST-B SKM 0745 1.6 --- 27453 777 286.9 24.5 Sunny
TEST-D SKM 0745 1.6 --- 27515 779 287.1 26.5 Sunny
15-May-12
TEST-A DLM 0745 --- 3293 --- --- --- --- Sunny
TEST-B DLM 0745 1.5 --- 29740 842 310.8 24.5 Sunny
TEST-D DLM 0745 1.5 --- 29810 844 311.1 26.5 Sunny
16-May-12
TEST-A DLM 0730 --- 3353 --- --- --- --- Sunny
TEST-B DLM 0730 1.6 --- 32012 906 334.5 24 Sunny
TEST-D DLM 0730 1.6 --- 32082 908 334.7 26 Sunny
17-May-12
TEST-A DLM 0805 --- 3417.2 --- --- --- --- Sunny
TEST-B DLM 0805 1.6 --- 2236 63 23.3 23 Sunny
TEST-D DLM 0805 1.6 --- 2261 64 23.6 27 Sunny
18-May-12
TEST-A DLM 0725 --- 3478.1 --- --- --- --- Sunny
TEST-B DLM --- (5) --- (5) (5) (5) 23 Sunny
TEST-D DLM 0725 1.5 --- 4501 127 47 26 Sunny
21-May-12
TEST-A SKM 0750 --- 3665 --- --- --- --- Cloudy
TEST-B SKM 0750 1.6 --- 10192 288 106.5 25.5 Cloudy
TEST-D SKM 0750 1.6 --- 11436 324 119.3 26 Cloudy
22-May-12
TEST-A DLM 0810 --- 3729.7 --- --- --- --- Overcast
TEST-B DLM 0810 1.5 --- 12511 354 130.7 26 Overcast
TEST-D DLM 0810 1.6 --- 13761 389 143.6 27 Overcast
23-May-12
TEST-A DLM 0900 --- 3795 --- --- --- --- Thin Overcast
TEST-B DLM 0900 1.6 --- 14894 422 155.6 27.5 Thin Overcast
TEST-D DLM 0900 1.6 --- 16147 457 168.5 28 Thin Overcast
24-May-12
TEST-A SKM 0900 --- 3856 --- --- --- --- Sunny
TEST-B SKM 0900 1.6 --- 17198 487 179.7 25 Sunny
TEST-D SKM 0900 1.6 --- 18451 522 192.5 27.5 Sunny
25-May-12
TEST-A SKM 0900 --- 3919 --- --- --- --- Sunny
TEST-B SKM 0900 1.6 --- 19495 552 203.7 28 Sunny
TEST-D SKM 0900 1.6 --- 20751 587 216.5 28 Sunny
29-May-12
TEST-A DLM 0810 --- 4163 --- --- --- --- Thin Overcast
TEST-B DLM 0810 1.5 --- 28578 809 298.6 25.5 Thin Overcast
TEST-D DLM 0810 1.6 --- 29853 845 311.5 28 Thin Overcast
30-May-12
TEST-A DLM 0855 --- 4227 --- --- --- --- Overcast
TEST-B DLM 0855 1.6 --- 30945 876 323.3 24.5 Overcast
TEST-D DLM 0855 1.5 --- 32219 912 336.2 28 Overcast
31-May-12
TEST-A DLM 0825 --- 4294 --- --- --- --- Cloudy
TEST-B DLM 0825 1.6 --- 2144 61 22.4 24.5 Cloudy
TEST-D DLM 0825 1.6 --- 2171 61 22.6 26.5 Cloudy
1-Jun-12
TEST-A DLM 0750 --- 4361 --- --- --- --- Cloudy
TEST-B DLM 0750 1.6 --- 4386 124 45.8 24 Cloudy
TEST-D DLM 0750 1.5 --- 4417 125 46.1 27 Cloudy
4-Jun-12
TEST-A SKM 0800 --- 4566 --- --- --- --- Cloudy
TEST-B SKM 0800 (6) --- (6) (6) (6) 23 Cloudy
TEST-D SKM 0800 1.6 --- 11321 320 118.1 26 Cloudy
A.6
Date
Monitoring
System RPT Time
Flow
Rate
(cfm)
End
Volume
(m3)
Total
Flow
(ft3)
Total
Flow (ft3)
converted
to m3
Elapsed
Time
(Hrs)
Battery
Condition
(V)
Environmental
Conditions
5-Jun-12
TEST-A FG 0800 --- 4634 --- --- --- --- Raining
TEST-B FG 0800 (6) --- (6) (6) (6) ((6) Raining
TEST-D FG 0800 1.6 --- 13625 386 142.1 26 Raining
6-Jun-12
TEST-A FG 0830 --- 4703 --- --- --- --- Sunny
TEST-B FG 0830 (6) --- (6) (6) (6) (6) Sunny
TEST-D FG 0830 1.5 --- 15969 452 166.6 28 Sunny
7-Jun-12
TEST-A FG 0730 --- 4769 --- --- --- --- Cloudy
TEST-B FG 0730 (6) --- (6) (6) (6) (6) Cloudy
TEST-D FG 0730 1.6 --- 18193 515 189.8 27 Cloudy
8-Jun-12
TEST-A DLM 1315 --- 4852 --- --- --- --- Partly Cloudy
TEST-B DLM 1315 1.6 --- 13399 379 140 28 Partly Cloudy
TEST-D DLM 1315 1.6 --- 21029 595 219.3 26 Partly Cloudy
11-Jun-12
TEST-A FG 0930 --- 5049 --- --- --- --- Partly Cloudy
TEST-B FG 0830 (6) --- (6) (6) (6) (6) Partly Cloudy
TEST-D FG 0830 (6) --- (6) (6) (6) (6) Partly Cloudy
12-Jun-12
TEST-A DLM 1510 --- 5130 --- --- --- --- Mostly Cloudy
TEST-B DLM 1330 1.6 --- 19866 562 207.6 28 Mostly Cloudy
TEST-D DLM 1500 1.5 --- 27627 782 288.2 26 Mostly Cloudy
13-Jun-12
TEST-A DLM 1100 --- 5187 --- --- --- --- Clear
TEST-B DLM 1000 1.6 --- 21824 618 228 28 Clear
TEST-D DLM 0910 1.6 --- 29364 831 306.3 28 Clear
14-Jun-12
TEST-A DLM 1111 --- 5256 --- --- --- --- Sunny
TEST-B DLM 1057 1.6 --- 2370 67 24.8 27 Sunny
TEST-D DLM 1016 1.6 --- 2385 67 24.9 26.5 Sunny
15-Jun-12
TEST-A FG 0830 --- 5317 --- --- --- --- Sunny
TEST-B FG 0900 1.6 --- 4472 127 46.8 27 Sunny
TEST-D FG 0845 1.5 --- 4544 129 47.4 28 Sunny
18-Jun-12
TEST-A SKM 0750 --- 5520 --- --- --- --- Cloudy
TEST-B SKM 0800 1.6 --- 11276 319 117.8 28 Cloudy
TEST-D SKM 0755 1.6 --- 11361 322 118.5 26.5 Cloudy
19-Jun-12
TEST-A FG 0830 --- 5592 --- --- --- --- Cloudy
TEST-B FG 0800 1.5 --- 13620 385 142.3 28 Cloudy
TEST-D FG 0800 1.6 --- 13708 388 143 28 Cloudy
20-Jun-12
TEST-A FG 1300 --- 5672 --- --- --- --- Sunny
TEST-B FG 1315 1.6 --- 16341 462 170.8 26 Sunny
TEST-D FG 1300 1.6 --- 16414 465 171.2 26 Sunny
21-Jun-12
TEST-A FG 0800 --- 5728 --- --- --- --- Sunny
TEST-B FG 0830 1.6 --- 18175 514 189.9 27.5 Sunny
TEST-D FG 0815 1.6 --- 18257 517 190.5 26.5 Sunny
22-Jun-12
TEST-A DLM 0753 --- 5794 --- --- --- --- Overcast
TEST-B DLM 0806 1.5 --- 20448 579 213.7 26.5 Overcast
TEST-D DLM 0801 1.6 --- 20540 581 214.3 26 Overcast
25-Jun-12
TEST-A FG 0915 --- 6004 --- --- --- --- Overcast
TEST-B FG 0900 1.5 --- 27370 775 266 28 Overcast
TEST-D FG 0930 1.6 --- 27568 780 287.6 28 Overcast
A.7
Date
Monitoring
System RPT Time
Flow
Rate
(cfm)
End
Volume
(m3)
Total
Flow
(ft3)
Total
Flow (ft3)
converted
to m3
Elapsed
Time
(Hrs)
Battery
Condition
(V)
Environmental
Conditions
26-Jun-12
TEST-A FG 1100 --- 6079 --- --- --- --- Raining
TEST-B FG 1130 1.6 --- 29894 846 312.3 28 Raining
TEST-D FG 1115 1.6 --- 30081 851 313.8 28 Raining
27-Jun-12
TEST-A FG 1345 --- 6155 --- --- --- --- Sunny
TEST-B FG 1430 1.6 --- 32335 915 337.8 26 Sunny
TEST-D FG 1400 1.6 --- 32598 923 340.1 26 Sunny (1) This data is dependent on the type of monitoring system (120-V versus 24-V) and is not available. (2) Data not collected. (3) Increased set flow to 1.6. (4) System failed and 4-in. filter taken out of service; sent HI-Q blower unit back to vendor for repair. TEST-C was
replaced with TEST-D. TEST-C was a 4-in. filter, and TEST-D is a 2-in. filter. (5) System failed then started unexpectedly after being inoperative for 13 hours. (6) System power controller failed. System off line.


Appendix B
GEL Laboratories Analytical Results for 2-in Sample Filters

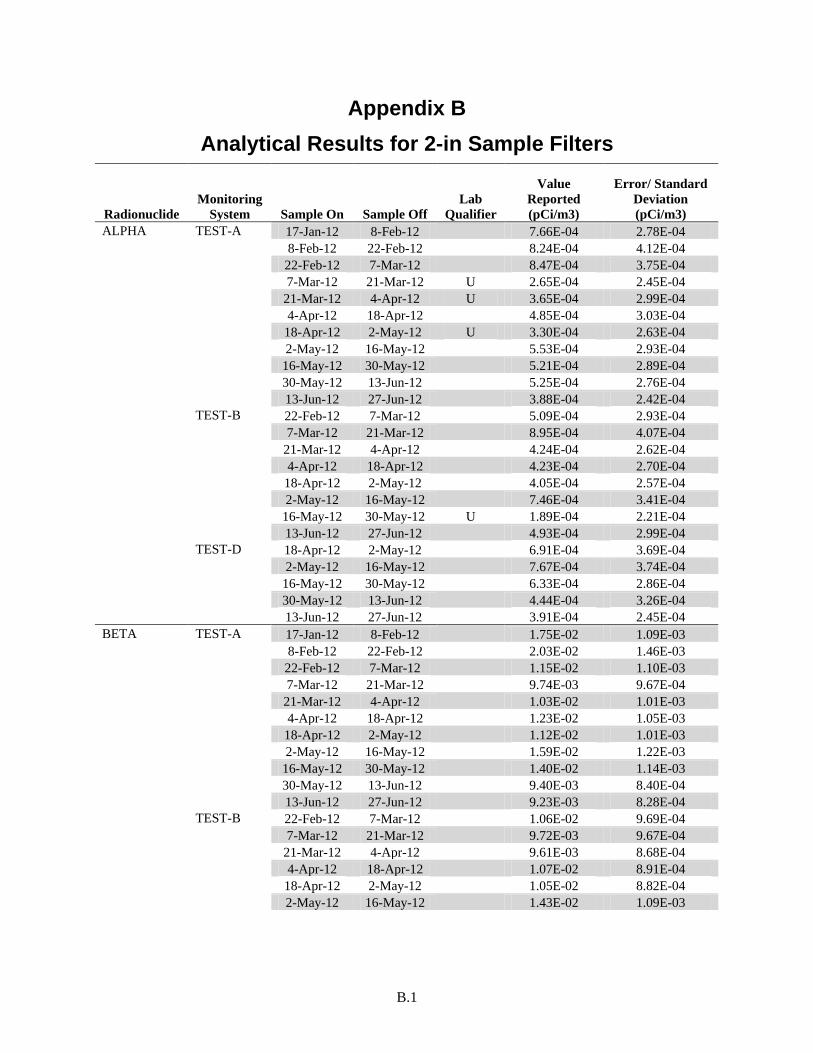
B.1
Appendix B
Analytical Results for 2-in Sample Filters
Radionuclide
Monitoring
System Sample On Sample Off
Lab
Qualifier
Value
Reported
(pCi/m3)
Error/ Standard
Deviation
(pCi/m3)
ALPHA TEST-A 17-Jan-12 8-Feb-12
7.66E-04 2.78E-04
8-Feb-12 22-Feb-12
8.24E-04 4.12E-04
22-Feb-12 7-Mar-12
8.47E-04 3.75E-04
7-Mar-12 21-Mar-12 U 2.65E-04 2.45E-04
21-Mar-12 4-Apr-12 U 3.65E-04 2.99E-04
4-Apr-12 18-Apr-12
4.85E-04 3.03E-04
18-Apr-12 2-May-12 U 3.30E-04 2.63E-04
2-May-12 16-May-12
5.53E-04 2.93E-04
16-May-12 30-May-12
5.21E-04 2.89E-04
30-May-12 13-Jun-12
5.25E-04 2.76E-04
13-Jun-12 27-Jun-12
3.88E-04 2.42E-04
TEST-B 22-Feb-12 7-Mar-12
5.09E-04 2.93E-04
7-Mar-12 21-Mar-12
8.95E-04 4.07E-04
21-Mar-12 4-Apr-12
4.24E-04 2.62E-04
4-Apr-12 18-Apr-12
4.23E-04 2.70E-04
18-Apr-12 2-May-12
4.05E-04 2.57E-04
2-May-12 16-May-12
7.46E-04 3.41E-04
16-May-12 30-May-12 U 1.89E-04 2.21E-04
13-Jun-12 27-Jun-12
4.93E-04 2.99E-04
TEST-D 18-Apr-12 2-May-12
6.91E-04 3.69E-04
2-May-12 16-May-12
7.67E-04 3.74E-04
16-May-12 30-May-12
6.33E-04 2.86E-04
30-May-12 13-Jun-12
4.44E-04 3.26E-04
13-Jun-12 27-Jun-12 3.91E-04 2.45E-04
BETA TEST-A 17-Jan-12 8-Feb-12
1.75E-02 1.09E-03
8-Feb-12 22-Feb-12
2.03E-02 1.46E-03
22-Feb-12 7-Mar-12
1.15E-02 1.10E-03
7-Mar-12 21-Mar-12
9.74E-03 9.67E-04
21-Mar-12 4-Apr-12
1.03E-02 1.01E-03
4-Apr-12 18-Apr-12
1.23E-02 1.05E-03
18-Apr-12 2-May-12
1.12E-02 1.01E-03
2-May-12 16-May-12
1.59E-02 1.22E-03
16-May-12 30-May-12
1.40E-02 1.14E-03
30-May-12 13-Jun-12
9.40E-03 8.40E-04
13-Jun-12 27-Jun-12
9.23E-03 8.28E-04
TEST-B 22-Feb-12 7-Mar-12
1.06E-02 9.69E-04
7-Mar-12 21-Mar-12
9.72E-03 9.67E-04
21-Mar-12 4-Apr-12
9.61E-03 8.68E-04
4-Apr-12 18-Apr-12
1.07E-02 8.91E-04
18-Apr-12 2-May-12
1.05E-02 8.82E-04
2-May-12 16-May-12
1.43E-02 1.09E-03

B.2
Radionuclide
Monitoring
System Sample On Sample Off
Lab
Qualifier
Value
Reported
(pCi/m3)
Error/ Standard
Deviation
(pCi/m3)
BETA TEST-B 16-May-12 30-May-12
1.24E-02 1.23E-03
13-Jun-12 27-Jun-12
8.77E-03 8.68E-04
TEST-D 18-Apr-12 2-May-12
1.22E-02 9.44E-04
2-May-12 16-May-12
1.63E-02 1.19E-03
16-May-12 30-May-12
1.33E-02 1.10E-03
30-May-12 13-Jun-12
1.11E-02 9.51E-04
13-Jun-12 27-Jun-12 1.02E-02 8.64E-04
Am-241 TEST-A 17-Jan-12 27-Jun-12 U 1.25E-06 3.70E-06
TEST-B 22-Feb-12 27-Jun-12 U -8.96E-08 2.47E-06
TEST-D 18-Apr-12 27-Jun-12 U -2.60E-06 5.43E-06
Am-243 TEST-A 17-Jan-12 27-Jun-12 U 2.19E-06 6.64E-06
TEST-B 22-Feb-12 27-Jun-12 U -2.08E-06 2.91E-06
TEST-D 18-Apr-12 27-Jun-12 U -1.14E-06 3.88E-06
Cm-243/244 TEST-A 17-Jan-12 27-Jun-12 U -2.08E-06 3.55E-06
TEST-B 22-Feb-12 27-Jun-12 U -2.26E-06 2.72E-06
TEST-D 18-Apr-12 27-Jun-12 U -5.16E-06 4.95E-06
Co-60 TEST-A 17-Jan-12 4-Apr-12 U -3.30E-05 6.60E-04
TEST-A 4-Apr-12 27-Jun-12 U -3.25E-05 4.99E-04
TEST-B 22-Feb-12 27-Jun-12 U -9.54E-05 3.01E-04
TEST-D 18-Apr-12 27-Jun-12 U -9.49E-06 6.70E-04
Pu-238 TEST-A 17-Jan-12 27-Jun-12 U 3.85E-07 1.85E-06
TEST-B 22-Feb-12 27-Jun-12 U 8.36E-07 1.55E-06
TEST-D 18-Apr-12 27-Jun-12 U 0.00E+00 2.03E-06
Pu-239/240 TEST-A 17-Jan-12 27-Jun-12
4.61E-06 3.12E-06
TEST-B 22-Feb-12 27-Jun-12 U 1.95E-06 2.32E-06
TEST-D 18-Apr-12 27-Jun-12 4.16E-06 3.40E-06
U-233/234 TEST-A 17-Jan-12 27-Jun-12
4.82E-05 1.63E-05
TEST-B 22-Feb-12 27-Jun-12
4.71E-05 1.22E-05
TEST-D 18-Apr-12 27-Jun-12
4.01E-05 1.55E-05

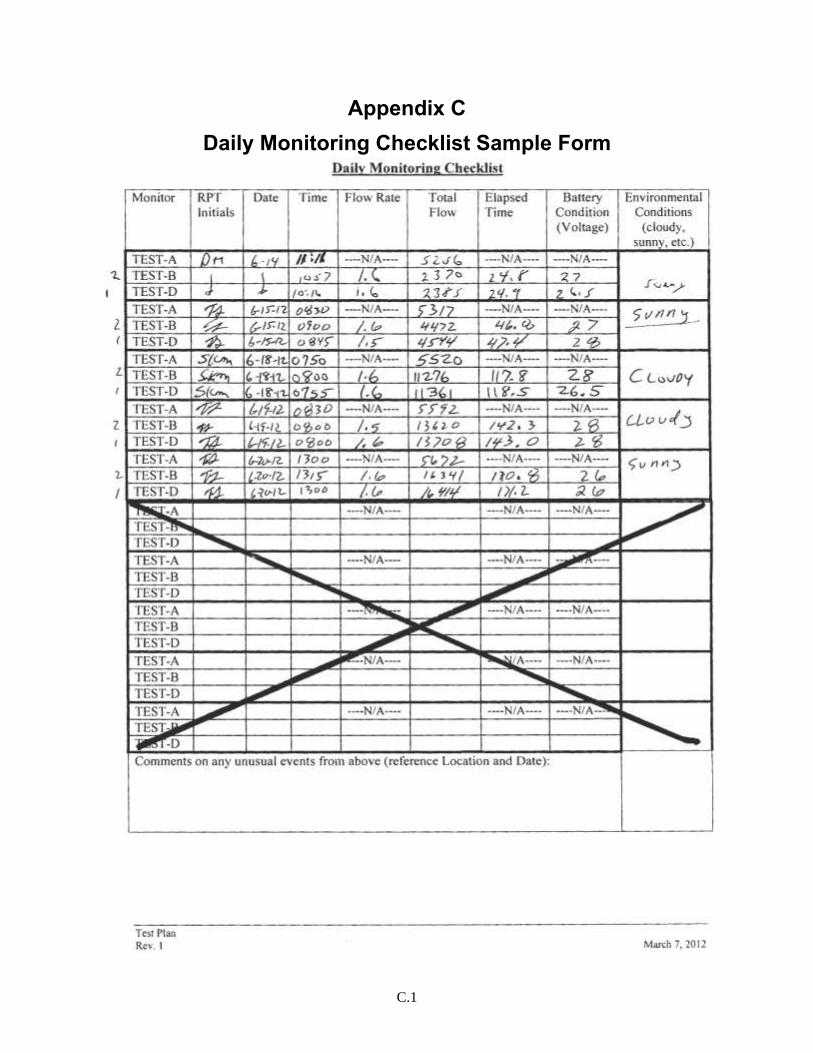
Appendix C
Daily Monitoring Checklist Sample Form

C.1
Appendix C
Daily Monitoring Checklist Sample Form