Embed Size (px)
Citation preview

Centre
Number
Paper Reference Surname Other Names
Candidate
Number
Candidate Signature
For
Examiner’s use
1389For Team
Leader’s use
Edexcel GCSE
Statistics
Paper 1H
HIGHER TIER
Specimen Paper
Time: 2 hours 30 minutes
Materials required for the examination Items included with these question papers
Ruler graduated in centimetres and
millimetres, protractor, compass, pen,
HB pencil, eraser, electronic calculator.
Formulae sheet.
Instructions to Candidates
In the boxes above, write your centre number, candidate number, the paper reference, your surname and other
names and your signature. The paper reference is shown above.
Answer all questions in the spaces provided in this book.
Supplementary answer sheets may be used.
Information for Candidates
The total mark for this paper is 100.
The marks for the various parts of questions are shown in round brackets: e.g. (2).
This question paper has 9 questions in Section A and 8 questions in Section B.
Advice to Candidates
Work steadily through the paper.
Do not spend too long on one question.
Show all stages in any calculations.
If you cannot answer a question, leave it and attempt the next one.
Return at the end to those you have left out.
N0000
© 2003 Edexcel – GCSE Statistics Specimen Paper 1H
This publication may only be reproduced in accordance with Edexcel copyright policy.
Edexcel Foundation is a registered charity.

Leave
blank
2Edexcel GCSE Statistics: Specimen Paper 1H (Higher)
Edexcel Foundation
GCSE Statistics
Formulae Sheet
Higher Tier
Mean of a frequency distribution = �
�
f
fx.
Mean of a grouped frequency
distribution=
�
�
f
fx, where x is the mid-interval value.
Variance = n
xx� � 2)(
Standard deviation (set of numbers)���
�
���
���
�
�
��22
n
x
n
x
or
��
���
� ��
n
xx 2)(
where x is the mean of the set of values.
Standard deviation (discrete frequency
distribution) ��
�
�
��
�
�
���
�
�
�
�
�
�22
f
fx
f
fx
or �
�
���
� �
�
�
f
xxf 2)(
Spearman’s Rank Correlation
coefficient )1(
61
2
2
�
�
�
nn
d

Leave
blank
3
Edexcel GCSE Statistics: Specimen Paper 1H (Higher) Turn over
Write down your answers in the spaces provided.
You must write down all stages in your working.
Section A
Answer ALL NINE questions.
1. The sequences of numbers given below are taken from a random number table. It is to be
used to simulate ten throws of an unbiased six-sided die.
11 74 26 93 81 44 33 93 08 72 30 79 76 39
Describe the rule you would use for selecting the numbers showing on the die.
…………………………………………………………………………………………………
(1)
Use the above rule to fill in the table below.
Throw 1 2 3 4 5 6 7 8 9 10
Number showing on die
(1)
2. This pie chart shows the number of people who voted for one of three candidates in a recent
election.
Votes cast in election
Candidate A
Candidate B
Candidate C
Give one way in which this method of data representation is misleading.
………………………………………………………………………………………………....
…………………………………………………………………………………………………
(1)

Leave
blank
4Edexcel GCSE Statistics: Specimen Paper 1H (Higher)
3. In a study into smoking a doctor selected a sample of adult patients from those registered
with him and looked at their records to see to what degree they claimed to smoke.
(a) What is the population being studied?
…………………………………………………………………………………………….
(1)
(b) If the doctor wished to get the number of males and the number of females in proportion
to the numbers on his register, what sampling method should he use?
…………………………………………………………………………………………….
(1)
(c) The doctor’s information on smoking was obtained by asking the patients, at the time of
setting up a database. Give two reasons why the figures obtained may be unreliable.
…………………………………………………………………………………………….
…………………………………………………………………………………………….
(2)
4. The nutritional information for two breakfast cereals is shown below.
Weetabix per serving Shredded Wheat per serving
Protein 4.2g 5.2g
Carbohydrate 25.4g 30.4g
Fat 1.0g 1.0g
Fibre 3.9g 5.2g
Marathon runners need a diet high in carbohydrate and protein, but low in fat.
(a) Draw composite bar charts to display these data on the grid opposite.
(2)
(b) Which of the two breakfast cereals would you recommend a marathon runner to eat?
Explain your answer.
…………………………...………………………………………………………………..
…………………………...………………………………………………………………..
…………………………...………………………………………………………………..
(2)

Leave
blank
5
Edexcel GCSE Statistics: Specimen Paper 1H (Higher) Turn over
52.5
50
47.5
45
42.5
40
37.5
35
32.5
30
27.5
25Gra
ms
22.5
20
17.5
15
12.5
10
7.5
5
2.5
0

Leave
blank
6Edexcel GCSE Statistics: Specimen Paper 1H (Higher)
5. The table shows the attitudes to the teaching of basic skills in State secondary schools in
1987. This was just before the national curriculum was introduced.
3.13Attitudes to the teaching of basic skills in State
secondary schools: by age, 1987
Great Britain Percentages and numbers
How well do you think state secondary schools nowadays teach
young people basic skills, such as reading, writing and maths?
Very
well
Quite
well
Not
very
well
Not at
all
well
Don’t
know/
not
answered
Weighted base
(=100%)
(Numbers)
Age groups
(years)
18 – 24 19 59 14 8 0 174
25 – 34 11 58 24 7 � 238
35 – 44 12 47 31 9 1 252
45 – 54 7 45 36 12 � 202
55 – 64 7 37 41 15 1 181
65 and
over
7 30 42 17 3 195
All 10 46 31 11 1 1243
Source: British Social Attitudes Survey, 1987.
Social Community Planning and Research.
Social Trends 20, 1990. Table 3.13
(a) Write down the type of scale used for the horizontal measurements (Very well, quite well,
etc ...)
………………………………
(1)
(b) Write down the number of people surveyed.
.…………………………….
(1)

Leave
blank
7
Edexcel GCSE Statistics: Specimen Paper 1H (Higher) Turn over
The following statement is wrong:
“19% of those who said ‘very well’ were 18 – 24 years old”
(c) Write down a correct version of this statement.
..............................................................................................................................………...
..................................................................................................................................……...(1)
(d) Describe briefly what the table shows about how attitudes to the teaching of basic skills
in state secondary schools changes with age.
.............................................................................................................................................
...............................................................................................................................………..
.....................................................................................................................................……
(1)

Leave
blank
8Edexcel GCSE Statistics: Specimen Paper 1H (Higher)
6. The diagrams below show the distribution of the Golden Plover birds in the UK (Map A)
together with the maps B, C and D which show three possible factors that may influence
positively the distribution of Golden Plovers. Heavier shading implies greater density in
maps A and C, higher altitudes in map B and higher rainfall in map C.
Map A: Distribution of Golden Plover Map B: Altitude (feet)
Map C: Lowland Heath Map D: Annual Rainfall (mm)
By looking at the maps B, C and D, and comparing them to map A above, decide which of
the three factors are most likely to influence the distribution of Golden Plovers. Give a
reason for your answer.
…………………………………………………………………………………………………
…………………………………………………………………………………………………
(2)
Source: The Atlas of Breeding Birds of Britain and Ireland (BTO/IWC 1976), ISBN 0903793 01 6.

Leave
blank
9
Edexcel GCSE Statistics: Specimen Paper 1H (Higher) Turn over
7. The probability that a climber reaches the top of a particular crag when the ground is dry
underfoot is 5
4 . When the ground is wet underfoot, the probability that he reaches the top of
the crag is 10
1 . Past weather statistics from the crag show that the probability that it will be
wet underfoot on any particular day is 4
1 .
(a) Complete the tree diagram below.
Underfoot Climb
reaches the top
Dry
…….
……. fails to reach the top
reaches the top
…….
Wet
…….. fails to reach the top
(2)
(b) Find the probability that, on a day chosen at random, a climber makes it to the top of the
crag.
………………………………
(2)
(c) Given the climber makes it to the top of the crag, find the probability that the ground is
wet underfoot.
………………………………
(2)
54
101

Leave
blank
10Edexcel GCSE Statistics: Specimen Paper 1H (Higher)
8. Mary is carrying out an investigation into the cost of food at her college canteen.
She asks people in the queue for canteen food
“Do you agree that canteen food is value for money?”
(a) Why is her sample of people likely to be biased?
............................................................................................................................................…
..............................................................................................................................................
(1)
(b) Why is her question biased?
….........................................................................................................................................
(1)
(c) Suggest two reasons for her to carry out a pilot survey.
(i).................................................................................................................................…….
(ii)....................................................................................................................……………
(2)
For another investigation Mary selects a sample of 30 students from the 720 students at her
college.
(d) Describe how she would select a simple random sample.
.............................................................................................................................................
...................……………………..........................................................................................
………….............................................................................................................................
(2)

Leave
blank
11
Edexcel GCSE Statistics: Specimen Paper 1H (Higher) Turn over
9. 178 female and 220 male adult tortoises are weighed. The summary statistics of these data
are shown in the table below.
Tortoise
weight
(grams)
MinimumLower
QuartileMedian
Upper
QuartileMaximum
Female 155 520 615 718 964
Male 633 996 1121 1220 1390
(a) Draw two box plots to represent these data on the grid.
(4)
(b) Discuss how you might use the weight of an adult tortoise to infer whether it is male or
female.
….…………………………………………………………………………………………
….…………………………………………………………………………………………
….…………………………………………………………………………………………
….…………………………………………………………………………………………
….…………………………………………………………………………………………
(2)
TOTAL FOR SECTION A: 35 MARKS

Leave
blank
12Edexcel GCSE Statistics: Specimen Paper 1H (Higher)
Section B
Answer ALL EIGHT questions.
1. A teacher asks his class of 15 students to measure, to the nearest degree, an angle using a
protractor.
The values of the angles as measured by the students are shown below.
72�, 73�, 75�, 102�, 105�, 107�, 107�, 107�, 108�, 108�, 108�, 108�, 108�, 108�, 110�.
(a) Complete the stem and leaf diagram below.
Angles 10|8 means 108
7 2 3
8
9
10
11
(1)
(b) Write down the mode of these data.
…………………………..
(1)
(c) Find the median of these data.
…………………………..
(1)
(d) Find the interquartile range of these data.
…………………………..
(2)

Leave
blank
13
Edexcel GCSE Statistics: Specimen Paper 1H (Higher) Turn over
The teacher suspects that three of the students have read the wrong scale on their protractors.
The suspected wrong measurements are 72�, 75� and 73�.
(e) Are these measurements outliers? Justify your answer.
…………………………………………………………………………………………….
…………………………………………………………………………………………….
…………………………………………………………………………………………….
…………………………………………………………………………………………….
(2)
The teacher corrects these three measurements by subtracting them from 180�.
(f) Find the median of the new data set.
………………………
(2)
(g) The mean of the old data set was 86.7�. Without doing any further calculations, say
whether the new mean changed by more or less than the new median? Explain your
answer.
…………………………………………………………………………………………….
…………………………………………………………………………………………….
…………………………………………………………………………………………….
…………………………………………………………………………………………….
…………………………………………………………………………………………….
…………………………………………………………………………………………….
(2)

Leave
blank
14Edexcel GCSE Statistics: Specimen Paper 1H (Higher)
2. The bar chart below shows the goals scored by players playing in different positions for
Bude Hockey Club during the season 2002/03.
Goals scored by position
50
40
30
20
10
Num
ber
of
goal
s sc
ore
d
0
Def
ender
s
Mid
fiel
der
s
Att
acker
s
The breakdown of goals scored by Bude Hockey Club by position in 2001/02 is shown
below.
Defenders Midfielders Attackers
6 21 21

Leave
blank
15
Edexcel GCSE Statistics: Specimen Paper 1H (Higher) Turn over
(a) Draw two comparative pie charts to show the breakdown of goals scored by position in
2001/02 and 2002/03. Make the diameter of the 2001/2002 pie chart 6 cm. The size of
the 2002/2003 pie chart should reflect accurately the different number of goals scored in
2002/2003.
(4)
(b) Comment on two differences or similarities between the numbers of goals scored by
players playing in different positions for Bude Hockey Club in 2001/2002 and
2002/2003.
………………………………………………………………………………..…………...
…………………………………………………………………………………………….
(2)

Leave
blank
16Edexcel GCSE Statistics: Specimen Paper 1H (Higher)
3. The table shows the quarterly profits in £(millions) recorded at the end of each quarter in the
years 2001, 2002 and 2003 by a manufacturing company.
Quarter
1 2 3 4
2001 3.4 3.8 3.2 2.8
2002 3.2 3.6 3.2 2.6
Yea
r
2003 3.0 3.4 3.0 2.6
(a) Use the table given below to work out the four-point moving averages. The first one has
been worked out for you.
Year and QuarterQuarterly profits
(£ millions)4-point moving averages
2001 1 3.4
2001 2 3.8
(3.4 + 3.8 + 3.2 + 2.8) � 4 = 3.3
2001 3 3.2
2001 4 2.8
2002 1 3.2
2002 2 3.6
2002 3 3.2
2002 4 2.6
2003 1 3.0
2003 2 3.4
2003 3 3.0
2003 4 2.6
(3)

Leave
blank
17
Edexcel GCSE Statistics: Specimen Paper 1H (Higher) Turn over
(b) Complete the time-series graph below by plotting the moving averages and drawing in a
trend line.
2 .5
2 .7 5
3
3 .2 5
3 .5
3 .7 5
4
Y e a r a n d q u arte r
Quar
terl
y p
rofi
ts (
£ m
illi
ons)
1 2 3 4 1 2 3 4 1 2 3 4
2001 2002 2003
(3)
(c) Are profits going up or going down from January 2001 to December 2003? Explain
your answer.
…………………………………………………………………………………………….
…...……………….……………………………………………………………………….
(1)
(d) Find the equation of the trend line.
……………..………………
(3)

Leave
blank
18Edexcel GCSE Statistics: Specimen Paper 1H (Higher)
(e) Given that the mean seasonal effect for the first quarter is +0.05 millions, estimate the
profits at the end of the first quarter of 2004.
…..……….………………..
(2)

Leave
blank
19
Edexcel GCSE Statistics: Specimen Paper 1H (Higher) Turn over
4. The times taken by an operator at a call centre to answer each of 150 calls made during one
shift are shown in the table below.
Times (mins) Number of calls(f) Frequency density Mid-point x f � x
0 < x � 10 10 1 5 50
10 < x � 25 20
25 < x � 30 35
30 < x � 40 45
40 < x � 50 40
50 < x 0
Totals
(a) Complete the table above.
(3)
(b) Calculate an estimate of the mean time taken to answer a call.
………………………….
(2)

Leave
blank
20Edexcel GCSE Statistics: Specimen Paper 1H (Higher)
(c) Draw a frequency density histogram to represent these data.
8
7
6
5
4
3
2
1
0
5 10 15 20 25 30 35 40 45 50 55 60
Time (sec)
(2)
(d) Describe the skewness of the time taken to answer a call.
…………………………………………………………………………………………….
(1)
Fre
quen
cy d
ensi
ty

Leave
blank
21
Edexcel GCSE Statistics: Specimen Paper 1H (Higher) Turn over
5. Two students Paul and Jane did examinations in Mathematics and in English. Both
examinations were marked out of 100. The table below shows the marks they attained
together with mean and standard deviations of the overall marks in each subject. They wish
to see who did best in the examinations.
Mark Jane Mean Standard deviation
Mathematics 55 65 60 15
English 47 45 45 8
(a) Explain why the students standardised scores should be used.
…………………………………………………………………………………………….
…………………………………………………………………………………………….
…………………………………………………………………………………………….
(1)
(b) Work out Paul and Jane’s standard scores in Mathematics and English.
Paul: Maths…………………………English……………………………….
Jane: Maths…………………………English……………………………….
(3)
(c) Comment on the examination performance of the two students. Who did best overall?
………….…………………………………………………………………………………
…………………………………………………………………………………………….
…………………………………………………………………………………………….
…………………………………………………………………………………………….
…………………………………………………………………………………………….
(2)
Leave
blank
22Edexcel GCSE Statistics: Specimen Paper 1H (Higher)
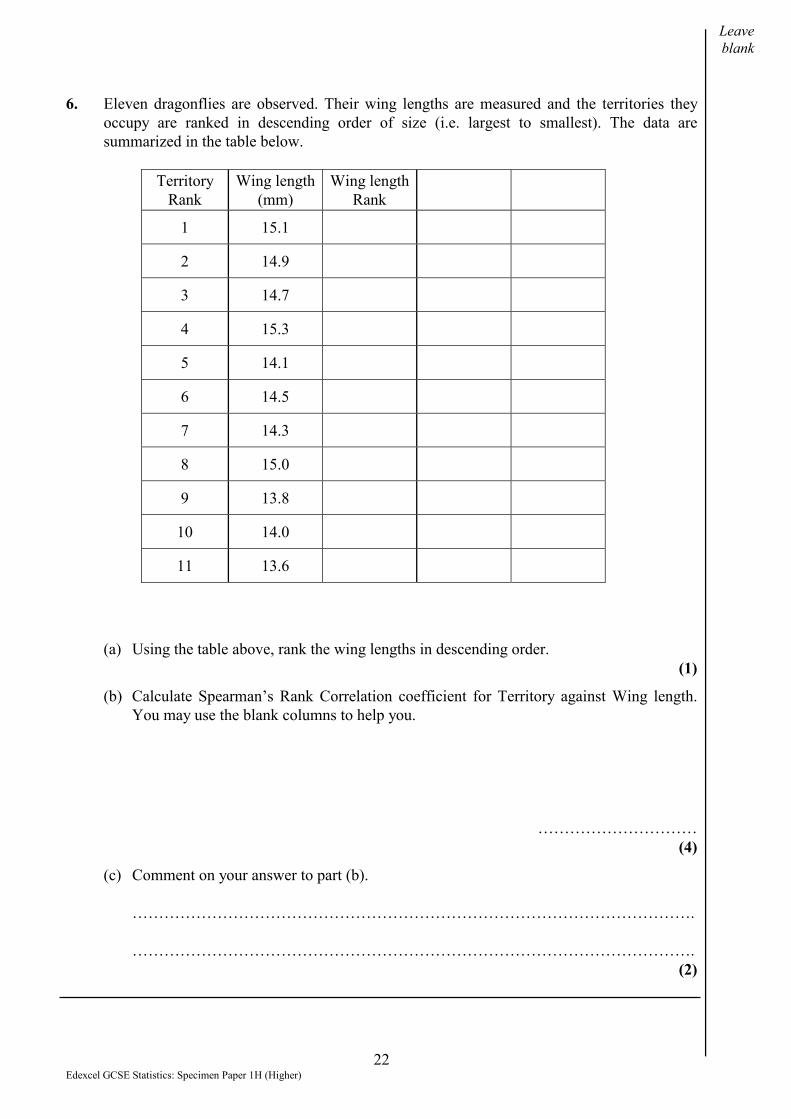
6. Eleven dragonflies are observed. Their wing lengths are measured and the territories they
occupy are ranked in descending order of size (i.e. largest to smallest). The data are
summarized in the table below.
Territory
Rank
Wing length
(mm)
Wing length
Rank
1 15.1
2 14.9
3 14.7
4 15.3
5 14.1
6 14.5
7 14.3
8 15.0
9 13.8
10 14.0
11 13.6
(a) Using the table above, rank the wing lengths in descending order.
(1)
(b) Calculate Spearman’s Rank Correlation coefficient for Territory against Wing length.
You may use the blank columns to help you.
…………………………
(4)
(c) Comment on your answer to part (b).
…………………………………………………………………………………………….
…………………………………………………………………………………………….
(2)

Leave
blank
23
Edexcel GCSE Statistics: Specimen Paper 1H (Higher) Turn over
7. A council estate has 120 houses. Of these houses, 36 have a video player and 50 have a
DVD player. 16 houses have both a video player and a DVD player.
(a) Draw a Venn diagram to show this information.
(2)
(b) Find the probability that a house chosen at random has a video player, a DVD player or
both.
………………………………….
(3)
(c) Two houses are chosen at random. Find the probability that neither house has both a
video player and a DVD player.
…………………………………
(3)

Leave
blank
24Edexcel GCSE Statistics: Specimen Paper 1H (Higher)
8. A manufacturer of electrical motors is making the central motor shafts. The target diameter of
the shafts is 38 mm. Samples of the shafts are taken at half-hourly intervals. The machine on
which the shafts are produced is such that the mean size of the samples is normally distributed
with a mean value of 38 mm and a standard deviation of 0.26 mm.
(a) Calculate the warning and action limits if these are set so that 95% of the samples means
are to fall within the warning limits and 99.8% within the action limits.
Warning limits:………………………………………………..
Action limits:...………………………………………………..
(3)
(b) Explain why a control chart for range or variance would also be used by the manufacturer.
……………………………………………………………………………………………....
………………………………………………………………………………………………
(2)
(c) What action would be taken if a sample mean fell between the warning and action limits?
……………………………………………………………………………………………....
………………………………………………………………………………………………
(1)
(d) What action would be taken if a sample mean fell outside the action limits?
………………………………………………………………………………………………
………………………………………………………………………………………………
(1)
TOTAL FOR SECTION B: 65 MARKS

Leave
blank
25
Edexcel GCSE Statistics: Specimen Paper 1H (Higher) Turn over
BLANK PAGE
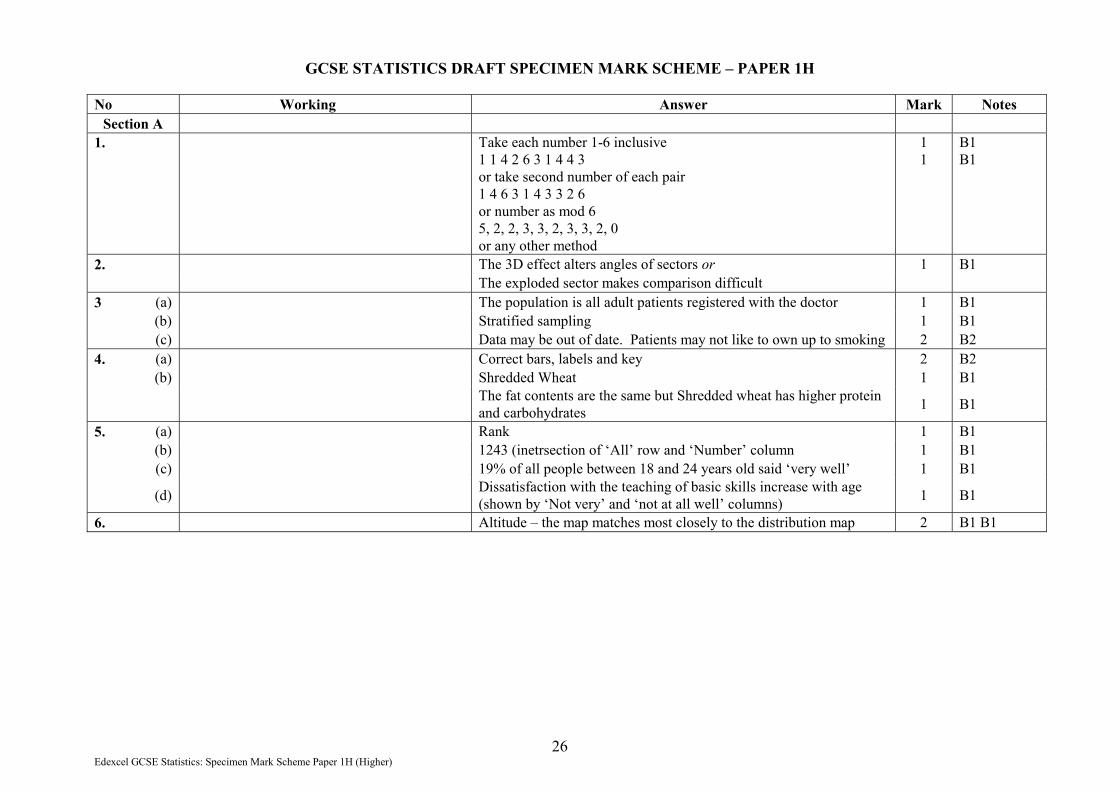
GCSE STATISTICS DRAFT SPECIMEN MARK SCHEME – PAPER 1H
26Edexcel GCSE Statistics: Specimen Mark Scheme Paper 1H (Higher)
No Working Answer Mark Notes
Section A
1. Take each number 1-6 inclusive
1 1 4 2 6 3 1 4 4 3
or take second number of each pair
1 4 6 3 1 4 3 3 2 6
or number as mod 6
5, 2, 2, 3, 3, 2, 3, 3, 2, 0
or any other method
1
1
B1
B1
2. The 3D effect alters angles of sectors or 1 B1
The exploded sector makes comparison difficult
3 (a) The population is all adult patients registered with the doctor 1 B1
(b) Stratified sampling 1 B1
(c) Data may be out of date. Patients may not like to own up to smoking 2 B2
4. (a) Correct bars, labels and key 2 B2
(b) Shredded Wheat 1 B1
The fat contents are the same but Shredded wheat has higher protein
and carbohydrates1 B1
5. (a) Rank 1 B1
(b) 1243 (inetrsection of ‘All’ row and ‘Number’ column 1 B1
(c) 19% of all people between 18 and 24 years old said ‘very well’ 1 B1
(d)Dissatisfaction with the teaching of basic skills increase with age
(shown by ‘Not very’ and ‘not at all well’ columns)1 B1
6. Altitude – the map matches most closely to the distribution map 2 B1 B1

GCSE STATISTICS SPECIMEN MARK SCHEME – PAPER 1H
Edexcel GCSE Statistics: Specimen Mark Scheme Paper 1H (Higher) 27
No Working Answer Mark Notes
7. (a)P(dry) = 1 –
4
3 =
4
1
P(dry) = 1 – 4
1 =
4
34
3and
4
12 B1
P(fails�dry) = 1 – 5
4
P(fails�dry) = 1 – 10
1 5
1 and
10
9B1
(b) ��
���
����
�
���
��
10
1
4
1
5
4
4
3
8
5 or
16
10 or 0.625 2 M1 A1
(c) ��
���
���
5
3
40
1
40
1
25
1 or 0.04 2 M1 A1
8. (a)Likely to be not representative, students who dislike the canteen will
eat elsewhere1 B1
(b)This is a leading question – the respondent is invited to agree with
interviewer1 B1
(c)To test if the questions are clear. To see if the information collected
is what is required2 B1 B1
(d)Allocate a unique number to each member of population. Use
random numbers to select sample2 B1 B1
9. (a) Labels, boxplots. 4 B1 B1
Correct points for each B1 B1
(b) Male generally heavier than females 2
Below 633 g fairly sure female (could accept up tp 750 g) B1
Above 964 g fairly sure male (could accept down to 850 g) B1

GCSE STATISTICS DRAFT SPECIMEN MARK SCHEME – PAPER 1H
28Edexcel GCSE Statistics: Specimen Mark Scheme Paper 1H (Higher)
No Working Answer Mark Notes
Section B
1. (a) 7�5, 10�2 5 7 7 7 8 8 8 8 8 8 and 11�0 1 B1
(b) 108 (greatest frequency) 1 B1
(c) 107 (middle value) 1 B1
(d) 108 � 102 6 2 M1 A1
(e) 102 � 9 = 93 Outliers are less than LQ � 12
1 IQR, 72, 75 and 73 are outliers 2 M1 A1
(f)New data 102, 105, 105, 107, 107, 107, 107,
108, 108, 108, 108, 108, 108, 108, 110 108 (middle value of new data) 2 B1 B1
(g) More; mean is more affected by extreme values than median 2 B2
2. (a) 2002/2003: (Defenders) 48
6 � 360 = 45�,
(Midfield or Attackers) 48
21� 360 = 157.5�, 45�, 157.5� on pie chart 2 M1 A1
2001/2002:
Defenders 60
9 � 360 = 54�,
(Midfield) 60
12 � 360 = 72�
(Attackers) 60
39 � 360 = 234�,
Diameter = ��
���
�� 26
43
60 = 6.7 cm
6.7 cm, 54�, 720�, 234� on pie chart 2 M1 A1
(b)Fewer goals were scored in 2001/2002. The proportion scored by
attackers was much smaller2 B1 B1

GCSE STATISTICS SPECIMEN MARK SCHEME – PAPER 1H
Edexcel GCSE Statistics: Specimen Mark Scheme Paper 1H (Higher) 29
No Working Answer Mark Notes
3. (a)Next moving average =
(3.8 + 3.2 + 2.8 + 3.2)/43.25 3 M1
other moving averages = 3.2, 3.2, 3.15, 3.1, 3.05, 3.0, 3.0. A1 (3 corr.)
A1 (All)
(b) Plot points correctly 3 B2
Trend line B1
(c) y = ax + b, b = 3.4 from graph Profits are decreasing since moving averages decrease 1 B1
(d) A = 1
1 4.3
x
y � (for some (x1, y1)) = � 0.04 y = � 0.04x + 3.4 (Tolerance for a: 0.005: tolerance for b: 0.05) 3 M1 M1 A1
(e) 2.9 + 0.05 £2.95 million 2 M1 A1
4. (a) FD: 1, 1.3, 7, 4.5, 4, 0. 3
Mid-point 5, 17.5, 27.5, 35, 45, 0 B1
f � x: 50, 350, 962.5 1575, 1800, 0. B1
Tots: 150, 17.8, 4737.5 B1
(b)50
5.473731.6 2 M1 A1
(c) Bars plotted correctly 2B1 (4 corr)
B1 (all corr)
(d) Negative Skew 1 B1

GCSE STATISTICS DRAFT SPECIMEN MARK SCHEME – PAPER 1H
30Edexcel GCSE Statistics: Specimen Mark Scheme Paper 1H (Higher)
No Working Answer Mark Notes
5. (a) Standardised scores let you compare data from different distributions 1 B1
Paul: Maths � 0.3, Eng 0.625 M1 A1(b) St. Score =
dev.Stand.
MeanScore �
Jane: Maths 0.3, Eng � 0.6253
A1
Paul: Maths = 15
6055 � = � 0.3
English = 15
4547 � = 0.25
Jane: Maths = 15
6065 � = 0.3
English = 8
4545 � = 0
(c)Paul better than average at English, Jane at Maths, but Jane has no
negative values so has done better2 B1 B1
6. (a) Rank: 2, 4, 5, 1, 8, 6, 7, 3, 10, 9, 11 1 B1
(b)Diff: 1, 2, 2, 3, 3, 0, 0, 5, 1, 1, 0.
d 2 : 1, 4, 4, 9, 9, 0, 0, 25, 1, 1, 0
4 B1
B1
1320
5461
�
� 0.754M1
A1
(c) +ve correlation. The larger the wing span the larger the territory 2 B1 B1

GCSE STATISTICS SPECIMEN MARK SCHEME – PAPER 1H
Edexcel GCSE Statistics: Specimen Mark Scheme Paper 1H (Higher) 31
No Working Answer Mark Notes
7. (a) VP DVD
20 16 34
50
Venn Diagram. Correct numbers 2 B1, B1
(b) 20 + 16 + 34 = 70. Prob. = 12
7
120
70�
12
7 3 M1 M1 A1
(c) P(neither Video or DVD) = 120
16120 �
120
1043 M1
P(two houses) = 119
103
120
104� 0.75 or equivalent M1 A1
8. (a) W.L: 38 � 2 � 0.26. AL: 38 � 3 � 0.26 Warning limits 38.52 and 37.48. Action limits 38.78 and 37.22 3 M1 A1 A1
(b)Limits on mean depend upon standard deviation if it changes limits
are no longer valid.2 B1 B1
(c) A new sample would be taken immediately 1 B1
(d) The process would be stopped and machinery reset 1 B1

GCSE STATISTICS DRAFT SPECIMEN MARK SCHEME – PAPER 1H
32Edexcel GCSE Statistics: Specimen Mark Scheme Paper 1H (Higher)
Question Subject area Spec ref Mark AO1 AO2 AO3 AO4
Section A
1. Die simulation simulation 1(d) 2 2
2. 3D Pie misrepresenting data 2(b) 1 1
3. Doctors surgery sampling methods 1(c) 4 4
4. Breakfast cereals composite bar charts 2(b) 4 2 2
5. Teaching skills data analysis 2(a) 4 1 3
6. Golden Plover choropleth 2(b) 2 1 1
7. Climbing crags conditional probability 4 6 2 4
8. College canteensurvey design, sampling
strategy1(d) 6 6
8. Tortoises boxplots 2(d), 3 6 3 3
Section A total 35
Section B
1. Protractor angles
stem & leaf, mode,
median and range;
outliers
2(d) 11 2 6 3
2. Hockey comparative pie charts 2(b) 6 2 2 2
3. Prices in Guernsey moving averages 2(g) 12 3 7 2
4. Call centremean, histogram,
skewness2(d), 2(c) 8 5 2 1
5. Exam marks Standard scores 2(d) 6 3 3
6. Dragonflies Spearman’s 2(f), 3 7 5 2
7. Video/DVD player Venn diagrams 4 8 2 6
8. Elect. motor shafts Control charts 2(h) 7 3 4
Section B total 65
Totals 100 14 23 36 27
Max 16 30 43 30
Min 13 20 26 20