Embed Size (px)
Citation preview
1
ECONOMIC REFORMS, CAPITAL FLOWS AND MACRO ECONOMIC IMPACT ON INDIA
Narayan Sethi1
Abstract Capital flows are most helpful when the magnitude of those flows is steady and stable. The international capital flow such as direct and portfolio flows has huge contribution to influence the economic behavior of the countries positively. The present study attempts to explain the effects of private capital inflows (FINV) on some macro economic variables in India using the time series data between April 1995 to Dec. 2006. The study also examine the impact of international capital flows on economic growth, trends and composition and suggest policy implication thereof. Cointegration test confirms the presence of long-run equilibrium relationships between a few pair of variables like private capital inflows (FINV) and economic growth (IIP as proxy of GDP) and FINV and Exchange Rate (EXR). The Granger causality test shows unidirectional causality from FINV to Exchange Rate (EXR) and bi-directional causality from FINV and growth (IIP). Finally study found that Foreign Direct Investment (FDI) is positively affecting the economic growth, while Foreign Institutional Investment (FII) is negatively affecting the growth. The empirical analysis shows that FDI plays unambiguous role in contributing to economic growth. It concludes that capital inflows have not contributed much towards industrial production or economic growth. There are two reasons for this, one the amount of capital inflows to the country has not been enough. Two, the amount of capital that does flow in, is not utilized to its full potential
********* Key Words: Capital Flows, Financial crisis, capital account liberalization, emerging markets and financial integration
1 Doctoral Research Fellow, Dept. of Economics, University of Hyderabad, P.O – Central University, Hyderabad, Pin- 500046, (A.P), INDIA, Email- [email protected]
2
1. Introduction
The recent wave of financial globalization and its aftermath has been marked by a surge in international capital flows among the industrial and developing countries, where the notions of tense capital flows have been associated with high growth rates in some developing countries. Some countries have experienced periodic collapse in growth rates and financial crisis over the same period. It is true that many developing economies with a high degree of financial integration have also experience higher growth rate. Low Developing Countries (LDCs) are eager to welcome any kind of foreign capital inflows to overcome the debt crisis situation. They are facing the challenges from the foreign capital and the invisible resource. From the supply side also there are some strong inducing factors, which led the international investors towards the financial market of the developing countries. The correlation between the movements in developed and developing countries financial market, the deceleration in industrial economy markets and high growth prospects of the less developed market are some of the important reasons, which made them an attractive option for portfolio diversification.
It is fact that international capital flows on financial market can be very volatile. However, different countries experienced different degree of volatility of financial market and this may be systematically related to the quality of macro economic policies and domestic financial governance. In this context high volatility of capital flows has affected the macro economic variables such as exchange rate, interest rate, money stock (M3) and inflation negatively. Even in countries where a conducive atmosphere is created for the free flow of capital and authorities don’t operate with any current account deficit complicates the assessment of integration in financial market. Capital flows have significant potential benefits for economies around the world. Countries with sound macroeconomic policies and well-functioning institutions are their best to reap the benefits of capital flows and minimize the risks. Countries that permit free capital flows must choose between the stability provided by fixed exchange rates and the flexibility afforded by an independent monetary policy.
Capital flows have particularly become prominent after the advent of globalization that has led to widespread implementation of liberalization programme and financial reforms in various countries across the globe in 1990’s. This resulted in the integration of global financial markets. As a result, capital started flowing freely across national border seeking out the highest return. During 1991 to 1996 there was a spectacular rise in net capital flows from industrial countries to developing countries and transition economies. This development was associated with greatly increased interest by international asset holders in the emerging market economies to find trend toward the globalization of financial markets. The global financial markets can gradually create a virtuous circle in which developing and transitional economies strengthen the market discipline that enhances financial system soundness. At present, however, there are important informational uncertainties in global market as well as major gaps and inefficiencies in financial system of many developing countries.
Looking at the composition of capital flows, net foreign direct investment represents the largest share of private capital flows in the emerging markets. Net portfolio investment is also an important source of finance in the emerging markets, though these flows were more volatile after 1994. Until 1997 a market shift, in the composition of

3
capital flows to domestic financial market with a significant increase in net private capital inflows to financial markets and a decline in the share of official flows. Foreign Direct Investment (FDI) is the most stable capital. Both net portfolio investment and banking flows were volatile. Portfolio flows are rendering the financial markets more volatile through increased linkage between the domestic and foreign financial markets. Capital flows expose the potential vulnerability of the economy to sudden withdrawals of foreign investor from the financial market, which will affect liquidity and contribute to financial market volatility. One opinion that could be explored in the face of capital inflow surge is absorption by the external sector through capital outflows.
Financial markets are thrown open to Foreign Institutional Investors (FII’s) and there is convertibility of the rupee for FII’s both on current and capital account. Over the years, Indian capital market has experienced a significant structural transformation. Financial markets are significantly different from other markets; market failures are likely to be more pervasive in these markets and there exists Government intervention. Government interventions in the financial markets that promoted savings and the efficient allocation of capital are the central factor to the efficiency of financial markets
2. Literature Review
Lensik et al (1999) examine the impact of uncertain capital flows on the growth of 60 developing countries during the 1990’s. They distinguished between total capital flows, official capital flows and private capital flows. For the three types of capital flows, they derived a yearly uncertainty measure. They have used the yearly uncertainty measures in Ordinary Least Square (OLS) as we as Generalized Method of Moments (GMM) estimates, to explain the impact of uncertain capital flows on growth. They conclude that both types of estimates suggest that uncertain capital flows have a negative effect on financial market and growth in developing countries.
Rangrajan (2000) investigates the capital flows and its impact on the capital formation and economic growth taking into the variable as net private capital flows, net direct investment, net official flows, net portfolio investment and other net investments in 22 countries during 1992 to 2000. If capital inflows were volatile or temporary, the country would have to go through an adjustment process in both the real and financial market. Inflows, which take the form of direct foreign investment, are generally considered more permanent in character. Capital flows can be promoted purely by external factors which may tend to be less sustainable than those induced by domestic factors. Both capital inflows and outflows when they are large and sudden have important implication for economies. When capital inflows are large, they can lead to an appreciation of real exchange rate. He concludes that the capital account liberalization is not a discrete event.
Khanna (2002) examines the macro economic impact on Indian capital market as well as the corporate sector and what are the macro economic effects on inflows of capital to Indian and micro economic effects on the capital market during 1989 to 2002. He took the macro variable as FDI, FPI, NRI deposits, external assistance and GDP/GDS/GNP. He tells that entry of international capital flows helps to provide greater depth to the domestic capital market and reduce the systematic risk of the economy. He argues that advanced for liberalizing capital market for liberalizing capital market and
4
opening them to foreign investor are to increase the availability of capital with domestic industries and commercial firms. On the other hand, the Indian stock market is today largely dominated by a small group of FII’s, are able to move the market by large intervened. He concludes that in case of India, the microanalysis of stock market also fails to provide any evidence that the entry of FII has reduced the cost of Indian corporate sector.
Kohli (2003) examines how capital flows affect a range of economic variables such as exchange rates, interest rates of foreign exchange reserves, domestic monetary condition and financial system in India during the period 1986 to 2001. She has examines how capital inflows induce real exchange rate appreciation, stock market and real estate boom, real accumulation and monetary expansion as well as effects on production and consumption. She investigates the impact on capital flows upon the domestic financial sector in India. Inflows of foreign capital have a significant impact on domestic money supply and stock market growth, liquidity and volatility. At the conclusion, the domestic financial sector that is the banking sector and capital market in the event of a heavy inflow of foreign capital in India. Correlation between domestic and foreign financial market highlights India’s vulnerability to external financial shocks. For India on the relationship between portfolio flows and some stock market indicators suggest that market price are not unaffected by capital inflows. So far the difference between net capital inflows and current account deficit has been positive in India.
Chakraborty (2001) explain the effects of inflows of private foreign capital on some major macroeconomic variables in India using quarterly data for the period 1993-99. She analyses of trends in private foreign capital inflows and some other variables indicate instability. She has taken the net inflows of private foreign capital as well as macro economic variables foreign currency assets, wholesale price index, money supply, real and nominal effective exchange rates and exports. The Cointegration test confirms the presence of long-run equilibrium relationships between a few pairs of variables. But the dependence of each variable on private capital flows invalidates such cointegration except in two cases: cointegration exists between foreign currency assets and money supply and between nominal effective exchange rate and exports, even after controlling for private capital flows. The Granger Causality Test shows unidirectional causality from private capital flows to nominal effective exchange rates- both trade-based and export-based-, which raises concern about the RBI strategy in the foreign exchange market. Finally, instability in the trend of foreign currency assets could be partially explained by the instability in private capital flows with some lagged effect.
Kaminsky(2003) examine the characteristics of international capital flows since 1970 and summarizes some of the findings of the research conducted in the 1990’s on the effects of globalization. Even if international capital flows do not trigger excess volatility in domestic financial market, it is till true that large capital flows can spark off inflation in the presence of fixed exchange rate. He said globalization allows capital to more to its more attractive destination, fueling higher growth. He suggests that in the short run, globalization triggers bankruptcy of the financial system and protracted recession. The exploration of capital flows to emerging markets in the early and mid 1990’s and the recent reversal following the crisis’s around the globe have ignited once again a heated debate on how to manage international capital flows. He indicates capital outflows worry

5
policy makers, but so do capital inflows as they may trigger bubbles in asset market and foster an appreciation of the domestic currency and a loss of competitiveness.
3. Economic Reforms, Capital Flows and Economic Growth in India 3.1. Capital Flows and Economic Growth in India
Capital flows into India have been predominantly influenced by the policy environment. Recognizing the availability constraint and reflecting the emphasis on self-reliance, planned levels of dependence on foreign capital in successive Plans were deliberately held at modest levels. Economy in the recourse to foreign capital was achieved through import substitution industrialization in the initial years of planned development. The possibility of exports replacing foreign capital was generally not explored until the 1980s. It is only in the 1990s that elements of an export-led growth strategy became clearly evident alongside compositional shifts in the capital flows in favour of commercial debt capital in the 1980s and in favour of non-debt flows in the 1990s. The approach to liberalization of restrictions on specific capital account transactions, however, has all along been against any "big-bang".
India considers liberalization of capital account as a process and not as a single event. While relaxing capital controls, India makes a clear distinction between inflows and outflows with asymmetrical treatment between inflows (less restricted), outflows associated with inflows (free) and other outflows (more restricted). Differential restrictions are also applied to resident’s vis-à-vis non-residents and to individuals’ vis-à-vis corporate and financial institutions. The control regime also aims at ensuring a well diversified capital account including portfolio investments and at changing the composition of capital flows in favour of non-debt liabilities and a higher share of long-term debt in total debt liabilities. Thus, quantitative annual ceilings on external commercial borrowings (ECB) along with maturity and end use restrictions broadly shape the ECB policy. Foreign direct investment (FDI) is encouraged through a progressively expanding automatic route and a shrinking case-by case route. Portfolio investments are restricted to select players, particularly approved institutional investors and the NRIs. Short-term capital gains are taxed at a higher rate than longer-term capital gains. Indian companies are also permitted to access international markets through GDRs/ADRs, subject to specified guidelines. Capital outflows (FDI) in the form of Indian joint ventures abroad are also permitted through both automatic and case-by-case routes. The Committee on Capital Account Convertibility (Chairman: Shri S.S. Tarapore,2006) which submitted its Report in 2006 highlighted the benefits of a more open capital account but at the same time cautioned that capital account convertibility (CAC) could cause tremendous pressures on the financial system. To ensure a more stable transition to CAC, the Report recommended certain signposts and preconditions of which the three crucial ones relate to fiscal consolidation, mandated inflation target and strengthened financial system.
3.2. Importance of the Foreign Capital Flows The purpose of the flow of capital to underdeveloped countries is to accelerate their economic development upto a point where a satisfactory growth of rate can be achieved on a self sustaining basis. Capital flows in the form of private investment, foreign investment; foreign aid and private bank lending are the principle ways by which

6
resources can come from rich to poor countries. The transmission of technology, ideas and knowledge are other special types of resource transfer.
When discuss about the constraints of economic growth, one should referred to the saving gap and foreign exchange gap of the country. A net capital inflow contributes to the filling of the both the gaps. The capital flow of countries increases due to the amount of resources available for capital formation above what can be provided by domestic savings. It also raises the recipient economy’s capacity to import goods: capital flow provides foreign exchange and eases the problem of making international payments.
Countries in early stages of development assumed to have a primary need for technical assistance and institution building and only limited need for capital assistance chiefly for infrastructure projects. As the need for capital assistance increases, the need for technical assistance shifts from general to more specific skills. The gradual increase in domestic savings and a growing capacity to attract private and other conventional foreign capital on non-concession ally term will progressively reduce the need for foreign aid. The assumption that need for foreign capital is temporary and limited is underlined several recipients in Latin America else where and expected attain rapid development in ten to fifteen years but it is recognized that in Asia and Africa, the need for capital flows will remain for a much longer time.
Theoretical and empirical research on the role of foreign capital in the growth process has generally yielded conflicting results. Conventionally, the two-gap approach justifies the role of foreign capital for relaxing the two major constraints to growth (Chenery and Bruno, 1962; McKinnon, 1964). In the neo-classical framework, however, capital neither explains differences in the levels and rates of growth across countries nor can large capital flows make any significant difference to the growth rate that a country could achieve (Krugman, 1993). In the subsequent resurrection of the two-gap approach, the emphasis has generally laid on the preconditions that could make foreign capital more productive in developing countries. The important preconditions comprised presence of surplus labor and excess productive demand for foreign exchange. With the growing influence of the new growth theories in the second half of the 1980s that recognized the effects of positive externalities associated with capital accumulation on growth, the role of foreign capital in the growth process assumed renewed importance. In the endogenous growth framework, the sources of growth attributed to capital flows comprise the spillovers associated with foreign capital in the form of technology, skills, and introduction of new products as well as the positive externalities in terms of higher efficiency of domestic financial markets, improved resource allocation and efficient financial intermediation by domestic financial institutions (de Mello and Thea, 1995; Bailliu, 2000). Since the spillovers and externalities associated with different forms of foreign capital could vary, a pecking order approach to the composition of capital flows is often pursued which helps in prioritizing the capital flows based on the growth enhancing role of each form of capital (Reisen, 2001; Razin, Sadka and Yuen, 1998). The dominant view on what drives cross-border capital flows is that marginal productivity of capital is higher in a country where capital is scarce.
3.3. Economic Reforms in India and Capital Flows After independence, India has a comparatively unrestricted financial system until the 1960’s when the government began to impose controls for the purpose of directing credit towards development programmes. Over the decade of the 1960’s, interest rate

7
restrictions and liquidity requirement were adopted and progressively tightened. Government established the state banks and nationalized commercial banks by the end of the decade. Through the 1970s and into the 1980s directed credit to rising share of domestic lending and interest rate. Subsidies became common for targeted industries, with the start of economic reforms in 1985, the government began to reduce financial controls, which were reinstated, and it began to realm ceiling on lending rates of interest.
Until reforms began in the late 1980s, international capital inflows and outflows were restricted by administrative controls, which had outright prohibition on the purchase of foreign asset by residents, direct investment by foreigners and private external borrowing. After the balance of payment difficulties in 1991, authorities began a gradual relax restriction in inward capital flows and currency convertible for current account transaction.
Over the last several years, restrictions on direct foreign investment, portfolio borrowing and foreign equity ownership have been relaxed. This was significant turn around reform banning foreign investment. Restrictions on the share of foreign enterprise for most sectors have been removed, and the upper bounds for automatic approval of direct and portfolio investment have been progressively raised. Foreign investment income is fully convertible to foreign currency for repatriation. External commercial borrowing has been relaxed but as regulated with respect of maturities and interest rate spreads. Effective restrictions continued on the acquisition of foreign financial assets by residents and on currency convertibility for capital account transaction. Recently these restrictions have been slightly eased to allow domestic resident to investment in foreign equities.
The experience of capital account liberalization elsewhere suggests that opening domestic financial markets to international capital flows exacerbates imprudent practice under weak regulation or regulatory forbearance. The large accumulation of reserves by RBI provides insurance against rapid capital outflows but at the loss of foreign interest earnings (Khanna, 2002).
The rapid liberalization of financially repressed economy often leads to large capital and rapid expansion of domestic financial market followed by a capital account crisis and economic contraction. The elimination of capital controls exposes domestic capital markets and macro economic policies to discipline of international capital market, starting a race between financial reforms and crash. Indian policy is following a determined gradual path towards economic liberalization and international integration. Following the liberalization of transaction on the current account, restrictions on capital inflows have been relaxed steadily with an emphasis on encouraging long-term investment and saving. The pattern of liberalization capital inflows in India has been the gradual raising of quantitative restriction on inflows and the size of flows that automatically approved. The gradual relaxation on restriction on capital outflows would logically follow, while restriction that discourages short-term inflow, which are the parts of current policy. Capital control means that the Government borrows on captive domestic financial market regardless of financial reforms on date. International financial integration typically leads to both inward and outward gross capital flows. Gross capital flows are indeed are much larger internationally then are net capital flows; with capital account, India could well experience a large outflow of domestic saving from high cost domestic financial intermediaries to international capital markets. The process of opening

8
the Indian economy to foreign capital inflows is not complete and making India more attractive to FDI require more than the relaxation of constraints on inflows and foreign ownership. Domestic policy distortions and regulatory uncertainty can inhibit investment inflows, perhaps significantly. Opening up capital account to outflow could also enhance FDI (Chitre, 1996).
The process was completed by the simultaneous evolution of factors encouraging the flow of private capital across the globe. The developments have stimulated a keen interest in understanding the nature and economic effects of capital flows as well as the appropriate policy responses to safeguard against financial instability that appears to be associated with the global movement of private capital.
3.3. Trends and Composition of Capital Flows into India The 1990’s saw a radical transformation in the nature of capital flow into India. From a mere absence of any private capital inflows till 1992 (expect those by Non-Resident Indians), today such inflows represent a dominant proportion of total flows. The official flows shown as external assistance, i.e grants and loans from bilateral and multilateral sources represented 75-80 per cent of flows till 1991. By 1994, this has come down to about 20 per cent and has further fallen to below 5 per cent by late 1990s (Chakrabarti, 2001). During the last 10 years, India has attracted more than US $ 40 billion of foreign investment (Table-1). At a time, when the flow of private capital to developing countries has shrunk considerably, private flows to India have strengthened, and are currently running at US $ 9 to 10 billion per year, of which more than 55 per cent constitute FDI and portfolio flows. As a matter of fact, there has been limited recourse to bank borrowing or floating of bonds abroad by Indian corporate sector, as RBI and government tried to limit access to such borrowings to few large private companies with high credit ratings, in a policy of limiting debt creating inflow. In some years though, such debt creating flows were significant and constituted about 40 per cent of inflows.
The liberalization of the portfolio investment led to a surge in inflow of capital for investment in the primary and secondary market for Indian equity and corporate (and subsequently sovereign) bond market. About 460 foreign institutional investors (FIIs) have been allowed to enter the Indian market and together have brought in more than US $ 14 billion GDR and ADR floated by Indian corporate sector brought in the remaining portfolio inflows.
Table-1 provides an overview of the total foreign capital that India attracted during the 1992-2006 period. As the Table shows, India has attracted about $ 22 billion in portfolio investments since 1993-94 and more than $18 billion in FDI. These portfolio flows began in 1993 when India attracted more than $5 billion in few months and continued at the level of $ 2-3 billion per year till the Asian crises. The year 1998 witnessed a marginal out flow from the Indian stock market but soon the inflows went back to the US $ 2-3 billion per year level.
The first phase of stock market liberalization also saw many Indian companies issuing GDR and listing them on European exchanges like Luxembourg. As Table-2 shows the composition of capital flows during 1993-95 more than half of the portfolio investments were the Global Depository Receipts (GDR) floated by the Indian companies while the other half was FII investments.

9
TABLE-III.1 INDIA’S: COMPOSITION OF CAPITAL INFLOWS (US $ million)
Variable 1990-91 1991-92 1992-93 1993-94 1994-95 1995-96 1996-97 1997-98 1998-99 1999-00 2000-01 2001-02 2002-03
2003-04
2004-05
2005-06 1 2 3 4 5 6 7 8 9 10 11 12 13 14 15 16 17
Total Inflows (net) of which:(In percent) 7056 3910 3876
8895
8502
4089
12006
9844
8435
10444
10018
10573
12133
22112
31027
24693
1. Non Debt-creating inflows
1.5
3.4
14.3 47.6 57.9 117.5 51.3 54.8 28.6 49.7 67.8 77.1 46.6
72.5
46.7
81.7
a) Foreign Direct investment
1.4
3.3
8.1 6.6 15.8 52.4 23.7 36.2 29.4 20.7 40.2 58.0 38.5
21.1
18.0
31.1
b) Portfolio investment
0.1
0.1
6.2 41 42.1 65.1 27.6 18.6 -0.8 29 27.6 19.1 8.1
51.4
28.7
50.6
2. Debt creating-inflows
83.3
77.5
39.0 21.3 25 57.7 61.7 52.4 54.4 23.1 59.4 9.2 -10.7
1.4
30.6
29.9
a) External assistance
31.3
77.7
48.0 21.4 17.9 21.6 9.2 9.2 9.7 8.6 4.3 11.4 -20.0
-12.0
6.5
6.2
b)External commercial Borrowing #
31.9
37.2
-9.2
6.8
12.1
31.2
23.7
40.6
51.7
3
37.2
-14.9
-19.4
-8.4
16.3
7.8
c) Short term Credits
15.2
-13.1
-27.8 -8.6 46 1.2 7 -1 -8.9 3.6 1.0 -8.4 8.1
7.1
12.2
6.9
d) NRI Deposits ($)
21.8
7.4
51.6 13.5 2 27 27.9 11.4 11.4 14.7 23.1 26.0 24.6
16.4
-3.1
11.3
e) Rupee Debt-Service
-16.9
-31.7
-22.7 -11.8 -11.6 -23.3 -6.1 -7.8 -9.5 -6.8 -6.2 -4.9 -3.9
-1.7
-1.3
-2.3
3. Other Capital @ 15.2 19.1 45.8 31.1 17.1 -75.2 -13 -7.2 17 27.2 -27.2 13.7 64.1
26.1
22.7
-11.6
Total (1+2+3) 100 100 100 100 100 100 100 100 100 100 100 100 100
100
100
100 Memo Item: Stable flows * 84.7 112.9 121.6 67.6 53.3 33.7 65.4 82.4 109.7 67.4 68.2 88.1 84.5
85.6
59.1
42.5
# refers to medium and long terms borrowings. $ including NRNR deposits. @includes delayed export receipts, advance payment against imports, loans to non-residents by residents and banking capital. * Stable flows are defined to represent all capital flows excluding portfolio flows and short-term trade credits. Source: Report on Currency and Finance, 2005-06, RBI,

10
The FII investment was initially limited to a selected group of stocks and they were excluded from the growing market for bonds, and government securities. Their entry into the latter was permitted only in the late 1990s. The total amount of funds raised by India through GDR constituted roughly 40 percent of total inflows. However, during the second half of the 1990s there was a sharp declined in the funds raised through GDR and FII investment in the Indian equity (and recently bond market) became the main form of portfolio inflows (Khanna, 2002).Thus in a span of less than a decade, private foreign investment to India constitute more than 55 per cent of all flows. The total inflow of $ 22 billion as portfolio investment also constitutes a significant proportion of the total market capitalization in India.
The Indian economy faced first time a comfortable foreign exchange position. The rising reserves also reduced the vulnerability of the economy to minor shocks and also brought in large amount of investments from Non-Resident Indians (NRIs). The liberalization of gold imports and over all trade liberalization led to a sharp decline in capital flight and the black market premium on foreign exchange disappeared. This led to a diversion of transfer payments (mainly remittances from workers abroad) from illegal to banking channels. The transfer payments rose sharply from $ 2-3 billion in 1991-92 to $ 11-13 billion by the end of the decade 1999-2000.
TABLE-III.2 CAPITAL FLOWS INTO INDIA AFTER 1990’S (Yearly) US $ million
Year FDI FPI FII NRI ADR/GDR TCF
1990-91 97 6 - - -
103
1991-92 129 4 - - - 133 1992-93 315 244 1 42 240 559 1993-94 586 3567 1665 89 1520 4153 1994-95 1314 3824 1503 171 2082 5138 1995-96 2144 2748 2009 169 683 4892 1996-97 2821 3312 1926 135 1366 6133 1997-98 3557 1828 979 202 645 5385 1998-99 2462 -61 -390 179 270 2911 1999-00 2155 3026 2135 171 768 5181 2000-01 4029 2760 1847 67 831 6789 2001-02 6130 2021 1505 35 477 8151 2002-03 5035 979 377 NA 600 6014 2003-04 4673 11377 10918 NA 459 16050 2004-05 5653 9313 8684 NA 613 14966 2005-06 7751 12492 9926 NA 2552 20243 2006-07p 19531 7003 3776 NA 3225 26534 Source: Hand Book of Statistics on Indian Economy, Reserve Bank of India (RBI) @1 FIIs, NRI, and GDR are introduced in 1993 September, so data before the 1993 is not available. TCF2; Total Capital Flows, P3: Projection value.

11
GRAPH-III.1 Trends of Capital Inflows into India
Capital flows into India
-5000
0
5000
10000
15000
20000
25000
30000
1990
-91
1991
-92
1992
-93
1993
-94
1994
-95
1995
-96
1996
-97
1997
-98
1998
-99
1999
-00
2000
-01
2001
-02
2002
-03
2003
-04
2004
-05
2005
-06
2006
-07p
YEARS
FDI,
FPI,
FII,
NRI,
GDR/A
DR &
TCF
FDIFPIFIINRIADR/GDRTCF
4. The Study
4.1. Research Issues
In this context, our earlier discussion arises the question whether the international capital flows have been successfully increasing the growth of the economy and in particular whether they have lead to greater efficient financial markets. That is what provides the motivation for the present study. The present study tried to make a preliminary attempt to test whether international capital flow helps to integrate domestic financial markets with international financial markets and also whether international capital flows has the positive impact on financial market and economic growth with the help of macro economic variables in the economy. Hence, the financial sector reforms to revive the capital markets helped to attract the capital flows due to comparative returns. The second-generation reforms now need to be tailored to further enhance the capital flow by opening up the insurance sector, allowing the pension funds to invest in equities, and mutual funds to invest in global financial market. The objective of this study is to observe and analyze the dynamics of some selected macroeconomic indicators in relation to the inflows of private foreign capital as a consequence of economic reforms in India and impact of capital flows on economic growth in India. The study also examines the trends and composition of capital flows into India. The study tries to address the following questions:
(1) What drives capital flows? (2) How large our models will predict flows should be? How volatile? (3) What direction should they flow? (4) What form should capital flows take? Is there an “optimal composition” of global
capital flows? (5) What are potential welfare gains from open capital markets and had they been
obtained? (6) What prevents capital flows? (7) Why gross flows are large and net flows small? Why flows so volatile?
12
(8) What are the perceived failures of the global capital market and how could they be remedied?
4.2. Sample Design and Data Collection
The data for the study have been collected from the secondary source such as Handbook of Statistics in Indian Economy (RBI) and International Financial Statistics (IFS), (IMF). The monthly data have been taken for the period from April 1995 to Dec. 2006. The data of the study are private foreign capital inflows (FINV), Foreign Direct Investment (FDI), Foreign Portfolio Investment (FPI), Foreign Institutional Investment (FII) money supply (M3), exchange rate (EXR), wholesale price Index (WPI), export (EXP), import (IMP), foreign exchange reserve (FOREX), rate of interest (RI) and index of industrial production (IIP). The index of industrial production (IIP) has taken as the proxy of GDP, though my study is based on monthly time series data, the monthly data of GDP is not available. The choice of IIP as a proxy for economic growth is for two other reason. First, IIP is significantly correlated with real GDP (0.97 with a significance level of 0.01) as well as with the real output of the services as a robust proxy for economic growth. Second, IIP is found to be reliable leading indicator of business cycles in India (Mazumdar, 2005). The period of study is constrained due to the unavailability of data after the liberalization period from 1991. So, the period of the study has been taken from April 1995 to December 2006. 4.3 Methodology The methodology have employed in this paper such as ordinary least square method (OLS) to examine the impact of private foreign capital inflow on economic growth. Cointegration test has used to find the presence of long run relationship between the variables. The Granger Causality test used to look the unidirectional and bi-directional relationship among the variable.
5. Results
This section empirically analyses the effects private capital inflows on some of the major macro economic variables in India using the monthly time series data for the period April, 1995 to Dec. 2006. We try to understand if the observed fluctuations in the time-series of some macroeconomic variables viz., interest rate, wholesale price index, money supply, exchange rates, exports, import and foreign exchange reserve as reported theoretically in the earlier, can be explained in relation to the fluctuations in the time series of inflows of foreign capital. Research done over the past decades shows that before indulging in any econometric modeling using time-series data, one should be concerned about the problem of non-Stationarity or unit root problem. Results from a regression exercise involving non-stationary data is observed to be spurious (Granger and Newbold, 1974 and Granger, 1981). Therefore, the following empirical analysis is carried out in the light of the recent developments in the time series analysis.
In first stage, Stationarity of series on each variable is examined using both Dickey-Fuller test and Augmented Dickey-Fuller tests. The Dickey-Fuller test involves estimating regression equation and carrying out the hypothesis test. To show the Dickey-Fuller (DF) test, the AR (1) process is shown.

13
Yt = α+ ρ.Yt-1+εt………………………….. (5.2)
Where α and ρ are parameters and εt is a white noise. Y is stationary, if -1<ρ<1. if ρ= 1, y is non stationary. if the absolute value of ρ is greater than one (ρ > 1), the series is explosive. Therefore, the hypothesis of a stationary series involves in whether the absolute value of ρ is strictly less than on (ρ < 1). The test is carried out by estimating an equation with Yt-1 subtracted from both sides of equations.
∆Yt = α + γ Yt-1 + εt……………………(5.3)
Where, γ = ρ – 1 and the null and alternative hypothesis are
H0: γ = 0
H1: γ >1 The t-statistics under the null hypothesis of a unit root does not have the
conventional t-distribution. Dickey-Fuller (1979) shows that the distribution is non-standard, and simulated critical values for the selected sample. Later Mackinnon (1991) generalizes the critical values for any sample size by implementing a much larger set of simulations.
One advantage of ADF is that it corrects for higher order serial correlation by adding lagged difference term on the right hand side. If the simple unit root test is valid only if the series is an AR(1) process. One of the important assumptions of DF test is that error terms are uncorrelated, homoscedastic as well as identically and independently distributed (iid).
Y∆ t = α +γYt-1+δ1 Y∆ t-1+ δ2 Y∆ t-2 +…..+ δp Y∆ t-p+ εt………….(5.4) This augmented specification is then tested for
H0: γ = 0
H1: γ >1 The results of various unit root tests namely DF and ADF tests are shown in table-1 below. All the tests suggest that not all the variables are having unit root at level. That means they are stationary at level. The DF and ADF tests are carried out using without trend and with trend option. In both the cases, results suggest that all the variables are stationary. However, the story is somewhat different in case of IIP variable. The ADF tests for IIP suggest that it is stationary at level with trend, where as DF tests indicate it is stationary. However, DF tests suggest that the IIP variable is stationary at level when trend is allowed, where as ADF test does not support it.
In the second stage, tests for cointegration are applied to examine if there exists any long-run equilibrium relationship between any pair of variables. A number of series are said to be cointegrated if they are non-stationary at the level and have same order of integration but there is at least a linear combination of these variables which is stationary. We have carried out cointegration test for each pair of variables having series

14
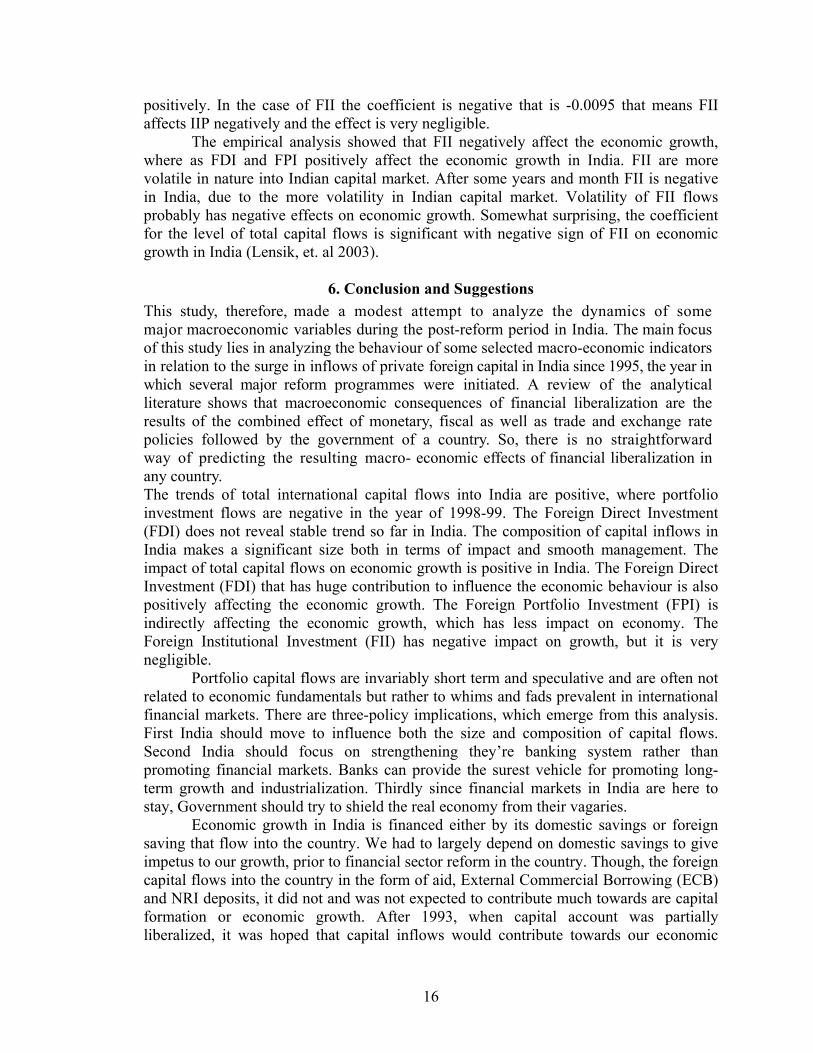
by making use of the methodology suggested by Engle and Granger (1987). The results are reported in Table 2. We find, following either the DF or ADF test results, that all the variables individually have cointegrating relationship with FINV. In addition, cointegration is observed between the following pairs of variables: FINV and M3, M3 and WPI, WPI and EXR, WPI and EXR, EXR and EXP, FOREX and EXP, RI and EXP, IIP and EXP. The results of cointegration test in the latter sequence of relations suggest that the long- run equilibrium relationship is restored between the following pairs of variables viz, private foreign capital flows and money supply, money supply and WPI, WPI and exchange rate, exchange rate and exports during the period 1995-2006. These long-run relationships, based on the observed data, reflect that the covariate fluctuations for the variables in each pair are correlated over time. These relationships, however, need to be analyzed carefully, because such cointegration relationship between variables in each pair breaks down in most of the cases when we include FINV as a third variable. The results of the test of cointegration, reported in Table 4, reveal that we fail to reject the null hypothesis of no cointegration in all the cases but with two exceptions. These two exceptional cases are (M3, FINV, IIP) and (EXR, FINV, EXP) where these two sets are observed to be cointegrated following the DF and ADF tests, respectively. The above results suggest that if we control for the variable FINV, no long-run equilibrium relationship holds between the variables for most of the above mentioned pairs of variables. These findings are indicative of the fact that the increased inflows of foreign capital in India since 1993 might account for the disturbances in the equilibrium relationship between a numbers of macroeconomic variables with a few exceptions. Exceptions, which follow from our study, are between economic growth ( I IP) and money supply and between exchange rate and exports.
The test of cointegration ignores the effect of the past values of one variable on the current value of the other variable. So, finally, we tried the Granger causality test to examine such possibilities. Since the reliability of results of the Granger causality test depends on whether the variables are stationary or not, we applied this test on the first difference which are reported to be stationary. It is well-known that Granger causality test is sensitive to the choice of lag length. To avoid this problem, as noted in Enders (1995) we have applied Akaike information criterion to choose the optimum lag length.
Granger’s test causality is also known as Weiner-Granger test, since its origin has been traced to Wiener. To explain Granger test, we will consider two stationary processes namely Yt and Xt are considered. The test involves estimating two regressions namely,
Yt = ∑=
n
i 1α i Xt-i + ∑
−
n
j 1β j Yt-j + u1t.........................(5.6)
Xt = ∑=
n
i 1
λ i Xt-i + ∑=
n
j 1δ j +Yt-j +u2t............................(5.7)
Equation (5.6) and (5.7) respectively postulate that current Y is related to past values of itself as well as that of X and a similar relation for X. In the above equations, α’s, β’s and δ’s are parameters. In this context it is possible to distinguish three cases: Unidirectional causality from X to Y is indicated if the estimated coefficients on the lagged X in equation (5.6) are statistically different from zero as a group (i.e. ∑αi≠0) and
15
set of estimated coefficients on the lagged Y in (equation (5.7)) is not statistically different from 0 (i.e. ∑δj=0). Feedback or bi-directional causality is suggested when X causes Y and Y causes X. In this case, the set of coefficient of X and Y are statistically significant different from zero in both regressions. Finally, independence is suggested when X does not cause Y and Y does not cause X that is, the set of coefficients are not statistically significant in both the regressions.
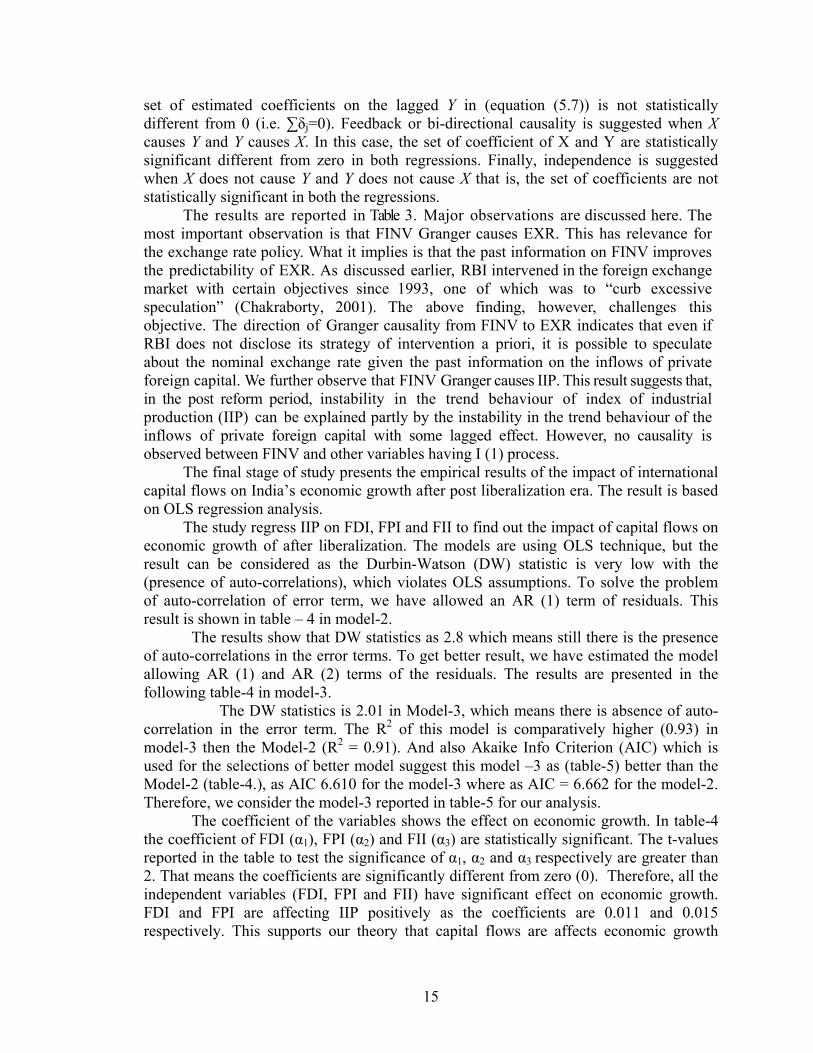
The results are reported in Table 3. Major observations are discussed here. The most important observation is that FINV Granger causes EXR. This has relevance for the exchange rate policy. What it implies is that the past information on FINV improves the predictability of EXR. As discussed earlier, RBI intervened in the foreign exchange market with certain objectives since 1993, one of which was to “curb excessive speculation” (Chakraborty, 2001). The above finding, however, challenges this objective. The direction of Granger causality from FINV to EXR indicates that even if RBI does not disclose its strategy of intervention a priori, it is possible to speculate about the nominal exchange rate given the past information on the inflows of private foreign capital. We further observe that FINV Granger causes IIP. This result suggests that, in the post reform period, instability in the trend behaviour of index of industrial production (IIP) can be explained partly by the instability in the trend behaviour of the inflows of private foreign capital with some lagged effect. However, no causality is observed between FINV and other variables having I (1) process.
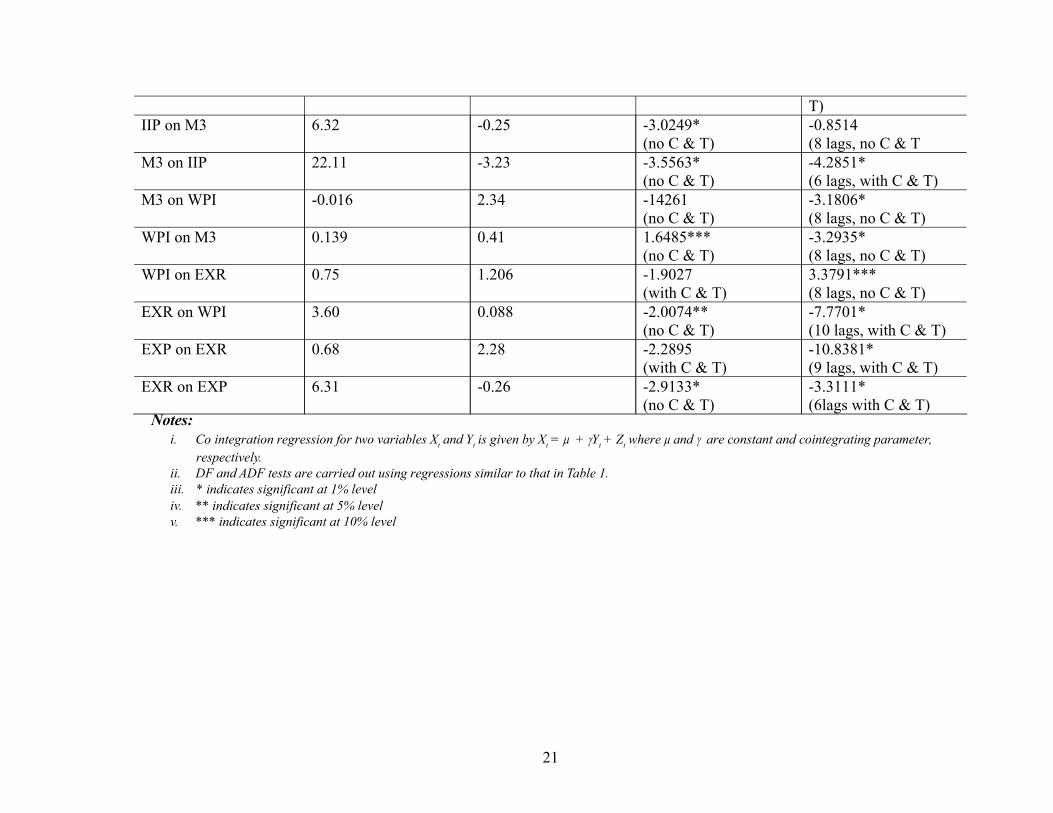
The final stage of study presents the empirical results of the impact of international capital flows on India’s economic growth after post liberalization era. The result is based on OLS regression analysis.
The study regress IIP on FDI, FPI and FII to find out the impact of capital flows on economic growth of after liberalization. The models are using OLS technique, but the result can be considered as the Durbin-Watson (DW) statistic is very low with the (presence of auto-correlations), which violates OLS assumptions. To solve the problem of auto-correlation of error term, we have allowed an AR (1) term of residuals. This result is shown in table – 4 in model-2.
The results show that DW statistics as 2.8 which means still there is the presence of auto-correlations in the error terms. To get better result, we have estimated the model allowing AR (1) and AR (2) terms of the residuals. The results are presented in the following table-4 in model-3. The DW statistics is 2.01 in Model-3, which means there is absence of auto-correlation in the error term. The R2 of this model is comparatively higher (0.93) in model-3 then the Model-2 (R2 = 0.91). And also Akaike Info Criterion (AIC) which is used for the selections of better model suggest this model –3 as (table-5) better than the Model-2 (table-4.), as AIC 6.610 for the model-3 where as AIC = 6.662 for the model-2. Therefore, we consider the model-3 reported in table-5 for our analysis.
The coefficient of the variables shows the effect on economic growth. In table-4 the coefficient of FDI (α1), FPI (α2) and FII (α3) are statistically significant. The t-values reported in the table to test the significance of α1, α2 and α3 respectively are greater than 2. That means the coefficients are significantly different from zero (0). Therefore, all the independent variables (FDI, FPI and FII) have significant effect on economic growth. FDI and FPI are affecting IIP positively as the coefficients are 0.011 and 0.015 respectively. This supports our theory that capital flows are affects economic growth
16
positively. In the case of FII the coefficient is negative that is -0.0095 that means FII affects IIP negatively and the effect is very negligible.
The empirical analysis showed that FII negatively affect the economic growth, where as FDI and FPI positively affect the economic growth in India. FII are more volatile in nature into Indian capital market. After some years and month FII is negative in India, due to the more volatility in Indian capital market. Volatility of FII flows probably has negative effects on economic growth. Somewhat surprising, the coefficient for the level of total capital flows is significant with negative sign of FII on economic growth in India (Lensik, et. al 2003).
6. Conclusion and Suggestions
This study, therefore, made a modest attempt to analyze the dynamics of some major macroeconomic variables during the post-reform period in India. The main focus of this study lies in analyzing the behaviour of some selected macro-economic indicators in relation to the surge in inflows of private foreign capital in India since 1995, the year in which several major reform programmes were initiated. A review of the analytical literature shows that macroeconomic consequences of financial liberalization are the results of the combined effect of monetary, fiscal as well as trade and exchange rate policies followed by the government of a country. So, there is no straightforward way of predicting the resulting macro- economic effects of financial liberalization in any country. The trends of total international capital flows into India are positive, where portfolio investment flows are negative in the year of 1998-99. The Foreign Direct Investment (FDI) does not reveal stable trend so far in India. The composition of capital inflows in India makes a significant size both in terms of impact and smooth management. The impact of total capital flows on economic growth is positive in India. The Foreign Direct Investment (FDI) that has huge contribution to influence the economic behaviour is also positively affecting the economic growth. The Foreign Portfolio Investment (FPI) is indirectly affecting the economic growth, which has less impact on economy. The Foreign Institutional Investment (FII) has negative impact on growth, but it is very negligible.
Portfolio capital flows are invariably short term and speculative and are often not related to economic fundamentals but rather to whims and fads prevalent in international financial markets. There are three-policy implications, which emerge from this analysis. First India should move to influence both the size and composition of capital flows. Second India should focus on strengthening they’re banking system rather than promoting financial markets. Banks can provide the surest vehicle for promoting long-term growth and industrialization. Thirdly since financial markets in India are here to stay, Government should try to shield the real economy from their vagaries.
Economic growth in India is financed either by its domestic savings or foreign saving that flow into the country. We had to largely depend on domestic savings to give impetus to our growth, prior to financial sector reform in the country. Though, the foreign capital flows into the country in the form of aid, External Commercial Borrowing (ECB) and NRI deposits, it did not and was not expected to contribute much towards are capital formation or economic growth. After 1993, when capital account was partially liberalized, it was hoped that capital inflows would contribute towards our economic

17
growth. It concludes that capital inflows have not contributed towards industrial production or economic growth. There are two reasons for this, one the amount of capital inflows to the country has not been enough. Two, the amount of capital that does flow in, is not utilized to its full potential (Mazumdar, 2005). References
(1) Agarwal, R.N (1997), “Foreign Portfolio Investment in Some Developing Countries: A Study of Determinants and Macro Economic Impact”, The Indian Economic Review, VOL.XXXII (2), PP- 217-229.
(2) Bhole L.M (1999) “Financial Market and Institution”, Tata – Mcgraw- Hill, 4th Edition. (3) Brenan, Micheal J and Henery, H (1997), “International Portfolio Investment Flows”,
Journal of Finance, VOL. LII. (5) PP, 151-93 (4) Chakrabarti, Rajesh (2001), “FII Flows to India: Nature and Causes”, Money and Finance,
VOL.2, Issue 7. Oct-Dec. (5) Chakraborty, Indrani. (2001), “Economic Reforms, Capital Inflows and Macro Economic
Impact in India”, CDS Working Paper, No.311 (6) Chakraborty, Indrani (2003), “Liberalization of Capital Flows and the Real Exchange Rate in
India: A VAR Analysis”, CDS Working Paper, No- 351, Sept. (7) Chitre, Vikas (1996), “Foreign Capital Flows and Financial Market in India”, Journal of
Foreign Exchange and International Finance, Vol, No 4, PP, 275-282. (8) Dicky, D.A and W.A Fuller (1981), “Like hood Ratio Statistics for Autoregressive Time
Series with a Unit Root”, Econometrica, 49, July, PP.1057-72. (9) Duttaray, Mousami, Dutt A.K and Mukhopadhyay, Kajol (2003), “The Relation between
Foreign Direct Investment and Growth: Causality and Mechanisms”, Asian Development Review, Vol, 83, PP, 369-75.
(10) Enders, Walter (1995), Applied Econometric Time Series, John Wiley & Sons. (11) Engle, R.F. and Granger, C.W.J. (1987), "Cointegration and Error- Correction:
Representation, Estimation and Testing", Econometrica, 55. (12) Granger, C.W.J. (1981), "Some Properties of Time-Series Data and Their Use in
Econometric Model Specification", Journal of Econometrics, 16. (13) Granger, C.W.J. and Newbold, P. (1974), "Spurious Regressions in Econometrics",
Journal of Econometrics, 2. (14) Kaminsky, Graciela (2005), “International Capital Flows, Financial Stability and
Growth”, DESA Working Paper, No.10, December (15) Khanna, S (1999), “Financial Reforms and Industrial Sector in India”, Economic Political
Weekly, Nov. 6, PP, 3231-38. (16) Khanna, Sushil (2002), “Has India Gained from Capital Account Liberalization? Private
Capital Flows and Indian Economy in the 1990’s”, Paper Presented at the IDEAS Conference, “International Money and Developing Countries”, Dec.16-19.
(17) Kohli, Renu (2001), “Capital Flows and Their Macro Economic Effects in India”, Working Paper ICRIER, No- 64, PP- 11-42.
(18) Kohli, Renu (2003), “Capital Flows and Domestic Financial Sector in India”, Economic Political Weekly, Feb. 22. PP-761-68.

18
(19) Lensik, R. Oliver, M. and Osei, R. (1999), “The Impact of Uncertain Capital Flows on Economic Growth in Developing Countries: An Empirical Analysis For the 1999’s”, Paper Presented in University of Groningen.
(20) Lucas, R.E (1990), “Why Does Capital Flows From Rich to Poor Countries”, American Economic Review, VOL.80, pp, 92-96.
(21) Mazumdar, T. (2005) “Capital Flows into India: Implications for its Economic Growth” Economic Political Weekly, May
(22) Mckibbin, W.J (2003), “International Capital Flows, financial Reform and Consequences of Changing Risk Perception in APEC Economies”, Paper Presented at Economic Studies Program, Massachusetts.
(23) Mishra, D. Mody, A. and Murshid, A.P. (2001), “Private Capital Flows and Growth”, A Quarterly Magazine of IMF, VOL.38, No (2).
(24) Pal, Parthapratim (1998), “Foreign Portfolio Investment in India Equity Market: Has the Economy Benefited?” Economic Political Weekly, March 14, PP- 589-98.
(25) Phillips, P. C.B and P. Perron (1988), “Testing for Unit Root in Time Series Regression” Biometrica, PP.335-46.
(26) Prasad, E. Rogoff, K. S.J Wei and M.A Kose (2003), “Effects of Financial Globalization on Developing Countries: Some Empirical Evidence”, Economic Political Weekly, VOL.38, Nov/ Oct 11-17. PP 4319-4330.
(27) Rangarajan, C (2000), “Capital Flows: Another Look”, Economic Political Weekly, Dec. 9, PP-4421-27.
(28) Rakshit, Mihir (1994), “Issues in Financial Liberalization”, Economic Political Weekly, Sept 24, pp, 2547-52.
(29) Reserve Bank of India, RBI (2006), Report on Currency and Finance, Govt. of India, India
(30) ___________, (2006), RBI Annual Report, Govt. of India (31) ______,(2006), Report on Currency and Finance, (32) S. S Tara pore, (2006) Report of Fuller Capital Account Convertibility (33) Shah, Ajay and Patnaik, Illa (2004), “India’s Experience with Capital Flows”, Paper
Published by Ministry of Finance India, December (34) Singh, A and Bruce, A.W (1998), “Emerging Stock Markets, Portfolio Capital Flows and
Long Term Economic Growth: Micro and Macro Economic Perspectives”, World Development, VOL.26, (4), PP-607-22.

19
APPENDICES
Table.1. Unit Root Test Results DF test ADF test
Variable (xt)
Levels 1st Difference Levels 1st Difference FINV -3.1930**
(with C) -4.6582* (no C & T)
-2.0690 (15 lags with C & T)
-1.6255*** (14 lags, no C & T)
M3 -3.2267 (with C & T)
-6.3117* (with C)
-2.3074 (15 lags, with C & T)
-2.8578*** (6 lags, with C)
WPI -3.0611** (With C)
-4.3871* (With C & T)
-3.1862 (15 lags, with C & T)
-4.5889* (9 lags, with C & T)
EXR -2.5224 (With C)
-7.5214* (no C & T)
1.5836 (15 lags, with C & T)
-2.8276 (12 lags, no C & T)
EXP -2.8085 (With C & T)
-8.0557* (with C)
1.7272 (15 lags, no C & T)
-1.2418 (12 lags, no C & T)
IMP -1.9683 (with C & T)
-5.3986* (no C & T)
-1.7740 (15 lags, no C & T)
-2.7765** 10 lags, no C & T)
FOREX 1.9669 (With C & T)
-6.1035** (no C & T)
-1.8982*** 11 lags, no C & T)
-4.0576* 10 lags, no C & T)
RI -4.672** (With C & T)
-4.22* (no C & T)
-5.5617* (15 lags, with C & T)
-2.1132 (12 lags, no C & T)
IIP -3.3121*** (with C & T)
-4.7181* (with C)
-5.5617* (15lags, with C & T)
3.2184 (10 lags, no C & T)
FDI -9.274* (with C & T)
-3,22** (with C)
-6.2812* (10 lags with C & T)
-1.254 (15 lags, no C & T)
FPI -3. 452 (with C)
-4.214* (no C & T)
-2.763* (15 lags no C & T)
-4.324** (6 lags, with C)
Notes: i. The critical values for unit root tests are 3.48%, 2.88% and 2.58% without trend and 4.03%, 3.44% and 3.14% with
trend at 1%, 5% and 10% level respectively. The numbers in parentheses represent optimal lags, which are selected automatically by E-Views using Schwarz info Criterion for ADF test and newly west method
ii. The figures reported in the table are t-values of parenthesis iii. ‘C’ stands for constant and ‘T’ stands for trend iv. * signifies statistically significant at 1 % level v. ** signifies statistically significant at 5 % level vi. *** signifies statistically significant at 10 % level

20
Table.2. Test for Pair-wise co integration
Equation: Xt on Yt µ γ DF ADF FINV on M3 6.45 0.12 -2.90*
(no C & T) -3.27* (1 lag, no C & T)
M3 On FINV 13.14 0.024 -2.26 (With C & T)
-0.9952 (3 lags, no C & T)
FINV on WPI 5.87 0.39 -2.89* (With C & T)
-3.2655* (1 lag, no C & T)
WPI on FINV 5.59 0.014 -1.38 (With C)
-5.491 (1 lag, with C & T)
FINV on EXR 5.29 0.254 -2.6125 (no C & T)
-2.1417** (5 lags, no C & T)
EXR on FINV 9.80 0.16 -1.6114 (no C & T)
-3.2052 (3 lag, with C & T)
FINV on EXP -13.73 5.26 -2.7195** (no C & T)
-2.16 (5 lags, no C & T)
EXP on FINV 4.03 0.015 -2.0771** (no C & T)
12.836* (10 lag, with C & T)
FINV on IMP -17.78 6.30 -2.7253* ( With C & T)
-6.1864* (10 lag, with C & T)
IMP on FINV 3.97 0.016 -2.1369** (no C & T)
-28.5731* (10 lag, with C & T)
FINV on FOREX 6.49 0.442 -3.0257* (no C & T)
-2.06660** (5 lags, no C & T)
FOREX on FINV 3.64 0.006 0.6929 (no C & T)
-0.7996 (8 lags, no C & T)
FINV on RI 6.56 0.428 -3.0268* (no C & T)
-2.0667** (5 lags, no C & T)
RI on FINV 3.62 0.006 -0.6599 (no C & T)
-3.3511 (3 lags with C& T)
FINV on IIP 3.87 0.418 -2.7207** (no C & T)
-2.1502** (5 lags, no C & T)
IIP on FINV 9.62 0.068 -2.4868 ( With C & T) -2.6298(4 lags, no C &
21
Notes: i. Co integration regression for two variables Xt and Yt is given by Xt = µ + γYt + Zt where µ and γ are constant and cointegrating parameter,
respectively. ii. DF and ADF tests are carried out using regressions similar to that in Table 1. iii. * indicates significant at 1% level iv. ** indicates significant at 5% level v. *** indicates significant at 10% level
T) IIP on M3 6.32 -0.25 -3.0249*
(no C & T) -0.8514 (8 lags, no C & T
M3 on IIP 22.11 -3.23 -3.5563* (no C & T)
-4.2851* (6 lags, with C & T)
M3 on WPI -0.016 2.34 -14261 (no C & T)
-3.1806* (8 lags, no C & T)
WPI on M3 0.139 0.41 1.6485*** (no C & T)
-3.2935* (8 lags, no C & T)
WPI on EXR 0.75 1.206 -1.9027 (with C & T)
3.3791*** (8 lags, no C & T)
EXR on WPI 3.60 0.088 -2.0074** (no C & T)
-7.7701* (10 lags, with C & T)
EXP on EXR 0.68 2.28 -2.2895 (with C & T)
-10.8381* (9 lags, with C & T)
EXR on EXP 6.31 -0.26 -2.9133* (no C & T)
-3.3111* (6lags with C & T)

22
Table.3. Pairwise Granger Causality Test Dependent Variable
Explanatory Variables
m n F-Statistics P-Value Remarks
FINV FINV,M3 1 1 1.09 0.31 No causality from M3 →FINV M3 M3,FINV 1 1 0.009 0.92 No causality from FINV → M3 FINV FINV, WPI 1 1 57 023 No causality from WPI →FINV WPI WPI, FINV 2 1 0.38 0.54 No causality from FINV → WPI FINV FINV, EXR 1 1 3.74 0.06 causality from EXR → FINV EXR EXR,FINV 1 1 2.14 0.16 No causality from FINV→ EXR FINV FINV,EXP 1 1 0.29 0.59 No causality from EXP → FINV EXP EXP,FINV 4 1 0.13 0.72 No causality from FINV → EXP FINV FINV,IMP 1 1 0.026 0.87 No causality from IMP→ FINV IMP IMP,FINV 1 1 0.41 0.53 No causality from FINV→ IMP FINV FINV,FOREX 1 1 0.075 0.78 No causality from FOREX→ FINV FOREX FOREX, FINV 1 1 6.79 0.02 No causality from FINV → FOREX FINV FINV,RI 1 1 2.28 0.15 No causality from RI → FINV RI RI,FINV 1 1 2.01 0.17 No causality from FINV → RI FINV FINV,IIP 1 1 3.005 0.10 causality from IIP → FINV IIP IP,FINV 1 1 2.27 0.12 causality from FINV → IIP IIP IIP,M3 1 1 1.06 0.3 No causality from M3 → FINV M3 M3,IIP 1 1 2.12 0.15 No causality from FINV → M3 M3 M3,WPI 1 1 0.49 0.49 No causality from M3 → WPI WPI WPI,M3 2 1 0.99 0.33 No causality from WPI→ M3 WPI WPI,EXR 2 1 2.33 0.14 No causality from EXR → WPI EXR EXR,WPI 4 1 1.16 0.29 No causality from WPI → EXR EXP EXP,EXR 1 2 2.15 0.16 No causality from EXR → EXP EXR EXR, EXP 1 4 2.04 0.17 No causality from EXP→ EXR Notes: Optimum lag lengths (m, n) are determined by minimizing the Akaike Information Criteria (AIC) by E-Views Package.
23
Table.4. Test for Cointegration
Notes: (i) Following results are based on regressions including a constant and a trend (ii) The results for ADF test correspond to 11 lags, the highest possible number of lags that can
be chosen for the given number of observation by E-Views. The null hypothesis of no cointegration is rejected in none of this case.
(iii) ** indicates significant at 5% level. Table.5. Impact of Capital Flows on Economic Growth
Variables
Model-1
Model-2
Model -3
C 184.2699 (4.7761)* 244.9976(1.2645)* 244.9976(1.2645)*
FDI 0.009901(2.2380)* 0.010115 (2.1250)*
0.011115(2.1250)*
FPI 0.016291 (4.1530)* 0.013070 (3.0979)* 0.015070(3.0979)*
FII -0.014096(3.2681)* -0.009313(-2.0570)* -0.009513(2.0570)*
AR (1) - 0.972040(34.9807)* 0.533676 (5.88)*
(AR (2) - - 0.453423(5.0096)* R2 = 0.919, Adjusted R- Squared = 0.916 for Model – 2 and R2 = 0.932, Adjusted R- Squared = 0.928 for Model-3.
DW-Statistic= 2.854, AIC = 6.662 for Model –2 and DW-Statistic = 2.017, Akaike Info Criterion (AIC) = 6.610 for Model-3.
Notes: i. Figure in brackets of table relate to t-value ii. * Indicates the t values are significant at 1 percent level iii. IIPt = α0 + α1 FDIt + α2 FPIt +α3 FII +ut regression equation.
Variables DF test ADF test FINV, M3, IIP -4.8560** -0.7400 FINV, M3, WPI -3.4596 -3.8497 FINV, WPI, EXR -1.9165 -1.0948 FINV, WPI, EXP -1.8686 -1.0545 FINV,M3,IMP -1.9000 -0.0209 FINV,RI, IMP -1.8856 0.0389 FINV, EXP, EXR -2.3841 -6.2334** FINV, EXP, FOREX -2.4095 -0.5647