Embed Size (px)
Citation preview
ECONOMIC IMPACTS OF CLIMATE CHANGE: A
REINSURANCE INDUSTRY PERSPECTIVEMark C. Bove, CPCU, ARe
Senior Research Meteorologist
Munich Reinsurance America, Inc.
AMS Short Course on Communicating the Costs of Climate Change
20 June 2017
Source: NPS
Agenda
Insurance, Reinsurance, & Natural Catastrophes
U.S. Natural Catastrophes Risk in a Warming Climate
Socioeconomics & U.S. Natural Catastrophe Risk
Insurance, Reinsurance, & Natural Catastrophes
U.S. Natural Catastrophes Risk in a Warming Climate
Socioeconomics & U.S. Natural Catastrophe Risk
2
3
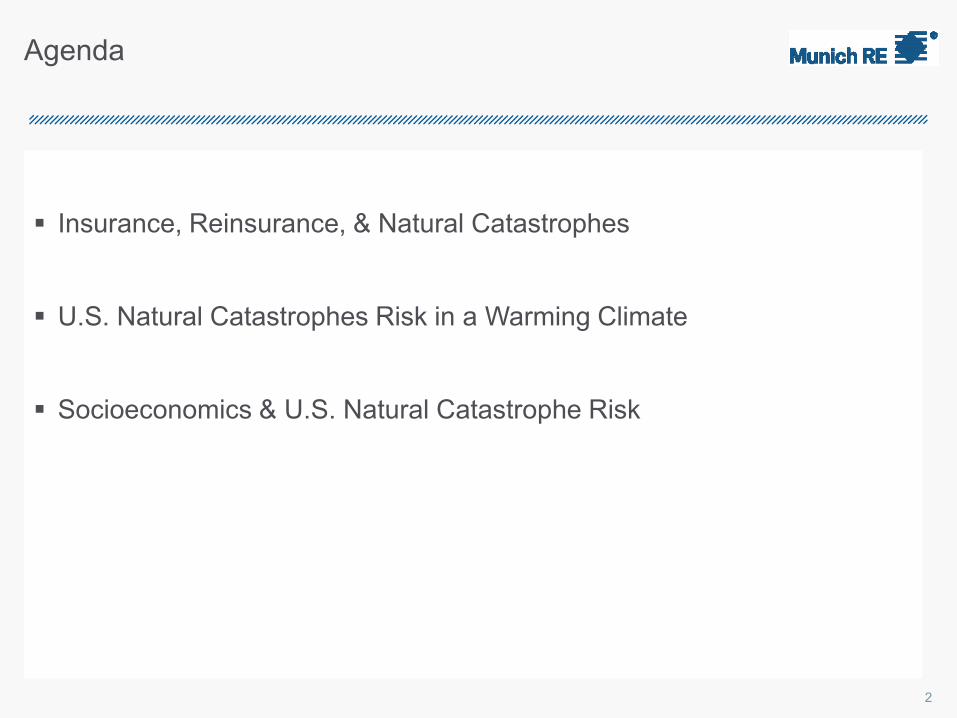
Hurricane Katrina
August 29, 2005 Source: Munich Re
Insurance, Reinsurance, & Natural Catastrophes
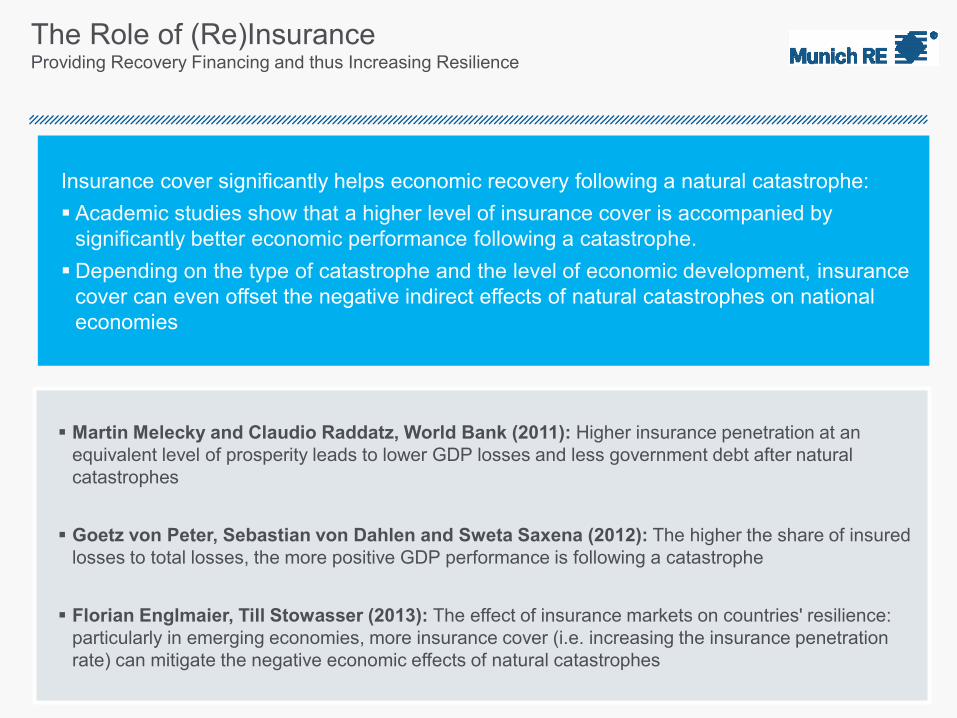
The Role of (Re)InsuranceProviding Recovery Financing and thus Increasing Resilience
Martin Melecky and Claudio Raddatz, World Bank (2011): Higher insurance penetration at an
equivalent level of prosperity leads to lower GDP losses and less government debt after natural
catastrophes
Goetz von Peter, Sebastian von Dahlen and Sweta Saxena (2012): The higher the share of insured
losses to total losses, the more positive GDP performance is following a catastrophe
Florian Englmaier, Till Stowasser (2013): The effect of insurance markets on countries' resilience:
particularly in emerging economies, more insurance cover (i.e. increasing the insurance penetration
rate) can mitigate the negative economic effects of natural catastrophes
Insurance cover significantly helps economic recovery following a natural catastrophe:
Academic studies show that a higher level of insurance cover is accompanied by
significantly better economic performance following a catastrophe.
Depending on the type of catastrophe and the level of economic development, insurance
cover can even offset the negative indirect effects of natural catastrophes on national
economies
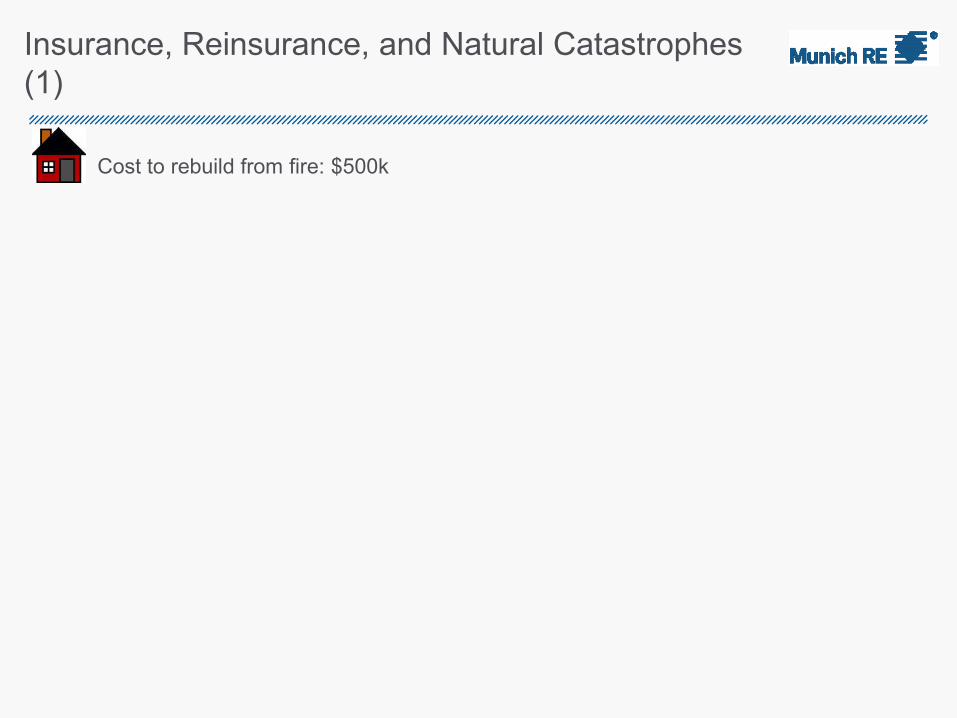
Insurance, Reinsurance, and Natural Catastrophes
(1)
Cost to rebuild from fire: $500k
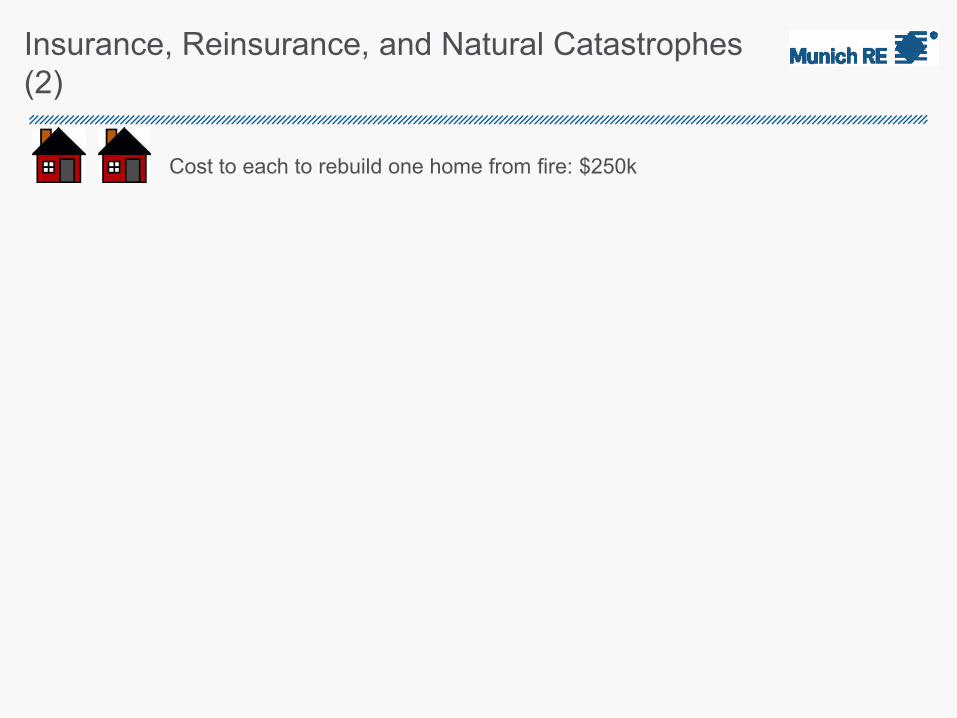
Insurance, Reinsurance, and Natural Catastrophes
(2)
Cost to each to rebuild one home from fire: $250k
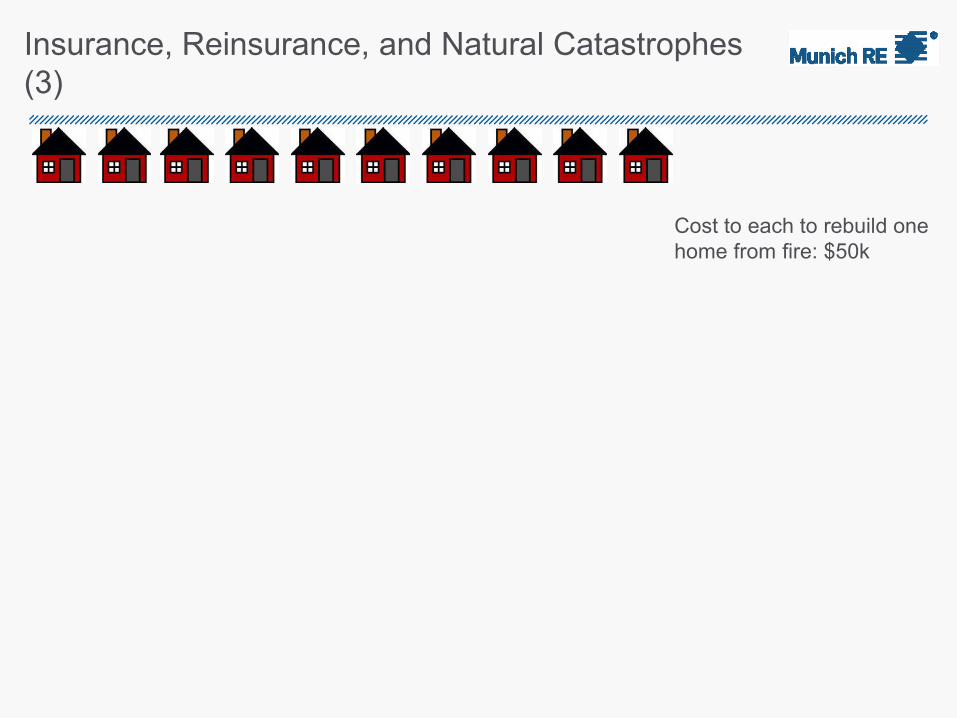
Insurance, Reinsurance, and Natural Catastrophes
(3)
Cost to each to rebuild one
home from fire: $50k
Insurance, Reinsurance, and Natural Catastrophes
(4)
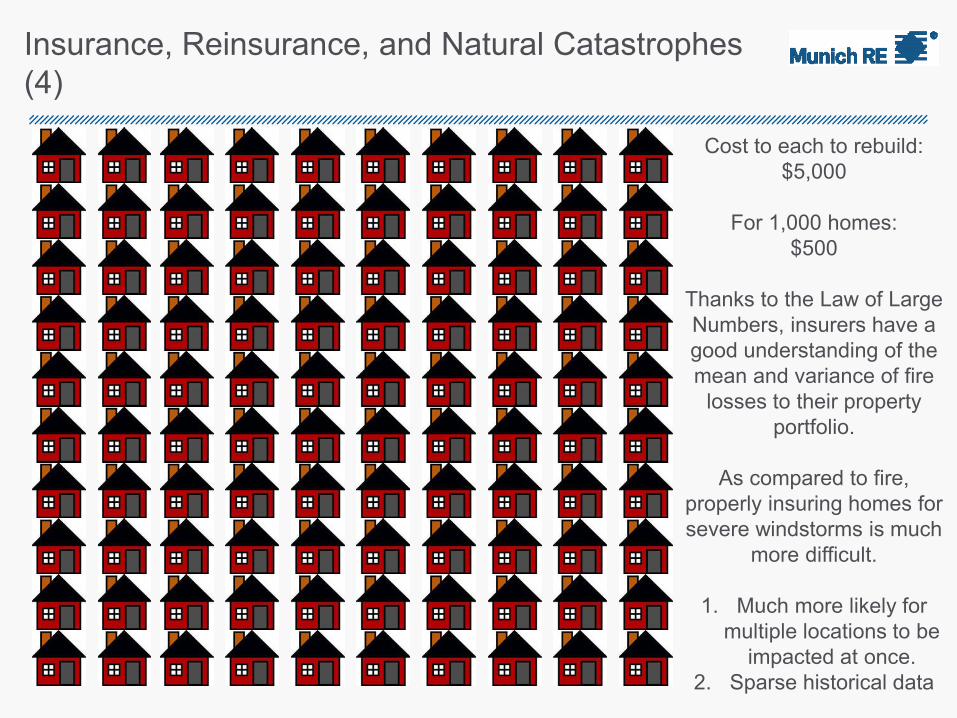
Cost to each to rebuild:
$5,000
For 1,000 homes:
$500
Thanks to the Law of Large
Numbers, insurers have a
good understanding of the
mean and variance of fire
losses to their property
portfolio.
As compared to fire,
properly insuring homes for
severe windstorms is much
more difficult.
1. Much more likely for
multiple locations to be
impacted at once.
2. Sparse historical data
Insurance, Reinsurance, and Natural Catastrophes
(5)
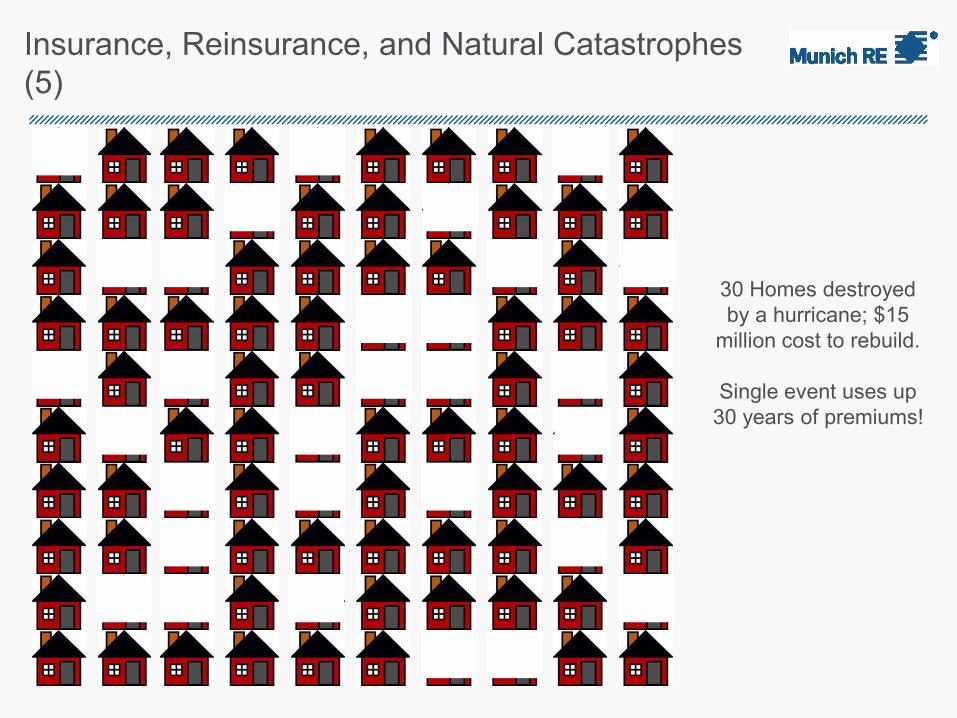
30 Homes destroyed
by a hurricane; $15
million cost to rebuild.
Single event uses up
30 years of premiums!
Insurance, Reinsurance, and Natural Catastrophes
(6)
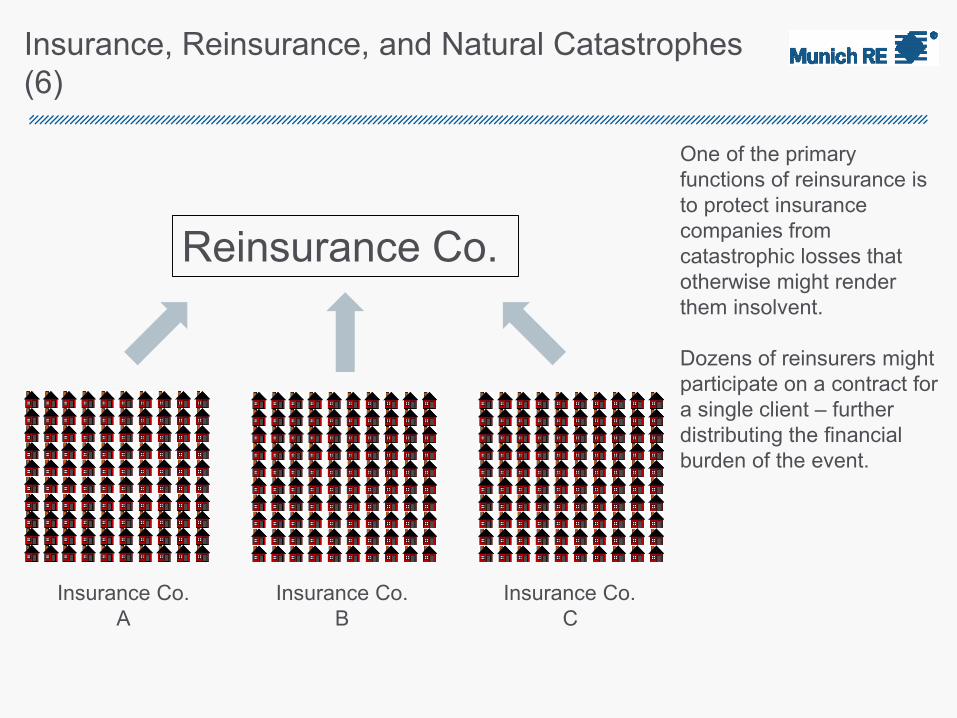
One of the primary
functions of reinsurance is
to protect insurance
companies from
catastrophic losses that
otherwise might render
them insolvent.
Dozens of reinsurers might
participate on a contract for
a single client – further
distributing the financial
burden of the event.
Insurance Co.
A
Insurance Co.
B
Insurance Co.
C
Reinsurance Co.
(Re)insurance & Climate Change
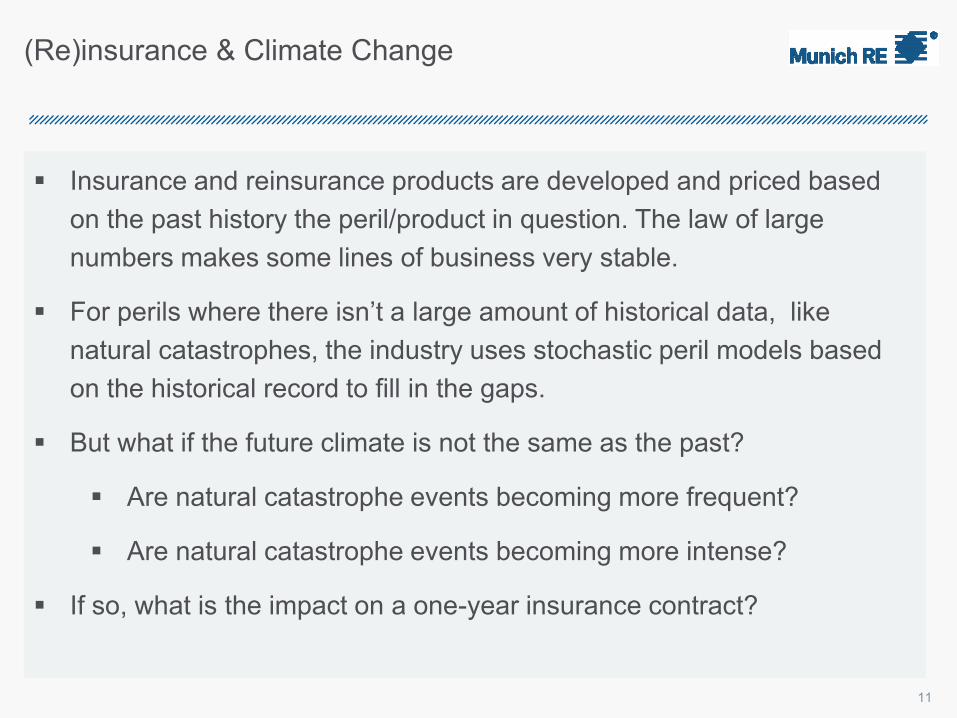
Insurance and reinsurance products are developed and priced based
on the past history the peril/product in question. The law of large
numbers makes some lines of business very stable.
For perils where there isn’t a large amount of historical data, like
natural catastrophes, the industry uses stochastic peril models based
on the historical record to fill in the gaps.
But what if the future climate is not the same as the past?
Are natural catastrophe events becoming more frequent?
Are natural catastrophe events becoming more intense?
If so, what is the impact on a one-year insurance contract?
11
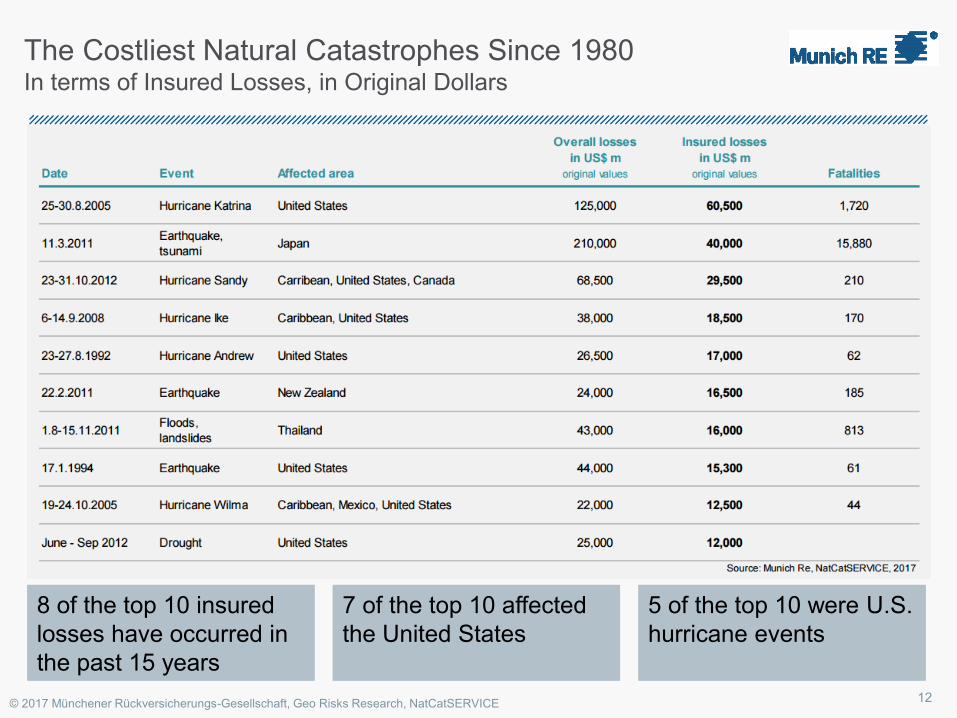
The Costliest Natural Catastrophes Since 1980In terms of Insured Losses, in Original Dollars
© 2017 Münchener Rückversicherungs-Gesellschaft, Geo Risks Research, NatCatSERVICE
8 of the top 10 insured
losses have occurred in
the past 15 years
8 of the top 10 insured
losses have occurred in
the past 15 years
7 of the top 10 affected
the United States
7 of the top 10 affected
the United States
5 of the top 10 were U.S.
hurricane events
5 of the top 10 were U.S.
hurricane events
12
13
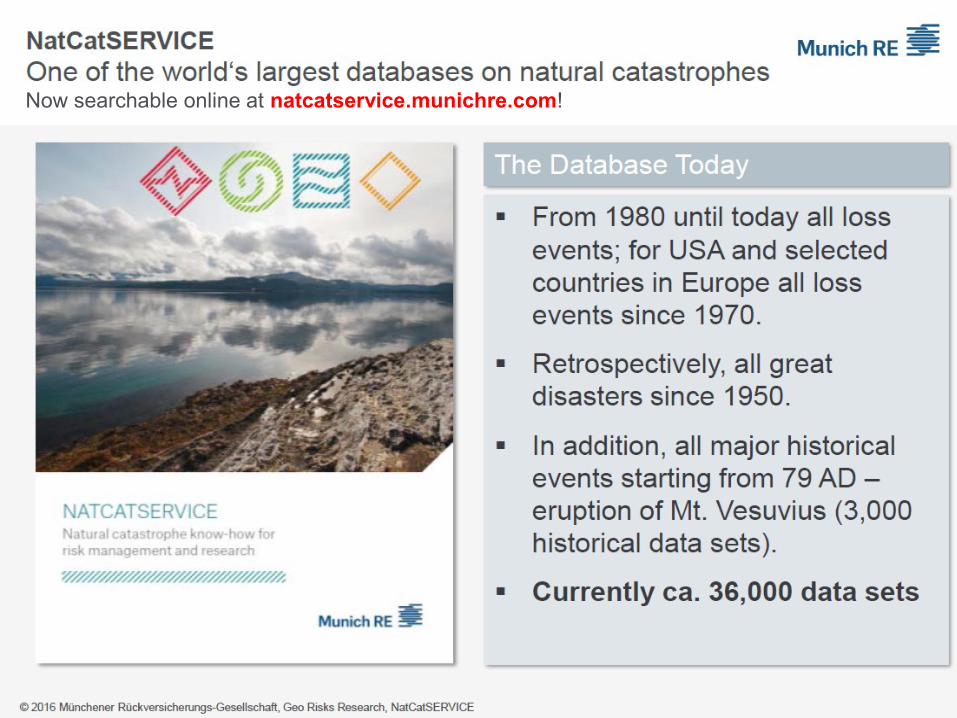
Now searchable online at natcatservice.munichre.com!
NatCatSERVICE
© 2016 Münchener Rückversicherungs-Gesellschaft, Geo Risks Research, NatCatSERVICE – As at March 2016
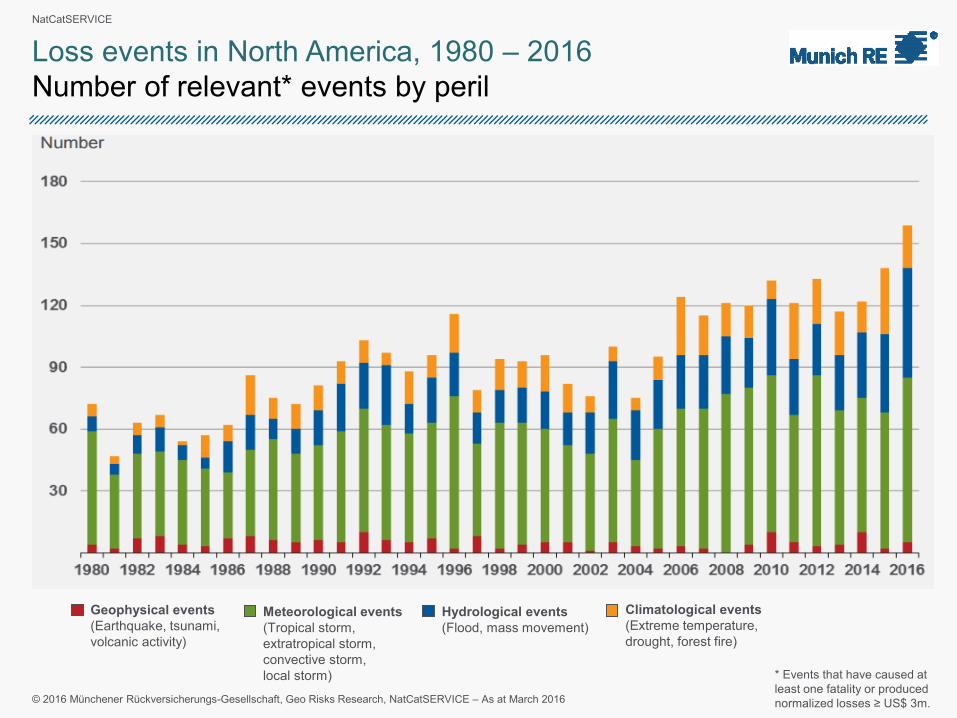
Loss events in North America, 1980 – 2016
Number of relevant* events by peril
* Events that have caused at
least one fatality or produced
normalized losses ≥ US$ 3m.
Meteorological events
(Tropical storm,
extratropical storm,
convective storm,
local storm)
Hydrological events
(Flood, mass movement)
Climatological events
(Extreme temperature,
drought, forest fire)
Geophysical events
(Earthquake, tsunami,
volcanic activity)
NatCatSERVICE
© 2016 Münchener Rückversicherungs-Gesellschaft, Geo Risks Research, NatCatSERVICE – As at March 2016
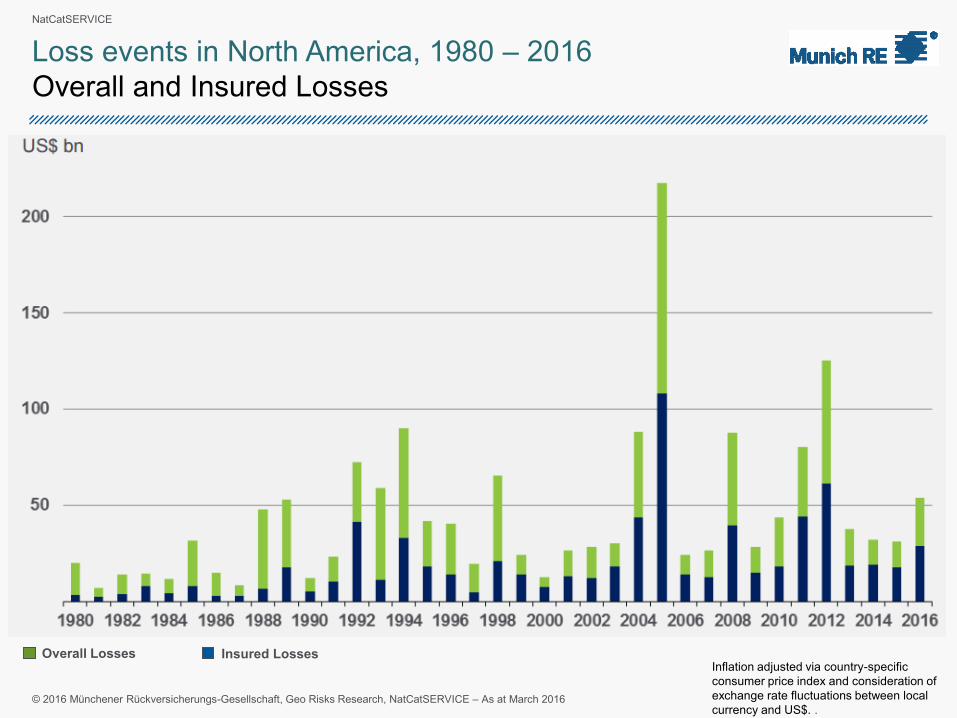
Loss events in North America, 1980 – 2016
Overall and Insured Losses
Inflation adjusted via country-specific
consumer price index and consideration of
exchange rate fluctuations between local
currency and US$. .
Insured LossesOverall Losses
NatCatSERVICE
© 2016 Münchener Rückversicherungs-Gesellschaft, Geo Risks Research, NatCatSERVICE – As at March 2016
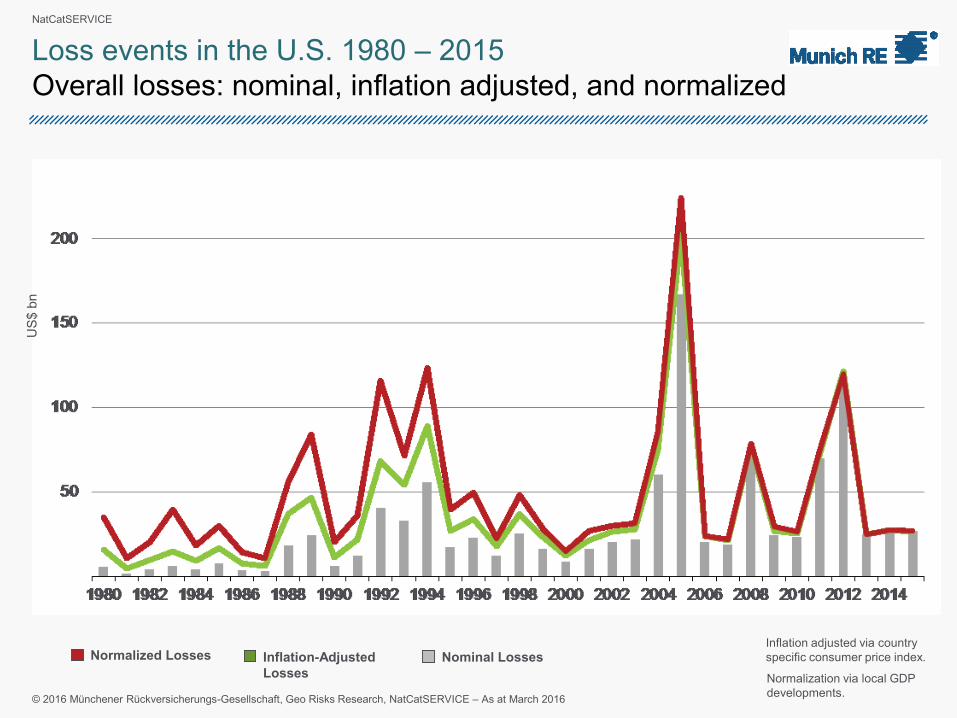
Loss events in the U.S. 1980 – 2015
Overall losses: nominal, inflation adjusted, and normalized
US
$bn
Inflation adjusted via country
specific consumer price index.
Normalization via local GDP
developments.
Inflation-Adjusted
Losses
Nominal LossesNormalized Losses
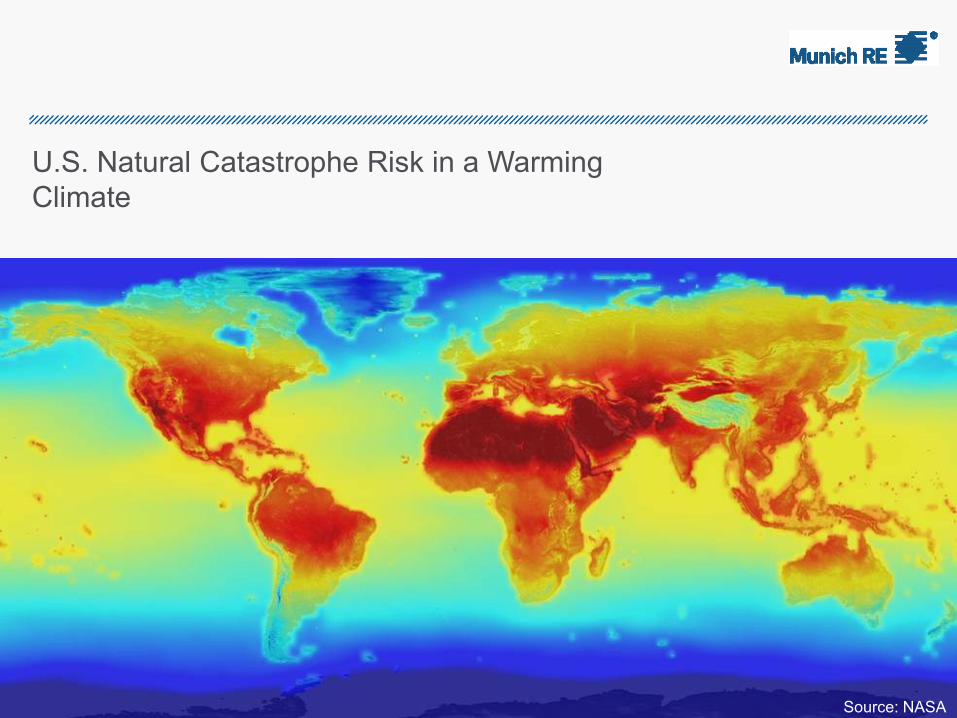
U.S. Natural Catastrophe Risk in a Warming
Climate
Source: NASA
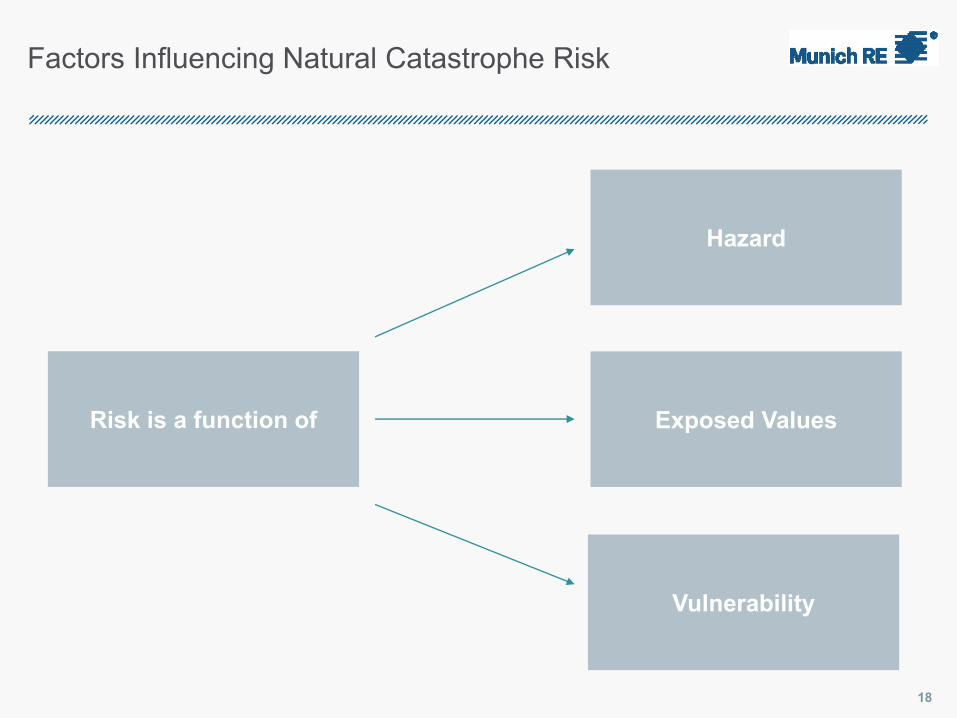
Factors Influencing Natural Catastrophe Risk
18
Risk is a function of
Hazard
Exposed Values
Vulnerability
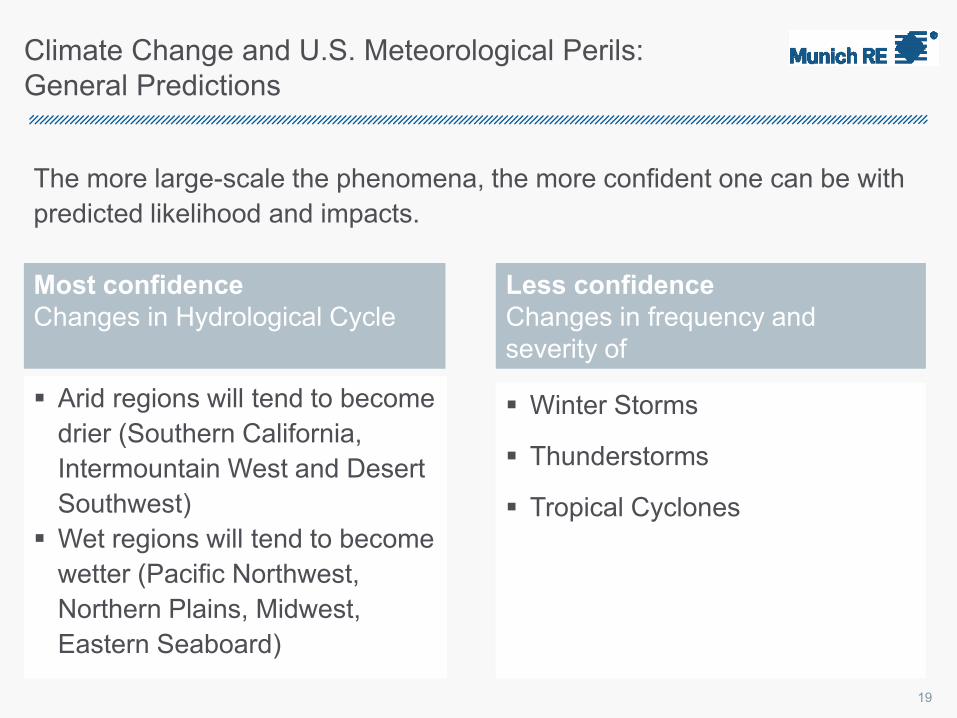
Climate Change and U.S. Meteorological Perils:
General Predictions
The more large-scale the phenomena, the more confident one can be with
predicted likelihood and impacts.
Arid regions will tend to become
drier (Southern California,
Intermountain West and Desert
Southwest)
Wet regions will tend to become
wetter (Pacific Northwest,
Northern Plains, Midwest,
Eastern Seaboard)
Arid regions will tend to become
drier (Southern California,
Intermountain West and Desert
Southwest)
Wet regions will tend to become
wetter (Pacific Northwest,
Northern Plains, Midwest,
Eastern Seaboard)
Winter Storms
Thunderstorms
Tropical Cyclones
Winter Storms
Thunderstorms
Tropical Cyclones
Most confidence
Changes in Hydrological Cycle
Most confidence
Changes in Hydrological Cycle
Less confidence
Changes in frequency and
severity of
Less confidence
Changes in frequency and
severity of
19
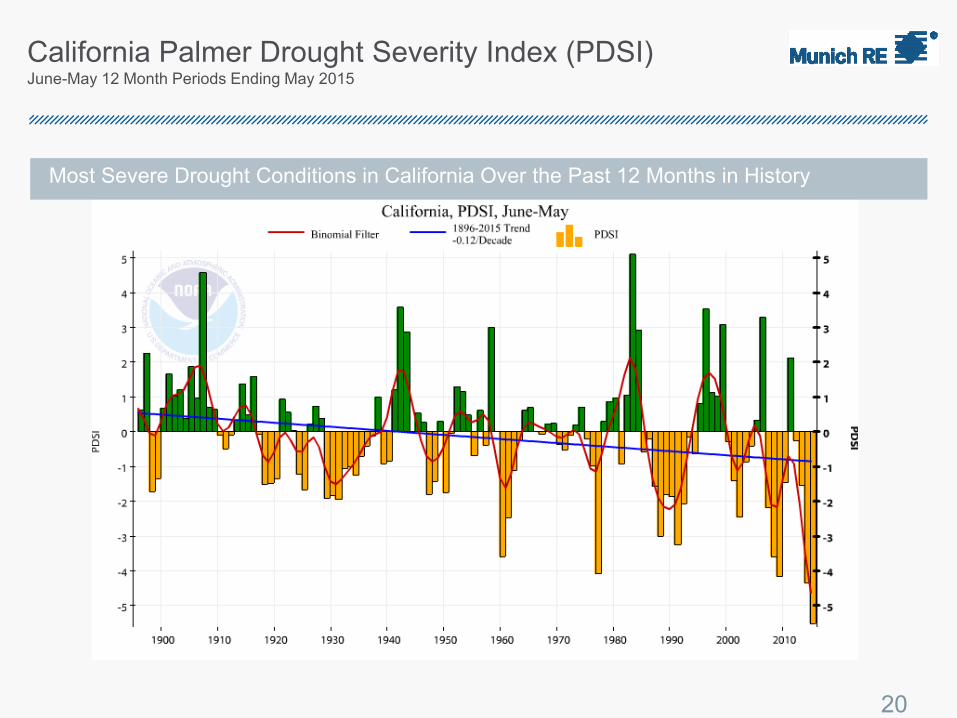
California Palmer Drought Severity Index (PDSI)June-May 12 Month Periods Ending May 2015
20
Most Severe Drought Conditions in California Over the Past 12 Months in History
21
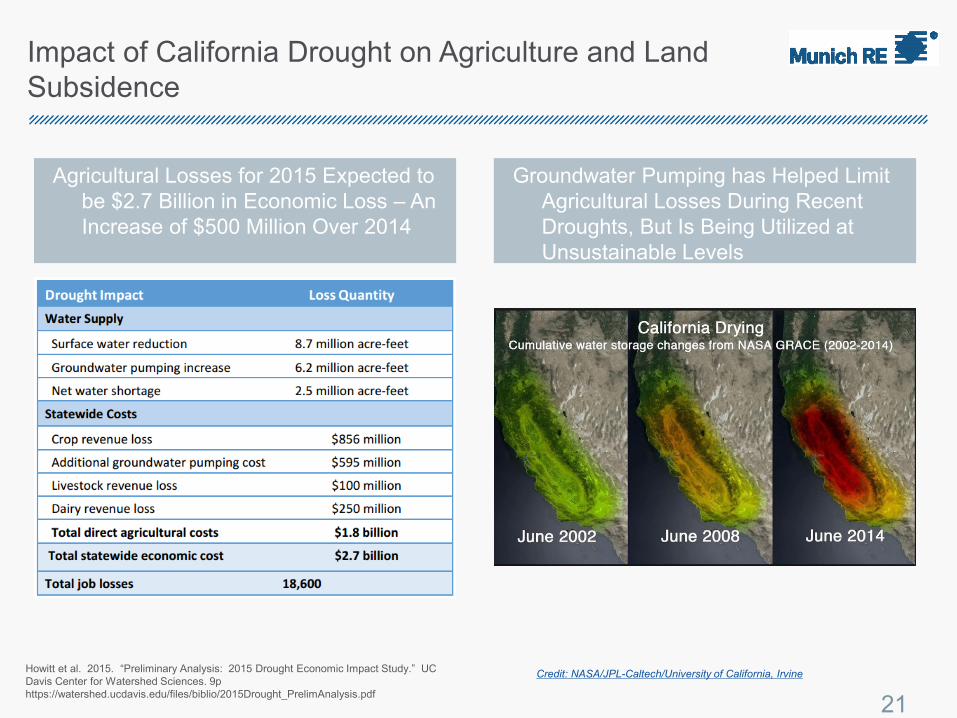
Impact of California Drought on Agriculture and Land
Subsidence
Agricultural Losses for 2015 Expected to
be $2.7 Billion in Economic Loss – An
Increase of $500 Million Over 2014
Groundwater Pumping has Helped Limit
Agricultural Losses During Recent
Droughts, But Is Being Utilized at
Unsustainable Levels
Howitt et al. 2015. “Preliminary Analysis: 2015 Drought Economic Impact Study.” UC
Davis Center for Watershed Sciences. 9p
https://watershed.ucdavis.edu/files/biblio/2015Drought_PrelimAnalysis.pdf
Credit: NASA/JPL-Caltech/University of California, Irvine
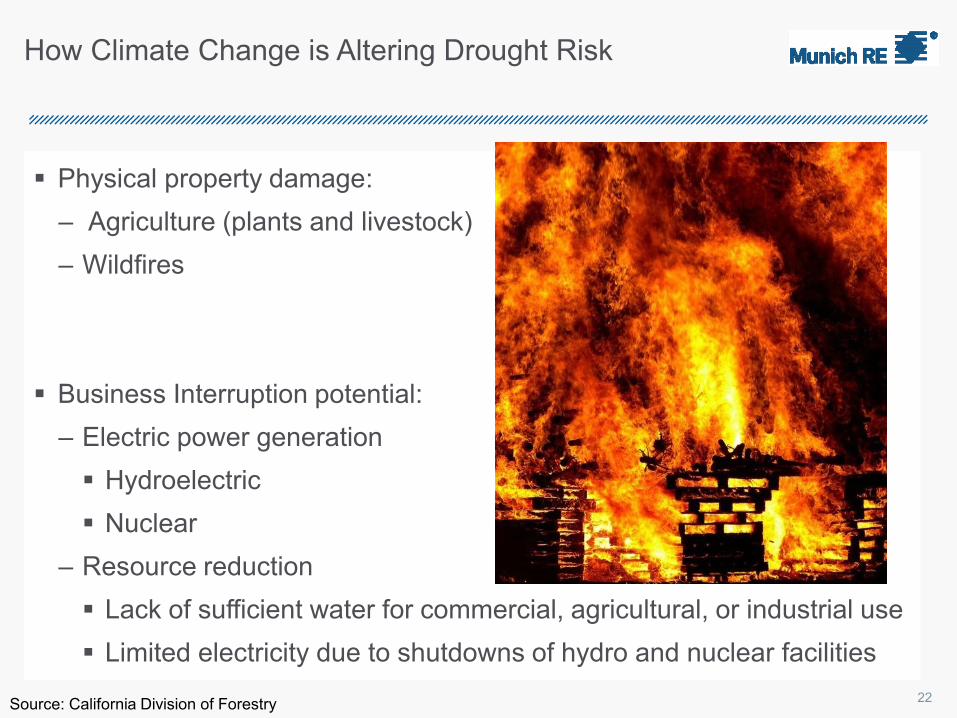
How Climate Change is Altering Drought Risk
Physical property damage:
‒ Agriculture (plants and livestock)
‒ Wildfires
Business Interruption potential:
‒ Electric power generation
Hydroelectric
Nuclear
‒ Resource reduction
Lack of sufficient water for commercial, agricultural, or industrial use
Limited electricity due to shutdowns of hydro and nuclear facilities
22Source: California Division of Forestry
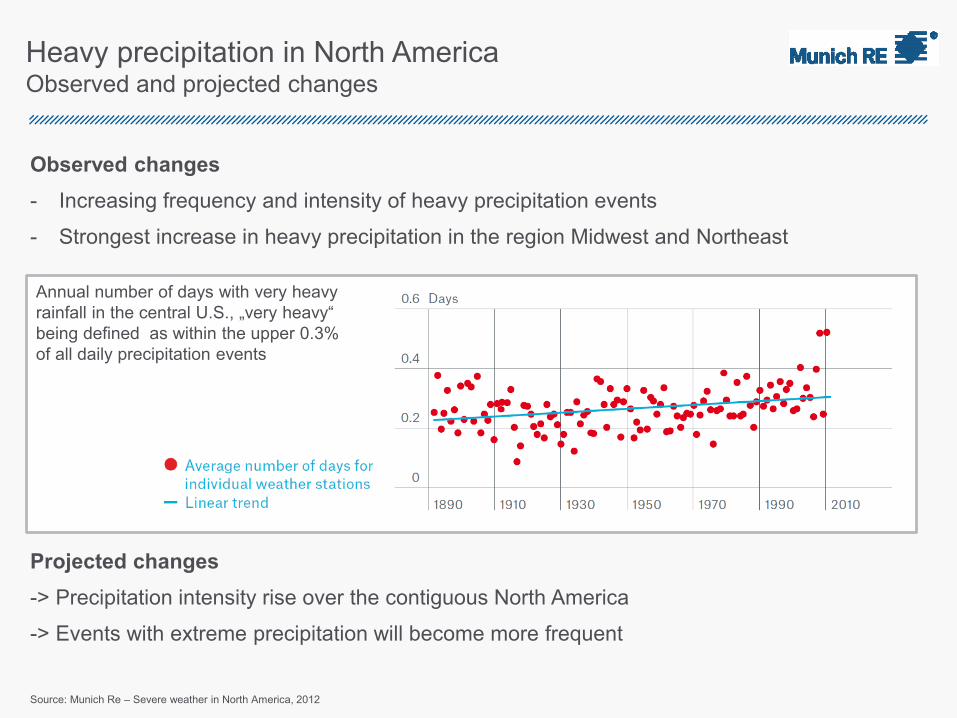
Heavy precipitation in North AmericaObserved and projected changes
Observed changes
- Increasing frequency and intensity of heavy precipitation events
- Strongest increase in heavy precipitation in the region Midwest and Northeast
Projected changes
-> Precipitation intensity rise over the contiguous North America
-> Events with extreme precipitation will become more frequent
Annual number of days with very heavy
rainfall in the central U.S., „very heavy“
being defined as within the upper 0.3%
of all daily precipitation events
Source: Munich Re – Severe weather in North America, 2012
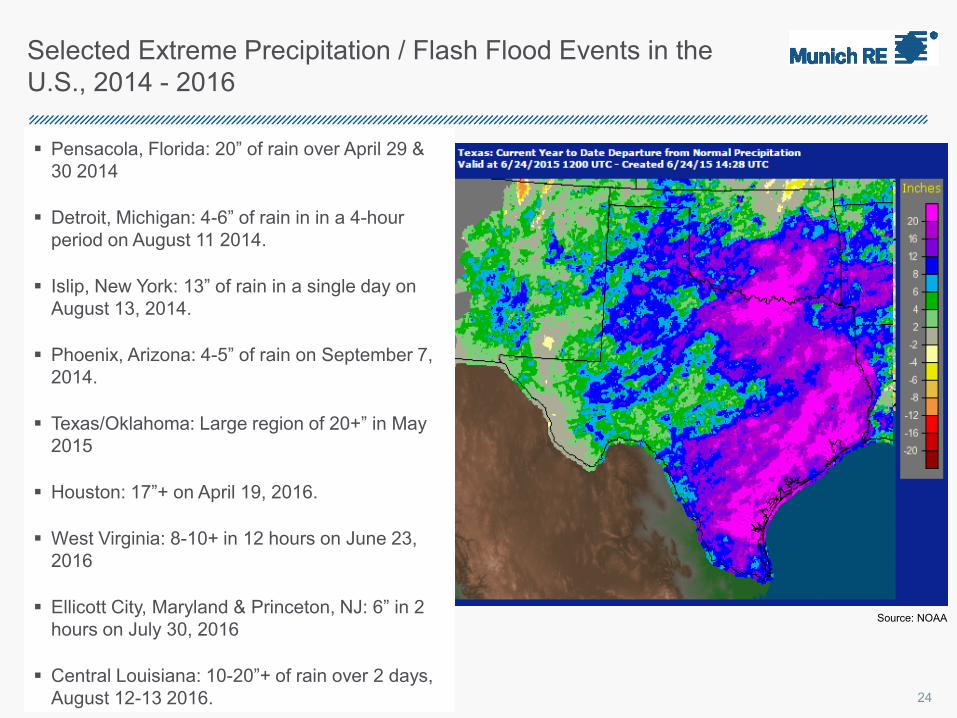
Selected Extreme Precipitation / Flash Flood Events in the
U.S., 2014 - 2016
Pensacola, Florida: 20” of rain over April 29 &
30 2014
Detroit, Michigan: 4-6” of rain in in a 4-hour
period on August 11 2014.
Islip, New York: 13” of rain in a single day on
August 13, 2014.
Phoenix, Arizona: 4-5” of rain on September 7,
2014.
Texas/Oklahoma: Large region of 20+” in May
2015
Houston: 17”+ on April 19, 2016.
West Virginia: 8-10+ in 12 hours on June 23,
2016
Ellicott City, Maryland & Princeton, NJ: 6” in 2
hours on July 30, 2016
Central Louisiana: 10-20”+ of rain over 2 days,
August 12-13 2016.
Source: NOAA
24

Impact of Oceanic Heat Increase on
Atlantic Hurricane Climate
Ocean warming has led to
an apparent linear increasing
trend in the decadal-scale
AMO cycle.
Increased oceanic heat content
can provide more “fuel” for
hurricanes and allow them to
become more intense – but
only if other atmospheric
conditions are conducive for
Intensification.
25Source: NOAA
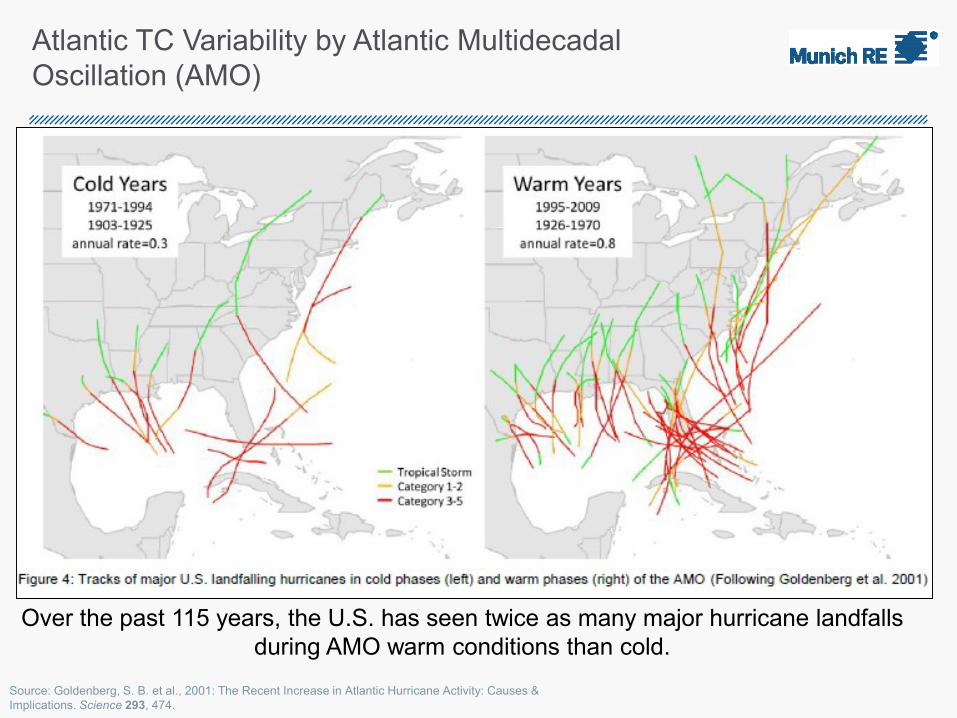
Over the past 115 years, the U.S. has seen twice as many major hurricane landfalls
during AMO warm conditions than cold.
Atlantic TC Variability by Atlantic Multidecadal
Oscillation (AMO)
Source: Goldenberg, S. B. et al., 2001: The Recent Increase in Atlantic Hurricane Activity: Causes &
Implications. Science 293, 474.
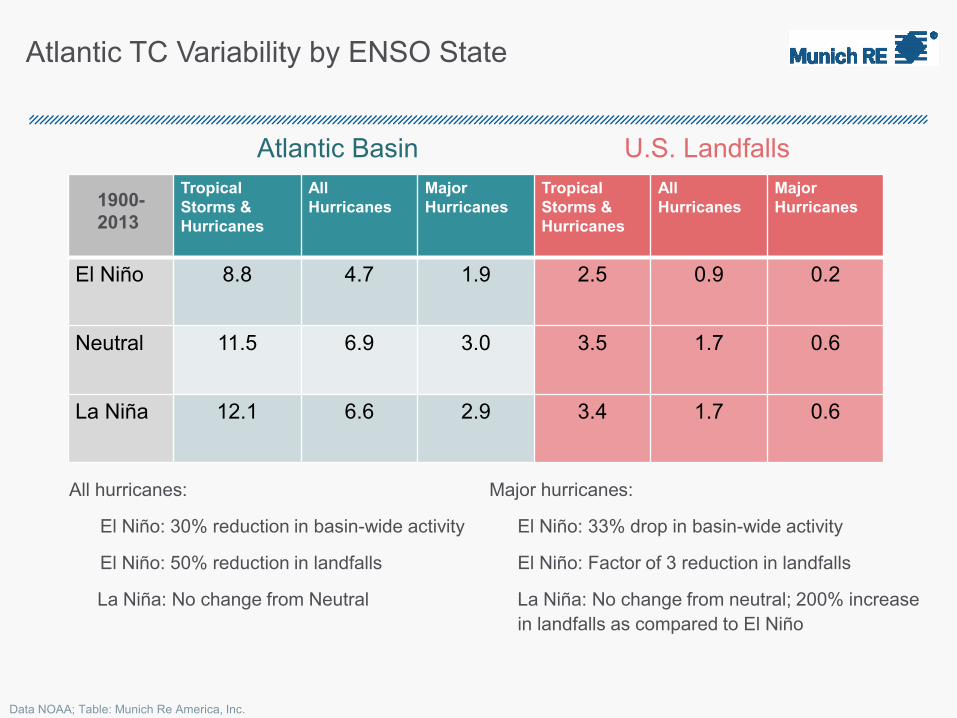
Atlantic TC Variability by ENSO State
Tropical
Storms &
Hurricanes
All
Hurricanes
Major
Hurricanes
Tropical
Storms &
Hurricanes
All
Hurricanes
Major
Hurricanes
El Niño 8.8 4.7 1.9 2.5 0.9 0.2
Neutral 11.5 6.9 3.0 3.5 1.7 0.6
La Niña 12.1 6.6 2.9 3.4 1.7 0.6
1900-
2013
Major hurricanes:
El Niño: 33% drop in basin-wide activity
El Niño: Factor of 3 reduction in landfalls
La Niña: No change from neutral; 200% increase
in landfalls as compared to El Niño
All hurricanes:
El Niño: 30% reduction in basin-wide activity
El Niño: 50% reduction in landfalls
La Niña: No change from Neutral
Atlantic Basin U.S. Landfalls
Data NOAA; Table: Munich Re America, Inc.
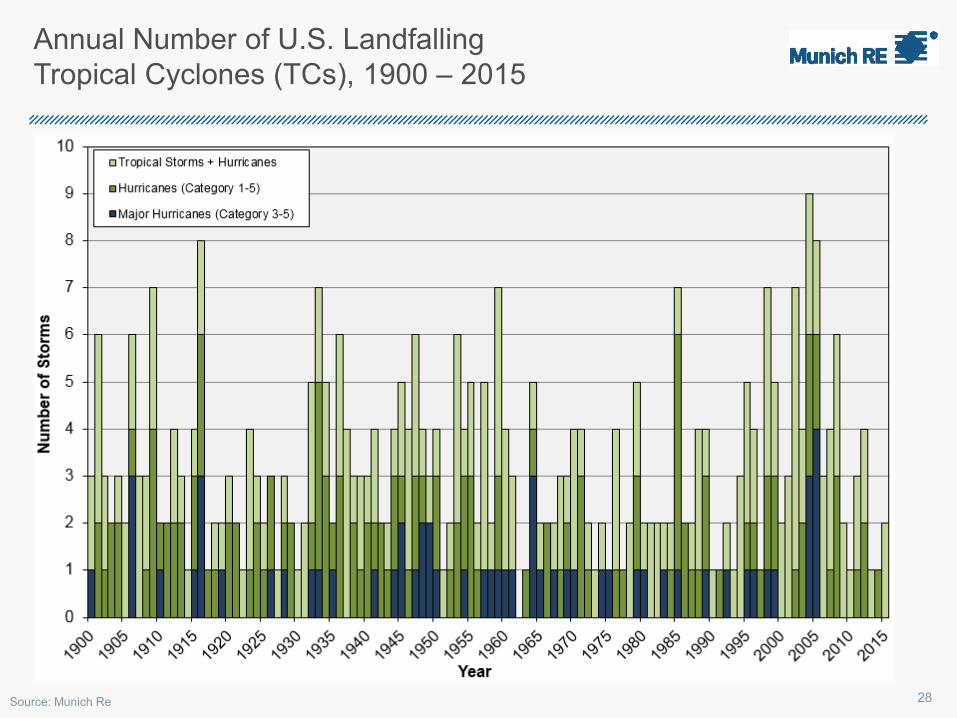
Annual Number of U.S. Landfalling
Tropical Cyclones (TCs), 1900 – 2015
Source: Munich Re 28
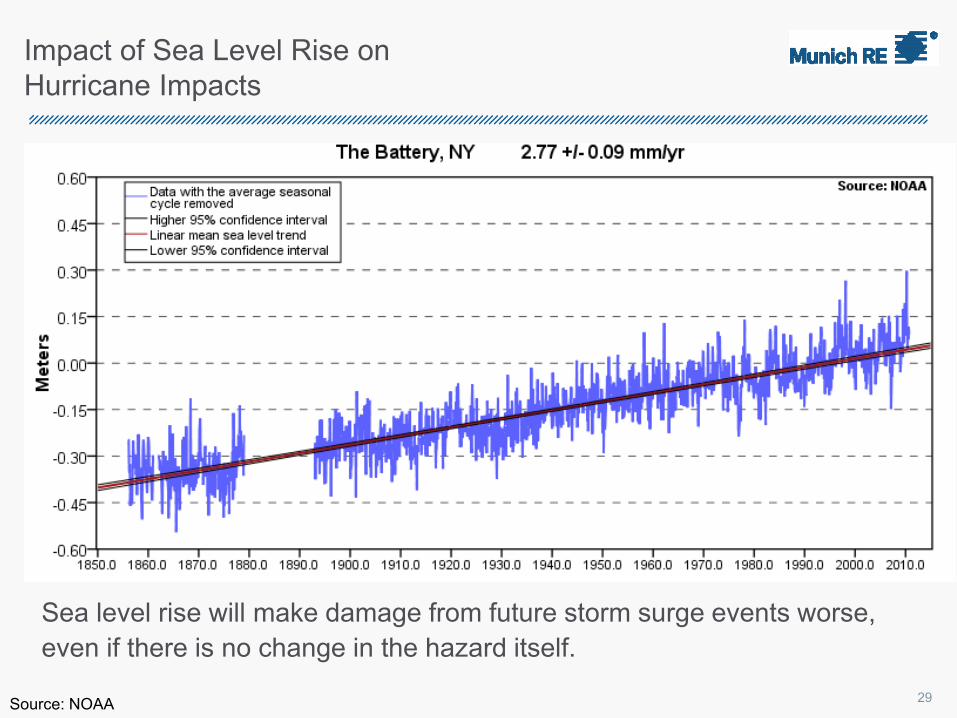
Impact of Sea Level Rise on
Hurricane Impacts
Sea level rise will make damage from future storm surge events worse,
even if there is no change in the hazard itself.
29Source: NOAA
Thunderstorms and Climate Change
Due to the small-scale, localized nature of severe thunderstorms and
their associated hazards, it is hard to tell what impact climate change
will have on these storms.
Increased atmospheric moisture and heat will likely increase the
number of days per year that severe thunderstorms are possible in
certain areas of the globe.
Some studies already indicating more large hail events over past 50
years; unclear if naturally driven change or influence by human activity.
30
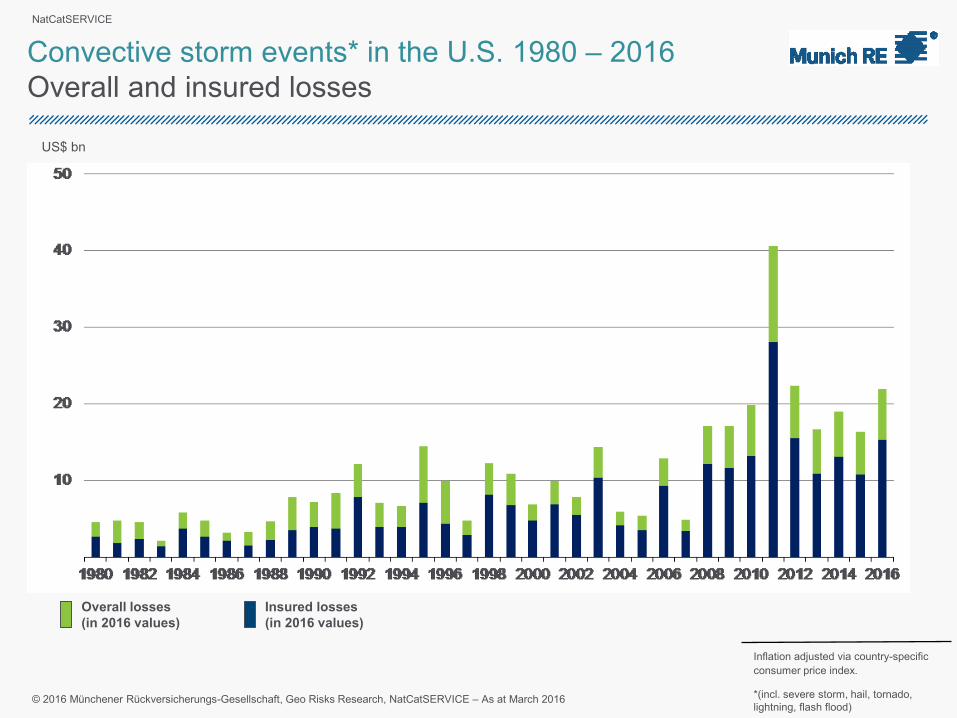
NatCatSERVICE
© 2016 Münchener Rückversicherungs-Gesellschaft, Geo Risks Research, NatCatSERVICE – As at March 2016
Convective storm events* in the U.S. 1980 – 2016
Overall and insured losses
US$ bn
Inflation adjusted via country-specific
consumer price index.
Overall losses
(in 2016 values)
Insured losses
(in 2016 values)
*(incl. severe storm, hail, tornado,
lightning, flash flood)

NatCatSERVICE
© 2016 Münchener Rückversicherungs-Gesellschaft, Geo Risks Research, NatCatSERVICE – As at March 2016
Convective storm events* in the U.S. 1980 – 2016
Overall losses: nominal, inflation adjusted, and normalized
Inflation adjusted via country-specific
consumer price index.
Normalization via local GDP
developments measured in US$.
US$ bn
*(incl. severe storm, hail, tornado,
lightning, flash flood)
Inflation-Adjusted
Losses
Nominal LossesNormalized Losses
NatCatSERVICE
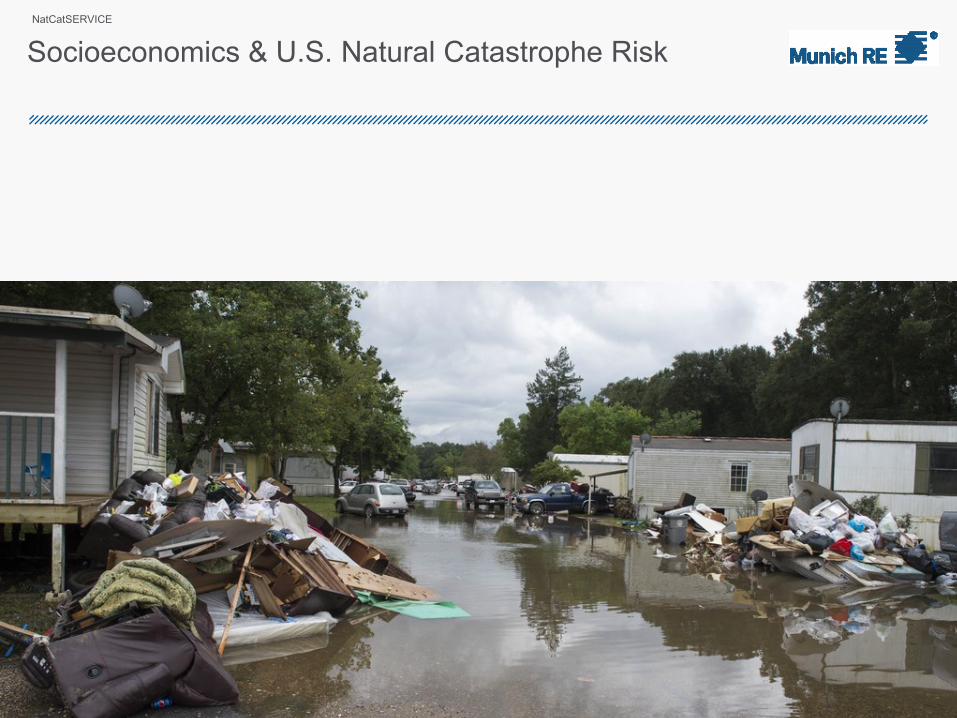
© 2016 Münchener Rückversicherungs-Gesellschaft, Geo Risks Research, NatCatSERVICE – As at March 2016
Socioeconomics & U.S. Natural Catastrophe Risk
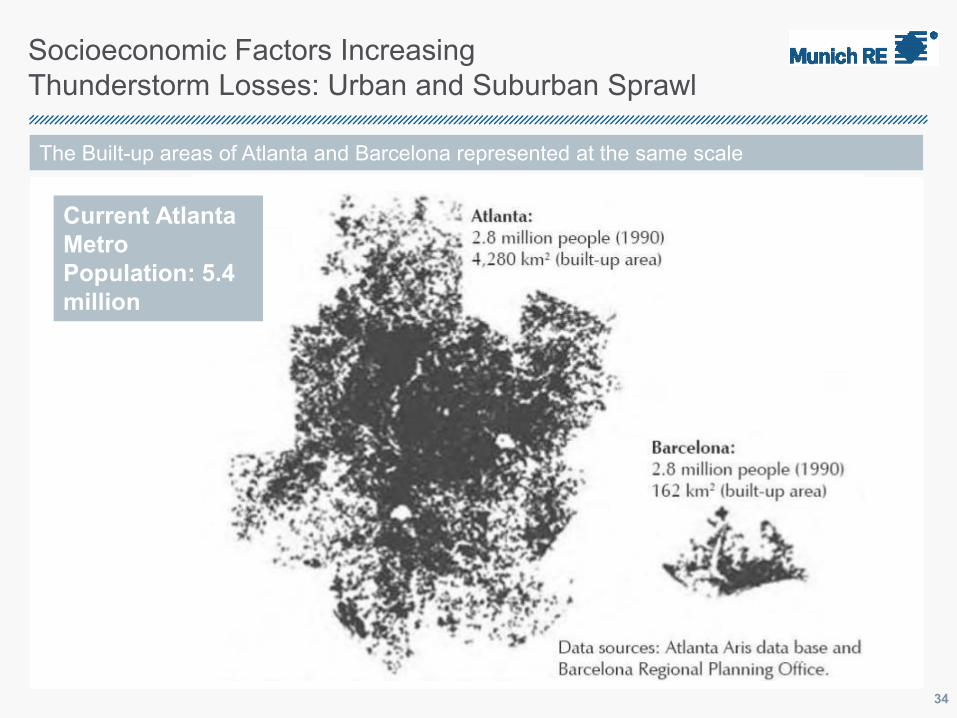
Socioeconomic Factors Increasing
Thunderstorm Losses: Urban and Suburban Sprawl
Current Atlanta
Metro
Population: 5.4
million
The Built-up areas of Atlanta and Barcelona represented at the same scale
34
Socioeconomic Factors Increasing
Nat Cat Losses: Building Age / Construction Quality
Links to Institute For Business & Home Safety Videos Shown:
https://www.youtube.com/watch?v=itv3XFe-lEI
https://www.youtube.com/watch?v=L9ngIY_fzgg
https://www.youtube.com/user/ibhsdotorg/featured
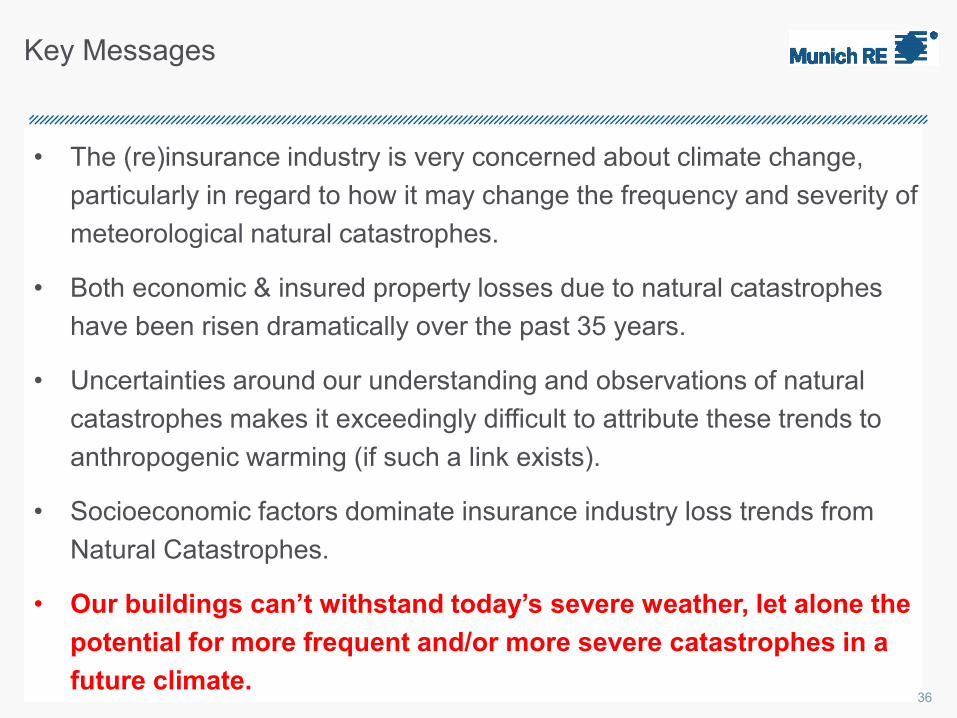
Key Messages
• The (re)insurance industry is very concerned about climate change,
particularly in regard to how it may change the frequency and severity of
meteorological natural catastrophes.
• Both economic & insured property losses due to natural catastrophes
have been risen dramatically over the past 35 years.
• Uncertainties around our understanding and observations of natural
catastrophes makes it exceedingly difficult to attribute these trends to
anthropogenic warming (if such a link exists).
• Socioeconomic factors dominate insurance industry loss trends from
Natural Catastrophes.
• Our buildings can’t withstand today’s severe weather, let alone the
potential for more frequent and/or more severe catastrophes in a
future climate.
• The (re)insurance industry is very concerned about climate change,
particularly in regard to how it may change the frequency and severity of
meteorological natural catastrophes.
• Both economic & insured property losses due to natural catastrophes
have been risen dramatically over the past 35 years.
• Uncertainties around our understanding and observations of natural
catastrophes makes it exceedingly difficult to attribute these trends to
anthropogenic warming (if such a link exists).
• Socioeconomic factors dominate insurance industry loss trends from
Natural Catastrophes.
• Our buildings can’t withstand today’s severe weather, let alone the
potential for more frequent and/or more severe catastrophes in a
future climate. 36
THANK YOU! ANY QUESTIONS?
Mark C. Bove, CPCU ARe
@MarkCBove
Source: NOAA
© Copyright 2017 Munich Reinsurance America, Inc. All rights reserved. "Munich Re" and the Munich Re logo are
internationally protected registered trademarks. The material in this presentation is provided for your information only, and
is not permitted to be further distributed without the express written permission of Munich Reinsurance America, Inc. or
Munich Re. This material is not intended to be legal, underwriting, financial, or any other type of professional advice.
Examples given are for illustrative purposes only. Each reader should consult an attorney and other appropriate advisors
to determine the applicability of any particular contract language to the reader's specific circumstances.
Source: NOAA