Embed Size (px)
Citation preview
1
\15LTthen-doc1.5.doc 7 July 2015
Paper prepared for the DG ECFIN seminar “Joining the euro and then? How to ensure economic success after entering the common currency”
16 June 2015, Vilnius, Lithuania
Final version!
Economic Growth and Convergence in the Baltic States: Caught in a Middle Income Trap?
KARSTEN STAEHR*
Department of Finance and Economics Tallinn University of Technology
Akadeemia tee 3-486 12618 Tallinn
Estonia
E-mail: [email protected] Tel.: +372 6204057
Mobile: +372 58161415 Abstract: The Baltic states have by 2015 attained a high degree of financial and economic stability. Economic growth has however been modest after the global financial crisis and con-vergence has slowed down. Moreover, the boom before the crisis did not reflect the longer term growth potential as it was partly driven by demand impulses made possible by large capital inflows. These findings suggest that the Baltic states may risk being caught in a middle income trap with modest growth and slow convergence. Such a trap may result from a lack of coordination between different actors in the economy, which holds back a rapid expansion of productive capacity in the economy. The authorities may play a role in coordinating and di-recting measures seeking to avoid the trap and like so facilitate rapid and sustainable growth. There is a need for broad-based and closely coordinated programmes to expand investment in education, machinery, innovation, infrastructure and economic governance. 1. Introduction
* The author would like to thank, without implicating, the discussants Ingrida Šimonytė, Andris Strazds and Märten Ross for valuable feedback at the DG ECFIN seminar. He would also like to thank, again without impli-cating, Jaanika Meriküll, Martti Randveer and Commission staff for feedback during the preparation of the pa-per. The views expressed are those of the author and not necessarily those of the institutions with which he is affiliated.
2
The Baltic states – Estonia, Latvia and Lithuania – have overall been economically successful in the first decades since regaining independence. Their economies have been transformed, living standards have increased, and a high degree of macroeconomic stability has been at-tained.1 The admission of the countries into the European Union in 2004 signified that they had well-functioning democratic systems and competitive market economies. The admission to the euro area of Estonia in 2011, Latvia in 2014 and Lithuania in 2015 signalled a high de-gree of convergence in inflation, interest rates, budget balance and public debt. Although the Baltic states are fully integrated with European institutions and have attained a high degree of financial and fiscal stability, they have income levels substantially below those in the Western European EU countries. GDP per capita in 2013 was around 65 percent of the EU15 average and around 55 percent of the level in neighbouring Sweden (Eurostat 2015, code: nama_gdp_c). Economic growth in the aftermath of the global financial crisis has gen-erally remained subdued and the speed of convergence since 2007 has consequently been low, in particular vis-à-vis the North European countries. This pattern is set to continue in 2015-2016 according to forecasts. These developments make it pertinent to examine the economic performance of the Baltic states and the potential of those countries to grow in the medium term. Other studies such as Becker et al. (2010), Mitra et al. (2010) and Åslund (2012) have considered the growth pros-pects of the former transition countries since the global financial crisis, but this paper is the first to discuss the specific growth challenges in the Baltic states and in particular the risk of the countries being caught in a trap with low rates of growth and slow or non-existent conver-gence towards the income levels found in Western Europe. Many emerging economies have experienced spurts of rapid economic growth that have nar-rowed the gap towards the high-income or developed economies, only to see economic growth taper off and the process of convergence slow down. Only a dozen emerging econo-mies have succeeded in narrowing the income gap further and essentially attaining the living standards of developed economies, while many emerging economies have seen per capita in-come levels stabilise at around half of the US level (Eichengreen et al. 2013). Such a scenario with low trend growth and slow or no convergence was first labelled a middle income trap by Gill et al. (2007).2 The key issue in this paper is whether the Baltic states could risk being caught in a middle in-come trap with low trend growth and slow income convergence. Such an outcome may be self-reinforcing as discouraging future prospects may lead to low investment in human capital and advanced production activities. The paper will provide analyses suggesting that the mid-dle income trap is a possibility as the growth spurt in the Baltic states in the pre-crisis period was facilitated by the accumulation of external liabilities. The pre-crisis growth spurt was not sustainable and the lower growth rates after the crisis are unsurprising in this light. Moreover, although it is difficult to ascertain due to data problems, the growth rates of capital accumula-tion and total factor productivity have been falling since the global financial crisis, and this
1 These achievements are particularly apparent when comparisons are made with other countries emerging from the Soviet Union. 2 The countries that have successfully made the transition from emerging economies include several Asian “tiger economies” such as Singapore, Hong Kong and South Korea, and also some South European countries. The countries that may be caught in a middle income trap include several Latin American countries and also coun-tries in Asia such as Malaysia and the Philippines (Agénor & Canuto 2012).
3
casts some doubt on the growth performance in times ahead. This paper focuses on the Baltic states but much of the discussion may also be applicable to other EU countries from Central and Eastern Europe, and to some Southern European countries badly affected by the global financial crisis. The rest of the paper is organised as follows: Section 2 considers the growth performance and the process of convergence in the Baltic states in 1995-2014. Section 3 presents econometric evidence for the importance of external financing for short-term economic growth in the EU countries from Central and Eastern Europe (CEE), including the Baltic states. Section 4 pro-vides scenarios of the hypothetical growth performance if the Baltic states had not had access to external financing and compares the performance to that of other CEE countries. Section 5 reports data on potential growth and provides a closer look at developments in capital accu-mulation and total factor productivity. Section 6 is based on the findings in Sections 4 and 5 and assesses the risk of the Baltic states being caught in a low income trap. Finally, Section 7 provides some policy discussion. 2. Economic growth and convergence
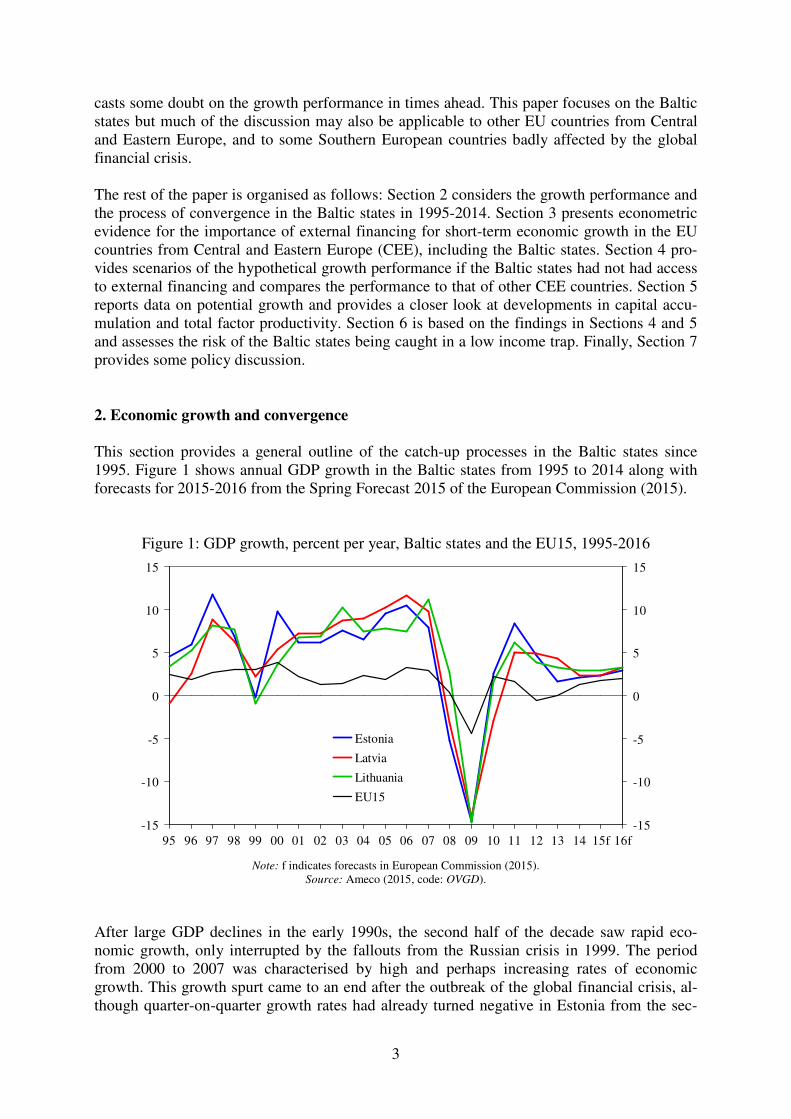
This section provides a general outline of the catch-up processes in the Baltic states since 1995. Figure 1 shows annual GDP growth in the Baltic states from 1995 to 2014 along with forecasts for 2015-2016 from the Spring Forecast 2015 of the European Commission (2015).
Figure 1: GDP growth, percent per year, Baltic states and the EU15, 1995-2016
-15
-10
-5
0
5
10
15
95 96 97 98 99 00 01 02 03 04 05 06 07 08 09 10 11 12 13 14 15f 16f-15
-10
-5
0
5
10
15
Estonia
Latvia
Lithuania
EU15
Note: f indicates forecasts in European Commission (2015). Source: Ameco (2015, code: OVGD).
After large GDP declines in the early 1990s, the second half of the decade saw rapid eco-nomic growth, only interrupted by the fallouts from the Russian crisis in 1999. The period from 2000 to 2007 was characterised by high and perhaps increasing rates of economic growth. This growth spurt came to an end after the outbreak of the global financial crisis, al-though quarter-on-quarter growth rates had already turned negative in Estonia from the sec-
4
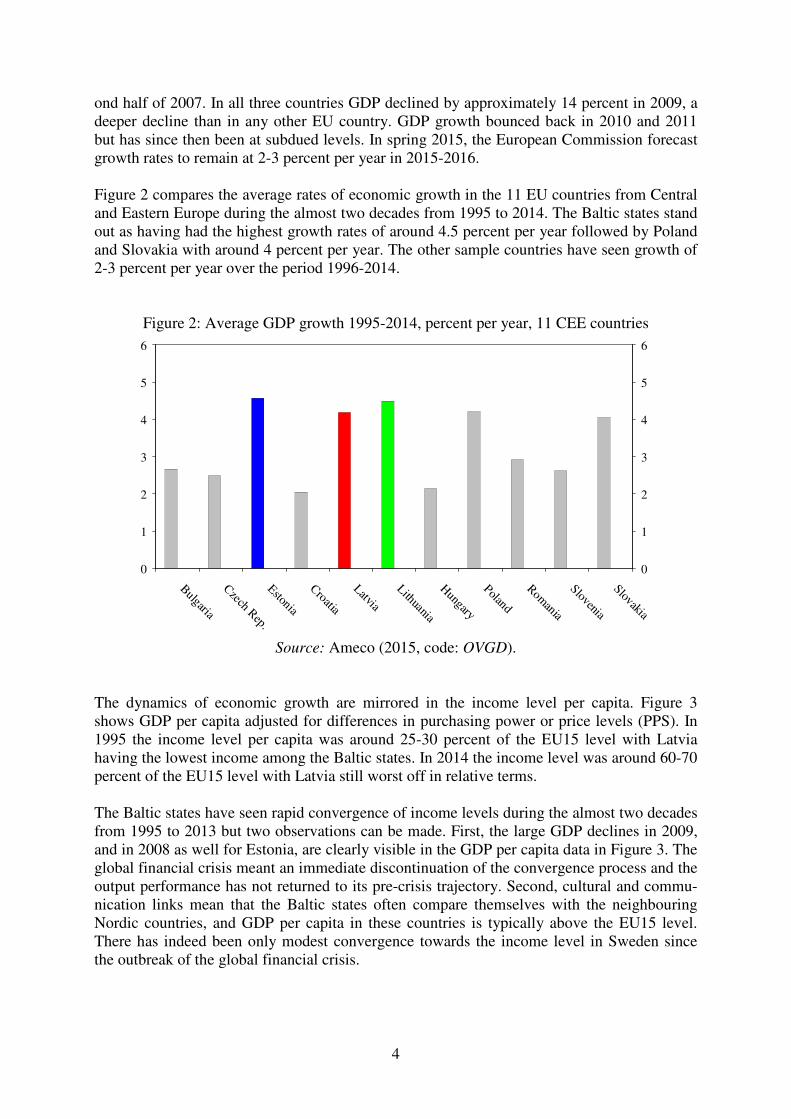
ond half of 2007. In all three countries GDP declined by approximately 14 percent in 2009, a deeper decline than in any other EU country. GDP growth bounced back in 2010 and 2011 but has since then been at subdued levels. In spring 2015, the European Commission forecast growth rates to remain at 2-3 percent per year in 2015-2016. Figure 2 compares the average rates of economic growth in the 11 EU countries from Central and Eastern Europe during the almost two decades from 1995 to 2014. The Baltic states stand out as having had the highest growth rates of around 4.5 percent per year followed by Poland and Slovakia with around 4 percent per year. The other sample countries have seen growth of 2-3 percent per year over the period 1996-2014.
Figure 2: Average GDP growth 1995-2014, percent per year, 11 CEE countries
0
1
2
3
4
5
6
Bulgaria
Czech Rep.
Estonia
Croatia
Latvia
Lithuania
Hungary
Poland
Romania
Slovenia
Slovakia
0
1
2
3
4
5
6
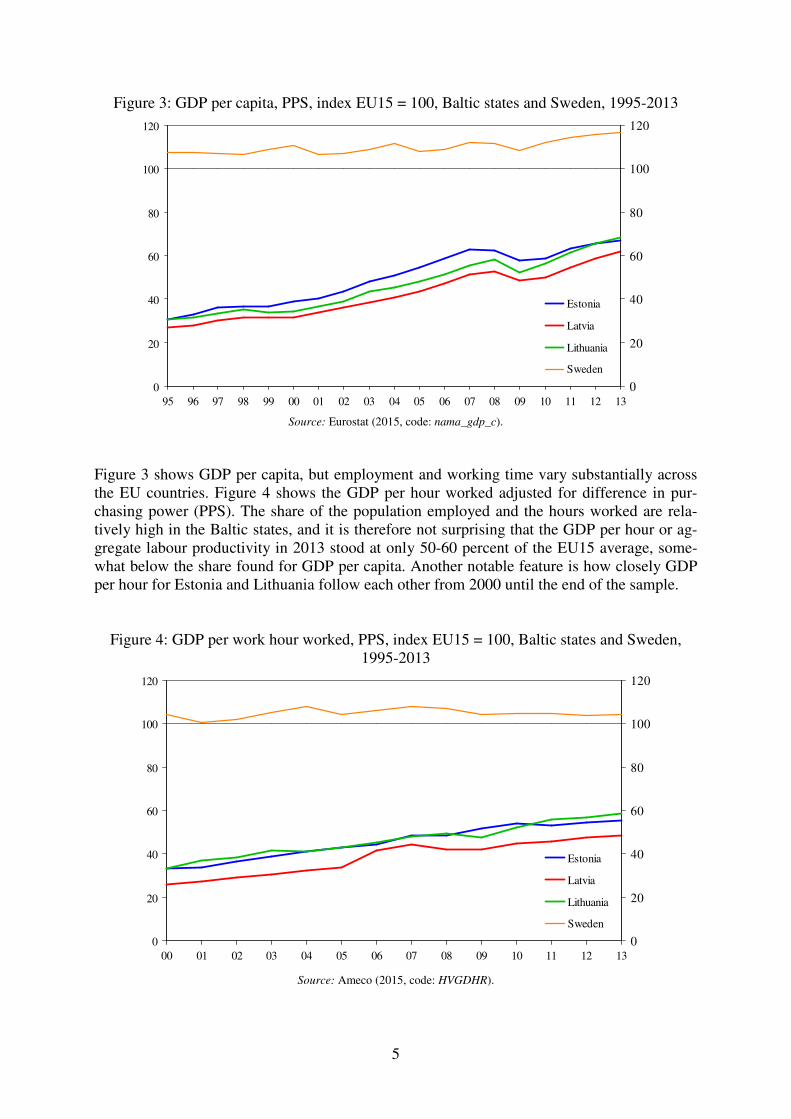
Source: Ameco (2015, code: OVGD). The dynamics of economic growth are mirrored in the income level per capita. Figure 3 shows GDP per capita adjusted for differences in purchasing power or price levels (PPS). In 1995 the income level per capita was around 25-30 percent of the EU15 level with Latvia having the lowest income among the Baltic states. In 2014 the income level was around 60-70 percent of the EU15 level with Latvia still worst off in relative terms. The Baltic states have seen rapid convergence of income levels during the almost two decades from 1995 to 2013 but two observations can be made. First, the large GDP declines in 2009, and in 2008 as well for Estonia, are clearly visible in the GDP per capita data in Figure 3. The global financial crisis meant an immediate discontinuation of the convergence process and the output performance has not returned to its pre-crisis trajectory. Second, cultural and commu-nication links mean that the Baltic states often compare themselves with the neighbouring Nordic countries, and GDP per capita in these countries is typically above the EU15 level. There has indeed been only modest convergence towards the income level in Sweden since the outbreak of the global financial crisis.
5
Figure 3: GDP per capita, PPS, index EU15 = 100, Baltic states and Sweden, 1995-2013
0
20
40
60
80
100
120
95 96 97 98 99 00 01 02 03 04 05 06 07 08 09 10 11 12 130
20
40
60
80
100
120
Estonia
Latvia
Lithuania
Sweden
Source: Eurostat (2015, code: nama_gdp_c).
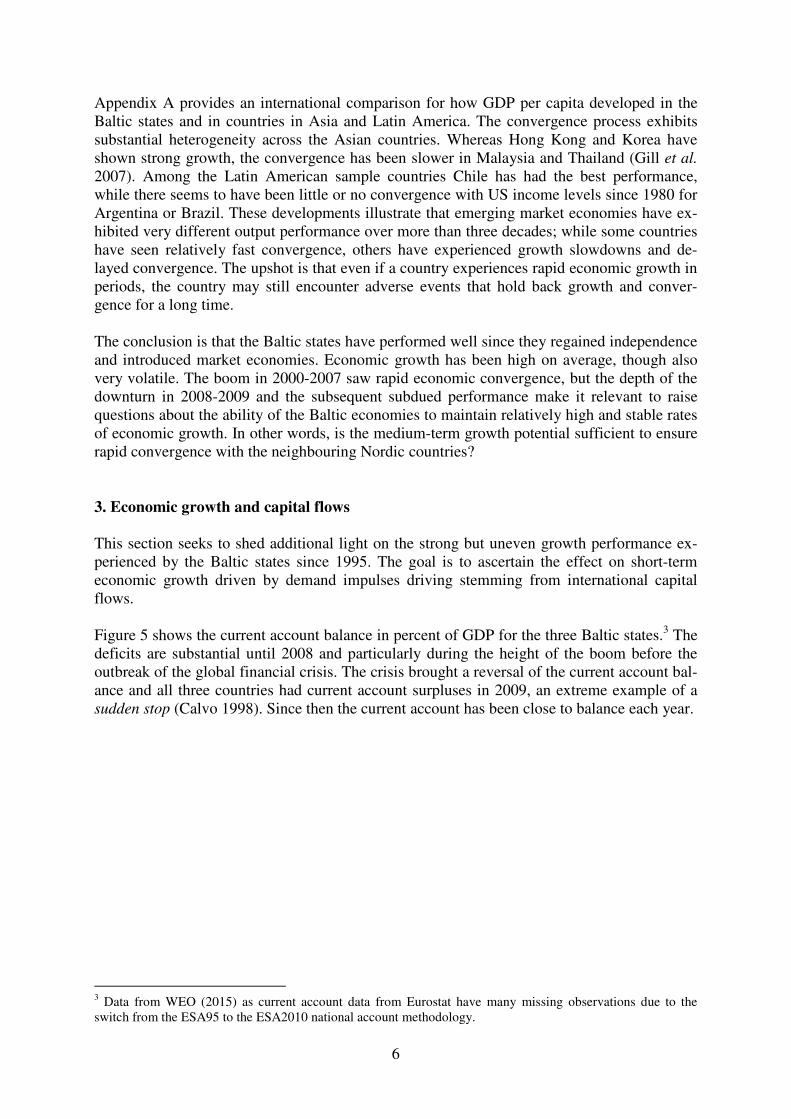
Figure 3 shows GDP per capita, but employment and working time vary substantially across the EU countries. Figure 4 shows the GDP per hour worked adjusted for difference in pur-chasing power (PPS). The share of the population employed and the hours worked are rela-tively high in the Baltic states, and it is therefore not surprising that the GDP per hour or ag-gregate labour productivity in 2013 stood at only 50-60 percent of the EU15 average, some-what below the share found for GDP per capita. Another notable feature is how closely GDP per hour for Estonia and Lithuania follow each other from 2000 until the end of the sample.
Figure 4: GDP per work hour worked, PPS, index EU15 = 100, Baltic states and Sweden, 1995-2013
0
20
40
60
80
100
120
00 01 02 03 04 05 06 07 08 09 10 11 12 130
20
40
60
80
100
120
Estonia
Latvia
Lithuania
Sweden
Source: Ameco (2015, code: HVGDHR).
6
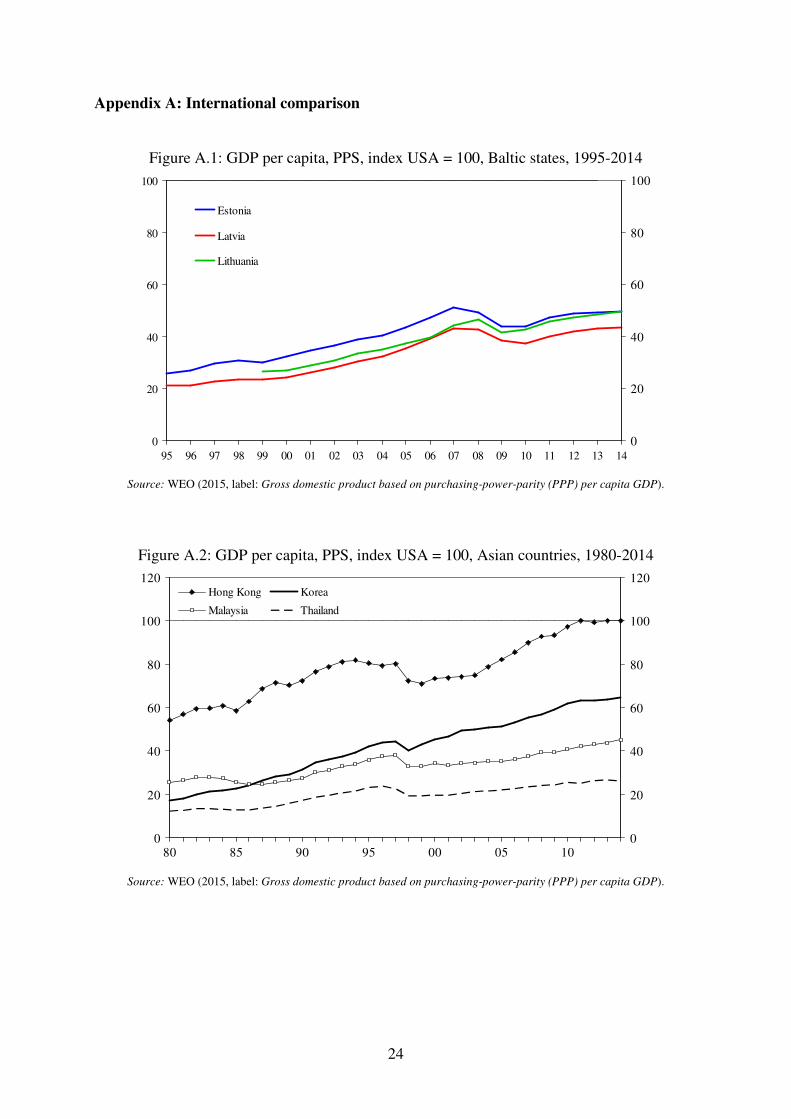
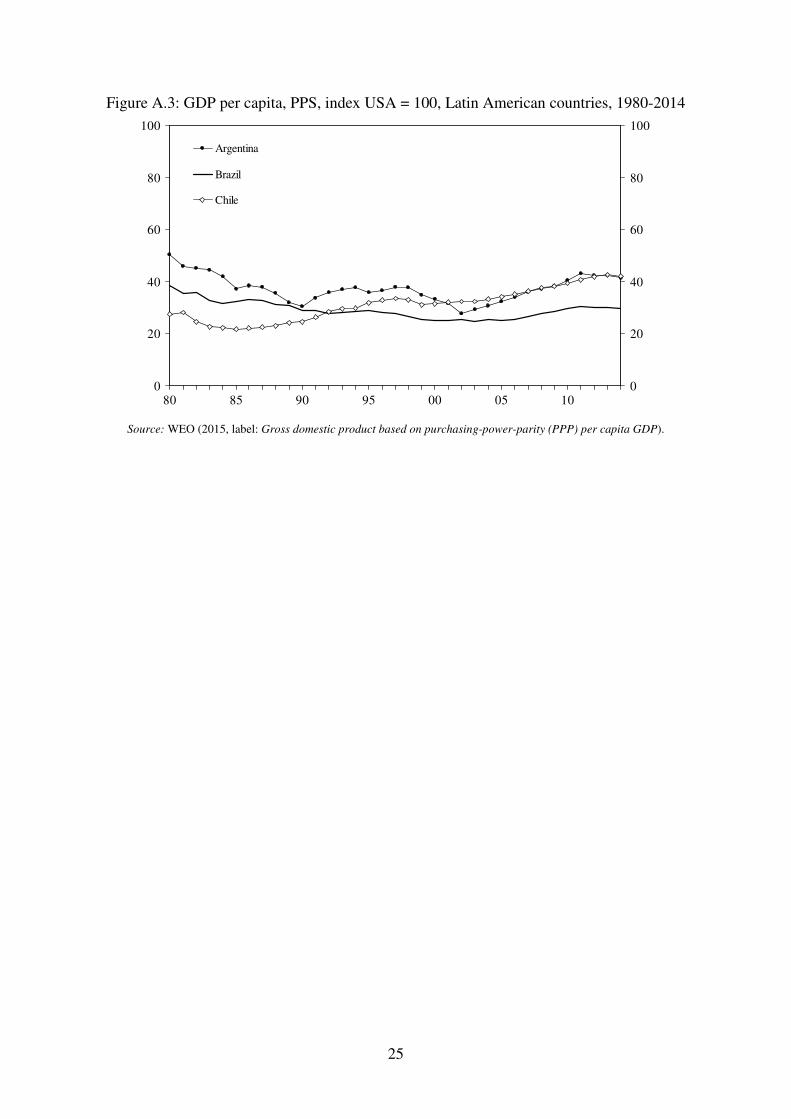
Appendix A provides an international comparison for how GDP per capita developed in the Baltic states and in countries in Asia and Latin America. The convergence process exhibits substantial heterogeneity across the Asian countries. Whereas Hong Kong and Korea have shown strong growth, the convergence has been slower in Malaysia and Thailand (Gill et al. 2007). Among the Latin American sample countries Chile has had the best performance, while there seems to have been little or no convergence with US income levels since 1980 for Argentina or Brazil. These developments illustrate that emerging market economies have ex-hibited very different output performance over more than three decades; while some countries have seen relatively fast convergence, others have experienced growth slowdowns and de-layed convergence. The upshot is that even if a country experiences rapid economic growth in periods, the country may still encounter adverse events that hold back growth and conver-gence for a long time. The conclusion is that the Baltic states have performed well since they regained independence and introduced market economies. Economic growth has been high on average, though also very volatile. The boom in 2000-2007 saw rapid economic convergence, but the depth of the downturn in 2008-2009 and the subsequent subdued performance make it relevant to raise questions about the ability of the Baltic economies to maintain relatively high and stable rates of economic growth. In other words, is the medium-term growth potential sufficient to ensure rapid convergence with the neighbouring Nordic countries? 3. Economic growth and capital flows
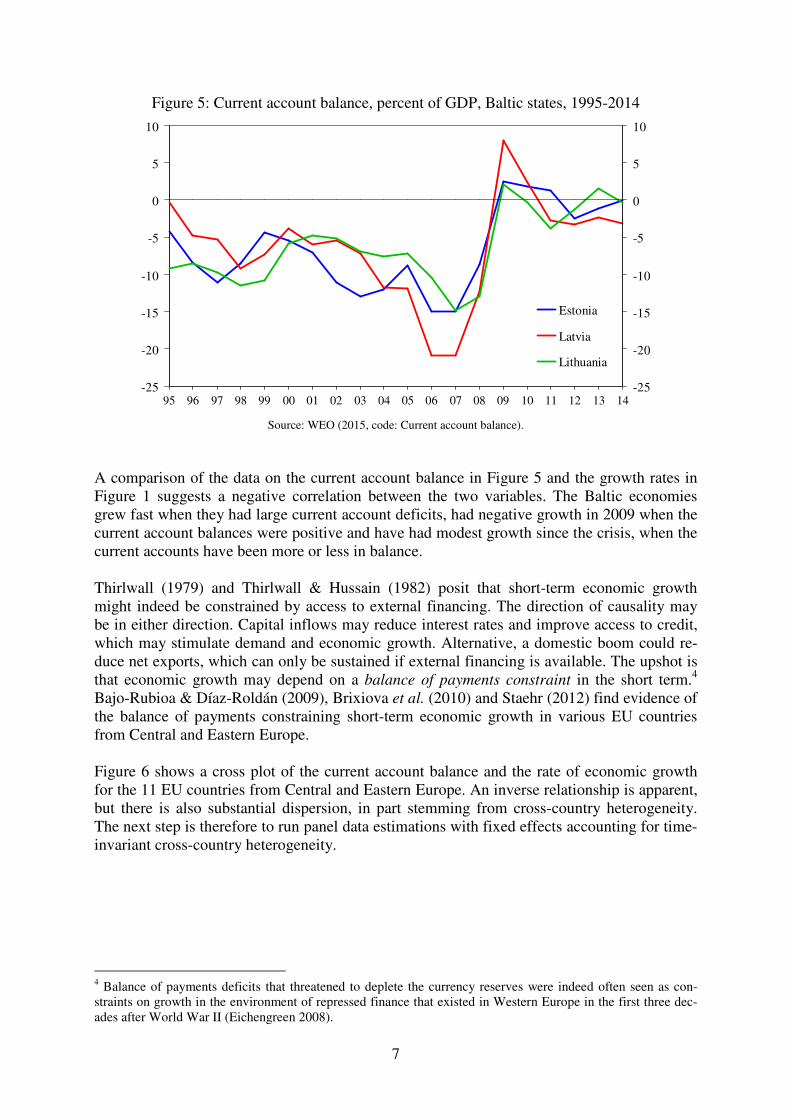
This section seeks to shed additional light on the strong but uneven growth performance ex-perienced by the Baltic states since 1995. The goal is to ascertain the effect on short-term economic growth driven by demand impulses driving stemming from international capital flows. Figure 5 shows the current account balance in percent of GDP for the three Baltic states.3 The deficits are substantial until 2008 and particularly during the height of the boom before the outbreak of the global financial crisis. The crisis brought a reversal of the current account bal-ance and all three countries had current account surpluses in 2009, an extreme example of a sudden stop (Calvo 1998). Since then the current account has been close to balance each year.
3 Data from WEO (2015) as current account data from Eurostat have many missing observations due to the switch from the ESA95 to the ESA2010 national account methodology.
7
Figure 5: Current account balance, percent of GDP, Baltic states, 1995-2014
-25
-20
-15
-10
-5
0
5
10
95 96 97 98 99 00 01 02 03 04 05 06 07 08 09 10 11 12 13 14-25
-20
-15
-10
-5
0
5
10
Estonia
Latvia
Lithuania
Source: WEO (2015, code: Current account balance).
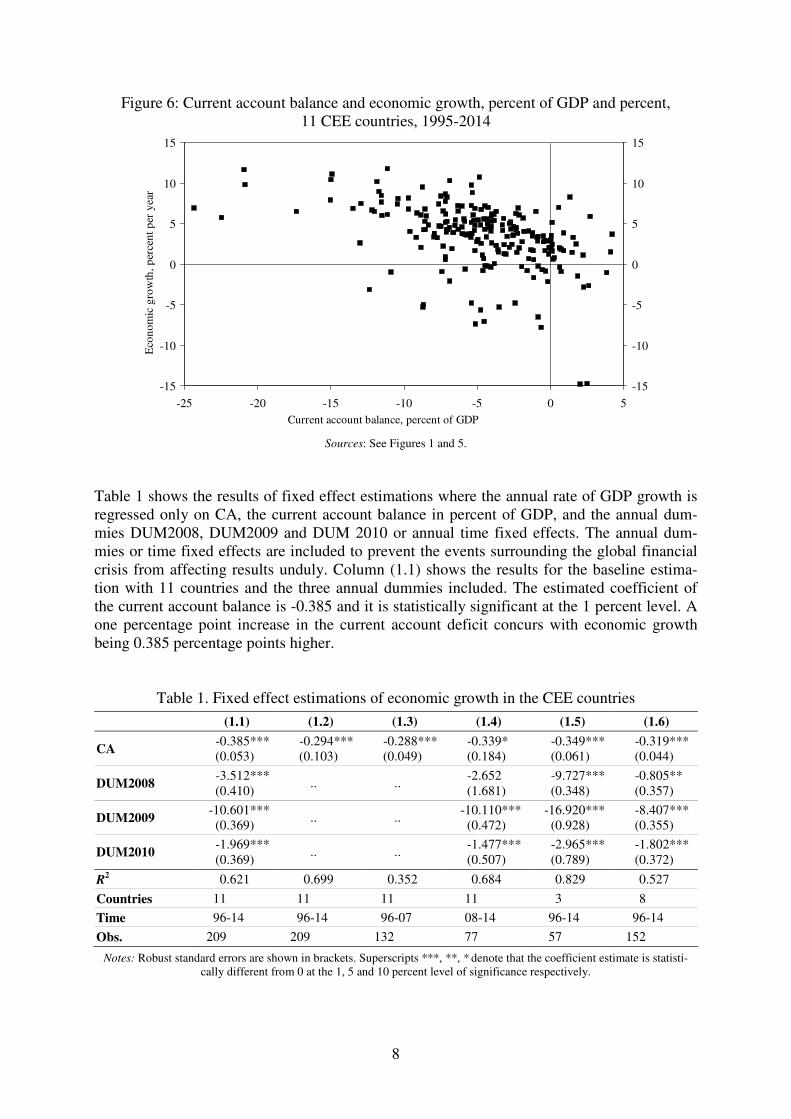
A comparison of the data on the current account balance in Figure 5 and the growth rates in Figure 1 suggests a negative correlation between the two variables. The Baltic economies grew fast when they had large current account deficits, had negative growth in 2009 when the current account balances were positive and have had modest growth since the crisis, when the current accounts have been more or less in balance. Thirlwall (1979) and Thirlwall & Hussain (1982) posit that short-term economic growth might indeed be constrained by access to external financing. The direction of causality may be in either direction. Capital inflows may reduce interest rates and improve access to credit, which may stimulate demand and economic growth. Alternative, a domestic boom could re-duce net exports, which can only be sustained if external financing is available. The upshot is that economic growth may depend on a balance of payments constraint in the short term.4 Bajo-Rubioa & Díaz-Roldán (2009), Brixiova et al. (2010) and Staehr (2012) find evidence of the balance of payments constraining short-term economic growth in various EU countries from Central and Eastern Europe. Figure 6 shows a cross plot of the current account balance and the rate of economic growth for the 11 EU countries from Central and Eastern Europe. An inverse relationship is apparent, but there is also substantial dispersion, in part stemming from cross-country heterogeneity. The next step is therefore to run panel data estimations with fixed effects accounting for time-invariant cross-country heterogeneity.
4 Balance of payments deficits that threatened to deplete the currency reserves were indeed often seen as con-straints on growth in the environment of repressed finance that existed in Western Europe in the first three dec-ades after World War II (Eichengreen 2008).
8
Figure 6: Current account balance and economic growth, percent of GDP and percent, 11 CEE countries, 1995-2014
-15
-10
-5
0
5
10
15
-25 -20 -15 -10 -5 0 5Current account balance, percent of GDP
Eco
nom
ic g
row
th, p
erce
nt p
er y
ear
-15
-10
-5
0
5
10
15
Sources: See Figures 1 and 5.
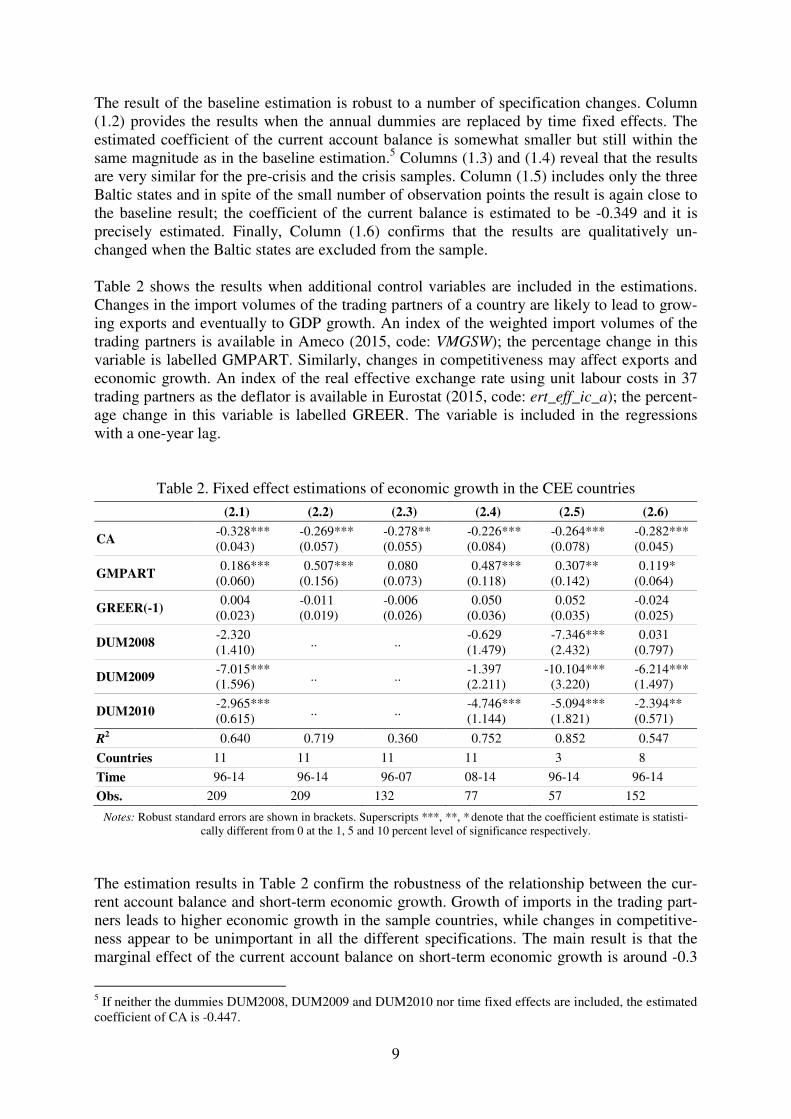
Table 1 shows the results of fixed effect estimations where the annual rate of GDP growth is regressed only on CA, the current account balance in percent of GDP, and the annual dum-mies DUM2008, DUM2009 and DUM 2010 or annual time fixed effects. The annual dum-mies or time fixed effects are included to prevent the events surrounding the global financial crisis from affecting results unduly. Column (1.1) shows the results for the baseline estima-tion with 11 countries and the three annual dummies included. The estimated coefficient of the current account balance is -0.385 and it is statistically significant at the 1 percent level. A one percentage point increase in the current account deficit concurs with economic growth being 0.385 percentage points higher.
Table 1. Fixed effect estimations of economic growth in the CEE countries (1.1) (1.2) (1.3) (1.4) (1.5) (1.6)
CA -0.385*** (0.053)
-0.294*** (0.103)
-0.288*** (0.049)
-0.339* (0.184)
-0.349*** (0.061)
-0.319*** (0.044)
DUM2008 -3.512*** (0.410)
.. .. -2.652 (1.681)
-9.727*** (0.348)
-0.805** (0.357)
DUM2009 -10.601*** (0.369)
.. .. -10.110*** (0.472)
-16.920*** (0.928)
-8.407*** (0.355)
DUM2010 -1.969*** (0.369)
.. .. -1.477*** (0.507)
-2.965*** (0.789)
-1.802*** (0.372)
R2 0.621 0.699 0.352 0.684 0.829 0.527
Countries 11 11 11 11 3 8
Time 96-14 96-14 96-07 08-14 96-14 96-14
Obs. 209 209 132 77 57 152
Notes: Robust standard errors are shown in brackets. Superscripts ***, **, * denote that the coefficient estimate is statisti-cally different from 0 at the 1, 5 and 10 percent level of significance respectively.
9
The result of the baseline estimation is robust to a number of specification changes. Column (1.2) provides the results when the annual dummies are replaced by time fixed effects. The estimated coefficient of the current account balance is somewhat smaller but still within the same magnitude as in the baseline estimation.5 Columns (1.3) and (1.4) reveal that the results are very similar for the pre-crisis and the crisis samples. Column (1.5) includes only the three Baltic states and in spite of the small number of observation points the result is again close to the baseline result; the coefficient of the current balance is estimated to be -0.349 and it is precisely estimated. Finally, Column (1.6) confirms that the results are qualitatively un-changed when the Baltic states are excluded from the sample. Table 2 shows the results when additional control variables are included in the estimations. Changes in the import volumes of the trading partners of a country are likely to lead to grow-ing exports and eventually to GDP growth. An index of the weighted import volumes of the trading partners is available in Ameco (2015, code: VMGSW); the percentage change in this variable is labelled GMPART. Similarly, changes in competitiveness may affect exports and economic growth. An index of the real effective exchange rate using unit labour costs in 37 trading partners as the deflator is available in Eurostat (2015, code: ert_eff_ic_a); the percent-age change in this variable is labelled GREER. The variable is included in the regressions with a one-year lag.
Table 2. Fixed effect estimations of economic growth in the CEE countries (2.1) (2.2) (2.3) (2.4) (2.5) (2.6)
CA -0.328*** (0.043)
-0.269*** (0.057)
-0.278** (0.055)
-0.226*** (0.084)
-0.264*** (0.078)
-0.282*** (0.045)
GMPART 0.186***
(0.060) 0.507***
(0.156) 0.080
(0.073) 0.487***
(0.118) 0.307**
(0.142) 0.119*
(0.064)
GREER(-1) 0.004
(0.023) -0.011 (0.019)
-0.006 (0.026)
0.050 (0.036)
0.052 (0.035)
-0.024 (0.025)
DUM2008 -2.320 (1.410)
.. .. -0.629 (1.479)
-7.346*** (2.432)
0.031 (0.797)
DUM2009 -7.015*** (1.596)
.. .. -1.397 (2.211)
-10.104*** (3.220)
-6.214*** (1.497)
DUM2010 -2.965*** (0.615)
.. .. -4.746*** (1.144)
-5.094*** (1.821)
-2.394** (0.571)
R2 0.640 0.719 0.360 0.752 0.852 0.547
Countries 11 11 11 11 3 8
Time 96-14 96-14 96-07 08-14 96-14 96-14
Obs. 209 209 132 77 57 152
Notes: Robust standard errors are shown in brackets. Superscripts ***, **, * denote that the coefficient estimate is statisti-cally different from 0 at the 1, 5 and 10 percent level of significance respectively.
The estimation results in Table 2 confirm the robustness of the relationship between the cur-rent account balance and short-term economic growth. Growth of imports in the trading part-ners leads to higher economic growth in the sample countries, while changes in competitive-ness appear to be unimportant in all the different specifications. The main result is that the marginal effect of the current account balance on short-term economic growth is around -0.3
5 If neither the dummies DUM2008, DUM2009 and DUM2010 nor time fixed effects are included, the estimated coefficient of CA is -0.447.
10
in the full sample in Columns (2.1) and (2.2) and in the various subdivisions in Columns (2.3)-(2.6).6 The graphical and econometric analyses in this section reveal that economic growth and capi-tal inflows have gone hand-in-hand in the EU countries from Central and Eastern Europe in-cluding the Baltic states. The finding is consistent with the experiences during the pre-crisis boom and the deep downturns during the global financial crisis, and the finding is also consis-tent with the lacklustre growth performance since 2010 when uncertainty and risk aversion have held back capital flows to emerging markets, including the Baltic states. 4. GDP growth adjusted for capital flows
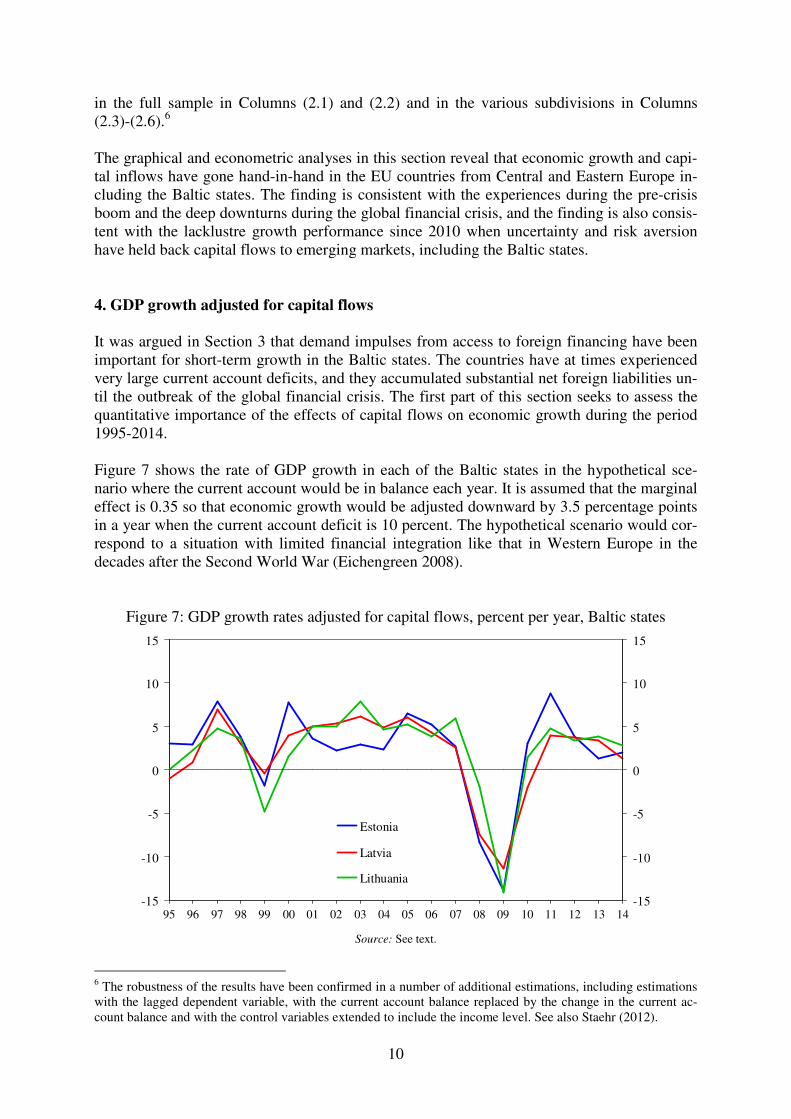
It was argued in Section 3 that demand impulses from access to foreign financing have been important for short-term growth in the Baltic states. The countries have at times experienced very large current account deficits, and they accumulated substantial net foreign liabilities un-til the outbreak of the global financial crisis. The first part of this section seeks to assess the quantitative importance of the effects of capital flows on economic growth during the period 1995-2014. Figure 7 shows the rate of GDP growth in each of the Baltic states in the hypothetical sce-nario where the current account would be in balance each year. It is assumed that the marginal effect is 0.35 so that economic growth would be adjusted downward by 3.5 percentage points in a year when the current account deficit is 10 percent. The hypothetical scenario would cor-respond to a situation with limited financial integration like that in Western Europe in the decades after the Second World War (Eichengreen 2008).
Figure 7: GDP growth rates adjusted for capital flows, percent per year, Baltic states
-15
-10
-5
0
5
10
15
95 96 97 98 99 00 01 02 03 04 05 06 07 08 09 10 11 12 13 14-15
-10
-5
0
5
10
15
Estonia
Latvia
Lithuania
Source: See text.
6 The robustness of the results have been confirmed in a number of additional estimations, including estimations with the lagged dependent variable, with the current account balance replaced by the change in the current ac-count balance and with the control variables extended to include the income level. See also Staehr (2012).
11
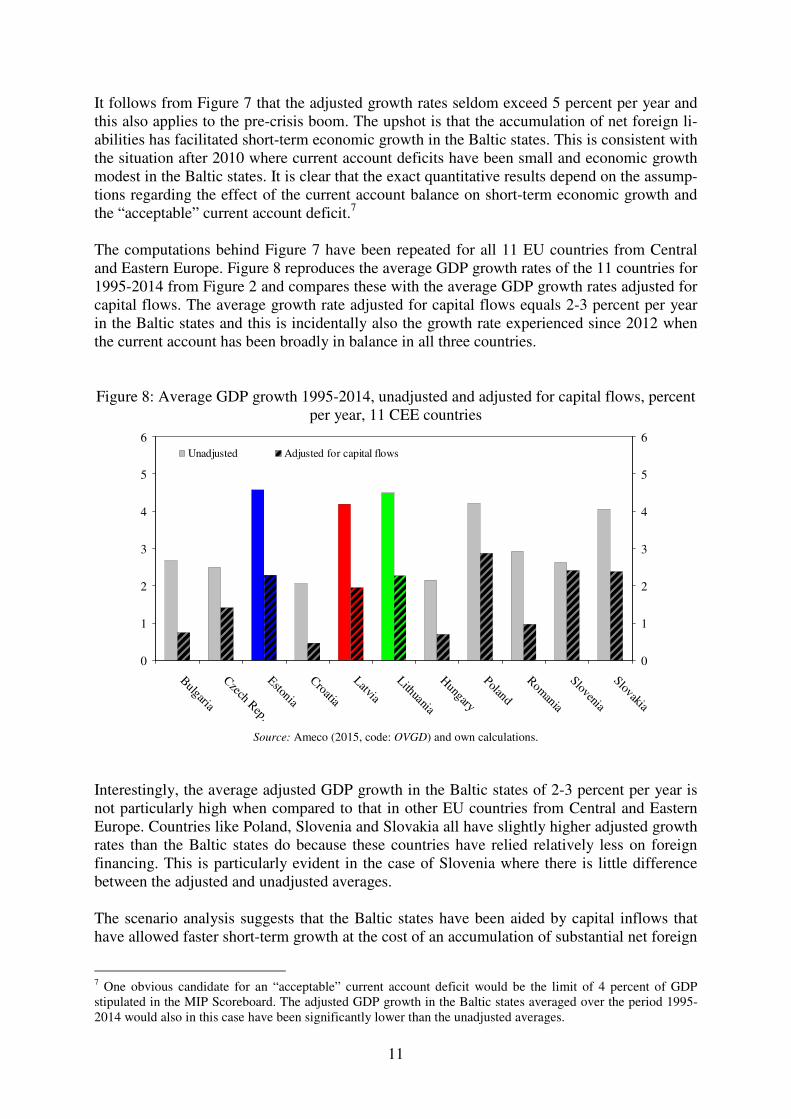
It follows from Figure 7 that the adjusted growth rates seldom exceed 5 percent per year and this also applies to the pre-crisis boom. The upshot is that the accumulation of net foreign li-abilities has facilitated short-term economic growth in the Baltic states. This is consistent with the situation after 2010 where current account deficits have been small and economic growth modest in the Baltic states. It is clear that the exact quantitative results depend on the assump-tions regarding the effect of the current account balance on short-term economic growth and the “acceptable” current account deficit.7 The computations behind Figure 7 have been repeated for all 11 EU countries from Central and Eastern Europe. Figure 8 reproduces the average GDP growth rates of the 11 countries for 1995-2014 from Figure 2 and compares these with the average GDP growth rates adjusted for capital flows. The average growth rate adjusted for capital flows equals 2-3 percent per year in the Baltic states and this is incidentally also the growth rate experienced since 2012 when the current account has been broadly in balance in all three countries. Figure 8: Average GDP growth 1995-2014, unadjusted and adjusted for capital flows, percent
per year, 11 CEE countries
0
1
2
3
4
5
6
Bulgaria
Czech Rep.
Estonia
Croatia
Latvia
Lithuania
Hungary
Poland
Romania
Slovenia
Slovakia
0
1
2
3
4
5
6Unadjusted Adjusted for capital flows
Source: Ameco (2015, code: OVGD) and own calculations.
Interestingly, the average adjusted GDP growth in the Baltic states of 2-3 percent per year is not particularly high when compared to that in other EU countries from Central and Eastern Europe. Countries like Poland, Slovenia and Slovakia all have slightly higher adjusted growth rates than the Baltic states do because these countries have relied relatively less on foreign financing. This is particularly evident in the case of Slovenia where there is little difference between the adjusted and unadjusted averages. The scenario analysis suggests that the Baltic states have been aided by capital inflows that have allowed faster short-term growth at the cost of an accumulation of substantial net foreign
7 One obvious candidate for an “acceptable” current account deficit would be the limit of 4 percent of GDP stipulated in the MIP Scoreboard. The adjusted GDP growth in the Baltic states averaged over the period 1995-2014 would also in this case have been significantly lower than the unadjusted averages.
12
liabilities. When this effect is removed, the growth performance of the Baltic states is close to the levels seen in several other countries in Central and Eastern Europe. This rather unspec-tacular performance is also notable because the Baltic states are among the EU countries with the lowest per capita income. Empirical studies typically find evidence of convergence, im-plying that countries with low per capita income grow faster than countries with high per cap-ita income.8 The upshot is that the underlying growth potential in the Baltic states is likely to be lower than what is apparent from the overall growth performance since 1995. 5. Potential growth and puzzling data
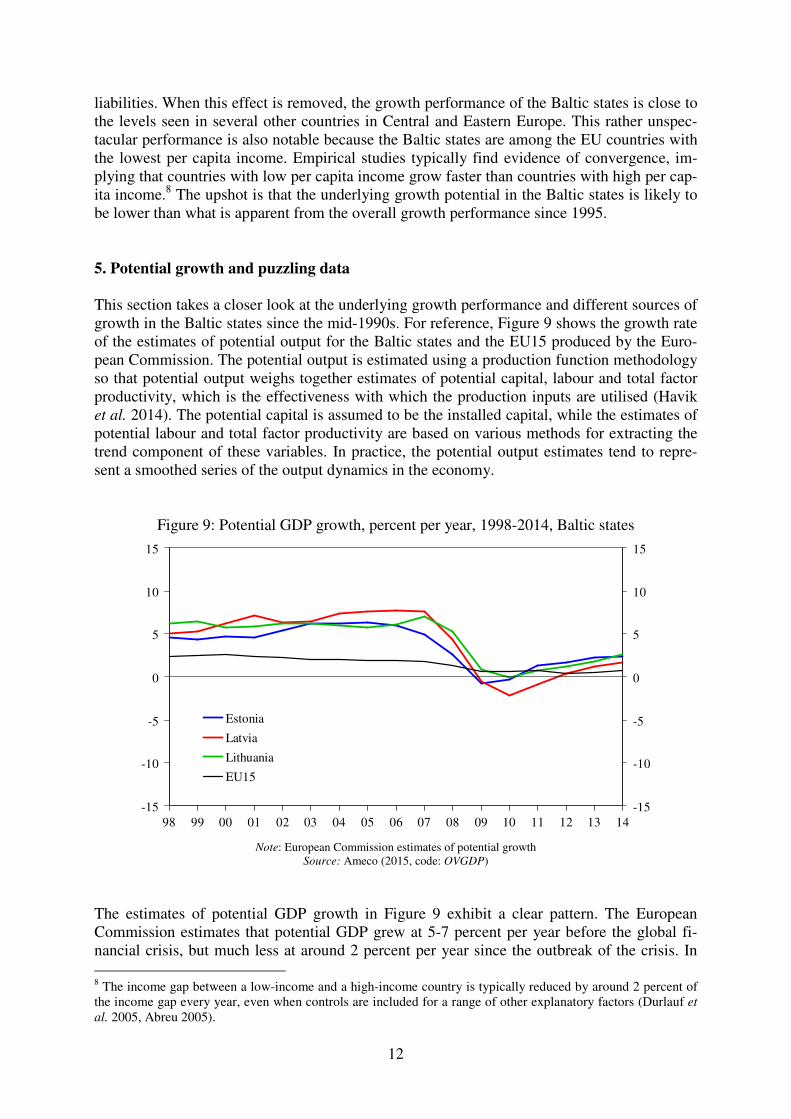
This section takes a closer look at the underlying growth performance and different sources of growth in the Baltic states since the mid-1990s. For reference, Figure 9 shows the growth rate of the estimates of potential output for the Baltic states and the EU15 produced by the Euro-pean Commission. The potential output is estimated using a production function methodology so that potential output weighs together estimates of potential capital, labour and total factor productivity, which is the effectiveness with which the production inputs are utilised (Havik et al. 2014). The potential capital is assumed to be the installed capital, while the estimates of potential labour and total factor productivity are based on various methods for extracting the trend component of these variables. In practice, the potential output estimates tend to repre-sent a smoothed series of the output dynamics in the economy.
Figure 9: Potential GDP growth, percent per year, 1998-2014, Baltic states
-15
-10
-5
0
5
10
15
98 99 00 01 02 03 04 05 06 07 08 09 10 11 12 13 14-15
-10
-5
0
5
10
15
Estonia
Latvia
Lithuania
EU15
Note: European Commission estimates of potential growth
Source: Ameco (2015, code: OVGDP)
The estimates of potential GDP growth in Figure 9 exhibit a clear pattern. The European Commission estimates that potential GDP grew at 5-7 percent per year before the global fi-nancial crisis, but much less at around 2 percent per year since the outbreak of the crisis. In 8 The income gap between a low-income and a high-income country is typically reduced by around 2 percent of the income gap every year, even when controls are included for a range of other explanatory factors (Durlauf et
al. 2005, Abreu 2005).
13
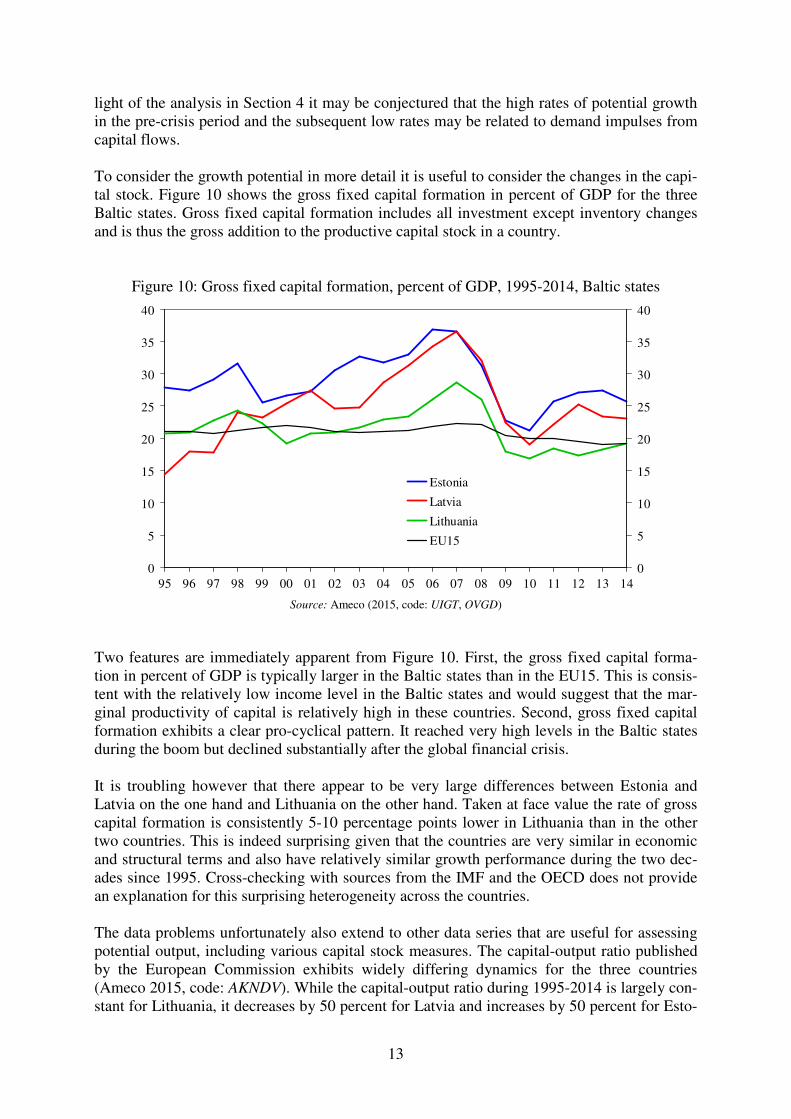
light of the analysis in Section 4 it may be conjectured that the high rates of potential growth in the pre-crisis period and the subsequent low rates may be related to demand impulses from capital flows. To consider the growth potential in more detail it is useful to consider the changes in the capi-tal stock. Figure 10 shows the gross fixed capital formation in percent of GDP for the three Baltic states. Gross fixed capital formation includes all investment except inventory changes and is thus the gross addition to the productive capital stock in a country.
Figure 10: Gross fixed capital formation, percent of GDP, 1995-2014, Baltic states
0
5
10
15
20
25
30
35
40
95 96 97 98 99 00 01 02 03 04 05 06 07 08 09 10 11 12 13 140
5
10
15
20
25
30
35
40
Estonia
Latvia
Lithuania
EU15
Source: Ameco (2015, code: UIGT, OVGD)
Two features are immediately apparent from Figure 10. First, the gross fixed capital forma-tion in percent of GDP is typically larger in the Baltic states than in the EU15. This is consis-tent with the relatively low income level in the Baltic states and would suggest that the mar-ginal productivity of capital is relatively high in these countries. Second, gross fixed capital formation exhibits a clear pro-cyclical pattern. It reached very high levels in the Baltic states during the boom but declined substantially after the global financial crisis. It is troubling however that there appear to be very large differences between Estonia and Latvia on the one hand and Lithuania on the other hand. Taken at face value the rate of gross capital formation is consistently 5-10 percentage points lower in Lithuania than in the other two countries. This is indeed surprising given that the countries are very similar in economic and structural terms and also have relatively similar growth performance during the two dec-ades since 1995. Cross-checking with sources from the IMF and the OECD does not provide an explanation for this surprising heterogeneity across the countries. The data problems unfortunately also extend to other data series that are useful for assessing potential output, including various capital stock measures. The capital-output ratio published by the European Commission exhibits widely differing dynamics for the three countries (Ameco 2015, code: AKNDV). While the capital-output ratio during 1995-2014 is largely con-stant for Lithuania, it decreases by 50 percent for Latvia and increases by 50 percent for Esto-
14
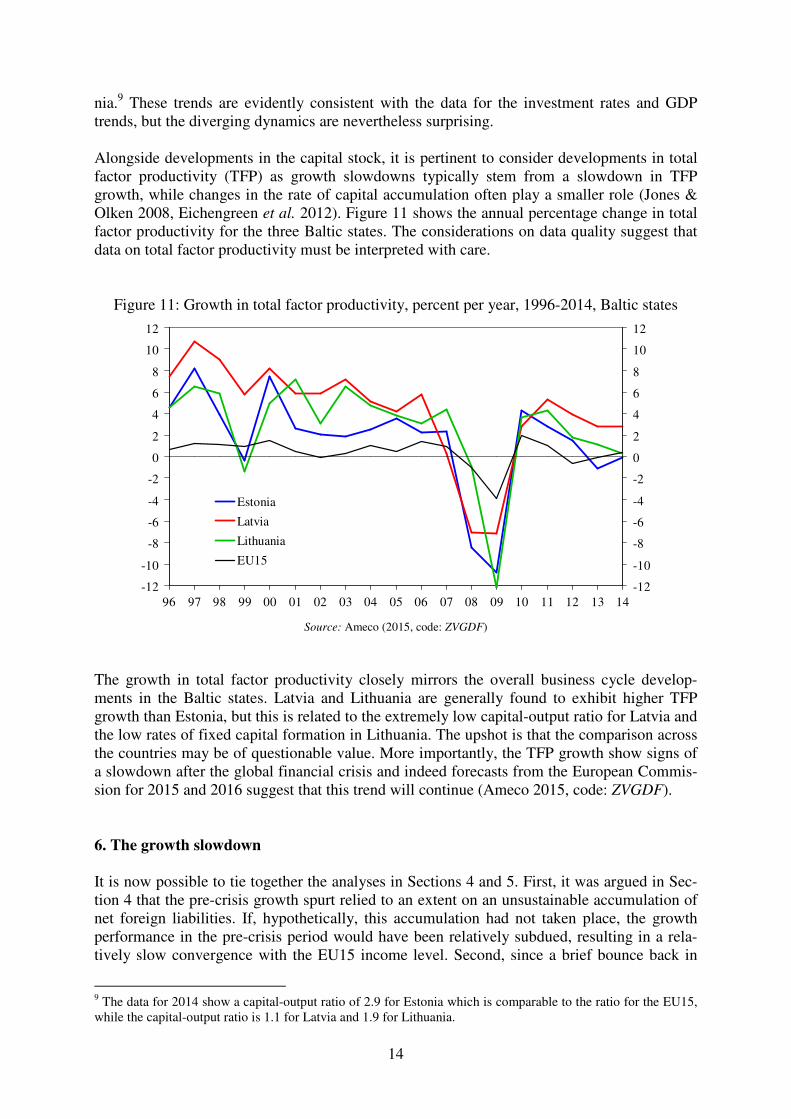
nia.9 These trends are evidently consistent with the data for the investment rates and GDP trends, but the diverging dynamics are nevertheless surprising. Alongside developments in the capital stock, it is pertinent to consider developments in total factor productivity (TFP) as growth slowdowns typically stem from a slowdown in TFP growth, while changes in the rate of capital accumulation often play a smaller role (Jones & Olken 2008, Eichengreen et al. 2012). Figure 11 shows the annual percentage change in total factor productivity for the three Baltic states. The considerations on data quality suggest that data on total factor productivity must be interpreted with care.
Figure 11: Growth in total factor productivity, percent per year, 1996-2014, Baltic states
-12
-10
-8
-6
-4
-2
0
2
4
6
8
10
12
96 97 98 99 00 01 02 03 04 05 06 07 08 09 10 11 12 13 14-12
-10
-8
-6
-4
-2
0
2
4
6
8
10
12
Estonia
Latvia
Lithuania
EU15
Source: Ameco (2015, code: ZVGDF)
The growth in total factor productivity closely mirrors the overall business cycle develop-ments in the Baltic states. Latvia and Lithuania are generally found to exhibit higher TFP growth than Estonia, but this is related to the extremely low capital-output ratio for Latvia and the low rates of fixed capital formation in Lithuania. The upshot is that the comparison across the countries may be of questionable value. More importantly, the TFP growth show signs of a slowdown after the global financial crisis and indeed forecasts from the European Commis-sion for 2015 and 2016 suggest that this trend will continue (Ameco 2015, code: ZVGDF). 6. The growth slowdown
It is now possible to tie together the analyses in Sections 4 and 5. First, it was argued in Sec-tion 4 that the pre-crisis growth spurt relied to an extent on an unsustainable accumulation of net foreign liabilities. If, hypothetically, this accumulation had not taken place, the growth performance in the pre-crisis period would have been relatively subdued, resulting in a rela-tively slow convergence with the EU15 income level. Second, since a brief bounce back in
9 The data for 2014 show a capital-output ratio of 2.9 for Estonia which is comparable to the ratio for the EU15, while the capital-output ratio is 1.1 for Latvia and 1.9 for Lithuania.

15
2010-2011, economic growth has been modest in the Baltic states. Notwithstanding the sub-stantial uncertainty about the contents of the data, total factor productivity growth seems to have been relatively low after the global financial crisis and forecasts suggest that this will remain the case for a while. Finally, the gross fixed capital formation in percent of GDP after the crisis is low compared to what it was in earlier periods. The conclusion is that the relative decline in growth after the crisis may be long-lasting, suggesting that there is a risk that the Baltic states may be caught in a middle income trap. The issue of a country failing to transition from being a middle-income economy to being a high-income one was first labelled the middle income trap in a study by Gill et al. (2007). The study considered the experiences of several Asian countries and found that whereas some had succeeded in making the transition, others had not (see also Appendix A). The issue regained impetus after the global financial crisis as growth prospects weakened in many emerging economies. The possibility of a middle income trap has been discussed in several studies in-cluding Eichengreen et al. (2012, 2013), Cai (2012), Aiyar et al. (2013) and Kanchoochat (2014). It is generally found that growth slowdowns occur when “easy” productivity gains from sectoral reallocation and imports of foreign technology have been exhausted. This is consistent with the finding that growth slowdowns are typically associated with a correspond-ing slowdown in TFP growth (Jones & Olken 2008, Eichengreen et al. 2012). Some authors, including Pritchett & Summers (2014), argue that the risk of a middle income trap should not be exaggerated. As the gap between an emerging market economy and the high-income economies narrows, the advantage from backwardness is reduced and economic growth will slow down. Moreover, growth rates are bound to change over time and periods of lower growth may be succeeded by periods with higher rates of growth. The upshot is that a wide range of outcomes are possible for the convergence process of an emerging economy, but this, of course, includes the possible outcome of a slowdown in growth for an extended period. The term “trap” suggests that the middle income outcome is the result of self-fulfilling or self-reinforcing mechanisms. Agénor & Canuto (2012) present a model of multiple rational expec-tations equilibria with one middle income equilibrium and one high income equilibrium. The argument runs as follows. A middle income economy is engaged in relatively simple produc-tion activities and mainly employs workers with relatively short or basic education, while a high income economy is engaged in design, invention and advanced production activities and to that end employs many highly skilled workers. Individuals in the middle income economy have little incentive to invest in education, because very few highly educated workers are em-ployed in this economy. The firms operating in the middle income economy cannot move into highly productive innovation and design activities, because there are so few highly educated workers. In this way the economy is trapped as a middle income economy. In the high income economy, on the other hand, individuals have an incentive to invest in education and the firms can engage in highly productive activities as they have ample access to highly educated work-ers. Along these lines of reasoning, the middle income trap is essentially the result of a coor-dination problem. There are likely many mechanisms through which a middle income trap can emerge (Cai 2012, Agénor et al. 2012).10 Advanced infrastructure such as high-speed communication and
10 The conceptualisation of the middle income trap bears many similarities to the conceptualisation of the low
income trap in Nurkse (1953). The prescribed remedy for the low income trap is “balanced growth”, where de-velopments in different sectors or parts of the economy are coordinated.
16
efficient city transportation may not benefit a middle income economy very much and there is therefore little incentive to invest in an improvement of the infrastructure, but this may make it more difficult for the economy to transition to becoming a high income economy. The same line of reasoning may apply for measures to improve enforcement of intellectual property rights, reduce corruption, improve business practices or ensure the flexible labour markets that are conducive for a knowledge-based economy. There is evidence suggesting that these coordination problems may indeed have been behind growth slowdowns in reality. Eichengreen et al. (2013) use data for the period 1957-2010 and identify a substantial number of growth slowdowns. They find using probit regression tech-niques that a country where a high share of the population has completed tertiary education has a lower probability of experiencing a growth slowdown, whereas the share of the popula-tion with secondary education appears unimportant. A large share of high technology in ex-ports appears to reduce the risk of the middle income trap.11 A large old-age dependency bur-den and a financial crisis appear to increase the probability of a slowdown; these results may partly be due to the development of investments. Aiyar et al. (2013) use a large sample of 138 countries from 1955-2009 and identify first epi-sodes of growth slowdowns and then the determinants of those slowdowns. Using the full
sample it is found that the probability of a growth slowdown decreases if institutions are strong, if the old-age dependency ratio is low, if the macroeconomic environment is strong, if the investment share is high, and if output and trade are diversified. Using a subsample of middle income countries it emerges furthermore that a small government and highly devel-oped infrastructure reduce the probability of a growth slowdown. Given the substantial data and methodology problems it is reassuring that the robustness of the results is confirmed us-ing Bayesian Model Averaging. Theory and the empirical studies by Eichengreen et al. (2013), Aiyar et al. (2013) and others provide largely overlapping lists of factors that may increase the likelihood of a country being caught in a middle income trap. Several of these factors may be relevant for the Baltic states and other EU countries lagging behind the frontier group of high income countries. Before discussing the list of factors in the context of the Baltic states, it is useful to consider whether the Baltic states comply with the main assumption of the coordination problem model, which is that the high income equilibrium is one where research and development, innovation and design increase productivity. Whereas productivity gains from sectoral reallocation may be important in less developed countries, these gains have been relatively small in the CEE countries since the mid-1990s, perhaps because the CEE countries were already industrialised when the transition process began in the early 1990s. Bah & Brada (2009) find from pre-crisis data that sectoral realloca-tion played a very small role in aggregate TFP growth in the CEE countries. Kuusk et al. (2015) consider labour productivity and also conclude that structural or sectoral change does not contribute substantially to aggregate productivity growth in the Baltic states with the ex-ception of the late stage of the boom period 2005-2007 where labour moved into more pro-ductive sectors. Interestingly, Kuusk et al. (2015) also find that there has been little sectoral change after the global financial crisis.
11 This result may be due to policies that have “defied” comparative advantages by favouring research and de-velopment, innovation and design activities (Kanchoochat 2014).
17
The second observation concerns the distribution of productivity at the microeconomic level. Evidence from the ECB Competitiveness Network shows that the firms in the Baltic states and other EU countries from Central and Eastern Europe are on average not very productive and that there are very few highly productive firms (ECB 2014, Lopez-Garcia et al. 2015). This stands in contrast to the distribution of firm productivity in the high income countries in Western Europe where the average is lifted by many highly productive firms. This appears to confirm that for the Baltic states to close the aggregate productivity gap, a larger share of the firms than is currently the case must engage in highly productive production processes involv-ing research and development, innovation, design and service. Returning to the list of factors that may increase the likelihood of a middle income trap, sev-eral may be of importance for the Baltic states. Arguably the most important factor may be education and in particular tertiary education. Spending on education in the Baltic states is generally somewhat below the spending in the EU15 and particularly the neighbouring Nordic countries.12 In 2014 the share of the population aged 25-64 with a tertiary degree was 38.8 percent in Estonia, 30.2 percent in Latvia and 36.7 in Lithuania, while the average for the EU15 countries was 30.8 percent (Eurostat 2015, code: edat_lfse_07). Although the statistics bear witness to very well educated populations, it must be noted that the tertiary education systems in the Baltic states and other CEE countries are very heteroge-neous and this may also affect the scope and the quality of the education provided (Kogan 2008). The Eurostudent IV survey reveals that tertiary students in Estonia and Latvia gener-ally spend little time on attending classes and studying themselves while they spend much time on paid work (Orr et al. 2011). This pattern is particularly pronounced for master stu-dents. Estonia and Latvia are the two countries in the survey where the master students spend the most time working, on average 27 hours per week. The exports of the Baltic states gradually evolved from products produced in low-skilled sec-tors to products produced in medium-skilled sectors during the 1990s (Zaghini 2005). Even so, high-tech products provide a relatively small share of total exports compared to other CEE countries like the Czech Republic and Hungary. It is also notable that many of the high-tech products exported are only assembled in the Baltic states and often exhibit little domestic value added. The relatively unsophisticated export structure of the Baltic states seems to have remained after the global financial crisis (Remeikiene et al. 2015). The Baltic states have seen a rapid increase in the old-age dependency rate, which may curtail dynamism and increase the likelihood of a middle income trap arising. The old-age depend-ency ratio is typically computed as the number of people aged 65 or above relative to the number of people aged 15-64. The dependency ratio was 27-29 percent for the Baltic states in 2014, which is slightly below the EU average (Eurostat 2015, code: demo_pjanind). Projec-tions suggest that the old-age dependency ratio will increase rapidly in the coming decades and this trend may be aggravated if emigration continues to reduce the size of the working-age population. Finally, the Baltic states were strongly affected by the global financial crisis and have subse-quently seen a substantial reduction in investment, cf. Section 5. This is consistent with the pattern of low growth and low TFP growth present in all three Baltic states after the crisis. 12 In 2011 total public and private spending on education was 5.5 percent of GDP in Estonia, 5.6 percent in Lat-via and 5.8 percent in Lithuania, while it was 7.0 percent of GDP in Sweden (Eurostat 2015, code: educ_thexp).
18
The conclusion from the discussion of the literature on the middle income trap is that the Bal-tic states exhibit features that could potentially make them vulnerable to the middle income trap. The countries have gone through an exceptionally severe economic and financial crisis, the production and export structures are tilted toward low-tech products, and the education sector might exhibit quality problems. None of these factors prevent a return to fast economic growth and rapid convergence, but they do indicate the challenges faced by policymakers in the Baltic states. 7. Policy challenges
The analyses in this paper have concluded that although the Baltic states overall have exhib-ited strong economic growth in the two decades since 1995, the growth prospects for the short and medium terms are less encouraging. The growth spurt before the global financial crisis appears in large part to have been made possible by large capital inflows that lifted short-term economic growth but may have had little effect on longer-term growth. This finding is consis-tent with the relatively low growth rates seen since the global financial crisis and with the forecasts for the coming years. The conclusion is that there is a risk that the Baltic states could be caught in a middle income trap with relatively low growth rates and slow or non-existent convergence with Western European income levels. This conclusion makes it pertinent to discuss possible policies which the Baltic states may pursue to increase potential growth in the years ahead. The theory and the empirical studies on the medium income trap are useful starting points for the policy discussion. The premise is that to raise growth, the production processes in the Baltic states must move up the value chains and this requires change from simple manufacturing and low value-added services where the products are sold in competition with producers from Asian and elsewhere to proc-esses with substantial contents of research and development, innovation and design. This move would bring rents from knowledge, agglomeration, specialisation and location, which can be translated into larger value added and allow high returns to the production factors em-ployed (Baldwin & Evenett 2015). This transformation, moving up the value chain, may be facilitated by investment in human capital, physical capital and innovation, and by ensuring a conducive and stable economic environment (Foxley & Sossdorf 2011, Kharas & Kohli 2011, Agénor et al. 2012).13 Knowledge-based production requires investment in people and human capital. This may be facilitated by comprehensive reforms strengthening education and skills accumulation at all levels, including education at tertiary level. Firms should have access to a substantial pool of researchers and specialists with world class qualifications. Universities and tertiary schools should be international leaders and should benchmark their performance against top Western institutions. Students should be full-time students and commit their entire time to studies and academic advancement, something which requires scholarships and student loans to be avail-able. Life-long learning should be encouraged to ensure that the aging of society does not re-duce the pool of qualified specialists. Finally, reliable and easily available child care, health care services and social support may also be important for improving the quantity and the quality of the labour supply.
13 See also OECD (2015a) for a broader discussion of growth enhancing reforms and OECD (2015b) for country specific recommendations.
19
Knowledge-based production requires investment in physical capital as well as know-how or intellectual capital. These investments will typically be borne by privately-owned firms and it is therefore important that financing be available. Studies suggest that investment in research and development and other forms of knowledge accumulation are particularly difficult for firms from central and eastern Europe to finance (Meriküll & Männisoo 2015). There is al-ready substantial support for private research and development in the Baltic states, but there is arguably a need to develop financing schemes that share rewards and risks between private firms and the authorities in effective and fair ways. Other measures may also help strengthen investment in physical capital and know-how. Stud-ies often find that infrastructure and communication investments have substantial returns and may help raise total factor productivity in the economy (La Ferrara & Marcellino 2006). The authorities may take steps to improve the protection of intellectual property rights, to reduce bureaucracy and to clamp down on corruption, and to affect influence peddling and tax eva-sion.14 These measures are particularly important in a knowledge-based economy where products are often immaterial and where trust and network effects are pivotal. Regional poli-cies should similarly acknowledge the importance of network and agglomeration effects and this is likely to demand a certain concentration of production activities and the work force. Countries risk being caught in a middle income trap after a financial crisis affecting invest-ment and the outlook for companies and individuals, and the experience in the Baltic states after the global financial crisis does indeed point in this direction. This underscores the need for the authorities to lower the likelihood of a future crisis by preventing financial and eco-nomic imbalances accumulating, by using macro-prudential and micro-prudential regulation actively, and by implementing counter-cyclical fiscal policies. Studies find that countries with little output variability on average grow faster than countries with a lot of output variability (Dabušinskas et al. 2012). As discussed the middle-income trap is seen as stemming from a coordination problem where the individually rational choices lead to an inefficient outcome. One such example would be individuals that do not seek education because firms do not engage in knowledge-based pro-duction and firms that do not engage in knowledge-based production because there are too few highly educated workers. This would suggest that the authorities or policymakers may play an important coordinating role, seeking to encourage behaviour that leads to an efficient outcome.15 Measures to get a country out of the middle income trap should therefore take into account the complementarity of the different elements, i.e. the measures must be comprehen-sive and mutually coordinated and it is important that households and firms can be confident that the policies will remain in place for a long time. For the Baltic states the considerations above suggest that policies that may reduce the prob-ability of being caught in a middle income trap should be comprehensive and seek to coordi-nate activities across firms, households and the government. Such policies may raise potential growth over time, but may also incur short-term costs for households and firms. To avoid growth enhancing policies being subject to unjustified delays due to a war of attrition the po-litical process may be important. It is notable that major reform packages seeking to reinvigo-rate economic growth have often been agreed in tripartite negotiations between government,
14 Meriküll et al. (2013) find from survey data from the Baltics that firms in the Baltic states consider these prob-lems to be widespread and important for their business activities. 15 Individuals investing in education should have an expectation of getting a high-paying job, and firms investing in innovation and knowledge should expect to find workers with sufficient qualifications.
20
industry and labour organisations. This was for instance the case in Ireland at the end of the 1980s, in Finland after the bank crisis at the beginning of the 1990s, and in South Korea after the Asian crisis at the end of the 1990s (Foxley & Sossdorf 2011). It is clear that the specific measures of programmes to enhance growth in the Baltic states must take country-specific features and the preferences of the public and policymakers into account. It would be very instructive to use thorough and detailed analyses to compare the performance of the individual countries and also to compare the Baltic states and other emerg-ing economies. One issue of particular importance is the very different investment levels and capital efficiencies in the three Baltic states. A number of countries, including the Nordic countries, Canada, New Zealand and Australia, have established “productivity commissions” which have analysed productivity developments and their courses, and which have produced ideas for raising productivity and trend growth. Similar initiatives would be useful in the Bal-tic states with the eventual goal of reducing the probability that those countries being caught in a middle income trap.
21
List of literature
Abreu, Maria, Henri L. F. de Groot & Raymond J. G. M. Florax (2005): “A meta-analysis of beta-convergence: the legendary two percent”, Journal of Economic Surveys, vol. 19, no. 3, pp. 389-420.
Agénor, Pierre-Richard & Otaviano Canuto (2012): “Middle-income growth traps”, World Bank Policy Research Working Paper, no. 6210.
Agénor, Pierre-Richard, Otaviano Canuto & Michael Jelenic (2012): “Avoiding middle-income growth traps”, VOX (CEPR’s Policy Portal), http://www.voxeu.org/article/ avoiding-middle-income-growth-traps.
Aiyar, Shekhar, Romain Duval, Damien Puy, Yiqun Wu & Longmei Zhang (2013): “Growth slowdowns and the middle-income trap”, IMF Working Paper, no. WP/13/71, Interna-tional Monetary Fund.
Ameco (2015): “Annual macro-economic database”, http://ec.europa.eu/economy_finance/ ameco/user/serie/SelectSerie.cfm.
Åslund (2012): “Is the catching up process in Central and Eastern Europe sustainable?”, in Ewald Nowotny, Peter Mooslechner & Doris Ritzberger-Grünwald (eds.): European
Integration in a Global Economy: CESEE and the Impact of China and Russia, Ed-ward Elgar, ch. 13, p. 129-146.
Bah, El-hadj M. & Josef C. Brada (2009): “Total factor productivity growth, structural change and convergence in the new members of the European Union”, Comparative Eco-
nomic Studies, vol. 51, no. 4, pp. 421-446.
Bajo-Rubioa, Oscar & Carmen Díaz-Roldán (2009): “Does the balance of payments constrain economic growth? Some evidence for the new EU members”, Post-Communist
Economies, vol. 21, no. 1, pp. 41-46.
Baldwin, Richard E. & Simon J. Evenett (2015): “Value creation and trade in 21st century manufacturing”, Journal of Regional Science, vol. 55, no. 1, pp. 31-50.
Becker, T., D. Daianu, Z. Darvas, V. Gligorov, M. Landesmann, P. Petrovic, J. Pisani-Ferry, D. Rosati, A. Sapir, & B. Weder di Mauro (2010). Whither Growth in Central and
Eastern Europe? Policy Lessons for an Integrated Europe. Bruegel Blueprint Series No. 11, Bruegel, Brussels.
Brixiova, Zuzana, Laura Vartia & Andreas Worgotter (2010): “Capital flows and the boom-bust cycle: the case of Estonia”, Economic Systems, vol. 34, no. 1, pp. 55-72.
Cai, Fang (2012): “Is there a “middle-income trap”? Theories, experiences and relevance to China”, China & World Economy, vol. 20, no. 1, pp. 49-61.
Calvo, Guillermo (1998): “Capital flows and capital-market crises: the simple economics of sudden stops”, Journal of Applied Economics, vol. 1, no. 1, pp. 35-54.
Dabušinskas, Aurelijus, Dmitry Kulikov, Martti Randveer (2012): “The impact of volatility on economic growth”, Working Papers of Eesti Pank, no. 7/2012.
Durlauf, Steven N., Paul A. Johnson & Jonatan R. W. Temple (2005): “Growth economet-rics”, in Philippe Aghion & Steven N. Durlauf (eds.): Handbook of Economic Growth, Elsevier North-Holland, ch. 8, pp. 555-677.
ECB (2014): “Micro-based evidence of EU competitiveness. The CompNet database”, ECB Working Paper Series, no. 1634, European Central Bank.
22
Eichengreen, Barry (2008): The European Economy since 1945: Coordinated Capitalism and
Beyond, Princeton University Press.
Eichengreen, Barry, Donghyun Park & Kwanho Shin (2012): “When fast growing economies slow down: international evidence and implications for China”, Asian Economic Pa-
pers, vol. 11, no. 1, pp. 42-87.
Eichengreen, Barry, Donghyun Park & Kwanho Shin (2013): “Growth slowdowns redux: new evidence on the middle-income trap”, NBER Working Paper, no. 18673, National Bu-reau of Economic Research.
European Commission (2015): “European Economic Forecast. Spring 2015”, European Economy, no. 2/2015.
Eurostat (2015): “Database”, http://ec.europa.eu/eurostat/data/database.
Foxley, Alejandro & Fernando Sossdorf (2011): “Making the transition from middle-income to advanced economies”, The Carnegie Papers, Carnegie Endowment for International Peace.
Gill, Indermit Singh, Homi J. Kharas & Deepak Bhattasali (2007): An East Asian Renais-
sance: Ideas for Economic Growth, The World Bank
Havik, Karel, Kieran Mc Morrow, Fabrice Orlandi, Christophe Planas, Rafal Raciborski, Werner Roeger, Alessandro Rossi, Anna Thum-Thysen, Valerie Vandermeulen (2014): “The production function methodology for calculating potential growth rates and output gaps”, European Economy. Economic Papers, no. 535.
Jones, Benjamin & Benjamin Olken (2008): “The anatomy of start-stop growth”, Review of
Economics and Statistics, vol. 90, no. 3, pp. 582-587.
Kanchoochat, Veerayooth (2014): “The middle-income trap debate: taking stock, looking ahead”, mimeo, The Japan Institute of International Affairs, http://www2.jiia.or.jp/en/ papers.php#.
Kharas, Homi & Harinder Kohli (2011): “What is the middle income trap, why do countries fall into it, and how can it be avoided?”, Global Journal of Emerging Market Econo-mies, vol. 3, no. 3, pp. 281-289.
Kogan, Irena (2008): “Education systems of Central and Eastern European countries”, in Irena Kogan, Michael Gebel & Clemens Noelke (eds.): Europe Enlarged: A Handbook
of Education, Labour and Welfare Regimes in Central and Eastern Europe, The Pol-icy Press, ch. 1, pp. 7-34.
Kuusk, Andres, Karsten Staehr & Uku Varblane (2015): “Sectoral change and productivity growth during boom, bust and recovery in Central and Eastern Europe”, Working Pa-pers of Eesti Pank, no. 2/2015.
La Ferrara, Eliana & Massimiliano Marcellino (2006): “TFP, costs and public infrastructure: an equivocal relationship”, in Michael Artis & Anindya Banerjee (eds.): The Central
and Eastern European Countries and the European Union, Cambridge University Press.
Lopez-Garcia, Paloma, Filippo di Mauro & the CompNet Task Force (2015): “Assessing European competitiveness: the new CompNet microbased database”, ECB Working Paper Series, no. 1764, European Central Bank.
Meriküll, Jaanika & Kadri Männisoo (2015): “The impact of firm financing constraints on R&D over the business cycle”, Working Papers of Eesti Pank, no. 3/2015.
23
Meriküll, Jaanika, Tairi Rõõm & Karsten Staehr (2013): “Perceptions of unreported economic activities in Baltic firms. Individualistic and non-individualistic motives”, in Maaja Vadi & Tiia Vissak (eds.): (Dis)honesty in Management: Manifestations and Conse-
quences, Emerald, pp. 85-125.
Mitra, Pradeep, Marcelo Selowsky & Juan Zalduendo (2010): Turmoil at Twenty. Recession,
Recovery, and Reform in Central and Eastern Europe and the Former Soviet Union, The World Bank.
Nurkse, Ragnar (1953): Problems of Capital Formation in Underdeveloped Countries, Ox-ford University Press.
OECD (2015a): Economic Policy Reforms 2015: Going for Growth, OECD Publishing.
OECD (2015b): “Economic Policy Reforms”, http://www.oecd-ilibrary.org/economics/ economic-policy-reforms_18132723.
Orr, Dominic, Christoph Gwosc & Nicolai Netz (2011): Social and Economic Conditions of
Student Life in Europe (Eurostudent IV 2008-2011), W. Bertelsmann Verlag.
Pritchett, Lant & Lawrence H. Summers (2014): “Asiaphoria meets regression to the mean”, NBER Working Paper, no. W20573.
Remeikiene, Rita, Grazina Startiene & Daiva Dumciuviene (2015): “Assessment of the indus-try competitiveness of the Baltic states in the EU during the period of economic reces-sion”, Technological and Economic Development of Economy, vol. 21, no. 1, pp. 79-95.
Staehr, Karsten (2012): “External capital flows, international price competitiveness and short-term economic growth in Latvia”, European Economy – Occasional Papers, no. 120, pp. 19-39.
Thirlwall, Anthony P. (1979): “The balance of payments constraint as an explanation of inter-national growth rate differences”, Banca Nazionale del Lavoro Quarterly Review, vol. 32, no. 128, pp. 45-53.
Thirlwall, Anthony Ph. & M. Nureldin Hussain (1982): “The balance of payments constraint, capital flows and growth rate differences between developing countries”, Oxford Eco-
nomic Papers, Vol. 34, No. 3, pp. 498-510.
WEO (2015): “World Economic Outlook database”, April 2015 edition, International Mone-tary Fund, https://www.imf.org/external/pubs/ft/weo/2015/01/weodata/index.aspx.
Zaghini, Andrea (2005): “Evolution of trade patterns in the new EU member states”, Econom-
ics of Transition, vol. 13, no. 4, pp. 629-658. [All data valid on 1 June 2015.]
24
Appendix A: International comparison
Figure A.1: GDP per capita, PPS, index USA = 100, Baltic states, 1995-2014
0
20
40
60
80
100
95 96 97 98 99 00 01 02 03 04 05 06 07 08 09 10 11 12 13 140
20
40
60
80
100
Estonia
Latvia
Lithuania
Source: WEO (2015, label: Gross domestic product based on purchasing-power-parity (PPP) per capita GDP).
Figure A.2: GDP per capita, PPS, index USA = 100, Asian countries, 1980-2014
0
20
40
60
80
100
120
80 85 90 95 00 05 100
20
40
60
80
100
120Hong Kong Korea
Malaysia Thailand
Source: WEO (2015, label: Gross domestic product based on purchasing-power-parity (PPP) per capita GDP).
25
Figure A.3: GDP per capita, PPS, index USA = 100, Latin American countries, 1980-2014
0
20
40
60
80
100
80 85 90 95 00 05 100
20
40
60
80
100
Argentina
Brazil
Chile
Source: WEO (2015, label: Gross domestic product based on purchasing-power-parity (PPP) per capita GDP).