Embed Size (px)
Citation preview

ECE 571 – AdvancedMicroprocessor-Based Design
Lecture 8
Vince Weaver
http://www.eece.maine.edu/∼[email protected]
7 February 2013
Hardware Performance Counters – SoftwareTools
1
PAPI (Performance API)
• Low-level Performance Measurement Interface
• Cross-platform
• Self-monitoring or Sampling
• C, C++, Fortran (or attach to running process)
• Basis for more advanced visualization tools. Vampir,
Tau, PerfExpert, etc.
2
• Provides high-level access to timers
• Provides high and low-level access to performance
counters
• Provides profiling support
• Provides system information
• Components
• Fine-grained instrumentation
3
PAPI Limitations
• Limitations: In general have to modify source code
• Limitation: Overhead included in program run
4
PAPI Platforms
• Linux perf event
• Linux perfmon2/perfctr (mostly deprecated except Cray)
• IBM BlueGene P/Q
• Solaris
• FreeBSD
• IBM AIX
5
PAPI CPUs
• x86, MIC
• ARM
• Power
• SPARC
• Itanium
• MIPS
6
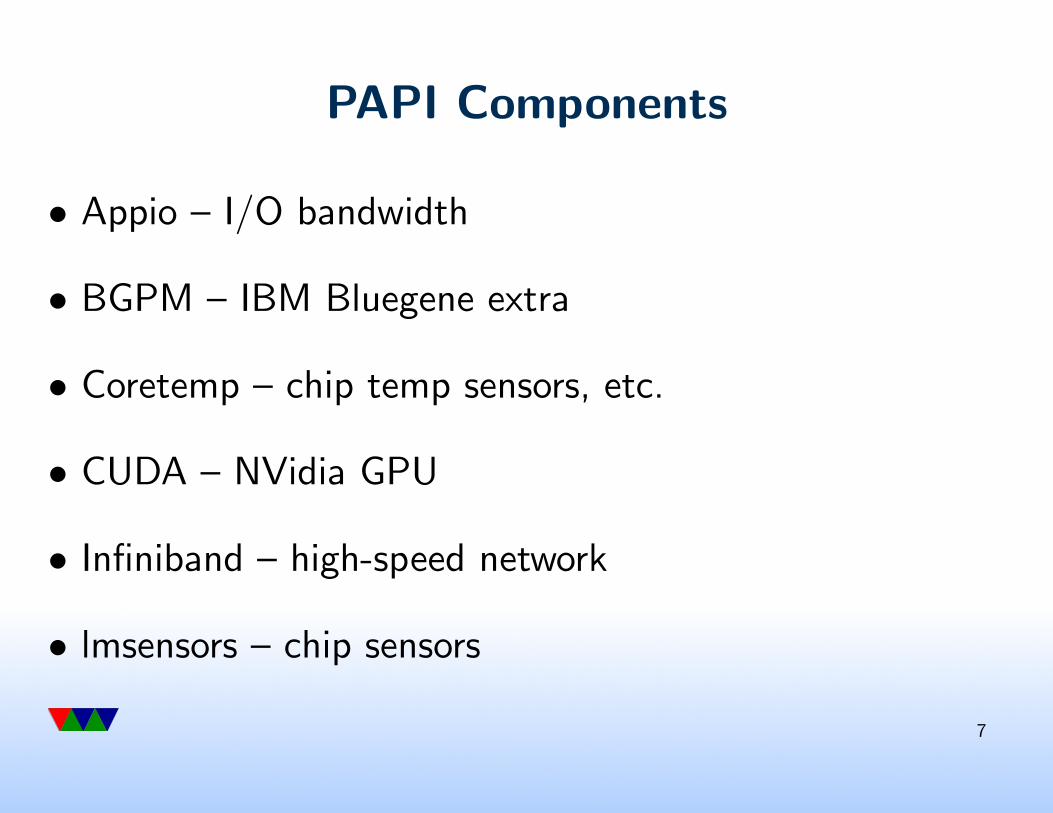
PAPI Components
• Appio – I/O bandwidth
• BGPM – IBM Bluegene extra
• Coretemp – chip temp sensors, etc.
• CUDA – NVidia GPU
• Infiniband – high-speed network
• lmsensors – chip sensors
7
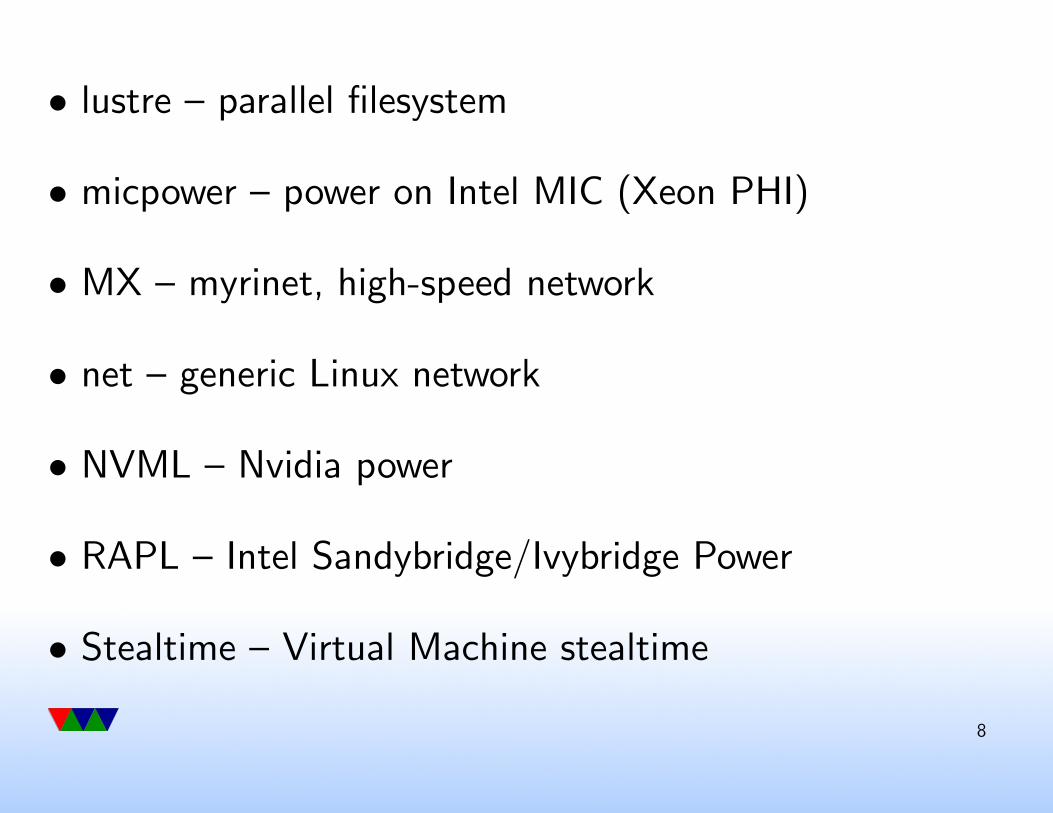
• lustre – parallel filesystem
• micpower – power on Intel MIC (Xeon PHI)
• MX – myrinet, high-speed network
• net – generic Linux network
• NVML – Nvidia power
• RAPL – Intel Sandybridge/Ivybridge Power
• Stealtime – Virtual Machine stealtime
8
• VMware – VMware stats
9
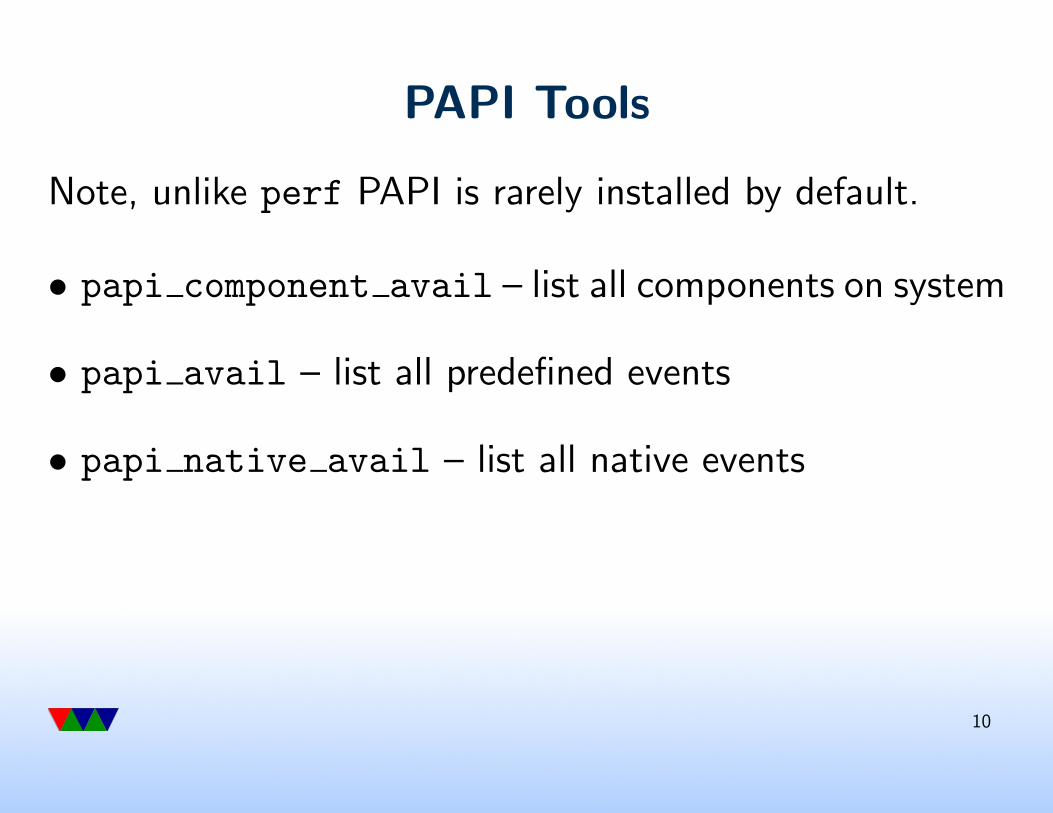
PAPI Tools
Note, unlike perf PAPI is rarely installed by default.
• papi component avail – list all components on system
• papi avail – list all predefined events
• papi native avail – list all native events
10
PAPI Instrumentation
Code has to be instrumented and linked against PAPI
library.
Usually this is done manually, but some tools can do
this automatically via binary instrumentation.
11
PAPI Timers
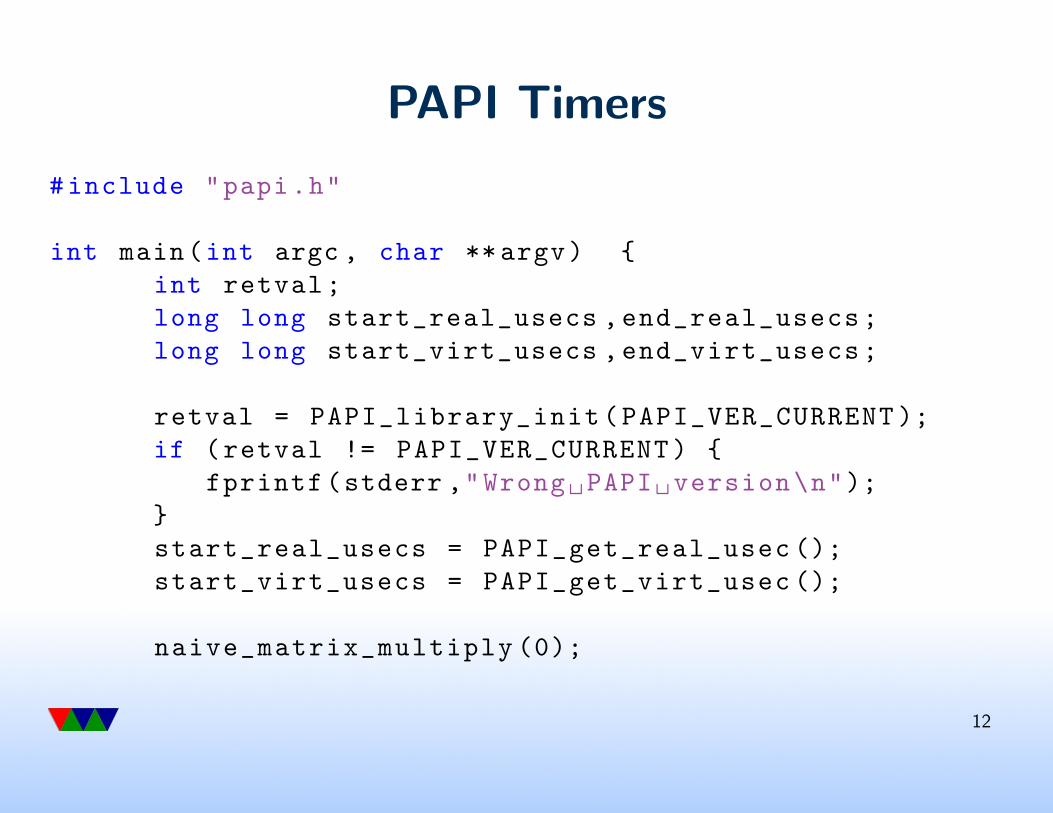
#include "papi.h"
int main(int argc , char **argv) {
int retval;
long long start_real_usecs ,end_real_usecs;
long long start_virt_usecs ,end_virt_usecs;
retval = PAPI_library_init(PAPI_VER_CURRENT );
if (retval != PAPI_VER_CURRENT) {
fprintf(stderr ,"Wrong PAPI version\n");
}
start_real_usecs = PAPI_get_real_usec ();
start_virt_usecs = PAPI_get_virt_usec ();
naive_matrix_multiply (0);
12
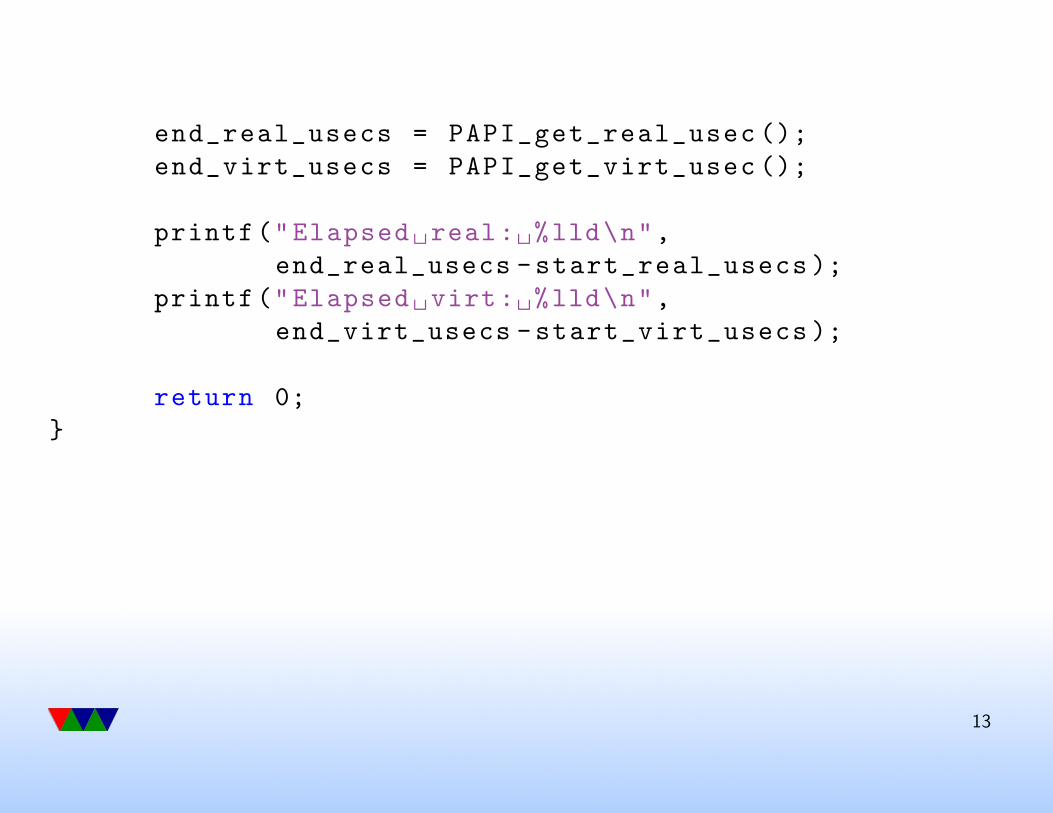
end_real_usecs = PAPI_get_real_usec ();
end_virt_usecs = PAPI_get_virt_usec ();
printf("Elapsed real: %lld\n",
end_real_usecs -start_real_usecs );
printf("Elapsed virt: %lld\n",
end_virt_usecs -start_virt_usecs );
return 0;
}
13
PAPI get real usec() vsPAPI get virt usec()
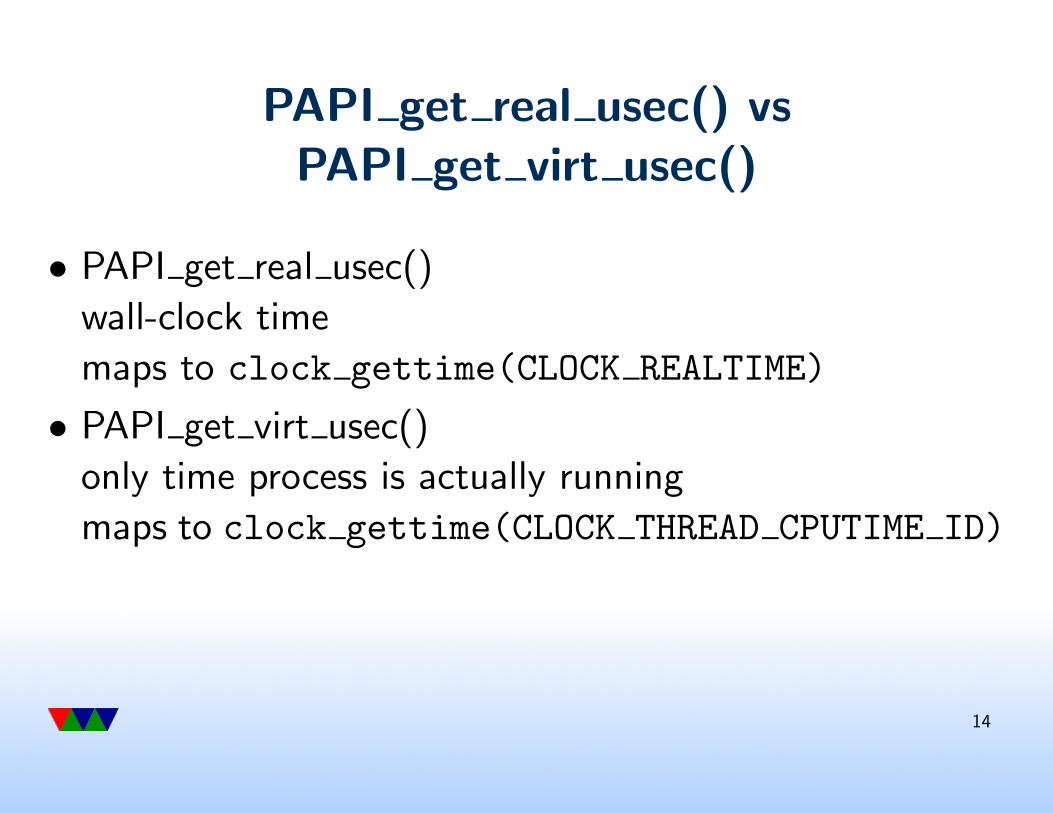
• PAPI get real usec()
wall-clock time
maps to clock gettime(CLOCK REALTIME)
• PAPI get virt usec()
only time process is actually running
maps to clock gettime(CLOCK THREAD CPUTIME ID)
14
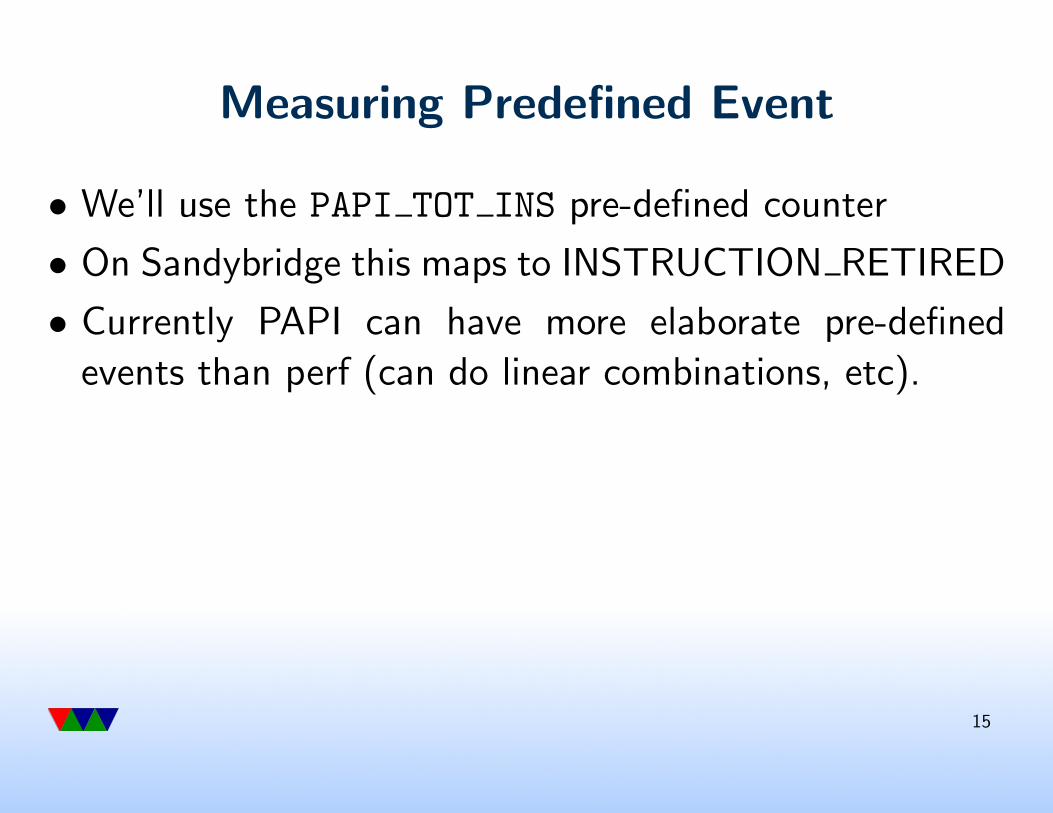
Measuring Predefined Event
• We’ll use the PAPI TOT INS pre-defined counter
• On Sandybridge this maps to INSTRUCTION RETIRED
• Currently PAPI can have more elaborate pre-defined
events than perf (can do linear combinations, etc).
15
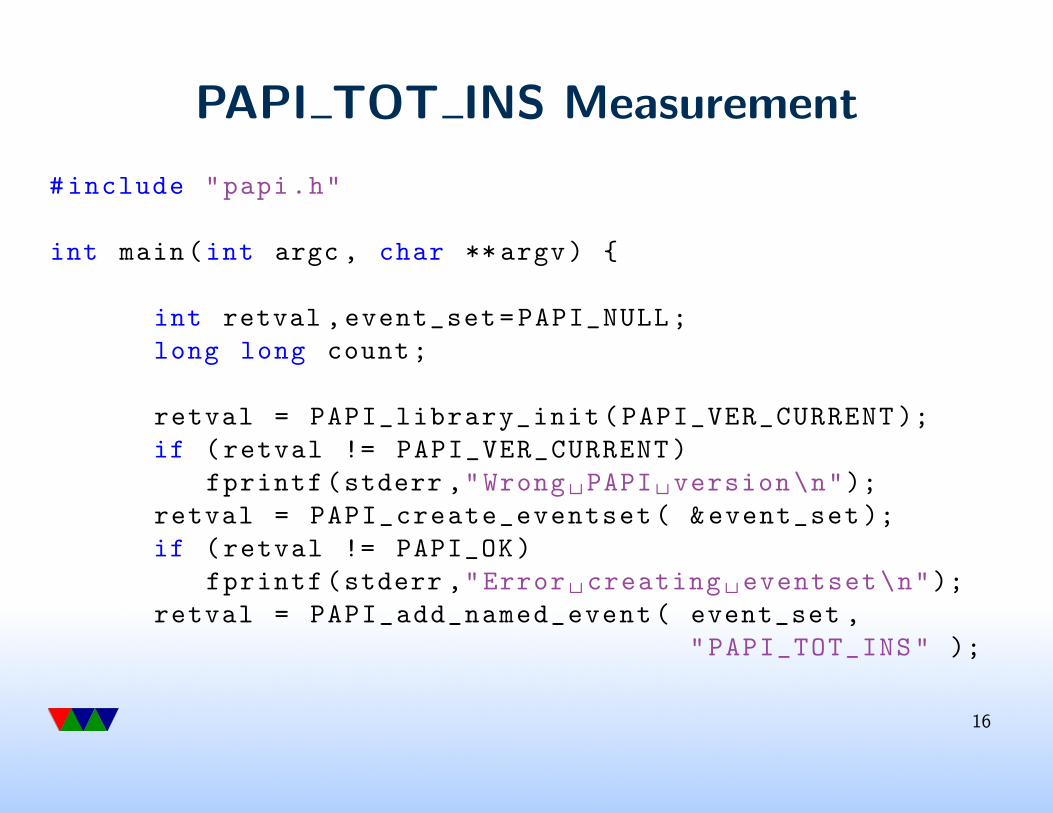
PAPI TOT INS Measurement
#include "papi.h"
int main(int argc , char **argv) {
int retval ,event_set=PAPI_NULL;
long long count;
retval = PAPI_library_init(PAPI_VER_CURRENT );
if (retval != PAPI_VER_CURRENT)
fprintf(stderr ,"Wrong PAPI version\n");
retval = PAPI_create_eventset( &event_set );
if (retval != PAPI_OK)
fprintf(stderr ,"Error creating eventset\n");
retval = PAPI_add_named_event( event_set ,
"PAPI_TOT_INS" );
16
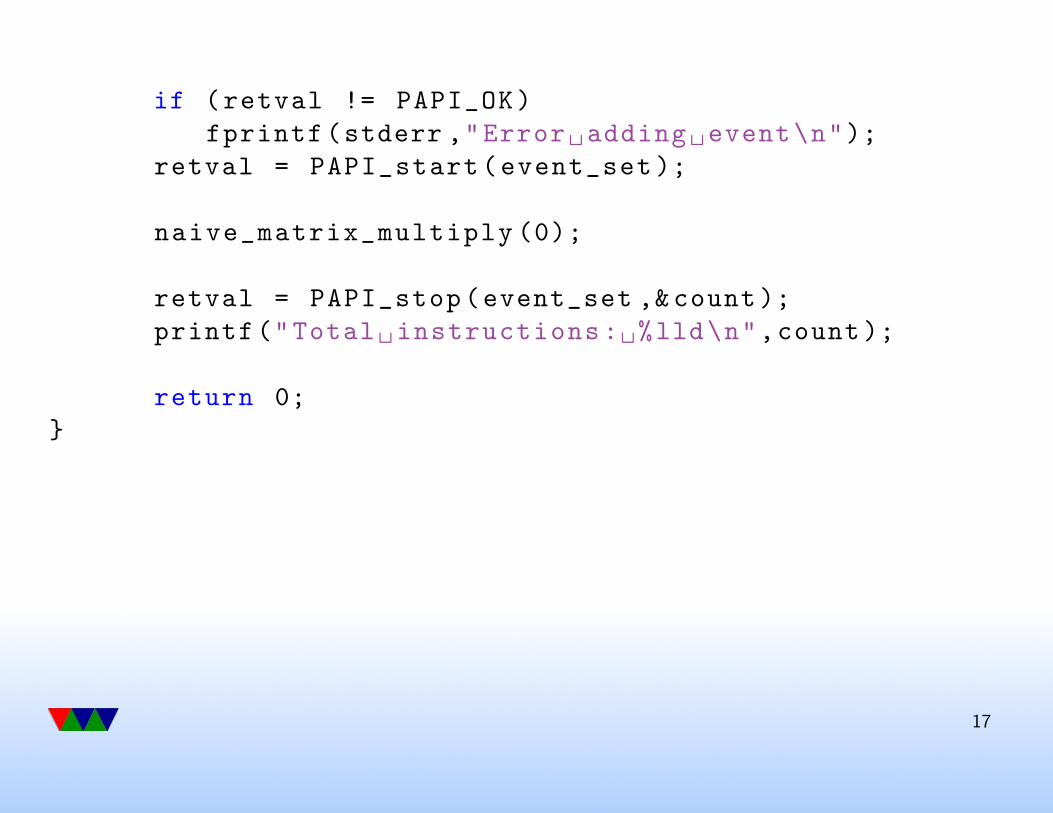
if (retval != PAPI_OK)
fprintf(stderr ,"Error adding event\n");
retval = PAPI_start(event_set );
naive_matrix_multiply (0);
retval = PAPI_stop(event_set ,& count);
printf("Total instructions: %lld\n",count);
return 0;
}
17
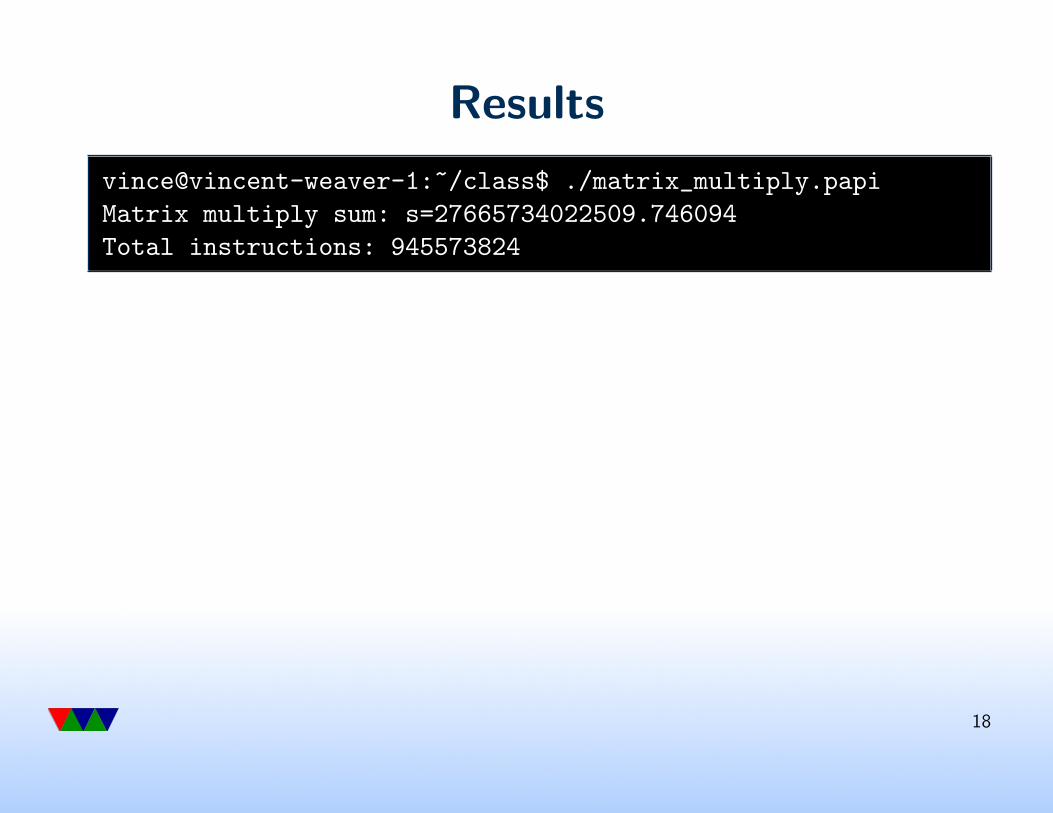
Results
vince@vincent-weaver-1:~/class$ ./matrix_multiply.papi
Matrix multiply sum: s=27665734022509.746094
Total instructions: 945573824
18
PAPI Overflow
• PAPI Can do overflow, but only provides RAW Program
Counter
• Need external tool if want more detailed info
19
Performance Measurement Methodologies
• Aggregate Count – overall, total counts
• Profiling – measure at beginning of function.
gprof, Valgrind Callgrind.
records every entry/exit into a function, knows full
backtrace
• Statistical Sampling – samples at rate of some sort of
periodic counter
perf record, oprofile
20
can completely miss important functions if unlucky,
harder to get backtrace
21
Inclusive vs Exclusive
• Exclusive only lists time spent in actual function
• Inclusive includes time spent in all child functions
22
Performance Counters and Java
This was asked about at the end of the last class.
Here are the results of a quick literature search, not very
thorough.
23
Sweeny et al. USENIX VM 2004
Using Hardware Performance Monitors to Understand the
Behavior of Java Applications by Sweeney, Hauswirth,
Cahoon, Cheng, Diwan, Grove, and Hind (USENIX VM
2004).
They found these challenges:
• Distinguish application instructions from VM instructions
• Handling threads
• Capture time-varying behavior of thread
• Handle threads migrating across CPUs
24
Sweeny et al. – continued
• They Modify the Jikes VM to generate thread traces on
AIX.
• They gather per results with Pmapi and the
SPECjbb2000 Benchmarks
• They add native methods to access counters and add
code to save/restore counters on thread switch.
• This has an Overhead of 2%
25
Sweeny et al. – continued
Their results:
• Found IPC improvement over time as optimizer worked
• IPC got worse after garbage collection. Turns out
compacting memory destroys cache.
26
Forst, Eclipsecon 2008
Analyzing Java Performance Using Hardware
Performance Counters by Gary Frost (Eclipsecon 2008).
• hprof takes you to the method but not into the method.
• AMD CodeAnalyst. Uses HW perf counters, integrates
with Eclipse. Allows mapping up with actual lines in
Java code. Unclear exactly how this works (just a slide
deck, not a paper).
27
Schneider and Gross – LCPC2005
Using Platform-Specific Performance Counters for
Dynamic Compilation Schneider and Gross, LCPC2005.
• VM/JIT. Plan to use counters to help optimize JIT.
• Use custom kernel module, Pentium 4
• Table of methods, list of where each byte code starts.
Once get address have to do binary search to find which
byte code it matches.
28
Georges et al. – OOPSLA 2007
Statistically Rigorous Java Performance Evaluation by
Georges, Buytaert, Eeckhout (Oopsla07).
Sources of non-determinism in Java Programs:
• JIT compilation (timer-based sampling might lead to
different JIT invocation times)
• Thread scheduling
• Garbage collection
• System interrupts
29
Georges et al. – continued
• Problem reporting “best” run versus 95% confidence
interval
• They found it changes conclusions.
• Methodology is important
30
Counter Determinism
31
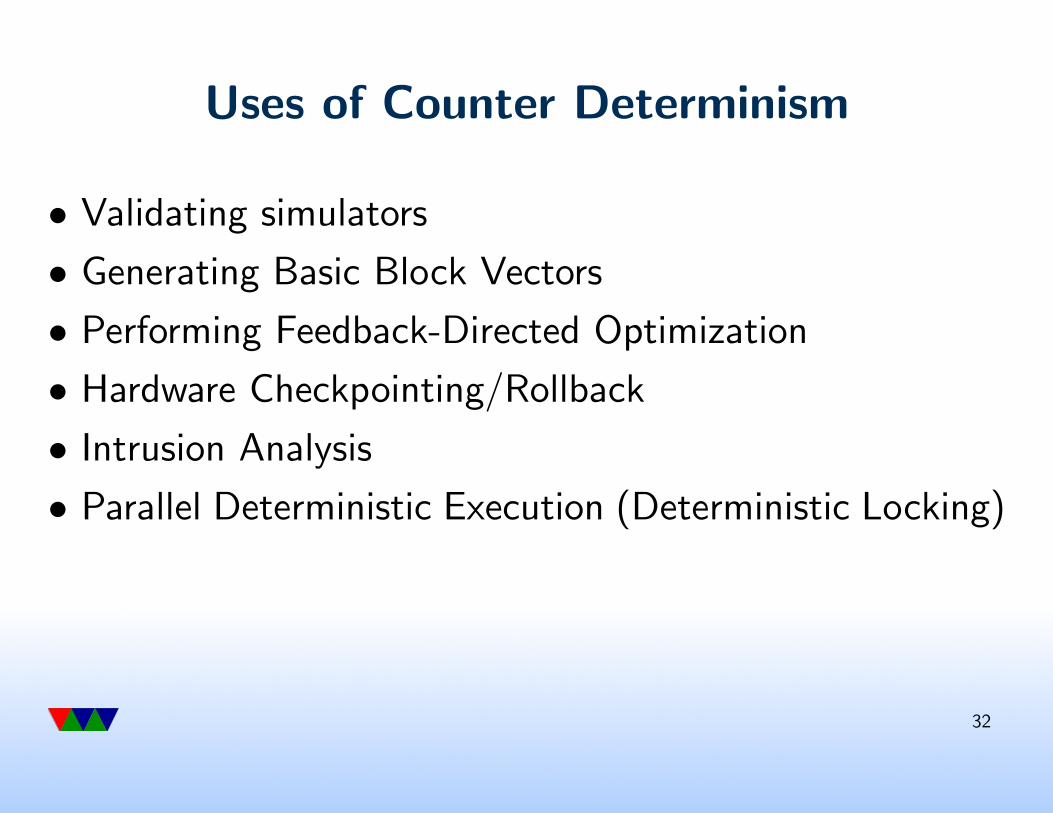
Uses of Counter Determinism
• Validating simulators
• Generating Basic Block Vectors
• Performing Feedback-Directed Optimization
• Hardware Checkpointing/Rollback
• Intrusion Analysis
• Parallel Deterministic Execution (Deterministic Locking)
32
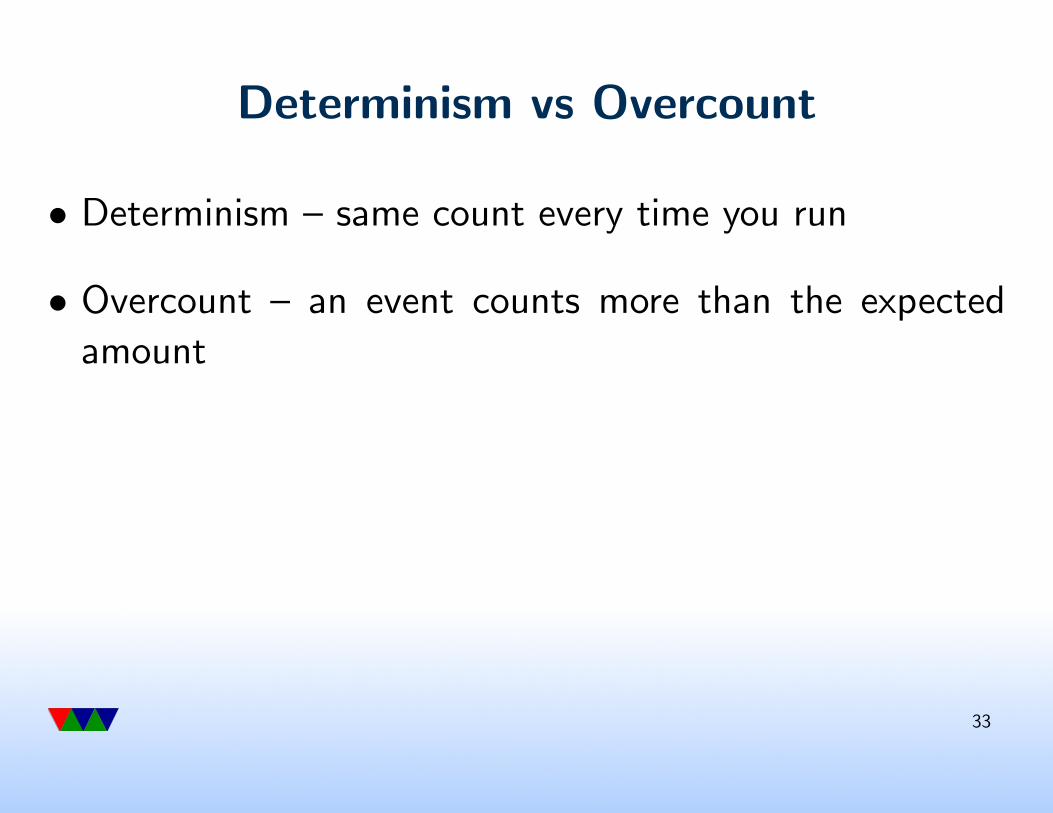
Determinism vs Overcount
• Determinism – same count every time you run
• Overcount – an event counts more than the expected
amount
33
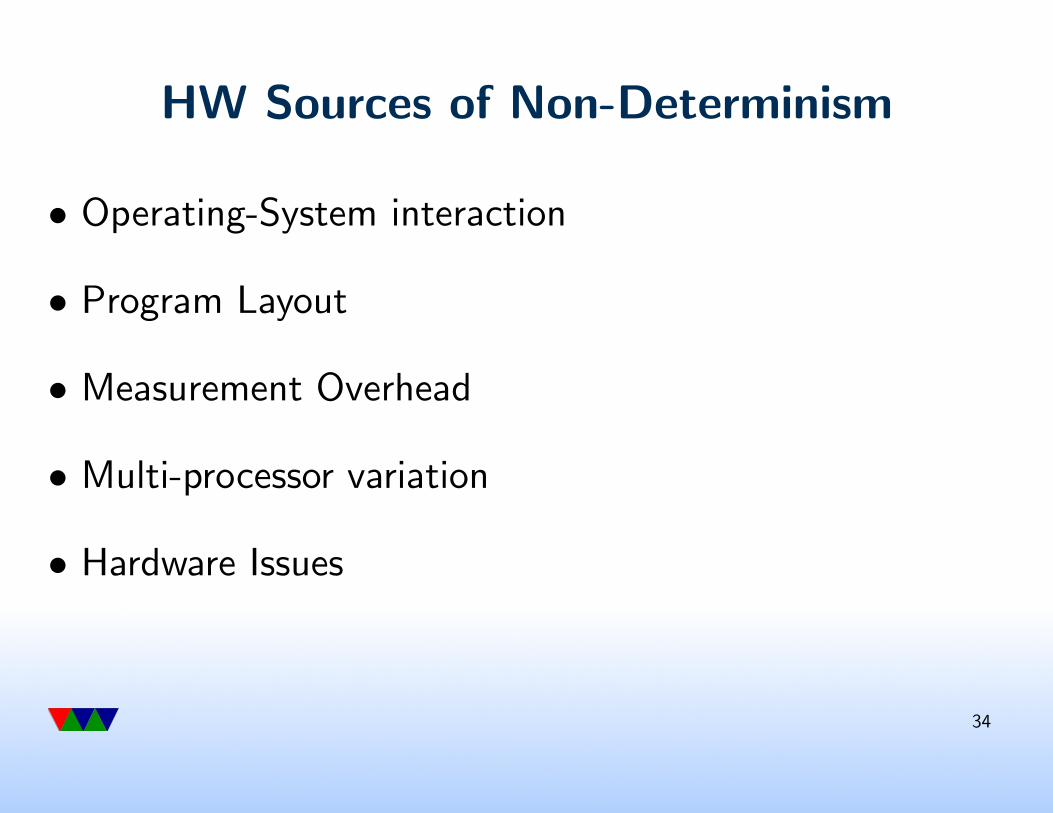
HW Sources of Non-Determinism
• Operating-System interaction
• Program Layout
• Measurement Overhead
• Multi-processor variation
• Hardware Issues
34
SW Sources of Non-Determinism
• Accessing changing values, such as time
• Pointer-value dependencies
35
Problems fount on x86 64
• Hardware Interrupt Interference – extra counts due to
HW interrupts. This includes page faults.
• Instruction Overcounts – some counters are buggy and
count extra
• FP exception/Lazy FP Handling
• Instructions that count uops rather than instructions
36
x86 Deterministic Counters
• Core2: Retired Stores
• Westmere, SNB, IVB: Conditional Branches
37
Mytkowicz et al. ASPLOS 2009
Producing Wrong Data Without Doing Anything Obviously
Wrong. Mytkowicz, Diwan, Hauswirth, Sweeney: ASPLOS
2009.
• Measurement bias
• Simple experiment, seeing if -O3 compiler optimization
is better not straightforward
• Changing environment variable size affects cycle count.
38
• Changing link order can change performance more than
compiler optimization
• It varies by machine and by compiler
39
Counter Accuracy Conclusion
Results are not meant to scare you or say to not use
counters.
Just remember they are not perfect and keep in mind
their limitations as you use them.
40