Embed Size (px)
Citation preview

Compatibility studies between PMSE and other systems/services in the band 1350-1400 MHz
Approved 29 January 2016
ECC Report 245

ECC REPORT 245 - Page 2
0 EXECUTIVE SUMMARY
This ECC Report investigates the compatibility between audio PMSE systems and others systems in the frequency range 1350-1400 MHz.
This report considered only body worn and handheld wireless microphone and IEM, but excluding wireless microphone on stands.
Co-channel sharing between the Radiolocation Service/Fixed Service and wireless microphones at the same geographical location would be problematic because of the disruptive effect on the wireless microphone receivers from the radiolocation or the Fixed Service signals. Therefore, by implementing a scanning procedure in order to identify the parts of spectrum, which are in use by other transmitter(s) and the parts, which are available for successful audio PMSE operation, audio PMSE will avoid being interfered with by Radiolocation/Fixed Service systems and avoid interfering with the Radiolocation/Fixed Service systems.
Geographical sharing for co-channel operation based on exclusion zones around the radars is practical. Co-channel sharing between the fixed service - coordinated and wireless microphones is feasible with the separation distances given in the table.
In case of TRR, the risk of interference is quite low for the body worn and hand held equipment. The risk of interference is more significant in case of IEM deployed outdoors. Administrations may consider two mitigation techniques: Implementation of separation distances (1 km), if possible or Limit the deployment of IEM to indoors.
For UAS BS the separation distances are of the order of 250 m, considering the mobile usage of this system, the need and practicability of the implementation of such a separation distance is questionable. For UAS UAV: outdoor PMSE, the separation distances are of the order of 3 km; indoor PMSE, no need for mitigation techniques.

ECC REPORT 245 - Page 3
The following table provides an overview of the proposed mitigation techniques.
Table 1: Overview of the proposed mitigation techniques
Service Body worn / Hand held IEM
Radiolocation
Outdoor: separation distance of 15 km Indoor: separation distance of 5 km
Outdoor: separation distance of 19 km Indoor: separation distance of 7 km
Fixed Service - coordinated
Main lobe: 20 km Side lobe Outdoor: separation distance of 2,5 km Indoor: separation distance of 1 km
Main lobe: 21 km Side lobe: Outdoor: separation distances of 7 km Indoor: separation distances of 2,5 km
TRR None Limit the deployment to indoor or separation distance of 1 km.
UAS BS 200 m outdoor - 50 m indoor 250 m outdoor - 100 m indoor
UAV 2 km outdoor - (no separation needed for indoor)
3 km outdoor - (no separation needed for indoor)
RAS
1350 - 1400 MHz: Indoor: no separation distance Outdoor: 51 km separation distance (see Note) 1400 - 1427 MHz: Indoor: no separation distance Outdoor: 1.0 km separation distance (see Note 1)
1350 - 1400 MHz: Indoor: no separation distance Outdoor: 55 km separation distance (see Note) 1400 - 1427 MHz: Indoor: no separation distance Outdoor: 1.3 km separation distance (see Note 2)
Note 1: The calculations are based on a standard 0 dBi RAS antenna gain, and are independent of the antenna pointing. The separation distances may be shorter depending upon factors such as terrain shielding.
Note 2: separation distances assumed wall losses of 15 dB for indoor use.
Recognizing that some administrations operate their radiolocation service in the band 1350-1375 MHz and some others in the band 1375-1400 MHz, one may conclude that at least 25 MHz could be made available for the deployment of wireless microphones in the frequency band 1350-1400 MHz. In order to cover the different national cases, the tuning range for wireless microphones should identify the whole band 1350-1400 MHz. Depending on the national situation, administrations will decide which portion of the tuning range within the 50 MHz could be then made available for wireless microphones.

ECC REPORT 245 - Page 4
TABLE OF CONTENTS
0 Executive summary ................................................................................................................................. 2
1 Introduction .............................................................................................................................................. 7
2 Definitions ................................................................................................................................................. 8
3 Technical characteristics of AUDIO PMSE systems ............................................................................ 9 3.1 PMSE AUDIO LINK DEScription ..................................................................................................... 9
3.1.1 Audio PMSE Transmitters ................................................................................................ 10 3.1.2 Audio PMSE Receivers..................................................................................................... 14 3.1.3 Audio PMSE Deployment ................................................................................................. 14
3.1.3.1 Operation ........................................................................................................... 14 3.1.3.2 Use case scenarios ........................................................................................... 15 3.1.3.3 Density ............................................................................................................... 15 3.1.3.4 Wall attenuation ................................................................................................. 15
4 TECHNICAL Characteristics OF SERVICES AND SYSTEMS USED for the Compatibility studies in the frequency band 1350-1400 MHz ..................................................................................................... 17 4.1 Radiolocation ................................................................................................................................. 17 4.2 Mobile service - Unmanned Aircraft systems (UAS) ..................................................................... 18 4.3 FIXED SERVICE ........................................................................................................................... 19 4.4 Radio Astronomy Service .............................................................................................................. 21
5 Co-existence between wireless microphones and existing services in the band 1350-1427 MHz 23 5.1 Compatibility between the PMSE and the radiolocation service ................................................... 23
5.1.1 Calculation methodology .................................................................................................. 23 5.2 Calculation results ......................................................................................................................... 23
5.2.1 Impact of audio PMSE on Radiolocation systems ............................................................ 24 5.2.2 Impact of Radiolocation systems on Audio PMSE ........................................................... 27 5.2.3 Conclusions ...................................................................................................................... 27
5.3 Impact on Fixed Service ................................................................................................................ 28 5.3.1 Systems having similar characteristics as in the frequency range 1492-1517 MHz ........ 28
5.3.1.1 Minimum coupling loss calculations .................................................................. 28 5.3.1.2 SEAMCAT simulations ...................................................................................... 30
5.3.2 Considerations on the non-co-frequency case ................................................................. 31 5.3.2.1 Impact of the unwanted emissions .................................................................... 31 5.3.2.2 Impact on the blocking....................................................................................... 32 5.3.2.3 Conclusions ....................................................................................................... 33
5.3.3 Tactical radio relay (TRR) ................................................................................................. 33 5.3.4 Considerations on the co-frequency case ........................................................................ 33
5.3.4.1 Minimum coupling loss calculations .................................................................. 33 5.3.4.2 SEAMCAT simulations ...................................................................................... 34
5.3.5 Considerations on the non-co-frequency case ................................................................. 34 5.3.5.1 Impact of the unwanted emissions .................................................................... 35 5.3.5.2 Impact on the blocking....................................................................................... 35 5.3.5.3 Conclusions ....................................................................................................... 35
5.4 Mobile (UAS) ................................................................................................................................. 35 5.4.1 Conclusions ...................................................................................................................... 37
5.5 Co-existence between PMSE and RAS ........................................................................................ 37 5.5.1.1 Study parameters .............................................................................................. 37 5.5.1.2 Impact of the emissions from wireless microphones on RAS station operating in
1350-1400 MHz or/and 1400-1427 MHz ........................................................... 38

ECC REPORT 245 - Page 5
5.5.1.3 Conclusion ......................................................................................................... 39 5.5.1.4 Conclusions In-band sharing results for the 1330-1400 MHz band .................. 39 5.5.1.5 Conclusions for the 1400-1427 MHz band ........................................................ 39
6 Discussion and conclusion .................................................................................................................. 40
ANNEX 1: AUDIO PMSE BODY LOSS .......................................................................................................... 42
ANNEX 2: Wall loss attenuation ................................................................................................................... 59
ANNEX 3: List of RAS stations in Europe operating in the 1330-1400 MHz and 1400-1427 MHz bands ................................................................................................................................................................. 64
ANNEX 4: List of Reference .......................................................................................................................... 65

ECC REPORT 245 - Page 6
LIST OF ABBREVIATIONS
Abbreviation Explanation
AMSL Above Mean Sea Level
BW Bandwidth
CEPT European Conference of Postal and Telecommunications Administrations
ECC Electronic Communications Committee
e.i.r.p. equivalent isotropically radiated power
EN European Norm
ERC European Radiocommunications Committee
ETSI European Telecommunications Standards Institute
GS Ground station
IEM In-Ear Monitoring
ITU International Telecommunication Union
JTG Joint Task Group
MCL Minimum Coupling Loss
PMSE Programme Making and Special Events
PWMS Professional Wireless Microphone Systems
RAS Radio Astronomy Service
TR Technical Report
TRR Tactical Radio Relay
UAS Unmanned Aircraft System
UAV Unmanned Aerial Vehicle

ECC REPORT 245 - Page 7
1 INTRODUCTION
This ECC Report investigates the compatibility between wireless microphones and others systems in the frequency range 1350-1400 MHz for some scenarios
At its meeting (WG FM#81), WG FM decided to task WG SE to assess the possibility of including the 1350-1400 MHz band into the tuning ranges for audio PMSE systems.
Additionally, WG SE is conducting studies to investigate how a wider adoption of PMSE amongst CEPT member states for the bands 1492-1518 MHz and 1518-1525 MHz could be achieved.
The following table provides an overview of the European use of the frequency range 1350-400 MHz and of the adjacent bands based on ERC Report 25 [1].
Table 2: European use of the frequency range 1350-1400 MHz and of the adjacent bands based on ERC Report 25
Frequency range
European Common Allocation
ECC/ERC harmonisation
measure Applications European
footnotes Standard
1300-1350 MHz
AERONAUTICAL RADIONAVIGATION 5.337 RADIOLOCATION RADIONAVIGATION-SATELLITE (EARTH-TO-SPACE) 5.149 EU2 5.337A
Defence systems Radio astronomy Radiolocation (civil) Satellite navigation systems
1350-1400 MHz
FIXED MOBILE RADIOLOCATION 5.149 EU2 5.338A EU15 5.339
T/R 13-01 [15] Defence systems Fixed Radio astronomy
EU15A EN 302 217 [6]
1400-1427 MHz
EARTH EXPLORATION-SATELLITE (PASSIVE) RADIO ASTRONOMY SPACE RESEARCH (PASSIVE) 5.340 5.341
ECC/DEC/(11)01 [13]
Passive sensors (satellite) Radio astronomy
ECC REPORT 245 - Page 8
2 DEFINITIONS
Term Definition
PMSE
Programme Making and Special Events The term includes all wireless equipment used at the front-end of all professional productions; e.g. audio, video and effect control. PWMS are intended for use in the entertainment and installed sound industry by Professional Users involved in stage productions, public events, and TV programme production, public and private broadcasters’ installation in conference centres / rooms, city halls, musical and theatres, sport / event centres or other professional activities / installation.
PWMS
Professional Wireless Microphone Systems The term includes all wireless audio equipment used at the front-end of all professional audio productions; like wireless microphones or In-Ear-Monitoring (IEM). PWMS are intended for use in the entertainment and AV content industry by Professional Users involved in stage productions, public events, and TV programme production, public and private broadcasters’ installation in conference centres / rooms, city halls, musical and theatres, sport / event centres or other professional activities / installation.

ECC REPORT 245 - Page 9
3 TECHNICAL CHARACTERISTICS OF AUDIO PMSE SYSTEMS
Sharing studies conducted in this Report take into account only scenarios where specific types of audio PMSE systems are operating under particular regulatory conditions e.g. possible outdoor and indoor usage, also considering an individual licensing regime. The following classes of equipment should be considered: Programme Audio Links, monophonic or stereophonic music and speech signals only.
The Harmonised Standard EN 300 422 [7] provides updated information compared to ETSI TR 102 546 [4] (audio PMSE spectrum mask has been changed compared to the older documentation, i.e. inclusion of new masks for digital audio PMSE equipment).
The following scenarios are suggested to improve compatibility with incumbent services where audio PMSE system is operating in the environments where there could be higher wall attenuation: Theatres; Concert halls; Conference and studio buildings. In the framework of this report, a licensing regime is considered. This may allow widening the national implementation in the frequency ranges under considerations by: Enforcing the separation distances which may be required to protect some services; Limiting the deployment of audio PMSE to some type of buildings if it is found necessary and
practical; Allowing the administration to monitor and control the deployment of audio PMSE in case existing
services in the bands are further extended or new services/systems are implemented.
In particular, it has been proposed to consider use of individually licensed audio PMSE systems inside buildings where the total wall attenuation is normally at the upper end of the attenuation figures provided in ANNEX 2: such as stages in theatres, concert halls, trade show halls or conference centres. The consideration of the attenuation of buildings can reduce the probability of interference to the primary services used outside such venues.
The following scenarios can also be considered in order to improve the sharing conditions: Use of 'down tilt' antennas, in a way to minimise interference to the outside environment; Time limited or temporary use; Tuning range; Locations for this type of audio PMSE use normally occurs at locations with well-established terrestrial
communications facilities and predominantly in metropolitan areas/ urban scenarios. A subdivision similar to the bands 1785-1795 MHz, 1795-1800 MHz and 1800-1804.8 MHz could be
considered (i.e. the deployment of audio PMSE operating at the higher power (50 mW) is limited to body worn equipment).
3.1 PMSE AUDIO LINK DESCRIPTION
The PMSE systems considered in this Report are radio microphones and in ear monitors (IEM). Radio microphones are used to provide high quality, short range, wireless links for use in audio performance for professional use in broadcasting, concerts, etc. In ear monitoring equipment is used by stage and studio performers to receive personal fold back (monitoring) of the performance. This can be just their own voice or a mix of sources. The bandwidth requirement of professional in ear monitoring equipment is similar to those of radio microphones.
The technical characteristics of PMSE used in these studies are provided below.
ECC REPORT 245 - Page 10
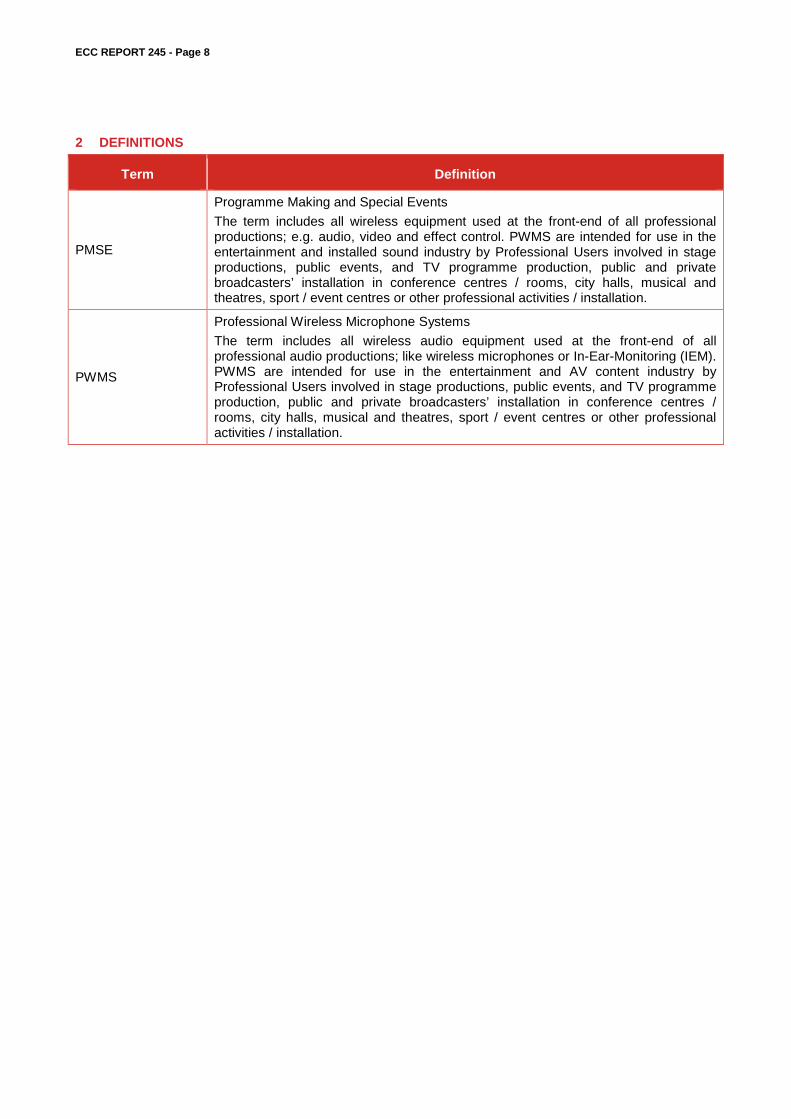
3.1.1 Audio PMSE Transmitters
The tables below show parameters for the handheld and body worn wireless microphones as well as for IEM. The case with a wireless microphone on a stand is not considered since it is not representative of real cases (see section 3.1.3.2).
Table 3: Parameters for handheld wireless microphone
Parameter Unit Value Comment
Bandwidth (BW) MHz 0.2
Antenna height m 1.5
Body loss1 dB Minimum value 6 dB Median value 11 dB
In this Report, minimum value is used in MCL calculation, median value for Seamcat simulation
Maximum e.i.r.p. dBm 13 ERC/REC 70-03 [3], Annex 10
Antenna polarisation
NA Vertical
Table 4: Parameters for body worn wireless microphone
Parameter Unit Value Comment
Bandwidth (BW) MHz 0.2
Antenna height m 1.5
Body loss2 dB Minimum value 11 dB Median value 21 dB
In this Report, minimum value is used in MCL calculation, median value for Seamcat simulation
Maximum e.i.r.p. dBm 17 ERC/REC 70-03
Antenna polarisation
NA Vertical
The usual configuration for IEM transmitter antennas is to mount them above the stage at a height of at least 2 meters.
1 See A1.2 2 See A1.2

ECC REPORT 245 - Page 11
Table 5: Parameters for IEM
Parameter Unit Value Comment
Bandwidth (BW) MHz 0.2
Antenna height m 2 1 to 6 m
Antenna pattern dB See Figure 1
Maximum antenna gain dBi 8
Maximum e.i.r.p. dBm 17 ERC/REC 70-03, Annex 10
Antenna polarisation NA Vertical
IEM transmitting antennas on the stage are then angled down towards the stage at approximately 45º. This reduces interference to nearby systems as propagation in a horizontal direction is via a combination of the side lobes of the antenna and scatter from the stage. Considering the pointing downward of the IEM antenna, for the MCL calculations, an e.i.r.p of 9 dBm is considered (9 dBm output power and 0 dB antenna gain). Figure 1 provides the horizontal and vertical pattern of IEM antennas.

ECC REPORT 245 - Page 12
Figure 1: PMSE IEM Antenna Pattern
The spectrum masks for analogue and digital audio PMSE systems are given in Figure 2 and Figure 3, below. (ETSI EN 300 422 (V1.5.0 /2015-01) [7].

ECC REPORT 245 - Page 13
Figure 2: Spectrum mask for analogue systems in all bands (measurement bandwidth is 1 kHz)
Figure 3: Spectrum mask for digital systems below 2 GHz (measurement bandwidth is 1 kHz)
The spectrum mask for digital systems is above the mask for analogue systems and therefore, may need to be used in the compatibility studies if the worst case only is considered.
B
fc + 0,35B fc - 0,35B
0dB
-10
-30
-40
-50
-60
-70
-80
-90
-100
Unmodulated carrier reference
fc - 1 MHz fc - B fc - B _ 2
B _ 2
fc fc + fc + B fc + 1 MHz
fc = Transmitter carrier frequency
-20

ECC REPORT 245 - Page 14
3.1.2 Audio PMSE Receivers
Table 6: Parameters for Audio PMSE receivers
Parameter Unit Value Comment
Bandwidth (BW) MHz 0.2
Reference Sensitivity
dBm -90 ETSI TR 102 546 [4], Section B.4.1.3
Noise Figure (NF) dB 3 The Noise Figure value is representing typically single channel audio links. If multichannel PMSE are operated in a splitter architecture the noise figure will be increased by few dBs
Noise Floor (N) dBm -118 10∙log(k∙T∙BW∙(Hz)) + NF
Standard Desensitization DSTANDARD
dB 3 DTARGET = DSTANDARD
Interference level dBm -118
Blocking Response dB
ETSI TR 102 546 Attachment 2, Applicable Receiver Parameter for PWMS below 1 GHz
Antenna height m 3
Antenna gain dBi 0 Omni directional
3.1.3 Audio PMSE Deployment
3.1.3.1 Operation
Traditionally, for event and content production audio PMSE systems have operated in interleaved spectrum, between the televisions transmissions in Bands III, IV and V on a geographical basis. REC/ERC 70-03 [3] identifies this spectrum on a ‘tuning range’ basis, allowing different administrations to authorise these systems where and when they are needed. This maintains maximum flexibility and avoids ‘sterilizing’ spectrum.
Many Administrations allow licenced exempt use of the tuning range 470-790 MHz relying on the fact that audio PMSE cannot occupy the same spectrum as a primary service transmitter in a given geographical area as this would interfere with the audio PMSE systems.
In general, if a frequency is already in use, then audio PMSE systems must be set to a different frequency. Otherwise, the high audio quality criteria of audio PMSE cannot be achieved. This procedure could reliably
ECC REPORT 245 - Page 15
be used in any other frequency bands using the tuning range approach. This type of behaviour offers reliable protection for the primary terrestrial services. In order to avoid the implementation of separation distances for the protection of audio PMSE, the audio PMSE users need to scan their assigned spectrum in order to identify the parts of spectrum, which are in use by other transmitter(s) and the parts, which are available for successful audio PMSE operation (see Annex 5 to ECC Report 191[2]).
3.1.3.2 Use case scenarios
Based on feedback from the PMSE community wireless microphone operations can be split into the following use case scenarios based on feedback from the PMSE community.
- 25 % hand-held operation;
- 60 % Body-worn operation;
- 14 % floor tripod close to the user's body; (not studied in this report)
- 1 % table tripod; (not studied in this report)
3.1.3.3 Density
The density of active devices in this study is 1-2 per MHz at the same time in a given area.
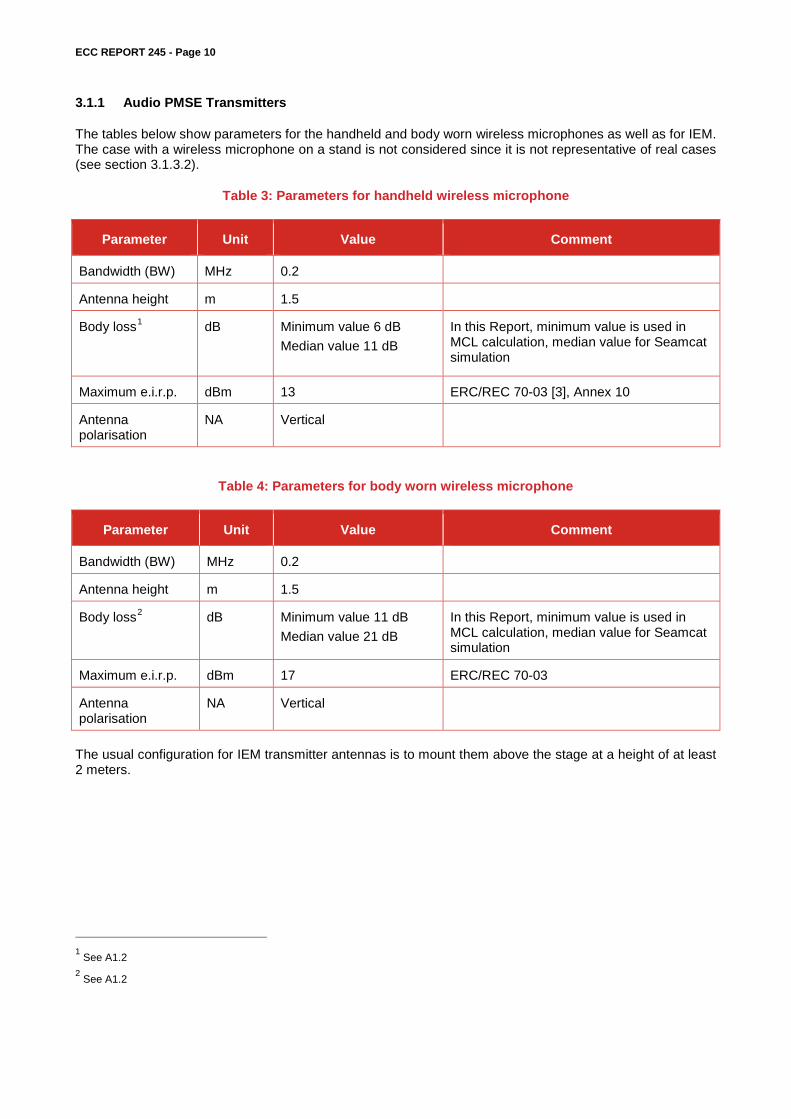
3.1.3.4 Wall attenuation
The value of 10 dB for the wall loss attenuation was considered in ECC Report 121 [8] for most of the compatibility analyses.
The ETSI TR 102 546 (2007) [4] considered a range of values based of a campaign of measurements which are provided below:
Table 7: Wall attenuation values
Wall type / material Absorption @1450 MHz
Lime sandstone 24 cm 34 dB
Lime sandstone 17 cm 29 dB
Ytong 36.5 cm 23 dB
High hole brick 24 cm 19 dB
Reinforced concrete 16 cm 13 dB
Lightweight concrete 11.5 cm 9 dB
ThermoPlane 6 dB

ECC REPORT 245 - Page 16
Figure 4: Wall attenuation (dB) for different wall materials at 1400-1600 MHz
The graph was recalculated based on the ECC Report 121 [8] values. As the graphics shows, the measured values of wall loss for the materials tested range from 6 dB to about 34 dB and the majority of wall materials have an attenuation value significant above 10 dB.
The following values were considered in the framework of the WRC-15 in JTG 4-5-6-7 for the Macro Cases for the frequency range 1 to 3 GHz and are also considered in the calculations depending on the environment (Rural, Suburban, Urban) (see ITU-R Report M.2292 [14]).
Table 8: Wall loss attenuation
Environment Rural Suburban Urban
Attenuation 15 dB 20 dB 20 dB
Additional information about wall loss is also available in ANNEX 2:.
ECC REPORT 245 - Page 17
4 TECHNICAL CHARACTERISTICS OF SERVICES AND SYSTEMS USED FOR THE COMPATIBILITY STUDIES IN THE FREQUENCY BAND 1350-1400 MHZ
4.1 RADIOLOCATION
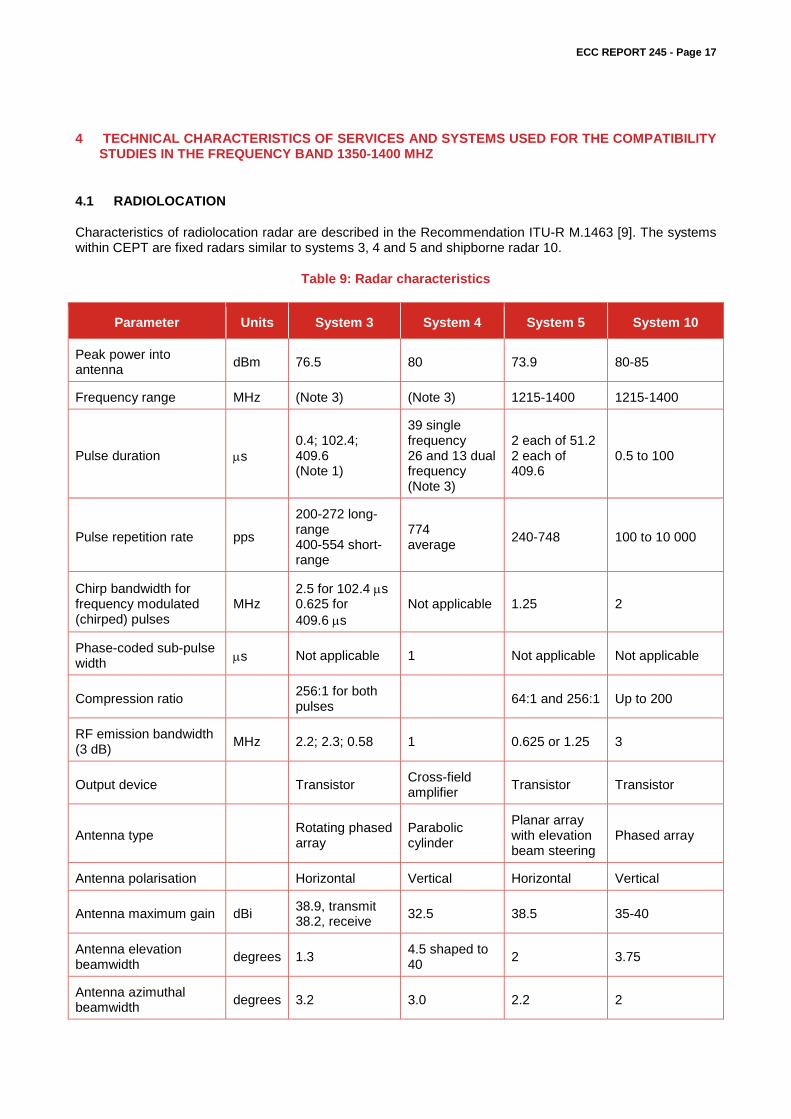
Characteristics of radiolocation radar are described in the Recommendation ITU-R M.1463 [9]. The systems within CEPT are fixed radars similar to systems 3, 4 and 5 and shipborne radar 10.
Table 9: Radar characteristics
Parameter Units System 3 System 4 System 5 System 10
Peak power into antenna dBm 76.5 80 73.9 80-85
Frequency range MHz (Note 3) (Note 3) 1215-1400 1215-1400
Pulse duration µs 0.4; 102.4; 409.6 (Note 1)
39 single frequency 26 and 13 dual frequency (Note 3)
2 each of 51.2 2 each of 409.6
0.5 to 100
Pulse repetition rate pps
200-272 long-range 400-554 short-range
774 average 240-748 100 to 10 000
Chirp bandwidth for frequency modulated (chirped) pulses
MHz 2.5 for 102.4 µs 0.625 for 409.6 µs
Not applicable 1.25 2
Phase-coded sub-pulse width µs Not applicable 1 Not applicable Not applicable
Compression ratio 256:1 for both pulses 64:1 and 256:1 Up to 200
RF emission bandwidth (3 dB) MHz 2.2; 2.3; 0.58 1 0.625 or 1.25 3
Output device Transistor Cross-field amplifier Transistor Transistor
Antenna type Rotating phased array
Parabolic cylinder
Planar array with elevation beam steering
Phased array
Antenna polarisation Horizontal Vertical Horizontal Vertical
Antenna maximum gain dBi 38.9, transmit 38.2, receive 32.5 38.5 35-40
Antenna elevation beamwidth degrees 1.3 4.5 shaped to
40 2 3.75
Antenna azimuthal beamwidth degrees 3.2 3.0 2.2 2

ECC REPORT 245 - Page 18
Parameter Units System 3 System 4 System 5 System 10
Antenna horizontal scan characteristics rpm
360° mechanical at 6 rpm for long range and 12 rpm for short range
360° mechanical at 6, 12 or 15 rpm
5
360° at 12-15 rpm or Sector scan at variable rate
Antenna vertical scan characteristics degrees –1 to +19
in 73.5 ms Not applicable −6 to +20 Not applicable
Receiver IF bandwidth kHz 4400 to 6400 1200 625 / 1250 2000
Receiver noise figure dB 4.7 3.5 2.6 3
Platform type Transportable Transportable Fixed terrestrial
Shipbased/ terrestrial
Time system operates % 100 100 100 100
Receiver noise dBm -102.7 dBm -109.5 dBm -110.2 dBm (Note 2) -107.8 dBm
NOTE 1 – The radar has 20 RF channels in 8.96 MHz increments. The transmitted waveform group consists of one 0.4 µs P0 pulse (optional) which is followed by one 102.4 µs linear frequency modulated pulse (if 0.4 µs P0 is not transmitted) of 2.5 MHz chirp which may be followed by one to four long-range 409.6 µs linear frequency modulated pulses each chirped 625 kHz and transmitted on different carriers separated by 3.75 MHz. Normal mode of operation employs frequency agility whereby the individual frequencies of each waveform group are selected in a pseudo-random manner from one of the possible 20 RF channels within the frequency band 1 215-1 400 MHz.
NOTE 2 – Calculated assuming a bandwidth of 1250 kHz. NOTE 3 - Frequency range is not given in the ITU-R Rec M.1463, therefore this radar is assumed to operate in the frequency range
1350-1400 MHz.
4.2 MOBILE SERVICE - UNMANNED AIRCRAFT SYSTEMS (UAS)
The frequency band is used by Unmanned Aircraft systems (UAS). Preliminary characteristics are issued from ECC Report 172 [5].
Table 10: UAS characteristics
Parameters Value Comments
Aircraft (UAV)
Bandwidth (MHz) 5 (1.5 to 20) One channel used at a time, which bandwidth extends from 1.5 to 20 MHz)
Max output power (dBm) 23 to 40 An e.i.r.p. value of 38 dBm is used for the study
Antenna gain (dBi) 1 0 to 2 dB
Losses (dB) 0 to 1.5 An e.i.r.p. value of 38 dBm is used for the study
Max e.i.r.p. (dBm) 38
Antenna height (m) 0 to 3000
Receiver noise (dBm) -90
Ground
Bandwidth (MHz) 5
Max output power (dBm) 23
ECC REPORT 245 - Page 19
Parameters Value Comments
station (GS) Antenna gain (dBi) 5 Some ground stations use more than one antenna
(directional and omni directional)
Max e.i.r.p (dBm) 40 25 to 41 dBm
Antenna height (m) 2
Receiver noise (dBm) -90
Interference level (dBm) -96 dBm
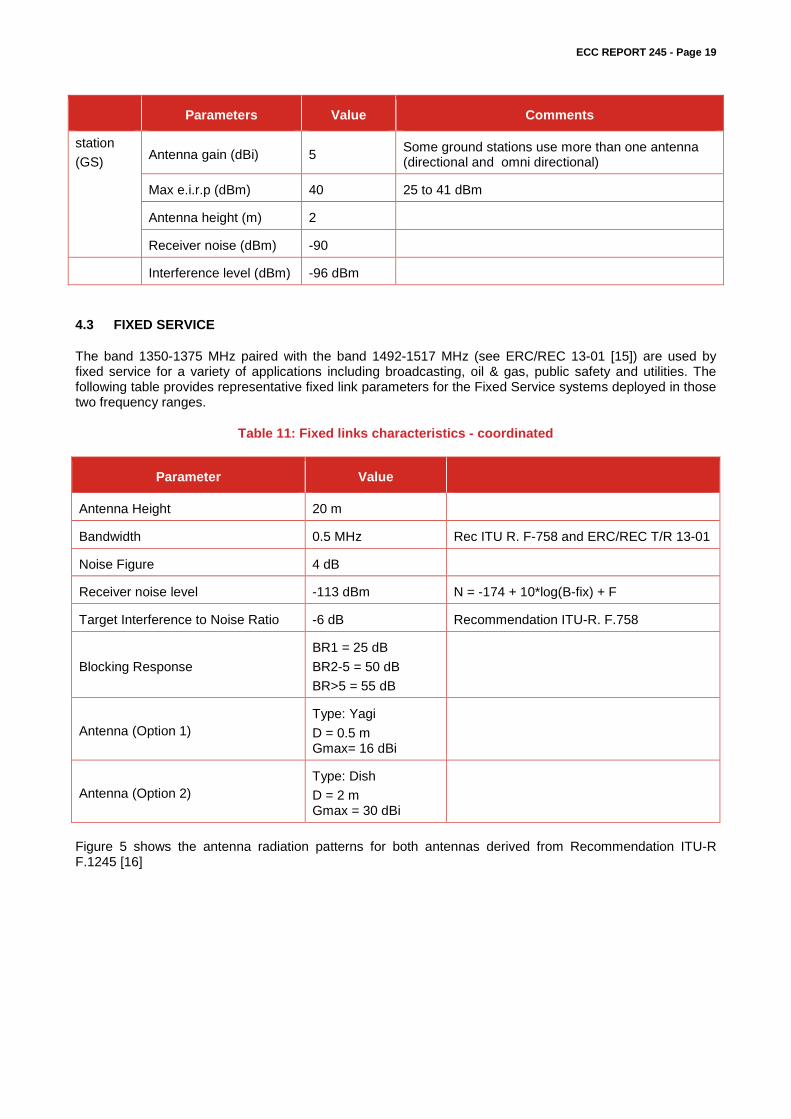
4.3 FIXED SERVICE
The band 1350-1375 MHz paired with the band 1492-1517 MHz (see ERC/REC 13-01 [15]) are used by fixed service for a variety of applications including broadcasting, oil & gas, public safety and utilities. The following table provides representative fixed link parameters for the Fixed Service systems deployed in those two frequency ranges.
Table 11: Fixed links characteristics - coordinated
Parameter Value
Antenna Height 20 m
Bandwidth 0.5 MHz Rec ITU R. F-758 and ERC/REC T/R 13-01
Noise Figure 4 dB
Receiver noise level -113 dBm N = -174 + 10*log(B-fix) + F
Target Interference to Noise Ratio -6 dB Recommendation ITU-R. F.758
Blocking Response BR1 = 25 dB BR2-5 = 50 dB BR>5 = 55 dB
Antenna (Option 1) Type: Yagi D = 0.5 m Gmax= 16 dBi
Antenna (Option 2) Type: Dish D = 2 m Gmax = 30 dBi
Figure 5 shows the antenna radiation patterns for both antennas derived from Recommendation ITU-R F.1245 [16]

ECC REPORT 245 - Page 20
Figure 5: FS antenna patterns derived from Recommendation ITU-R F. 1245
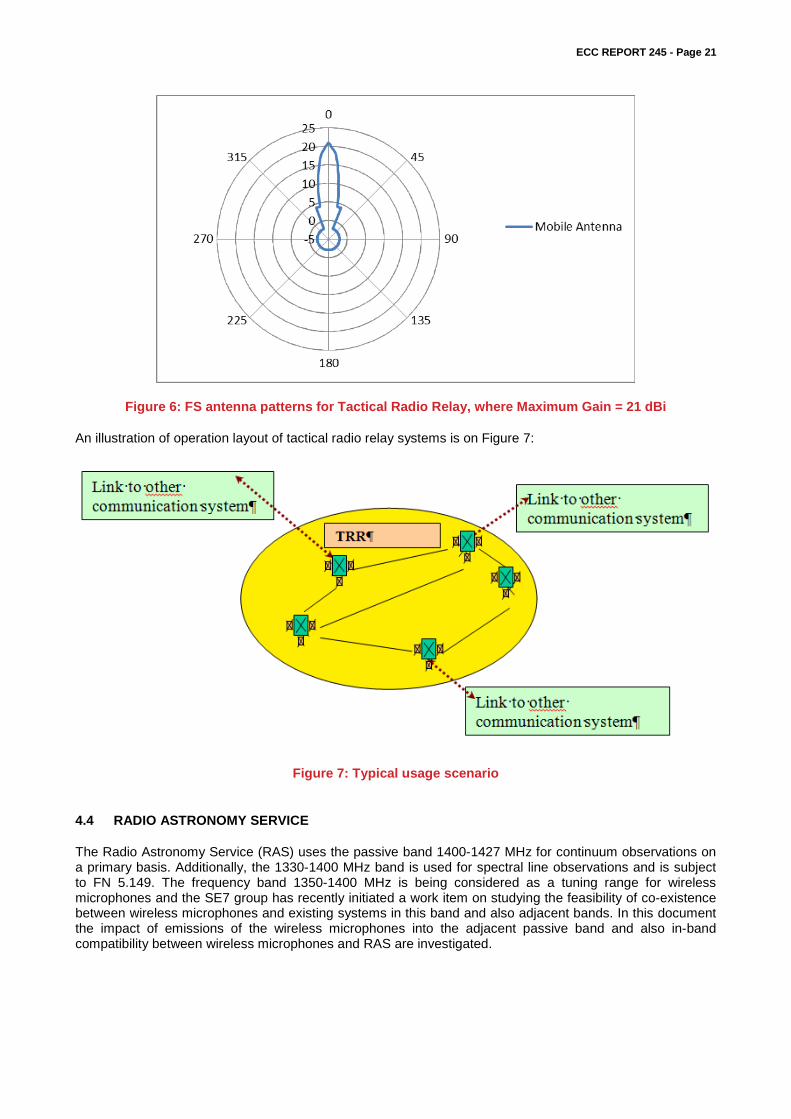
The Fixed Service is also used by Tactical Radio Relay in this frequency band. Tactical radio relay services are mesh networks deployed in different locations a short notice. Each TRR contains multiple point to point links. The separation distances between each transmitter are variable.
Table 12: TRR characteristics
Tactical radio relay
Operating frequency 1350-1400 MHz
Transmit power 34 dBm
Bandwidth 1.5 MHz
Thermal Noise Receiver -105 dBm
I/N 0 dB
Antenna polarisation Circular
Antenna Gain 21 dB Pattern see below
Antenna directivity ±5°
Feeder loss 4 dB
Antenna height 10 to 15 m
Blocking Response BR1 = 27 dB BR2 = 45 dB BR3 = 70 dB
-10
-5
0
5
10
15
20
25
30
35
0 50 100 150 200
Antenna pattern (dB)
Dish Yagi
ECC REPORT 245 - Page 21
Figure 6: FS antenna patterns for Tactical Radio Relay, where Maximum Gain = 21 dBi
An illustration of operation layout of tactical radio relay systems is on Figure 7:
Figure 7: Typical usage scenario
4.4 RADIO ASTRONOMY SERVICE
The Radio Astronomy Service (RAS) uses the passive band 1400-1427 MHz for continuum observations on a primary basis. Additionally, the 1330-1400 MHz band is used for spectral line observations and is subject to FN 5.149. The frequency band 1350-1400 MHz is being considered as a tuning range for wireless microphones and the SE7 group has recently initiated a work item on studying the feasibility of co-existence between wireless microphones and existing systems in this band and also adjacent bands. In this document the impact of emissions of the wireless microphones into the adjacent passive band and also in-band compatibility between wireless microphones and RAS are investigated.

ECC REPORT 245 - Page 22
Table 13: RAS parameters
Parameters RAS Spectral line RAS Continum
Center frequency 1380 MHz 1413 MHz
Bandwidth 20 kHz 27 MHz
RAS protection level -220.2 dBW -204.5 dBW
Antenna height 50 m 50 m
Antenna gain 0 dBi 0 dBi
A list of RAS stations operating in this frequency range in Europe is provided in ANNEX 3:

ECC REPORT 245 - Page 23
5 CO-EXISTENCE BETWEEN WIRELESS MICROPHONES AND EXISTING SERVICES IN THE BAND 1350-1427 MHZ
This generic study addresses sharing between wireless microphones and the radiolocation and fixed services in the band 1350-1400 MHz.
5.1 COMPATIBILITY BETWEEN THE PMSE AND THE RADIOLOCATION SERVICE
5.1.1 Calculation methodology
For the purpose of the present study, the required path loss and related separation distance between the wireless microphones and radiolocation and fixed services are estimated by means of the minimum coupling loss (MCL) calculations.
For example, the following MCL formula is used in the case of a PMSE transmitter interfering with a radiolocation service receiver
𝑃𝑃𝑃𝑃(𝑑𝑑) = 𝑃𝑃PMSE + 𝐺𝐺PMSE − 𝐵𝐵𝑃𝑃 −𝑊𝑊𝑃𝑃 + 𝐺𝐺RL − 𝐴𝐴cp − 𝐼𝐼RL
where 𝑃𝑃PMSE (dBm) is the power of the PMSE device, 𝐺𝐺PMSE (dBi) is the gain of the PMSE antenna in the direction of the radiolocation receiver, 𝐵𝐵𝑃𝑃 (dB) is the body loss, 𝑊𝑊𝑃𝑃 (dB) is the wall loss, 𝐺𝐺RL (dBi) is the gain of the radiolocation antenna in the direction of the PMSE device, 𝐴𝐴cp (dB) is the cross-polarization attenuation, and 𝐼𝐼RL (dBm) is the allowed interference level at the radiolocation receiver. The separation distance 𝑑𝑑 needs to provide the sufficient path loss 𝑃𝑃𝑃𝑃(𝑑𝑑) for a given propagation model in order to satisfy the above MCL formula.
The propagation path loss is assessed using Extended-Hata model for the distances shorter than about 20 km, and using the model given in Recommendation ITU-R P.1546 [10] for the greater distances with the time probability of 1 % and the location probability of 50 %.
The sharing is considered in both directions, i.e. when the wireless microphones are interfering into and are interfered with by the radiolocation and fixed services.
Considerations have been given to the co-channel co-existence in suburban and rural environments and when the wireless microphones are operated indoor and outdoor.
5.2 CALCULATION RESULTS
This section provides results relating to the radiolocation, considering the characteristics provided in Table 9.
ECC REPORT 245 - Page 24
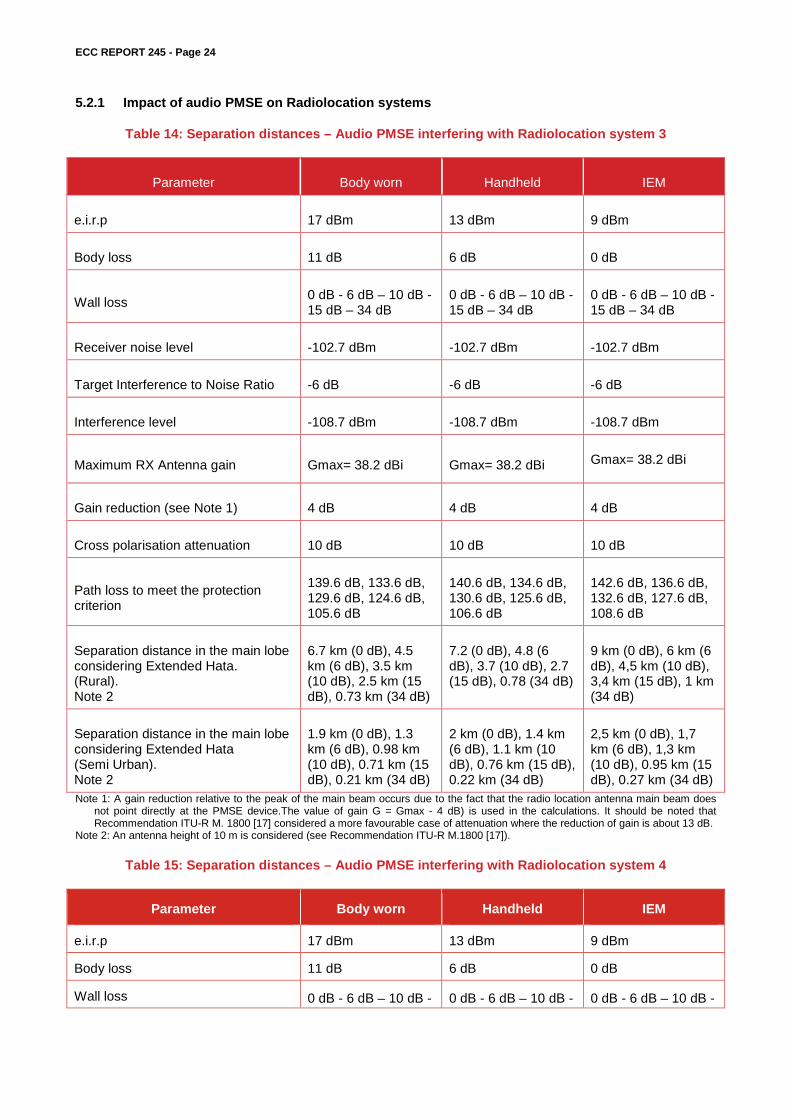
5.2.1 Impact of audio PMSE on Radiolocation systems
Table 14: Separation distances – Audio PMSE interfering with Radiolocation system 3
Parameter Body worn Handheld IEM
e.i.r.p 17 dBm 13 dBm 9 dBm
Body loss 11 dB 6 dB 0 dB
Wall loss 0 dB - 6 dB – 10 dB -15 dB – 34 dB
0 dB - 6 dB – 10 dB -15 dB – 34 dB
0 dB - 6 dB – 10 dB -15 dB – 34 dB
Receiver noise level -102.7 dBm -102.7 dBm -102.7 dBm
Target Interference to Noise Ratio -6 dB -6 dB -6 dB
Interference level -108.7 dBm -108.7 dBm -108.7 dBm
Maximum RX Antenna gain Gmax= 38.2 dBi Gmax= 38.2 dBi Gmax= 38.2 dBi
Gain reduction (see Note 1) 4 dB 4 dB 4 dB
Cross polarisation attenuation 10 dB 10 dB 10 dB
Path loss to meet the protection criterion
139.6 dB, 133.6 dB, 129.6 dB, 124.6 dB, 105.6 dB
140.6 dB, 134.6 dB, 130.6 dB, 125.6 dB, 106.6 dB
142.6 dB, 136.6 dB, 132.6 dB, 127.6 dB, 108.6 dB
Separation distance in the main lobe considering Extended Hata. (Rural). Note 2
6.7 km (0 dB), 4.5 km (6 dB), 3.5 km (10 dB), 2.5 km (15 dB), 0.73 km (34 dB)
7.2 (0 dB), 4.8 (6 dB), 3.7 (10 dB), 2.7 (15 dB), 0.78 (34 dB)
9 km (0 dB), 6 km (6 dB), 4,5 km (10 dB), 3,4 km (15 dB), 1 km (34 dB)
Separation distance in the main lobe considering Extended Hata (Semi Urban). Note 2
1.9 km (0 dB), 1.3 km (6 dB), 0.98 km (10 dB), 0.71 km (15 dB), 0.21 km (34 dB)
2 km (0 dB), 1.4 km (6 dB), 1.1 km (10 dB), 0.76 km (15 dB), 0.22 km (34 dB)
2,5 km (0 dB), 1,7 km (6 dB), 1,3 km (10 dB), 0.95 km (15 dB), 0.27 km (34 dB)
Note 1: A gain reduction relative to the peak of the main beam occurs due to the fact that the radio location antenna main beam does not point directly at the PMSE device.The value of gain G = Gmax - 4 dB) is used in the calculations. It should be noted that Recommendation ITU-R M. 1800 [17] considered a more favourable case of attenuation where the reduction of gain is about 13 dB.
Note 2: An antenna height of 10 m is considered (see Recommendation ITU-R M.1800 [17]).
Table 15: Separation distances – Audio PMSE interfering with Radiolocation system 4
Parameter Body worn Handheld IEM
e.i.r.p 17 dBm 13 dBm 9 dBm
Body loss 11 dB 6 dB 0 dB
Wall loss 0 dB - 6 dB – 10 dB - 0 dB - 6 dB – 10 dB - 0 dB - 6 dB – 10 dB -

ECC REPORT 245 - Page 25
Parameter Body worn Handheld IEM
15 dB – 34 dB 15 dB – 34 dB 15 dB – 34 dB
Receiver noise level -109.5 dBm -109.5 dBm -109.5 dBm
Target Interference to Noise Ratio -6 dB -6 dB -6 dB
Interference level -115.5 dBm -115.5 dBm -115.5 dBm
Antenna Gmax= 32.5 dBi Gmax= 32.5 dBi Gmax= 32.5 dBi
Gain reduction (see Note 1) 4 dB 4 dB 4 dB
Cross polarisation attenuation 0 dB 0 dB 0 dB
Path loss (protection criterion) (dB) 150 dB, 144 dB, 140 dB, 135 dB, 116 dB
151 dB, 145 dB, 141 dB, 136 dB, 117 dB
153 dB, 147 dB, 143 dB, 138 dB, 119 dB
Separation distance in the main lobe considering Extended Hata. (Rural). Note 2
13.3 km (0 dB), 9 km (6 dB), 6.9 km (10 dB), 5 km (15 dB), 1.4 km (34 dB)
14.2 km (0 dB), 9.6 km (6 dB), 7.4 km (10 dB), 5.3 (15 dB), 1.5 (34 dB)
18 km (0 dB), 12 km (6 dB), 9.2 km (10 dB), 6,5 km (15 dB), 1,9 km (34 dB)
Separation distance in the main lobe considering Extended Hata (Semi Urban). Note 2
3.7 km (0 dB), 2.5 km (6 dB), 1.9 km (10 dB), 1.4 km (15 dB), 0.41 km (34 dB)
4 km (0 dB), 2.7 km (6 dB), 2.1 km (10 dB), 1.5 km (15 dB), 0.43 km (34 dB)
5 km (0 dB), 3,4 km (6 dB), 2,6 km (10 dB), 1.9 km (15 dB), 0.55 km (34 dB)
Note 1: A gain reduction relative to the peak of the main beam occurs due to the fact that the radio location antenna main beam does not point directly at the PMSE device.The value of gain G = Gmax - 4 dB) is used in the calculations. It should be noted that Recommendation ITU-R M. 1800 [17] considered a more favourable case of attenuation where the reduction of gain is about 13 dB.
Note 2: an antenna height of 10 m is considered (see Recommendation ITU-R M.1800 [17]).
Table 16: Separation distances – Audio PMSE interfering with Radiolocation system 5
Parameter Body worn Handheld IEM
e.i.r.p 17 dBm 13 dBm 9 dBm
Body loss 11 dB 6 dB 0 dB
Wall loss 0 dB - 6 dB – 10 dB -15 dB – 34 dB
0 dB - 6 dB – 10 dB -15 dB – 34 dB
0 dB - 6 dB – 10 dB -15 dB – 34 dB
Receiver noise level -110.3 dBm -110.3 dBm -110.3 dBm
Target Interference to Noise Ratio -6 dB -6 dB -6 dB
Interference level -116.3 dBm -116.3 dBm -116.3 dBm
Antenna Gmax = 38.5 dBi Gmax = 38.5 dBi Gmax = 38.5 dBi
Gain reduction (see Note 1) 4 dB 4 dB 4 dB
Cross polarisation attenuation 10 dB 10 dB 10 dB
ECC REPORT 245 - Page 26
Parameter Body worn Handheld IEM
Path loss to meet the protection criterion
146.8 dB, 140.8 dB, 136.8 dB, 131.8 dB, 112.8 dB
147.8 dB, 141.8 dB, 137.8 dB, 132.8 dB, 113.8 dB
149.8 dB, 143.8 dB, 139.8 dB, 134.8 dB, 115.8 dB
Separation distance in the main lobe considering Extended Hata (Rural). Note 2
10.7 km (0 dB), 7.3 km (6 dB), 5.6 km (10 dB), 4 km (15 dB), 1.2 km (34 dB)
11.5 km (0 dB), 7.7 km (6 dB), 6 km (10 dB), 4.3 km (15 dB), 1.2 km (34 dB)
14 km (0 dB), 9,5 km (6 dB), 7 km (10 dB), 5,4 km (15 dB), 1,6 km (34 dB)
Separation distance in the main lobe considering Extended Hata. (Semi Urban) Note 2
3 km (0 dB), 2 km (6 dB), 1.6 km (10 dB), 1.1 km (15 dB), 0.33 km (34 dB)
3.2 km (0 dB), 2.2 km (6 dB), 1.7 km (10 dB), 1.2 km (15 dB), 0.35 km (34 dB)
4 km (0 dB), 2,7 km (6 dB), 2,1 km (10 dB), 1,5 km (15 dB), 0.42 km (34 dB)
Note 1: A gain reduction relative to the peak of the main beam occurs due to the fact that the radio location antenna main beam does not point directly at the PMSE device. The value of gain G = Gmax - 4 dB) is used in the calculations. It should be noted that Recommendation ITU-R M. 1800 [17] considered a more favourable case of attenuation where the reduction of gain is about 13 dB.
Note 2: An antenna height of 10 m is considered (see Recommendation ITU-R M.1800 [17]).
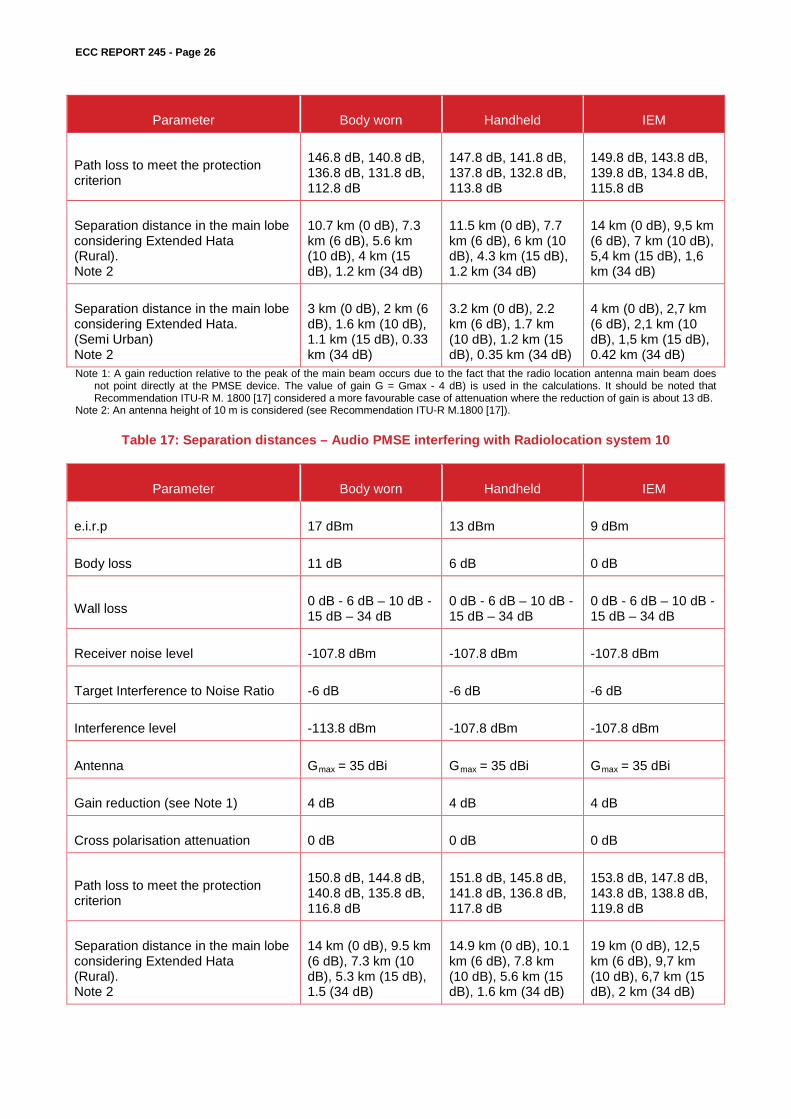
Table 17: Separation distances – Audio PMSE interfering with Radiolocation system 10
Parameter Body worn Handheld IEM
e.i.r.p 17 dBm 13 dBm 9 dBm
Body loss 11 dB 6 dB 0 dB
Wall loss 0 dB - 6 dB – 10 dB -15 dB – 34 dB
0 dB - 6 dB – 10 dB -15 dB – 34 dB
0 dB - 6 dB – 10 dB -15 dB – 34 dB
Receiver noise level -107.8 dBm -107.8 dBm -107.8 dBm
Target Interference to Noise Ratio -6 dB -6 dB -6 dB
Interference level -113.8 dBm -107.8 dBm -107.8 dBm
Antenna Gmax = 35 dBi Gmax = 35 dBi Gmax = 35 dBi
Gain reduction (see Note 1) 4 dB 4 dB 4 dB
Cross polarisation attenuation 0 dB 0 dB 0 dB
Path loss to meet the protection criterion
150.8 dB, 144.8 dB, 140.8 dB, 135.8 dB, 116.8 dB
151.8 dB, 145.8 dB, 141.8 dB, 136.8 dB, 117.8 dB
153.8 dB, 147.8 dB, 143.8 dB, 138.8 dB, 119.8 dB
Separation distance in the main lobe considering Extended Hata (Rural). Note 2
14 km (0 dB), 9.5 km (6 dB), 7.3 km (10 dB), 5.3 km (15 dB), 1.5 (34 dB)
14.9 km (0 dB), 10.1 km (6 dB), 7.8 km (10 dB), 5.6 km (15 dB), 1.6 km (34 dB)
19 km (0 dB), 12,5 km (6 dB), 9,7 km (10 dB), 6,7 km (15 dB), 2 km (34 dB)

ECC REPORT 245 - Page 27
Parameter Body worn Handheld IEM
Separation distance in the main lobe considering Extended Hata (Semi Urban). Note 2
3.9 km (0 dB), 2.7 km (6 dB), 2.1 km (10 dB), 1.5 km (15 dB), 0.43 km (34 dB)
4.2 km (0 dB), 2.8 km (6 dB), 2.2 km (10 dB), 1.6 km (15 dB), 0.46 km (34 dB)
5,3 km (0 dB), 3,5 km (6 dB), 2,7 km (10 dB), 2 km (15 dB), 0.57 km (34 dB)
Note 1: A gain reduction relative to the peak of the main beam occurs due to the fact that the radio location antenna main beam does not point directly at the PMSE device.The value of gain G = Gmax - 4 dB) is used in the calculations. It should be noted that Recommendation ITU-R M. 1800 [17] considered a more favourable case of attenuation where the reduction of gain is about 13 dB.
Note 2: An antenna height of 10 m is considered (see Recommendation ITU-R M.1800 [17]).
5.2.2 Impact of Radiolocation systems on Audio PMSE
Table 18: Separation distances – Radiolocation system interfering with audio PMSE
Parameter Radiolocation 3
Radiolocation 4
Radiolocation 5
Radiolocation 10
e.i.r.p. (dBm) 76.5 80 73.9 85
Wall Loss (dB) 0, 6, 10, 15, 34 0, 6, 10, 15, 34 0, 6, 10, 15, 34 0, 6, 10, 15, 34
Receiver noise level (dBm) -117.8 -117.8 -117.8 -117.8
Desensitization (dB) 3 3 3 3
Interference level (dBm) -117.8 -117.8 -117.8 -117.8
Antenna gain (Gmax) (dBi) 38.9 32.5 38.5 35.0
Relative antenna gain (dB) -4 -4 -4 -4
Cross polarisation attenuation (dB) 10 0 10 0
Path loss (protection criterion) (dB)
208.8, 202.8, 198.8, 193.8, 174.8
219.4, 213.4, 209.4, 204.4, 185.4
208.3, 202.3, 198.3, 193.3, 174.3
222.1, 216.1, 212.1, 207.1, 188.1
Separation distance in the main lobe considering P.1546 (rural) (km)
188.7 (0 dB), 123.5 (6 dB), 87 (10 dB), 58.1 (15 dB), 19.4 (34 dB)
304.9 (0 dB), 238.2 (6 dB), 194.4 (10 dB), 139.6 (15 dB), 33.9 (34 dB)
182.6 (0 dB), 118 (6 dB), 83 (10 dB), 55.8 (15 dB), 18.9 (34 dB)
335.7 (0 dB), 268.4 (6 dB), 224.5 (10 dB), 169.4 (15 dB), 39.7 (34 dB)
Separation distance in the main lobe considering P.1546 (suburban) (km)
112.5 (0 dB), 67.1 (6 dB), 50.1 (10 dB), 36.7 (15 dB), 13.7 (34 dB)
226.3 (0 dB), 160.3 (6 dB), 117.7 (10 dB), 76 (15 dB), 23.1 (34 dB)
107.2 (0 dB), 64.3 (6 dB), 48.3 (10 dB), 35.5 (15 dB), 13.3 (34 dB)
256.2 (0 dB), 190.4 (6 dB), 146.4 (10 dB), 96.4 (15 dB), 26.7 (34 dB)
5.2.3 Conclusions
For the protection of Radiolocation systems, separation distances of the order of 19 km are necessary for IEM deployed outdoors. If the deployment
of IEM is limited to indoor, then, a separation distance of about 7 km is necessary;

ECC REPORT 245 - Page 28
separation distances of the order of 15 km are necessary for body worn and hand held equipment deployed outdoors. If the deployment of body worn and hand held equipment is limited to indoor, then a separation distance of about 5 km is necessary.
It can be clearly seen that the radio microphone receiver would suffer from interference long before any interference occurs to the primary terrestrial service. Therefore, by implementing a scanning procedure in order to identify the parts of spectrum, which are in use by other transmitter(s) and the parts, which are available for successful audio PMSE operation, audio PMSE will avoid being interfered with by Radiolocation systems and avoid interfering with the Radiolocation systems.
5.3 IMPACT ON FIXED SERVICE
5.3.1 Systems having similar characteristics as in the frequency range 1492-1517 MHz
5.3.1.1 Minimum coupling loss calculations
Considering the assumptions given in section 4, it is possible to determine the minimum separation distances in order to meet the Fixed Service interference criterion.
Table 19: Separation distances – Dish antenna - Fixed Service Coordinated
Parameter Body worn Handheld IEM
e.i.r.p 17 dBm 13 dBm 9 dBm
Body loss 11 dB 6 dB 0 dB
Wall loss 0 dB - 6 dB – 10 dB -15 dB – 34 dB
0 dB - 6 dB – 10 dB -15 dB – 34 dB
0 dB - 6 dB – 10 dB -15 dB – 34 dB
Receiver noise level -113 dBm -113 dBm -113 dBm
Target Interference to Noise Ratio -6 dB -6 dB -6 dB
Interference level -119 dBm -119 dBm -119 dBm
Antenna Type: Dish Gmax= 30 dBi
Type: Dish Gmax= 30 dBi
Type: Dish Gmax= 30 dBi
Path loss to meet the protection criterion
155 dB - 149 dB – 145 dB – 140 dB – 121 dB
156 dB -150 dB – 146 dB – 141 dB - 122 dB
158 dB - 152 dB – 148 dB – 143 dB - 124 dB
Separation distances in the main lobe 3
20 km (0 – 15 dB) 4 – 9,8 km (34 dB)
20 km 5 (0 -15 dB)– 10,4 km (34 dB)
21 km 6 (0 – 15 dB) – 12 km (34 dB)
3 Resulting protection distances are calculated using a dual slope free space model (20 log for distances up to 5 km and 40 log above)
(see ECC Report 121) 4 Line of sight is calculated using: 3.57*(20 m)^0.5+3.57*(1,5 m)^0.5, the results is in km. 5 Line of sight is calculated using: 3.57*(20 m)^0.5+3.57*(1,5 m)^0.5, the results is in km. 6 Line of sight is calculated using: 3.57*(20 m)^0.5+3.57*(2 m)^0.5, the results is in km.

ECC REPORT 245 - Page 29
Parameter Body worn Handheld IEM
Separation distance in the main lobe considering Extended Hata (Rural)
25 km (0 dB) - 18 km (6 dB) – 14 km (10 dB) – 10 km (15 dB) – 3 km (34 dB)
27 km (0 dB) - 20 km (6 dB) –15 km (10 dB) – 11 km (15 dB) – 3 km (34 dB)
31 km (0 dB) - 23 km (6 dB) –19 km (10 dB) – 14 km (15 dB) – 3,9 km (34 dB)
Separation distance in the main lobe considering Extended Hata (Sub urban)
7,6 km (0 dB) - 5,1 km (6 dB) – 4 km (10 dB) – 2,9 km (15 dB) – 0,85 km (34 dB)
8,1 km (0 dB) - 5,5 km (6 dB) – 4,3 km (10 dB) – 3,1 km (15 dB) – 0,9 km (34 dB)
10,2 km (0 dB) - 7 km (6 dB) – 5,4 km (10 dB) – 3,9 km (15 dB) – 1,1 km (34 dB)
Path loss to meet the protection criterion in the side lobe
117 dB - 111 dB –107 dB –102 dB – 83 dB
118 dB - 112 dB – 108 dB – 103 dB – 84 dB
120 dB - 114 dB – 110 dB – 105 dB – 86 dB
Separation distances in the side lobe
7,8 km (0 dB) - 5,5 km (6 dB) – 3,8 km (10 dB) – 2,1 km (15 dB) – 0,2 km (34 dB)
8,2 km (0 dB) - 5,8 km (6 dB) – 4,3 km (10 dB) – 2,4 km (15 dB) – 0,3 km (34 dB)
9,2 km (0 dB) - 6,5 km (6 dB) – 5,2 km (10 dB) – 3 km (15 dB) – 0,3 km (34 dB)
Separation distance in the side lobe considering Extended Hata (Rural)
2,3 km (0 dB) - 1,5 km (6 dB) – 1,2 km (10 dB) – 0,85 km (15 dB) – 0,245 km (34 dB)
2,4 km (0 dB) - 1,6 km (6 dB) –1,25 km (10 dB) – 0,9 km (15 dB) – 0,26 km (34 dB)
3 km (0 dB) - 2 km (6 dB) – 1,6 km (10 dB) – 1,15 km (15 dB) – 0,39 km (34 dB)
Separation distance in the side lobe considering Extended Hata (Sub urban)
0,65 km (0 dB) - 0,43 km (6 dB) – 0,33 km (10 dB) – 0,24 km (15 dB) – 0,078 km (34 dB)
0,7 km (0 dB) - 0,46 km (6 dB) – 0,35 km (10 dB) – 0,26 km (15 dB) – 0,081 km (34 dB)
0,85 km (0 km) - 0,58 km (6 dB) –0,45 km (10 dB) – 0,32 km (15 dB) – 0,095 km (34 dB)
Table 20: Separation distances -Yagi antenna - Fixed Service Coordinated
Parameter Body worn Handheld IEM
e.i.r.p 17 dBm 13 dBm 9 dBm
Body loss 11 dB 6 dB 0 dB
Wall loss 0 dB - 6 dB – 10 dB -15 dB – 34 dB
0 dB - 6 dB – 10 dB -15 dB – 34 dB
0 dB - 6 dB – 10 dB -15 dB – 34 dB
Receiver noise level -113 dBm -113 dBm -113 dBm
Target Interference to Noise Ratio -6 dB -6 dB -6 dB
Interference level -119 dBm -119 dBm -119 dBm
Antenna Type: Yagi Gmax= 16 dBi
Type: Yagi Gmax= 16 dBi
Type: Yagi Gmax= 16 dBi
Path loss to meet the protection criterion
141 dB - 135 dB – 131 dB – 126 dB – 107 dB
142 dB - 136 dB – 132 dB – 127 dB - 108 dB
144 dB - 138 dB – 134 dB – 129 dB – 110 dB

ECC REPORT 245 - Page 30
Parameter Body worn Handheld IEM
Separation distances in the main lobe 7
20 km (0 dB - 6 dB) – 17 km (10 dB) – 13 km (15 dB) – 3,8 km (34 dB)
20 km 8(0 dB - 6 dB) – 18 km (10 dB) – 14 km (15 dB) – 4,3 km (34 dB)
21 km 9 (0 dB – 10 dB) 16 km (15 dB) – 5 km (34 dB)
Separation distance in the main lobe considering Extended Hata (Rural)
11 km (0dB) - 7,3 km (6 dB) – 5,5 km (10 dB) – 4 km (15 dB) – 1,2 km (34 dB)
11,5 km (0dB) - 7,8 km (6 dB) – 6 km (10 dB) – 4,4 km (15 dB) – 1,25 km (34 dB)
14,5 km (0 dB) - 10 km (6 dB) –7,5 km (10 dB) – 5,5 km (15 dB) – 1,6 km (34 dB)
Separation distance in the main lobe considering Extended Hata (Sub urban)
3,1 km (0 dB) - 2 km (6 dB) – 1,6 km (10 dB) – 1,15 km (15 dB) –0,33 km (34 dB)
3,3 km (0 dB) - 2,2 km (6 dB) – 1,7 km (10 dB) – 1,2 km (15 dB) – 0,35 km (34 dB)
4,1 km (0 dB) - 2,8 km (6 dB) – 2,1 km (10 dB) – 1,55 km (15 dB) – 0,45 km (34 dB)
Path loss to meet the protection criterion in the side lobe
120 dB - 114 dB –110 dB –105 dB – 86 dB
121 dB - 115 dB – 111 dB – 106 dB – 87 dB
123 dB - 117 dB – 113 dB – 108 dB – 89 dB
Separation distances in the side lobe
9,2 km (0 dB) - 6,5 km (6 dB) – 5,2 km (10 dB) – 3 km (15 dB) – 0,3 km (34 dB)
9,8 km (0 dB) - 6,9 km (6 dB) – 5,5 km (10 dB) – 3,4 km (15 dB) – 0,4 km (34 dB)
11 km (0 dB) - 7,8 km (6 dB) – 6,2 km (10 dB) – 4,3 km (15 dB) – 0,5 km (34 dB)
Separation distance in the side lobe considering Extended Hata (Rural)
2,8 km (0 dB) - 1,9 km (6 dB) – 1,4 km (10 dB) – 1 km (15 dB) – 0,3 km (34 dB)
3 km (0 dB) - 2 km (6 dB) –1,5 km (10 dB) – 1,1 km (15 dB) – 0,32 km (34 dB)
3,7 km (0 dB) - 2,5 km (6 dB) – 1,9 km (10 dB) – 1,4 km (15 dB) – 0,4 km (34 dB)
Separation distance in the side lobe considering Extended Hata (Sub urban)
0,77 km (0 dB) - 0,52 km (6 dB) – 0,4 km (10 dB) – 0,29 km (15 dB) – 0,09 km (34 dB)
0,82 km (0 dB) - 0,55 km (6 dB) – 0,43 km (10 dB) – 0,31 km (15 dB) – 0,093 km (34 dB)
1,05 km (0 dB) - 0,7 km (6 dB) – 0,55 km (10 dB) – 0,4 km (15 dB) – 0,11 km (34 dB)
5.3.1.2 SEAMCAT simulations
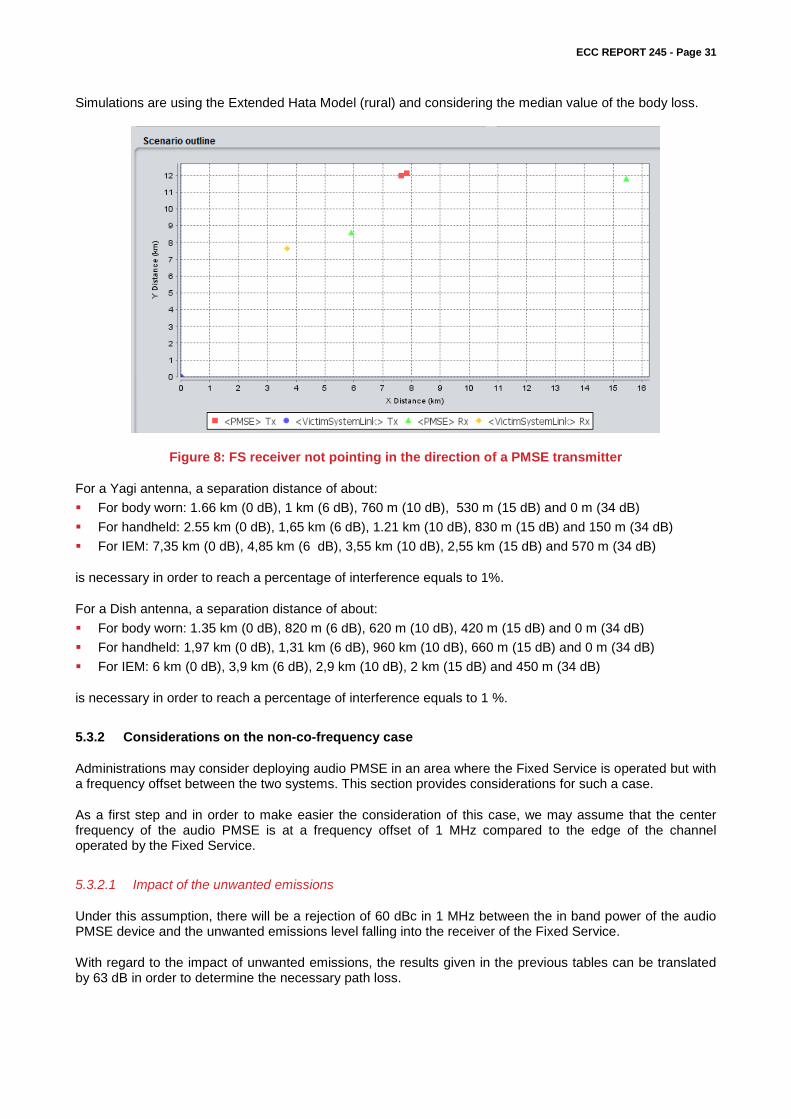
The approach is based on the simulations described in ECC Report 121 [8], a separation distance between the Fixed Service receiver and the audio PMSE transmitters is considered. It should be noted that in a given 1 MHz the density of audio PMSE devices in this frequency range is expected to be rather low. No more than 2 devices are expected to be deployed in a given area in a given 500 kHz. The victim / interfering frequency is 1492.5 MHz.
In order to consider a coordinated deployment, it is assumed the Fixed Service receiver is not pointing in the direction of the audio PMSE transmitters or that the audio PMSE are located in an area not located in the main beam of the Fixed Service antenna. If a coordination process is implemented in order to identify areas where audio PMSE could be deployed, one could expect that the Fixed Service receiver is unlikely to point in the direction of a audio PMSE transmitter. Therefore, in the scenario, the Fixed Service receiver is deployed in the area centered on the Fixed Service transmitter limited to 0 to 90 degrees.
7 Resulting protection distances are calculated using a dual slope free space model (20 log for distances up to 5 km and 40 log above)
(see ECC Report 121) 8 Line of sight is calculated using: 3.57*(20 m)^0.5+3.57*(1,5 m)^0.5, the results is in km. 9 Line of sight is calculated using: 3.57*(20 m)^0.5+3.57*(2 m)^0.5, the results is in km.
ECC REPORT 245 - Page 31
Simulations are using the Extended Hata Model (rural) and considering the median value of the body loss.
Figure 8: FS receiver not pointing in the direction of a PMSE transmitter
For a Yagi antenna, a separation distance of about: For body worn: 1.66 km (0 dB), 1 km (6 dB), 760 m (10 dB), 530 m (15 dB) and 0 m (34 dB) For handheld: 2.55 km (0 dB), 1,65 km (6 dB), 1.21 km (10 dB), 830 m (15 dB) and 150 m (34 dB) For IEM: 7,35 km (0 dB), 4,85 km (6 dB), 3,55 km (10 dB), 2,55 km (15 dB) and 570 m (34 dB)
is necessary in order to reach a percentage of interference equals to 1%.
For a Dish antenna, a separation distance of about: For body worn: 1.35 km (0 dB), 820 m (6 dB), 620 m (10 dB), 420 m (15 dB) and 0 m (34 dB) For handheld: 1,97 km (0 dB), 1,31 km (6 dB), 960 km (10 dB), 660 m (15 dB) and 0 m (34 dB) For IEM: 6 km (0 dB), 3,9 km (6 dB), 2,9 km (10 dB), 2 km (15 dB) and 450 m (34 dB)
is necessary in order to reach a percentage of interference equals to 1 %.
5.3.2 Considerations on the non-co-frequency case
Administrations may consider deploying audio PMSE in an area where the Fixed Service is operated but with a frequency offset between the two systems. This section provides considerations for such a case.
As a first step and in order to make easier the consideration of this case, we may assume that the center frequency of the audio PMSE is at a frequency offset of 1 MHz compared to the edge of the channel operated by the Fixed Service.
5.3.2.1 Impact of the unwanted emissions
Under this assumption, there will be a rejection of 60 dBc in 1 MHz between the in band power of the audio PMSE device and the unwanted emissions level falling into the receiver of the Fixed Service.
With regard to the impact of unwanted emissions, the results given in the previous tables can be translated by 63 dB in order to determine the necessary path loss.
ECC REPORT 245 - Page 32
For body worn wireless microphone (best case):
For the Yagi antenna, in the main beam case, the necessary path loss will be of the order of 78 dB to 44 dB corresponding to a distance of about 150 m in the worst case, indicating that even if the wireless microphones are operated nearby the Fixed Service antenna, there would be no risk of interference, since the wireless microphones are unlikely to be located in the main beam of the FS antenna at such distance.
For the Dish antenna, in the main beam case, the necessary path loss will be of the order of 92 dB to 58 dB corresponding to a distance of about 600 m (0 dB) to 0 m (34 dB) (considering the free space model). In any case, wireless microphones are unlikely to be located in the main beam of the FS antenna if located in their vicinity. For the side lobe case, in the worst case, the necessary path loss will be of the order of 53 dB, indicating that even if the wireless microphones are operated nearby the Fixed Service antenna, there would be no risk of interference.
For handheld: the results are very similar to the body worn case.
For IEM (worst case):
For the Yagi antenna, in the main beam case, the necessary path loss will be of the order of 81 dB to 47 dB corresponding to a distance of about 180 m (0 dB) to 0 m (34 dB) (considering the free space model). For the side lobe case, in the worst case, the necessary path loss will be of the order of 60 dB, indicating that even if the IEM are operated nearby the Fixed Service antenna, there would be no risk of interference.
For the Dish antenna, in the main beam case, the necessary path loss will be of the order of 95 dB to 61 dB corresponding to a distance of about 900 m (0 dB) to 18 m (34 dB) (assuming the free space model). In any case, IEM are unlikely to be located in the main beam of the FS antenna if located in their vicinity. For the side lobe case, in the worst case, the necessary path loss will be of the order of 56 dB, indicating that even if the IEM are operated nearby the Fixed Service antenna, there would be no risk of interference.
5.3.2.2 Impact on the blocking
In order to assess the impact of audio PMSE systems on the blocking of the Fixed Service receiver, it would be necessary to have additional information on the distribution of the received power. As an initial step, the power received by the Fixed Service receiver is assumed to be equal to −87 dBm/MHz (see ECC Report 202 – Annex 5) [18].
If body worn devices (best case) are deployed with a guard band of 1 MHz, nearby the channel operated by the Fixed Service a BR of 50 dB should be considered (see ECC Report 202). This implies that a path loss of: -87 dBm + 50 dB – (6 dBm + 16 dBi - Attwallloss) = -59 dB + Attwallloss should be considered in the
main beam for the Yagi antenna. Then, no interference is expected -87 dBm + 50 dB – (6 dBm) + 30 dBi - Attwallloss) = -73 dB + Attwallloss should be considered in the
main beam for the Dish antenna. Then, no interference is expected since PMSE are not going to be located in the main beam of the FS link considering the corresponding distances (70 m).
If IEM devices (worst case) are deployed with a guard band of 1 MHz, nearby the channel operated by the Fixed Service a BR of 50 dB should be considered (see ECC Report 202). This implies that a path loss of: -87 dBm + 50 dB – ((9 dBm) + 16 dBi - Attwallloss) = -62 dB - Attwallloss should be considered in the
main beam for option 1 (Yagi antenna). Then, no interference is expected. -87 dBm + 50 dB – (9 dBm) + 30 dBi - Attwallloss) = -76 dB - Attwallloss should be considered in the
main beam for option 2 (Dish antenna) corresponding to a distance of from 0 m (34 dB) to 120 m (0 dB) (considering the free space model). No interference is expected since IEM are not going to be located in the main beam of the FS link considering the corresponding distances.

ECC REPORT 245 - Page 33
5.3.2.3 Conclusions
In the case of co-frequency operation, separation distance could be implemented. Separation distances are shorter for body worn/handheld wireless microphones (about 2.5 km for outdoor deployment and 1 km for indoor deployment) than for IEM (7 km for outdoor deployment and 2.5 km for indoor deployment) when located in the side lobes of the Fixed Service antenna (wall loss attenuation of 15 dB). In the main lobe, separation distances of about 21 km are needed.
If a guard band of 1 MHz is considered between the edge of the channels used by the audio PMSE and the Fixed Service receiver respectively, there will be no interference on the Fixed Service.
For smaller guard bands, a combination of guard band associated with a separation distance may need to be considered.
5.3.3 Tactical radio relay (TRR)
5.3.4 Considerations on the co-frequency case
5.3.4.1 Minimum coupling loss calculations
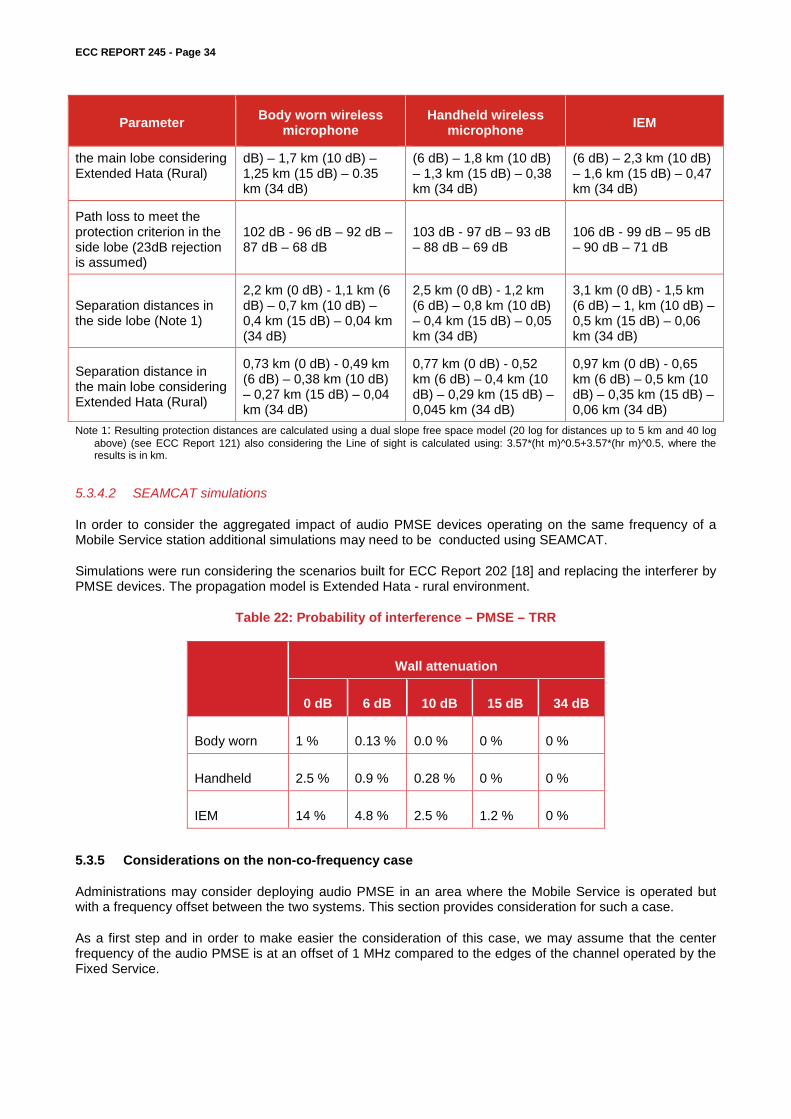
Considering the assumptions given in sections 2 and 3, it is possible to determine the minimum separation in order to meet the TRR interference criterion.
Table 21: Separation distances – TRR
Parameter Body worn wireless microphone
Handheld wireless microphone IEM
e.i.r.p 17 dBm 13 dBm 9 dBm
Body loss 11 dB 6 dB 0 dB
Wall loss 0 dB - 6 dB – 10 dB -15 dB – 34 dB
0 dB - 6 dB – 10 dB -15 dB – 34 dB
0 dB - 6 dB – 10 dB -15 dB – 34 dB
Receiver noise level -105 dBm/1.5 MHz -105 dBm/1.5 MHz 105 dBm/1.5 MHz
Target Interference to Noise Ratio 0 dB 0 dB 0 dB
Interference level -105 dBm/1.5 MHz -105 dBm/1.5 MHz -105 dBm/1.5 MHz
Antenna Gmax= 21 dBi Gmax= 21 dBi Gmax= 21 dBi
Feeder Loss 4 dB 4 dB 4 dB
Polarisation discrimination (linear to circular)
3 dB 3 dB 3 dB
Path loss to meet the protection criterion
125 dB - 119 dB – 115 dB – 110 dB – 91 dB
126 dB - 120 dB – 116 dB – 111 dB – 92 dB
128 dB - 122 dB – 118 dB – 113 dB – 94 dB
Separation distances in the main lobe (Note 1)
12 km (0 dB) - 9 km (6 dB) – 7 km (10 dB) – 5 km (15 dB) – 1 km (34 dB)
13 km (0 dB) - 9 km (6 dB) – 7 km (10 dB) – 6 km (15 dB) – 1 km (34 dB)
15 km (0 dB) – 10 km (6 dB) – 8 km (10 dB) - 6 km (15 dB) – 1 km (34 dB)
Separation distance in 3,3 km (0 dB) - 2,2 km (6 3,5 km (0 dB) - 2,4 km 4,3 km (0 dB) - 2,9 km
ECC REPORT 245 - Page 34
Parameter Body worn wireless microphone
Handheld wireless microphone IEM
the main lobe considering Extended Hata (Rural)
dB) – 1,7 km (10 dB) – 1,25 km (15 dB) – 0.35 km (34 dB)
(6 dB) – 1,8 km (10 dB) – 1,3 km (15 dB) – 0,38 km (34 dB)
(6 dB) – 2,3 km (10 dB) – 1,6 km (15 dB) – 0,47 km (34 dB)
Path loss to meet the protection criterion in the side lobe (23dB rejection is assumed)
102 dB - 96 dB – 92 dB – 87 dB – 68 dB
103 dB - 97 dB – 93 dB – 88 dB – 69 dB
106 dB - 99 dB – 95 dB – 90 dB – 71 dB
Separation distances in the side lobe (Note 1)
2,2 km (0 dB) - 1,1 km (6 dB) – 0,7 km (10 dB) – 0,4 km (15 dB) – 0,04 km (34 dB)
2,5 km (0 dB) - 1,2 km (6 dB) – 0,8 km (10 dB) – 0,4 km (15 dB) – 0,05 km (34 dB)
3,1 km (0 dB) - 1,5 km (6 dB) – 1, km (10 dB) – 0,5 km (15 dB) – 0,06 km (34 dB)
Separation distance in the main lobe considering Extended Hata (Rural)
0,73 km (0 dB) - 0,49 km (6 dB) – 0,38 km (10 dB) – 0,27 km (15 dB) – 0,04 km (34 dB)
0,77 km (0 dB) - 0,52 km (6 dB) – 0,4 km (10 dB) – 0,29 km (15 dB) – 0,045 km (34 dB)
0,97 km (0 dB) - 0,65 km (6 dB) – 0,5 km (10 dB) – 0,35 km (15 dB) – 0,06 km (34 dB)
Note 1: Resulting protection distances are calculated using a dual slope free space model (20 log for distances up to 5 km and 40 log above) (see ECC Report 121) also considering the Line of sight is calculated using: 3.57*(ht m)^0.5+3.57*(hr m)^0.5, where the results is in km.
5.3.4.2 SEAMCAT simulations
In order to consider the aggregated impact of audio PMSE devices operating on the same frequency of a Mobile Service station additional simulations may need to be conducted using SEAMCAT.
Simulations were run considering the scenarios built for ECC Report 202 [18] and replacing the interferer by PMSE devices. The propagation model is Extended Hata - rural environment.
Table 22: Probability of interference – PMSE – TRR
Wall attenuation
0 dB 6 dB 10 dB 15 dB 34 dB
Body worn 1 % 0.13 % 0.0 % 0 % 0 %
Handheld 2.5 % 0.9 % 0.28 % 0 % 0 %
IEM 14 % 4.8 % 2.5 % 1.2 % 0 %
5.3.5 Considerations on the non-co-frequency case
Administrations may consider deploying audio PMSE in an area where the Mobile Service is operated but with a frequency offset between the two systems. This section provides consideration for such a case.
As a first step and in order to make easier the consideration of this case, we may assume that the center frequency of the audio PMSE is at an offset of 1 MHz compared to the edges of the channel operated by the Fixed Service.

ECC REPORT 245 - Page 35
5.3.5.1 Impact of the unwanted emissions
Under this assumption, there will be a rejection of 60 dBc in 1 MHz between the in band power of the audio PMSE device and the unwanted emissions level falling into the receiver of the Mobile Service.
With regard to the impact of unwanted emissions, the results given in Table 21 can be translated by 60 dB in order to determine the necessary path loss.
In the main beam case, the necessary path loss will be of the order of 70 dB corresponding to a distance of less than 60 m (assuming the free space model). For the side lobe case, in the worst case, the necessary path loss will be of the order of 46 dB, indicating that even if the audio PMSE are operated nearby the Mobile Service antenna, there would be no risk of interference.
5.3.5.2 Impact on the blocking
In order to assess the impact of audio PMSE on the blocking of the Mobile Service receiver, it would be necessary to have additional information on the distribution of the received power. As an initial step, the power received by the Mobile Service receiver is assumed to be equal to −87 dBm in 1.5 MHz.
If audio PMSE devices are deployed with a guard band of 1.5 MHz, nearby the channel operated by the Mobile Service a BR of 45 dB should be considered This implies that a path loss of:
-87 dBm + 45 dB – ((5 dBm) + 21 dBi) = 68 dB should be considered in the main beam corresponding to a distance less than 50 m (considering the free space model), 45 dB in the sidelobes.
5.3.5.3 Conclusions In case of TRR, the risk of interference is quite low for the body worn and hand held equipment. The risk of interference is more significant in case of IEM deployed outdoor. Administrations may consider two mitigation techniques:
Implementation of separation distances (1 km), if possible or Limit the deployment of IEM to indoor.
5.4 MOBILE (UAS)
The following table provides results of the MCL calculations for the separation distances for PMSE impact on UAS-BS RX (with RX noise level of -90 dBm) considering the rural and sub-urban environment.
Table 23: Separation distances – UAS-BS
Parameter Body worn Handheld IEM
e.i.r.p 17 dBm 13 dBm 9 dBm
Body loss 11 dB 6 dB 0 dB
Wall loss 0 dB - 6 dB – 10 dB -15 dB – 34 dB
0 dB - 6 dB – 10 dB -15 dB – 34 dB
0 dB - 6 dB – 10 dB -15 dB – 34 dB
Receiver noise level -90 dBm -90 dBm -90 dBm
Target Interference to Noise Ratio -6 dB -6 dB -6 dB

ECC REPORT 245 - Page 36
Parameter Body worn Handheld IEM
Interference level -96 dBm -96 dBm -96 dBm
Antenna 5 dBi 5 dBi 5 dBi
Path loss to meet the protection criterion in the main lobe
107 dB - 101 dB – 97 dB – 92 dB – 73 dB
108 dB - 102 dB – 98 dB – 93 dB – 74 dB
110 dB - 104 dB – 100 dB – 95 dB – 76 dB
Separation distance in the main lobe considering Extended Hata (Rural)
0.27 km (0 dB) - 0.18 km (6 dB) – 0.14 km (10 dB) – 0.10 km (15 dB) – 0.05 km (34 dB)
0.20 km (0 dB) – 0.20 km (6 dB) – 0.15 km (10 dB) - 0.11 km (15 dB) – 0.052 km (34 dB)
0.4 km (0 dB) - 0.27 km (6 dB) – 0.20 km (10 dB) – 0.15 km (15 dB) – 0.06 km (34 dB)
Separation distance in the main lobe considering Extended Hata (Semi Urban)
0.092 km (0 dB) - 0.081 km (6 dB) – 0.075 km (10 dB) –0.067 km (15 dB) – 0.045 km (34 dB)
0.094 (0 dB) – 0.083 km (6 dB) – 0.076 km (10 dB) – 0.069 km (15 dB) – 0.046 km (34 dB)
0.11 km (0 dB) – 0.090 km (6 dB) –0.083 km (10 dB) – 0.074 km (15 dB) – 0.050 km (34 dB)
Path loss to meet the protection criterion in the side lobe
99 dB - 93 dB – 89 dB – 84 dB – 65 dB
100 dB - 94 dB – 90 dB – 85 dB – 66 dB
102 dB - 96 dB – 92 dB – 87 dB – 68 dB
Separation distance in the side lobe considering Extended Hata (Rural)
0.16 km (0 dB) - 0.11 km (6 dB) – 0.09 km (10 dB) – 0.075 km (15 dB) – 0.031 km (34 dB)
0.17 km (0 dB) – 0.12 km (6 dB) – 0.095 km (10 dB) - 0.078 km (15 dB) – 0.035 km (34 dB)
0.23 km (0 dB) - 0.15 km (6 dB) – 0.12 km (10 dB) – 0.091 km (15 dB) – 0.042 km (34 dB)
Separation distance in the side lobe considering Extended Hata (Semi Urban)
0.078 km (0 dB) - 0.069 km (6 dB) – 0.063 km (10 dB) – 0.057 km (15 dB) – 0.031 km (34 dB)
0.080 km (0 dB) – 0.070 km (6 dB) – 0.065 km (10 dB) - 0.058 km (15 dB) – 0.034 km (34 dB)
0.087 km (0 dB) – 0.076 km (6 dB) –0.071 km (10 dB) – 0.062 km (15 dB) – 0.041 km (34 dB)
The following table provides results of the MCL calculations for the separation distances for PMSE impact on UAS-UAV considering the free space model. An altitude of 2000 m is considered for the UAV, it should be noted that ECC Report 172 [5] considered an altitude of 3000 m.
Table 24: Separation distances – UAS-UAV
Parameter Body worn Handheld IEM
e.i.r.p 17 dBm 13 dBm 9 dBm
Body loss 11 dB 6 dB 0 dB
Wall loss 0 dB - 6 dB – 10 dB -15 dB – 34 dB
0 dB - 6 dB – 10 dB -15 dB – 34 dB
0 dB - 6 dB – 10 dB -15 dB – 34 dB

ECC REPORT 245 - Page 37
Parameter Body worn Handheld IEM
Receiver noise level -90 dBm -90 dBm -90 dBm
Target Interference to Noise Ratio -6 dB -6 dB -6 dB
Interference level -96 dBm -96 dBm -96 dBm
Antenna 1 dBi 1 dBi 1 dBi
Path loss to meet the protection criterion in the main lobe
103 dB - 97 dB – 93 dB – 88 dB – 69 dB
104 dB - 98 dB – 94 dB – 89 dB – 70 dB
106 dB - 100 dB – 96 dB – 91 dB – 72 dB
Separation distance in the main lobe considering Free Space
1,4 km (0 dB) - NA (6dB – 10 dB - 15 dB – 34 dB)
1,9 km (0 dB) – NA (6dB – 10 dB - 15 dB – 34 dB)
2,9 km (0 dB) – NA (6dB – 10 dB - 15 dB – 34 dB)
5.4.1 Conclusions For UAS BS: the separation distances are of the order of 250 m, considering the mobile usage of this system, the
need and practicability of the implementation of such a separation distance is questionable. For UAS UAV: outdoor PMSE, the separation distances are of the order of 3 km, indoor PMSE, no need for mitigation techniques.
5.5 CO-EXISTENCE BETWEEN PMSE AND RAS
5.5.1.1 Study parameters
The study parameters, as summarised in Table 25 of this section, were taken from Section 3 of this ECC Report. The compatibility calculations were performed for the audio PMSE operating as a single emitter at a direct line of sight on an RAS station (i.e., the worst case scenario).
The transmitted power in the RAS band is calculated by a numerical integration over the spectrum mask. The threshold interference level at any frequency is obtained from the methodology and tables in the Recommendation ITU-R RA.769-2 [12], using antenna and receiver temperatures of the closest match. The minimum coupling loss is then calculated using the obtained power levels and mitigations for single entry scenario.
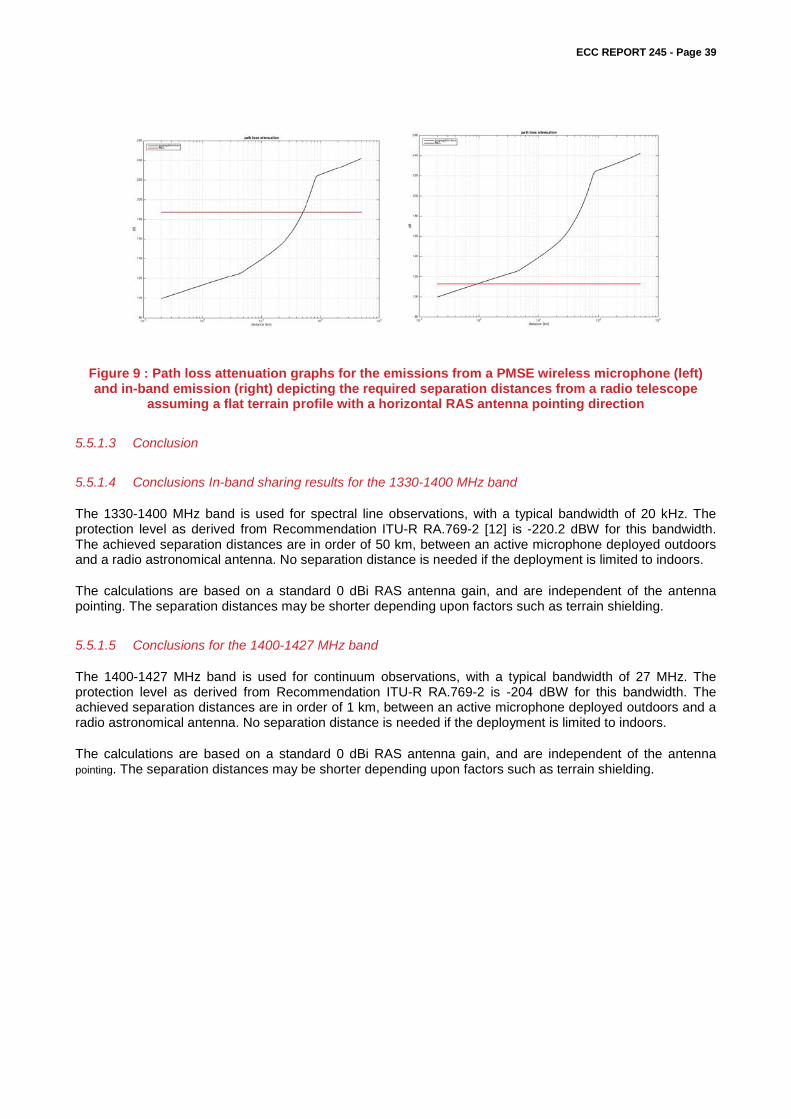
The path loss analysis fully follows the methodology in the propagation model described in Recommendation ITU-R P.452-15 [11]. The transmission loss calculations include the effects of attenuation from atmospheric absorption and anomalous propagation, spherical earth diffraction, tropospheric scatter, and ground clutter (considering a village clutter category). The atmospheric attenuation at frequencies below 500 MHz was assumed to be 0 dB/km. Finally, the minimum single emitter separation distance is obtained from the interception of the path loss curve with the MCL value, as demonstrated in Figure 9.

ECC REPORT 245 - Page 38
5.5.1.2 Impact of the emissions from wireless microphones on RAS station operating in 1350-1400 MHz or/and 1400-1427 MHz
Recommendation ITU-R RA.769-2 provides threshold levels of -204.5 dBW for interference detrimental to the RAS for the band 1400-1427 MHz. The obtained MCLs for the three types of PMSE transmitters vary from 111.8 dB to 122.8 dB, which translate to separation distances of 0.8 km to 3.5 km, respectively, between an active microphone and a radio astronomical antenna.
Table 25: Audio PMSE-RAS Compatibility results assuming flat terrain
Parameters IEM Handheld Body worn
Transmitter e.i.r.p 9 dBm 13 dBm 17 dBm
Body loss 0 dB 6 dBm 11 dBm
Total e.i.r.p 9 dBm 7 dBm 6 dBm
Transmitter bandwidth 0.2 MHz 0.2 MHz 0.2 MHz
Duty cycle 100% 100% 100%
Antenna height 2 m 1.5 m 1.5 m
Center frequency 1380 MHz 1380 MHz 1380 MHz
In-band sharing at 1330-1400 MHz
RAS protection level -220.2 dBW -220.2 dBW -220.2 dBW
e.i.r.p in RAS band -31 dBW -33 dBW -34 dBW
MCL 189.2 dB 187.2 dB 186.2 dB
Separation distance 55 km 51 km 50 km
Required reduction in spurious emissions 90.4 dB 87.6 dB 86.6 dB
Spurious emission limit -74.4 dBm/MHz -73.6 dBm/MHz -73.6 dBm/MHz
Unwanted emission into the RAS 1400-1427 MHz band
RAS protection level -204.5 dBW -204.5 dBW -204.5 dBW
e.i.r.p in RAS band -89.7 dBW -91.7 dBW -92.7 dBW
MCL 114.8 dB 112.8 dB 111.8 dB
Separation distance 1.3 km 1.0 km 0.8 km
Required reduction in spurious emissions 15.8 dB 13.0 dB 12.0 dB
Spurious emission limit -89.9 dBm/MHz -89.0 dBm/MHz -89.0 dBm/MHz
ECC REPORT 245 - Page 39
Figure 9 : Path loss attenuation graphs for the emissions from a PMSE wireless microphone (left) and in-band emission (right) depicting the required separation distances from a radio telescope
assuming a flat terrain profile with a horizontal RAS antenna pointing direction
5.5.1.3 Conclusion
5.5.1.4 Conclusions In-band sharing results for the 1330-1400 MHz band
The 1330-1400 MHz band is used for spectral line observations, with a typical bandwidth of 20 kHz. The protection level as derived from Recommendation ITU-R RA.769-2 [12] is -220.2 dBW for this bandwidth. The achieved separation distances are in order of 50 km, between an active microphone deployed outdoors and a radio astronomical antenna. No separation distance is needed if the deployment is limited to indoors.
The calculations are based on a standard 0 dBi RAS antenna gain, and are independent of the antenna pointing. The separation distances may be shorter depending upon factors such as terrain shielding.
5.5.1.5 Conclusions for the 1400-1427 MHz band
The 1400-1427 MHz band is used for continuum observations, with a typical bandwidth of 27 MHz. The protection level as derived from Recommendation ITU-R RA.769-2 is -204 dBW for this bandwidth. The achieved separation distances are in order of 1 km, between an active microphone deployed outdoors and a radio astronomical antenna. No separation distance is needed if the deployment is limited to indoors.
The calculations are based on a standard 0 dBi RAS antenna gain, and are independent of the antenna pointing. The separation distances may be shorter depending upon factors such as terrain shielding.

ECC REPORT 245 - Page 40
6 DISCUSSION AND CONCLUSION
This ECC Reports investigates the compatibility between wireless microphones and others systems in the frequency range 1350-1400 MHz and adjacent band compatibility with system at 1300-1350 MHz and 1400-1427 MHz.
This report considered only body worn and handheld wireless microphone and IEM, but excluding wireless microphones on stands.
Co-channel sharing between the Radiolocation Service/Fixed Service and wireless microphones at the same geographical location would be problematic because of the disruptive effect on the wireless microphone receivers from the radiolocation or the Fixed Service signals. Therefore, by implementing a scanning procedure in order to identify the parts of spectrum, which are in use by other transmitter(s) and the parts, which are available for successful audio PMSE operation, audio PMSE will avoid being interfered with by Radiolocation/Fixed Service systems and avoid interfering with the Radiolocation / Fixed Service systems.
Geographical sharing for co-channel operation based on exclusion zones around the radars is practical. Co-channel sharing between the fixed service - coordinated and wireless microphones is feasible with the separation distances given in the table.
In case of TRR, the risk of interference is quite low for the body worn and hand held equipment. The risk of interference is more significant in case of IEM deployed outdoors. Administrations may consider two mitigation techniques: Implementation of separation distances (1 km), if possible or Limit the deployment of IEM to indoors.
For UAS BS, the separation distances are of the order of 250 m, considering the mobile usage of this system, the need and practicability of the implementation of such a separation distance is questionable. For UAS UAV: outdoor PMSE, the separation distances are of the order of 3 km, indoor PMSE, no need for mitigation techniques.
The following table provides an overview of the proposed mitigation techniques.
Table 26: overview of the proposed mitigation techniques
Service Body worn / Hand held microphone IEM
Radiolocation
Outdoor: separation distance of 15 km Indoor: separation distance of 5 km
Outdoor: separation distance of 19 km Indoor: separation distance of 7 km
Fixed Service - coordinated
Main lobe: 20 km Side lobe Outdoor: separation distance of 2,5 km Indoor: separation distance of 1 km
Main lobe: 21 km Side lobe: Outdoor: separation distances of 7 km Indoor: separation distances of 2,5 km
TRR None Limit the deployment to indoor or separation distance of 1 km.
UAS BS 200 m outdoor - 50 m indoor 250 m outdoor - 100 m indoor

ECC REPORT 245 - Page 41
Service Body worn / Hand held microphone IEM
UAV 2 km outdoor - (no separation needed for indoor)
3 km outdoor - (no separation needed for indoor)
RAS
1350-1400 MHz: Indoor: no separation distance Outdoor: 51 km separation distance (see Note) 1400-1427 MHz: Indoor: no separation distance Outdoor: 1.0 km separation distance (see Note 1)
1350-1400 MHz: Indoor: no separation distance Outdoor: 55 km separation distance (see Note) 1400-1427 MHz: Indoor: no separation distance Outdoor: 1.3 km separation distance (see Note 1)
Note 1: The calculations are based on a standard 0 dBi RAS antenna gain, and are independent of the antenna pointing. The separation distances may be shorter depending upon factors such as terrain shielding.
Note 2: separation distances assumed wall losses of 15 dB for indoor use.
Recognising that some administrations operate their radiolocation service in the band 1350-1375 MHz and some others in the band 1375-1400 MHz, one may conclude that at least 25 MHz could be made available for the deployment of audio PMSE. In order to cover the different national cases, the tuning range for wireless microphones should identify the whole band 1350-1400 MHz. Depending on the national situation, administrations will decide which portion of the tuning range within the 50 MHz could be then made available for audio PMSE.
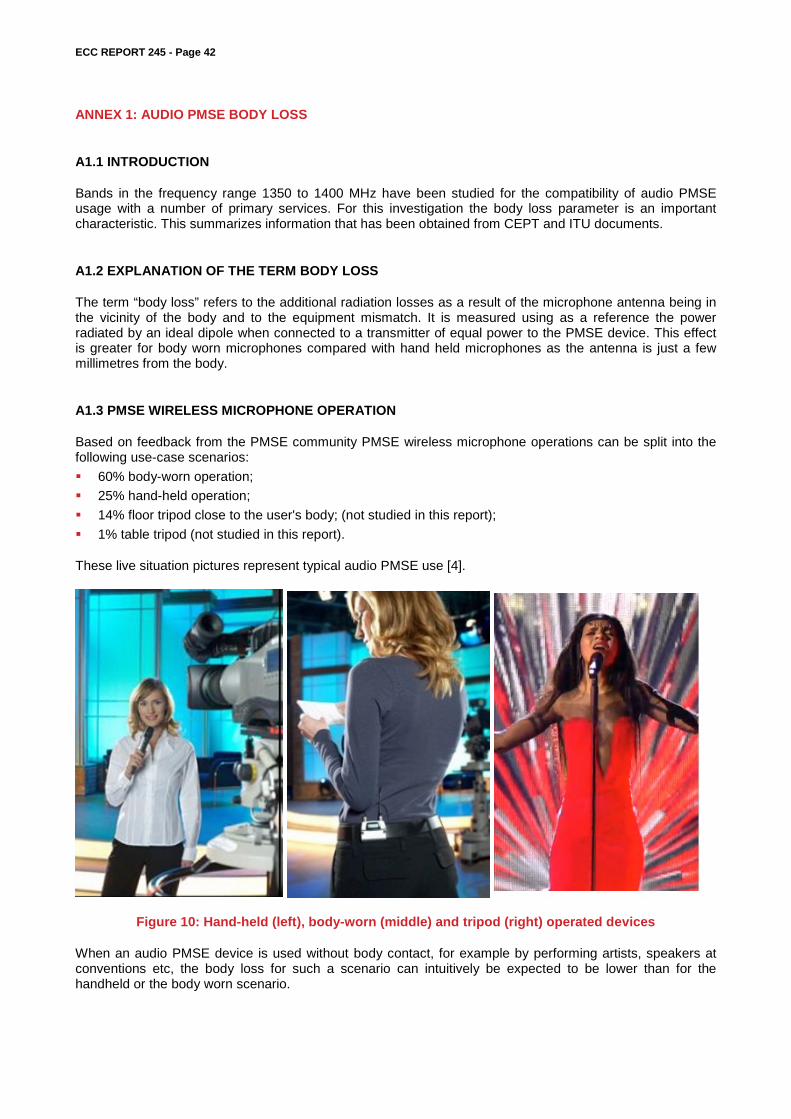
ECC REPORT 245 - Page 42
ANNEX 1: AUDIO PMSE BODY LOSS
A1.1 INTRODUCTION
Bands in the frequency range 1350 to 1400 MHz have been studied for the compatibility of audio PMSE usage with a number of primary services. For this investigation the body loss parameter is an important characteristic. This summarizes information that has been obtained from CEPT and ITU documents.
A1.2 EXPLANATION OF THE TERM BODY LOSS
The term “body loss” refers to the additional radiation losses as a result of the microphone antenna being in the vicinity of the body and to the equipment mismatch. It is measured using as a reference the power radiated by an ideal dipole when connected to a transmitter of equal power to the PMSE device. This effect is greater for body worn microphones compared with hand held microphones as the antenna is just a few millimetres from the body.
A1.3 PMSE WIRELESS MICROPHONE OPERATION
Based on feedback from the PMSE community PMSE wireless microphone operations can be split into the following use-case scenarios: 60% body-worn operation; 25% hand-held operation; 14% floor tripod close to the user's body; (not studied in this report); 1% table tripod (not studied in this report).
These live situation pictures represent typical audio PMSE use [4].
Figure 10: Hand-held (left), body-worn (middle) and tripod (right) operated devices
When an audio PMSE device is used without body contact, for example by performing artists, speakers at conventions etc, the body loss for such a scenario can intuitively be expected to be lower than for the handheld or the body worn scenario.

ECC REPORT 245 - Page 43
A1.4 SUMMARY OF EXISTING INFORMATION ON PMSE BODY LOSS
The ERC REPORT 42 [19] and its successor CEPT Report 30 [20] show body loss plots
Body loss for hand held devices: 8dB Body loss for body-worn devices: 18dB
Figure 11: Body loss
Note: ERC Report 42 refers to 650 MHz and CEPT Report 30 [20] to 800 MHz.
A1.4.1 Anechoic Chamber Measurements of Cobham Technical Services [22]
In 2009 Cobham presented the results of measurement undertaken for Ofcom UK in a West End Theatre to evaluate the loss on a transmitted signal from a belt-pack PMSE transmitter.
This picture refers to the results in ERC Report 42 identified by Cobham:
Figure 12: Polar plot of body loss as a function of angle measured inside an anechoic chamber
-30
-25
-20
-15
-10
-5
0
180º
dB
90º 270º
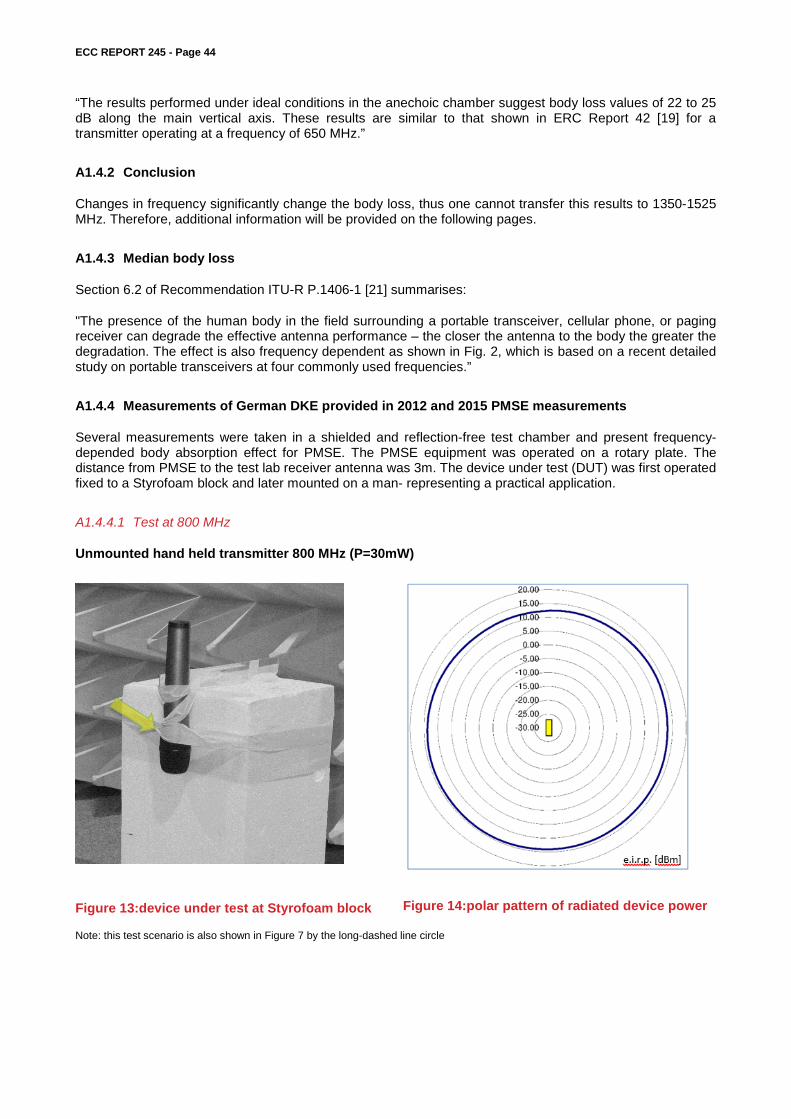
ECC REPORT 245 - Page 44
“The results performed under ideal conditions in the anechoic chamber suggest body loss values of 22 to 25 dB along the main vertical axis. These results are similar to that shown in ERC Report 42 [19] for a transmitter operating at a frequency of 650 MHz.”
A1.4.2 Conclusion
Changes in frequency significantly change the body loss, thus one cannot transfer this results to 1350-1525 MHz. Therefore, additional information will be provided on the following pages.
A1.4.3 Median body loss
Section 6.2 of Recommendation ITU-R P.1406-1 [21] summarises:
"The presence of the human body in the field surrounding a portable transceiver, cellular phone, or paging receiver can degrade the effective antenna performance – the closer the antenna to the body the greater the degradation. The effect is also frequency dependent as shown in Fig. 2, which is based on a recent detailed study on portable transceivers at four commonly used frequencies.”
A1.4.4 Measurements of German DKE provided in 2012 and 2015 PMSE measurements
Several measurements were taken in a shielded and reflection-free test chamber and present frequency-depended body absorption effect for PMSE. The PMSE equipment was operated on a rotary plate. The distance from PMSE to the test lab receiver antenna was 3m. The device under test (DUT) was first operated fixed to a Styrofoam block and later mounted on a man- representing a practical application.
A1.4.4.1 Test at 800 MHz
Unmounted hand held transmitter 800 MHz (P=30mW)
Figure 13:device under test at Styrofoam block Figure 14:polar pattern of radiated device power
Note: this test scenario is also shown in Figure 7 by the long-dashed line circle

ECC REPORT 245 - Page 45
Hand held transmitter 800 MHz (P=30mW)
Figure 15: Hand held device under test Figure 16: Polar pattern of radiated device power
Body-worn transmitter 800 MHz (P=30mW)
Figure 17: Device under test at human body Figure 18: Polar pattern of radiated device power

ECC REPORT 245 - Page 46
A1.4.4.2 Test at 1800 MHz
Unmounted hand held transmitter 1800 MHz (P=10mW)
Figure 19: Device under test at Styrofoam block Figure 20: Polar pattern of radiated power
Note: Each object in the immediate neighbourhood influences the radiation, which includes the Styrofoam block.
Hand held transmitter 1800 MHz (P=10mW)
Figure 21: Hand held device under test Figure 22: Polar pattern of radiated power
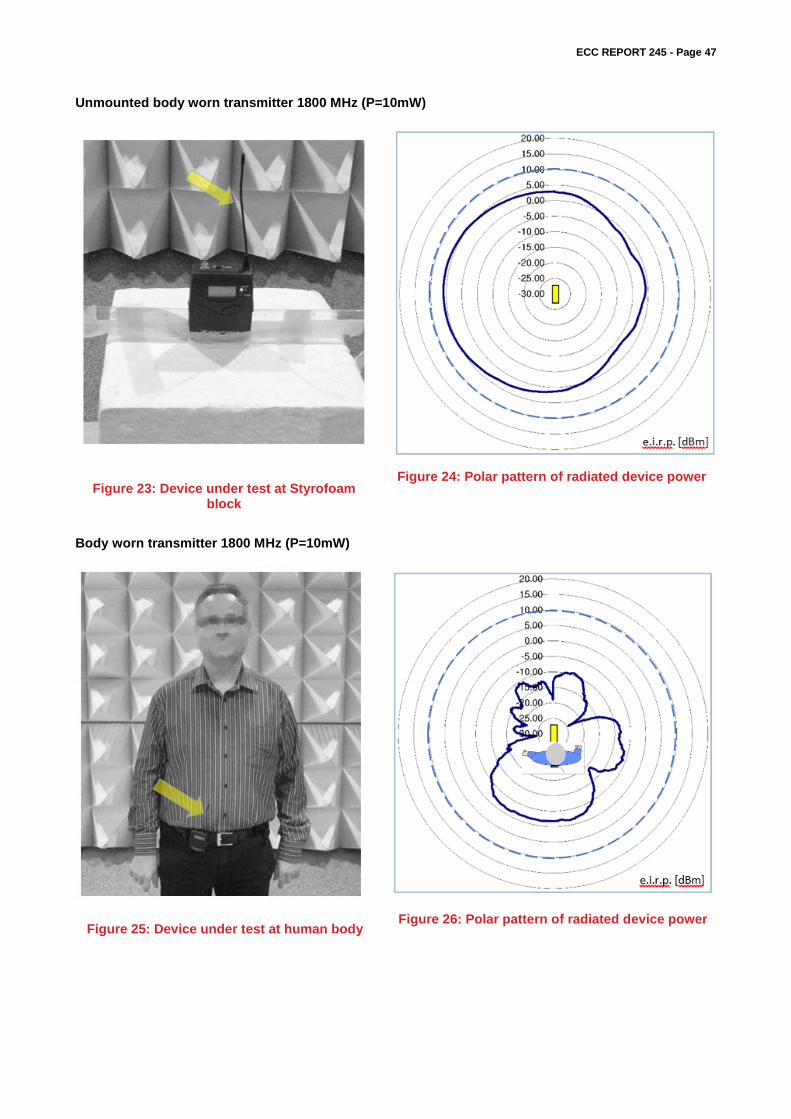
ECC REPORT 245 - Page 47
Unmounted body worn transmitter 1800 MHz (P=10mW)
Figure 23: Device under test at Styrofoam block
Figure 24: Polar pattern of radiated device power
Body worn transmitter 1800 MHz (P=10mW)
Figure 25: Device under test at human body Figure 26: Polar pattern of radiated device power

ECC REPORT 245 - Page 48
A1.4.4.3 Limitation of these Audio PMSE measurements
Each Audio PMSE unit has a different antenna characteristic. The short audio PMSE antenna does not represent the gain of a standard dipole. Therefore the DUT on a Styrofoam block has limited suitability as a reference. Although the hand-held and body-worn measurements show real-live scenarios if compared with a standard dipole antenna would lead to higher body absorption results.
Different Audio PMSE mounting positions on the human body will lead to different results. Best-case or worst-case assessments were not the subject of these tests.
The test was carried out with devices from just one manufacturer.
A1.4.4.4 Test output parameter for the minimum body loss effect of PMSE
The following graphics show the test lab measurement of the receiver input power provided by a fixed measurement antenna. This level is dependent on the rotary plate angle. The distance from PMSE transmitter to the test lab receiver antenna was 3 m. The device under test (DUT) was first operated fixed to a Styrofoam block and later mounted on a man in a practical application position.
PMSE operated at 800 MHz
Figure 27: Receiver level of hand-held DUT at Styrofoam block
Figure 28: Receiver level of a hand-held DUT
Note: between the two markers (M1 and M2) the rotary plate makes a 360 degree turn.
Figure 29: Receiver level of body-worn DUT at Styrofoam block
Figure 30: Receiver level of a body-worn DUT
Note: between the two markers (M1 and M2) the rotary plate makes a 360 degree turn.
Audio PMSE operated at 1800 MHz
Figure 31: Receiver level of hand-held DUT at Styrofoam block
Figure 32: Receiver level of hand-held DUT
Note: between the two markers (M1 and M2) the rotary plate makes a 360 degree turn.

ECC REPORT 245 - Page 49
Figure 33: Receiver level of body-worn DUT at Styrofoam block
Figure 34: Receiver level of body-worn DUT
Note: between the two markers (M1 and M2) the rotary plate makes a 360 degree turn.
A1.4.5 Median body loss effect of PMSE
A1.4.5.1 Result transfer to 1350-1525 MHz of minimum body loss effect of PMSE
Because Recommendation ITU-R P.1406 is referring to median values of body loss we present a similar information in the table and the graphic below. The median value for PMSE body loss was calculated from test lab receiver measurement:
Table 27: Median value for PMSE body loss
PMSE use form Median body loss effect
800 MHz 1800 MHz
Hand-held 9,7 12,3
Body-worn 15,7 21,6
A1.5 MEASUREMENT OF THE RADIATED POWER OF 1 455 MHZ BODY-WORN PMSE
A1.5.1 Purpose of measurement
Expanding on previous measurement at 800 and 1800 MHz body loss by DKE in 201210.
Additional information on frequency dependant effect of body absorption.
10 http://www.apwpt.org/downloads/dke_pmse_822mhz_1800mhz.pdf

ECC REPORT 245 - Page 50
A1.5.2 Measurement setup
The lab test was carried out in the EMC test chamber of Sennheiser Electronic at Wedemark (D):
Figure 35: Test setup
A1.5.3 Reference Dipole measurement
A typical wide-band dipole (SBA 9119, see Figure 36) was mounted in the non-anechoic test chamber, placed on a wooden rotating test platform. Radiated RF power was measured at different antenna heights of 1.1 m and 1.5 m and show a significant effect of mounting position.
Figure 36 : Radiated power of typical wide band dipole

ECC REPORT 245 - Page 51
A1.5.4 Body-worn transmitter in free space
Body-word PMSE are optimized for maximum radiated power when close to the human body. Without the body effect and due to the incorrectly matched antenna the 10 mW test transmitter radiates a significantly lower RF field:
Figure 37: Test transmitter without body effect
The well-known vertical antenna characteristic is almost round. The real scenario differs from it, also in this test. This can be seen above in the graph of RF attenuation distribution and compares with the reference dipole measurement. The diagram unbalance mainly arise from the test transceiver design and the laboratory fastening.
Figure 38: Parameter distribution of test transmitter without body effect

ECC REPORT 245 - Page 52
A1.5.5 Body-worn transmitter
The test transmitter was mounted on a male and female test subject in two positions: on the front and then on the back.
A1.5.5.1 Test transceiver mounted in body position on male test subject
PMSE can be fixed on different position on the human body. In this scenario a typical body position was choose. Section A1.5.7 discusses the body effect in a symmetrical mounting position.
Figure 39: Test transmitter in body position on male test subject
The body absorption has a significant effect on the antenna polar diagram. This is also clearly shown in the graph of body loss parameter distribution.
Figure 40: Body loss parameter distribution (male body)

ECC REPORT 245 - Page 53
Summary of variance of measured body attenuation
Min= 11 dB / Max= 58 dB / Delta= 47 dB / Median= 24 dB / Mean= 27 dB
Note: All results were rounded on integer numbers.
A1.5.5.2 Test transceiver mounted on body position of female test subject
PMSE can be fixed on different position at human body. In this scenario typical body position was choose. Section A1.5.6 discusses the body effect/absorption in a symmetrical mounting position.
Figure 41: Test transmitter in body position on female test subject
The body absorption has a significant effect on the antenna polar diagram. This is also clearly shown in the graph of body absorption parameter distribution:
Figure 42: Body loss parameter distribution (female body)
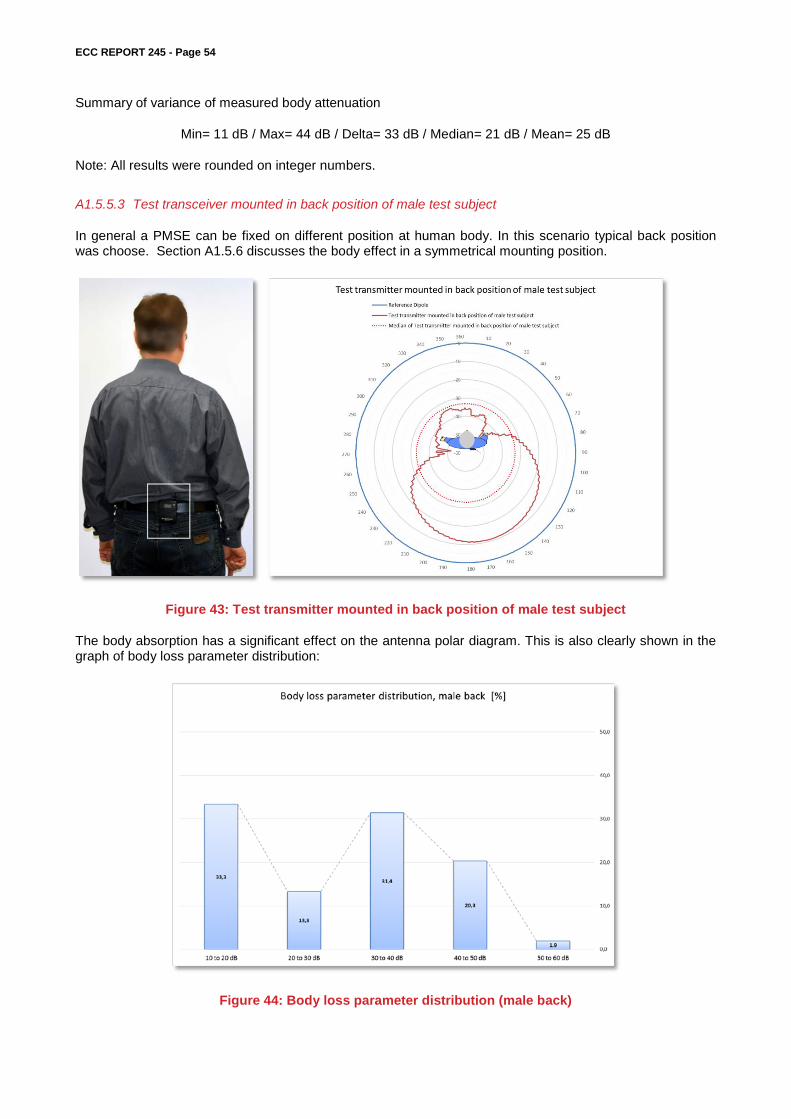
ECC REPORT 245 - Page 54
Summary of variance of measured body attenuation
Min= 11 dB / Max= 44 dB / Delta= 33 dB / Median= 21 dB / Mean= 25 dB
Note: All results were rounded on integer numbers.
A1.5.5.3 Test transceiver mounted in back position of male test subject
In general a PMSE can be fixed on different position at human body. In this scenario typical back position was choose. Section A1.5.6 discusses the body effect in a symmetrical mounting position.
Figure 43: Test transmitter mounted in back position of male test subject
The body absorption has a significant effect on the antenna polar diagram. This is also clearly shown in the graph of body loss parameter distribution:
Figure 44: Body loss parameter distribution (male back)
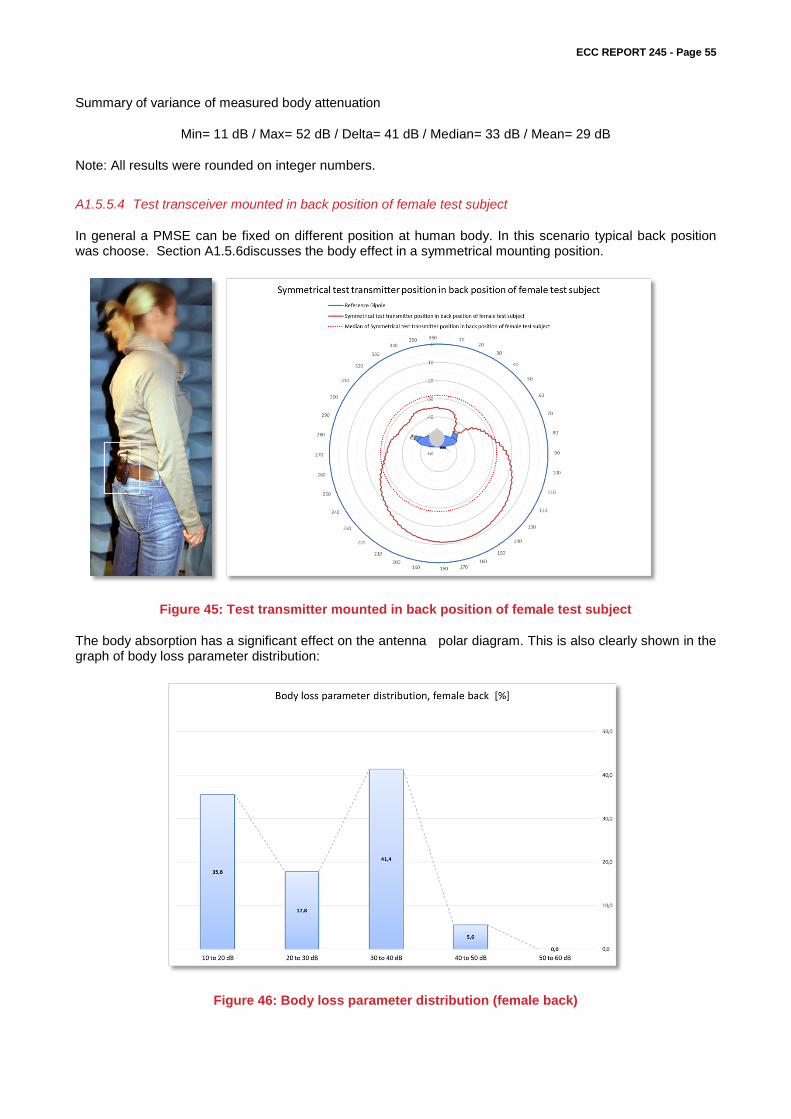
ECC REPORT 245 - Page 55
Summary of variance of measured body attenuation
Min= 11 dB / Max= 52 dB / Delta= 41 dB / Median= 33 dB / Mean= 29 dB
Note: All results were rounded on integer numbers.
A1.5.5.4 Test transceiver mounted in back position of female test subject
In general a PMSE can be fixed on different position at human body. In this scenario typical back position was choose. Section A1.5.6discusses the body effect in a symmetrical mounting position.
Figure 45: Test transmitter mounted in back position of female test subject
The body absorption has a significant effect on the antenna polar diagram. This is also clearly shown in the graph of body loss parameter distribution:
Figure 46: Body loss parameter distribution (female back)

ECC REPORT 245 - Page 56
Summary of variance of measured body attenuation
Min= 11 dB / Max= 47 dB / Delta= 36 dB / Median= 28 dB / Mean= 26 dB
Note: All results were rounded on integer numbers.
A1.5.5.5 Summary table of all measured body absorption values
In practice the measured body loss absorption is used for different purposes:
Maximum values are used for compatibility assessments.
Median and maximum body absorption values are used to estimate the safe frequency and physical separation for the required production quality.
Note: the median and mean values are used in a number of study groups, e.g. for CEPT SEAMCAT calculations.
Table 28: summary of measured data
Test case Section Min (dB) Max (dB) Delta (dB) Median (dB) Mean (dB)
Male test subject - body 5.1 11 58 47 24 27
Female test subject - body 5.2 11 44 33 21 25
Male test subject - back 5.3 11 52 41 33 29
Female test subject - back 5.4 11 47 36 28 26
Amplitude of variation -- about 11 44 to 58 33 to 47 21 to 33 25 to 29
Note: all results were rounded on integer numbers.
A1.5.6 Discussion of asymmetries in the radiated power
In section A1.5.4 and A1.5.5, we noted unsymmetrical radiation characteristics. For clarification additional tests were carried out with a test transceiver position in the centre on human body.
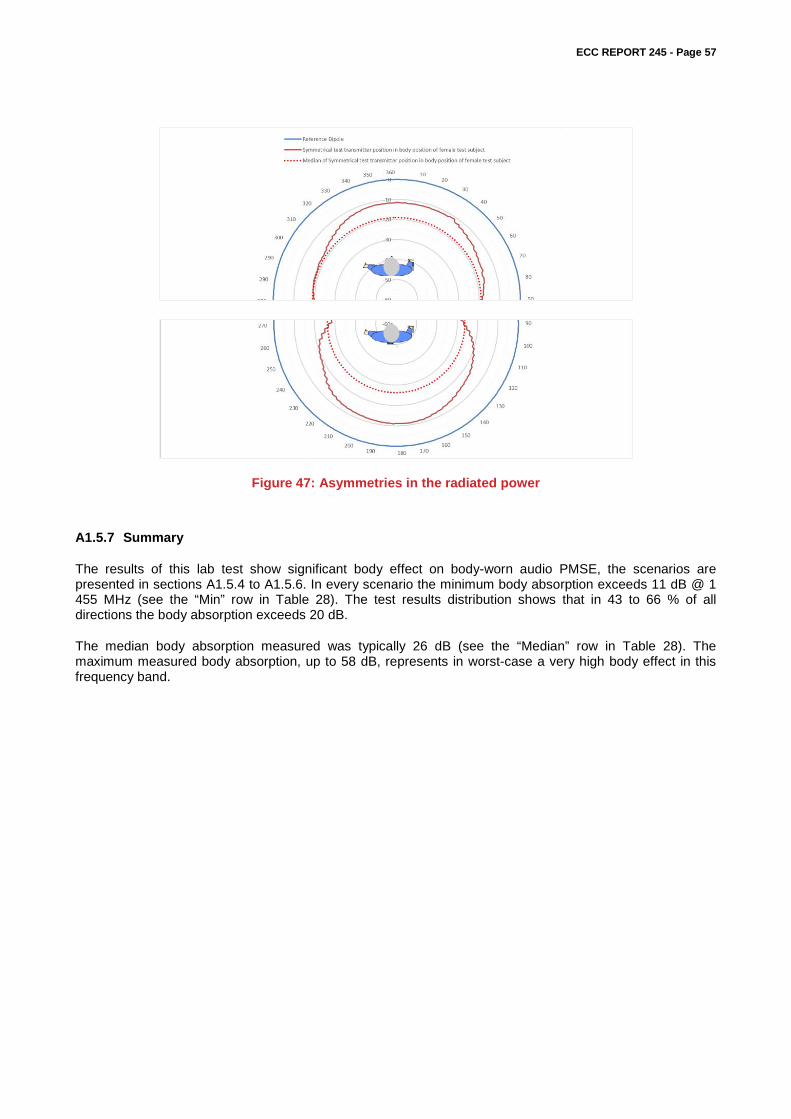
ECC REPORT 245 - Page 57
Figure 47: Asymmetries in the radiated power
A1.5.7 Summary
The results of this lab test show significant body effect on body-worn audio PMSE, the scenarios are presented in sections A1.5.4 to A1.5.6. In every scenario the minimum body absorption exceeds 11 dB @ 1 455 MHz (see the “Min” row in Table 28). The test results distribution shows that in 43 to 66 % of all directions the body absorption exceeds 20 dB.
The median body absorption measured was typically 26 dB (see the “Median” row in Table 28). The maximum measured body absorption, up to 58 dB, represents in worst-case a very high body effect in this frequency band.

ECC REPORT 245 - Page 58
A1.5.7.1 Hand-held audio PMSE
Figure 48: Minimum and median body loss effect of hand-held PMSE
A1.5.7.2 Body-worn audio PMSE
Figure 49: Minimum and median body loss effect of body-worn PMSE
A1.6 CONCLUSION
It is suggested the following body loss values for simulations in the band from 1350 to 1525 MHz: Hand-held microphones: Minimum: 6 dB and Median: 11 dB Body-worn microphones: Minimum: 11 dB and Median: 21 dB
7,0
0,0
5,0
10,0
15,0
800 850 900 950 1000 1050 1100 1150 1200 1250 1300 1350 1400 1450 1500 1550 1600 1650 1700 1750 1800
Minimum and Median body loss effect of hand-held PMSE
APWPT SE7(15)042hand-held Minimum
bouyguestelecomhand-held Minimum
APWPT SE7(15)042hand-held Median
bouyguestelecomhand-held Median
MHzMHz
dB
MHz
dB
dB
5,0
10,0
15,0
20,0
25,0
30,0
800 850 900 950 1000 1050 1100 1150 1200 1250 1300 1350 1400 1450 1500 1550 1600 1650 1700 1750 1800
Minimum and Median body loss effect of body-worn PMSE
APWPT SE7(15)042body-worn Minimum
bouyguestelecombody-worn Minimum
New DKEbody-worn Minimum
New DKEbody-worn Median
APWPT SE7(15)042body-worn Median
P.1406body loss Median
MHz
dB
MHz
dB
MHz
dB
dB
dB

ECC REPORT 245 - Page 59
ANNEX 2: WALL LOSS ATTENUATION
The following information is available at http://www.cmi.aau.dk/Projects/Projects_detailed/ and considered building loss from new and old building material.
A2.1 RF INSERTION LOSS IN NEW AND OLD BUILDING MATERIALS
New building materials such as walls and windows are improved with respect to thermal energy loss. Modern windows are coated with a thin metallic layer to improve indoor comfort in the summer and to prevent indoor thermal loss in the winter. This has a disadvantage with respect to insertion loss of incoming radio waves in the frequency area of 1 to 5 GHz.
To get some figures quantifying the problem a measurement program was initiated at CMI (Center for Communication, Media and Information Technology, Aalborg University) covering RF (radio frequency) measurements on new and old building materials. The purpose was to investigate the increasing problem of mobile telephone and internet communication in new buildings and to come up with some solutions to the problem.
The measurement setup is shown in Figure 50, using 2 horn antennas shown in Figure 51. Measuring S-parameters give accurate results for insertion loss and reflection coefficients. See Figure 52.
Figure 50: Measurement setup of indoor RF insertion loss
Figure 51: Horn antennas ensure a focused measurement beam reducing sorrounding reflections
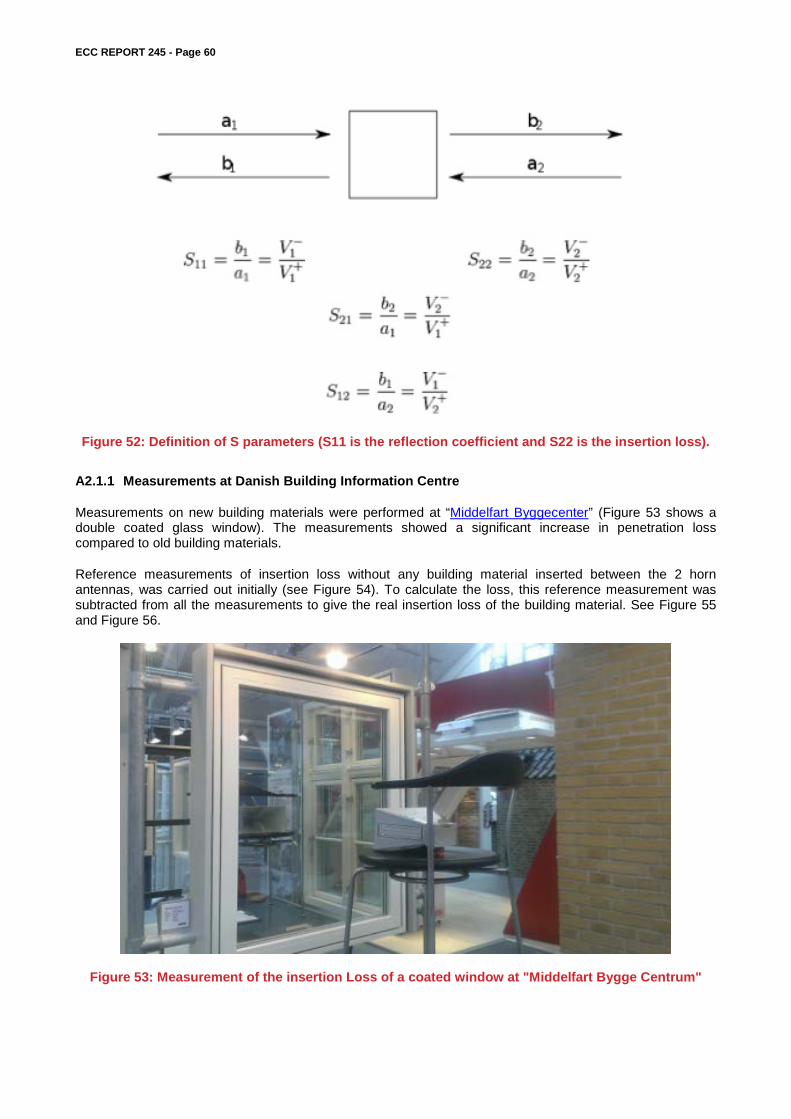
ECC REPORT 245 - Page 60
Figure 52: Definition of S parameters (S11 is the reflection coefficient and S22 is the insertion loss).
A2.1.1 Measurements at Danish Building Information Centre
Measurements on new building materials were performed at “Middelfart Byggecenter” (Figure 53 shows a double coated glass window). The measurements showed a significant increase in penetration loss compared to old building materials.
Reference measurements of insertion loss without any building material inserted between the 2 horn antennas, was carried out initially (see Figure 54). To calculate the loss, this reference measurement was subtracted from all the measurements to give the real insertion loss of the building material. See Figure 55 and Figure 56.
Figure 53: Measurement of the insertion Loss of a coated window at "Middelfart Bygge Centrum"

ECC REPORT 245 - Page 61
Figure 54: Measurement of the "reference Loss" without any material between the antennas
It can be seen on the Figure 56 (subtracting Figure 55) that a new double coated window has an insertion loss from 26 dB to - 35 dB in the frequency interval 1 GHz to 5 GHz. This should be compared to old uncoated windows which have an insertion loss of < 3 dB to 10 dB. Below is shown the insertion losses new and old building materials:
Figure 55: reference loss (air - no glass)
Range: 0.03 MHz to 6 GHz. Each grid section equals to: horizontally 600 MHz, vertically 20 dB
Figure 56: Insertion Loss of a double coated window
Range: 0.03 MHz to 6 GHz. Each grid section equals to: horizontally 600 MHz, vertically 20 dB
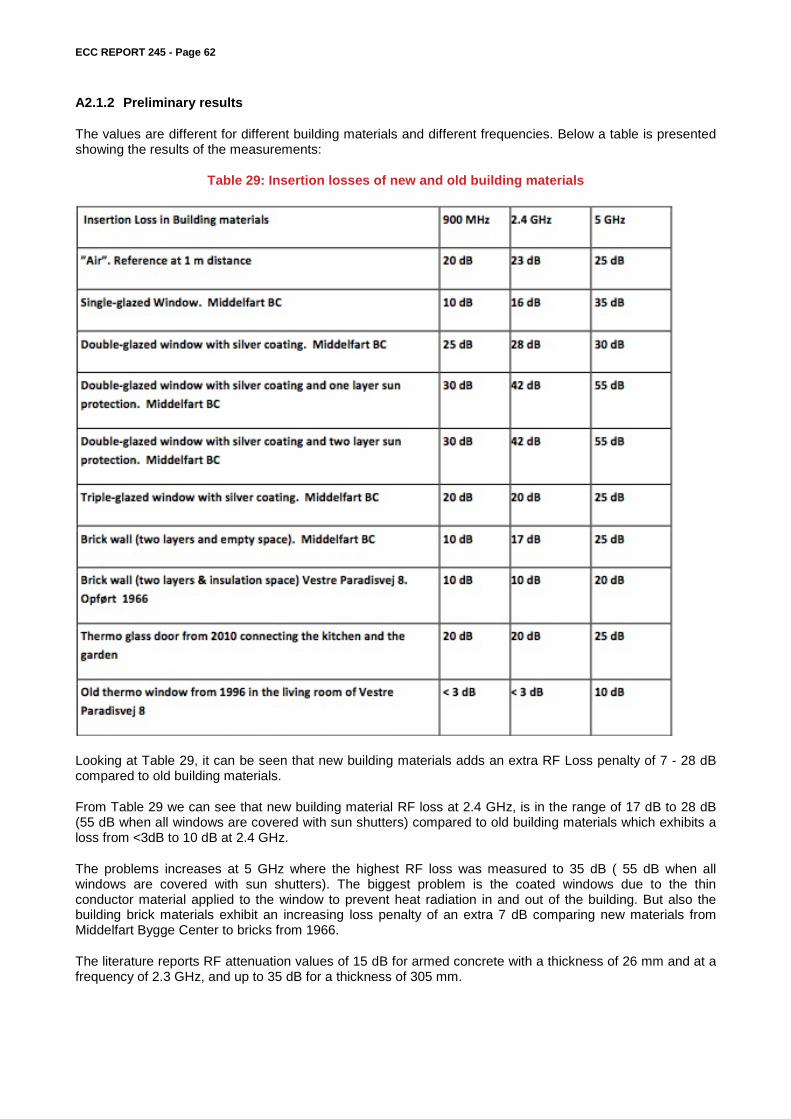
ECC REPORT 245 - Page 62
A2.1.2 Preliminary results
The values are different for different building materials and different frequencies. Below a table is presented showing the results of the measurements:
Table 29: Insertion losses of new and old building materials
Looking at Table 29, it can be seen that new building materials adds an extra RF Loss penalty of 7 - 28 dB compared to old building materials.
From Table 29 we can see that new building material RF loss at 2.4 GHz, is in the range of 17 dB to 28 dB (55 dB when all windows are covered with sun shutters) compared to old building materials which exhibits a loss from <3dB to 10 dB at 2.4 GHz.
The problems increases at 5 GHz where the highest RF loss was measured to 35 dB ( 55 dB when all windows are covered with sun shutters). The biggest problem is the coated windows due to the thin conductor material applied to the window to prevent heat radiation in and out of the building. But also the building brick materials exhibit an increasing loss penalty of an extra 7 dB comparing new materials from Middelfart Bygge Center to bricks from 1966.
The literature reports RF attenuation values of 15 dB for armed concrete with a thickness of 26 mm and at a frequency of 2.3 GHz, and up to 35 dB for a thickness of 305 mm.

ECC REPORT 245 - Page 63
A final remark should be that buildings are not build of pure bricks or pure coated glass (even though new architects are very satisfied with glass), and therefore the RF attenuation in a building as a whole, would be something in between the range of 7 - 28 dB attenuation, depending on the number, material and thickness of internal walls and doors.
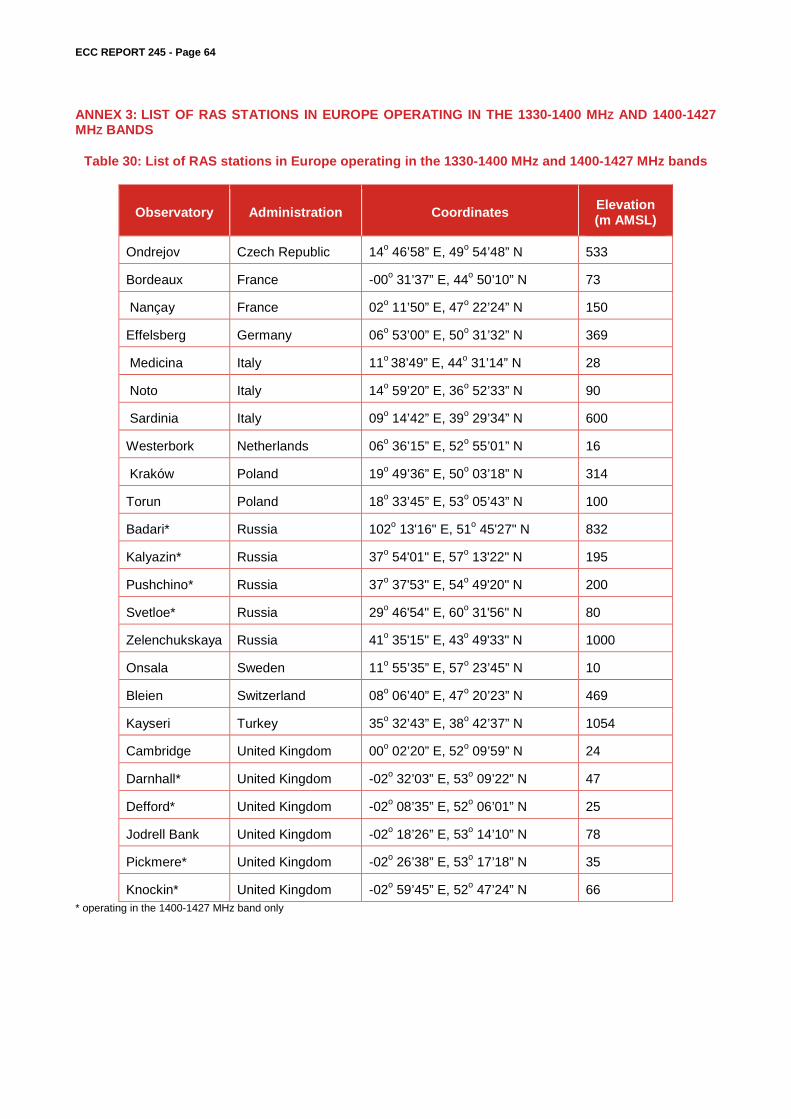
ECC REPORT 245 - Page 64
ANNEX 3: LIST OF RAS STATIONS IN EUROPE OPERATING IN THE 1330-1400 MHZ AND 1400-1427 MHZ BANDS
Table 30: List of RAS stations in Europe operating in the 1330-1400 MHz and 1400-1427 MHz bands
Observatory Administration Coordinates Elevation (m AMSL)
Ondrejov Czech Republic 14o 46’58” E, 49o 54’48” N 533
Bordeaux France -00o 31’37” E, 44o 50’10” N 73
Nançay France 02o 11’50” E, 47o 22’24” N 150
Effelsberg Germany 06o 53’00” E, 50o 31’32” N 369
Medicina Italy 11o 38’49” E, 44o 31’14” N 28
Noto Italy 14o 59’20” E, 36o 52’33” N 90
Sardinia Italy 09o 14’42” E, 39o 29’34” N 600
Westerbork Netherlands 06o 36’15” E, 52o 55’01” N 16
Kraków Poland 19o 49’36” E, 50o 03’18” N 314
Torun Poland 18o 33’45” E, 53o 05’43” N 100
Badari* Russia 102o 13'16" E, 51o 45'27" N 832
Kalyazin* Russia 37o 54'01" E, 57o 13'22" N 195
Pushchino* Russia 37o 37'53" E, 54o 49'20" N 200
Svetloe* Russia 29o 46'54" E, 60o 31'56" N 80
Zelenchukskaya Russia 41o 35'15" E, 43o 49'33" N 1000
Onsala Sweden 11o 55’35” E, 57o 23’45” N 10
Bleien Switzerland 08o 06’40” E, 47o 20’23” N 469
Kayseri Turkey 35o 32’43” E, 38o 42’37” N 1054
Cambridge United Kingdom 00o 02’20” E, 52o 09’59” N 24
Darnhall* United Kingdom -02o 32’03” E, 53o 09’22” N 47
Defford* United Kingdom -02o 08’35” E, 52o 06’01” N 25
Jodrell Bank United Kingdom -02o 18’26” E, 53o 14’10” N 78
Pickmere* United Kingdom -02o 26’38” E, 53o 17’18” N 35
Knockin* United Kingdom -02o 59’45” E, 52o 47’24” N 66 * operating in the 1400-1427 MHz band only
ECC REPORT 245 - Page 65
ANNEX 4: LIST OF REFERENCE [1] ERC Report 25: The European table of frequency allocations and applications in the frequency range
8.3 kHz to 3000 GHz [2] ECC Report 191: Adjacent band compatibility between MFCN and PMSE audio applications in the 1785-
1805 MHz frequency range [3] ERC Recommendation 70-03: Relating to the use of Short Range Devices (SRD). [4] ETSI TR 102 546: Electromagnetic compatibility and Radio spectrum Matters (ERM); Technical
characteristics for Professional Wireless Microphone Systems (PWMS); System Reference Document. [5] ECC Report 172: Broadband Wireless Systems Usage in 2300-2400 MHz [6] ETSI EN 302 217-1: Fixed Radio Systems; Characteristics and requirements for point-to-point
equipment and antennas. Part 1: Overview and system-independent common characteristics [7] ETSI EN 300 422-1: Electromagnetic compatibility and Radio spectrum Matters (ERM); Wireless
microphones in the 25 MHz to 3 GHz frequency range; Part 1: Technical characteristics and methods of measurement
[8] ECC Report 121: Compatibility studies between Professional Wireless Microphone Systems (PWMS) and other services/systems in the bands 1452-1492 MHz, 1492-1530 MHz,1533-1559 MHz also considering the services/systems in the adjacent bands (below 1452 MHz and above 1559 MHz)
[9] Recommendation ITU-R M.1463: Characteristics of and protection criteria for radars operating in the radio determination service in the frequency band 1 215-1 400 MHz
[10] Recommendation ITU-R P.1546: Method for point-to-area predictions for terrestrial services in the frequency range 30 MHz to 3 000 MHz
[11] Recommendation ITU-R P.452: Prediction procedure for the evaluation of microwave interference between stations on the surface of the Earth at frequencies above about 0.7 GHz
[12] ITU-R Recommendation RA.769-2: Protection criteria used for radio astronomical measurements. [13] ECC Decision (11)01: ECC Decision of 11 March 2011 on the protection of the Earth exploration
satellite service (passive) in the 1400-1427 MHz band [14] Report ITU-R M.2292: Characteristics of terrestrial IMT-Advanced systems for frequency
sharing/interference analyses [15] ERC Recommendation T/R 13-01: Channel arrangements for fixed services in the range 1-2.3 GHz [16] Recommendation ITU-R F.1245: Mathematical model of average and related radiation patterns for line-
of-sight point-to-point fixed wireless system antennas for use in certain coordination studies and interference assessment in the frequency range from 1 GHz to about 70 GHz
[17] Recommendation ITU-R M.1800: Protection of the fixed, mobile and radiolocation services from MSS feeder links that may operate in the bands 1 390-1 392 MHz (Earth-to-space) and 1 430-1 432 MHz (space-to-Earth)
[18] ECC Report 202: Out-of-Band emission limits for MFCN SDL in 1452 to 1492 MHz [19] ERC Report 42: Handbook on radio equipment and systems radio microphones and simple wide band
audio links [20] CEPT Report 30: The identification of common and minimal (least restrictive) technical conditions for
790 - 862 MHz for the digital dividend in the European Union [21] Recommendation ITU-R P.1406-1: Propagation effects relating to terrestrial land mobile and
broadcasting services in the VHF and UHF bands [22] Cobham Technical Services, Report 2009-0333, “Analysis of PMSE Wireless Microphone Body Loss
Effects"