Embed Size (px)
DESCRIPTION
East Los Angeles Community College. Content. Introduction Enrollment Trends Demographic Characteristics Transfers Financial Aid Math Sequence. Introduction. Located in the suburban community of Monterey Park, California, 10 miles east of downtown Los Angeles Website : www.elac.edu. - PowerPoint PPT Presentation
Citation preview
2
Introduction Enrollment Trends Demographic Characteristics Transfers Financial Aid Math Sequence
Content

3
Introduction
Located in the suburban community of Monterey Park, California, 10 miles east of downtown Los Angeles
Website: www.elac.edu

4
Enrollment Trends
Overall, increasing trends since 1985
1929
1945
1947
1949
1960
1967
1969
1975
1980
1985
1990
1995
1999
2000
2001
2002
2003
2004
2005
2006
2007
2008
2009
0
5,000
10,000
15,000
20,000
25,000
30,000
0 413
1,252
8,193
13,01416,671 14,707
17,16919,373
21,59620,813
22,885
27,181
# Enrolled: Fall 1929 - 2009

5
Enrollment Trends
All ages show increase except 35 and above
2000 2001 2002 2003 2004 2005 2006 2007 2008 2009 20100
1,000
2,000
3,000
4,000
5,000
6,000
7,000
8,000
9,000
10,000
1,370993 1,106
825 776 889642
1,106
1,964 2,115
3,3182,960
3,533
3,802 3,8764,094
4,368 4,7455,133
5,807
7,483
6,227
7,0027,443 7,380 7,138
7,449 7,943
8,561
9,437
5,871
5,263
5,822 5,7355,379
5,139 5,0625,368 5,537
6,030
3,909 3,930 4,166
3,792 3,563 3,553 3,588 3,723 3,697 3,792
# Enrolled by Age: Fall 2000 - 2010
Concurrent High School Under 20 20-24 25-34 35 and above

Between 2000 and 2009, the majority of LACC students were U.S. high school graduates. 6
Demographics Characteristics
2000 2001 2002 2003 2004 2005 2006 2007 2008 20090
5,000
10,000
15,000
20,000
25,000
30,000
17,40015,513 16,767 16,554 16,256 16,159 16,404 17,782
19,79722,236
3,354
2,8613,339 3,313 3,009 2,858 2,738
2,880
2,692
2,541
429
367381 345 269 238 298
430
604
685
617
536963 1,133 1,182 1,300 1,393
1,509
1,556
1,542
Other Student Visa Refugee Temp. Resident Permanent Resident US Citizen
% Enrolled by Citizenship: Fall 2000 - 2009

Hispanic – majority population Very low White, Black, and Other 7
Demographics Characteristics
2000 2001 2002 2003 2004 2005 2006 2007 2008 20090
5,000
10,000
15,000
20,000
25,000
30,000
3,535 3,391 3,978 4,200 3,926 3,957 3,997 4,585 4,767 5,061493 497 462 468 488 496 496 479 492 617
17,23714,881
16,498 16,270 15,966 15,755 15,98917,178
18,96420,710
530
463
527 515457 453 467
473
494
630
157
141
164 143 137 152 160170
174
164
Other White Hispanic Black Asian
% Enrolled by Ethnicity: Fall 2000 - 2010

Stable, 60 to 40 ratio 8
Demographics Characteristics
2000 2001 2002 2003 2004 2005 2006 2007 2008 20090%
10%
20%
30%
40%
50%
60%
70%
80%
90%
100%
13,534 12,170 13,635 13,576 13,335 13,116 13,218 14,239 15,222 16,340
8,417 7,203 7,994 8,020 7,638 7,697 7,891 8,646 9,670 10,841
% Enrolled by Gender: Fall 2000 - 2009
Males Females
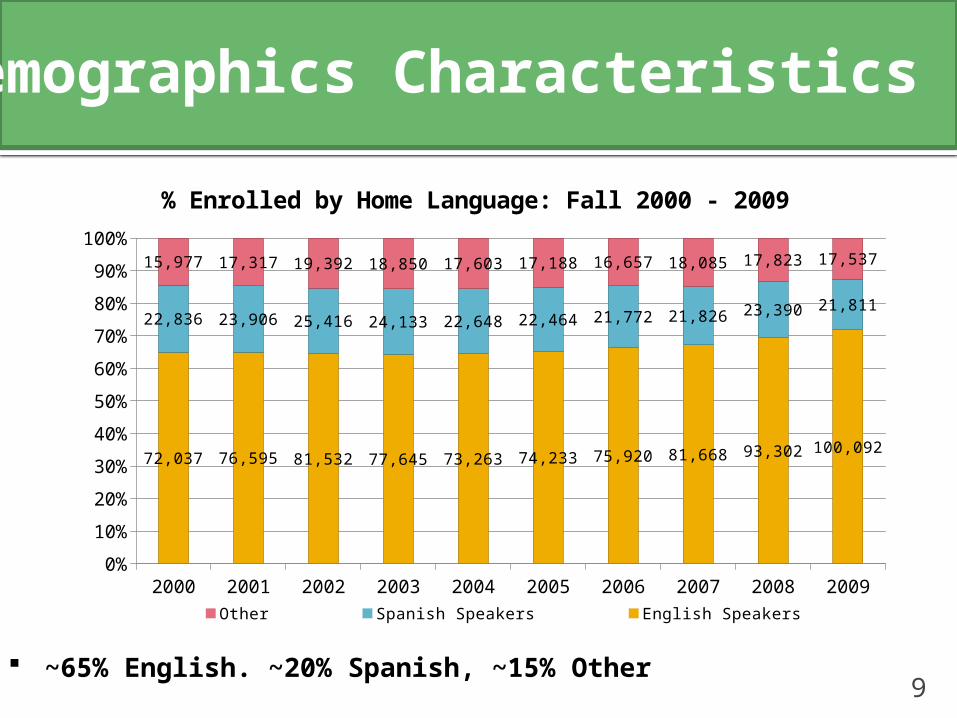
~65% English. ~20% Spanish, ~15% Other9
Demographics Characteristics
2000 2001 2002 2003 2004 2005 2006 2007 2008 20090%
10%
20%
30%
40%
50%
60%
70%
80%
90%
100%
72,037 76,595 81,532 77,645 73,263 74,233 75,920 81,668 93,302 100,092
22,836 23,906 25,416 24,133 22,648 22,464 21,772 21,826 23,390 21,811
15,977 17,317 19,392 18,850 17,603 17,188 16,657 18,085 17,823 17,537
Other Spanish Speakers English Speakers
% Enrolled by Home Language: Fall 2000 - 2009

High proportion of high school graduates 10
Demographics Characteristics
2000 2001 2002 2003 2004 2005 2006 2007 2008 20090
1,000
2,000
3,000
4,000
5,000
6,000
7,000
8,000
9,000
10,000
7,316
8,0128,480 8,009
7,887
8,0157,853
8,204
8,866
9,291
1,816 1,6441,770 1,814 1,528 1,520 1,543 1,724 1,822
1,790
794 855 904 888 798 901 924 960 1,0191,050
# Enrolled by Educational Attainment: Fall 2000 - 2009
U.S. High School Graduate
Foreign High School Graduate
High School Equiva-lency, Proficiency Cer-tificate, etc.
Concurrent High School Student
Not High School Graduate
AA Degree
BA Degree or Higher

11
Transfers
2000-01 2001-02 2002-03 2003-04 2004-05 2005-06 2006-07 2007-08 2008-090
100
200
300
400
500
600
700
800
900
1,000
661744 717 698
756 744 756 780 771
111
158138 153
137 151 149143 141
# of Transfers to UC and CSU: Fall 2000 - 2009
University of California California State University
The majority of students transfer to a CSU.

12
Transfers
Majority Hispanic transfers
2000-01 2001-02 2002-03 2003-04 2004-05 2005-06 2006-07 2007-08 2008-090
100
200
300
400
500
600
700
800
900
78 74116 121
167 192 178 167 1866 812 8
99 4 4
7
490564 492 468
486505
473 492 454
11
148
7
1010
15 12 2074
8388
93
8375
86 104 103
# of Transfer Students to CSU by Ethnicity: Fall 2000 - 2009
Unknown White Native American Hispanic Black Asian

13Within 6 years, 32% of students transfer who aimed to transfer
Transfers
1 2 3 4 5 60%
5%
10%
15%
20%
25%
30%
35%
1%
3%
8%
15%
21%
26%
1%
6%
13%
20%
27%
32%
Transfer Velocity Cohort Report (6 years)
1995-1996 2003-2004

~75% of students receive financial aid 14
Financial Aid
0
1,000
2,000
3,000
4,000
5,000
6,000
7,000
6,171
4600
1,334
3,214
52
Total Unduplicated Full-Time Students Receiving Fincancial Aid BOGW Only BOGW + Pell
BOGW + Other
# of Full-Time Resident Students Receiving Financial Aid 2007-2008 Academic Year
Receiving Financial Aid

Math Sequence
15