Embed Size (px)
Citation preview

KWONG-LEUNG TANG
EAST ASIAN NEWLY INDUSTRIALIZING COUNTRIES:ECONOMIC GROWTH AND QUALITY OF LIFE
ABSTRACT. The world is much impressed by the rapid economic developmentof four Asian Tigers – Hong Kong, Singapore, South Korea and Taiwan. However,it has often been taken for granted by many people that their social developmentis equally satisfactory. In order to investigate whether this belief is true or not,this paper looks at the levels of social development these countries have attained.Various measures of their quality of life will be assessed. Specifically, poverty,income distribution and environmental degradation are discussed. Despite theireconomic success, this study has found that most tigers are plagued by problemsof poverty, increasing income disparities and environmental degradation. Further,social expenditures of these countries have been too limited to eliminate or impacton these problems.
KEY WORDS: East Asia, Newly Industralizing Countries (NICs), social policy,economic development, quality of life measures, poverty, income inequality, andenvironmental degradation.
INTRODUCTION
In development studies, the economic success of the East AsianNewly Industrializing Countries (NICs) has occupied centre stage(Deyo, 1987; Haggard, 1990). Their rapid economic performancehas certainly impressed the rest of the world. Since the early 1970s,the average rate of growth of real per capita income has exceeded 6percent in each of the four East Asian NICs (Hong Kong, Taiwan,South Korea, and Singapore) (Krueger, 1995). Economic growthaccelerated rapidly in these “Asian Tigers” from 6.3 percent in 1990to 7.4 percent in 1994. Parallel to such phenomenal growth has beena big leap in per capita gross domestic product over a 30-year period.Hong Kong’s per capita GDP increased from US$2 422 in 1965 toUS$12 060 in 1994 while that for Singapore went up from US$1 685to US$13 043. The other two tigers experienced very similar successin the same period: Taiwan (US$267 to US$11 629) and South Korea
Social Indicators Research 43: 69–96, 1998.c 1998 Kluwer Academic Publishers. Printed in the Netherlands.

70 KWONG-LEUNG TANG
(US$623 to US$5 197). To many other developing societies, theirgrowth model is a blueprint for success.
The general perception that economic growth alone does not ade-quately indicate the actual development of a society is accepted bymany people and academics (Sarker and Gaur, 1994). Instead, a setof social and economic indices could better reflect the real “devel-opment” of society. However, compared with the attention devotedto questions of economic growth, the social aspect of developmentin these countries is often under-emphasized. Hence, assessing theimpact of social policy on quality of life in these countries has beenlimited. In the industrial countries, the situation is very differentbecause a good number of studies have been done to examine theimpact of the welfare state on social development (Korpi, 1985;Pfaller et al., 1991). As noted, examining and comparing the impactof social programs on social inequalities in the Asian NICs is limited(Clark and Chan, 1995). This is not desirable, since issues of qual-ity of life, poverty, and income distribution are closely intertwinedwith the process of economic development. It seems an opportunetime to take stock of the measures for quality of life and incomedistribution in these countries. To this end, this paper first examinesvarious indicators of the quality of life, poverty rate, and incomedistribution. More important, the problems of poverty and incomeinequality would be studied in some depth. Social expenditures willbe studied in order to assess their impact on the existing quality oflife.
ECONOMIC FREEDOM AND QUALITY OF LIFE
Governments of the four tigers constantly reiterate that economic andsocial non intervention is the key to their economic success. Conser-vative development economists have also attributed rapid growth inthe NICs to economic non-intervention policies. They contend thateconomic freedom and prosperity would go hand in hand. There isthus no urgent need for governments to spend resources on socialdevelopment since economic growth will take care of social needs.As far as their economic systems was concerned, the tigers are truebelievers of economic freedom. This is recently confirmed in a studyconducted by the Heritage Foundation, based in Washington DC and

EAST ASIAN NEWLY INDUSTRIALIZING COUNTRIES 71
the Wall Street Journal. They devise an index of economic freedomto study 150 countries in the world (Hong Kong Standard, December17, 1996) (Table I). Each of these countries are rated on 10 economicfactors, including their tax, trade, banking, foreign investment, pric-ing, monetary policies, and the size of the government sector. Inthe 1997 index, all the tigers are performing well. Hong Kong ratesat the top of the index while Singapore ranks second. Taiwan isranked eighth, South Korea twenty-second. Moreover, this studyfinds a strong correlation between economic freedom and economicgrowth: virtually all of the countries with the freest economies alsohave the highest per capita GDPs. Inevitably, the study concludesthat the four tigers will pose as good examples for the rest of theworld on how free markets can lift the impoverished out of poverty.However, whether economic prosperity must lead to better qualityof life is a difficult empirical question. It is, therefore, essential tolook at some important social indicators to gauge how the four tigersare faring socially.
QUALITY OF LIFE IN THE EAST ASIAN NICS
Given the extent of economic development in the Asian NICs, hasthere been a marked increase in the quality of life? This study wouldreview the comparative performance of four Asian NICs using thefollowing indicators: objective social indicators, human develop-ment index (HDI), poverty, and inequality.
As evidenced by some objective social indicators, there is goodquality of life in the NICs. Table II shows that all four NICs, whencompared with other developing countries, are performing well usingthe following criteria: mean years of schooling, enrolment ratio forall levels, adult literacy rate, and population per doctor. The measureof adult literacy rate is not very far those of the industrial countries.There is a larger gap when enrolment ratio for all levels, mean yearsof schooling and population per doctor are considered. Arguably, theAsian NICs have high quality of life and they are close to the stan-dards of living of advanced industrial countries. This conclusion isfurther backed by the United Nations Index on Human Development.

72 KWONG-LEUNG TANG
TABLE IDemographic and economic indicators: East Asian NICs
GNP Economic Population Unemployment Inflation Foreignper freedom (million) rate (%) rate (%) debt
capita rank (US$)(US$)� (billion)
1996 1997 1996 1996 1996 1996
Hong Kong 23 200 1 6.22 2.6 5.2 NilSouth Korea 10 076 22 44.8 1.9 4.7 21.6Singapore 26 400 2 3.1 1.4 1.4 NilTaiwan 12 265 8 21.6 2.8 3.7 Nil
� According to this study, GDP per capita (US$) for some industrial countries are:USA (26 620), Canada (18 900), Germany (24 905), Frane (25 860), Italy (18 905)and United Kingdom (18 800), Australia (19 100) and New Zealand (16 215).Source: Asia Weekly (December 9/15, 1996).
TABLE IISocial indicators: East Asian NICs and 5 industrial Countries
GNP per Mean yrs Enrolment Adult Populationcapita of ratio for literacy per(US$) schooling all levels rate (%) doctor
1991 1992 1990–91 1992 1990
Hong Kong 18520 7.2 69 90 1080Korea 6670 9.3 74 96.8 1370Singapore 14734 4.0 68 92 920Taiwan* 10599 NA NA 89.8 913
Canada 20510 12.2 89 99 450Switzerland 33710 11.6 74 99 630Japan 26840 10.8 73 99 610Sweden 25180 11.4 70 99 370Norway 24090 12.1 77 99 500
* Data come from Asian Development Bank (1994).Sources: Asian Development Bank (1994); United Nations Development Pro-gramme (1994).

EAST ASIAN NEWLY INDUSTRIALIZING COUNTRIES 73
Human Development Index. The most recent measure of the qualityof life which has attracted considerable attention is the HDI (Kanbur,1994). The United Nations (1994) first introduced this index in 1990as a composite human development measurement. It is defined onthe basis of three indicators of well-being at the national level –longevity, knowledge, and standard of living. Longevity is measuredby life expectancy. Knowledge is measured by a combination of adultliteracy and mean years of schooling. Standard of living is measuredby purchasing power, based on real GDP per capita adjusted for thelocal cost of living.
Table III indicates that all three NICs are ranked high accord-ing to the HDI in 1992: Hong Kong (24), South Korea (32) andSingapore (43). Ever since 1960, they have made very substantialprogress in human development. Their HDI values are now close tothe industrial countries but far outpace other Asian countries (e.g.China and Thailand). The overall HDI for the developing countriesis 0.541, with all three NICs well above this value. They are clas-sified as high human development countries. Taiwan which is notincluded in the HDI study would probably be ranked somewherebetween Singapore and Korea since all the indicators which under-line the HDI for Taiwan are very comparable to those of Singaporeand Korea (Gold, 1986; Asian Development Bank, 1995) (Table III).Another measure supports this contention. Hong Kong, Singapore,and South Korea are three of the ten best performers according to thepercentage reduction in combined infant and child mortality (Drezeand Sen, 1991).
It would be interesting to compare their HDI ranking with theirGNP per capita ranking (i. e. the income rank) since it will givean indication of the congruence of income and human development(Table III). Both Hong Kong (HDI rank 24, Per capita rank 22) andKorea (HDI rank 32, Per capita rank 36) have very similar ranksfor both measures. Singapore is an exception here since there is asubstantial discrepancy between its HDI rank (43) and its GNP percapita rank (21). Inevitably, this suggests that the income rank is farahead of the HDI rank, showing that Singapore still has considerablepotential for translating its income into improved well-being for thepeople.

74 KWONG-LEUNG TANG
TABLE IIIUNDP Human Development Index
Human Development Index HDI rank Per capita rank(Highest 1 lowest 173)
1960 1970 1980 1992 1992 1992
Hong Kong 0.561 0.737 0.830 0.875 24 22Singapore 0.519 0.682 0.780 0.836 43 21South Korea 0.398 0.523 0.666 0.859 32 36Taiwan NA NA NA NA NA NA
China 0.248 0.372 0.475 0.644 94 143Thailand 0.373 0.465 0.551 0.798 54 82
Canada 0.865 0.887 0.911 0.932 1 11United States 0.865 0.881 0.905 0.925 8 9United Kingdom 0.857 0.873 0.892 0.919 10 19Sweden 0.867 0.881 0.901 0.928 4 4
Note: The average HDI for developing countries is 0.541 in 1992 (Industrialcountries = 0.918).Source: United Nations Development Programme (1994).
Poverty. The second measure of quality of life is poverty rate. It isa more telling indicator than other social indicators. For some time,numerous studies have documented the rapid decline in poverty forthese four countries. For example, Fields (1984; 1991), using thehead-count index and country-specific poverty lines, reports thatpoverty decreased in all four East Asian NICs. Table IV gives theabsolute poverty rates of the Asian NICs over time and shows theextent of poverty alleviation. Given the fact that the proportion of thepopulation in poverty falls below 2 percent in the Asian NICs, thereis substantial poverty alleviation. South Korea stands out since ithas seen a substantial decline in absolute poverty: poverty declinessteeply from 41 percent in 1965 to less than 10 percent in 1980(Kim and Leipziger, 1993). The most recent estimate is 2.1 percent(UNDP, 1994), with only 20 percent of people living in rural areasbeing poor (Johansen, 1993). Most economists attribute this to gainsin income (Leipziger et al., 1992).

EAST ASIAN NEWLY INDUSTRIALIZING COUNTRIES 75
TABLE IVAbsolute poverty in the East Asian NICs
Year Households inpoverty (%)
South Korea 1965 411970 231976 151980 101990 51992 2.1
Singapore 1966 371973 31.91978 151983 0.3/7.2�
Hong Kong 1966 181971 111976 71980 41991�� 21996 10
Taiwan 1964 551973 201980 101990��� 0.5
Note: The estimate for Hong Kong’s poverty rate in 1996 issubjected to official challenge.� From Lim et al. (1988). Two poverty lines are used: anextreme absolute poverty line of S$60 per month per capitaand a moderate poverty line of S$120.�� Author’s estimates from Mok’s study (1994).��� Report in Ku (1995).Sources: (A) Korea: Bautista (1990); Tabatabai and Fouad
(1992) Johansen (1993); UNDP (1994).(B) Singapore: Bautista (1990); Lim et al. (1988).(C) Hong Kong: Bautista (1990); Midgley
(1984); Mok (1994). Oxfam (1996).(D) Taiwan: Bautista (1990); Midgley (1984); Ku
(1995).

76 KWONG-LEUNG TANG
The trends in poverty for Singapore is based on the AmalgamatedUnion of Public Employees (AUPE) poverty lines (Lim et al., 1988).The reduction in poverty is fast, from over 30 percent in 1973 to about15 percent in 1978 and 7.4 percent in 1983. Recent assessment ofpoverty in Singapore is extremely optimistic. Lim and her associates(1993) comment that rapid economic growth has almost removedabsolute poverty which is largely confined to elderly and disabled.Researchers attribute this downward trend in poverty to employmentexpansion and government policies pertaining to central providentfund, health, education, and public assistance (Lim et al., 1988). Itis not surprising to hear the Singapore government’s claim that thepoverty problem is solved.
This remarkable record has to be seen in the context of the restof developing world. The United Nations’ Report on the WorldSocial Situation (1993) laments that there has been only a negli-gible reduction in the incidence of poverty over the world in the1980s. With a very optimistic note, however, it praises the successof East Asian NICs in raising employment and alleviating poverty.Not surprisingly, the image of widespread poverty in the East AsiaNICs is pushed to one side by many economists (Forbes, 1993).International organizations make it clear that poverty is not a majorconcern in these countries (World Bank, 1990; UNDP, 1994).
In any estimate of the prevalence of poverty, there is always causefor caution. Official poverty rates in many countries are riddled withproblems and should be interpreted with great care (Fields, 1994;Forbes, 1993). There are many serious data problems, measurementbias, and a tendency for many governments to explain away thephenomenon.
A major problem has arisen with the poverty estimate in Taiwan.According to the Taiwanese government, only 0.5 percent of thetotal population can be counted as below the official poverty line.This incredibly low figure is subjected to serious questioning on thepart of the Taiwanese academics (Ku, 1995). One reason for this lowestimate is that the local authorities have been able to underestimatethe severity of the problem to avoid having to spend huge sums onsocial assistance.
Scholars in Hong Kong (Oxfam, 1996) has raised serious doubtsabout the reliability of official estimates which are based on the num-

EAST ASIAN NEWLY INDUSTRIALIZING COUNTRIES 77
ber of recipients of social assistance. This programme has carriedvery high stigma. The problem is that Hong Kong government hasbeen reluctant to raise the levels of social assistance and change therules of eligibility. Many more people could have obtained this sup-port had there been a change. Other researchers concur (Mok, 1994)and they found that the living standard of the poor had worsened asevidenced by the declining ratio of public assistance benefits to themedian wage of the manufacturing workers. More important, usinga different measure of poverty (i. e. relative poverty), poverty ratefor households would inflate to 13.0 percent (14.9 for individuals).Anecdotal accounts also support the presence of poverty. Despiteits growing affluence, MacPherson (1992) notes that urban poor andneedy are very visible in this British colony. Hong Kong govern-ment was very much embarrassed when the United Nations HumanRights Committee decided to investigate the living conditions ofthe three thousand poor who live in six-foot-long metal cages (FarEastern Economic Review, November 9, 1995). Most recently, thegovernment was further embarrassed when an Oxfam study releasedin October 1996 estimated that 10 percent of the population areliving in “abject” poverty. Some case studies even show that someworking households have inadequate food. There is thus evidencethat the problem of poverty is clearly getting worse in Hong Kong.
In some situations, urban poor only become “visible” when theystruggle for their housing right. There have been reports that livingand working conditions for the urban poor in Korea worsened overthe 1980s (Hart-Landsberg, 1993). They were neglected by gov-ernment. Recent government housing policy added to the housingproblems of the poor when it began to launch many “developmentprojects” for urban renewal. The results were eviction and clashesbetween the poor and the government. Poor people began to developtheir organizations in order to assert their rights and continue theirstruggle.
The case of Korea and Singapore highlights the importance ofrelative poverty. Like Hong Kong, the problem of relative depriva-tion is haunting both Singapore and Korea. According to the KoreanDevelopment Institute, relative poverty (percent of household withincomes below one-third of the average level of household income)declined dramatically from 12.1 percent in 1965 to 4.8 percent in

78 KWONG-LEUNG TANG
1970. During the 1970s, relative poverty increased, to 12.4 percentin 1976 and 13.3 percent in 1980 (Leipziger et al., 1992).
For Singapore, Lim and his associates (1988) worked out a rela-tive deprivation line of S$170 in 1982–83. A decline in relativepoverty was noted: the overall deprivation decline in 1982–83 to25 percent from the 1972–73 level of 63 percent. However, with aquarter of households considered as relatively deprived, the scenariois not one of complacency. Suspicions that relative poverty has beenrising in the East Asian NICs are valid. It will be fair to say thatthe real dimensions of absolute and relative poverty in Hong Kong,Singapore, Taiwan, and Korea have not come into the open.
Inequality. Another significant indicator of collective quality of lifeis income inequality. There are different ways to measure inequalitydistribution: Gini coefficient, Kuznets ratio, and Atkinson index. Themost popular measure of income inequality is still the Gini coefficientof household income (or individuals). Before looking at the Ginicoefficient, there is another measure worth studying. It is devisedby Ahluwalia (1976) to classify countries in terms of inequality. Hisclassification is based on the percent of income the poorest 40 percentobtain. There will be low inequality where the poorest 40 percentreceive more than 17 percent of income; moderate inequality wheretheir share is between 17 and 12 percent; and high inequality wheretheir share is less than 12 percent. Using this schema, South Koreaand Taiwan are listed as having low inequality while Hong Kongand Singapore have moderate inequality. In reality, the gap betweenHong Kong’s richest and poorest is among the Asia’s widest (FarEastern Economic Review, November 9, 1995). Government figuresfrom 1991 showed that the bottom 20 percent of households had amedian monthly income of HK$3 460 (US$443), the top 20 percentearn HK$27 965 (US$3 585).
Like the poverty problem, analyses of most recent Gini coeffi-cient present some worrying signs for the NICs (Table V). BothHong Kong (0.51 in 1996) and Singapore (0.46 in 1985) have levelsof inequality significantly higher than the other two countries. Bycontrast, Taiwan and South Korea have very comparable levels ofinequality and their Gini coefficients are much lowered than thoseof Hong Kong and Singapore. Other indicators confirm this obser-

EAST ASIAN NEWLY INDUSTRIALIZING COUNTRIES 79
TABLE VGini Coefficients for household income in the East Asian NICs 1953–96
Year Korea Taiwan Singapore Hong Kong
1953 0.5581957 0.4701961 0.4401963 0.4621964 0.3601965 0.3441966 0.342 0.358 0.498 0.4671968 0.305 0.3621970 0.332 0.321 0.4701971 0.360 0.430 0.4091972 0.318 0.4301973 0.4301974 0.319 0.430 0.3981975 0.4401976 0.391 0.307 0.440 0.4091977 0.4401978 0.400 0.306 0.4401979 0.424 0.3731980 0.389 0.303 0.4201981 0.443 0.4531982 0.357 0.308 0.4651983 0.4401984 0.312 0.4601985 0.356 0.317 0.4601986 0.4581988 0.3401991 0.4801996 0.440 0.518
Sources: Fields (1984, 1991); Lim et al. (1988); Haggard (1990); Sun-drum (1990); Tsang (1991).
vation: percentage share of income by the top 10 percent for HongKong and Singapore is 37.3 (1991) and 33.5 (1983) while the cor-responding figures for Korea and Taiwan are lowered. Looking atincome ratio of highest 20 percent to lowest 20 percent the pattern

80 KWONG-LEUNG TANG
is consistent, with Singapore high on the top of this measure ofinequality (Table VI).
It is important to look at the trend in income inequality inthese Asian countries. An important generalization about changesin income distribution over time is proposed by Kuznets (1955). Heargues that income inequality worsens in the early stages of eco-nomic development but then gradually improves as developmentproceeds. If this is the case, then economic prosperity would reallytake care of the problem. In actual practice, however, this “U-curve”distribution proposition is rather speculative and tentative (Midgley,1984; Sundrum, 1990). Yet, a number of later studies came to a verysimilar conclusion, confirming Kuznets’ hypothesis (Paukert, 1973;Ahluwalia, 1976; Adelman and Morris, 1984).
Looking at the four East Asian NICs, how valid is this generaliza-tion? The picture is a mixed one (Table V). First, it is seen that bothSouth Korea and Taiwan have very comparable Gini coefficients in1985 and South Korea appears to support Kuznets’ hypothesis. TheGini index was 0.344 in 1965, with inequality worsening to 0.391in 1976 before improving to 0.317 in 1985. It reached the lowestlevel in mid-1980s. Contrary to the proposition of Kuznets, Taiwanhas a consistently declining distribution. The problem of inequalityis improving over the years. Within a span of twenty five years, thefall in Gini coefficient has been substantial (from 0.558 to 0.317).Income distribution in South Korea and Taiwan has remained rela-tively more stable.
In contrast, Hong Kong and Singapore show a marked difference.Their patterns actually indicate a high level of inequality at first, fol-lowed by some improvements, and then quick deterioration. Incomeinequality in Hong Kong improved in the 1970s but worsened inthe 1980s and 1990s. Similarly, the level of inequality in Singaporeimproved in the late 1970s but worsened in the 1980s and 1990s. TheUnited Nations’ World Social Situation Report (1993) independent-ly arrives at this conclusion, noting the increase in income inequalityin Hong Kong and Singapore. In sum, East Asian NICs provide amixed picture (Bigsten, 1983). Kuznets’ prediction is not alwayscorrect. This is not surprising, in view of the facts that Kuznets’hypothesis is often stated as describing a historical process and hisstudy is plagued by the problem of small sample of countries.

EAST ASIAN NEWLY INDUSTRIALIZING COUNTRIES 81
TAB
LE
VI
Perc
enta
gesh
are
ofin
com
ein
the
Eas
tAsi
anN
ICs
Firs
tSe
cond
Thi
rdFo
urth
Hig
hest
Top
Bot
tom
Inco
me
ratio
quin
tile
quin
tile
quin
tile
quin
tile
quin
tile
10%
40%
ofhi
ghes
t20%
Tolo
wes
t20%
Hon
gK
ong�
1971
6.2
10.5
14.3
20.0
49.3
34.6
16.7
1991
4.7
10.0
14.5
22.1
48.0
37.3
14.7
1985
–89
8.7
Sing
apor
e
1966
4.7
11.1
16.1
20.7
47.4
28.9
15.8
1983
5.1
9.9
14.6
21.4
48.9
33.5
15.0
1985
–89
9.6
Kor
ea 1970
7.4
13.6
15.5
23.3
41.9
25.8
21.0
1988
7.4
12.3
16.3
21.8
42.2
27.6
19.7
1985
–89
7.5
Taiw
an
�
�
1971
8.7
13.2
16.6
22.3
39.2
24.7
21.9
1985
8.4
13.6
17.5
22.9
37.6
–22
.019
85–8
98.
3
Sour
ces:
Pang
(197
5);M
idgl
ey(1
984)
;��
Song
(199
0);�
Cha
u(1
993)
;Wor
ldB
ank
(198
0–95
).

82 KWONG-LEUNG TANG
Environment indicators. It is too early to conduct a comprehen-sive review of environmental problems of East Asian NICs sincechanges in the environment have not been an important concernfor many countries. Consequently, reliable indicators are lacking forcomparative purposes. However, one recent study on the efficiencyof energy use among the tigers raises some grave concerns. Incomeelasticity of energy demand and energy intensity are two importantmeasures of environment quality. Drysdale and Huang (1995) findthat the income elasticity of energy demand, defined as the ratioof the percentage change of energy consumption to the percentagechange of GDP, is 0.6 for developing East Asia (only 0.5 for theworld). This means that proportionally more energy is demanded inEast Asia to produce an extra 1 percent of GDP than on averagethroughout the world. Regrettably, this elasticity has been declin-ing in three NICs: Korea (from 1.0 in 1973–78 to 0.9 in 1978–85);Hong Kong (from 1.0 to 0.8) and Singapore (from 2.6 to 0.9). As faras energy intensity (the amount of energy in tons of oil equivalent(TOE) required to produce $1 000 output) is concerned, three tigers(Korea, Taiwan and Hong Kong) experienced a fall, from 0.6 TOEequivalent in 1971 to 0.5 TOE/$1 000 in 1990. Such a fall is an indi-cator of improvement. Yet this figure is still higher than the worldaverage.
As for environmental pollution, long years of intense industrial-ization has given rise to many pollution problems. The growth rateof carbon emissions by East Asian economies (including China andJapan), an annual average of 8.5%, is higher than that for the world asa whole (Drysdale and Huang, 1995). Certainly this figure is inflatedby the inclusion of China. But no one would deny that increasingtransportation in the tigers has been a major source of greenhousegases. Also, the average concentrations of pollutants (sulphur diox-ide and suspended matter in the air) in major East Asian cities (HongKong included) exceed safe (hence acceptable) levels in 1987–90(Drysdale and Huang, 1995).
In summary, even though the Asian tigers are wealthier, the prob-lems of poverty, income inequality and environmental degradationhaunt them. It would be necessary to look at their social policies togauge their capability to solve these problems.

EAST ASIAN NEWLY INDUSTRIALIZING COUNTRIES 83
SOCIAL POLICIES AND QUALITY OF LIFE
Traditionally, development economists tend to play down the impor-tance of social intervention because the latter would drain awayscarce resources for economic development (Tang, 1997). In thecase of Asian NICs, it would be wrong to assume that these coun-tries allow the free market to operate and distribute resources freely.Instead, each tiger has spent considerable amounts on social devel-opment. This in part explains why the Asian NICs perform well onsome social indicators. A study of social intervention in these coun-tries would identify the impact of social spending on the quality oflife.
It is true that, after the Second World War, mistrust of socialwelfare was rampant among the East Asian NICs. In the 1960s,social welfare was considered of secondary importance to economicpolicy and was developed to meet needs only to the extent thatthey would not hinder economic development (Chan, 1985; Chang,1985). Social welfare policy in these countries was modest, reac-tive, and cautious (Midgley 1984: MacPherson, 1992). As Jones(1993) succinctly puts it, governments in the Asian NICs are onlyminimalist on welfare but maximalist on profits. Taiwan exempli-fied this approach. Industrialization remained the prime target fordevelopment and social welfare policy was seen as generating feweconomic returns and diverting scarce resources away from indus-trialization. In addition, the heavy burden of military spending hadhandicapped the development of social welfare (Lin, 1991). Chan(1985) observes that the Taiwanese government had deterred thosesocial policies which were established for “unproductive labour.”The Korean model of welfare is very similar. Pae (1992) arguesthat Korean government allocated less than 10 percent of its bud-get for welfare services so that more money could be invested inhuman resources development. Thus a small budget has mandatedthe state to prioritize welfare services – comprehensive nationalmedical care protection, pension, support for the handicapped, thepoor and the old, and housing in descending order. Hong Kong andSingapore seem to be more conservative than Korea and Taiwan inwelfare delivery (Tang, 1996). Pursuing a laissez-faire policy and anexport-led development, the Hong Kong government turned downvarious requests to introduce different forms of social security before

84 KWONG-LEUNG TANG
1970, arguing that the traditional Chinese family support would beundermined. Governor Patten recently pledges that the governmentwould keep a sensible control of public spending at below 20 per-cent of GDP. Community services for the people will be provided“without ever jeopardising the strength of our economy” (Sing TaoDaily News, November 29, 1995). Similarly, Goh Chok Tong, primeminister of Singapore, reaffirms the defining characteristics of theSingapore-style social policy. Basically, it is through wealth-creationfirst and then distribution, with a strong emphasis on economic effi-ciency and meritocracy. The government’s efforts are motivated bythe principle of equality of opportunity, not of outcome. Although itsubsidizes education, housing, and basic health care, it stops short ofspending too much on social welfare (The Straits Times, September23, 1995).
Despite such ideological commitment to wealth creation, polit-ical, social, and economic conditions in the East Asian NICs haveengendered some forms of intervention in social policy. Thus Midg-ley (1986; 1992) observes that these four countries are characterizedby extensive government intervention and policies to promote indus-trialization. All four countries have established a variety of socialprogrammes and welfare schemes. They have statutory education,housing, social security, health, and social work services. Essen-tially, these governments had used social policies to promote labourstabilization, foster structural integration, gain legitimacy and winpopular support, and meet social needs. Education and health aretreasured highly by the NICs in the course of economic developmentbecause they will enhance human capital development, a necessarycondition for the economic success in any country (Lim et al., 1988;1992; Henderson, 1993). Some recent statistics on social spendingbear this out.
Table VII indicates that except for Singapore, all three coun-tries stand out in its relatively lower outlays for social security. Foreducation, three countries spend over 3 percent, with Korean expen-diture coming close to those of industrial nations. Hong Kong andKorea spend more on health than the other two countries. Lastly,compared to the industrial nations, government spending as percent-age of GDP is far lowered. As far as social security is concerned,none has unemployment benefits, although debates on its merits

EAST ASIAN NEWLY INDUSTRIALIZING COUNTRIES 85
TABLE VIISocial expenditures of East Asian NICs 1990�
Social security Education Health Governmentbenefits spending spending spending
spending(As % (As % (As % (As %
of GDP) of GDP) of GDP) of GDP)
Hong Kong�� 0.57 3.0 5.7 14.4Korea��� 1.3 6.6 3.6 17.0Singapore 7.1 3.4 1.9 22.7Taiwan���� 2.6 1.4 0.4 20.5
Canada 18.8 7.4 9.9 21.8Switzerland 13.3 5.4 8.0 19.5Japan 11.0 5.0 6.8 15.8Sweden 33.7 6.5 8.8 47.5Norway 17.6 7.6 8.4 46.4France 26.1 6.0 9.1 45.4Australia 8.0 5.5 8.6 27.4USA 12.6 7.0 13.3 24.3Netherlands 28.7 5.8 8.7 52.8UK 17.0 5.3 6.6 39.5Germany 23.0 5.4 9.1 24.6Austria 22.5 5.4 8.5 27.4Belgium 19.8 5.4 8.1 50.4Denmark 27.8 6.1 7.0 42.2Finland 22.2 6.6 8.9 39.2
Mean 20.1 6.0 8.7 34.9
� Data for industrial countries covers the period 1985–90.�� Data for Hong Kong come from Tang (1993) and Mok (1994).��� Data for Korea come from Kurian (1992).���� Data for Taiwan come from Asian Development Bank (1994) and StatisticalYearbook of ROC (1994).Sources: United Nations Development Programme (1994); Asian DevelopmentBank (1994); World Bank (1995).
are going on in Hong Kong and Korea. Hong Kong is the onlyEast Asian NICs which still lack social programs for ageing. Since1992, the government has proposed two social insurance plans and

86 KWONG-LEUNG TANG
then backed away. However Hong Kong has a demogrant allowancewhich is unique to the Asian NICs. Comparatively, Taiwan has themost comprehensive social security programme, providing insur-ance funded retirement, invalidity, survivor’s sickness, maternity,and work injury benefits. As a late-comer in social security, HongKong introduced social assistance in 1971, soon followed by socialallowance for old age and disability. Employer liability schemeswere introduced in order to provide work injury, sickness and mater-nity benefits (Midgley, 1986). Likewise, South Korea attached moreimportance to social welfare in the 1970s and it became part of socialdevelopment. Government then recognized the importance of socialdevelopment and the need to solve social problems (Chang, 1985).It soon introduced an insurance scheme which covered sickness,maternity and work injury benefits. In 1988, Korea set up a nationalpension plan covering all people between the age of eighteen andsixty (Ramesh, 1995). Finally, Singapore devised the central provi-dent fund to meet the needs of retirement in 1955. Like Hong Kongand Korea, employer liability programmes were established to meetthe needs of injury, sickness and maternity by the ruling party. All inall, the style of social policy has been incremental, piecemeal, andhaphazard. Midgley (1986) attributes this incrementalism to a reluc-tance on the part of political elites to expand social programmes,unless circumstances dictate otherwise.
Taken together, these tigers share some similarities in their socialpolicy strategies. First, they are ardent believers of trickle-downtheory of development: economic growth would raise incomesthrough real growth and benefits would flow throughout the popula-tion. Second, the following defining characteristics of total spendingare noted: relatively small fiscal deficits and the failure to restrict theflexibility of the labour market. Third, social security is a weapon totarget politically important groups, which could result in inequitablehorizontal redistribution. Researchers (Chang, 1985; Deyo, 1992)observe that the Korean government deviated from the “productionfirst” approach temporarily in 1963 and legislated to give pension,medical and other benefits for civil service, military, and privateschool teachers. Similarly, Hong Kong civil servants whose loyaltyis crucial to the survival of the colony have long enjoyed job secu-rity and generous allowances. To protect their interests after Hong

EAST ASIAN NEWLY INDUSTRIALIZING COUNTRIES 87
Kong is reverted to China in 1997, the government has set asidea huge sum (US$19 billion) as pension fund for the retired civilservants. In Taiwan, government’s contribution to social insurancefor military servicemen and related groups amounts to 10 times thesum contributed for farmers and labourers (Ku, 1995). Fourth, criseshad prodded these governments in expanding social policies. Thusthe Hong Kong government drastically increased its spending onsocial services after the riots in 1966–67 (Tang, 1996). In Taiwan,Ku (1995) finds that significant periods of growth in social spendingcorrespond with the emergence of political crises facing the gov-ernment. Similarly, the setting up of the central provident fund inSingapore at a time of political instability is interpreted by some as amechanism to gain popular mandate. Lastly, with the partial excep-tion of Hong Kong, these NICs are developmental states whichhave been strong in guiding and orchestrating rapid industrializa-tion (Gold, 1986; Appelbaum and Henderson, 1992; Amsten, 1994).They formulate and implement national development strategies, planfor effective deployment of labour and maintain lower labour costsby effectively suppressing labour movement (Deyo, 1987). The lastgoal is realized by repressive labour laws and the introduction oflabour dispute mediation machinery. In Hong Kong, Taiwan, andSingapore, the states in these countries have tried to regulate labourby means of labour welfare schemes.
THE IMPACT OF SOCIAL SECURITY
Generally, deliberate distributive policies initiated by the govern-ment would be instrumental in reducing inequality. Social securityprogrammes have been and could be redistributive. Some academicsshare this optimism. It is reasonable to expect that social securityprogrammes would increase income share of the workers, resultingin a more equal income distribution.
On the empirical front, the effect of fiscal policy on income dis-tribution depends on two factors: the way taxes are levied and theway government spending benefits different income groups. Thereis evidence to show that taxation and public spending really matterin redistribution. For instance, Musgrave and his associates (1974)found that for the United States, distribution of the tax burden would
88 KWONG-LEUNG TANG
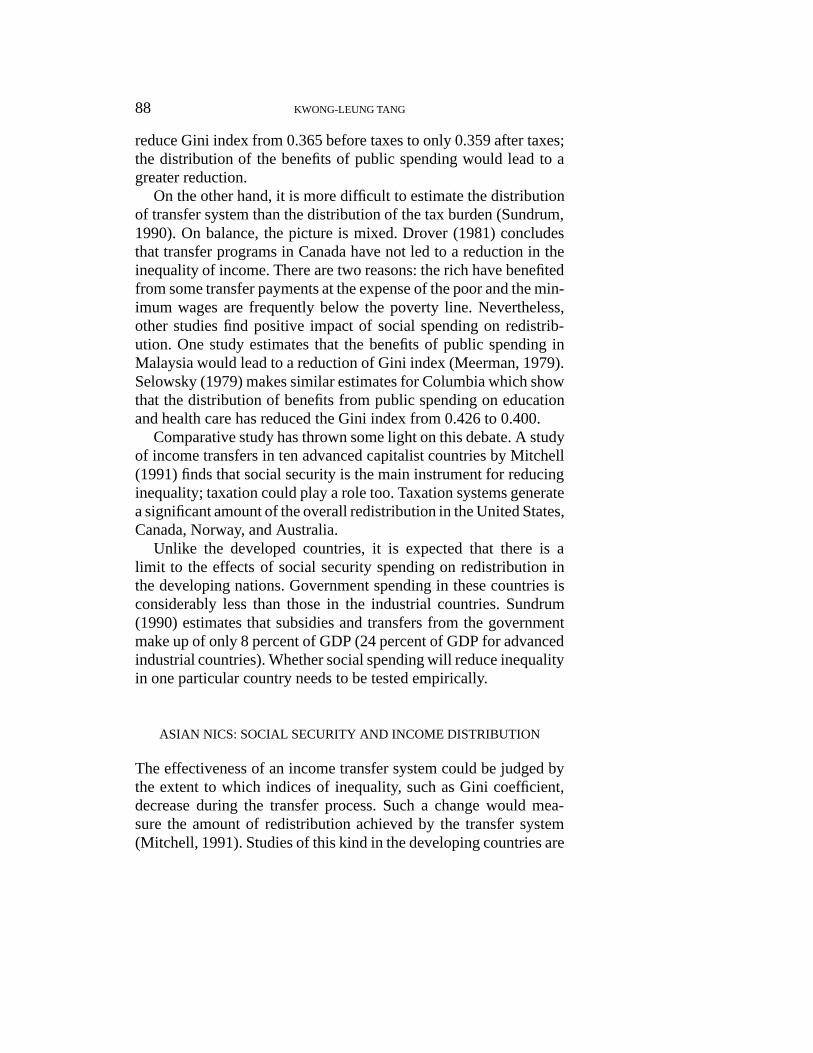
reduce Gini index from 0.365 before taxes to only 0.359 after taxes;the distribution of the benefits of public spending would lead to agreater reduction.
On the other hand, it is more difficult to estimate the distributionof transfer system than the distribution of the tax burden (Sundrum,1990). On balance, the picture is mixed. Drover (1981) concludesthat transfer programs in Canada have not led to a reduction in theinequality of income. There are two reasons: the rich have benefitedfrom some transfer payments at the expense of the poor and the min-imum wages are frequently below the poverty line. Nevertheless,other studies find positive impact of social spending on redistrib-ution. One study estimates that the benefits of public spending inMalaysia would lead to a reduction of Gini index (Meerman, 1979).Selowsky (1979) makes similar estimates for Columbia which showthat the distribution of benefits from public spending on educationand health care has reduced the Gini index from 0.426 to 0.400.
Comparative study has thrown some light on this debate. A studyof income transfers in ten advanced capitalist countries by Mitchell(1991) finds that social security is the main instrument for reducinginequality; taxation could play a role too. Taxation systems generatea significant amount of the overall redistribution in the United States,Canada, Norway, and Australia.
Unlike the developed countries, it is expected that there is alimit to the effects of social security spending on redistribution inthe developing nations. Government spending in these countries isconsiderably less than those in the industrial countries. Sundrum(1990) estimates that subsidies and transfers from the governmentmake up of only 8 percent of GDP (24 percent of GDP for advancedindustrial countries). Whether social spending will reduce inequalityin one particular country needs to be tested empirically.
ASIAN NICS: SOCIAL SECURITY AND INCOME DISTRIBUTION
The effectiveness of an income transfer system could be judged bythe extent to which indices of inequality, such as Gini coefficient,decrease during the transfer process. Such a change would mea-sure the amount of redistribution achieved by the transfer system(Mitchell, 1991). Studies of this kind in the developing countries are

EAST ASIAN NEWLY INDUSTRIALIZING COUNTRIES 89
limited. Two studies are done which might have some bearing on thisissue. An early study of income distribution in Hong Kong by Hsiaand Chau (1978) highlights the effects of taxes and social spending.They find that government spending strongly favours low-incomegroup. When the Gini coefficient is adjusted to take into account thedistribution of government taxes and benefits, it improves by about0.03 to 0.04. However, the gain is quite moderate.
A multivariate study on the relationship between social spend-ing and inequality is undertaken by Clark and Chan (1995) who setout to examine the validity of different theoretical paradigms (mod-ernization school, dependency theory etc.) to explain the economicdevelopment of Taiwan. Specifically, state policy in Taiwan is testedto see if it has positive impact on economic performance and popularwelfare. Welfare is measured by the growth of the national Physi-cal Quality of Life Index (PQLI) and the change in the ratio of theincome of the richest to the poorest fifths of the population. Theiranalysis is based on the regression of lagged time series relationshipsamong these variables.
They find that welfare spending has the largest impact on thenation’s PQLI. On income inequality, their study shows a combina-tion of market and policy factors (government spending growth andwelfare spending growth) which are influential. These findings “sug-gest that the government promoted equality both directly through its(limited) social spending and indirectly through the liberal effectsthat resulted from its conservative fiscal policies . . .” (Clark andChan, 1995, p. 36).
Another time-series study (Tang, 1996) on the other three tigersshow similar results. In this study, three separate single-country stud-ies (Hong Kong, Singapore, and South Korea) are made, each look-ing at the connection between social spending and income inequality.It relates social security and health spending to the Gini coefficientin each NICs over a specifiable period of time. There is no strongrelationship between income inequality and social security spendingin Hong Kong and Singapore. The mainstay of social security pro-grammes in Hong Kong is the public assistance and social allowance.The former has been described as “closer to the Poor Law than the21st century in its levels and in its rules” (MacPherson, 1992) whilethe social allowance yields small benefits for the beneficiaries. On

90 KWONG-LEUNG TANG
the other hand, Singapore has a long list of social provisions (publicassistance, tax allowance, and central provident fund) but there isa significant reduction of expenditure for social security in recentyears (Ramesh, 1995). This result for the two Asian Tigers givesno surprise, considering the excessive enthusiasm in these two city-states for rapid economic growth. The issue of social inequalitiesis slighted by the two governments which have tried to convincetheir people to trust the trickle-down mechanism. On the other hand,South Korea shows a more stronger relationship between income dis-tribution and social security. But the parameters have not achievedthe required level of significance. There is no doubt that the Koreangovernment has tried now to pursue a more equalitarian policy. Itis speculated that the introduction of the national pension plan inlate 1980s, given its limited coverage, would have some impact onincome distribution. However, given the short time span, its impactdoes not show up in this study.
These findings are suggestive but they urge careful thoughts begiven to social security provisions. Even in these high-income devel-oping countries, there is no inevitability that social security willlead to income redistribution. The case of Hong Kong and Singa-pore show the minimal impact of the social security provisions onincome distribution. However, Taiwan shows a very different reality.Social security has some impact on income distribution. The Koreancase lies in-between. Though it has a relatively more comprehensivesocial security systems than Hong Kong and Singapore, the periodunder examination, however, does not display any strong relation-ship between social security provisions and income inequality.
CONCLUSION
A review of the developmental experiences of old-age plans in thedeveloped and developing countries would shed more light on theeffectiveness of social security. Generally, pension plans and prov-ident fund approach, characterized by limited coverage and limitedbenefits, are not very redistributive. There is ample evidence drawnfrom various countries to prove this contention. In Germany, theold-age pension scheme involves very little income redistributionbetween classes since it is strongly earnings related (Kaim-Caudle,

EAST ASIAN NEWLY INDUSTRIALIZING COUNTRIES 91
1973). Similarly, very little redistributive effects can be found fromthe old-age pension plan in Britain which is means-tested and offerslow benefits (Williamson and Pampel, 1993). The Swedish occupa-tional pensions with universal coverage has little impact on redistrib-ution since the benefits are small. In the developing world, instancesthat point to the limits of social security programmes abound. Forinstance, Brazil’s enactment of a public pension plan fails to bringout distribution from the rich to the poor or even from the middleclass to the working class. Williamson and Pampel (1993) observethat the plan is based so much on prior contributions and thus priorincome that the impact of the program on inequality is really min-imal. Similarly, the Indian provident fund has little impact sinceworkers can only take out what they put in.
A comprehensive study of the impact of social security provi-sions in the Third World by Midgley (1984) finds that they havelittle redistributive effect and many programmes even reinforce andamplify existing inequalities. In most developing countries whichrun social security programmes, the benefits are small and cover-age is often restricted. As MacPherson (1987) points out, the mainfeature of social security provision in the developing countries hasbeen the universal restriction of coverage to those engaged in formalwage employment.
Comparatively, Asian NICs do better in providing employment,improving absolute income, and reducing poverty than their LatinAmerican counterparts (Haggard, 1990). Yet the problems of relativepoverty and inequality linger. This study has examined the influenceof social security on inequality. With the exception of Taiwan, socialsecurity plays little role in the reduction of social inequality in theAsian NICs. Obviously, the size of social security spending is toosmall to have a direct effect on inequalities. Since the influencesof social security on inequality are rather weak, these Asian NICsshould target the problem of inequality more seriously.
Undoubtedly, the Asian NICs have achieved good quality of life.But this study has showed that poverty lingers while income dispar-ities are getting worse. Added to this is the growing environmentalproblems. A more active policy is needed to alleviate these prob-lems. In fact, some conditions would facilitate their intervention.First, Hong Kong and Taiwan have accumulated huge amounts of

92 KWONG-LEUNG TANG
financial reserves. The financial capacity of South Korea and Sin-gapore should not be under-estimated. Each tiger has sizeable bil-lions of international reserves: Hong Kong (US$49b); Singapore(US$66b); Korea (US$31b); and Taiwan (US$99b) (Far EasternEconomic Review, November 16, 1995). Further, the high degreeof autonomy of the state in the East Asian NICs is to their favour(Jenkins, 1991; Castells, 1992). In this regard, Indonesia would giveus useful insights into the developmental paths of the four tigers.Owing to extreme income disparities and frequent social unrest, thegovernment recently imposes wealth tax to aid the poor by decree-ing that wealthy Indonesian companies and individuals to pay a 2percent surcharge on their after-tax profits and incomes (Asian WallStreet Journal, December 19, 1996). This action illustrates both theautonomy of the state and the urgency of the problem. Clearly, thefour tigers are equally autonomous but their problems are less seriousthat those of Indonesia. Because of their relatively better position, itis difficult to see a major shift in economic and social policies. Thus,there is no immediate prospect that these NICs are going to drasti-cally revise their social security strategy. Concerns over economicgrowth continue to prevail over all other social considerations.
REFERENCES
Adelman, I. and C. T. Morris: 1984, Economic Growth and Social Equity inDeveloping Countries (Stanford University Press, Stanford).
Ahluwalia, M.: 1976, ‘Inequality, poverty and development’, Journal of Develop-ment Economics 3, pp. 307–342.
Ahmad, E., J. Dreze, J. Hills and A. Sen: 1991, Social Security in DevelopingCountries (Clarendon, Oxford).
Amsden, Alice H.: 1994, ‘The spectre of Anglo-Saxonization is haunting SouthKorea’, in L. J. Cho and Y. H. Kim (eds.), Korea’s Political Economy: AnInstitutional Perspective (Westview, Boulder), pp. 87–126.
Asian Development Bank: 1994, Key Indicators of Developing Asian and PacificCountries 1994 (Oxford University Press, Manila).
Asian Development Bank: 1995, Basic Information (Asian Developing Bank,Bangkok).
Bigsten, A.: 1983, Income Distribution and Development: Theory, Evidence, andPolicy (Heinemann, London).
Chan, Gordon Hou Sheng: 1985, ‘Taiwan’, in J. Dixon and H. S. Kim (eds.),Social Welfare in Asia (Croom Helm, New Hampshire), pp. 21–62.
Chan, Steve: 1991, ‘Economic growth and popular well-being in Taiwan: A timeseries examination of some preliminary hypotheses’, Western Political Quarterly44, pp. 560–582.

EAST ASIAN NEWLY INDUSTRIALIZING COUNTRIES 93
Chang, In-Hyub: 1985, ‘South Korea’, in J. Dixon and H. S. Kim (eds.), SocialWelfare in Asia (Croom Helm, New Hampshire), pp. 176–213.
Chiu, Sammy and Raymond Ngan: 1993, ‘The production of inequality in socialsecurity provisions in Hong Kong’, in Social Security in The Nineties – Chal-lenges and Prospects: Reflections on the Connection Between Social Securityand Poverty (Council of Social Service, Hong Kong).
Chiuo, J.: 1996, ‘A dominance evaluation of Taiwan’s official income distributionstatistics, 1976–1992’, China Economic Review 7(1), pp. 57–75.
Chowdbury, Anis and Iyanatul Islam: 1993, The Newly Industralizing Economiesof East Asia (Routledge, New York).
Clark, C. and S. Chan: 1995, ‘State, market and dependency in Taiwan’s Devel-opment’, Journal of the Third World Spectrum, spring, pp. 19–45.
Deyo, Frederic C.: 1987, The Political Economy of the New Asian Industrialism(Ithaca, Cornell University Press, New York).
Deyo, Frederic C.: 1992, ‘The political economy of social policy formation: EastAsia’s newly industrializing countries’, in R. P. Appelbaum and Jeffrey Hen-derson (eds.), State and Development in the Asian Pacific Rim (Sage, NewburyPark), pp. 289–306.
Dreze, J. and A. Sen: 1991, ‘Public action for social security: Foundations andstrategy’, in E. Ahmad et al. (eds), Social Security in Developing Countries(Clarendon, Oxford), pp. 1–40.
Drover, Glenn: 1981, Inequality: Essays on the Political Economy of Canada(Toronto: University of Toronto Press).
Drysdale, P. and Y. Huang: 1995, ‘Growth, energy and the environment: Newchallenges for the Asian-Pacific economy’, Asian-Pacific Economic Literature9(2), November, pp. 1–13.
Far Eastern Economic Review: 1995, State Expectations: Poor Want A HelpingHand, Not An Invisible One. November 9 Issue.
Fields, Gary: 1984, ‘Employment, income distribution and economic growth inseven small open economies’, Economic Journal 94, pp. 74–83.
Fields, Gary: 1991, ‘Growth and income distribution’, in G. Psacharopoulos (ed.),Essays on Poverty, Equity and Growth (Pergamon Press, Oxford).
Fields, Gary: 1994, ‘Poverty changes in developing countries’, in Rolph vander Hoeven and Richard Anker (eds.), Poverty Monitoring: An InternationalConcern (St. Martin’s Press, New York), pp. 3–14.
Gold, Thomas: 1986, State and Society in the Taiwan Miracle (Sharpe, New York).Haggard, S.: 1990, Pathways from the periphery: The politics of growth in the
Newly Industrializing Countries (Cornell University Press, Ithaca).Hardiman, M. and J. Midgley: 1989, The Social Dimensions of Development
(Wiley, London).Hart-Landsberg,Martin: 1993, The Rush to Development (Monthly Review Press,
New York).Henderson, Jeffrey: 1993, ‘The role of the state in the economic transformation of
East Asia’, in Chris Dixon and D. Drakakis-Smith (eds.), Economic and SocialDevelopment in Pacific Area (Routledge, New York), pp. 85–114.
Heritage Foundation: 1996, Wall Street Journal Index of Economic Freedom 1997(Heritage Foundation, Washington DC).
Hofferbert, R. I.: 1990, The Reach and Grasp of Policy Analysis (University ofAlabam, Tuscaloosa).

94 KWONG-LEUNG TANG
Hsia, R. and L. Chau: 1978, Industrialization, Employment and Income Distribu-tion (Croom Helm, London).
Islam, Iyanatul and Colin Kirkpatrick: 1986, ‘Export-led development labour-market conditions and the distribution of income: The case of Singapore’, Cam-bridge Journal of Economics 10, pp. 113–127.
International Monetary Fund: 1995, Government Finance Statistics Yearbook(IMF, Washington).
Jenkins, R.: 1991, ‘The political economy of industralization: A comparison ofLatin American and East Asian newly industrializing countries’, Developmentand Change 22, pp. 197–231.
Johansen, Frida: 1993, Poverty Reduction in East Asia: the Silent Revolution(World Bank Discussion Paper, Washington DC).
Jones, Catherine: 1993, ‘The Pacific challenge’, in New Perpsectives on the Wel-fare State in Europe (Routledge, London), pp. 198–217.
Kaim-Caudle, P. R.: 1973, Comparative Social Policy and Social Security (MartinRobertson, London).
Kanbur, Rvai: 1994, ‘The Human Development Report and the World Develop-ment Report 1990’, in Rolph van der Hoevan et al. (eds.), Poverty Monitoring:An International Concern (St. Martin’s Press, New York).
Kim, Kihwan and Danny M. Leipzier: 1993, The Lessons of East Asia: Korea, ACase of Government-Led Development (World Bank, Washington DC).
Korpi, W.: 1985, ‘Economic growth and the welfare state: Leaky bucket or irriga-tion system’, Euorpean Sociological Review 1(2), pp. 97–1118.
Krueger, A.: 1995, ‘East Asian experience and endogenous growth theory’, in T.Ito and A. Krueger (eds.), Growth Theories in Light of the East Asian Experience(Chicago University Press, Chicago), pp. 9–36.
Ku, Yeun-wen: 1995, ‘The development of state welfare in the Asian NICs withspecial reference to Taiwan’, Social Policy and Administration 29(4), pp. 345–356.
Kurian, George (ed.): 1992, Encyclopaedia of the Third World. Vols. 1–3, 4thEdition (Facts on File Ltd., London).
Leipzier, D. M., D. Dollar, A. F. Shorrocks and S. Y. Song: 1992, Distribution ofIncome and Welfare in Korea (Economic Development Institute, World Bank,Washington DC).
Lim, Chong-Yah et al.: 1988, Policy Options for the Singapore Economy(McGraw-Hill, Singapore).
Lim, Linda, E. F. Pang and R. Findlay: 1993, ‘Singapore’, in R. Findlay andS. Wellisz (eds.), Five Small Open Economies (Oxford University Press, NewYork), pp. 93–139.
Lin, Wan-I: 1991, ‘The structural determinants of welfare effort in Post-war Tai-wan’, International Social Work 34, pp. 171–190.
MacPherson, Steward: 1987, ‘Social security in developing countries’, SocialPolicy and Administration 21(1), pp. 3–13.
MacPherson, Stewart: 1992, ‘Social policy and economic change in the AsiaPacific region’, Social Policy and Administration 26(1), pp. 55–61.
Meerman, J.: 1979, Public Expenditure in Malaysia (Oxford University Press,Oxford).
Midgley, James: 1984, Social Security, Inequality and the Third World (JohnWiley & Sons, New York).

EAST ASIAN NEWLY INDUSTRIALIZING COUNTRIES 95
Midgley, James: 1986, ‘Industrialization and welfare: The case of the four littletigers’, Social Policy and Administration 20(3), pp. 225–237.
Midgley, James: 1992, ‘Development theory, the state, and social development inAsia’, Social Development Issues 14, pp. 22–36.
Midgley, James: 1994, ‘Defining social development: Historical trends and con-ceptual formulations’, Social Development Issues 16, pp. 3–19.
Mitchell, Deborah: 1991, Income Transfers in Ten Welfare States (Avebury, Alder-shot).
Mok, H. T. K.: 1994, Poverty in Hong Kong and Social Secuirty (Chung WahBook, Hong Kong) (in Chinese).
Musgrave, R. A., K. E. Case and H. Leonard: 1974, ‘The distribution of fisualburdens and benefits’, Public Finance Quarterly 2, pp. 259–311.
Mydral, G.: 1968, Asian Drama: An Enquiry into the Poverty of Nations (Penguin,Harmondsworth).
Organization of Economic Cooperation and Development: 1986, Living Condi-tions in OECD Countries: A Compendium of Social Indicators (OECD, Paris).
Oxfam Hong Kong: 1997, Research on Expenditure Patterns of Low ExpenditureHouseholds in Hong Kong (Oxfam: Hong Kong).
Pae, Sung Moon: 1992, Korea Leading Developing Nations: Economy, Democ-racy, and Welfare (University Press of America, New York).
Palley, H. A. and C. Usui: 1995, ‘Social policies for the elderly in the Republic ofKorea and Japan: A comparative perspective’, Social Policy and Administration29(3), pp. 241–257.
Pang, Eng Fong: 1975, ‘Growth, Inequality and Race in Singapore’, InternationalLabour Review 3, pp. 15–28.
Paukert, F.: 1973, ‘Income distribution at different levels of development’, Inter-national Labour Review 108, pp. 97–125.
Pfaller, A., I. Gough and G. Therborn: 1991, Can the Welfare State Compete?(Macmillan, London).
Ramesh, M.: 1995, ‘Social security in South Korea and Singapore: Explaining thedifference’, Social Policy and Administration 29(3), pp. 228–240.
Rao, V. V. Bhanoji and M. K. Ramakrishnan: 1980, Income Inequality in Singa-pore: Impact of Economic Growth and Structural Change 1966–1975 (SingaporeUniversity Press, Singapore).
Sarker, P. C. and A. P. Gaur: 1994, ‘Socio-economic and human development inSouth and East Asian countries’, Asian-Pacific Development Journal, pp. 73–91.
Scitovsky, Tibor: 1990, ‘Economic development in Taiwan and South Korea,1965–1981’, in Lawrence J. Lau (ed.), Models of Development (ICS Press, SanFrancisco, California), pp. 127–182.
Selowksy, M.: 1979, Who Benefits from Government Expenditure? (Oxford Uni-veristy Press, Oxford).
Straits Times: 1995, Prime Minister Spells Out Way of Government, SingaporeStyle, September 23.
Sundrum, R. M.: 1990, Income Distribution in Less Developed Countries (Rout-ledge, London).
Synder, M. C. and M. Tadesse: 1995, African Women and Development (ZedBook, London).

96 KWONG-LEUNG TANG
Tang, Kwong-leung: 1996, ‘Social security and social development: East AsianNewly Industrializing Countries (NICs)’, Canadian Review of Social Policy 38,pp. 56–71.
Tang, Kwong-leung: 1977, ‘Social Welfare As An Inhibitor of Economic Growth?Evidence from Asia’, Social Development Issues, December.
Tsang, Shiu-kei: 1991, ‘A contributory social security scheme for Hong Kong:An economic perspective’, in Social Security Society (ed.), Commentary onSocial Security in Hong Kong (Social Security Society, Hong Kong), pp. 3–12(in Chinese).
United Nations: 1993, Report on the World Social Situation 1993 (United Nations,New York).
United Nations: 1994, Statistical Yearbook for Asia and the Pacific (UnitedNations, New York).
United Nations Development Project: 1994, Human Development Report 1994(United Nations, New York).
Williamson, J. B. and F. Pampel: 1993, Old-age Security in Comparative Perspec-tive (Oxford University Press, New York).
World Bank: 1992, World Development Report 1992 (World Bank, WashingtonDC).
World Bank: 1995, Trends in Developing Economies (Oxford University Press,New York).
Social Work ProgrameUniversity of Northern British ColumbiaPrince George, BC