Embed Size (px)
Citation preview

PROGNOSTIC AND PREDICTIVE BIOMARKERS IN HEAD & NECK CANCER
Lisa Licitra, MD and Salvatore Alfieri, MD
Fondazione IRCCS-Istituto Nazionale dei Tumori, Milan, Italy
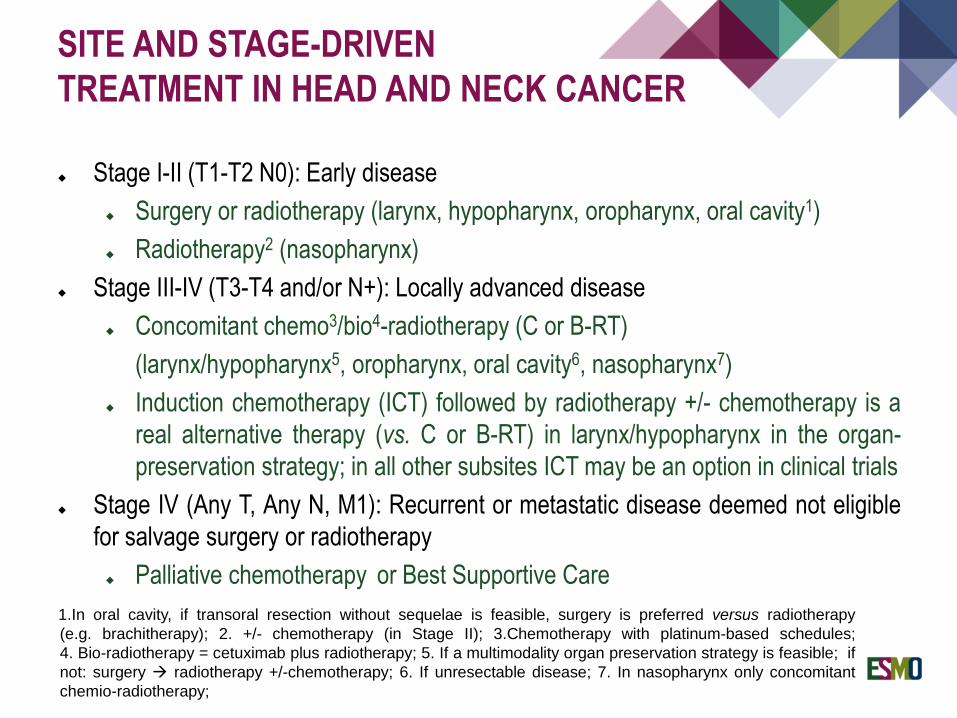
Stage I-II (T1-T2 N0): Early disease
Surgery or radiotherapy (larynx, hypopharynx, oropharynx, oral cavity1)
Radiotherapy2 (nasopharynx)
Stage III-IV (T3-T4 and/or N+): Locally advanced disease
Concomitant chemo3/bio4-radiotherapy (C or B-RT)
(larynx/hypopharynx5, oropharynx, oral cavity6, nasopharynx7)
Induction chemotherapy (ICT) followed by radiotherapy +/- chemotherapy is a
real alternative therapy (vs. C or B-RT) in larynx/hypopharynx in the organ-
preservation strategy; in all other subsites ICT may be an option in clinical trials
Stage IV (Any T, Any N, M1): Recurrent or metastatic disease deemed not eligible
for salvage surgery or radiotherapy
Palliative chemotherapy or Best Supportive Care
SITE AND STAGE-DRIVEN
TREATMENT IN HEAD AND NECK CANCER
1.In oral cavity, if transoral resection without sequelae is feasible, surgery is preferred versus radiotherapy
(e.g. brachitherapy); 2. +/- chemotherapy (in Stage II); 3.Chemotherapy with platinum-based schedules;
4. Bio-radiotherapy = cetuximab plus radiotherapy; 5. If a multimodality organ preservation strategy is feasible; if
not: surgery radiotherapy +/-chemotherapy; 6. If unresectable disease; 7. In nasopharynx only concomitant
chemio-radiotherapy;
A prognostic biomarker indicates the likely course of the disease in untreated
patients (or regardless of treatment)
A predictive biomarker identifies subpopulations of patients, who are most likely to
respond to a given therapy
PROGNOSTIC AND PREDICTIVE
BIOMARKERS
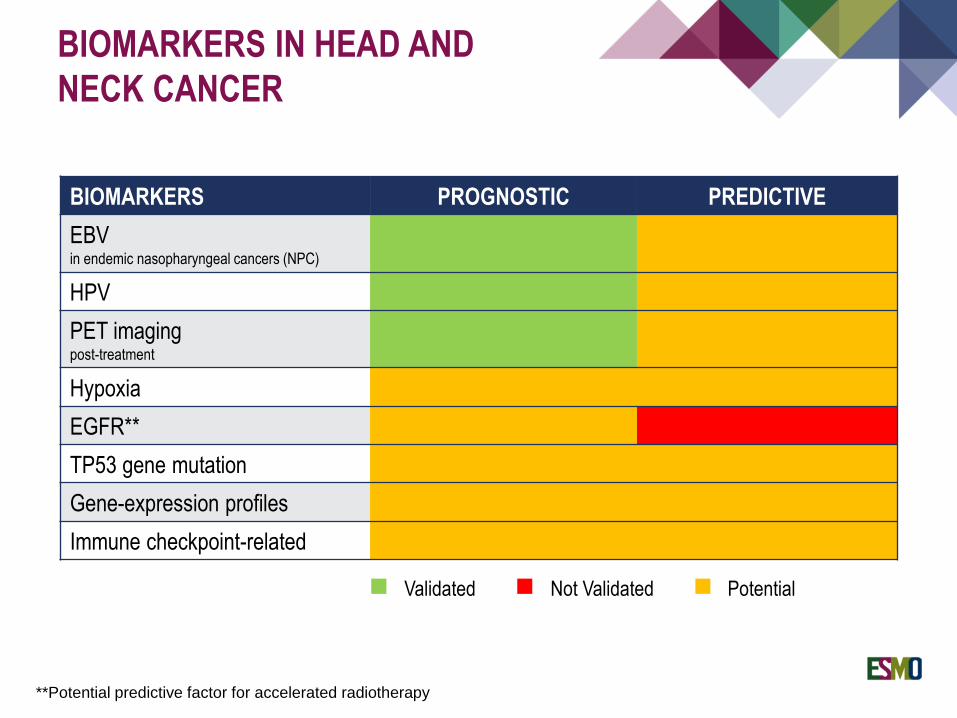
BIOMARKERS PROGNOSTIC PREDICTIVE
EBVin endemic nasopharyngeal cancers (NPC)
HPV
PET imagingpost-treatment
Hypoxia
EGFR**
TP53 gene mutation
Gene-expression profiles
Immune checkpoint-related
Validated Not Validated Potential
**Potential predictive factor for accelerated radiotherapy
BIOMARKERS IN HEAD AND
NECK CANCER
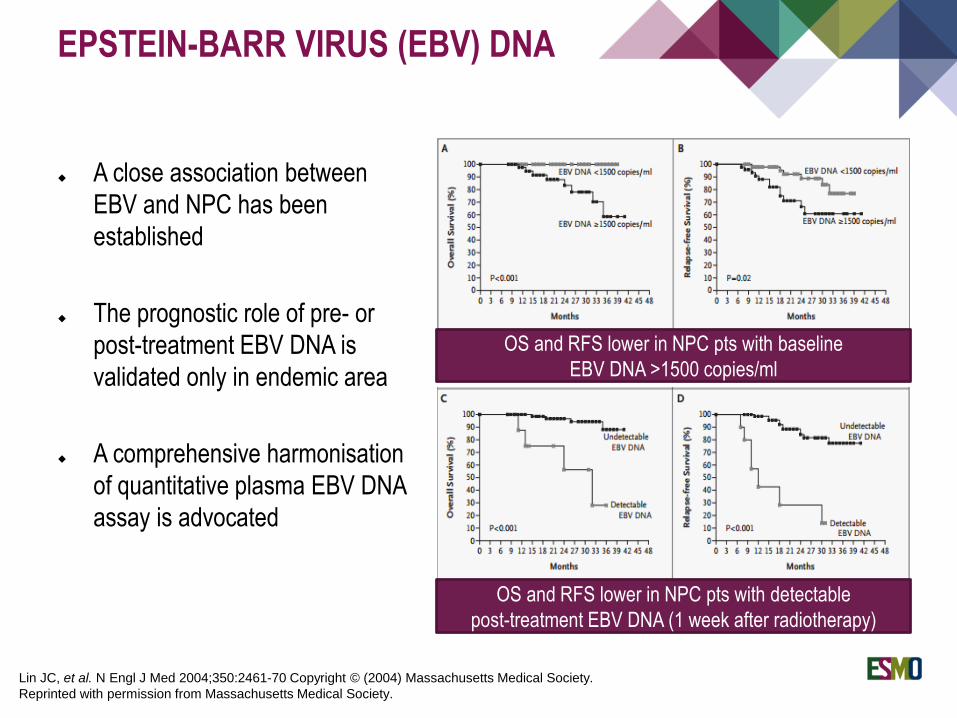
A close association between
EBV and NPC has been
established
The prognostic role of pre- or
post-treatment EBV DNA is
validated only in endemic area
A comprehensive harmonisation
of quantitative plasma EBV DNA
assay is advocated
EPSTEIN-BARR VIRUS (EBV) DNA
OS and RFS lower in NPC pts with baseline
EBV DNA >1500 copies/ml
OS and RFS lower in NPC pts with detectable
post-treatment EBV DNA (1 week after radiotherapy)
Lin JC, et al. N Engl J Med 2004;350:2461-70 Copyright © (2004) Massachusetts Medical Society.
Reprinted with permission from Massachusetts Medical Society.

EPSTEIN-BARR VIRUS (EBV) DNA
OS and RFS lower in NPC pts with:
Baseline EBV-DNA > 4000 cps/ml + post-treatment EBV-DNA > 500 cps/ml
(post-treatment EBV-DNA detected 6-8 weeks after ending radiotherapy)
The cutoff of 4000 copies/ml for baseline EBV DNA was also identified as predictive value of
post-treatment distant failure in patients with early-stage (I-II) nasopharyngeal
carcinoma of undifferentiated type (Leung SF, Cancer 2003)
Chan ATC, et al. Journal of the National Cancer Institute, Vol. 94, No. 21, November 6, 2002, by permission of Oxford University Press
Bathia A and Burtness B, JCO September 8, 2015
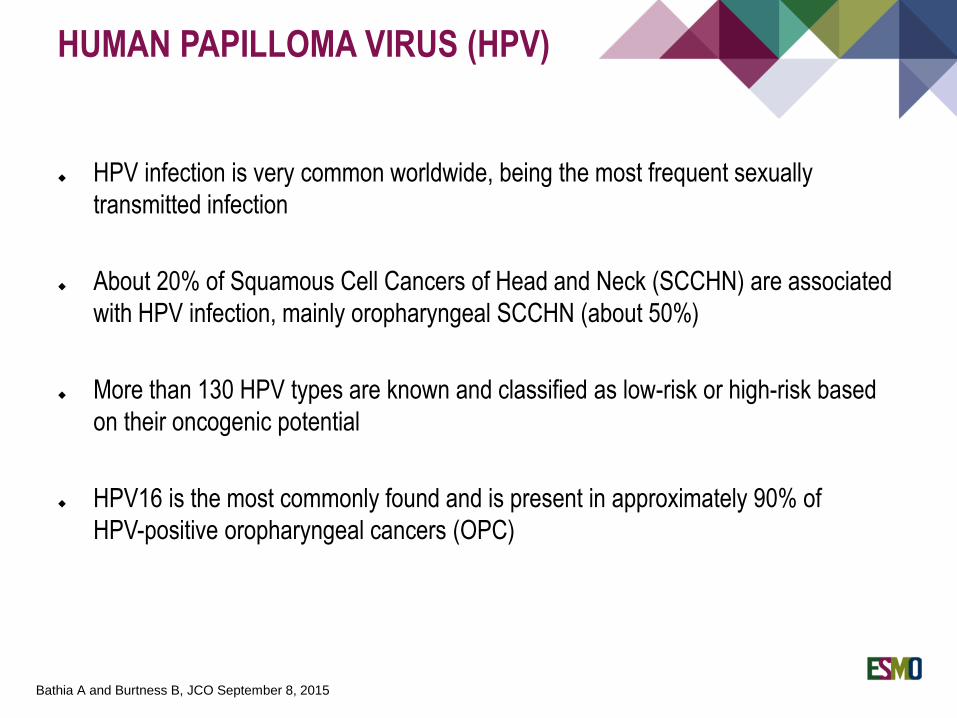
HPV infection is very common worldwide, being the most frequent sexually
transmitted infection
About 20% of Squamous Cell Cancers of Head and Neck (SCCHN) are associated
with HPV infection, mainly oropharyngeal SCCHN (about 50%)
More than 130 HPV types are known and classified as low-risk or high-risk based
on their oncogenic potential
HPV16 is the most commonly found and is present in approximately 90% of
HPV-positive oropharyngeal cancers (OPC)
HUMAN PAPILLOMA VIRUS (HPV)
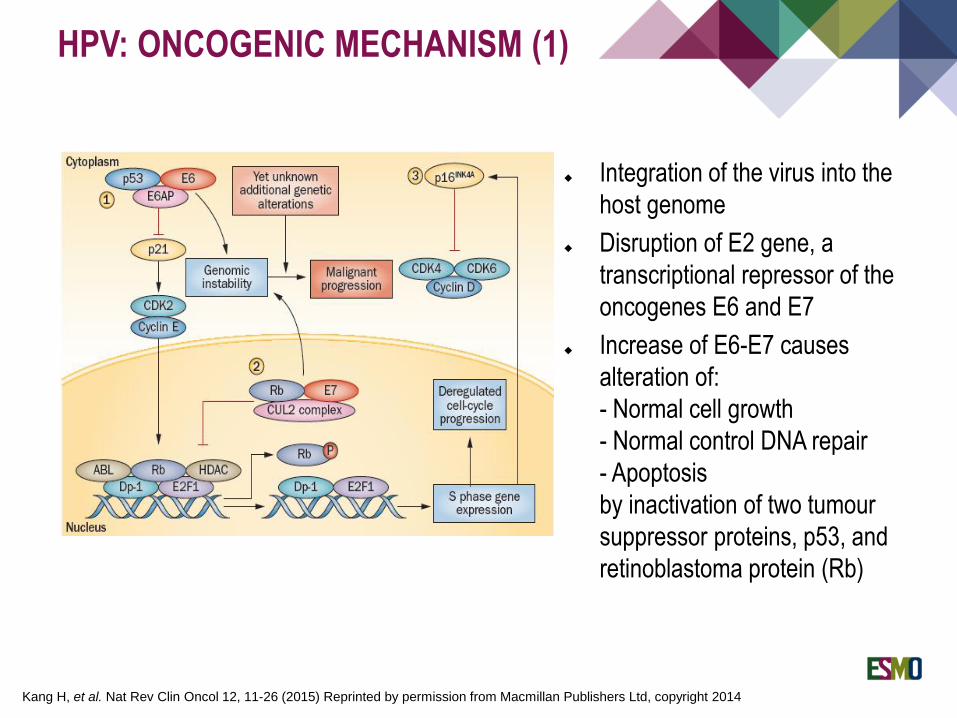
Integration of the virus into the
host genome
Disruption of E2 gene, a
transcriptional repressor of the
oncogenes E6 and E7
Increase of E6-E7 causes
alteration of:
- Normal cell growth
- Normal control DNA repair
- Apoptosis
by inactivation of two tumour
suppressor proteins, p53, and
retinoblastoma protein (Rb)
HPV: ONCOGENIC MECHANISM (1)
Kang H, et al. Nat Rev Clin Oncol 12, 11-26 (2015) Reprinted by permission from Macmillan Publishers Ltd, copyright 2014

HPV: ONCOGENIC MECHANISM (2)
Increase of E6-E7 causes:Blacklog of protein p16as part of a feedback loop attempting to applythe brakes to cell proliferation
Despite accumulation of p16, E7 overcomes its inhibitory effects via redundant pathways
Accumulation of p16:
- can serve to distinguish the two
different types of OSCCs, HPV-
induced and no HPV-related
- is a good surrogate marker of
HPV positivity (very high
sensitivity rate approching about
100% even if it does not warrant
of HPV-DNA integrated in the
host-genome
Reprinted from Gillison ML, et al. Semin Oncol 2004;31:744–54. Copyright 2004, with permission from Elsevier
HPV-induced OSCCs Tobacco/alcohol-induced OSCCs
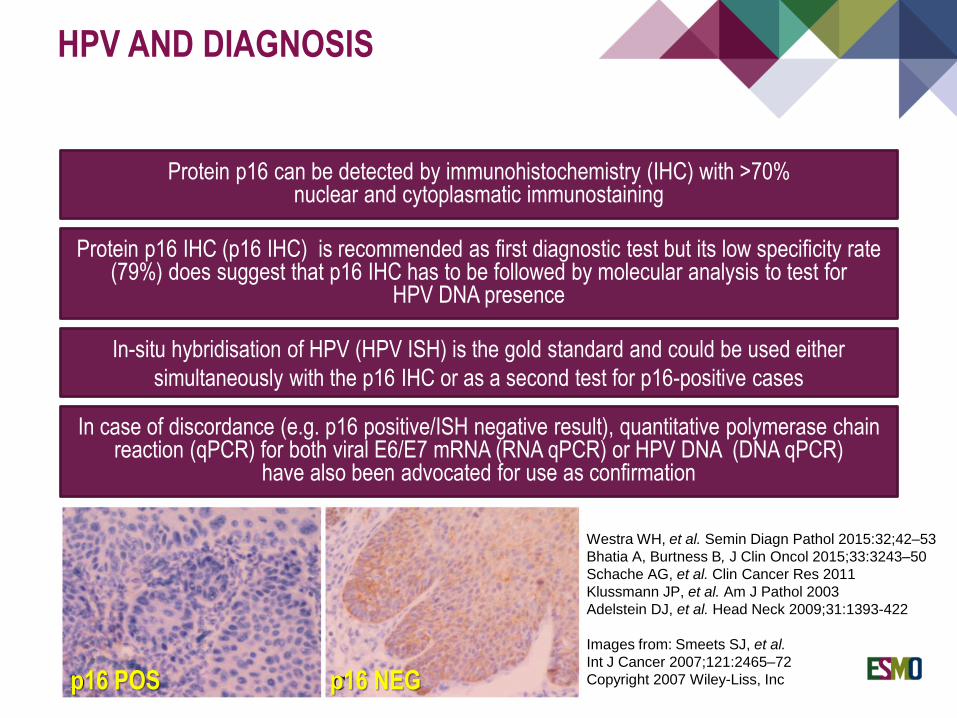
HPV AND DIAGNOSIS
Westra WH, et al. Semin Diagn Pathol 2015:32;42–53
Bhatia A, Burtness B, J Clin Oncol 2015;33:3243–50
Schache AG, et al. Clin Cancer Res 2011
Klussmann JP, et al. Am J Pathol 2003
Adelstein DJ, et al. Head Neck 2009;31:1393-422
Images from: Smeets SJ, et al.
Int J Cancer 2007;121:2465–72
Copyright 2007 Wiley-Liss, Inc
Protein p16 can be detected by immunohistochemistry (IHC) with >70% nuclear and cytoplasmatic immunostaining
Protein p16 IHC (p16 IHC) is recommended as first diagnostic test but its low specificity rate (79%) does suggest that p16 IHC has to be followed by molecular analysis to test for
HPV DNA presence
In case of discordance (e.g. p16 positive/ISH negative result), quantitative polymerase chainreaction (qPCR) for both viral E6/E7 mRNA (RNA qPCR) or HPV DNA (DNA qPCR)
have also been advocated for use as confirmation
In-situ hybridisation of HPV (HPV ISH) is the gold standard and could be used either
simultaneously with the p16 IHC or as a second test for p16-positive cases
p16 NEGp16 POS
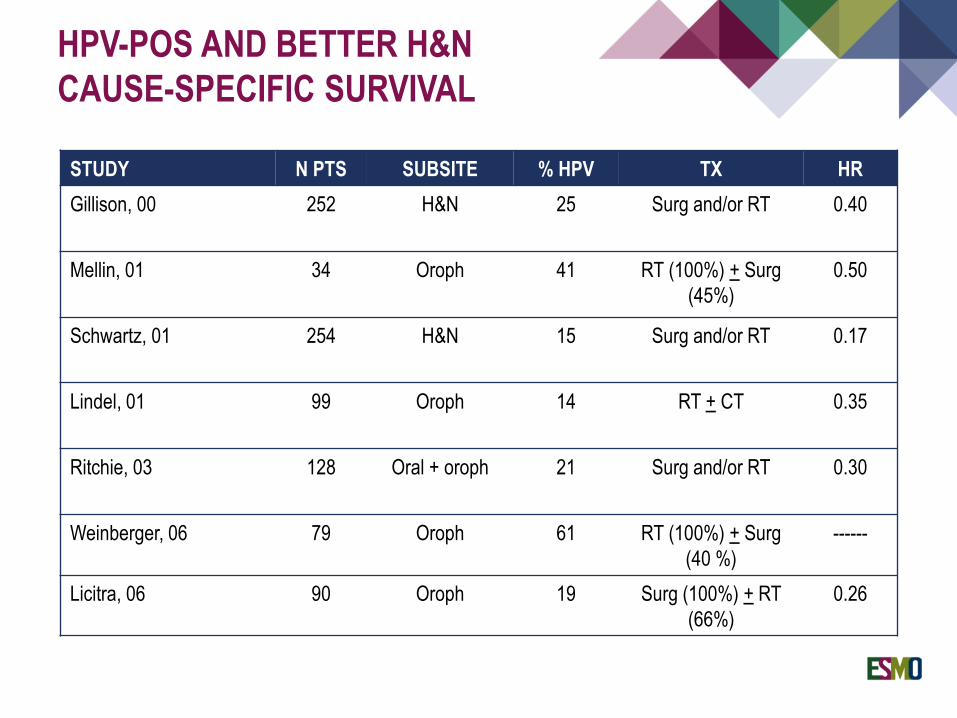
HPV-POS AND BETTER H&N
CAUSE-SPECIFIC SURVIVAL
STUDY N PTS SUBSITE % HPV TX HR
Gillison, 00 252 H&N 25 Surg and/or RT 0.40
Mellin, 01 34 Oroph 41 RT (100%) + Surg
(45%)
0.50
Schwartz, 01 254 H&N 15 Surg and/or RT 0.17
Lindel, 01 99 Oroph 14 RT + CT 0.35
Ritchie, 03 128 Oral + oroph 21 Surg and/or RT 0.30
Weinberger, 06 79 Oroph 61 RT (100%) + Surg
(40 %)
------
Licitra, 06 90 Oroph 19 Surg (100%) + RT
(66%)
0.26
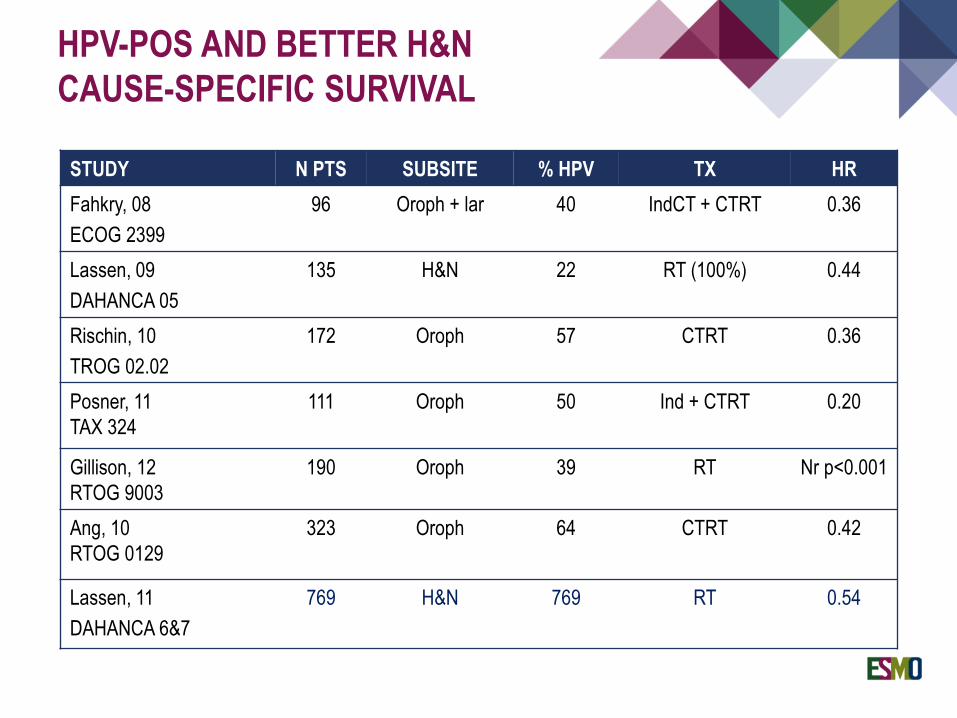
HPV-POS AND BETTER H&N
CAUSE-SPECIFIC SURVIVAL
STUDY N PTS SUBSITE % HPV TX HR
Fahkry, 08
ECOG 2399
96 Oroph + lar 40 IndCT + CTRT 0.36
Lassen, 09
DAHANCA 05
135 H&N 22 RT (100%) 0.44
Rischin, 10
TROG 02.02
172 Oroph 57 CTRT 0.36
Posner, 11
TAX 324
111 Oroph 50 Ind + CTRT 0.20
Gillison, 12
RTOG 9003
190 Oroph 39 RT Nr p<0.001
Ang, 10
RTOG 0129
323 Oroph 64 CTRT 0.42
Lassen, 11
DAHANCA 6&7
769 H&N 769 RT 0.54
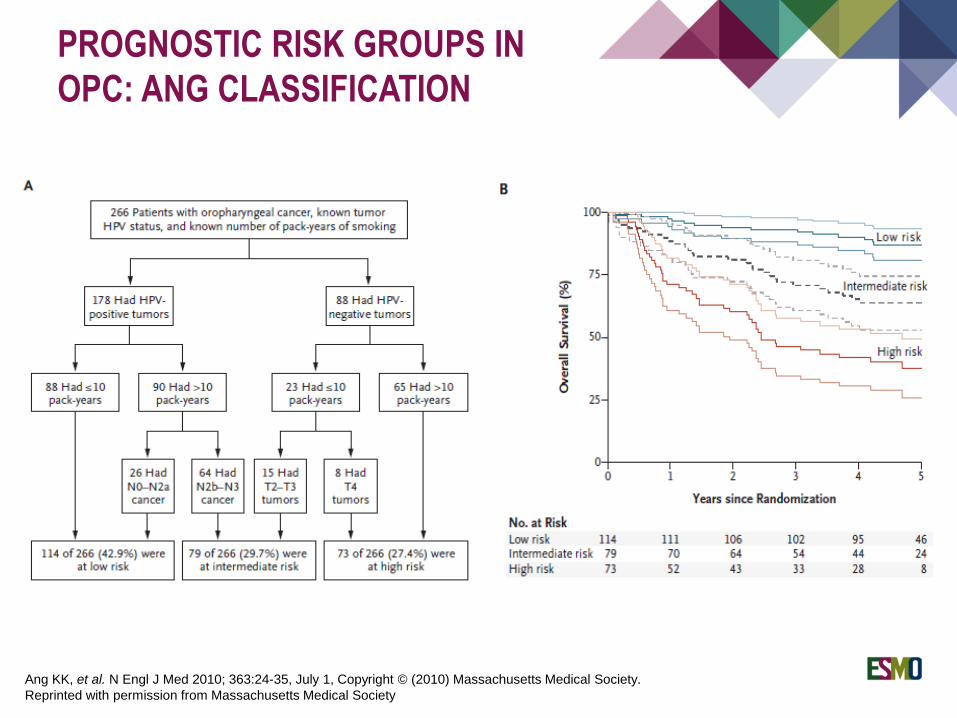
PROGNOSTIC RISK GROUPS IN
OPC: ANG CLASSIFICATION
Ang KK, et al. N Engl J Med 2010; 363:24-35, July 1, Copyright © (2010) Massachusetts Medical Society.
Reprinted with permission from Massachusetts Medical Society
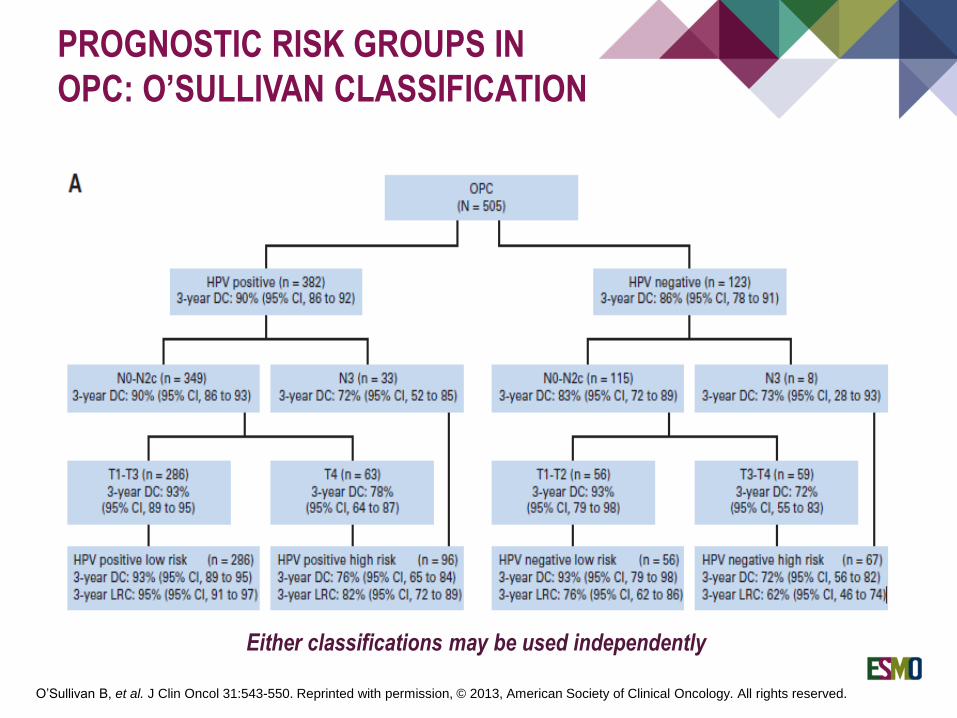
PROGNOSTIC RISK GROUPS IN
OPC: O’SULLIVAN CLASSIFICATION
O’Sullivan B, et al. J Clin Oncol 31:543-550. Reprinted with permission, © 2013, American Society of Clinical Oncology. All rights reserved.
Either classifications may be used independently
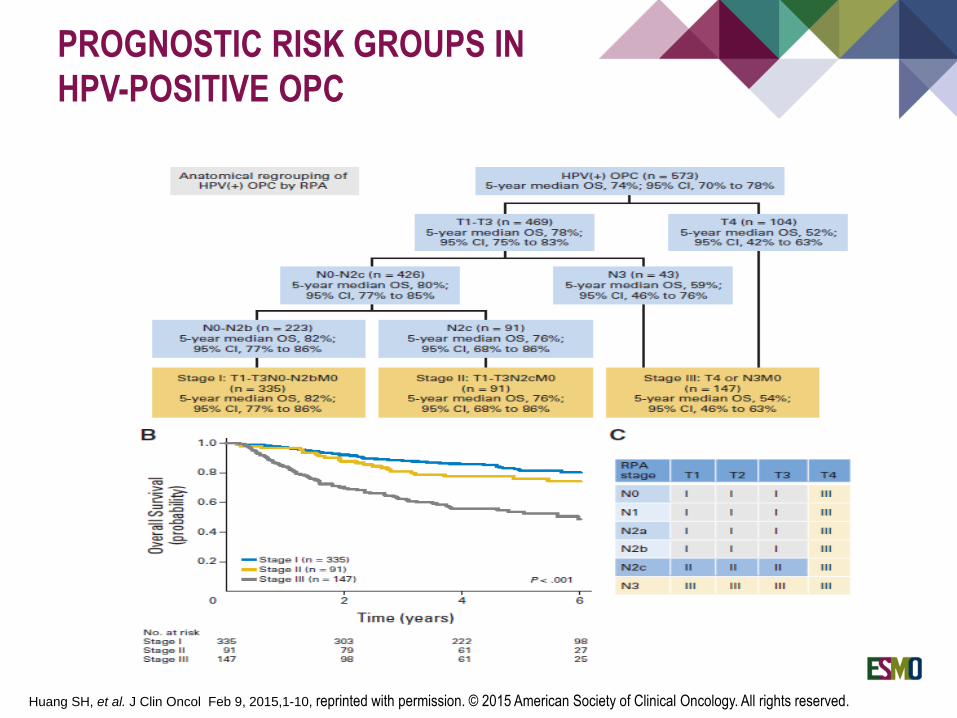
PROGNOSTIC RISK GROUPS IN
HPV-POSITIVE OPC
Huang SH, et al. J Clin Oncol Feb 9, 2015,1-10, reprinted with permission. © 2015 American Society of Clinical Oncology. All rights reserved.
*
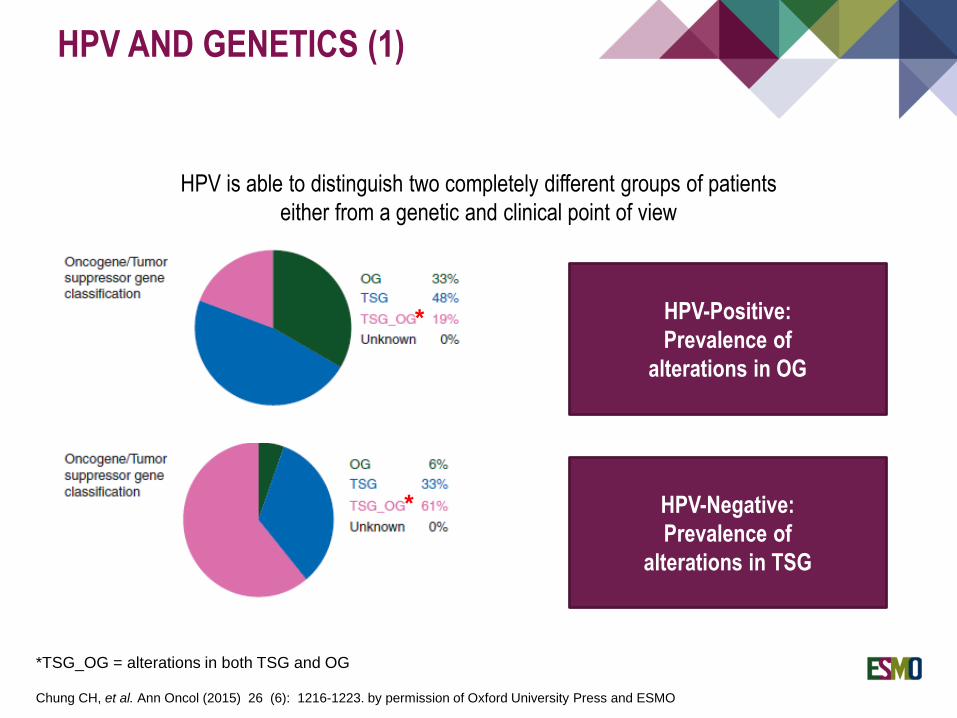
*TSG_OG = alterations in both TSG and OG
HPV-Positive:
Prevalence of
alterations in OG
HPV-Negative:
Prevalence of
alterations in TSG
*
Chung CH, et al. Ann Oncol (2015) 26 (6): 1216-1223. by permission of Oxford University Press and ESMO
HPV is able to distinguish two completely different groups of patients
either from a genetic and clinical point of view
HPV AND GENETICS (1)
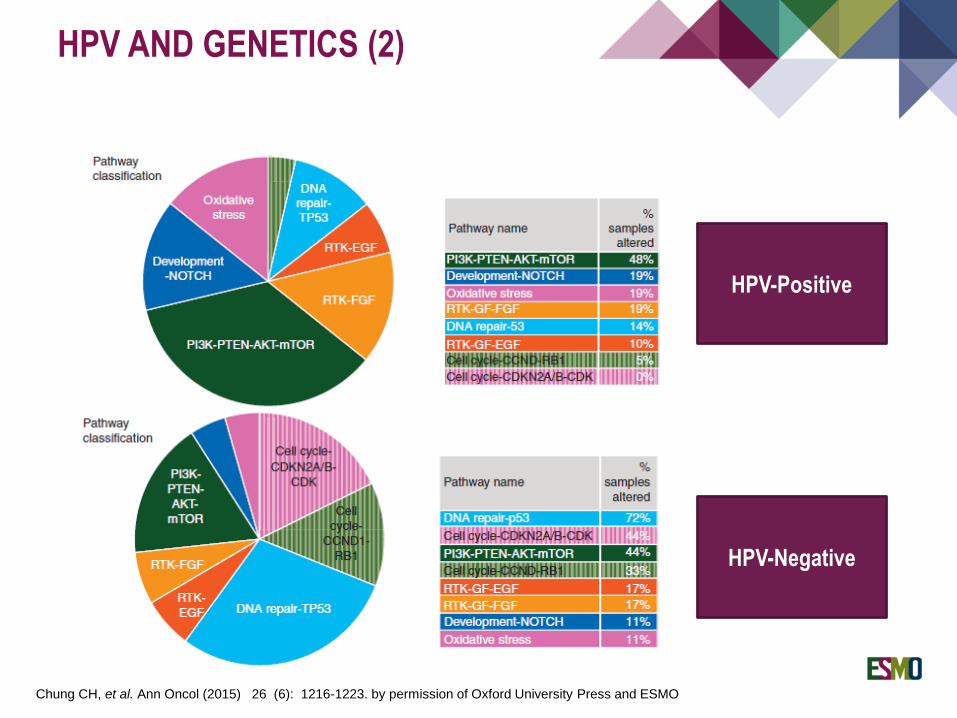
Chung CH, et al. Ann Oncol (2015) 26 (6): 1216-1223. by permission of Oxford University Press and ESMO
HPV-Positive
HPV-Negative
HPV AND GENETICS (2)
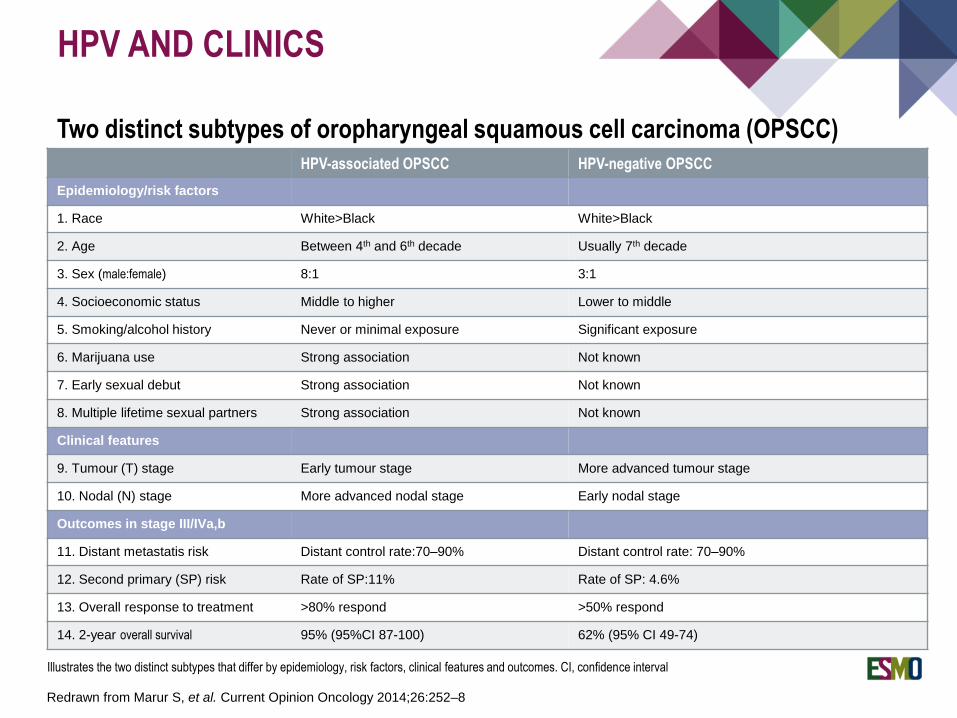
HPV AND CLINICS
HPV-associated OPSCC HPV-negative OPSCC
Epidemiology/risk factors
1. Race White>Black White>Black
2. Age Between 4th and 6th decade Usually 7th decade
3. Sex (male:female) 8:1 3:1
4. Socioeconomic status Middle to higher Lower to middle
5. Smoking/alcohol history Never or minimal exposure Significant exposure
6. Marijuana use Strong association Not known
7. Early sexual debut Strong association Not known
8. Multiple lifetime sexual partners Strong association Not known
Clinical features
9. Tumour (T) stage Early tumour stage More advanced tumour stage
10. Nodal (N) stage More advanced nodal stage Early nodal stage
Outcomes in stage III/IVa,b
11. Distant metastatis risk Distant control rate:70–90% Distant control rate: 70–90%
12. Second primary (SP) risk Rate of SP:11% Rate of SP: 4.6%
13. Overall response to treatment >80% respond >50% respond
14. 2-year overall survival 95% (95%CI 87-100) 62% (95% CI 49-74)
Two distinct subtypes of oropharyngeal squamous cell carcinoma (OPSCC)
Illustrates the two distinct subtypes that differ by epidemiology, risk factors, clinical features and outcomes. CI, confidence interval
Redrawn from Marur S, et al. Current Opinion Oncology 2014;26:252–8
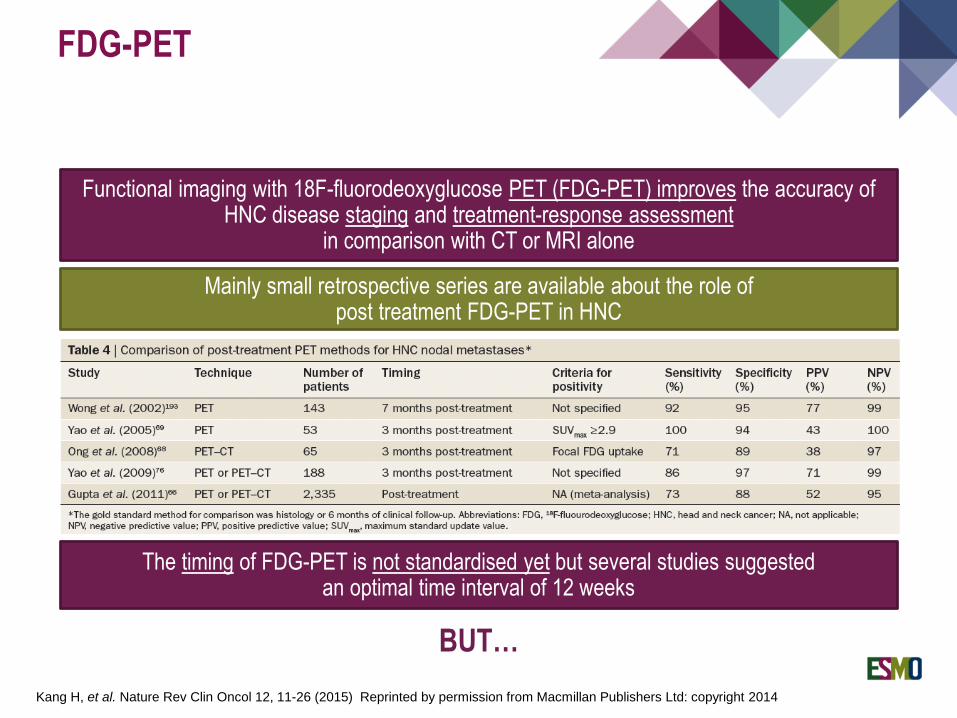
FDG-PET
Mainly small retrospective series are available about the role of post treatment FDG-PET in HNC
Kang H, et al. Nature Rev Clin Oncol 12, 11-26 (2015) Reprinted by permission from Macmillan Publishers Ltd: copyright 2014
Functional imaging with 18F-fluorodeoxyglucose PET (FDG-PET) improves the accuracy of HNC disease staging and treatment-response assessment
in comparison with CT or MRI alone
The timing of FDG-PET is not standardised yet but several studies suggested an optimal time interval of 12 weeks
BUT…
FDG-PET
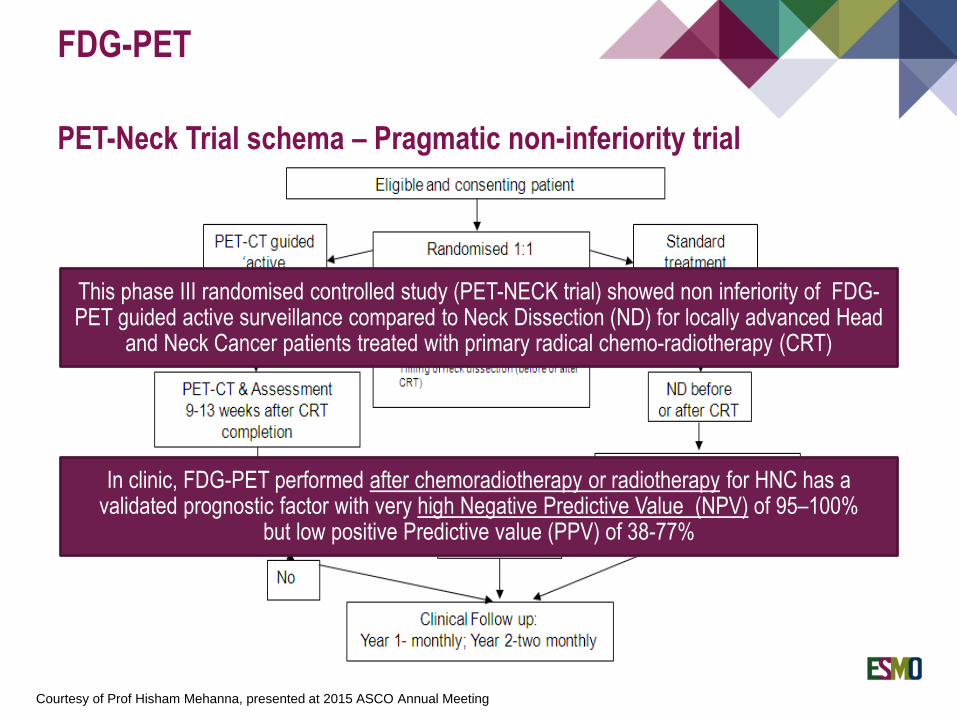
PET-Neck Trial schema – Pragmatic non-inferiority trial
Courtesy of Prof Hisham Mehanna, presented at 2015 ASCO Annual Meeting
This phase III randomised controlled study (PET-NECK trial) showed non inferiority of FDG-PET guided active surveillance compared to Neck Dissection (ND) for locally advanced Head
and Neck Cancer patients treated with primary radical chemo-radiotherapy (CRT)
In clinic, FDG-PET performed after chemoradiotherapy or radiotherapy for HNC has a validated prognostic factor with very high Negative Predictive Value (NPV) of 95–100%
but low positive Predictive value (PPV) of 38-77%
Tumour hypoxia is a marker of poor prognosis in head and neck cancer
An in vitro model of tumour radiosensitivity was used to create a 10-gene
radiosensitivity index (RSI) and this index is a potential clinical prognostic marker
for locoregional control in patients with head and neck cancer treated with
concurrent chemoradiotherapy
Kasper Toustrup (DAHANCA1) identified a gene-expression classifier, consisting of
15 hypoxia-related genes, able to predict for hypoxic radiotherapy-induced
modifications in head and neck squamous cell cancer (Cancer Res, 2011). More
hypoxic tumours, found by this signature, had benefit in terms of DSS* and LRC**
when treated with nimorazole, which is a hypoxic modifier drug, versus placebo
(Radiother Oncol, 2012).
Very high potential use of hypoxia-related biomarkers as predictive factors of
response to radiotherapy
HYPOXIA
Do we have other tools to predict hypoxia and its related radiotherapy response?
1Danish Head and Neck Cancer Group; DSS* Disease Specific Survival; LRC** Loco-Regional Control

Functional imaging modalities such as:
Dynamic Contrast-Enhanced Magnetic Resonance Imaging (DCE-MRI)
Apparent Diffusion Coefficient Magnetic Resonance Imaging (ADC-MRI)
Diffusion-Weighted Magnetic Resonance Imaging (DWI-MRI)
PET with following tracers:
18F-fluoromisonidazolo (FMISO)
18Fluoroazomycin arabinoside (FAZA)
HYPOXIA
…and so the BiGART (Biology-guided Adaptative Radiotherapy) was born
Grau C, et al. Acta Oncologica 2013; Hugo JWL, et al. Nature 2013; Chang JH, et al. Acta Oncologica 2013; Heijmen L, et al. CROH 2012
showed promising results in identifying hypoxia, proliferation,
cell density and the sequential radio-resistance/response thus
better guiding the radiotherapy treatment and decoding
the tumour phenotype by a radiomics approach
The Epidermal Growth Factor Receptor (EGFR) has been studied as:
EGFR protein expression*
EGFR protein activation (phospfhorylated EGFR, pEGFR)
EGFR gene copy number*
EGFR polymorphisms
EGFR mutation
EGFR
*Better studied
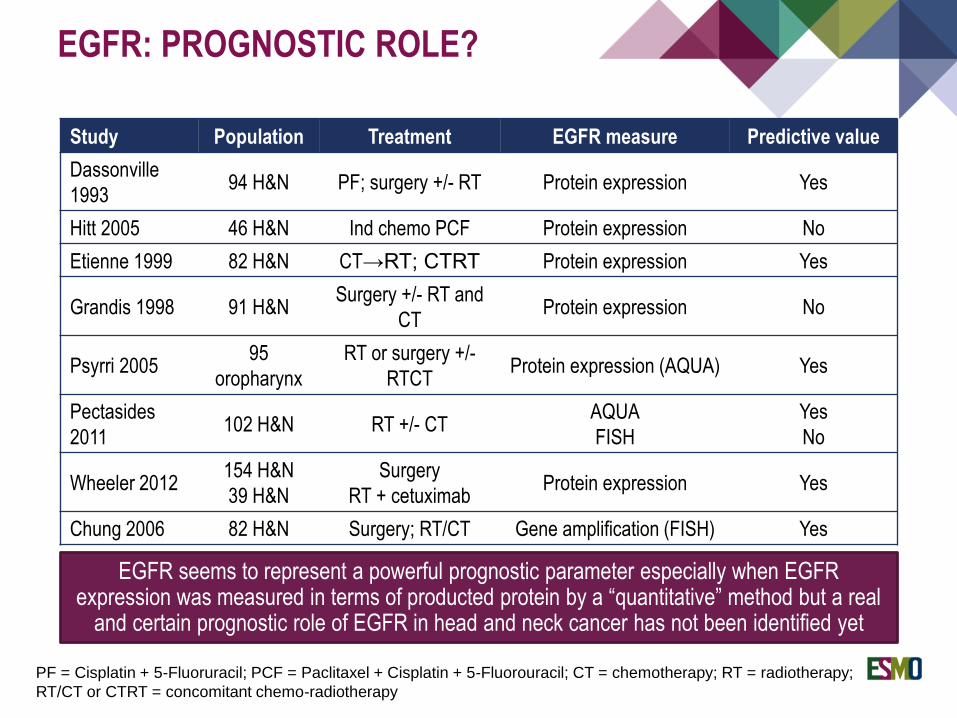
Study Population Treatment EGFR measure Predictive value
Dassonville
199394 H&N PF; surgery +/- RT Protein expression Yes
Hitt 2005 46 H&N Ind chemo PCF Protein expression No
Etienne 1999 82 H&N CT→RT; CTRT Protein expression Yes
Grandis 1998 91 H&NSurgery +/- RT and
CTProtein expression No
Psyrri 200595
oropharynx
RT or surgery +/-
RTCTProtein expression (AQUA) Yes
Pectasides
2011102 H&N RT +/- CT
AQUA
FISH
Yes
No
Wheeler 2012154 H&N
39 H&N
Surgery
RT + cetuximabProtein expression Yes
Chung 2006 82 H&N Surgery; RT/CT Gene amplification (FISH) Yes
EGFR seems to represent a powerful prognostic parameter especially when EGFR expression was measured in terms of producted protein by a “quantitative” method but a real
and certain prognostic role of EGFR in head and neck cancer has not been identified yet
PF = Cisplatin + 5-Fluoruracil; PCF = Paclitaxel + Cisplatin + 5-Fluorouracil; CT = chemotherapy; RT = radiotherapy;
RT/CT or CTRT = concomitant chemo-radiotherapy
EGFR: PROGNOSTIC ROLE?
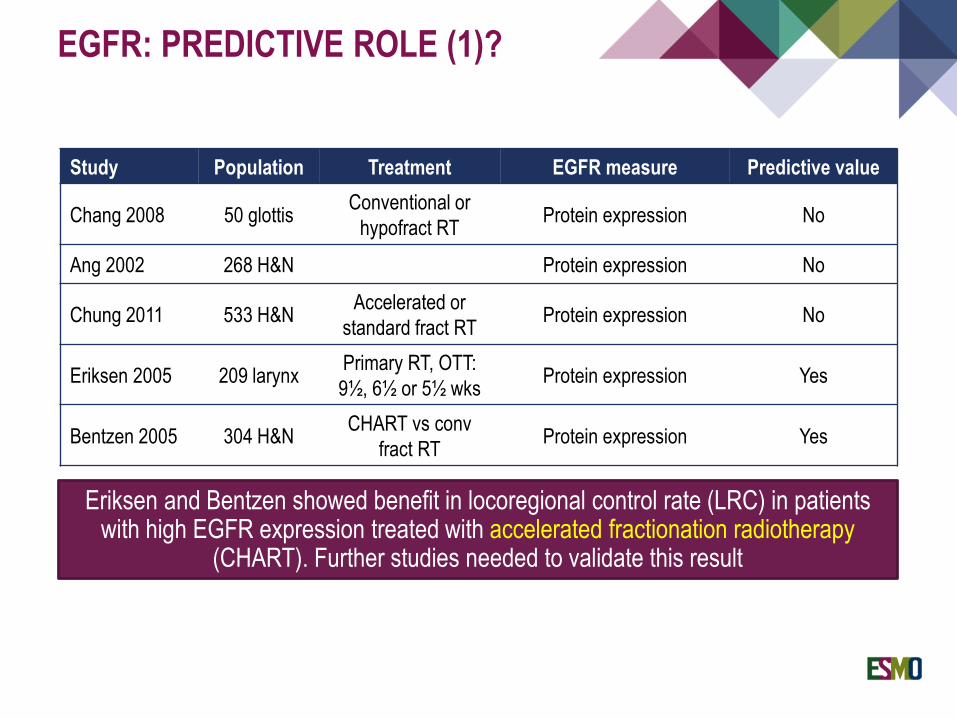
EGFR: PREDICTIVE ROLE (1)?
Eriksen and Bentzen showed benefit in locoregional control rate (LRC) in patients with high EGFR expression treated with accelerated fractionation radiotherapy
(CHART). Further studies needed to validate this result
Study Population Treatment EGFR measure Predictive value
Chang 2008 50 glottisConventional or
hypofract RTProtein expression No
Ang 2002 268 H&N Protein expression No
Chung 2011 533 H&NAccelerated or
standard fract RTProtein expression No
Eriksen 2005 209 larynxPrimary RT, OTT:
9½, 6½ or 5½ wksProtein expression Yes
Bentzen 2005 304 H&NCHART vs conv
fract RTProtein expression Yes
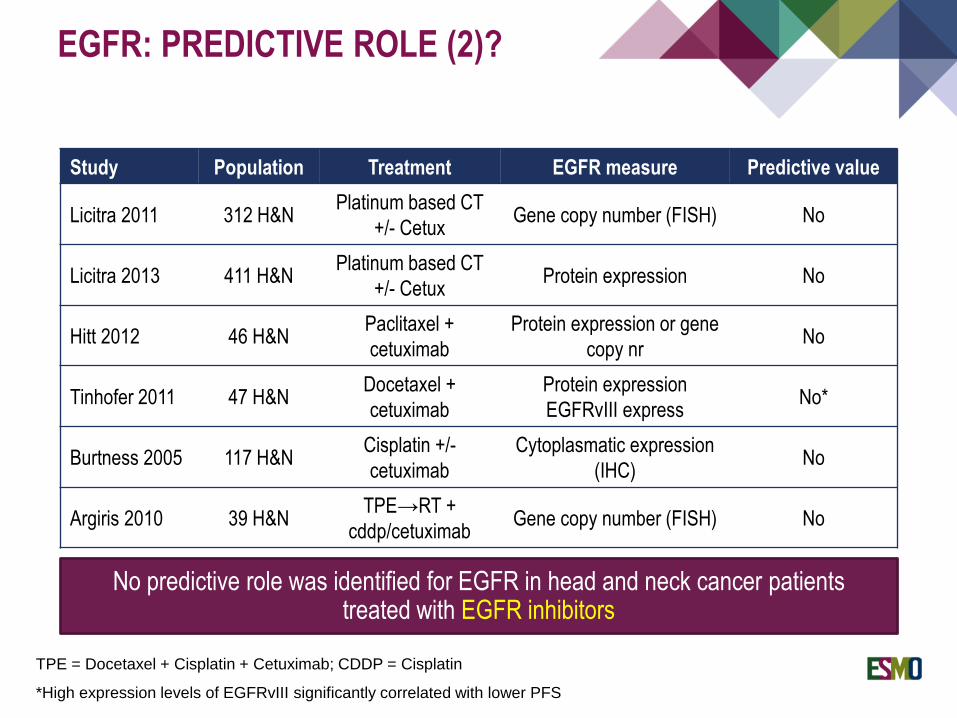
Study Population Treatment EGFR measure Predictive value
Licitra 2011 312 H&NPlatinum based CT
+/- CetuxGene copy number (FISH) No
Licitra 2013 411 H&NPlatinum based CT
+/- CetuxProtein expression No
Hitt 2012 46 H&NPaclitaxel +
cetuximab
Protein expression or gene
copy nrNo
Tinhofer 2011 47 H&NDocetaxel +
cetuximab
Protein expression
EGFRvIII expressNo*
Burtness 2005 117 H&NCisplatin +/-
cetuximab
Cytoplasmatic expression
(IHC)No
Argiris 2010 39 H&NTPE→RT +
cddp/cetuximabGene copy number (FISH) No
EGFR: PREDICTIVE ROLE (2)?
No predictive role was identified for EGFR in head and neck cancer patientstreated with EGFR inhibitors
*High expression levels of EGFRvIII significantly correlated with lower PFS
TPE = Docetaxel + Cisplatin + Cetuximab; CDDP = Cisplatin
Not so common such as in other kind of tumours (e.g. NSCLC or glioblastoma
multiforme)
In head and neck cancer the percentage of EGFR mutations varies from 4 to 16%
The most frequent is EGFRvIII, which is a variant of EGFR with: truncated
extracellular domain constitutive activation of the intracellular tyrosine kinases
All EGFR mutations in head and neck cancer were not related to different treatment
outcome or prognostic significance
EGFR MUTATIONS IN HEAD AND
NECK CANCER

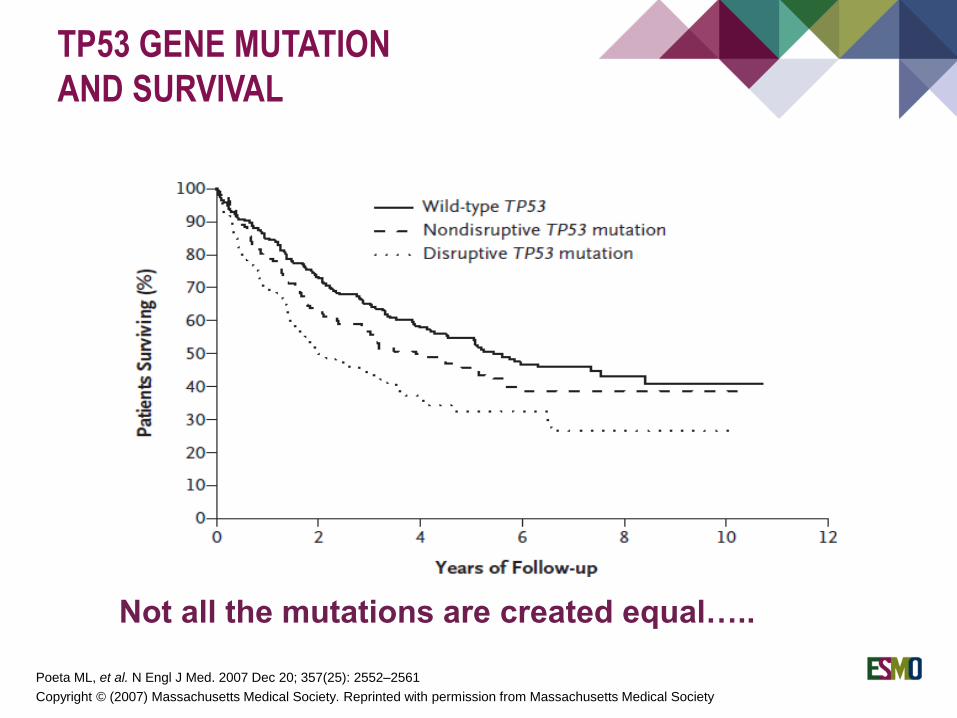
TP53 GENE MUTATION
AND SURVIVAL
Poeta ML, et al. N Engl J Med. 2007 Dec 20; 357(25): 2552–2561
Copyright © (2007) Massachusetts Medical Society. Reprinted with permission from Massachusetts Medical Society
TP53 GENE MUTATION
AND SURVIVAL
Poeta ML, et al. N Engl J Med. 2007 Dec 20; 357(25): 2552–2561
Not all the mutations are created equal…..
Copyright © (2007) Massachusetts Medical Society. Reprinted with permission from Massachusetts Medical Society

TP53 GENE MUTATION:
PREDICTIVE ROLE?
pCR Non-PCR
p53 mutations 27% 53%
p53 non functional mutations 14% 51%
p53 functional mutations 86% 49%
But not all mutations are created equal…..
A relationship between TP53 gene mutations and a lower response
rate to cisplatin-based neoadjuvant chemotherapy was found in head
and neck squamous cell cancer patients*
* Temam S, et al. JCO 2000; Cabelguenne A, et al. JCO 2000; Sullivan A, et al. Oncogene 2004
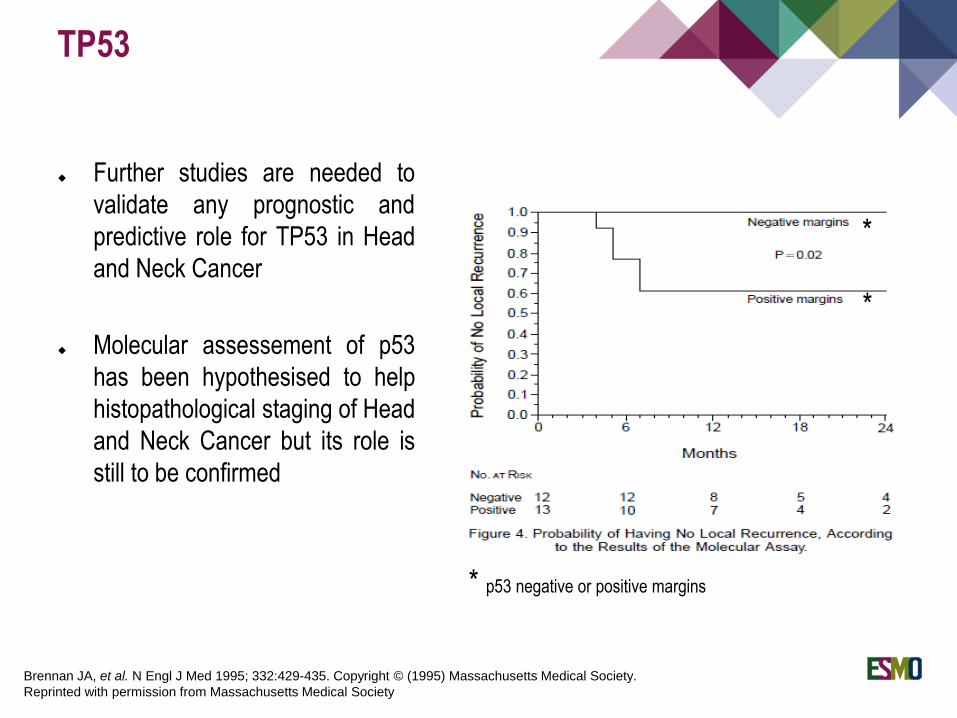
Further studies are needed to
validate any prognostic and
predictive role for TP53 in Head
and Neck Cancer
Molecular assessement of p53
has been hypothesised to help
histopathological staging of Head
and Neck Cancer but its role is
still to be confirmed
TP53
Brennan JA, et al. N Engl J Med 1995; 332:429-435. Copyright © (1995) Massachusetts Medical Society.
Reprinted with permission from Massachusetts Medical Society
*
*
* p53 negative or positive margins
BIOMARKERS: FUTURE
DIRECTIONS
Current prognostic biomarkers clearly do not serve as predictive biomarkers and,
at this time, cannot provide information regarding
how patients should be treated differently
This goal can only be achieved by a comprehensive understanding of
the biology, genetic and epigenetic alterations of HNC
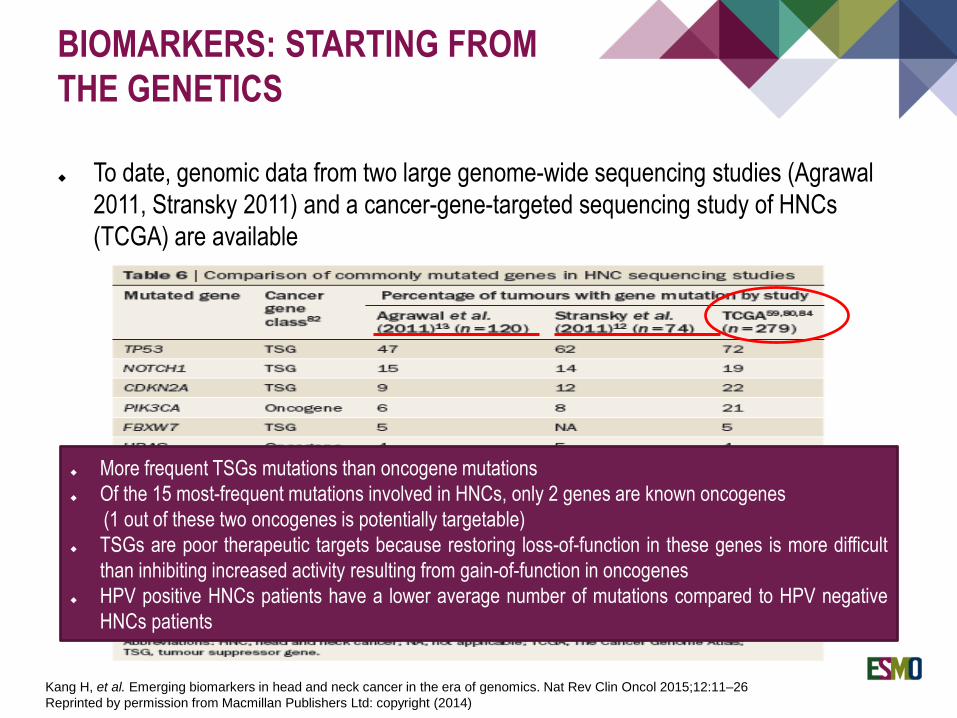
To date, genomic data from two large genome-wide sequencing studies (Agrawal
2011, Stransky 2011) and a cancer-gene-targeted sequencing study of HNCs
(TCGA) are available
BIOMARKERS: STARTING FROM
THE GENETICS
Kang H, et al. Emerging biomarkers in head and neck cancer in the era of genomics. Nat Rev Clin Oncol 2015;12:11–26
Reprinted by permission from Macmillan Publishers Ltd: copyright (2014)
More frequent TSGs mutations than oncogene mutations
Of the 15 most-frequent mutations involved in HNCs, only 2 genes are known oncogenes
(1 out of these two oncogenes is potentially targetable)
TSGs are poor therapeutic targets because restoring loss-of-function in these genes is more difficult
than inhibiting increased activity resulting from gain-of-function in oncogenes
HPV positive HNCs patients have a lower average number of mutations compared to HPV negative
HNCs patients
GENE EXPRESSION PROFILES:
POTENTIAL PROGNOSTIC AND
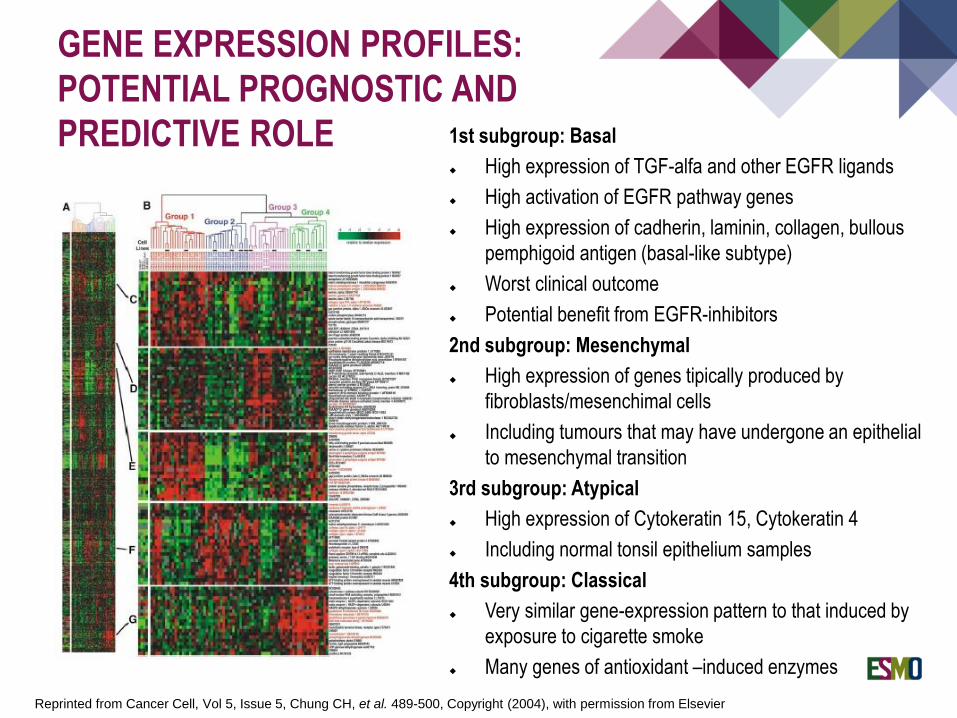
PREDICTIVE ROLE 1st subgroup: Basal
High expression of TGF-alfa and other EGFR ligands
High activation of EGFR pathway genes
High expression of cadherin, laminin, collagen, bullous
pemphigoid antigen (basal-like subtype)
Worst clinical outcome
Potential benefit from EGFR-inhibitors
2nd subgroup: Mesenchymal
High expression of genes tipically produced by
fibroblasts/mesenchimal cells
Including tumours that may have undergone an epithelial
to mesenchymal transition
3rd subgroup: Atypical
High expression of Cytokeratin 15, Cytokeratin 4
Including normal tonsil epithelium samples
4th subgroup: Classical
Very similar gene-expression pattern to that induced by
exposure to cigarette smoke
Many genes of antioxidant –induced enzymes
Reprinted from Cancer Cell, Vol 5, Issue 5, Chung CH, et al. 489-500, Copyright (2004), with permission from Elsevier

COMPARABLE RESULTS OF GENE
EXPRESSION PROFILES:
Walter V, et al.
PLOS one 2013
De Cecco L, et al.
Oncotarget 2015
Chung CH, et al.
Cancer Cell 2004

GENE EXPRESSION PROFILES:
POTENTIAL PROGNOSTIC ROLE
Kaplan-Maier (recurrence-free) survival analysis
of subgroup 1 vs. subgroup 2-4 (combined) from
Chung analysis
Kaplan-Maier (recurrence-free) survival analysis of
subgroup 1 vs. subgroup 2 vs. subgroup 3 + 4
(combined) from Chung analysis
Reprinted from Cancer Cell, Vol 5, Issue 5, Chung CH, et al. 489-500, Copyright (2004), with permission from Elsevier
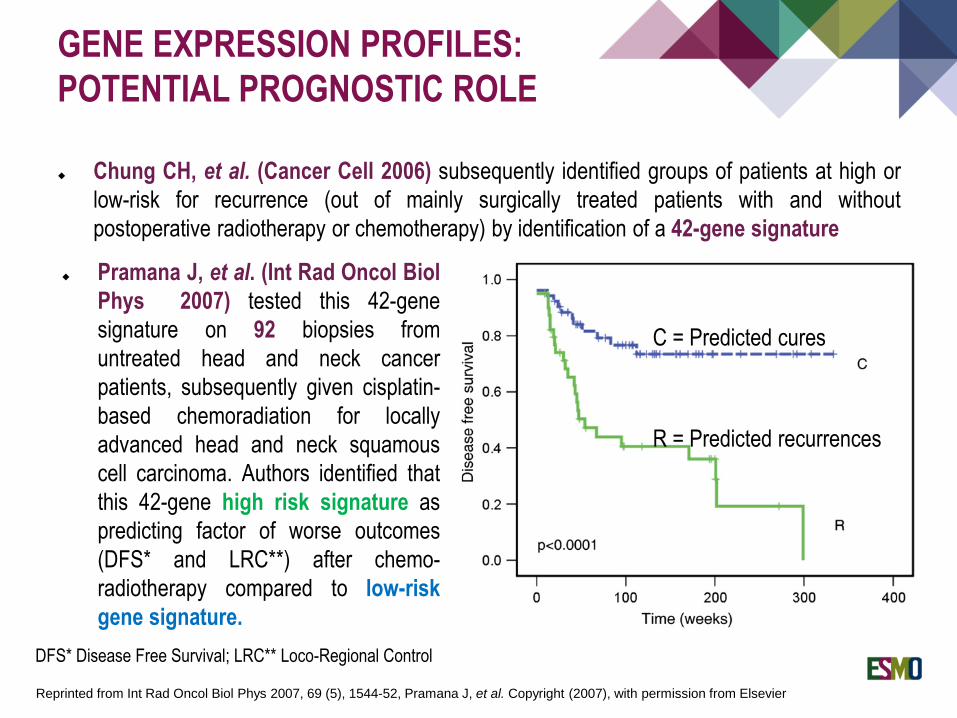
C = Predicted cures
R = Predicted recurrences
Chung CH, et al. (Cancer Cell 2006) subsequently identified groups of patients at high or
low-risk for recurrence (out of mainly surgically treated patients with and without
postoperative radiotherapy or chemotherapy) by identification of a 42-gene signature
GENE EXPRESSION PROFILES:
POTENTIAL PROGNOSTIC ROLE
Pramana J, et al. (Int Rad Oncol Biol
Phys 2007) tested this 42-gene
signature on 92 biopsies from
untreated head and neck cancer
patients, subsequently given cisplatin-
based chemoradiation for locally
advanced head and neck squamous
cell carcinoma. Authors identified that
this 42-gene high risk signature as
predicting factor of worse outcomes
(DFS* and LRC**) after chemo-
radiotherapy compared to low-risk
gene signature.
Reprinted from Int Rad Oncol Biol Phys 2007, 69 (5), 1544-52, Pramana J, et al. Copyright (2007), with permission from Elsevier
DFS* Disease Free Survival; LRC** Loco-Regional Control
GENE EXPRESSION PROFILES: POTENTIAL
PROGNOSTIC ROLE
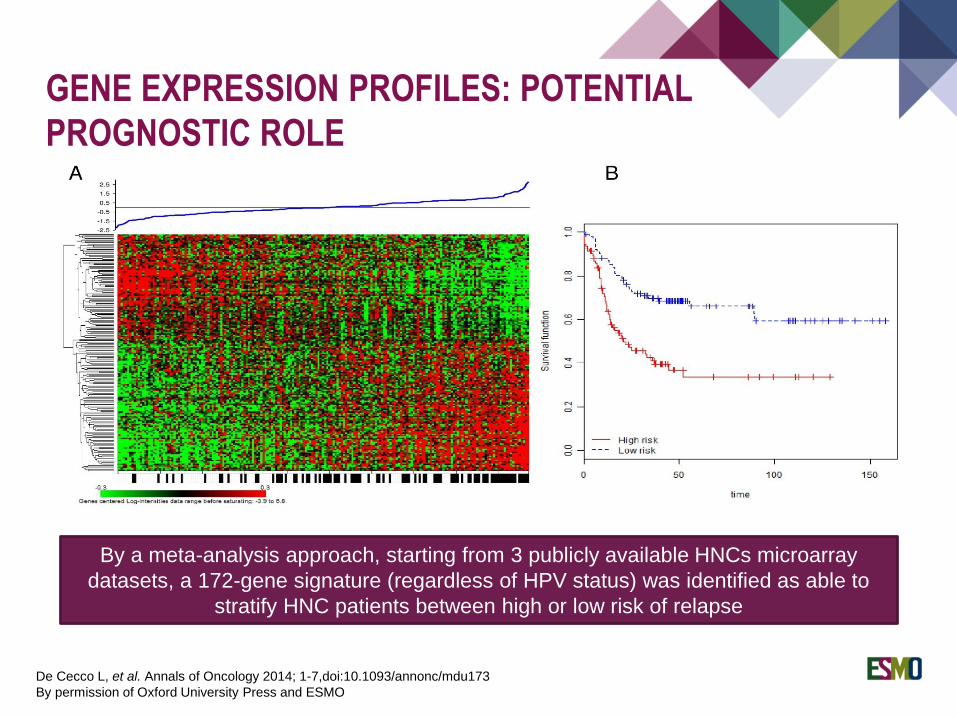
De Cecco L, et al. Annals of Oncology 2014; 1-7,doi:10.1093/annonc/mdu173
By permission of Oxford University Press and ESMO
By a meta-analysis approach, starting from 3 publicly available HNCs microarray
datasets, a 172-gene signature (regardless of HPV status) was identified as able to
stratify HNC patients between high or low risk of relapse
Presented at: Hammerman P, ASCO 2015
IMMUNE CHEKPOINT-RELATED:
PD-L1 / PD1 PATHWAY
Basis for immune therapy - immune escape
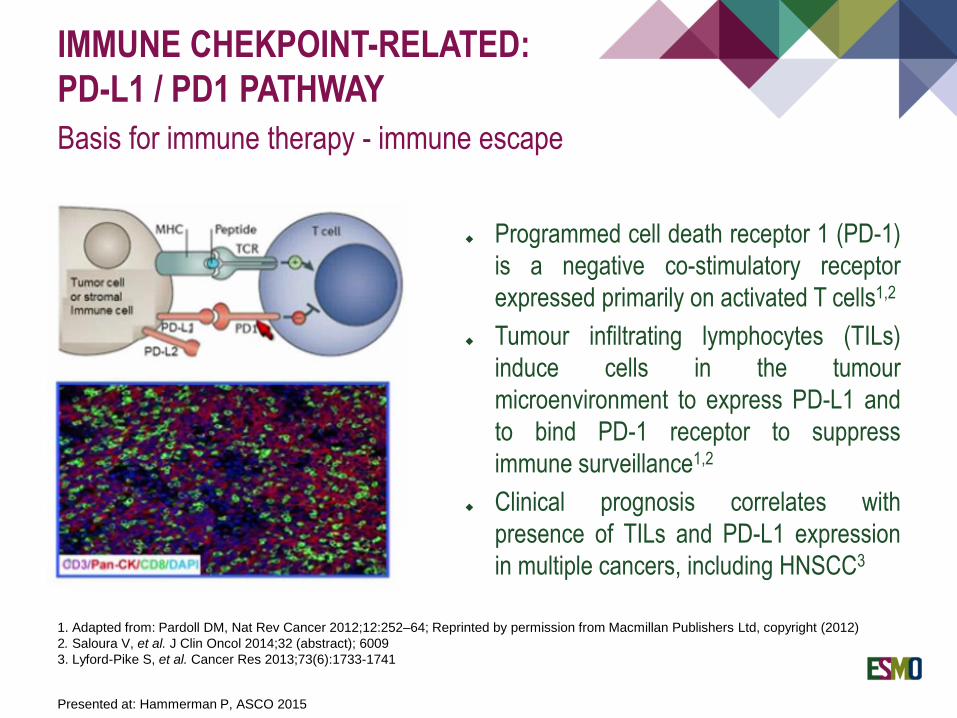
Programmed cell death receptor 1 (PD-1)
is a negative co-stimulatory receptor
expressed primarily on activated T cells1,2
Tumour infiltrating lymphocytes (TILs)
induce cells in the tumour
microenvironment to express PD-L1 and
to bind PD-1 receptor to suppress
immune surveillance1,2
Clinical prognosis correlates with
presence of TILs and PD-L1 expression
in multiple cancers, including HNSCC3
1. Adapted from: Pardoll DM, Nat Rev Cancer 2012;12:252–64; Reprinted by permission from Macmillan Publishers Ltd, copyright (2012)
2. Saloura V, et al. J Clin Oncol 2014;32 (abstract); 6009
3. Lyford-Pike S, et al. Cancer Res 2013;73(6):1733-1741
IMMUNE CHEKPOINT-RELATED
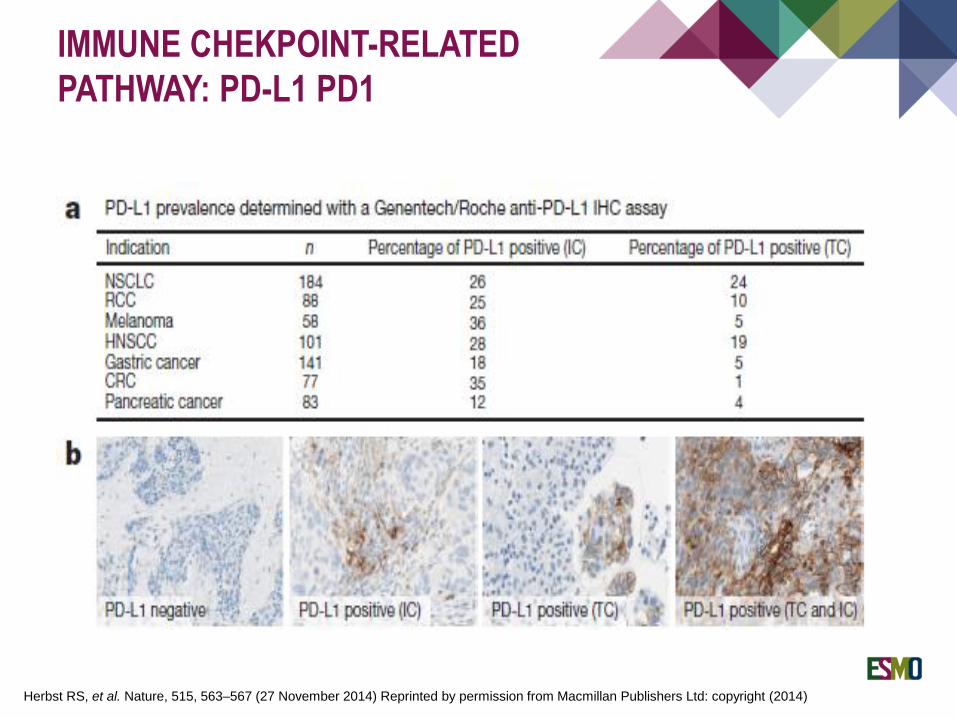
PATHWAY: PD-L1 PD1
Herbst RS, et al. Nature, 515, 563–567 (27 November 2014) Reprinted by permission from Macmillan Publishers Ltd: copyright (2014)
Herbst RS, et al. Nature, 515, 563–567 (27 November 2014)
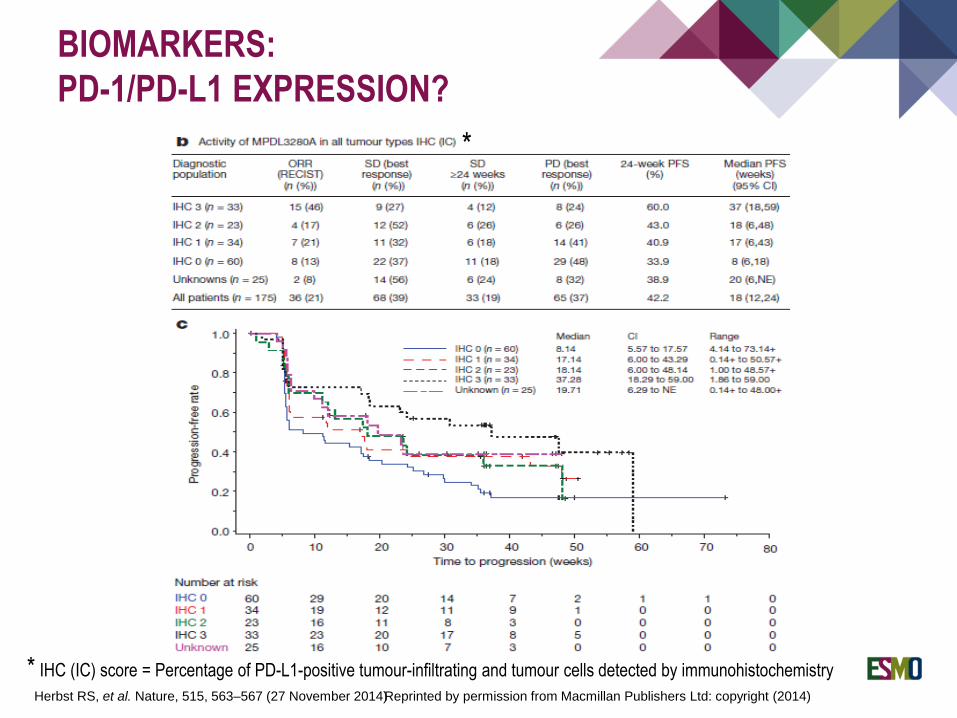
BIOMARKERS:
PD-1/PD-L1 EXPRESSION?
Reprinted by permission from Macmillan Publishers Ltd: copyright (2014)
*
* IHC (IC) score = Percentage of PD-L1-positive tumour-infiltrating and tumour cells detected by immunohistochemistry
The loss of chromosome region 9p21–22 is the most common of all genetic
changes in HNSCC at a frequency of 70% and occurs early in the progression of
head-and-neck tumours
Another example is the loss chromosome region 3p
Thirty percent of benign hyperplastic lesions, the earliest of precancerous lesions,
exhibited loss at either 9p21 or 3p
Patients with precancerous lesions showing these mutations have been
demonstrated at a significant higher risk of cancer development
BIOMARKERS OF
PRECANCERISATION

Thank you!