Embed Size (px)
Citation preview
1
e-Analysis of High-Rise Buildings Subjected to Wind Loads
Dae-Kun Kwon1, Tracy Kijewski-Correa2, Ahsan Kareem3
ABSTRACT
The NatHaz Aerodynamic Loads Database (NALD) (http://aerodata.ce.nd.edu)
introduced in 2000 has served an important first step in establishing an on-line
experimental archive of high frequency base balance (HFBB) data for use in the
preliminary design of high-rise buildings subjected to wind loads. As a result, NALD was
recently introduced in the Commentary of ASCE 7-05 (C6.5.8) as an alternative means of
assessing the dynamic wind load effects on high-rise buildings. This paper presents NALD
v. 2.0, integrating the latest advances in data management and mining for interactive
queries of aerodynamic load data and an integrated on-line analysis framework for
determining the resulting base moments and equivalent static wind loads (ESWL) for
survivability and accelerations for serviceability (habitability). The key feature of NALD v.
2.0 is the flexibility it’s analysis module offers: users may select not only the data from the
on-line NatHaz aerodynamic loads database, but also may implement any arbitrary power
spectral density (PSD) expression or wind tunnel-derived PSD data set for the evaluation of
1 Postdoctoral research associate, Department of Civil Engineering and Geological Sciences, Univ. of Notre
Dame, Notre Dame, IN 46556. E-mail: [email protected] 2 Assistant Professor, Department of Civil Engineering and Geological Sciences, Univ. of Notre Dame, Notre
Dame, IN 46556. E-mail: [email protected] 3 Professor, Department of Civil Engineering and Geological Sciences, Univ. of Notre Dame, Notre Dame, IN
46556. E-mail: [email protected]
2
wind load effects on high-rise buildings. Thus it serves as a stand-alone analysis engine.
Examples illustrate the capabilities of NALD v. 2.0 via its user-friendly analysis interface,
which will be particularly useful for those who may not be very familiar with the details of
the random vibration-based dynamic analysis procedure generally used in connection with
HFBB measurements. Some comparisons of response estimates based on information
derived from other sources are provided to demonstrate the flexibility of the analysis engine
and is not intended to serve as an exhaustive comparative study of HFBB data. NALD v.
2.0 is robust in that it can and will include additional data sets with more refined spectral
resolution and ranges of reduced frequency to yield a comprehensive, simplified and
efficient platform for e-analysis of high-rise buildings based on HFBB.
CE Database subject headings: Aerodynamics; Wind Loads; Wind Tunnels; Buildings,
high-rise; Building design; Structural Response; Building codes; Internet; Information
technology (IT)
3
INTRODUCTION
One of the major challenges in any engineering discipline is the processing and
archiving of large quantities of information. This is no exception in the field of Structural
Engineering, where such stores of data include those generated by wind tunnel studies,
laboratory experiments, material testing and even full-scale monitoring. Recent
developments in information technology (IT) offer attractive solutions to these challenges,
allowing efficient means to collect, store, analyze, manage, and even share large data sets
with the worldwide community (Kijewski et al. 2003, Kwon et al. 2004, Fritz and Simiu
2005). Not only do such approaches enable geographically dispersed researchers working
on a similar topic to share data and findings, but it also provides a venue in which this
information can be disseminated to other members of the design community around the
world.
The NatHaz Aerodynamic Loads Database (NALD) version 1.0, established in the fall
of 2000, is an example of web-based archiving and distribution of wind tunnel test data for
the determination of alongwind, acrosswind and torsional response (Zhou et al. 2003). This
site has served as an important first step in establishing an on-line experimental database
for use in the preliminary design of high-rise buildings which is being extensively
consulted by a number of firms (e.g., McNamara 2005) and individual researches (e.g.,
Chan and Chui 2006). This interactive database provides users with the RMS base bending
moment coefficients and the non-dimensionalized power spectra obtained from high-
frequency base balance (HFBB) measurements on rigid building models of various aspect
ratios and geometries, exposed to two typical boundary layers. One attractive feature in this
4
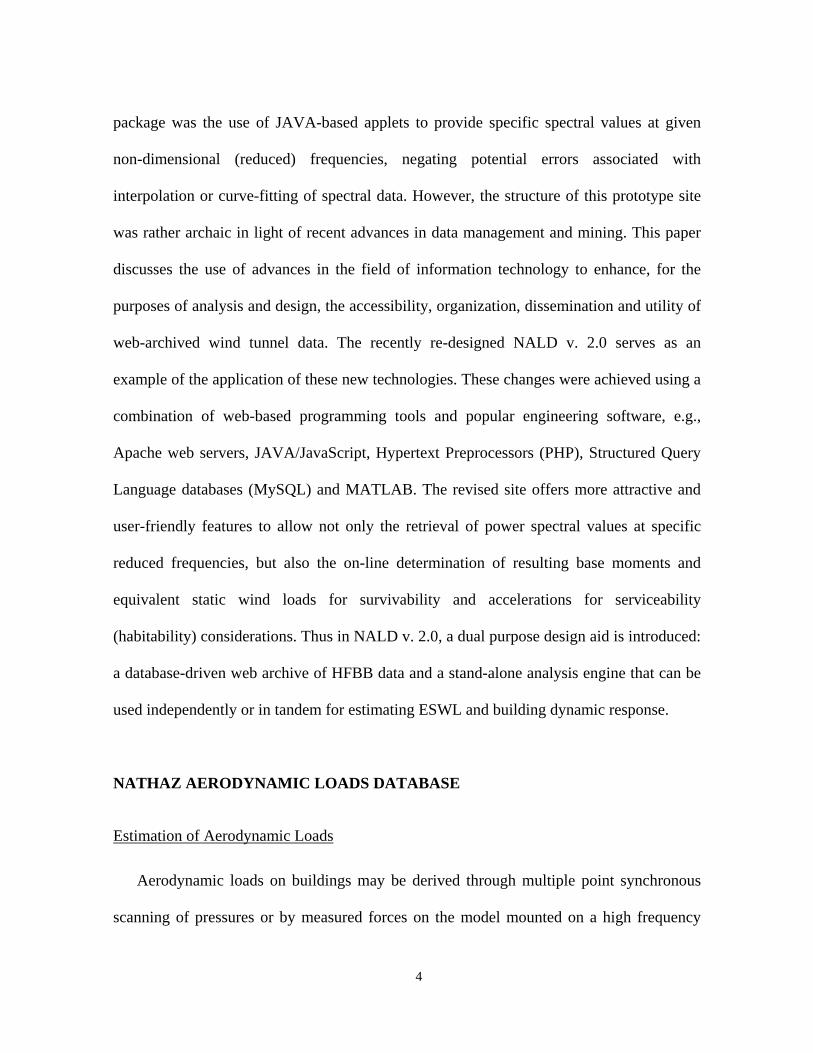
package was the use of JAVA-based applets to provide specific spectral values at given
non-dimensional (reduced) frequencies, negating potential errors associated with
interpolation or curve-fitting of spectral data. However, the structure of this prototype site
was rather archaic in light of recent advances in data management and mining. This paper
discusses the use of advances in the field of information technology to enhance, for the
purposes of analysis and design, the accessibility, organization, dissemination and utility of
web-archived wind tunnel data. The recently re-designed NALD v. 2.0 serves as an
example of the application of these new technologies. These changes were achieved using a
combination of web-based programming tools and popular engineering software, e.g.,
Apache web servers, JAVA/JavaScript, Hypertext Preprocessors (PHP), Structured Query
Language databases (MySQL) and MATLAB. The revised site offers more attractive and
user-friendly features to allow not only the retrieval of power spectral values at specific
reduced frequencies, but also the on-line determination of resulting base moments and
equivalent static wind loads for survivability and accelerations for serviceability
(habitability) considerations. Thus in NALD v. 2.0, a dual purpose design aid is introduced:
a database-driven web archive of HFBB data and a stand-alone analysis engine that can be
used independently or in tandem for estimating ESWL and building dynamic response.
NATHAZ AERODYNAMIC LOADS DATABASE
Estimation of Aerodynamic Loads
Aerodynamic loads on buildings may be derived through multiple point synchronous
scanning of pressures or by measured forces on the model mounted on a high frequency
5
base balance (HFBB). The simultaneously monitored pressure database offers great
flexibility in deriving mode generalized loads for buildings with mode shapes that depart
from linear or exhibit coupling. However, for tall buildings with dominant resonant
response, both the mean and background response components can be approximately
quantified by the modal analysis when only integrated wind loads through HFBB
measurements are available. The HFBB measurements have been widely recognized for
conveniently quantifying generalized wind forces on tall buildings with uncoupled mode
shapes (e.g., Kareem and Cermak 1979; Tschanz and Davenport 1983; Reinhold and
Kareem 1986; Boggs and Peterka 1989). The generalized forces are then utilized for
estimating building response with given structural characteristics. The HFBB technique
generally requires mode shape corrections which are either based on empirical corrections,
or analytical formulations derived on the basis of assumed wind loading models (e.g.,
Vickery et al. 1985; Boggs and Peterka 1989; Xu and Kwok 1993; Zhou et al. 2002;
Holmes et al. 2003; Chen and Kareem 2004; Chen and Kareem 2005).
Since its inception a few decades back at Shimizu Corporation’s wind tunnel laboratory
(Fujii et al. 1986; Kikuchi et al. 1997), synchronous pressure measurements (SPM) on
building surfaces have been increasingly implemented in wind tunnel practice. This was
largely facilitated by the availability of cheaper electronic pressure sensors and represented
an advancement over the covariance-based integration methodology that involved several
configurations of limited pressure measurements over a building surface (Kareem 1982).
SPM offers the added advantage of providing more accurate estimates of generalized wind
loads for buildings with non-linear mode shapes, as approximate mode shape corrections
are not required. Nonetheless, the HFBB maintains its attractiveness in cases where the
6
mode shapes do not depart too far from linear.
Individual researchers (e.g., Chen and Kareem 2005; Huang and Chen 2006) and wind
tunnel laboratories (e.g., Steckley et al. 1992; Ho et al. 1999) have their own favorite
analysis format based on either SPM or HFBB. Some groups (e.g., Chen and Kareem 2004,
2005) prefer to establish equivalent static wind loads (ESWL) from either SPM or HFBB
for subsequent response analysis, while others directly employ the data for calculating
response components (Steckley et al. 1992; Tamura et al. 1996; Ho et al. 1999; Fritz and
Simiu 2005).
Background of NALD
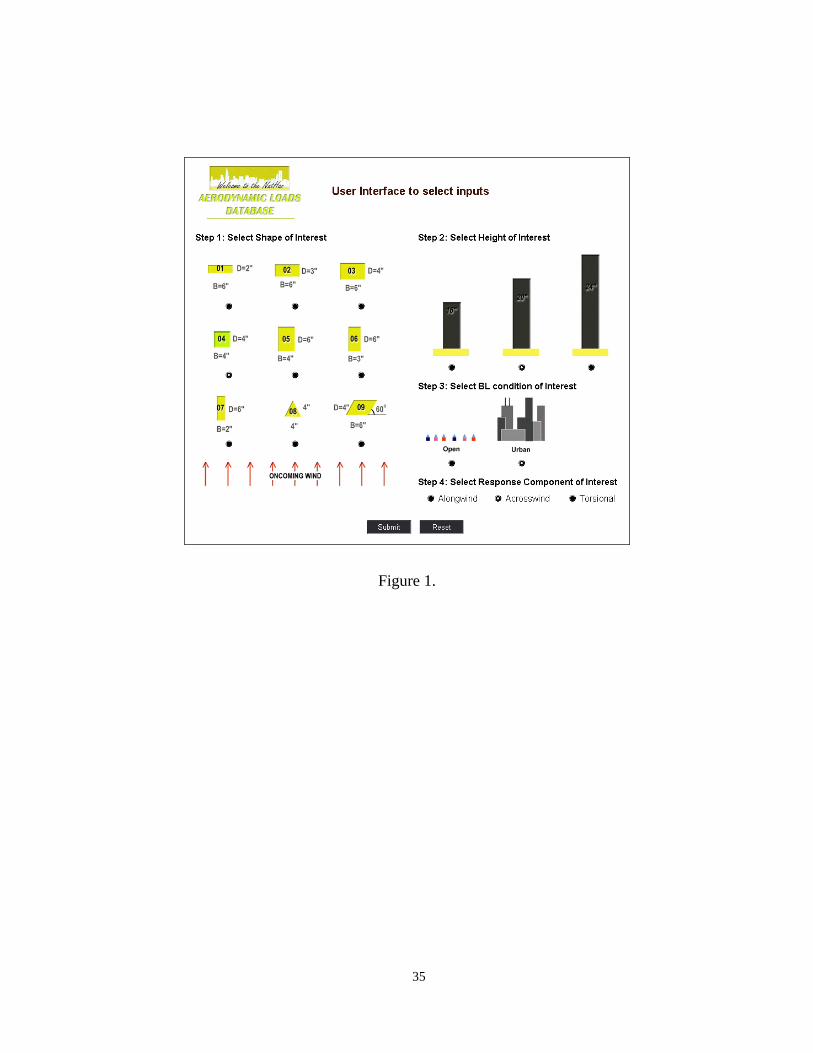
The NALD consists of results from 162 different tests, derived from 9 cross sectional
shapes, 3 model heights, 2 exposure categories and 3 response directions (alongwind,
acrosswind and torsion), as shown by the NALD web selection menu in Figure 1. While a
detailed description of the test procedures can be found in Kareem (1990), Kijewski and
Kareem (1998) and Zhou et al. (2003), a brief summary is now provided. Each of the balsa
wood models was tested in a boundary layer wind tunnel with a 3 m (10 ft) x 1.5 m (5 ft)
cross-section, of 18 m (60 ft) length. The turbulent boundary layers simulated in this study
were generated by the natural action of surface roughness added on the tunnel floor and
upstream spires. Two typical boundary layers were simulated in this experiment, BL1
(α=0.16, where α = power law exponent of the mean wind velocity profile) and BL2
(α=0.35), similar to the conditions of open [Exposure C in the ASCE 7-05, ASCE (2005)]
and urban [Exposure A in ASCE 7-98 (1998)] flow environments, respectively. The output
7
of the sensitive, multi-component base balance (HFBB) was analyzed using the Fast
Fourier Transform (FFT) to determine the spectral and cross-spectral density functions,
which were later non-dimensionalized. This analysis was carried out for all 27 building
models, in both boundary layers, and at various angles of wind incidence, though only the
results from perpendicular approaching winds (zero degree angle of attack) were
considered in the NALD. The authors plan to augment the 162 test cases currently housed
in the NALD with data for other building shapes and aspect ratios, as they become
available from other researchers and/or additional testing.
The reliability of the measured spectra within the NALD has been established through
verifications against datasets from other wind tunnels (Kareem 1989). The acrosswind
spectra have been compared to a model derived from earlier measurements by Kareem
(1988). Results in the torsional direction were also compared to those derived from
pneumatic averaging, to overcome the uniform mode shape assumption inherent to the
HFBB-derived torsional loads (Kareem 1990). More recently, Zhou et al. (2003) compared
the NALD acrosswind loads with the empirical expression suggested by the Architectural
Institute of Japan (AIJ 1996, Tamura et al. 1996). In addition, non-dimensionalized base
moment coefficients were compared to the empirical expressions given by AIJ for
acrosswind and torsional directions (Zhou et al. 2003).
Since these previously reported comparisons, a number of new studies concerning
HFBB and SPM have been published (Liang et al. 2002, 2004; Cheng and Wang 2004; Gu
and Quan 2004; Ha et al. 2004; Lin et al. 2005; Flay and Bhat 2005). In particular, it is
worth noting that Lin et al. (2005) have provided an in-depth comparison of the NALD to
their HFBB and SPM. They found the NALD to be in close agreement with their studies
8
with the exception of a few cases, stating: “With the linear mode shape assumption …
integrated simultaneous point pressures and HFBB agree for base force and moment spectra.
The [NALD] effectively provides the base moment spectra for preliminary design and can
be expanded on the Internet by the dataset here and by the other experimental results in the
future.” This speaks not only to the reliability of the NALD but also the robustness of its
framework for future expansion. The examples in this paper offer additional verification of
NALD against selected major studies, though these are by no means exhaustive or meant to
serve as a systematic comparison of HFBB data from different laboratories, codes and
standards.
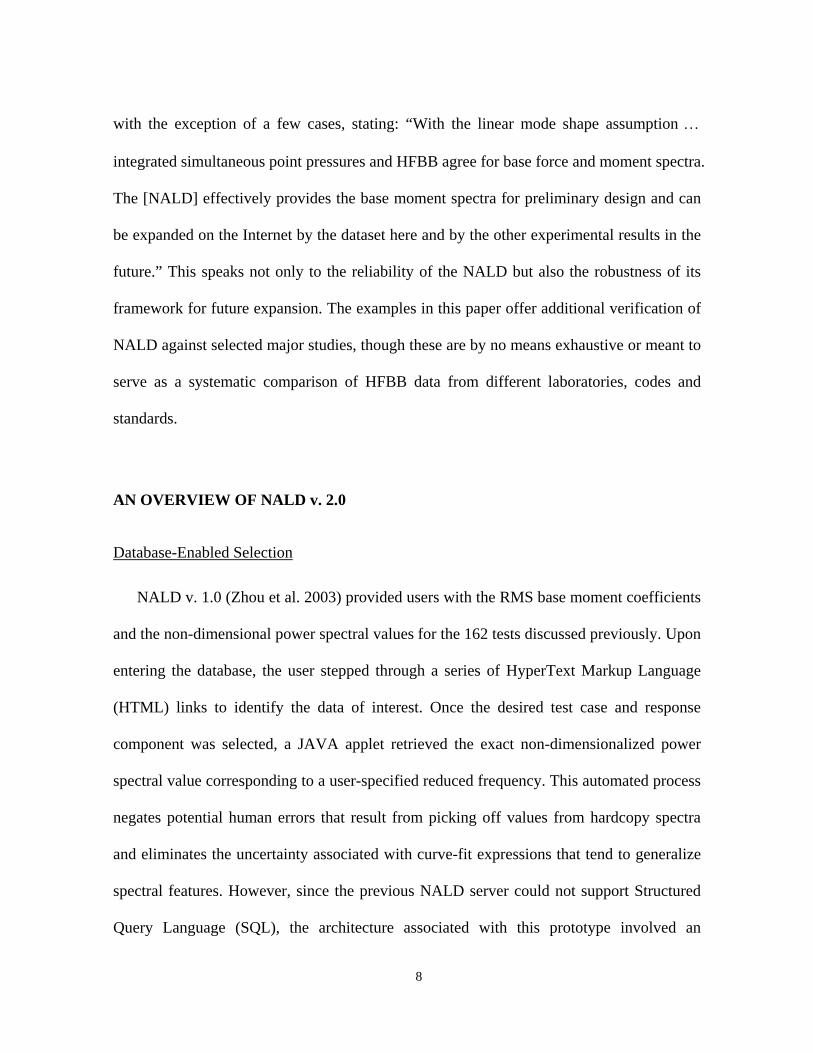
AN OVERVIEW OF NALD v. 2.0
Database-Enabled Selection
NALD v. 1.0 (Zhou et al. 2003) provided users with the RMS base moment coefficients
and the non-dimensional power spectral values for the 162 tests discussed previously. Upon
entering the database, the user stepped through a series of HyperText Markup Language
(HTML) links to identify the data of interest. Once the desired test case and response
component was selected, a JAVA applet retrieved the exact non-dimensionalized power
spectral value corresponding to a user-specified reduced frequency. This automated process
negates potential human errors that result from picking off values from hardcopy spectra
and eliminates the uncertainty associated with curve-fit expressions that tend to generalize
spectral features. However, since the previous NALD server could not support Structured
Query Language (SQL), the architecture associated with this prototype involved an
9
expansive hierarchy of directories with duplicate HTML files, requiring the user to step
through a sequence of at least five webpages to reach the desired JAVA applet.
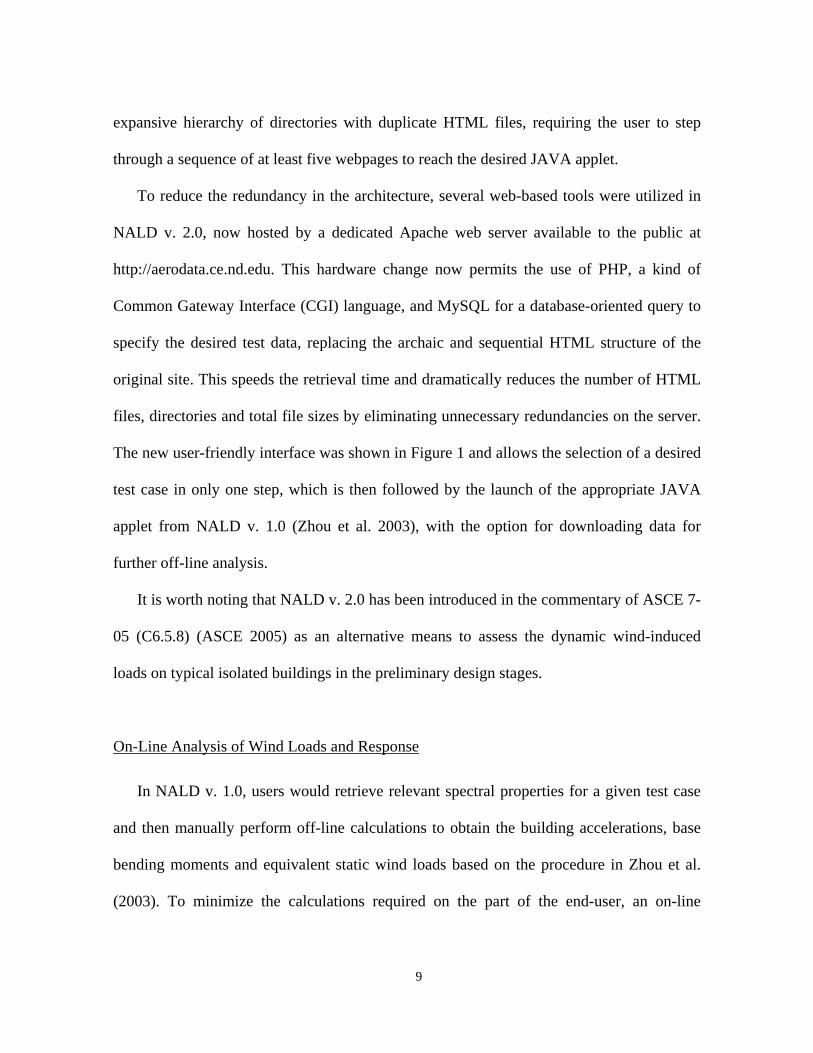
To reduce the redundancy in the architecture, several web-based tools were utilized in
NALD v. 2.0, now hosted by a dedicated Apache web server available to the public at
http://aerodata.ce.nd.edu. This hardware change now permits the use of PHP, a kind of
Common Gateway Interface (CGI) language, and MySQL for a database-oriented query to
specify the desired test data, replacing the archaic and sequential HTML structure of the
original site. This speeds the retrieval time and dramatically reduces the number of HTML
files, directories and total file sizes by eliminating unnecessary redundancies on the server.
The new user-friendly interface was shown in Figure 1 and allows the selection of a desired
test case in only one step, which is then followed by the launch of the appropriate JAVA
applet from NALD v. 1.0 (Zhou et al. 2003), with the option for downloading data for
further off-line analysis.
It is worth noting that NALD v. 2.0 has been introduced in the commentary of ASCE 7-
05 (C6.5.8) (ASCE 2005) as an alternative means to assess the dynamic wind-induced
loads on typical isolated buildings in the preliminary design stages.
On-Line Analysis of Wind Loads and Response
In NALD v. 1.0, users would retrieve relevant spectral properties for a given test case
and then manually perform off-line calculations to obtain the building accelerations, base
bending moments and equivalent static wind loads based on the procedure in Zhou et al.
(2003). To minimize the calculations required on the part of the end-user, an on-line
10
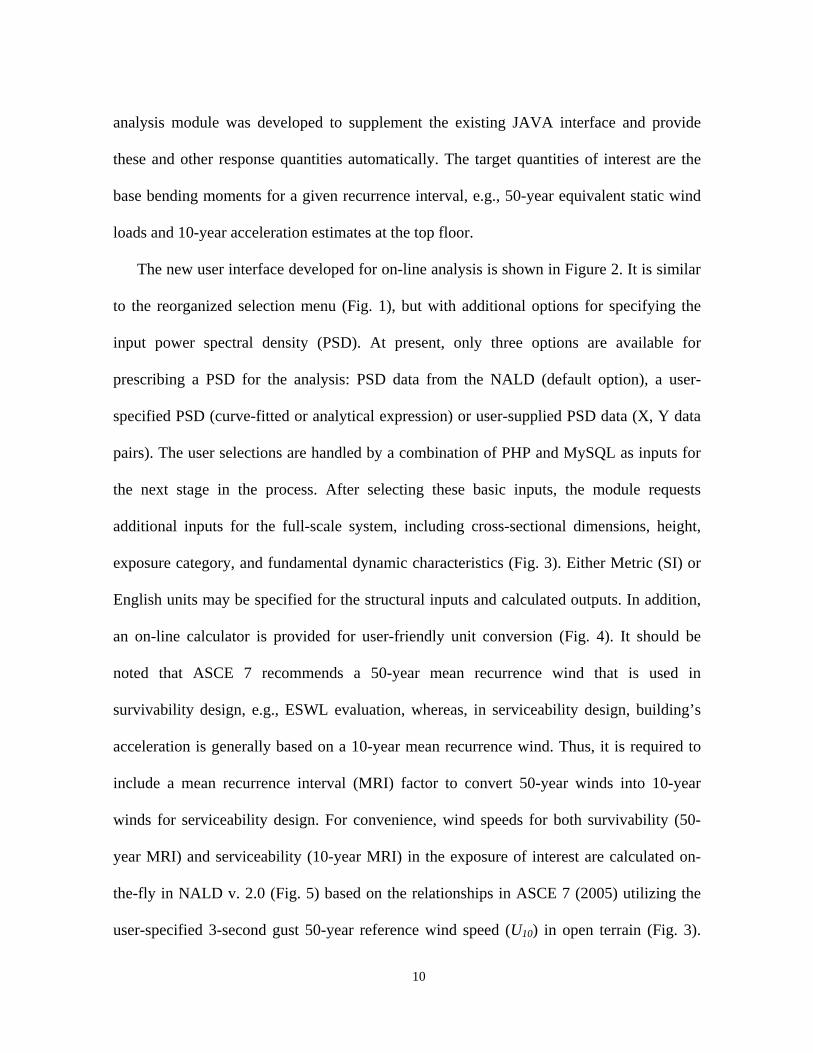
analysis module was developed to supplement the existing JAVA interface and provide
these and other response quantities automatically. The target quantities of interest are the
base bending moments for a given recurrence interval, e.g., 50-year equivalent static wind
loads and 10-year acceleration estimates at the top floor.
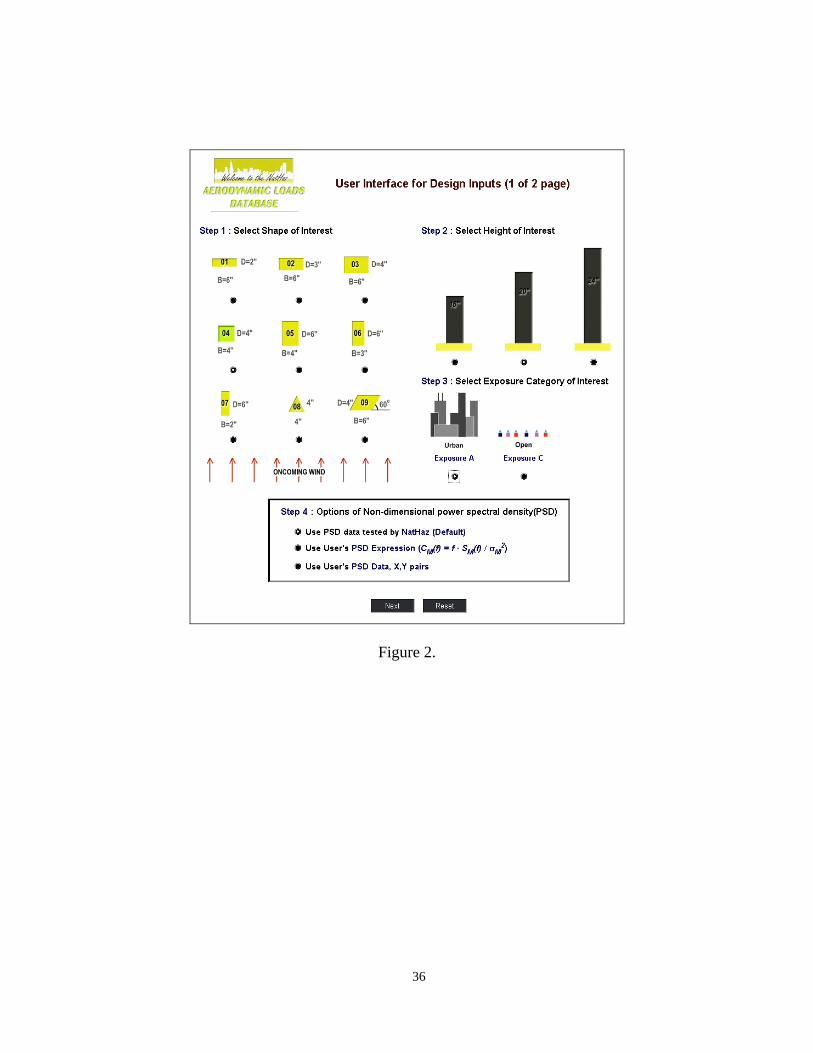
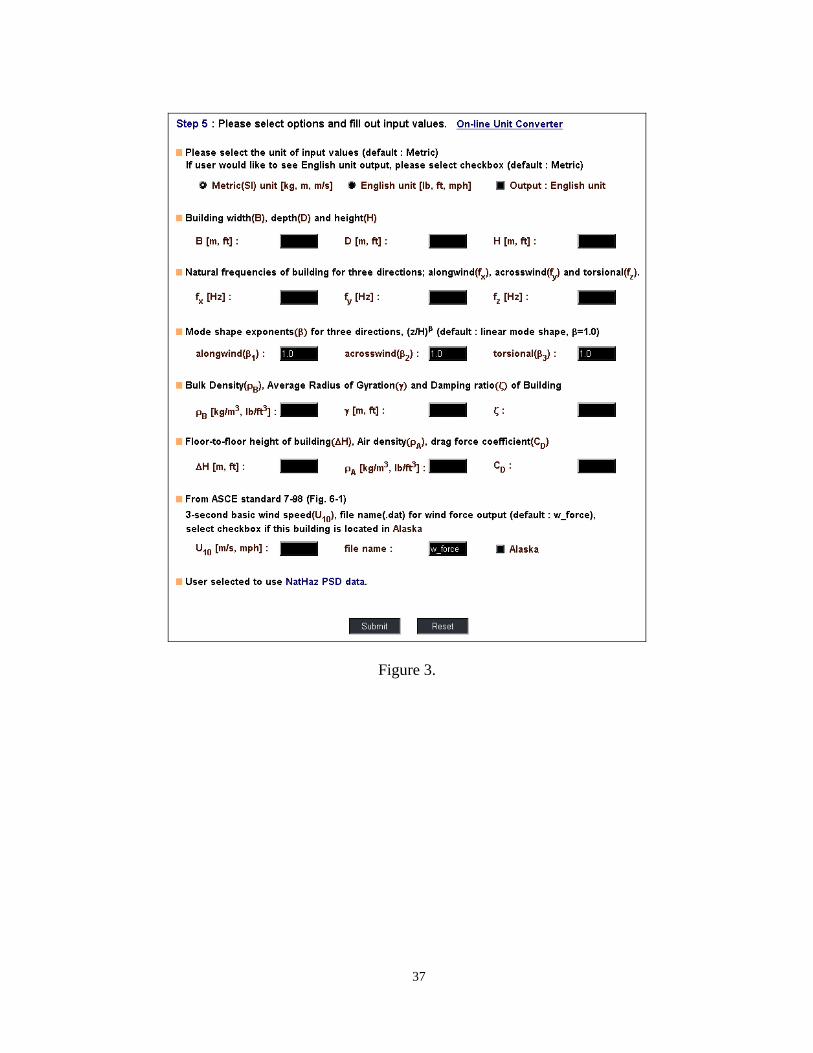
The new user interface developed for on-line analysis is shown in Figure 2. It is similar
to the reorganized selection menu (Fig. 1), but with additional options for specifying the
input power spectral density (PSD). At present, only three options are available for
prescribing a PSD for the analysis: PSD data from the NALD (default option), a user-
specified PSD (curve-fitted or analytical expression) or user-supplied PSD data (X, Y data
pairs). The user selections are handled by a combination of PHP and MySQL as inputs for
the next stage in the process. After selecting these basic inputs, the module requests
additional inputs for the full-scale system, including cross-sectional dimensions, height,
exposure category, and fundamental dynamic characteristics (Fig. 3). Either Metric (SI) or
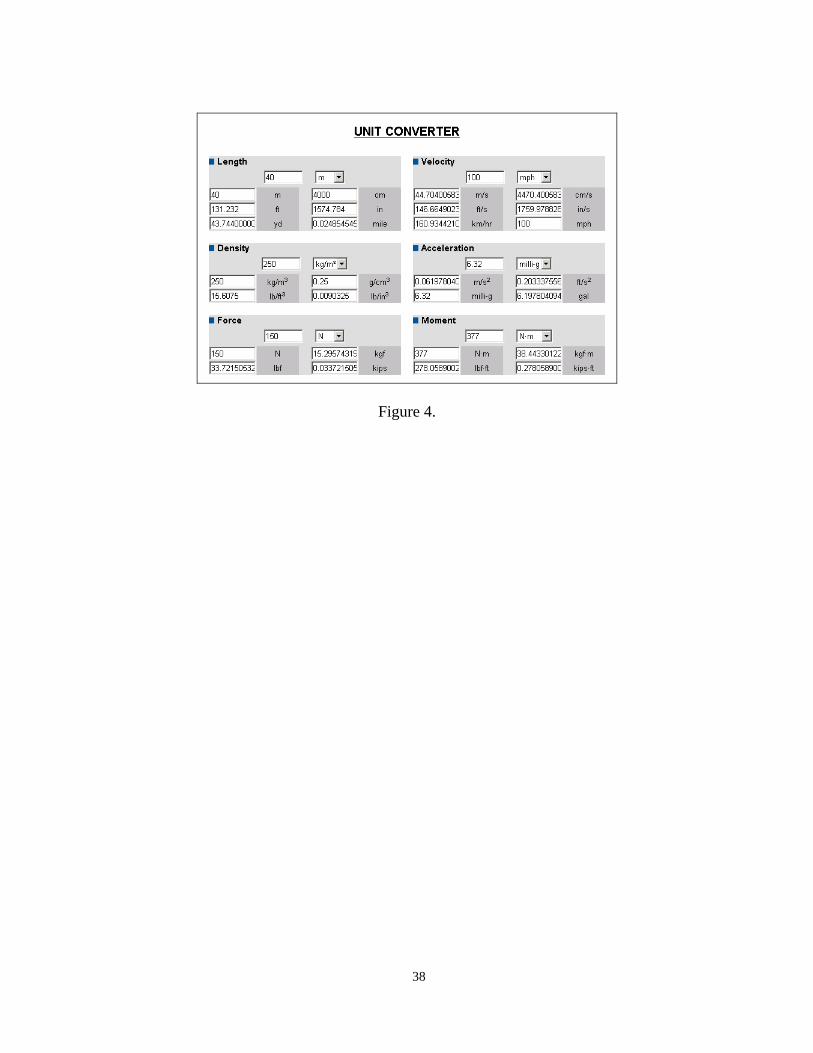
English units may be specified for the structural inputs and calculated outputs. In addition,
an on-line calculator is provided for user-friendly unit conversion (Fig. 4). It should be
noted that ASCE 7 recommends a 50-year mean recurrence wind that is used in
survivability design, e.g., ESWL evaluation, whereas, in serviceability design, building’s
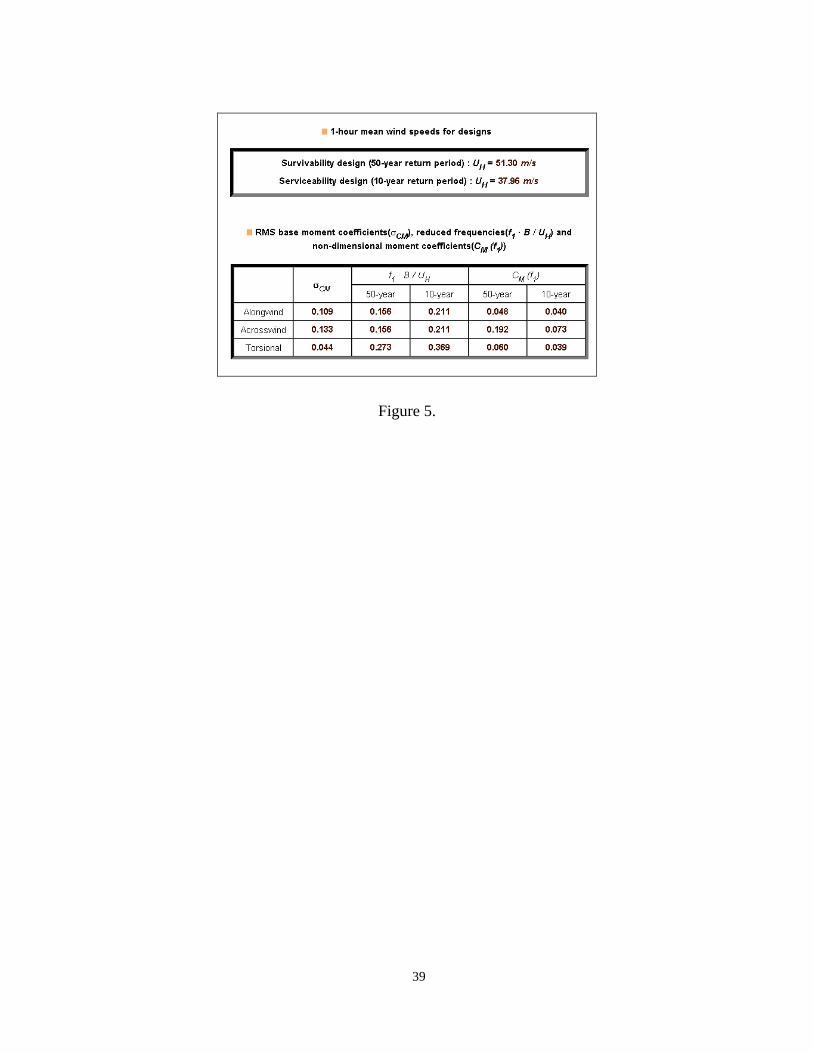
acceleration is generally based on a 10-year mean recurrence wind. Thus, it is required to
include a mean recurrence interval (MRI) factor to convert 50-year winds into 10-year
winds for serviceability design. For convenience, wind speeds for both survivability (50-
year MRI) and serviceability (10-year MRI) in the exposure of interest are calculated on-
the-fly in NALD v. 2.0 (Fig. 5) based on the relationships in ASCE 7 (2005) utilizing the
user-specified 3-second gust 50-year reference wind speed (U10) in open terrain (Fig. 3).
11
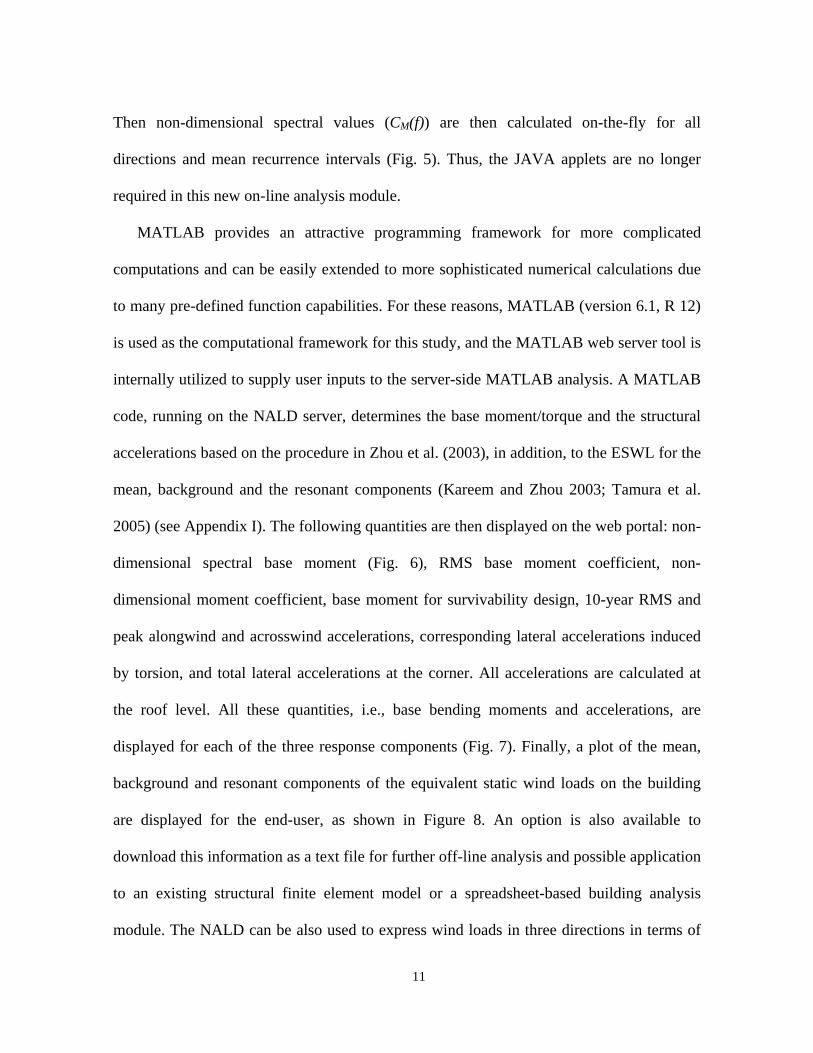
Then non-dimensional spectral values (CM(f)) are then calculated on-the-fly for all
directions and mean recurrence intervals (Fig. 5). Thus, the JAVA applets are no longer
required in this new on-line analysis module.
MATLAB provides an attractive programming framework for more complicated
computations and can be easily extended to more sophisticated numerical calculations due
to many pre-defined function capabilities. For these reasons, MATLAB (version 6.1, R 12)
is used as the computational framework for this study, and the MATLAB web server tool is
internally utilized to supply user inputs to the server-side MATLAB analysis. A MATLAB
code, running on the NALD server, determines the base moment/torque and the structural
accelerations based on the procedure in Zhou et al. (2003), in addition, to the ESWL for the
mean, background and the resonant components (Kareem and Zhou 2003; Tamura et al.
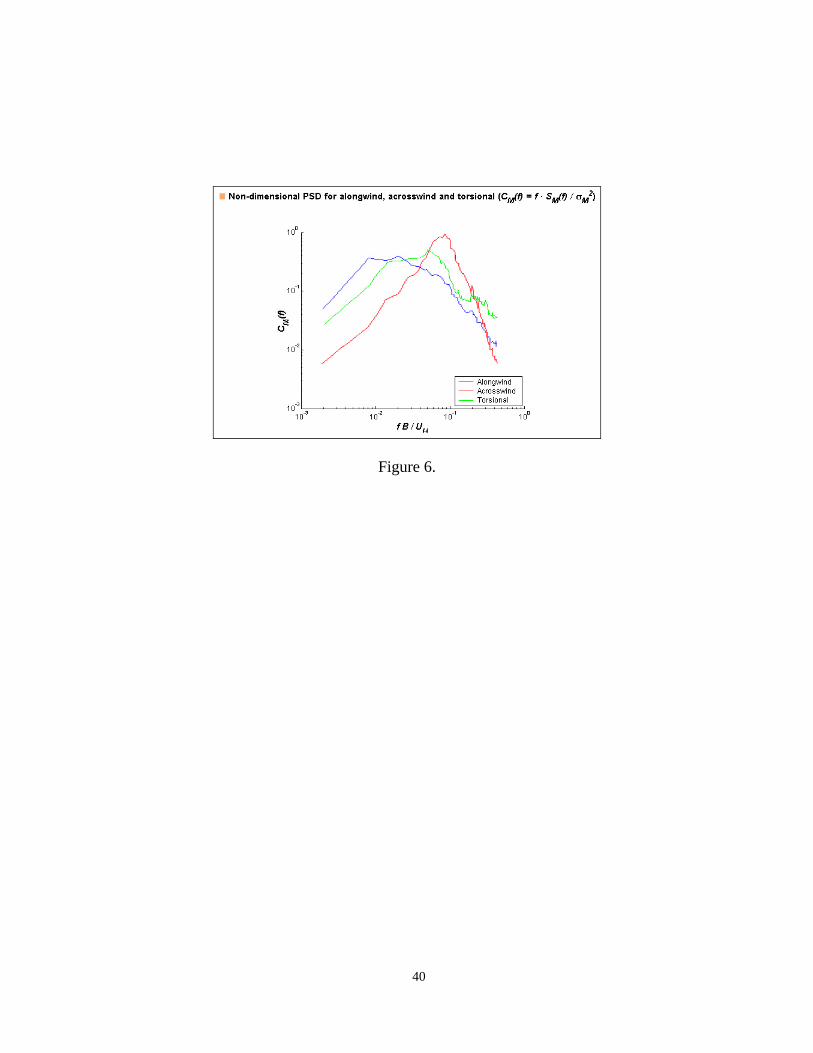
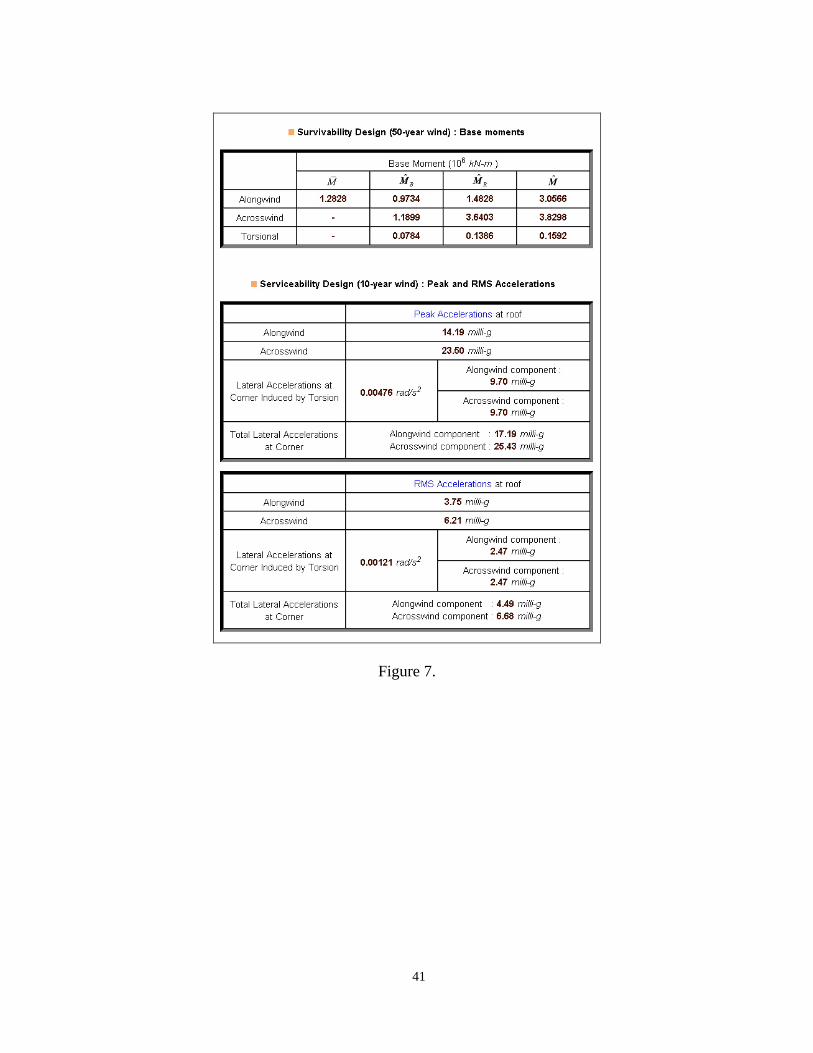
2005) (see Appendix I). The following quantities are then displayed on the web portal: non-
dimensional spectral base moment (Fig. 6), RMS base moment coefficient, non-
dimensional moment coefficient, base moment for survivability design, 10-year RMS and
peak alongwind and acrosswind accelerations, corresponding lateral accelerations induced
by torsion, and total lateral accelerations at the corner. All accelerations are calculated at
the roof level. All these quantities, i.e., base bending moments and accelerations, are
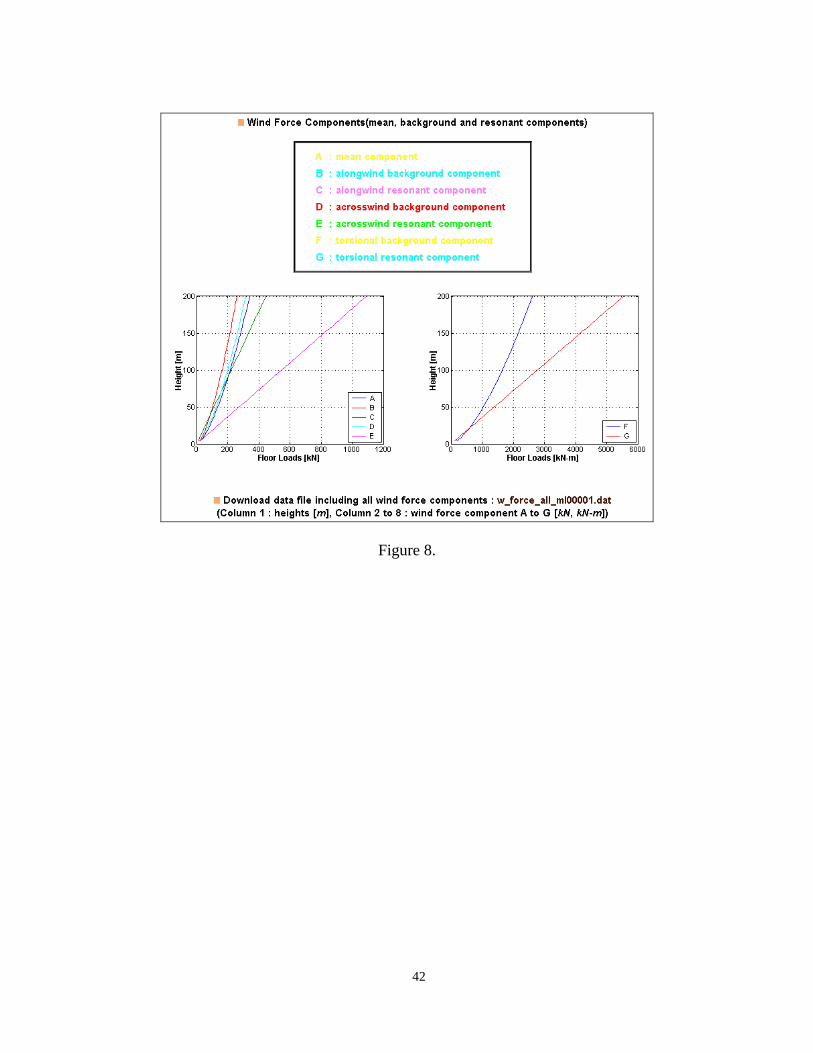
displayed for each of the three response components (Fig. 7). Finally, a plot of the mean,
background and resonant components of the equivalent static wind loads on the building
are displayed for the end-user, as shown in Figure 8. An option is also available to
download this information as a text file for further off-line analysis and possible application
to an existing structural finite element model or a spreadsheet-based building analysis
module. The NALD can be also used to express wind loads in three directions in terms of
12
3-D gust loading factors (GLF), akin to the along wind GLF (Kareem and Zhou 2003;
Tamura et al. 2005).
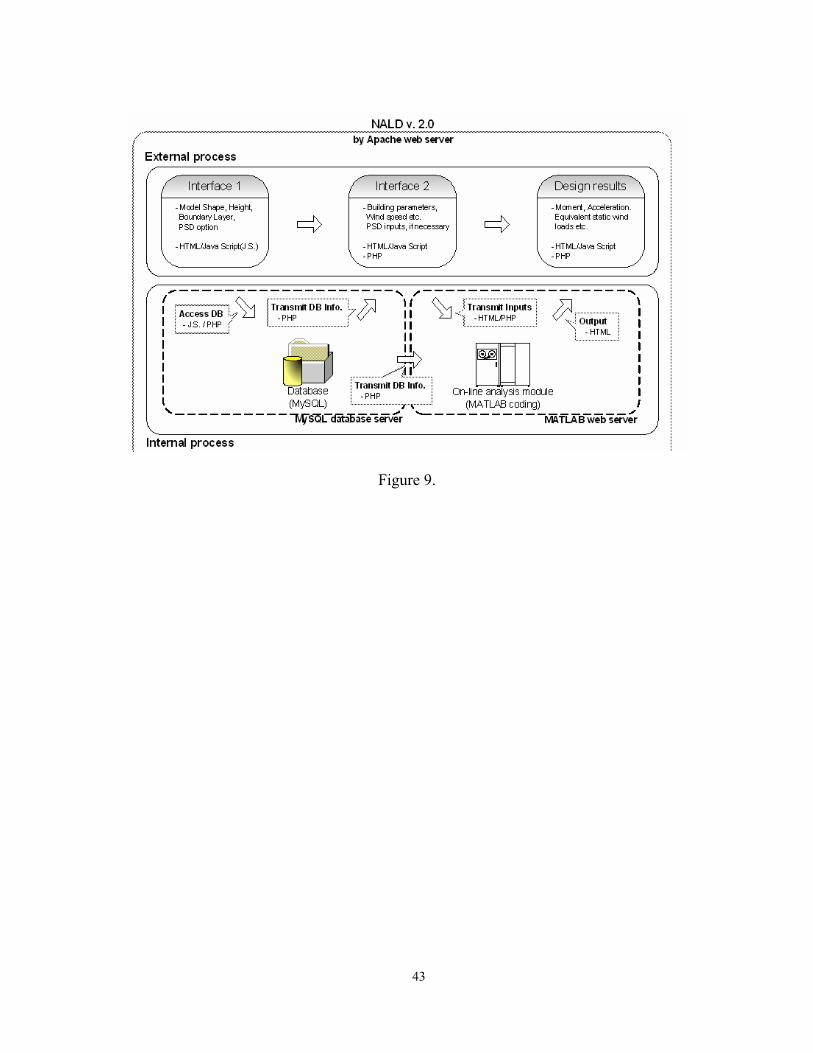
The architecture of NALD v. 2.0 and the role of various web-based tools such as
HTML/Java Script and PHP are summarized in Figure 9. It is basically operated by Apache
web server with two main processes, i.e., external process and internal process. The
external process includes user-friendly interfaces for the selection of a desired analysis case
in Figure 2 (interface 1), additional interfaces for design inputs such as structural
parameters of building in Figure 3 (interface 2) and display of analysis results for the user-
specified building. On the other hand, the internal processes are server-side operations
involving MySQL for database operations and MATLAB web servers for the
computational schemes are implicitly utilized in this revised NALD. The MySQL database
server handles data transmissions between interfaces and if necessary, transmits
information stored in the database. The MATLAB web server functions as a numerical
analysis engine for on-the-fly calculations as well as serving as the nexus between interface
2 and the design results. The on-line analysis module performs the requisite calculations
and then generates meaningful figures such as the non-dimensional PSD and equivalent
static wind loads, as well as the ESWL text file.
It should again be emphasized that one unique feature provided by this on-line analysis
module is the user’s non-dimensional PSD options. As mentioned earlier, NALD v. 2.0
provides the user with three PSD options. Thus, the user can utilize not only the PSD data
offered by the NALD, but also any arbitrary PSD expression or data set for the on-line
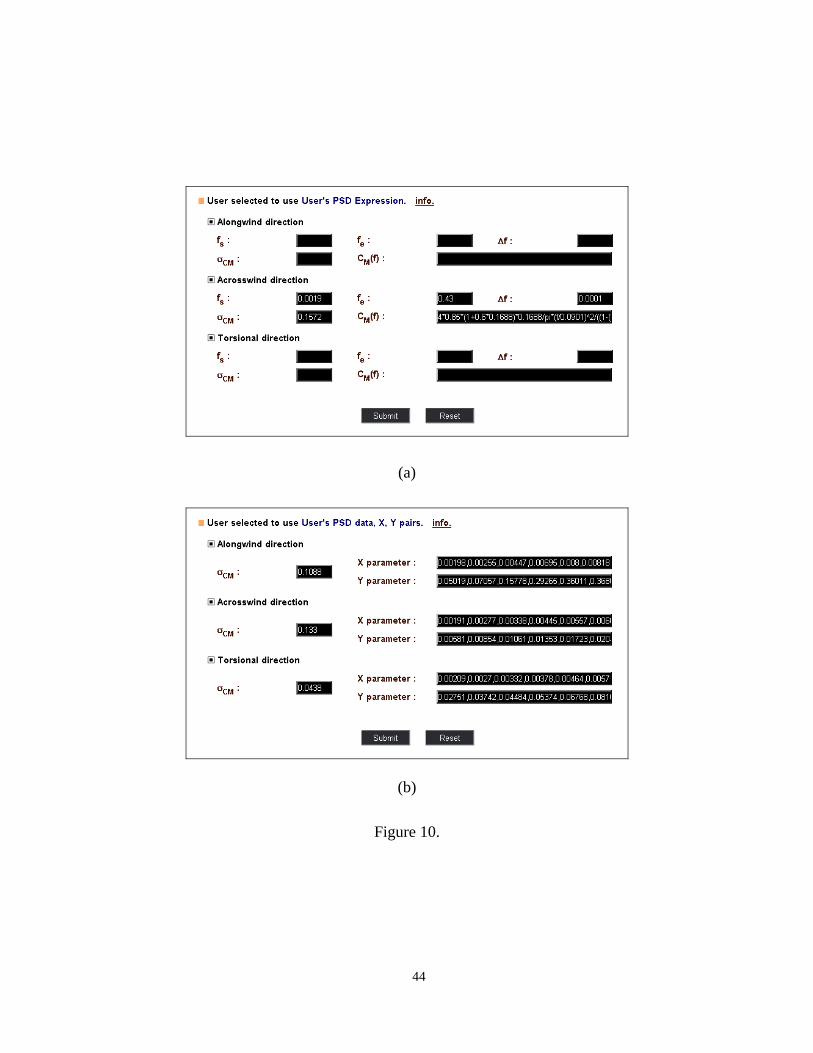
determination of wind load effects on high-rise buildings. Depending on the selected PSD
option specified in Figure 2, additional inputs will be requested following the prompt for
13
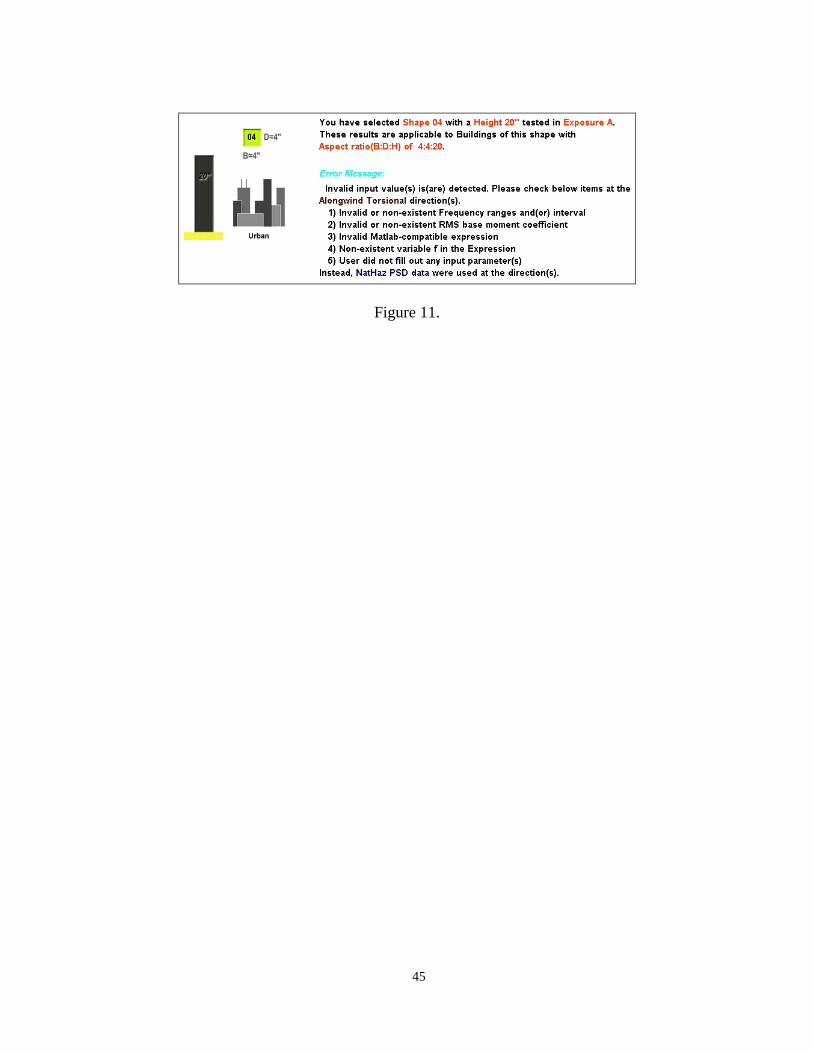
structural inputs (interface 2 in Fig. 3). Figure 10a shows the supplemental interface for
user-supplied PSD expressions, while Figure 10b shows the supplemental interface for
user-supplied PSD data sets of X (non-dimensional frequency) and Y (spectral coordinate)
pairs. Since this on-line analysis module mainly utilizes MATLAB, the aforementioned
inputs should be MATLAB compatible. The “Info link” displayed in the top line provides
the user with simple guidelines to minimize unexpected input errors. The on-line analysis
module also includes a simple error-detection scheme with pop-up error messages, which
alert users if input values are beyond the NALD’s range of applicability. The provision for
PSD options extends the utility of NALD v. 2.0 beyond its predecessor by offering an on-
line dynamic analysis framework that can be utilized for estimating dynamic load effects on
high-rise buildings with alternative input options, e.g., an independent wind tunnel study or
empirical expression from any wind load standard. This versatility provides users with a
robust stand-alone, on-line analysis engine that offers the flexibility option of utilizing user-
supplied custom spectral description or wind tunnel test results to provide final design
estimates of wind load effects on buildings and permit comparative studies of predictions
from various sources.
EXAMPLES
The example building and wind environment used in Zhou et al. (2003) are utilized
again in this study for consistency. Note that NALD v. 1.0 provided users with the spectral
amplitude at a specified reduced frequency only, thus requiring manual calculation of the
desired response components following the procedure provided on the NALD website,
14
based on the work by Zhou et al. (2003). The new version conducts all computations
automatically via the on-line analysis module. The example building characteristics are
summarized here for completeness and as a demonstration of the type of data an end-user
must input to analysis module: building dimension perpendicular to oncoming wind B = 40
m; building dimension parallel to oncoming wind D = 40 m; building height H = 200 m;
natural frequency in alongwind, acrosswind and torsional directions, respectively, fx = 0.2
Hz; fy = 0.2 Hz; fθ = 0.35 Hz; bulk density ρB = 250 kg/m3; average radius of gyration γ =
18 m; damping ratio ζ = 0.02; interstory height ∆H = 4 m; air density ρA = 1.25 kg/m3; drag
force coefficient CD = 1.3; 3-second reference wind speed at 10 m U10 = 63 m/s (50-year
MRI); mode shapes for all directions are assumed to be linear and the building is assumed
to be located in an urban area. Thus the model is selected as Shape 4 (D/B = 1), Height = 20
in. ( / 5H BD = ) in terrain category BL2 (Exposure A). Based on these input conditions,
analyses employing different PSD options are performed to demonstrate the capabilities of
the on-line analysis module. An additional example (Example 4) is reported for the building
used extensively in comparative studies and also in the Commentary for the Australian
Standard (Holmes et al. 1990).
Example 1 – NALD experimental data (PSD option 1)
For the previously specified reference wind speed, the 50-year and 10-year wind speeds
at the building height are determined to be 51.30 m/s and 37.96 m/s, respectively, for
survivability and serviceability response estimates (Zhou et al. 2003). The corresponding
alongwind, acrosswind and torsional loading spectra based on the NALD experimental data
15
were shown previously in Figure 6 and the display of the corresponding response estimates
automatically computed by the on-line analysis module were previously demonstrated in
Figure 7. These include: mean, peak background, peak resonant and total peak base
moments for survivability design, and peak and RMS accelerations at the roof level for
serviceability design. The results match those manually computed by Zhou et al. (2003).
The output also includes distributions of the equivalent static wind load components: mean,
background and resonant, for all response directions, as shown previously in Figure 8.
These load distributions can be downloaded by the user for incorporation into models
developed using various commercial software packages to allow for further analysis and
design of structural members. This exercise establishes that the real-time analysis module
provides response estimates that are consistent with manual calculations presented
previously by Zhou et al. (2003).
Example 2 – User’s PSD expression (PSD option 2)
As mentioned earlier, NALD v. 2.0 provides the user with an opportunity to utilize the
various types of empirical PSD expressions available. This, for example, permits
comparative analyses to demonstrate the impacts of generalized spectral expressions versus
precise spectral values drawn directly from PSDs of HFBB data. In this example,
acrosswind PSD expressions specified by AIJ (1996, 2004) and Gu and Quan (2004),
detailed in Appendix II, are considered.
The requisite inputs for this option were shown previously in Figure 10a: a non-
dimensional power spectrum, CM(f), where, CM(f) = f ·SM(f) / σM2, f : frequency (Hz), SM(f) :
16
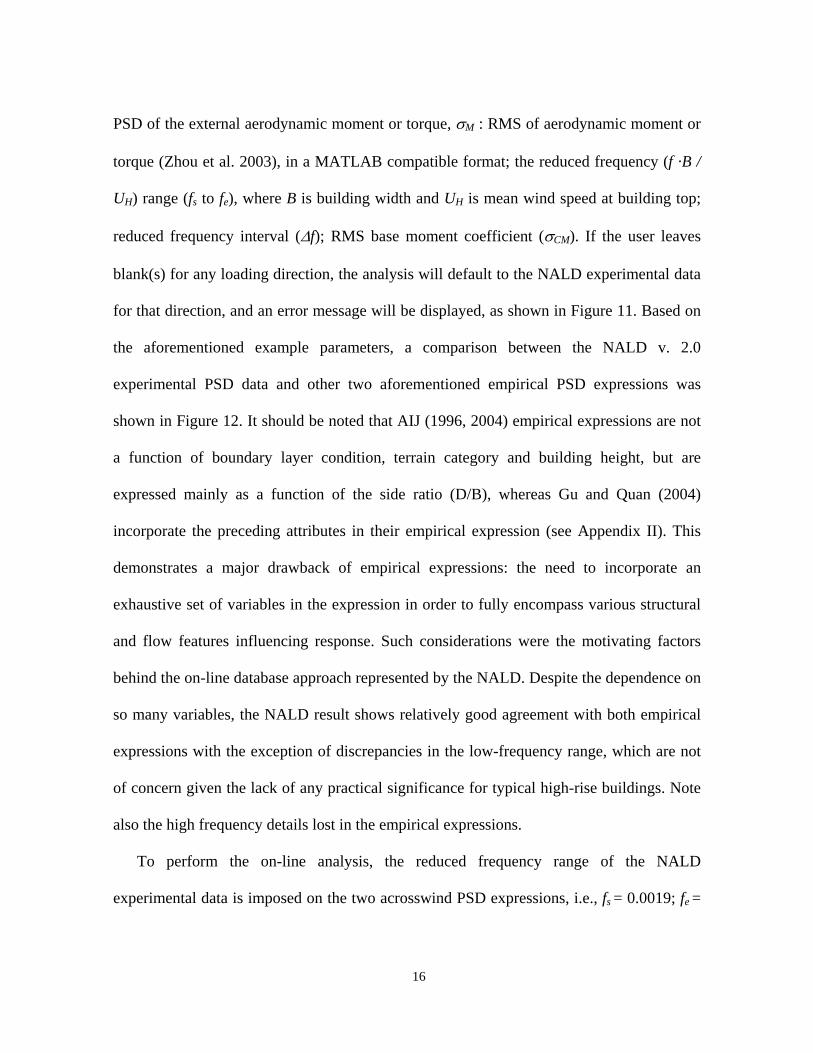
PSD of the external aerodynamic moment or torque, σM : RMS of aerodynamic moment or
torque (Zhou et al. 2003), in a MATLAB compatible format; the reduced frequency (f ·B /
UH) range (fs to fe), where B is building width and UH is mean wind speed at building top;
reduced frequency interval (∆f); RMS base moment coefficient (σCM). If the user leaves
blank(s) for any loading direction, the analysis will default to the NALD experimental data
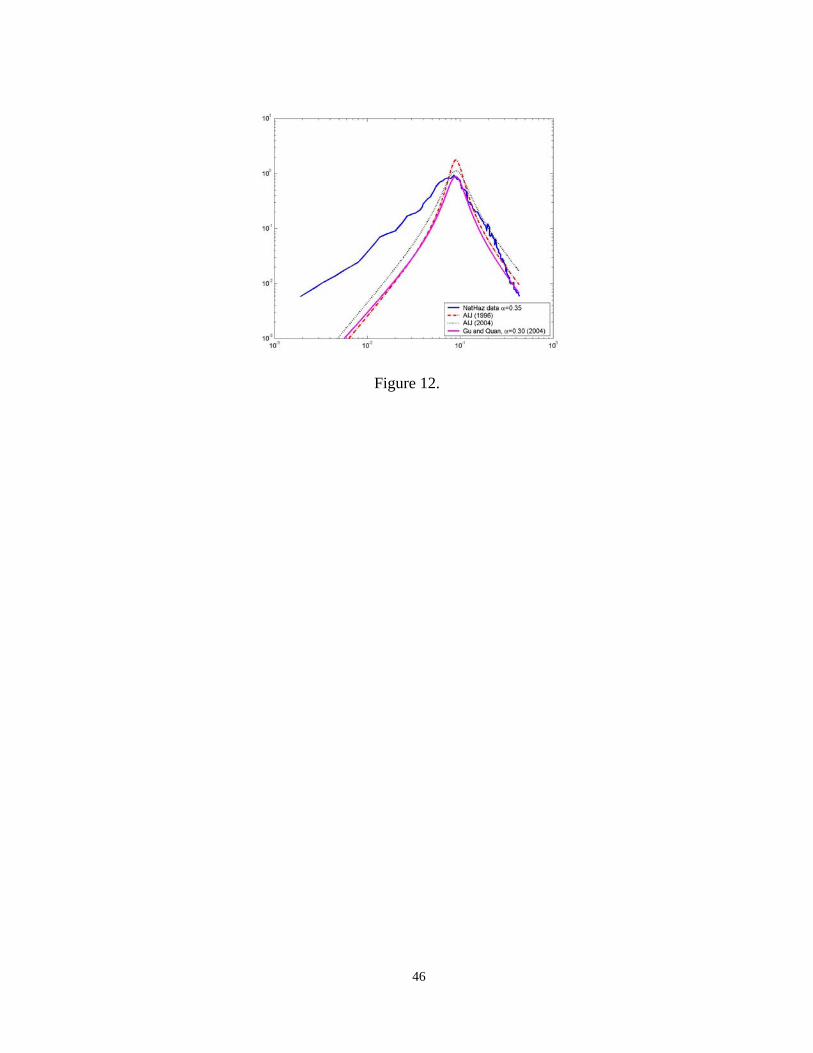
for that direction, and an error message will be displayed, as shown in Figure 11. Based on
the aforementioned example parameters, a comparison between the NALD v. 2.0
experimental PSD data and other two aforementioned empirical PSD expressions was
shown in Figure 12. It should be noted that AIJ (1996, 2004) empirical expressions are not
a function of boundary layer condition, terrain category and building height, but are
expressed mainly as a function of the side ratio (D/B), whereas Gu and Quan (2004)
incorporate the preceding attributes in their empirical expression (see Appendix II). This
demonstrates a major drawback of empirical expressions: the need to incorporate an
exhaustive set of variables in the expression in order to fully encompass various structural
and flow features influencing response. Such considerations were the motivating factors
behind the on-line database approach represented by the NALD. Despite the dependence on
so many variables, the NALD result shows relatively good agreement with both empirical
expressions with the exception of discrepancies in the low-frequency range, which are not
of concern given the lack of any practical significance for typical high-rise buildings. Note
also the high frequency details lost in the empirical expressions.
To perform the on-line analysis, the reduced frequency range of the NALD
experimental data is imposed on the two acrosswind PSD expressions, i.e., fs = 0.0019; fe =
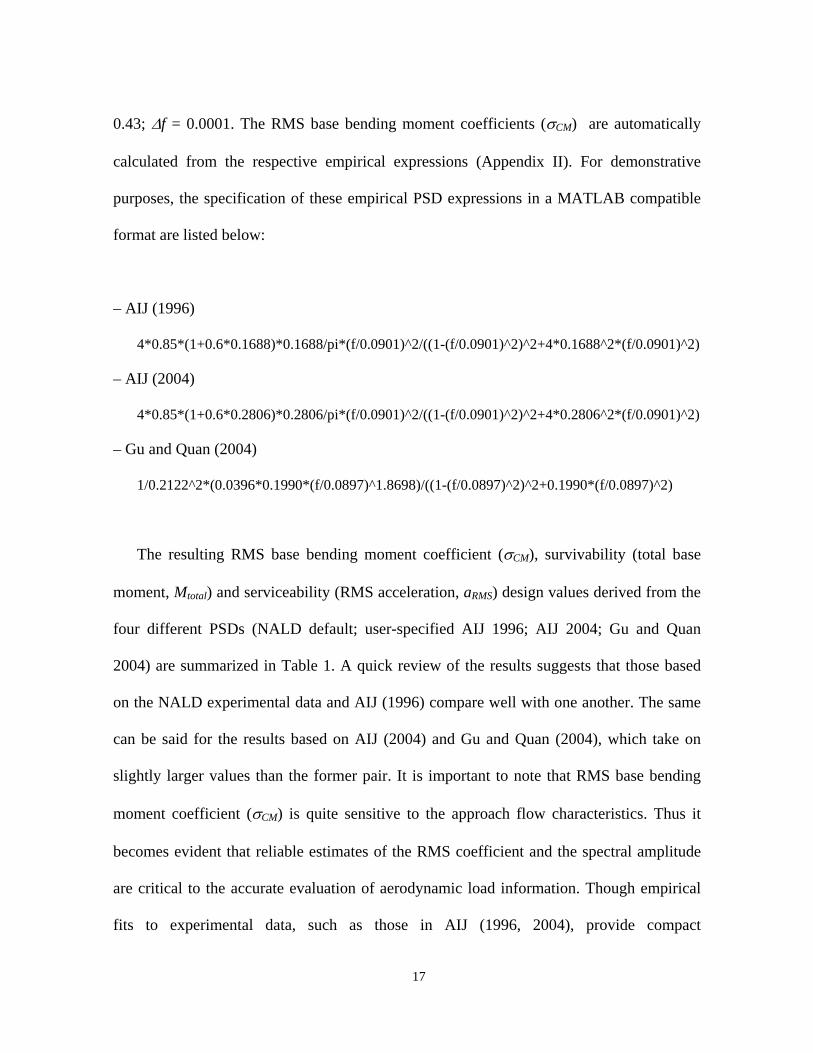
17
0.43; ∆f = 0.0001. The RMS base bending moment coefficients (σCM) are automatically
calculated from the respective empirical expressions (Appendix II). For demonstrative
purposes, the specification of these empirical PSD expressions in a MATLAB compatible
format are listed below:
– AIJ (1996)
4*0.85*(1+0.6*0.1688)*0.1688/pi*(f/0.0901)^2/((1-(f/0.0901)^2)^2+4*0.1688^2*(f/0.0901)^2)
– AIJ (2004)
4*0.85*(1+0.6*0.2806)*0.2806/pi*(f/0.0901)^2/((1-(f/0.0901)^2)^2+4*0.2806^2*(f/0.0901)^2)
– Gu and Quan (2004)
1/0.2122^2*(0.0396*0.1990*(f/0.0897)^1.8698)/((1-(f/0.0897)^2)^2+0.1990*(f/0.0897)^2)
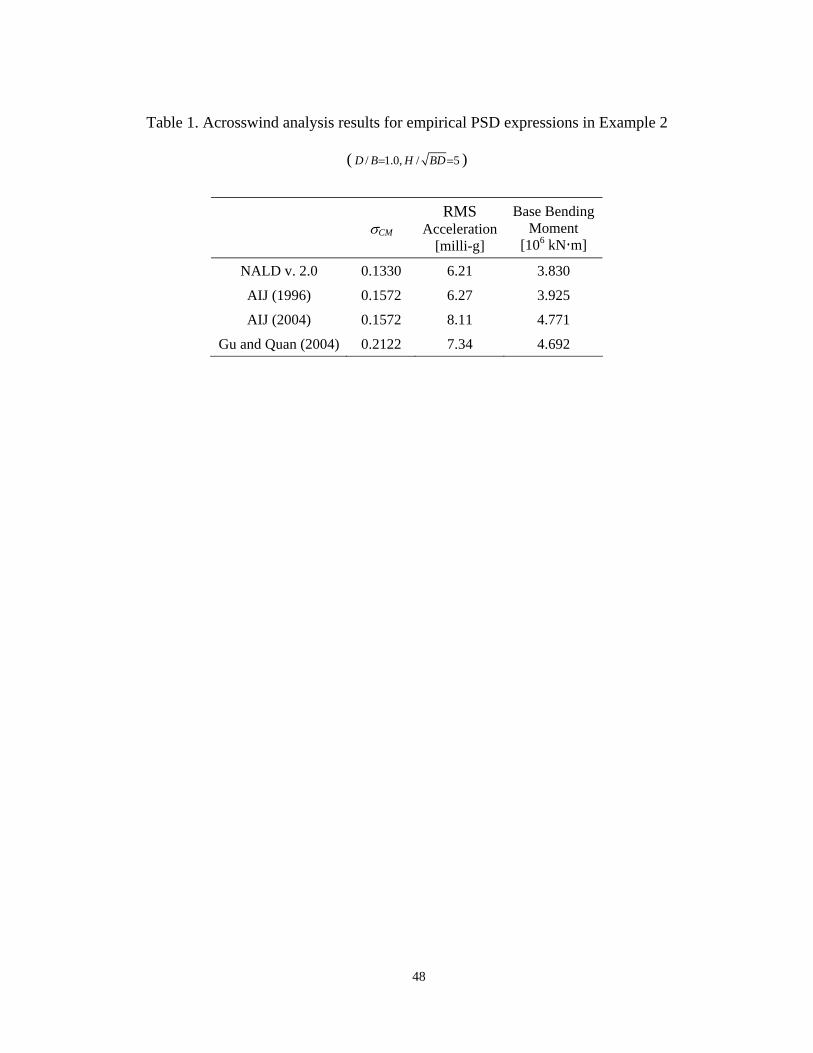
The resulting RMS base bending moment coefficient (σCM), survivability (total base
moment, Mtotal) and serviceability (RMS acceleration, aRMS) design values derived from the
four different PSDs (NALD default; user-specified AIJ 1996; AIJ 2004; Gu and Quan
2004) are summarized in Table 1. A quick review of the results suggests that those based
on the NALD experimental data and AIJ (1996) compare well with one another. The same
can be said for the results based on AIJ (2004) and Gu and Quan (2004), which take on
slightly larger values than the former pair. It is important to note that RMS base bending
moment coefficient (σCM) is quite sensitive to the approach flow characteristics. Thus it
becomes evident that reliable estimates of the RMS coefficient and the spectral amplitude
are critical to the accurate evaluation of aerodynamic load information. Though empirical
fits to experimental data, such as those in AIJ (1996, 2004), provide compact
18
representations for use in codes and standards, they cannot accurately represent
experimental data for all possible building configurations and flow conditions again
motivating the on-line database philosophy of NALD. However, in light of these factors,
the results are in reasonable agreement. Furthermore, it is also demonstrated that the on-line
analysis module works effectively for user-supplied PSD expressions.
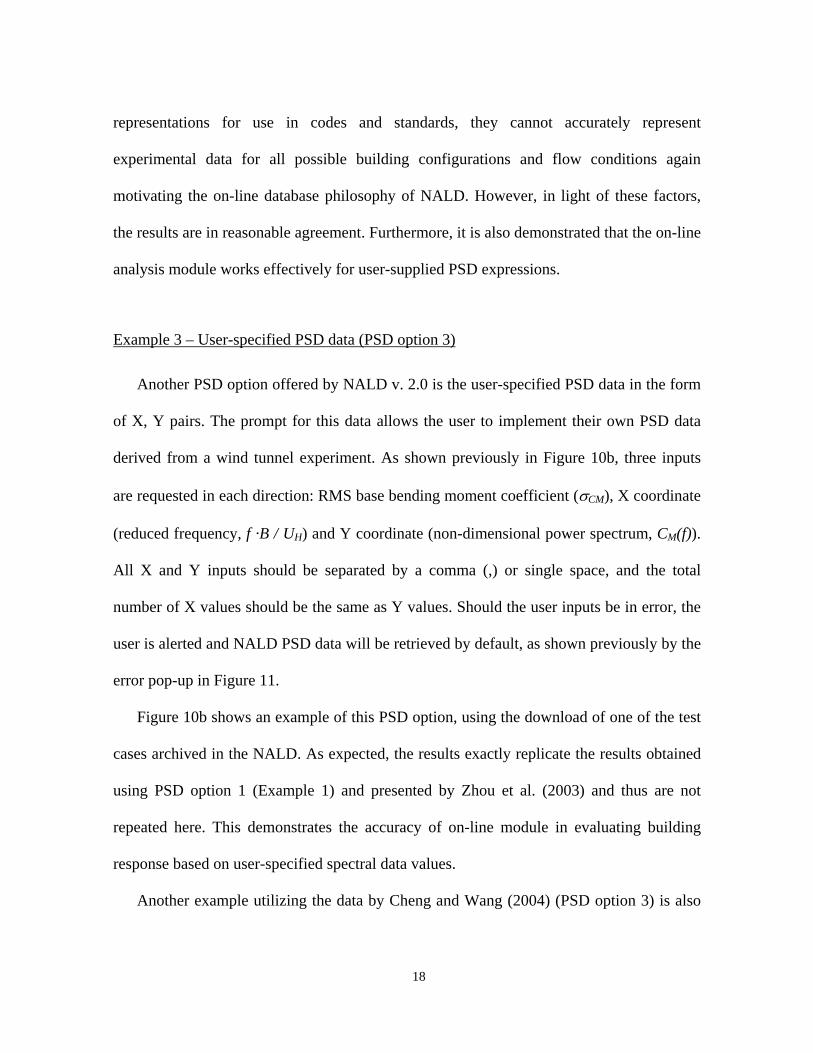
Example 3 – User-specified PSD data (PSD option 3)
Another PSD option offered by NALD v. 2.0 is the user-specified PSD data in the form
of X, Y pairs. The prompt for this data allows the user to implement their own PSD data
derived from a wind tunnel experiment. As shown previously in Figure 10b, three inputs
are requested in each direction: RMS base bending moment coefficient (σCM), X coordinate
(reduced frequency, f ·B / UH) and Y coordinate (non-dimensional power spectrum, CM(f)).
All X and Y inputs should be separated by a comma (,) or single space, and the total
number of X values should be the same as Y values. Should the user inputs be in error, the
user is alerted and NALD PSD data will be retrieved by default, as shown previously by the
error pop-up in Figure 11.
Figure 10b shows an example of this PSD option, using the download of one of the test
cases archived in the NALD. As expected, the results exactly replicate the results obtained
using PSD option 1 (Example 1) and presented by Zhou et al. (2003) and thus are not
repeated here. This demonstrates the accuracy of on-line module in evaluating building
response based on user-specified spectral data values.
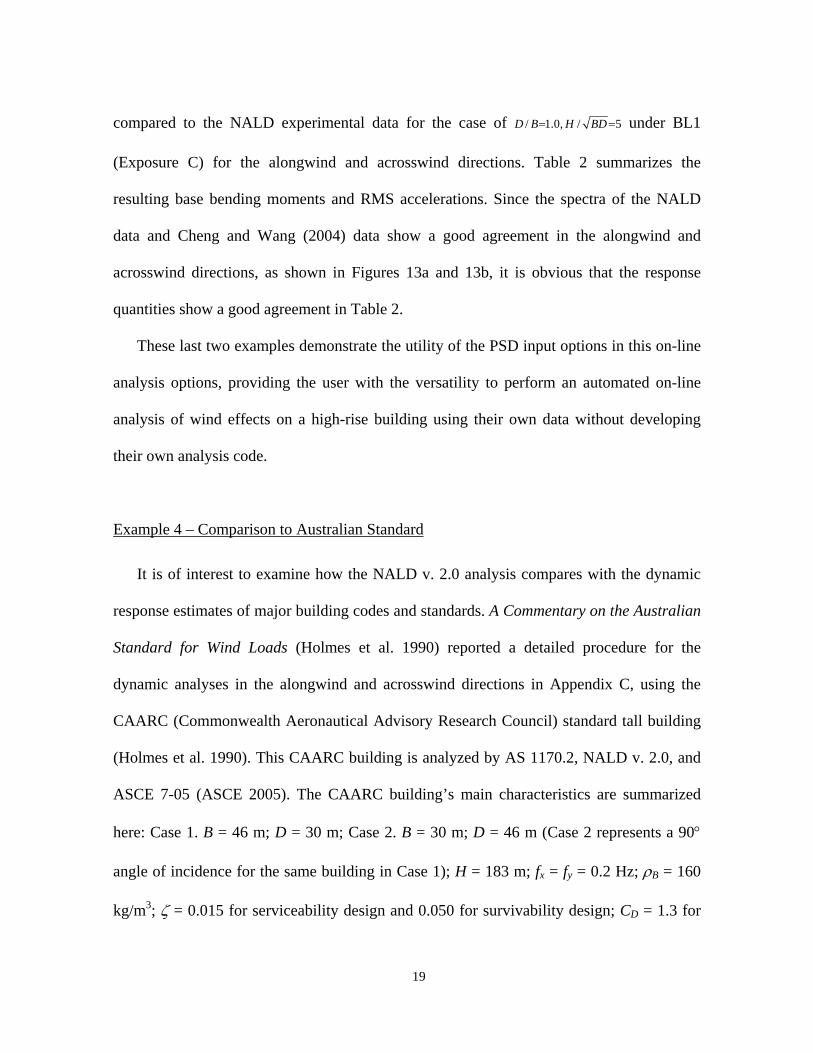
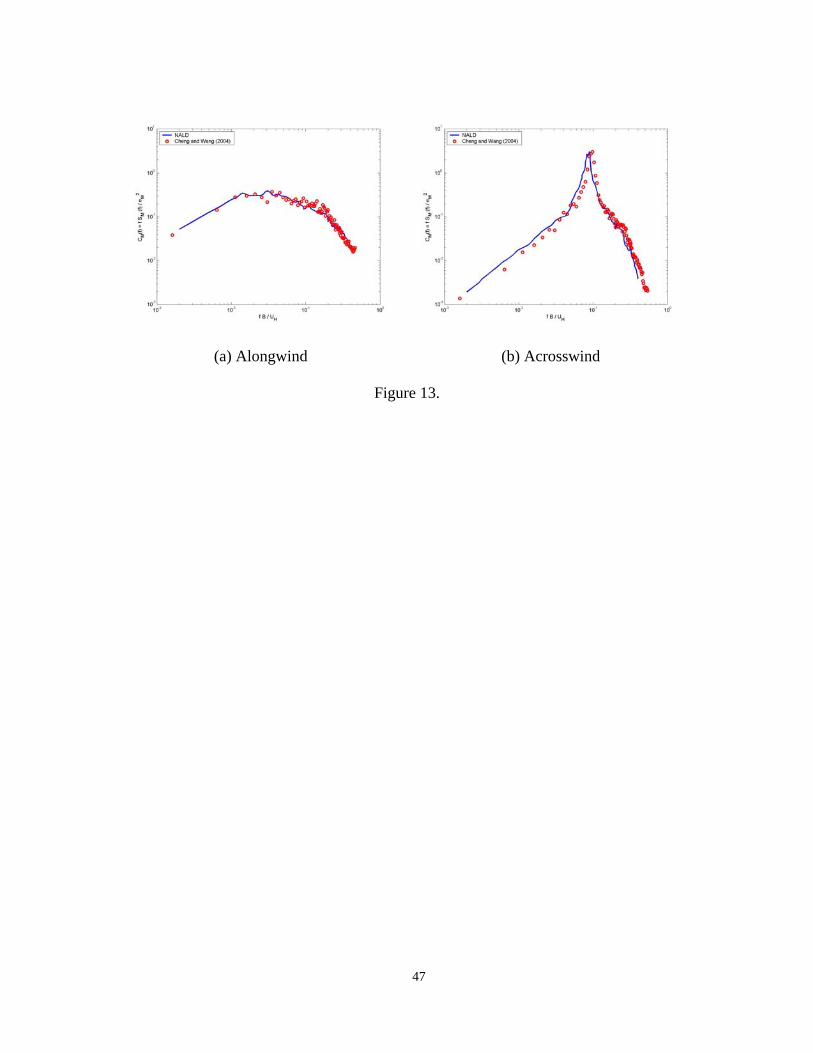
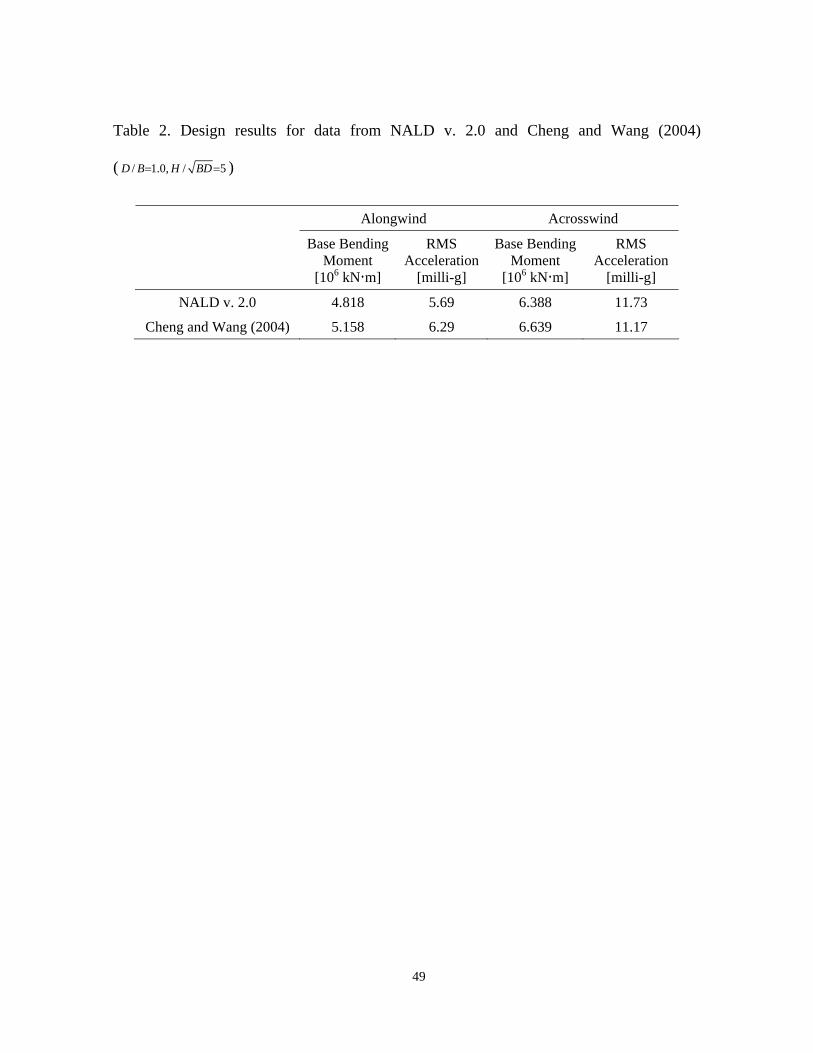
Another example utilizing the data by Cheng and Wang (2004) (PSD option 3) is also
19
compared to the NALD experimental data for the case of / 1.0, / 5D B H BD= = under BL1
(Exposure C) for the alongwind and acrosswind directions. Table 2 summarizes the
resulting base bending moments and RMS accelerations. Since the spectra of the NALD
data and Cheng and Wang (2004) data show a good agreement in the alongwind and
acrosswind directions, as shown in Figures 13a and 13b, it is obvious that the response
quantities show a good agreement in Table 2.
These last two examples demonstrate the utility of the PSD input options in this on-line
analysis options, providing the user with the versatility to perform an automated on-line
analysis of wind effects on a high-rise building using their own data without developing
their own analysis code.
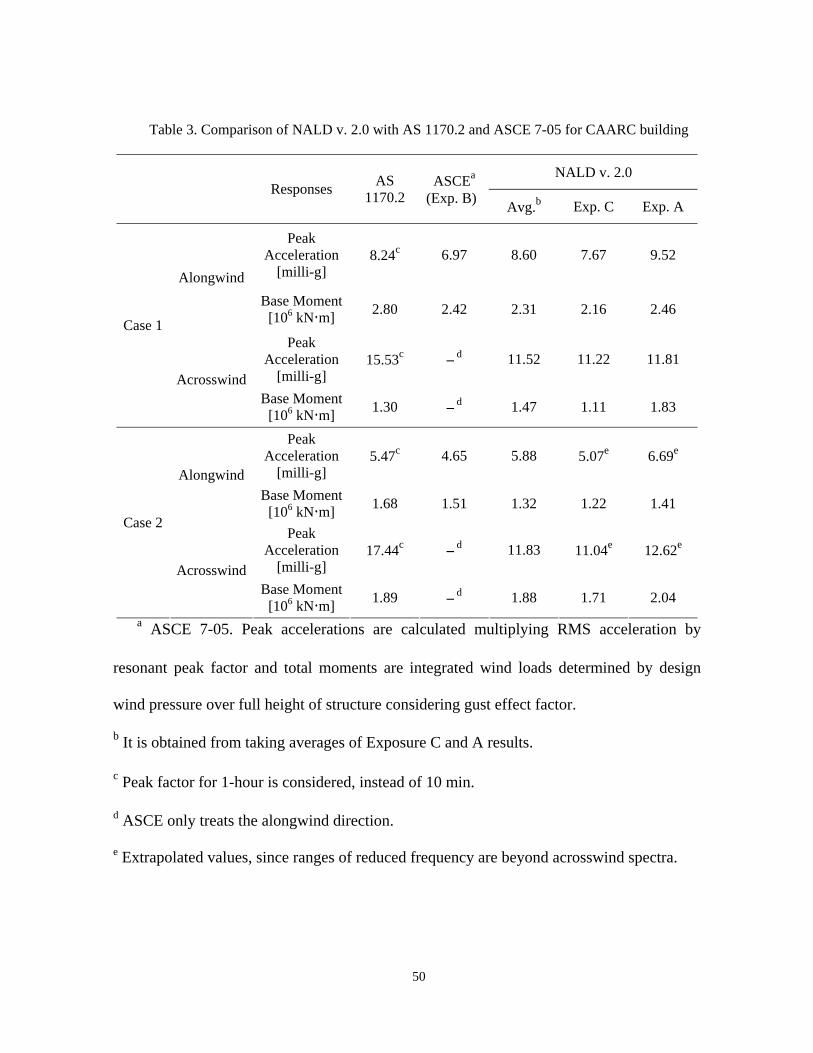
Example 4 – Comparison to Australian Standard
It is of interest to examine how the NALD v. 2.0 analysis compares with the dynamic
response estimates of major building codes and standards. A Commentary on the Australian
Standard for Wind Loads (Holmes et al. 1990) reported a detailed procedure for the
dynamic analyses in the alongwind and acrosswind directions in Appendix C, using the
CAARC (Commonwealth Aeronautical Advisory Research Council) standard tall building
(Holmes et al. 1990). This CAARC building is analyzed by AS 1170.2, NALD v. 2.0, and
ASCE 7-05 (ASCE 2005). The CAARC building’s main characteristics are summarized
here: Case 1. B = 46 m; D = 30 m; Case 2. B = 30 m; D = 46 m (Case 2 represents a 90°
angle of incidence for the same building in Case 1); H = 183 m; fx = fy = 0.2 Hz; ρB = 160
kg/m3; ζ = 0.015 for serviceability design and 0.050 for survivability design; CD = 1.3 for
20
Case 1 and 1.19 for Case 2; mode shapes for all directions are assumed linear. In Holmes et
al. (1990), it was assumed that the CAARC building was located in Brisbane (terrain
category 3), which corresponds to Exposure B in ASCE 7-05. Since NALD v. 2.0 handles
Exposures A (BL2) and C (BL1) only, comparisons are made for both exposures, as well as
their average, as they should provide upper and lower limits for the CAARC building. It
should be pointed out that base moments in the AS 1170.2 were calculated for the ultimate
limit state design, corresponding to wind speed of 1000-year return period, while
accelerations were calculated for a 5-year return period, and the peak factor was evaluated
for 10 minutes, instead of the 1-hour used in both NALD v. 2.0 and ASCE 7-05. On the
other hand, NALD v. 2.0 observes the standards set by ASCE 7: 50-year return period for
base moments (survivability design), and 10-year return period for accelerations
(serviceability design). Thus, proper modifications to wind speed (to account for
differences in return period) and peak factor (to account for differences in averaging
interval) are required to compare AS 1170.2 with both NALD v. 2.0 and ASCE 7-05 results.
As such, AS 1170.2 RMS results are translated to peak accelerations based on a peak factor
calculated over 1 hour. The design wind speed for NALD v. 2.0 and ASCE 7-05 are
adjusted using the relationships in ASCE 7-05 for a 1000-year return period in base
moment calculations and a 5-year return period in acceleration calculations, so that they
may be compared to the results of AS 1170.2 directly. As shown in Table 3, AS 1170.2
responses show relatively higher values (conservative) in comparison with NALD v. 2.0
and ASCE 7-05, except for the alongwind peak accelerations, which show good agreement.
The discrepancies may in part be attributed to the measurement approach used to estimate
aerodynamic loads. The data used in the Australian Standard is based on an aeroelastic
21
model and load spectra are estimated by an inverse approach, which may have inherent
identification errors. The other possible source may be the differences in the approach flow
conditions, which have influence on the acrosswind response. Another important advantage
of NALD v. 2.0 is also underscored by this example; it provides a means to estimate the
acrosswind response that ASCE 7 does not provide, outside of its commentary.
These examples demonstrate the capabilities and accuracy of NALD v. 2.0, providing a
user-friendly procedure to reliably estimate building dynamic responses. The authors
envision this capability to be particularly useful for those who may not be very familiar
with the details of the dynamic analysis procedure typically employed in response
estimation for wind-sensitive structures. In addition, the robust framework presented here is
conveniently amenable to including additional data for other building cross-sections and
flow conditions.
CONCLUDING REMARKS
The rapid development of the Internet technologies has revolutionized many
engineering applications. This study discusses the use of these advances to enhance, for the
purposes of analysis and design, the accessibility, organization, dissemination and utility of
wind tunnel data. The second version of the NatHaz Aerodynamic Loads Database (NALD
v. 2.0) (http://aerodata.ce.nd.edu) integrates these technologies for the purposes of wind-
induced response prediction. NALD v. 2.0 offers more attractive and user-friendly features
to allow on-line determination of not only the base moments and the equivalent static wind
22
loads for survivability design, but also accelerations for serviceability (habitability) design.
Several web-based tools such as PHP and MySQL are fused with MATLAB to create
efficient yet computationally robust interfaces that process, convert and analyze wind
tunnel data on-the-fly with minimal user effort. The attractive feature of this on-line
processing approach is that no user intervention is expended in the determination and
display of wind loads and response quantities for the preliminary design of high-rise
buildings. Moreover, this on-line analysis module provides the flexibility to utilize not only
the NALD experimental PSD data, but also user-specified PSD expressions or data sets.
This versatility provides users with a robust stand-alone, on-line analysis engine for high-
rise buildings using various data sources. Further, the architecture used in this study permits
easy extensions to more sophisticated numerical analyses by employing the many pre-
defined function capabilities of MATLAB operating in the server-side. While, the analysis
capabilities offered by NALD v. 2.0 are not necessarily intended to replace customized
wind tunnel testing in the final design stages, they do provide users with an efficient means
to approximate the complete 3-D response of buildings in the early design stage, which has
not been fully treated in most codes and standards. However, the analysis engine built into
NALD v. 2.0 offers the option of utilizing user-supplied custom spectral description or
wind tunnel test results to obtain final design estimates of wind load effects on buildings.
It should be noted that the web-based tools used to establish the interface and analysis
modules described in this study are continuously updated as evolving security and
vulnerability issues are identified. Due to this constant updating, the interfaces are likely to
experience some cosmetic changes since the publication of this manuscript.
23
ACKNOWLEDGEMENTS
The authors wish to acknowledge Dr. Yin Zhou of CPP, Inc., Dr. Chii-Ming Cheng,
Tamkang University, Taipei and Ms. Rachel Bashor, NatHaz Modeling Laboratory for their
respective contributions. The authors are also grateful for the financial support in part by
the National Science Foundation via grant CMS 03-24331 and a Postdoctoral Fellowship
from Korea Science and Engineering Foundation (KOSEF).
REFERENCES
Architectural Institute of Japan (1996, 2004). Recommendations for loads on buildings,
Architectural Institute of Japan.
American Society of Civil Engineers (ASCE) (1998). Minimum design loads for buildings
and other structures, ASCE 7-98, ASCE, Reston, VA.
American Society of Civil Engineers (ASCE) (2005). Minimum design loads for buildings
and other structures, ASCE 7-05, ASCE, Reston, VA.
Boggs, D. W., and Peterka, J. A. (1989). “Aerodynamic model tests of tall buildings.”, J. of
Eng. Mech., ASCE, 115(3), 618-635.
Chan, C.-M., and Chui, J. K. L. (2006). “Wind-induced response and serviceability design
optimization of tall steel buildings.” Eng. Struct., 28, 503-513.
Chen, X., and Kareem, A. (2004). “Equivalent static wind loads on buildings: A new
model.” J. Struct. Eng., ASCE, 130(10), 1425-1435.
Chen, X., and Kareem, A. (2005). “Dynamic wind effects on buildings with 3-D coupled
modes: application of high frequency force balance measurements.” J. Eng. Mech.,
24
ASCE, 131(11), 1115-1125.
Cheng, C.-M., and Wang, J. (2004). “Wind tunnel database for an intermediate wind
resistance design of tall buildings.” Proc. 1st International Symposium on Wind
Effects on Buildings and Urban Environment, Tokyo, Japan.
Flay, R. G. J., and Bhat J. (2005). “Cross-wind force spectra for building geometries
commonly proposed for New Zealand cities.” Proc. 2nd Workshop on Regional
Harmonization of Wind Loading and Wind Environmental Specifications in Asia-
Pacific Economies (APEC-WW), Hong Kong, China.
Fritz, W. P., and Simiu E. (2005). “Probabilistic description of tall building response to
wind: Database-assisted design, dynamics, and wind directionality effects.” Proc. 9th
International Conference On Structural Safety and Reliability, Rome, Italy.
Fujii, K., Hibi, K., and Ueda, H. (1986). “A new measuring system using electronically
scanned pressure sensors (ESP) and some applications of the ESP system to a square
building shape.” Proc. 9th National Symposium on Wind Engineering, Tokyo, Japan,
313-318 (in Japanese).
Gu, M., and Quan, Y. (2004). “Across-wind loads of typical tall buildings.” J. Wind. Eng.
Ind. Aerodyn., 92, 1147-1165.
Ha, Y. C., Kim, D. W., and Kil, Y. S. (2004). “Characteristics of the across-wind
fluctuating force and spectral density of rectangular high-rise buildings with various
side ratios.” CTBUH 2004, Seoul, Korea, 978-982.
Ho, T. C. E., Lythe, G. R., and Isyumov, N. (1999). “Structural loads and responses from
the integration of instantaneous pressures.” Proc. 10th International Conference on
Wind Engineering, Copenhagen, Denmark, 1505-1510.
25
Holmes, J. D., Melbourne, W. H., and Walker G. R. (1990). A commentary on the
Australian standard for wind loads: AS 1170 Part 2, Australian Wind Engineering
Society.
Holmes, J. D., Rofail, A. W., and Aurelius, L. J. (2003). “High frequency base balance
methodologies for tall buildings with torsional and coupled resonant modes.” Proc.
11th International Conference on Wind Engineering, Lubbock, Texas, 2381-2388.
Huang, G., and Chen, X. (2006), “Analysis of wind load effects on modeling of equivalent
static wind loads of tall buildings based on synchronous pressure measurements.”
Proc. 4th International Symposium on Computational Wind Engineering, Yokohama,
Japan.
Kareem, A., and Cermak, J. E. (1979). “Wind tunnel simulation of wind-structure
interactions.” ISA Transactions, 18(4), 23-41.
Kareem, A. (1982). “Fluctuating wind loads on buildings.” J. Eng. Mech. Div., ASCE,
Vol.108, No.6, 1086-1102.
Kareem, A. (1988). “Measurements and analysis of pressure fluctuations on prismatic
structures in turbulent boundary layer flows.” J. Wind. Eng. Ind. Aerodyn., 137, 229-
235.
Kareem, A. (1989). “Mapping and synthesis of random pressure fields.” J. Eng. Mech.,
ASCE, 115(10), 2325-2332.
Kareem, A. (1990). “Measurement of pressure and force fields on building models in
simulated atmospheric flows.” J. Wind. Eng. Ind. Aerodyn., 36, 589-599.
Kareem, A. and Zhou, Y. (2003). “Gust loading factor – past, present and future” J. Wind.
Eng. Ind. Aerodyn., 91, 1301-1328.
26
Kijewski, T., and Kareem, A. (1998). “Dynamic wind effects: A comparative study of
provisions in codes and standards with wind tunnel data.” Wind Struct., 1(1), 77-109.
Kijewski, T., Kwon, D., and Kareem, A. (2003). “E-Technologies for wind effects on
structures.” Proc. 11th International Conference on Wind Engineering, Lubbock,
Texas, 2217-2224.
Kikuchi, H., Tamura, Y., Ueda, H., and Hibi, K. (1997). “Dynamic wind pressures acting
on a tall building model – Proper orthogonal decomposition.” J. Wind. Eng. Ind.
Aerodyn., 69-71, 631-646.
Kwon, D., Kijewski-Correa, T., and Kareem, A. (2004). “e-Analysis/Design of tall
buildings subjected to wind loads.” Proc. 10th Americas Conference on Wind
Engineering, Baton Rouge, LA.
Liang, S., Liu, S., Li, Q. S., Zhang, L., and Gu, M. (2002). “Mathematical model of
acrosswind dynamic loads on rectangular tall buildings.” J. Wind. Eng. Ind. Aerodyn.,
90, 1757-1770.
Liang, S., Li, Q. S., Liu, S., Zhang, L., and Gu, M. (2004). “Torsional dynamic wind loads
on rectangular tall buildings.” Eng. Struct, 26, 129-137.
Lin, N., Letchford, C., Tamura, Y., Liang, B., and Nakamura, O. (2005). “Characteristics of
wind forces acting on tall buildings.” J. Wind. Eng. Ind. Aerodyn., 93, 217-242.
McNamara, R. J. (2005). “Some current trends in high rise structural design.”
STRUCTURE magazine, September, 19-23.
Reinhold, T. A., and Kareem, A. (1986). “Wind loads and building response predictions
using force-balance techniques.” Proc. 3rd ASCE Engineering Mechanics Specialty
Conference on Dynamic Response of Structures, UCLA, Los Angeles.
27
Solari, G., and Kareem, A. (1998). “On the formulation of ASCE 7-95 gust effect factor.”
J. Wind. Eng. Ind. Aerodyn., 77-78, 673-684.
Steckley, A., Accardo, M., Gamble, S. L., and Irwin, P. A. (1992). “The use of integrated
pressures to determine overall wind-induced response.” J. Wind. Eng. Ind. Aerodyn.,
42, 1023-1034.
Tamura, Y., Kawai, H., Uematsu, Y., Marukawa, H., Fujii, K., and Taniike, Y. (1996).
“Wind load and wind-induced response estimations in the Recommendations for
Loads on Buildings, AIJ 1993.” Eng. Struct., 18(6), 399-411.
Tamura, Y., Kareem, A., Solari, G., Kwok, K. C. S., and Holmes, J. D. (2005). “Aspects of
the dynamic wind-induced response of structures and codification.” Wind Struct., 8(4),
251-268.
Tschanz, T., and Davenport, A. G. (1983). “The base balance technique for the
determination of dynamic wind loads.” J. Wind. Eng. Ind. Aerodyn., 13(1-3), 429-439.
Vickery, P. J., Steckley, A. C., Isyumov, N., and Vickery, B. J. (1985). “The effect of mode
shape on the wind-induced response of tall buildings.” Proc. 5th U. S. National
Conference on Wind Engineering, Texas Tech University, Lubbock, Texas, 1B, 41-48.
Xu, Y. L., and Kwok, K. C. S. (1993). “Mode shape corrections for wind tunnel tests of tall
buildings.” Eng. Struct., 15(5), 387-392.
Zhou, Y., and Kareem, A. (2001). “Gust loading factors: New model.” J. Struct. Eng.,
ASCE, 127(2), 168-175.
Zhou, Y., Kareem, A., and Gu, M. (2002). “Mode shape corrections for wind load effects.”
J. Eng. Mech., ASCE, 128(1), 15-23.
Zhou, Y., Kijewski, T., and Kareem, A. (2003). “Aerodynamic loads on tall buildings:

28
Interactive database.” J. Eng. Mech., ASCE, 129(3), 394-404.
29
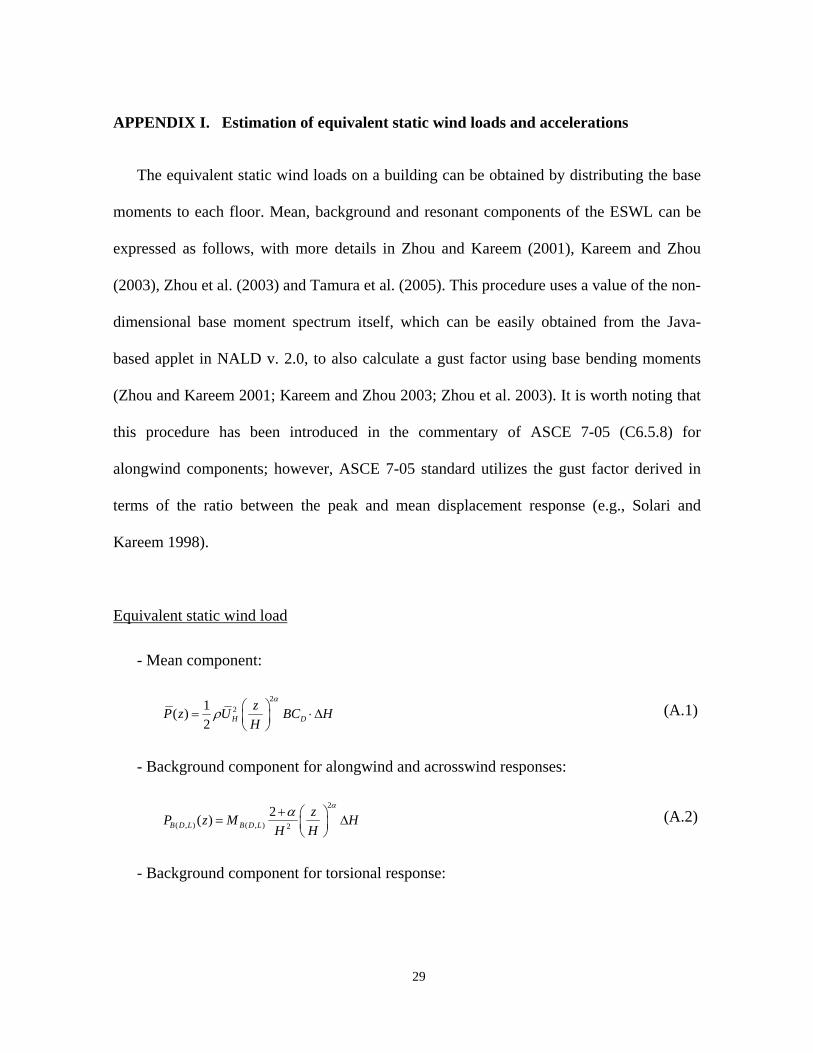
APPENDIX I. Estimation of equivalent static wind loads and accelerations
The equivalent static wind loads on a building can be obtained by distributing the base
moments to each floor. Mean, background and resonant components of the ESWL can be
expressed as follows, with more details in Zhou and Kareem (2001), Kareem and Zhou
(2003), Zhou et al. (2003) and Tamura et al. (2005). This procedure uses a value of the non-
dimensional base moment spectrum itself, which can be easily obtained from the Java-
based applet in NALD v. 2.0, to also calculate a gust factor using base bending moments
(Zhou and Kareem 2001; Kareem and Zhou 2003; Zhou et al. 2003). It is worth noting that
this procedure has been introduced in the commentary of ASCE 7-05 (C6.5.8) for
alongwind components; however, ASCE 7-05 standard utilizes the gust factor derived in
terms of the ratio between the peak and mean displacement response (e.g., Solari and
Kareem 1998).
Equivalent static wind load
- Mean component:
221( )
2 H DzP z U BC HH
α
ρ ⎛ ⎞= ⋅ ∆⎜ ⎟⎝ ⎠
(A.1)
- Background component for alongwind and acrosswind responses:
2
( , ) ( , ) 2
2( )B D L B D LzP z M H
H H
αα+ ⎛ ⎞= ∆⎜ ⎟⎝ ⎠
(A.2)
- Background component for torsional response:
30
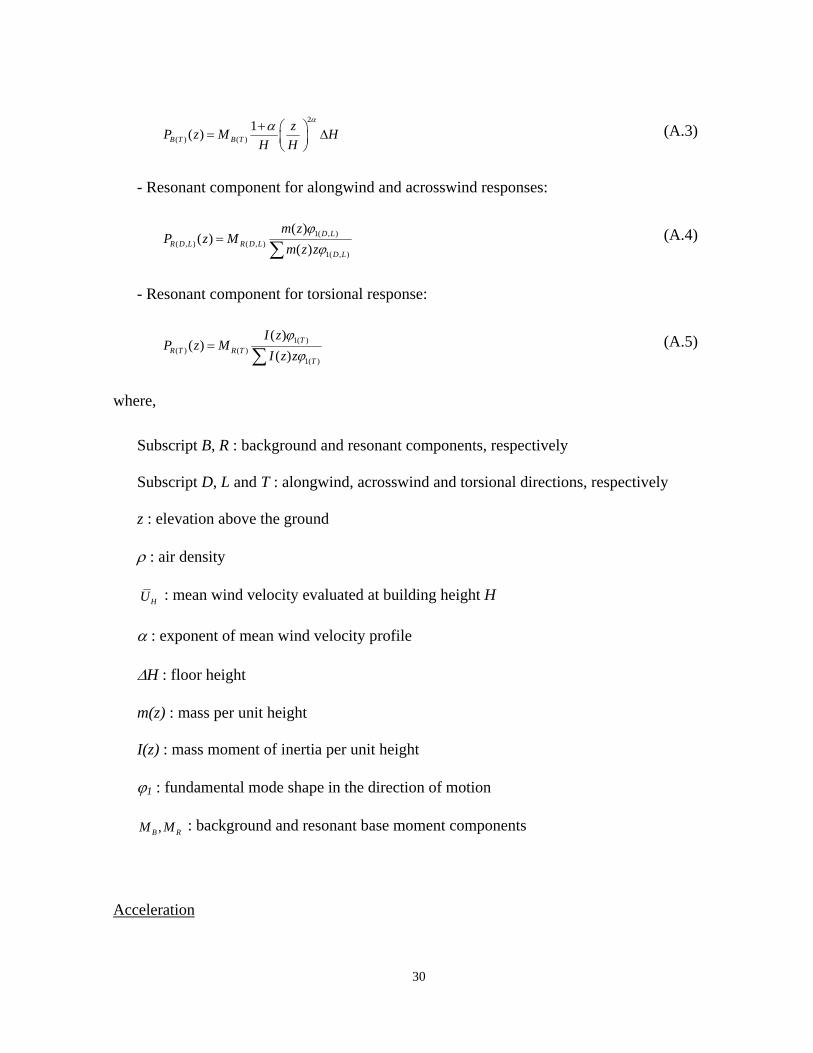
2
( ) ( )1( )B T B T
zP z M HH H
αα+ ⎛ ⎞= ∆⎜ ⎟⎝ ⎠
(A.3)
- Resonant component for alongwind and acrosswind responses:
1( , )( , ) ( , )
1( , )
( )( )
( )D L
R D L R D LD L
m zP z M
m z zϕ
ϕ=
∑ (A.4)
- Resonant component for torsional response:
1( )( ) ( )
1( )
( )( )
( )T
R T R TT
I zP z M
I z zϕ
ϕ=
∑ (A.5)
where,
Subscript B, R : background and resonant components, respectively
Subscript D, L and T : alongwind, acrosswind and torsional directions, respectively
z : elevation above the ground
ρ : air density
HU : mean wind velocity evaluated at building height H
α : exponent of mean wind velocity profile
∆H : floor height
m(z) : mass per unit height
I(z) : mass moment of inertia per unit height
ϕ1 : fundamental mode shape in the direction of motion
,B RM M : background and resonant base moment components
Acceleration
31
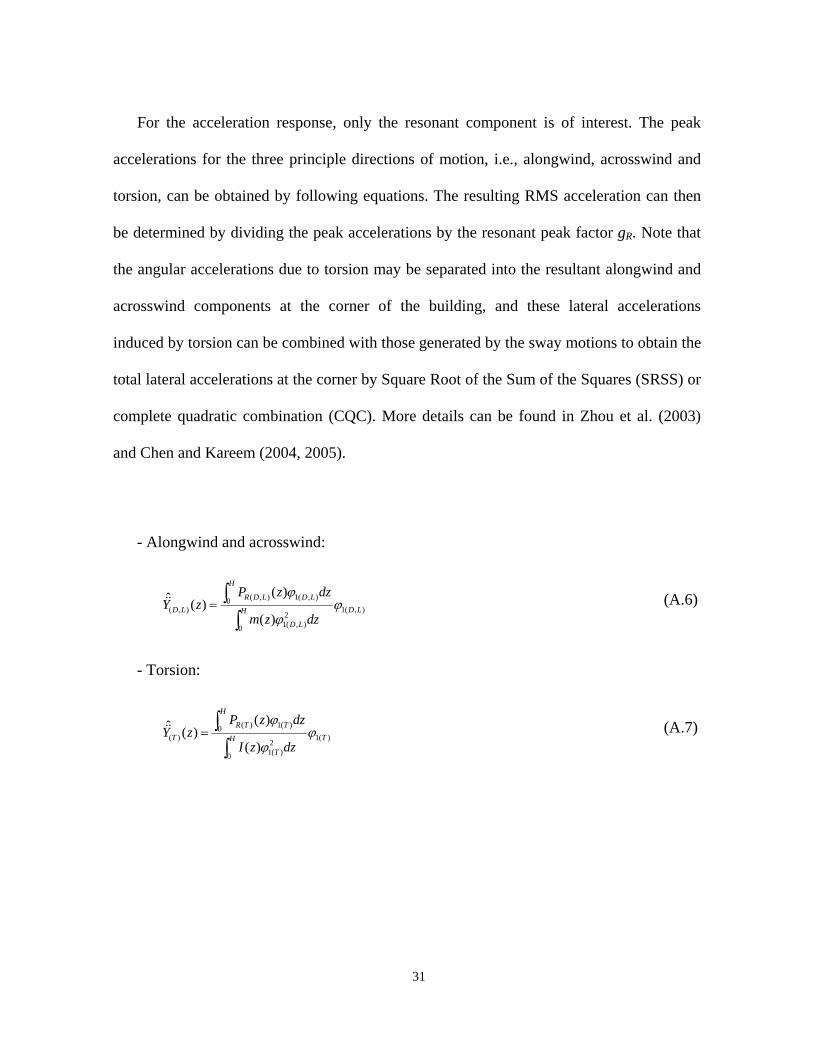
For the acceleration response, only the resonant component is of interest. The peak
accelerations for the three principle directions of motion, i.e., alongwind, acrosswind and
torsion, can be obtained by following equations. The resulting RMS acceleration can then
be determined by dividing the peak accelerations by the resonant peak factor gR. Note that
the angular accelerations due to torsion may be separated into the resultant alongwind and
acrosswind components at the corner of the building, and these lateral accelerations
induced by torsion can be combined with those generated by the sway motions to obtain the
total lateral accelerations at the corner by Square Root of the Sum of the Squares (SRSS) or
complete quadratic combination (CQC). More details can be found in Zhou et al. (2003)
and Chen and Kareem (2004, 2005).
- Alongwind and acrosswind:
( , ) 1( , )0( , ) 1( , )2
1( , )0
( )ˆ ( )( )
H
R D L D LD L D LH
D L
P z dzY z
m z dz
ϕϕ
ϕ= ∫
∫&& (A.6)
- Torsion:
( ) 1( )0( ) 1( )2
1( )0
( )ˆ ( )( )
H
R T TT TH
T
P z dzY z
I z dz
ϕϕ
ϕ= ∫
∫&& (A.7)
32
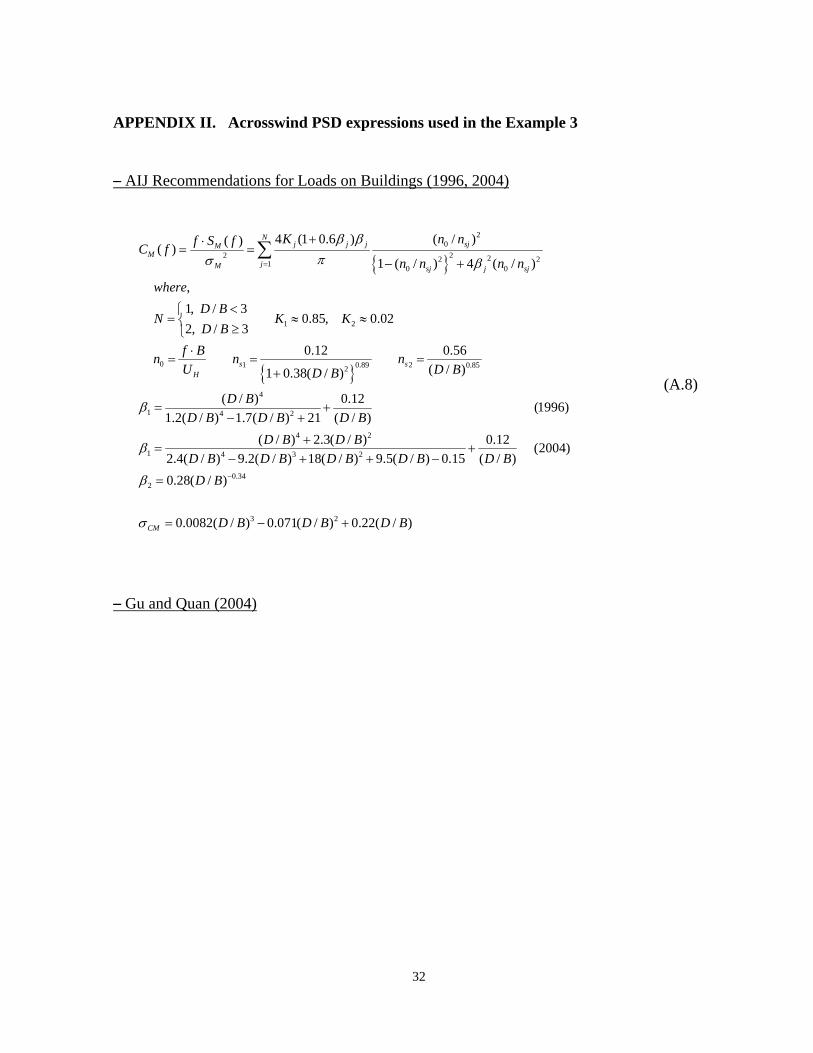
APPENDIX II. Acrosswind PSD expressions used in the Example 3
– AIJ Recommendations for Loads on Buildings (1996, 2004)
{ }
{ }
20
2 2 22 21 0 0
1 2
0 1 20.89 0.852
4
1 4 2
4 (1 0.6 ) ( / )( )( )1 ( / ) 4 ( / )
,1, / 3
0.85, 0.022, / 3
0.12 0.56( / )1 0.38( / )
( / ) 0.121.2( / ) 1.7( / ) 21 ( /
Nj j j sjM
MjM sj j sj
s sH
K n nf S fC fn n n n
whereD B
N K KD B
f Bn n nU D BD B
D BD B D B D
β βπσ β
β
=
+⋅= =
− +
<⎧= ≈ ≈⎨ ≥⎩
⋅= = =
+
= +− +
∑
4 2
1 4 3 2
0.342
3 2
(1996))
( / ) 2.3( / ) 0.12 (2004)2.4( / ) 9.2( / ) 18( / ) 9.5( / ) 0.15 ( / )0.28( / )
0.0082( / ) 0.071( / ) 0.22( / )CM
BD B D B
D B D B D B D B D BD B
D B D B D B
β
β
σ
−
+= +
− + + −
=
= − +
(A.8)
– Gu and Quan (2004)
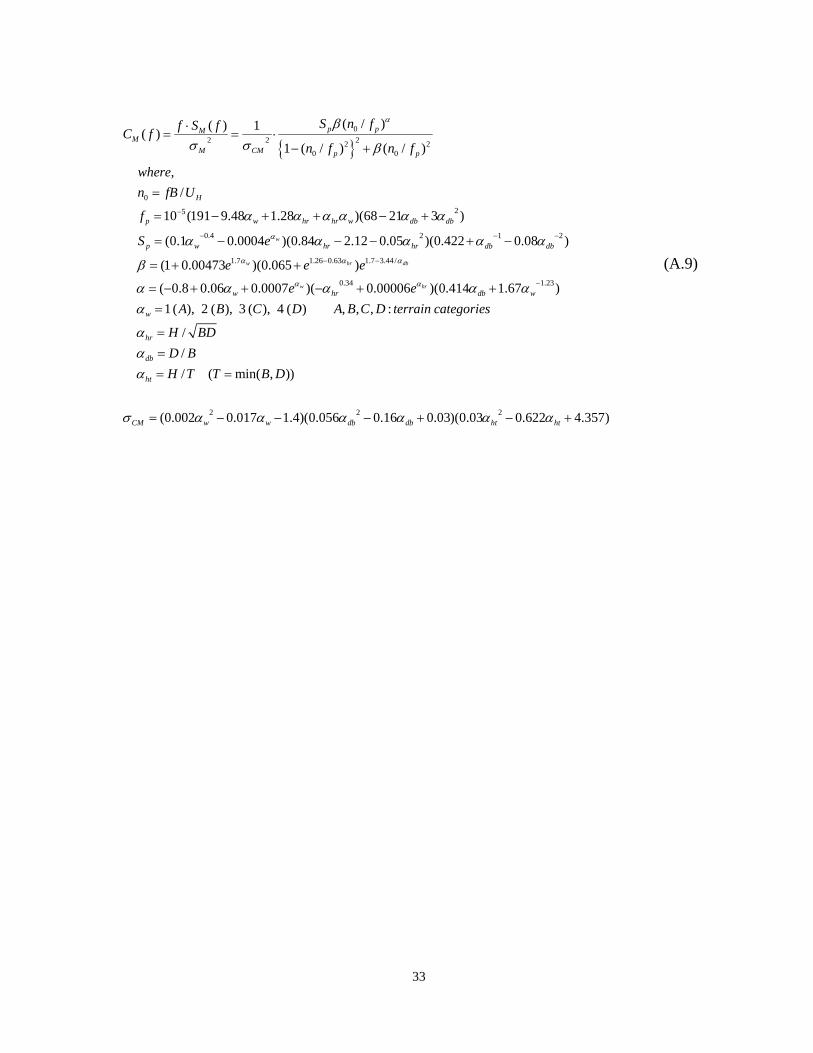
33
{ }0
2 2 22 20 0
025
0.4 2 1 2
( / )( ) 1( )1 ( / ) ( / )
,/
10 (191 9.48 1.28 )(68 21 3 )
(0.1 0.0004 )(0.84 2.12 0.05 )(0.422 0.08 )
(1 0.00473
w
p pMM
M CM p p
H
p w hr hr w db db
p w hr hr db db
S n ff S fC fn f n f
wheren fB U
f
S e
α
α
βσ σ β
α α α α α α
α α α α α
β
−
− − −
⋅= = ⋅
− +
=
= − + + − +
= − − − + −
= + 1.7 1.26 0.63 1.7 3.44 /
0.34 1.23
)(0.065 )
( 0.8 0.06 0.0007 )( 0.00006 )(0.414 1.67 )1 ( ), 2 ( ), 3 ( ), 4 ( ) , , , :
/// ( min( , ))
(0.00
w hr db
w hrw hr db w
w
hr
db
ht
CM
e e e
e eA B C D A B C D terrain categories
H BDD BH T T B D
α α α
α αα α α α αα
ααα
σ
− −
−
+
= − + + − + +=
=== =
= 2 2 22 0.017 1.4)(0.056 0.16 0.03)(0.03 0.622 4.357)w w db db ht htα α α α α α− − − + − +
(A.9)
34
Figure Captions:
Figure 1. NALD v. 2.0 data selection menu
Figure 2. NALD v. 2.0 data selection menu for on-line analysis, including PSD option
Figure 3. Interface for user-supplied structural inputs
Figure 4. On-line unit conversion module
Figure 5. NALD v. 2.0 output from on-the-fly calculation of wind speeds and non-
dimensional moment coefficients
Figure 6. Non-dimensional base moment spectrum display
Figure 7. Display of on-the-fly calculated survivability and serviceability values
Figure 8. Display of on-the-fly calculated wind force components
Figure 9. A diagram of NALD v. 2.0 architecture
Figure 10. Supplemental interfaces for user-specified PSD with examples: (a) interface for
PSD expression; (b) interface for PSD data
Figure 11. An example of error message for user-supplied inputs
Figure 12. Comparison of acrosswind spectra with empirical expressions of AIJ (1996,
2004) and Gu and Quan (2004) (D/B = 1.0, Exposure A)
Figure 13. Comparison of alongwind and acrosswind between NALD and Cheng and Wang
(2004) ( / 1.0, / 5D B H BD= = , Exposure C)
35
Figure 1.
36
Figure 2.
37
Figure 3.
38
Figure 4.
39
Figure 5.
40
Figure 6.
41
Figure 7.
42
Figure 8.
43
Figure 9.
44
(a)
(b)
Figure 10.
45
Figure 11.
46
Figure 12.
47
(a) Alongwind (b) Acrosswind
Figure 13.
48
Table 1. Acrosswind analysis results for empirical PSD expressions in Example 2
( / 1.0, / 5D B H BD= = )
σCM RMS
Acceleration [milli-g]
Base Bending Moment
[106 kN m]
NALD v. 2.0 0.1330 6.21 3.830
AIJ (1996) 0.1572 6.27 3.925
AIJ (2004) 0.1572 8.11 4.771
Gu and Quan (2004) 0.2122 7.34 4.692
49
Table 2. Design results for data from NALD v. 2.0 and Cheng and Wang (2004)
( / 1.0, / 5D B H BD= = )
Alongwind Acrosswind
Base Bending Moment
[106 kN m]
RMS Acceleration
[milli-g]
Base Bending Moment
[106 kN m]
RMS Acceleration
[milli-g]
NALD v. 2.0 4.818 5.69 6.388 11.73
Cheng and Wang (2004) 5.158 6.29 6.639 11.17
50
Table 3. Comparison of NALD v. 2.0 with AS 1170.2 and ASCE 7-05 for CAARC building
NALD v. 2.0 Responses AS
1170.2 ASCEa
(Exp. B) Avg.b Exp. C Exp. A
Peak Acceleration
[milli-g] 8.24c 6.97 8.60 7.67 9.52
Alongwind Base Moment
[106 kN m] 2.80 2.42 2.31 2.16 2.46
Peak Acceleration
[milli-g] 15.53c – d 11.52 11.22 11.81
Case 1
Acrosswind Base Moment
[106 kN m] 1.30 – d 1.47 1.11 1.83
Peak Acceleration
[milli-g] 5.47c 4.65 5.88 5.07e 6.69e
Alongwind Base Moment
[106 kN m] 1.68 1.51 1.32 1.22 1.41
Peak Acceleration
[milli-g] 17.44c – d 11.83 11.04e 12.62e
Case 2
Acrosswind Base Moment
[106 kN m] 1.89 – d 1.88 1.71 2.04 a ASCE 7-05. Peak accelerations are calculated multiplying RMS acceleration by
resonant peak factor and total moments are integrated wind loads determined by design
wind pressure over full height of structure considering gust effect factor.
b It is obtained from taking averages of Exposure C and A results.
c Peak factor for 1-hour is considered, instead of 10 min.
d ASCE only treats the alongwind direction.
e Extrapolated values, since ranges of reduced frequency are beyond acrosswind spectra.