Embed Size (px)
Citation preview
Full Terms & Conditions of access and use can be found athttp://www.tandfonline.com/action/journalInformation?journalCode=hdvn20
Developmental Neuropsychology
ISSN: 8756-5641 (Print) 1532-6942 (Online) Journal homepage: http://www.tandfonline.com/loi/hdvn20
Dyslexia and dyscalculia are characterized bycommon visual perception deficits
Dazhi Cheng, Qing Xiao, Qian Chen, Jiaxin Cui & Xinlin Zhou
To cite this article: Dazhi Cheng, Qing Xiao, Qian Chen, Jiaxin Cui & Xinlin Zhou (2018)Dyslexia and dyscalculia are characterized by common visual perception deficits, DevelopmentalNeuropsychology, 43:6, 497-507, DOI: 10.1080/87565641.2018.1481068
To link to this article: https://doi.org/10.1080/87565641.2018.1481068
Published online: 05 Jul 2018.
Submit your article to this journal
Article views: 198
View Crossmark data
Dyslexia and dyscalculia are characterized by common visualperception deficitsDazhi Chenga,b,c,d*, Qing Xiaoe*, Qian Chenc, Jiaxin Cuia,b,d, and Xinlin Zhoua,b,d
aState Key Laboratory of Cognitive Neuroscience and Learning, School of Brain and Cognitive Sciences, BeijingNormal University, Beijing, China; bAdvanced Innovation Center for Future Education, Beijing Normal University,Beijing, China; cDepartment of Pediatric Neurology, Capital Institute of Pediatrics, Beijing, China; dSiegler Center forInnovative Learning, Beijing Normal University, Beijing, China; eDepartment of specialty, Beijing Chinese Languageand Culture College, Beijing, China
ABSTRACTA number of studies have investigated the cognitive deficits underlyingdyslexia and dyscalculia. Yet, it remains unclear as to whether dyslexia anddyscalculia are associated with the common visual perception deficits. Thecurrent investigation analyzed cognitive performance in children with dys-lexia, dyscalculia, comorbidity, and typically developing subjects. The resultsshowed that children with dyslexia, dyscalculia and comorbidity exhibitedcommon deficits in numerosity processing and visual perception.Furthermore, visual perception deficits accounted for deficits in numerosityprocessing in all three groups. The results suggest that visual perceptiondeficits are a common cognitive deficit underlying both developmentaldyslexia and dyscalculia.
Introduction
Learning disabilities including reading disabilities (e.g., dyslexia) and mathematical learning dis-abilities (e.g., dyscalculia) are estimated to affect up to 10% of children (Butterworth & Kovas, 2013).Dyslexia refers to a specific deficit in learning to read (especially word recognition and decoding)(Layes, Lalonde, Mecheri, & Reba, 2015; Vellutino, Fletcher, Snowling, & Scanlon, 2004), whereasdyscalculia describes a specific deficit in the acquisition of arithmetic skills (especially number factknowledge and computation) (Geary, 2011; Rousselle & Noël, 2007; Schleifer & Landerl, 2011).Numerous studies have investigated whether dyslexia and dyscalculia share common cognitivemechanisms. Two major hypotheses have been proposed regarding the cognitive mechanisms ofdyslexia and dyscalculia. The first hypothesis postulates that dyslexia and dyscalculia exhibit distinctcognitive profiles, namely, a phonological deficit in dyslexia and a deficit in numerosity processing indyscalculia (Butterworth & Kovas, 2013; Landerl, Fussenegger, Moll, & Willburger, 2009; Moll,Göbel, & Snowling, 2015). The second hypothesis proposes that both dyslexia and dyscalculiashare a more fundamental cognitive deficit, such as a reduction in working memory (Moll, Göbel,Gooch, Landerl, & Snowling, 2014; Schuchardt, Maehler, & Hasselhorn, 2008). Moreover, recentstudies have indicated that visual perception deficits may play an important role in either dyslexia ordyscalculia. Some studies have reported visual perception deficits as important components ofdyslexia (Goswami et al., 2010; Stefanics et al., 2011; Vidyasagar & Pammer, 2010; Zhao, Qian, Bi,& Coltheart, 2014). In contrast, other researchers have identified visual perception deficits associated
CONTACT Xinlin Zhou [email protected] State Laboratory of Cognitive Neuroscience and Learning, Institute ofCognitive Neuroscience and Learning, Beijing Normal University, Beijing 100875, China
*These authors contributed equally to this work.Color versions of one or more of the figures in the article can be found online at www.tandfonline.com/hdvn.© 2018 Taylor & Francis
DEVELOPMENTAL NEUROPSYCHOLOGY2018, VOL. 43, NO. 6, 497–507https://doi.org/10.1080/87565641.2018.1481068
with dyscalculia (Sigmundsson, Anholt, & Talcott, 2010; Zhou & Cheng, 2015a). Deficits in theapproximate number system (ANS) are potentially associated with visual perception deficits(Butterworth, Varma, & Laurillard, 2011; Mazzocco, Feigenson, & Halberda, 2011; Zhou & Cheng,2015a). However, it remains unclear whether dyslexia and dyscalculia share a common visualperception deficit. To address this research question, the present study used a geometric figure-matching task (Basso et al., 1985; Strien, Licht, Bouma, & Bakker, 1989; Zhou & Cheng, 2015a; Zhou,Wei, Zhang, Cui, & Chen, 2015b) and an accompanying battery of cognitive tests to explore the roleof visual perception in dyslexia and dyscalculia.
The role of visual perception in dyslexia
Abnormal visual perception is thought to be a fundamental mechanism of dyslexia (Eden et al., 1996;Saksida et al., 2016; Stefanics et al., 2011; Valdois et al., 2011; Vidyasagar & Pammer, 2010; Zhaoet al., 2014). Although it might be assumed that phonological deficits account for developmentaldyslexia, phonological deficits can stem from more fundamental deficits in visual perceptualprocessing (Stefanics et al., 2011; Stein & Walsh, 1997; Vidyasagar & Pammer, 2010). Emergingevidence indicates that phonological problems and reading impairments arise from poor visualperception processing (e.g., detection of letter-strings, speed discrimination) (Goswami et al., 2010;Valdois et al., 2011; Zhao et al., 2014). In one study, researchers employed a task that requiredparticipants to detect coherently moving dots on a screen and found that individuals with dyslexiaexhibited abnormal visual motion processing (Eden et al., 1996). In contrast, individuals withdyslexia did not have deficits in processing the static presentation of the same dots. It has beenreported that training visual texture discrimination improves reading speed in patients affected bydyslexia (Wang et al., 2014).
The visual magnocellular dorsal pathway is a possible neural substrate of visual perception inreading. The magnocellular dorsal stream is sensitive to visual stimuli with low spatial frequency, lowcontrast, and high temporal frequency (Stein & Walsh, 1997). These visual features are common infast-changing or moving stimuli, and individuals with dyslexia show poor performance and abnor-mal patterns of neural activity in response to these visual features (Conlon, Sanders, & Wright, 2009;Demb, Boynton, & Heeger, 1998; Eden et al., 1996).
ANS deficits and visual perception in dyscalculia
Children with dyscalculia exhibit severe impairments in the ANS (Butterworth, 2010; Iuculano,Tang, Hall, & Butterworth, 2008; Mazzocco et al., 2011; Mejias, Grégoire, & Noël, 2012; Piazza et al.,2010; Skagerlund & Träff, 2014; Wilson et al., 2014). The ANS is typically assessed using numerositycomparison tasks wherein the participants is asked to select an item (e.g., a dot) array that has ahigher or lower number of items compared to two other item arrays (Butterworth & Kovas, 2013;Piazza et al., 2010). Piazza et al. (2010) used this paradigm to empirically demonstrate that childrenwith dyscalculia demonstrate ANS deficits. A cohort of 10-year-old children with dyscalculia showedpoor number acuity in a numerosity comparison task that was consistent with the performance of a5-year-old normally developing child. Children with dyscalculia showed difficulties across allmagnitude dimensions (i.e., space, time, and number) and showed impaired ANS acuity comparedto the control group (Skagerlund & Träff, 2014).
Previous research has examined the perceptual properties of numerosity processing (Burr & Ross,2008; Tibber, Greenwood, & Dakin, 2012). For example, Burr and Ross (2008) found that apparentnumerosity was decreased by adaptation to large numbers of dots and increased by adaptation tosmall numbers of dots, similar to adaption mechanisms for other primary visual properties of a scenesuch as color, contrast, size, and movement speed. To this end, recent studies have suggested thatANS deficits are associated with visual perception deficits. First, Zhou and colleagues (2015b)showed that tight coupling between the ANS and math fluency was fully explained by general visual
498 D. CHENG ET AL.
perception measured with a geometric figure matching task (Demb et al., 1998; Valdois et al., 2011).Second, Zhou and Cheng (2015a) showed that ANS deficits in dyscalculia were likely due to visualperception deficits; variations in visual perception were found to account for variations in numer-osity processing in children with dyscalculia.
Current investigation
As mentioned above, visual perception is thought to play an important role in both dyslexia anddyscalculia. Yet, it remains unclear as to whether dyslexia and dyscalculia share common visualperception deficits. Therefore, the goal of the current study was to examine visual perception deficitsin individuals with dyslexia and dyscalculia using a geometric figure matching task. Four groups ofchildren were included: a dyslexia group, a dyscalculia group, a comorbidity (dyslexia and dyscalcu-lia) group, and a typically developing (TD) group. With regard to the visual perceptional propertiesof numerosity processing, we expected that children with dyslexia, dyscalculia, and comorbiddyslexia with dyscalculia would exhibit deficits in visual perception and ANS and that visualperception deficits would account for ANS deficits.
To study the role of visual perception in both dyslexia and dyscalculia, we controlled for potentialconfounding factors related to cognitive processing. We included five other cognitive tasks asso-ciated with mathematical and linguistic cognition (Cirino, 2011; Halberda, Mazzocco, & Feigenson,2008). A basic reaction time task was used to control for the effect of manual response and mentalprocessing speed (Butterworth, 2003). We included a task to assess visual-tracing ability becausepoor oculomotor coordination has been linked to reading disability (Groffman, 1994) and mathe-matical deficits (Eden et al., 1996; Groffman, 2009). Raven’s Progressive Matrices measures basic“intelligence,” and scores on this test have been correlated with mathematical performance (Kyttälä& Lehto, 2008; Rohde & Thompson, 2007). Mental rotation tasks were used to control for the effectof spatial processing (Berg, 2008). A numerosity comparison task measured the extent to whichprocessing plays a role in mathematical cognition (Butterworth et al., 2011).
Methods
Participants
Participants were retrospectively enrolled from a dataset collected by the State Key Laboratory ofCognitive Neuroscience and Learning at Beijing Normal University. The dataset included 1,142 thirdgrade to fifth grade children (580 boys and 562 girls; age range, 8–11 year) from 57 classes at 5primary schools in Beijing, China. The classes were randomly selected from the schools. All studentsin each selected class participated in the study. Each class included approximately 20–40 children. Allparticipants were native Chinese speakers and had normal or corrected-to-normal vision. Thecurrent investigation was approved by the State Key Laboratory of Cognitive Neuroscience andLearning at Beijing Normal University and the principals of the schools. The parents or legalguardians of participating children provided written informed consent.
Dyslexia was defined in terms of standard scores on reading fluency. The criteria for dyslexia were(1) a score within less than the 7th percentile (−1.50 standard deviations from the mean) for readingmeasured with a sentence completion task; (2) a score above the 25th percentile (−.67 standarddeviations from the mean) for nonverbal intelligence measured with a nonverbal matrices reasoningtask; and (3) a score within −1.50 standard deviations from the mean for math fluency measuredwith subtraction tasks. Meanwhile, the participants with comorbid dyslexia and dyscalculia wereexcluded. A total of 39 children from the dataset met the criteria for dyslexia.
Dyscalculia was defined in terms of standard scores on math fluency. The criteria for dyscalculiawere (1) a score below the 7th percentile (−1.50 standard deviations from the mean) for mathfluency; (2) a score above the 25th percentile (−.67 standard deviations from the mean) for
DEVELOPMENTAL NEUROPSYCHOLOGY 499
nonverbal intelligence; and (3) a score above the 7th percentile (−1.50 standard deviations from themean) for reading. Meanwhile, the participants in comorbidity group were excluded. A total of 48children from the dataset met the criteria for dyscalculia.
Comorbid dyslexia and dyscalculia was defined in terms of standard scores on both reading andmath fluency. The criteria for comorbid dyslexia and dyscalculia were as follows: (1) scores below the7th percentile (−1.50 standard deviations from the mean) for both reading and math fluency and (2)a score above the 25th percentile (−.67 standard deviations from the mean) for nonverbal intelli-gence. Meanwhile, the participants with only dyslexia or dyscalculia were excluded. A total of 18children from the dataset met the criteria for comorbid dyslexia and dyscalculia.
Forty-eight TD children were included as a control group. These children were randomly sampledfrom the remaining 1,037 children in the dataset with the following constraints: (1) TD children wereindividually matched to children in the dyscalculia group in terms of age, gender, and grade; (2) scoresabove the 7th percentile (−1.50 standard deviations from the mean) for math fluency and reading; and(3) a score above the 25th percentile (−.67 standard deviations from the mean) for nonverbalintelligence. The demographic characteristics of included participants are shown in Table 1.
Procedure
The task battery was administered across two 45-min sessions. Testing was conducted in groups (oneclass at a time) in computer classrooms. Each class was monitored by six to seven experimenters(five to six children per experimenter) and one of the class teachers. Tasks were administered in thesame order for all students. For each task, an instruction was given and a practice session wascompleted prior to formal testing. The practice session for each task consisted of four to six trialsthat were similar to those used in the formal testing. During practice trials, the computer providedchildren with feedback on the screen; the feedback for correct responses was “Correct! Can you gofaster?” and the feedback for incorrect responses was “It is wrong. Try again.” Children were allowedto ask the experimenters questions during practice sessions. After all children in a class had finishedthe practice session and had no more questions for the experimenters, the main experimenter said,“Start,” and the children pressed any key to begin the formal testing.
For all but one task, children responded by pressing one of two keys (“P” or “Q”) on a computerkeyboard. For the visual tracing task, the children used a cursor tomark the correct end point after tracing aparticular line. Student responses were automatically recorded and conveyed over the Internet to a serverlocated in the Key Laboratory for storage. All data were collected between December 2013 and June 2014.
Tasks
Sentence completionThe sentence completion task used in this study was similar to a previously described task(Mummery, Patterson, Hodges, & Price, 1998; So & Siegel, 1997). Materials in the task were adaptedfrom textbooks used in primary schools from first grade to ninth grade. For each trial, a sentencewas presented in the middle of the computer screen with a word missing. Participants wereinstructed to complete the sentence by selecting one of two candidate words presented beneath
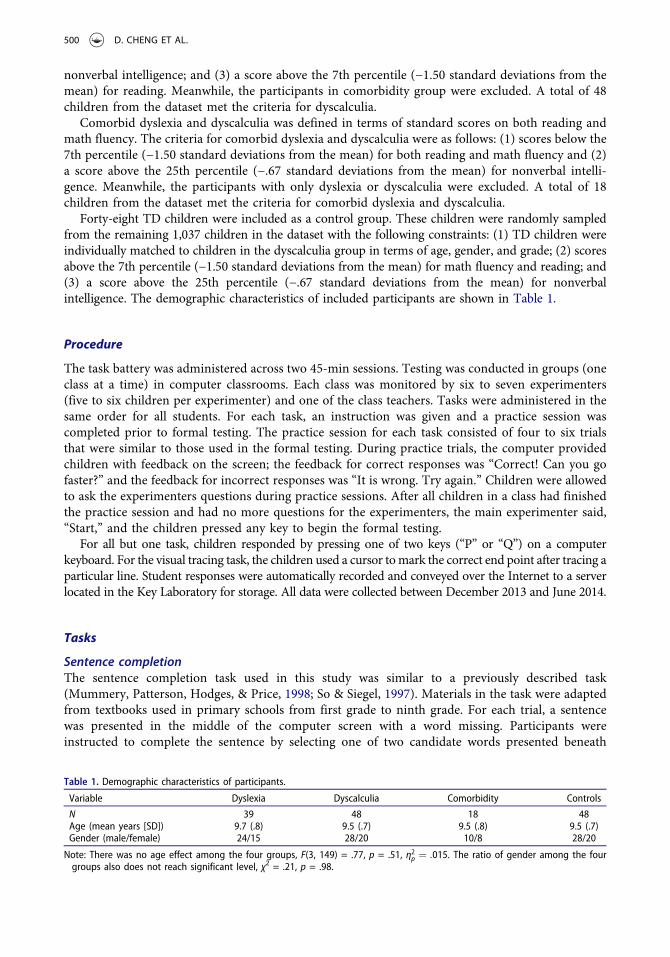
Table 1. Demographic characteristics of participants.
Variable Dyslexia Dyscalculia Comorbidity Controls
N 39 48 18 48Age (mean years [SD]) 9.7 (.8) 9.5 (.7) 9.5 (.8) 9.5 (.7)Gender (male/female) 24/15 28/20 10/8 28/20
Note: There was no age effect among the four groups, F(3, 149) = .77, p = .51, η2p ¼ :015. The ratio of gender among the fourgroups also does not reach significant level, χ2 = .21, p = .98.
500 D. CHENG ET AL.
the sentence by pressing a left key (“P”) or a right key (“Q”). The stimulus remained on the screenuntil the participants responded. There were 120 questions. This was a time-limited (5-min) task.
SubtractionThe subtraction task included simple and complex subtraction problems for which participants werenot allowed to use paper and pencil. For all 92 problems in the simple subtraction task, theminuends were 18 or smaller, and differences were single-digit numbers. Two candidate answerswere presented beneath each problem. Participants were instructed to select the correct answer bypressing the “Q” key to choose the answer on the left and the “P” key to choose the answer on theright. Each incorrect candidate answer was within ±3 values of the correct answer. This was a time-limited (2-min) task.
All 96 problems in the complex subtraction task involved two-digit operands. Most problemsrequired borrowing. Two candidate answers were presented beneath each problem and againparticipants were instructed to select the correct. Each incorrect candidate answer was within ±10values of the correct answer. Other aspects of the procedure (stimulus presentation, responsemethod) were identical to those in the simple subtraction task. This was a time-limited (2-min) task.
The numbers of correct trials in each of the two tasks were averaged to yield a general score formath fluency.
Choice reaction timeIn each trial of the choice reaction time task, a white dot was presented on a black screen either tothe left or to the right of a fixation cross. The position of the dot was within a 15° visual angle of thefixation cross. Participants were asked to press the “Q” key if the dot appeared on the left and the “P”key if the dot appeared on the right. The task included a total of 30 trials (15 trials with the dot onthe left and 15 trials with the dot on the right). The size of the screen on which the dot appearedvaried randomly across trials. The interstimulus interval as randomly varied between 1,500 and3,000 ms.
Mental rotationThe mental rotation task used in this study was adapted from a previously described task(Vandenberg & Kuse, 1978). In each trial, a three-dimensional image was presented on the upperpart of the screen and two more images were presented on the lower part of the screen. Participantswere asked to choose the image from the lower part of the screen that matched the image on theupper part of the screen; the matching image could only be identified by mental rotation. Thenonmatching image was a rotated mirror image of the target. The rotation angles of the matchingimages ranged from 15° to 345° (intervals of 15°). Participants pressed the “Q” key to choose theimage on the left and the “P” key to choose the image on the right. Stimuli remained on the screenuntil participant responded by pressing the “P” key or the “Q” key. This task consisted of 180 trialsand was a time-limited (3-min) test.
Nonverbal matrix reasoningA simplified version of the Raven’s Progressive Matrices test (Raven, 1998) was used to assess generalintelligence. In this task, participants were asked to identify a missing segment that would complete afigure’s pattern. Two candidate answers were presented beneath each problem and participants wereinstructed to press “Q” if the missing segment was on the left and “P” if it was on the right. The testconsisted of 80 trials and was a time-limited (3-min) test.
Visual tracingThe visual tracing task used in this study was adapted from Groffman’s visual-tracing test(Groffman, 1966). Several curved lines were interwoven within a square, starting from the left sideof the square and ending on the right side. Participants were asked to track a particular line from the
DEVELOPMENTAL NEUROPSYCHOLOGY 501
beginning to the end using only their vision (i.e., they were not allowed to use a finger or the cursorto trace the line path) and then to mark the correct end point. This task became more difficult as thetotal number of lines increased. There were 12 pictures used in 3 trials. This was a time-limited (4-min) task.
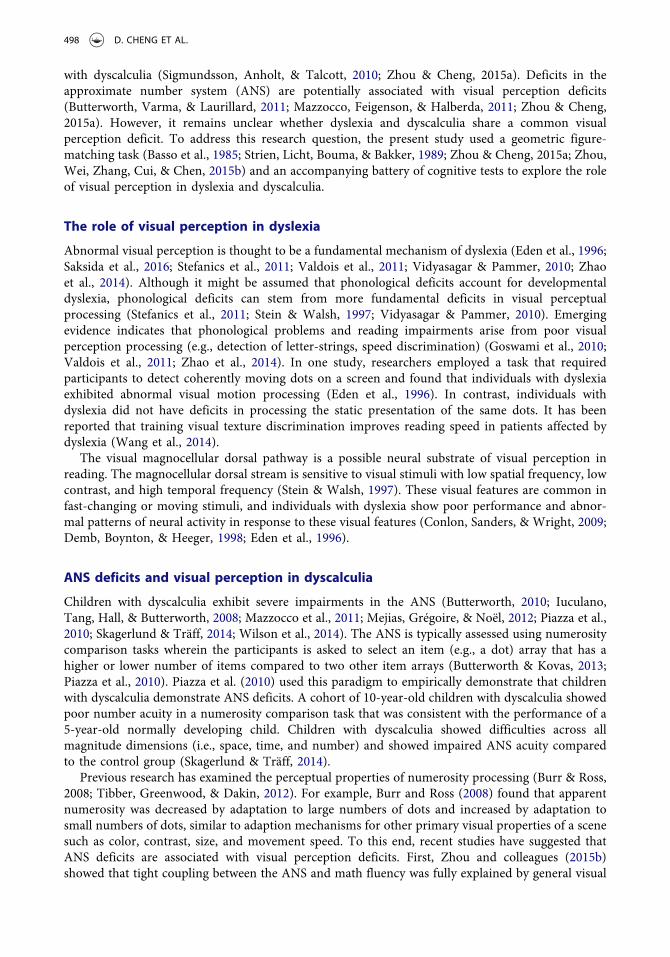
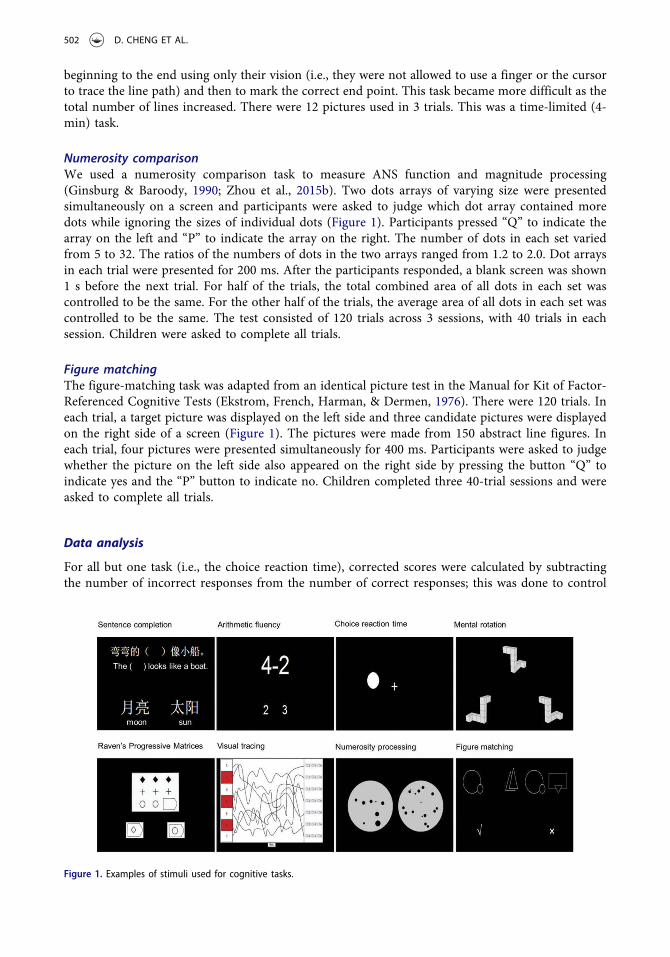
Numerosity comparisonWe used a numerosity comparison task to measure ANS function and magnitude processing(Ginsburg & Baroody, 1990; Zhou et al., 2015b). Two dots arrays of varying size were presentedsimultaneously on a screen and participants were asked to judge which dot array contained moredots while ignoring the sizes of individual dots (Figure 1). Participants pressed “Q” to indicate thearray on the left and “P” to indicate the array on the right. The number of dots in each set variedfrom 5 to 32. The ratios of the numbers of dots in the two arrays ranged from 1.2 to 2.0. Dot arraysin each trial were presented for 200 ms. After the participants responded, a blank screen was shown1 s before the next trial. For half of the trials, the total combined area of all dots in each set wascontrolled to be the same. For the other half of the trials, the average area of all dots in each set wascontrolled to be the same. The test consisted of 120 trials across 3 sessions, with 40 trials in eachsession. Children were asked to complete all trials.
Figure matchingThe figure-matching task was adapted from an identical picture test in the Manual for Kit of Factor-Referenced Cognitive Tests (Ekstrom, French, Harman, & Dermen, 1976). There were 120 trials. Ineach trial, a target picture was displayed on the left side and three candidate pictures were displayedon the right side of a screen (Figure 1). The pictures were made from 150 abstract line figures. Ineach trial, four pictures were presented simultaneously for 400 ms. Participants were asked to judgewhether the picture on the left side also appeared on the right side by pressing the button “Q” toindicate yes and the “P” button to indicate no. Children completed three 40-trial sessions and wereasked to complete all trials.
Data analysis
For all but one task (i.e., the choice reaction time), corrected scores were calculated by subtractingthe number of incorrect responses from the number of correct responses; this was done to control
Figure 1. Examples of stimuli used for cognitive tasks.
502 D. CHENG ET AL.
for the effect of guessing (Cirino, 2011; Hedden & Yoon, 2006; Salthouse & Meinz, 1995). For themath fluency and sentence completion tasks, we calculate standard Z scores for each participantbased on the corrected scores. For the choice reaction time task, only the median reaction time foreach participant was analyzed. The mean error rate was low (4.4%) and thus was not furtheranalyzed.
Correlation analyses were performed to identify relationships between the cognitive tests for allparticipates. Then, for each task, a between-subject analysis of variance using group as the between-subject factor was calculated to compare performance among the four groups, with posthoc pair-wiseanalysis using Bonferroni correction. Finally, an analysis of covariance was conducted to examinenumerosity processing deficits among the four groups using visual perception as well as othercognitive measures (i.e., choice reaction time, mental rotation, and visual tracing) as covariates.The data analysis was performed in the IBM SPSS 21 software.
Results
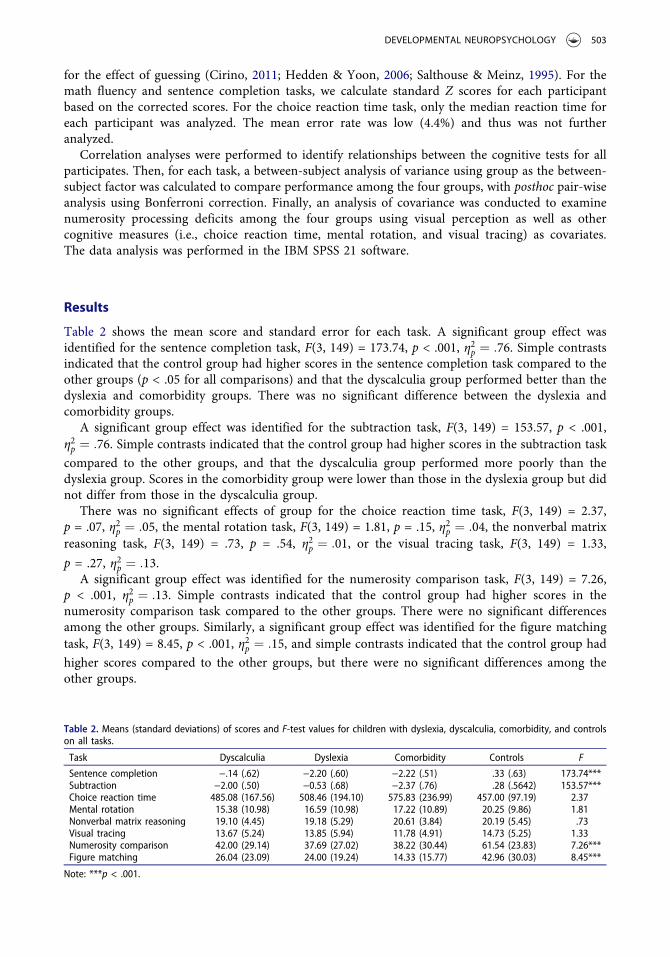
Table 2 shows the mean score and standard error for each task. A significant group effect wasidentified for the sentence completion task, F(3, 149) = 173.74, p < .001, η2p ¼ :76. Simple contrastsindicated that the control group had higher scores in the sentence completion task compared to theother groups (p < .05 for all comparisons) and that the dyscalculia group performed better than thedyslexia and comorbidity groups. There was no significant difference between the dyslexia andcomorbidity groups.
A significant group effect was identified for the subtraction task, F(3, 149) = 153.57, p < .001,η2p ¼ :76. Simple contrasts indicated that the control group had higher scores in the subtraction task
compared to the other groups, and that the dyscalculia group performed more poorly than thedyslexia group. Scores in the comorbidity group were lower than those in the dyslexia group but didnot differ from those in the dyscalculia group.
There was no significant effects of group for the choice reaction time task, F(3, 149) = 2.37,p = .07, η2p ¼ :05, the mental rotation task, F(3, 149) = 1.81, p = .15, η2p ¼ :04, the nonverbal matrixreasoning task, F(3, 149) = .73, p = .54, η2p ¼ :01, or the visual tracing task, F(3, 149) = 1.33,
p = .27, η2p ¼ :13.A significant group effect was identified for the numerosity comparison task, F(3, 149) = 7.26,
p < .001, η2p ¼ :13. Simple contrasts indicated that the control group had higher scores in thenumerosity comparison task compared to the other groups. There were no significant differencesamong the other groups. Similarly, a significant group effect was identified for the figure matchingtask, F(3, 149) = 8.45, p < .001, η2p ¼ :15, and simple contrasts indicated that the control group had
higher scores compared to the other groups, but there were no significant differences among theother groups.
Table 2. Means (standard deviations) of scores and F-test values for children with dyslexia, dyscalculia, comorbidity, and controlson all tasks.
Task Dyscalculia Dyslexia Comorbidity Controls F
Sentence completion −.14 (.62) −2.20 (.60) −2.22 (.51) .33 (.63) 173.74***Subtraction −2.00 (.50) −0.53 (.68) −2.37 (.76) .28 (.5642) 153.57***Choice reaction time 485.08 (167.56) 508.46 (194.10) 575.83 (236.99) 457.00 (97.19) 2.37Mental rotation 15.38 (10.98) 16.59 (10.98) 17.22 (10.89) 20.25 (9.86) 1.81Nonverbal matrix reasoning 19.10 (4.45) 19.18 (5.29) 20.61 (3.84) 20.19 (5.45) .73Visual tracing 13.67 (5.24) 13.85 (5.94) 11.78 (4.91) 14.73 (5.25) 1.33Numerosity comparison 42.00 (29.14) 37.69 (27.02) 38.22 (30.44) 61.54 (23.83) 7.26***Figure matching 26.04 (23.09) 24.00 (19.24) 14.33 (15.77) 42.96 (30.03) 8.45***
Note: ***p < .001.
DEVELOPMENTAL NEUROPSYCHOLOGY 503
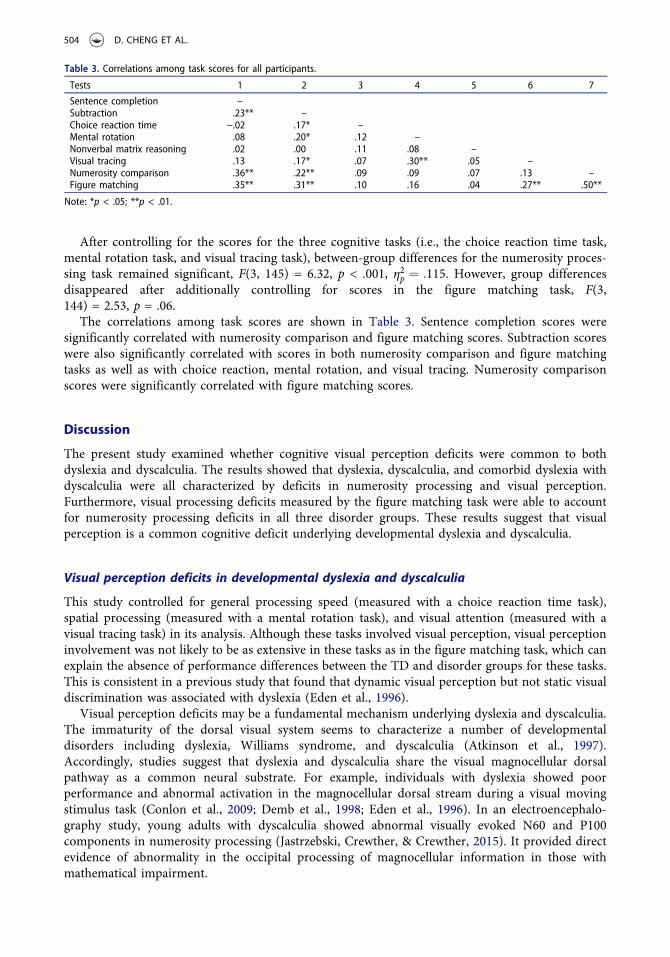
After controlling for the scores for the three cognitive tasks (i.e., the choice reaction time task,mental rotation task, and visual tracing task), between-group differences for the numerosity proces-sing task remained significant, F(3, 145) = 6.32, p < .001, η2p ¼ :115. However, group differencesdisappeared after additionally controlling for scores in the figure matching task, F(3,144) = 2.53, p = .06.
The correlations among task scores are shown in Table 3. Sentence completion scores weresignificantly correlated with numerosity comparison and figure matching scores. Subtraction scoreswere also significantly correlated with scores in both numerosity comparison and figure matchingtasks as well as with choice reaction, mental rotation, and visual tracing. Numerosity comparisonscores were significantly correlated with figure matching scores.
Discussion
The present study examined whether cognitive visual perception deficits were common to bothdyslexia and dyscalculia. The results showed that dyslexia, dyscalculia, and comorbid dyslexia withdyscalculia were all characterized by deficits in numerosity processing and visual perception.Furthermore, visual processing deficits measured by the figure matching task were able to accountfor numerosity processing deficits in all three disorder groups. These results suggest that visualperception is a common cognitive deficit underlying developmental dyslexia and dyscalculia.
Visual perception deficits in developmental dyslexia and dyscalculia
This study controlled for general processing speed (measured with a choice reaction time task),spatial processing (measured with a mental rotation task), and visual attention (measured with avisual tracing task) in its analysis. Although these tasks involved visual perception, visual perceptioninvolvement was not likely to be as extensive in these tasks as in the figure matching task, which canexplain the absence of performance differences between the TD and disorder groups for these tasks.This is consistent in a previous study that found that dynamic visual perception but not static visualdiscrimination was associated with dyslexia (Eden et al., 1996).
Visual perception deficits may be a fundamental mechanism underlying dyslexia and dyscalculia.The immaturity of the dorsal visual system seems to characterize a number of developmentaldisorders including dyslexia, Williams syndrome, and dyscalculia (Atkinson et al., 1997).Accordingly, studies suggest that dyslexia and dyscalculia share the visual magnocellular dorsalpathway as a common neural substrate. For example, individuals with dyslexia showed poorperformance and abnormal activation in the magnocellular dorsal stream during a visual movingstimulus task (Conlon et al., 2009; Demb et al., 1998; Eden et al., 1996). In an electroencephalo-graphy study, young adults with dyscalculia showed abnormal visually evoked N60 and P100components in numerosity processing (Jastrzebski, Crewther, & Crewther, 2015). It provided directevidence of abnormality in the occipital processing of magnocellular information in those withmathematical impairment.
Table 3. Correlations among task scores for all participants.
Tests 1 2 3 4 5 6 7
Sentence completion –Subtraction .23** –Choice reaction time −.02 .17* –Mental rotation .08 .20* .12 –Nonverbal matrix reasoning .02 .00 .11 .08 –Visual tracing .13 .17* .07 .30** .05 –Numerosity comparison .36** .22** .09 .09 .07 .13 –Figure matching .35** .31** .10 .16 .04 .27** .50**
Note: *p < .05; **p < .01.
504 D. CHENG ET AL.
Numerosity processing deficits in developmental dyslexia and dyscalculia
Consistent with previous studies (Butterworth, 2010; Iuculano et al., 2008; Mazzocco et al., 2011; Mejiaset al., 2012; Piazza et al., 2010; Skagerlund & Träff, 2014; Wilson et al., 2014), we identified numerosityprocessing deficits in children with developmental dyscalculia, representing ANS acuity impairment. Asa novel finding, we identified similar numerosity processing deficits in children with developmentaldyslexia. The results indicated that dyslexia and dyscalculia share common visual perception deficits andthat visual perception performance could explain numerosity processing deficits in the disorder groups.A previous study also reported that numerosity processing is primarily a visual task (Burr & Ross, 2008;Zhou et al., 2015b). Consistent with the findings of the previous study, children with developmentaldyslexia also showed deficits in the numerosity comparison task.
In conclusion, visual perception deficits appear to arise from a common cognitive mechanismunderlying dyslexia, dyscalculia, and comorbid dyslexia with dyscalculia. Our results provide analternative explanation for the comorbid presentation of dyslexia and dyscalculia. We showed thatdeficits in visual perception contributed to the ANS deficits observed in children with learningdisabilities; however, knowledge regarding the causes of these disorders remains incomplete. Furtherstudies must be conducted to determine whether visual perception training could help to improveassociated cognitive functions in children with learning disabilities.
Funding
This research was supported by the State Key Basic Research Program of China: [Grant Number 2014CB846100], fivegrants from the Natural Science Foundation of China (Project nos. 31700977, 31671151, 31600896, 31521063, and31271187), the 111 Project (B07008), a grant from the Advanced Innovation Center for Future Education at BeijingNormal University (27900-110631111), a grant from Beijing Chinese Language and Culture College (HW-17-B08), agrant from the Capital Institute of Pediatrics (FX-2017-09) and the project supported by Beijing Municipal Science &Technology Commission (Z171100000417020).
References
Atkinson, J., King, J., Braddick, O., Nokes, L., Anker, S., & Braddick, F. (1997). A specific deficit of dorsal streamfunction in Williams’ syndrome. Neuroreport, 8, 1919–1922. doi:10.1097/00001756-199705260-00025
Basso, A., Capitani, E., Luzzatti, C., Spinnler, H., & Zanobio, M. E. (1985). Different basic components in theperformance of Broca’s and Wernicke’s aphasics on the colour-figure matching test. Neuropsychologia, 23, 51–59.doi:10.1016/0028-3932(85)90043-0
Berg, D. H. (2008). Working memory and arithmetic calculation in children: The contributory roles of processingspeed, short-term memory, and reading. Journal of Experimental Child Psychology, 99, 288–308. doi:10.1016/j.jecp.2007.12.002
Burr, D., & Ross, J. (2008). A visual sense of number. Current Biology, 18, 425–428. doi:10.1016/j.cub.2008.02.052Butterworth, B. (2010). Foundational numerical capacities and the origins of dyscalculia. Trends in Cognitive Sciences,
14, 534–541. doi:10.1016/j.tics.2010.09.007Butterworth, B., & Kovas, Y. (2013). Understanding neurocognitive developmental disorders can improve education
for all. Science, 340, 300–305. doi:10.1126/science.1231022Butterworth, B., Varma, S., & Laurillard, D. (2011). Dyscalculia: From brain to education. Science, 332, 1049–1053.
doi:10.1126/science.1201536Butterworth., B. (2003). Dyscalculia screener. London: nferNelson Pub.Cirino, P. T. (2011). The interrelationships of mathematical precursors in kindergarten. Journal of Experimental Child
Psychology, 108, 713–733. doi:10.1016/j.jecp.2010.11.004Conlon, E. G., Sanders, M. A., & Wright, C. M. (2009). Relationships between global motion and global form
processing, practice, cognitive and visual processing in adults with dyslexia or visual discomfort.Neuropsychologia, 47, 907–915. doi:10.1016/j.neuropsychologia.2008.12.037
Demb, J. B., Boynton, G. M., & Heeger, D. J. (1998). Functional magnetic resonance imaging of early visual pathwaysin dyslexia. Journal of Neuroscience, 18, 6939–6951. doi:10.1523/JNEUROSCI.18-17-06939.1998
Eden, G. F., Vanmeter, J. W., Rumsey, J. M., Maisog, J. M., Woods, R. P., & Zeffiro, T. A. (1996). Abnormal processingof visual motion in dyslexia revealed by functional brain imaging. Nature, 382, 66–69. doi:10.1038/382066a0
DEVELOPMENTAL NEUROPSYCHOLOGY 505
Ekstrom, R. B., French, J. W., Harman, H. H., & Dermen, D. (1976). Manual for kit of factor-referenced cognitive tests.Princeton, NJ: Educational testing service.
Geary, D. C. (2011). Consequences, characteristics, and causes of mathematical learning disabilities and persistent lowachievement in mathematics. Journal of Developmental & Behavioral Pediatrics, 32, 250–263. doi:10.1097/DBP.0b013e318209edef
Ginsburg, H. P., & Baroody, A. J. (1990). Examiners manual of the test of early mathematics ability Austin, TX: Pro-Ed.Goswami, U., Wang, H. L. S., Cruz, A., Fosker, T., Mead, N., & Huss, M. (2010). Language-universal sensory deficits in
developmental dyslexia: English, Spanish, and Chinese. Journal of Cognitive Neuroscience, 23, 325–337. doi:10.1162/jocn.2010.21453
Groffman, S. (1966). Visual tracing. Journal of American Optometric Association, 37, 139–141.Groffman, S. (1994). The relationship between visual perception and learning. In: Scheiman, MM., Rouse, MW. eds.
Optometric management of learning-related vision problems. St. Louis: Mosby-Year Book.Groffman, S. (2009). Subitizing: Vision therapy for math deficits. Optometry and Vision Development, 40, 229.Halberda, J., Mazzocco, M. M., & Feigenson, L. (2008). Individual differences in non-verbal number acuity correlate
with maths achievement. Nature, 455, 665–668. doi:10.1038/nature07246Hedden, T., & Yoon, C. (2006). Individual differences in executive processing predict susceptibility to interference in
verbal working memory. Neuropsychology, 20, 511. doi:10.1037/0894-4105.20.5.511Iuculano, T., Tang, J., Hall, C. W. B., & Butterworth, B. (2008). Core information processing deficits in developmental
dyscalculia and low numeracy. Developmental Science, 11, 669–680. doi:10.1111/j.1467-7687.2008.00716.xJastrzebski, N. R., Crewther, S. G., & Crewther, D. P. (2015). Mathematical impairment associated with high-contrast
abnormalities in change detection and magnocellular visual evoked response. Experimental Brain Research, 233,3039–3046. doi:10.1007/s00221-015-4373-y
Kyttälä, M., & Lehto, J. E. (2008). Some factors underlying mathematical performance: The role of visuospatialworking memory and non-verbal intelligence. European Journal of Psychology of Education, 23, 77–94.doi:10.1007/BF03173141
Landerl, K., Fussenegger, B., Moll, K., & Willburger, E. (2009). Dyslexia and dyscalculia: Two learning disorders withdifferent cognitive profiles. Journal of Experimental Child Psychology, 103, 309–324. doi:10.1016/j.jecp.2009.03.006
Layes, S., Lalonde, R., Mecheri, S., & Reba, M. (2015). Phonological and cognitive reading related skills as predictors ofword reading and reading comprehension among Arabic dyslexic children. Psychology, 06, 20–38. doi:10.4236/psych.2015.61003
Mazzocco, M. M. M., Feigenson, L., & Halberda, J. (2011). Impaired acuity of the approximate number systemunderlies mathematical learning disability (Dyscalculia). Child Development, 82, 1224–1237. doi:10.1111/j.1467-8624.2011.01608.x
Mejias, S., Grégoire, J., & Noël, M. P. (2012). Numerical estimation in adults with and without developmentaldyscalculia. Learning & Individual Differences, 22, 164–170. doi:10.1016/j.lindif.2011.09.013
Moll, K., Göbel, S. M., Gooch, D., Landerl, K., & Snowling, M. J. (2014). Cognitive risk factors for specific learningdisorder processing speed, temporal processing, and working memory. Journal of Learning Disabilities, 49(3), 272–281. doi:10.1177/0022219414547221
Moll, K., Göbel, S. M., & Snowling, M. J. (2015). Basic number processing in children with specific learning disorders:Comorbidity of reading and mathematics disorders. Child Neuropsychology, 21, 399–417. doi:10.1080/09297049.2014.899570
Mummery, C. J., Patterson, K., Hodges, J. R., & Price, C. J. (1998). Functional neuroanatomy of the semantic system:Divisible by what? Journal of Cognitive Neuroscience, 10, 766–777. doi:10.1162/089892998563059
Piazza, M., Facoetti, A., Trussardi, A. N., Berteletti, I., Conte, S., Lucangeli, D., Dehaenea, S., Zorzi, M. (2010).Developmental trajectory of number acuity reveals a severe impairment in developmental dyscalculia. Cognition,116, 33–41. doi:10.1016/j.cognition.2010.03.012
Raven, J. (1998). Manual for Raven’s progressive matrices and vocabulary scales: Section 1. Oxford, UK: OxfordPsychologists Press.
Rohde, T. E., & Thompson, L. A. (2007). Predicting academic achievement with cognitive ability. Intelligence, 35, 83–92. doi:10.1016/j.intell.2006.05.004
Rousselle, L., & Noël, M. P. (2007). Basic numerical skills in children with mathematics learning disabilities: Acomparison of symbolic vs non-symbolic number magnitude processing. Cognition, 102, 361–395. doi:10.1016/j.cognition.2006.01.005
Saksida, A., Iannuzzi, S., Bogliotti, C., Chaix, Y., Demonet, J. F., Bricout, L., Billard, C., Nguyen-Morel, M., Le Heuzey,M., Soares-Boucaud, I., George, F., Ziegler, J., Ramus, F. (2016). Phonological skills, visual attention span, andvisual stress in developmental dyslexia. Developmental Psychology, 52, 1503–1516. doi:10.1037/dev0000184
Salthouse, T. A., & Meinz, E. J. (1995). Aging, inhibition, working memory, and speed. The Journals of GerontologySeries B: Psychological Sciences and Social Sciences, 50, P297–P306. doi:10.1093/geronb/50B.6.P297
Schleifer, P., & Landerl, K. (2011). Subitizing and counting in typical and atypical development. Developmental Science,14(212), 280–291. doi:10.1111/j.1467-7687.2010.00976.x
506 D. CHENG ET AL.
Schuchardt, K., Maehler, C., & Hasselhorn, M. (2008). Working memory deficits in children with specific learningdisorders. Journal Learning Disability, 41, 514–523. doi:10.1177/0022219408317856
Sigmundsson, H., Anholt, S. K., & Talcott, J. B. (2010). Are poor mathematics skills associated with visual deficits intemporal processing? Neuroscience Letters, 469, 248–250. doi:10.1016/j.neulet.2009.12.005
Skagerlund, K., & Träff, U. (2014). Number processing and heterogeneity of developmental dyscalculia: Subtypes withdifferent cognitive profiles and deficits. Journal of Learning Disabilities, 49(1), 36. doi:10.1177/0022219414522707
So, D., & Siegel, L. S. (1997). Learning to read Chinese: Semantic, syntactic, phonological and working memory skillsin normally achieving and poor Chinese readers. Reading & Writing, 9, 1–21. doi:10.1023/A:1007963513853
Stefanics, G., Fosker, T., Huss, M., Mead, N., Szucs, D., & Goswami, U. (2011). Auditory sensory deficits indevelopmental dyslexia: A longitudinal ERP study. Neuroimage, 57, 723–732. doi:10.1016/j.neuroimage.2011.04.005
Stein, J., & Walsh, V. (1997). To see but not to read; the magnocellular theory of dyslexia. Trends in Neurosciences, 20,147–152. doi:10.1016/S0166-2236(96)01005-3
Strien, J. W. V., Licht, R., Bouma, A., & Bakker, D. J. (1989). Event-related potentials during word-reading and figure-matching in left-handed and right-handed males and females. Brain & Language, 37, 525–547. doi:10.1016/0093-934X(89)90110-7
Tibber, M. S., Greenwood, J. A., & Dakin, S. C. (2012). Number and density discrimination rely on a common metric:Similar psychophysical effects of size, contrast, and divided attention. Journal of Vision, 12, 8. doi:10.1167/12.6.8
Valdois, S., Bidet-Ildei, C., Lassus-Sangosse, D., Reilhac, C., N’guyen-Morel, M., Guinet, E., Orliagueta, J. (2011). Avisual processing but no phonological disorder in a child with mixed dyslexia. Cortex, 47, 1197–1218. doi:10.1016/j.cortex.2011.05.011
Vandenberg, S. G., & Kuse, A. R. (1978). Mental rotations, a group test of three-dimensional spatial visualization.Perceptual and Motor Skills, 47, 599–604. doi:10.2466/pms.1978.47.2.599
Vellutino, F. R., Fletcher, J. M., Snowling, M. J., & Scanlon, D. M. (2004). Specific reading disability (dyslexia): Whathave we learned in the past four decades? Journal of Child Psychology & Psychiatry, 45, 2–40. doi:10.1046/j.0021-9630.2003.00305.x
Vidyasagar, T. R., & Pammer, K. (2010). Dyslexia: A deficit in visuo-spatial attention, not in phonological processing.Trends in Cognitive Sciences, 14, 57–63. doi:10.1016/j.tics.2009.12.003
Wang, Z., Cheng-Lai, A., Yan, S., Cutting, L., Jiang, Y., Lin, O., Meng, X., Zhou, X. (2014). A perceptual learningdeficit in chinese developmental dyslexia as revealed by visual texture discrimination training. Dyslexia, 20, 280–296. doi:10.1002/dys.1475
Wilson, A. J., Andrewes, S. G., Struthers, H., Rowe, V. M., Bogdanovic, R., & Waldie, K. E. (2014). Dyscalculia anddyslexia in adults: Cognitive bases of comorbidity. Learning & Individual Differences, 37, 118–132. doi:10.1016/j.lindif.2014.11.017
Zhao, J., Qian, Y., Bi, H. Y., & Coltheart, M. (2014). The visual magnocellular-dorsal dysfunction in Chinese childrenwith developmental dyslexia impedes Chinese character recognition. Scientific Reports, 4, 7068. doi:10.1038/srep07068
Zhou, X., & Cheng, D. (2015a). When and why numerosity processing is associated with developmental dyscalculia. InChinn, S. The routledge international handbook of dyscalculia and mathematical (pp. 78–89). Swales & Willis Ltd,Exeter, Devon, UK: Routledge.
Zhou, X., Wei, W., Zhang, Y., Cui, J., & Chen, C. (2015b). Visual perception can account for the close relation betweennumerosity processing and computational fluency. Frontiers in Psychology, 6, 1364. doi:10.3389/fpsyg.2015.01364
DEVELOPMENTAL NEUROPSYCHOLOGY 507