Embed Size (px)
Citation preview

1
Dynamics of Rural Poverty in Madagascar
Flore Gubert and Anne-Sophie Robilliard
DIAL/IRD
Conference on « Employment and poverty », Lima, Peru, 16-17 October 2003

2
Conference on « Employment and poverty », Lima, Peru, 16-17 October 2003
Objectives of the paper
Analysing the dynamics of poverty from 1996 to 2002 using unique household panel data collected in four distinct areas of Madagascar
Two complementary approaches :
- components approach [Jalan and Ravallion (1998) (China); Muller (2000) (Rwanda); Haddad and Ahmed (2002) (Egypt)]
- Spell-based approach [Stevens (1999) (United Kingdom); Jarvis and Jenkins (1995, 1996) (United Kingdom); Devicienti (2001) (United Kingdom)]
Motivations
- Income and poverty dynamics have intrinsic social relevance and policy significance ;
- Many academic challenges raised by income and poverty dynamics ;
- Little research has been done on income and poverty dynamics.

3
Conference on « Employment and poverty », Lima, Peru, 16-17 October 2003
The data
-Survey jointly administered by Madagascar’s INSTAT and IRD through the projet MADIO ;
-Conducted every year since 1995, in four separate agro-climatic zones ;
-500 households surveyed every year in eachof the four regions ;
-High attrition with approx. 20% of the samplerenewed each year
=> Balanced panel consists of 414 households surveyed from 1995 to 2002
-Very rich data on household demographics and education; living conditions;migration; consumption and incomes by source ; assets, savings and borrowing, etc.

4
Conference on « Employment and poverty », Lima, Peru, 16-17 October 2003
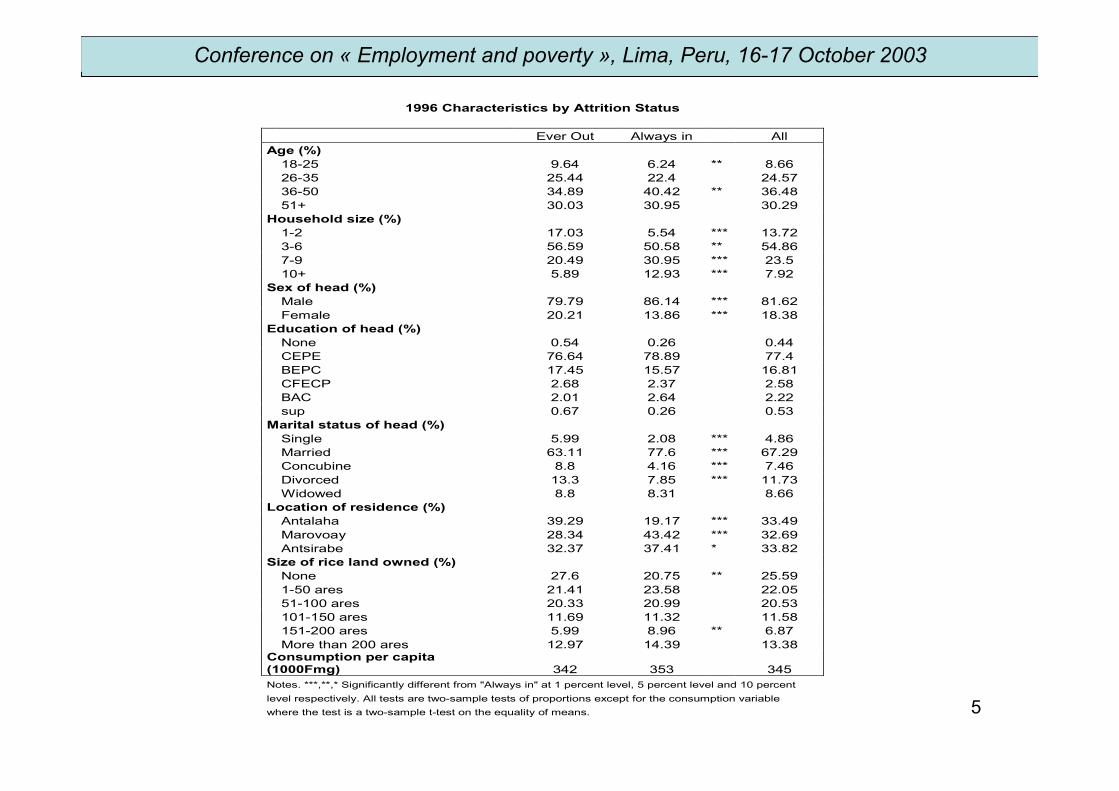
Sample attrition issues : is attrition ignorable ?
22.10.031.939.516.6As a % of 1996433016218883200234.724.033.741.639.2As a % of 1996679114171198196200143.542.938.847.944.8As a % of 1996853204197228224200048.948.443.152.751.4As a % of 1996957230219251257199960.652.871.159.558.4As a % of 19961187251361283292199878.369.785.063.793.6As a % of 199615343314323034681997100.0100.0100.0100.0100.0As a % of 199619594755084765001996AllToliaraMarovoayAntsirabeAntalaha
Attrition hazards: sample with no new entrants
5
Conference on « Employment and poverty », Lima, Peru, 16-17 October 2003
1996 Characteristics by Attrition Status Ever Out Always in All Age (%) 18-25 9.64 6.24 ** 8.66 26-35 25.44 22.4 24.57 36-50 34.89 40.42 ** 36.48 51+ 30.03 30.95 30.29 Household size (%) 1-2 17.03 5.54 *** 13.72 3-6 56.59 50.58 ** 54.86 7-9 20.49 30.95 *** 23.5 10+ 5.89 12.93 *** 7.92 Sex of head (%) Male 79.79 86.14 *** 81.62 Female 20.21 13.86 *** 18.38 Education of head (%) None 0.54 0.26 0.44 CEPE 76.64 78.89 77.4 BEPC 17.45 15.57 16.81 CFECP 2.68 2.37 2.58 BAC 2.01 2.64 2.22 sup 0.67 0.26 0.53 Marital status of head (%) Single 5.99 2.08 *** 4.86 Married 63.11 77.6 *** 67.29 Concubine 8.8 4.16 *** 7.46 Divorced 13.3 7.85 *** 11.73 Widowed 8.8 8.31 8.66 Location of residence (%) Antalaha 39.29 19.17 *** 33.49 Marovoay 28.34 43.42 *** 32.69 Antsirabe 32.37 37.41 * 33.82 Size of rice land owned (%) None 27.6 20.75 ** 25.59 1-50 ares 21.41 23.58 22.05 51-100 ares 20.33 20.99 20.53 101-150 ares 11.69 11.32 11.58 151-200 ares 5.99 8.96 ** 6.87 More than 200 ares 12.97 14.39 13.38 Consumption per capita (1000Fmg) 342 353 345 Notes. ***,**,* Significantly different from "Always in" at 1 percent level, 5 percent level and 10 percent level respectively. All tests are two-sample tests of proportions except for the consumption variable where the test is a two-sample t-test on the equality of means.
6
Conference on « Employment and poverty », Lima, Peru, 16-17 October 2003
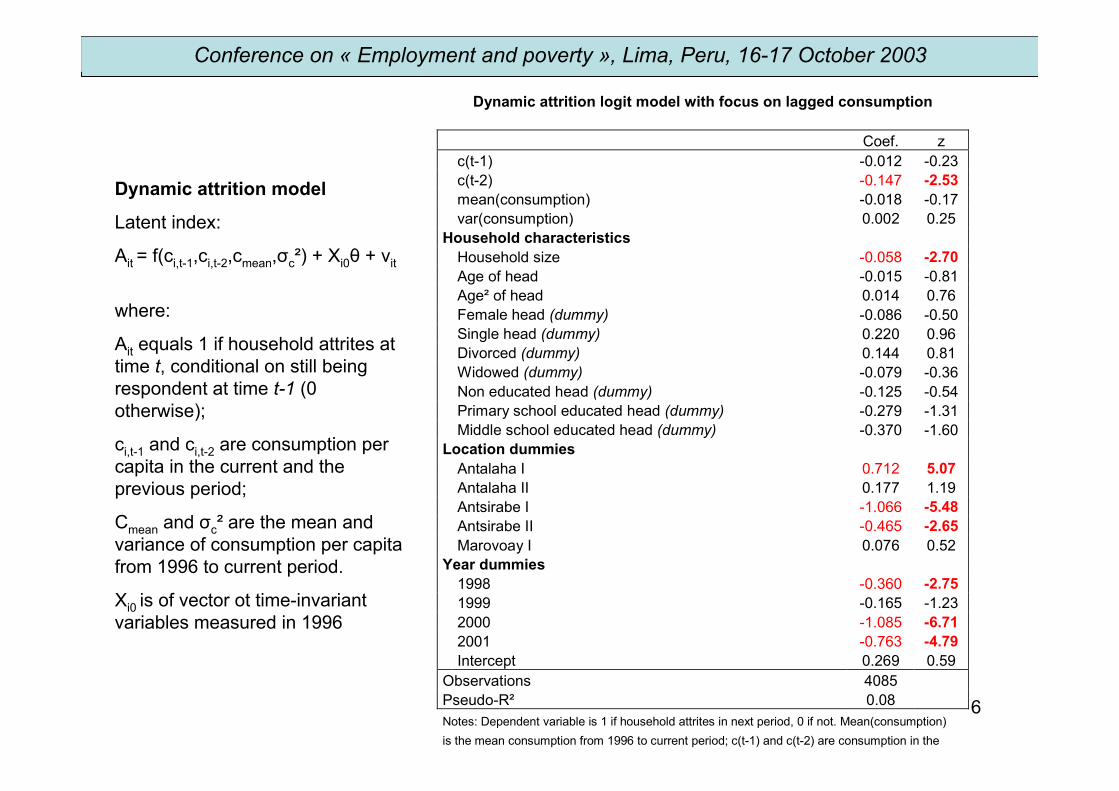
Dynamic attrition logit model with focus on lagged consumption Coef. z c(t-1) -0.012 -0.23 c(t-2) -0.147 -2.53 mean(consumption) -0.018 -0.17 var(consumption) 0.002 0.25 Household characteristics Household size -0.058 -2.70 Age of head -0.015 -0.81 Age² of head 0.014 0.76 Female head (dummy) -0.086 -0.50 Single head (dummy) 0.220 0.96 Divorced (dummy) 0.144 0.81 Widowed (dummy) -0.079 -0.36 Non educated head (dummy) -0.125 -0.54 Primary school educated head (dummy) -0.279 -1.31 Middle school educated head (dummy) -0.370 -1.60 Location dummies Antalaha I 0.712 5.07 Antalaha II 0.177 1.19 Antsirabe I -1.066 -5.48 Antsirabe II -0.465 -2.65 Marovoay I 0.076 0.52 Year dummies 1998 -0.360 -2.75 1999 -0.165 -1.23 2000 -1.085 -6.71 2001 -0.763 -4.79 Intercept 0.269 0.59 Observations 4085 Pseudo-R² 0.08 Notes: Dependent variable is 1 if household attrites in next period, 0 if not. Mean(consumption) is the mean consumption from 1996 to current period; c(t-1) and c(t-2) are consumption in the
Dynamic attrition model
Latent index:
Ait = f(ci,t-1,ci,t-2,cmean,σc²) + Xi0θ + vit
where:
Ait equals 1 if household attrites attime t, conditional on still beingrespondent at time t-1 (0 otherwise);
ci,t-1 and ci,t-2 are consumption per capita in the current and theprevious period;
Cmean and σc² are the mean andvariance of consumption per capita from 1996 to current period.
Xi0 is of vector ot time-invariantvariables measured in 1996

7
Conference on « Employment and poverty », Lima, Peru, 16-17 October 2003
Identifying the poor
We follow a “cost-of-basic-needs” approach as developed by Ravallion (1998) and augmented by an iterative solution proposed by Pradhan et al. (2001) for Indonesia
The computation of our poverty estimates relies on two steps: i) the definition of a measure of individual welfare; ii) the definition of a poverty line.
While these steps are supposedly rather current practice today, their implementation is complicated by the fact that we are interested in inter temporal as well as inter regional comparisons.
Definition of a measure of individual welfare
Our measure of individual welfare is per capita consumption.
- a better proxy for measuring households' welfare than incomes.
- includes cash expenditure and the imputed value of in-kind spending on food, clothing, medicines, housing, education, recreation, and transportation.
+ Price deflator to allow for inter-temporal and inter-regional comparisons

8
Conference on « Employment and poverty », Lima, Peru, 16-17 October 2003
Identifying the poor
Definition of a poverty line
The "cost-of-basic-needs" method relies on an additive decomposition of the povery line (PL) into two elements:
- a food poverty line (FPL) and - a non-food allowance (NFA).
The food component is anchored to nutritional requirement for good health : FPL = level of expenditure necessary to achieve an intake requirement of N calories per person per day.
Problem : not sufficient to compute because the same intake can be achieved through a near infinite mix of foods => basket of goods that corresponds to the average quantities actually consumed by a "reference population".
The food component is then augmented with an allowance for non-food goods.
Circularity problem between determining the reference population and the resulting headcount poverty rate => iterative approach developed by Pradhan et al (2001) for Indonesia.

9
Conference on « Employment and poverty », Lima, Peru, 16-17 October 2003
Identifying the poor
Poverty estimates
In order to reflect regional nutritional preferences and norms, one food basket was developed for each region => PLs differ across regions
Note: Mean consumption is computed over the 1996-2002 period except for households in theToliara region which were not surveyed in 2002.
2.360.810.910.80PL as a share of mean PCC
528 957426 493367 000388 996Poverty Line (PL = FPL + NFA)
98 64284 81876 35855 444Non Food Allowance (NFA)
430 315341 675290 642333 553Food Poverty Line (FPL)
224 471526 508401 215487 462Mean per capita consumption
ToliaraMarovoayAntsirabeAntalahaFmg per person
Summary data by region

10
Conference on « Employment and poverty », Lima, Peru, 16-17 October 2003
Identifying the poor
Poverty estimates
Note: Households in the Toliara region were not surveyed in 2002.
-0.480.400.430.540.480.45Toliara
0.010.030.050.060.060.050.09Marovaoy
0.150.160.120.110.090.040.06Antsirabe
0.010.030.040.010.020.020.15Antalaha
2002200120001999199819971996FGT2
-0.660.590.590.710.660.61Toliara
0.050.090.130.160.170.130.19Marovaoy
0.300.320.270.250.210.110.13Antsirabe
0.040.100.120.030.090.070.31Antalaha
2002200120001999199819971996FGT1
-0.970.970.920.990.960.95Toliara
0.390.430.480.610.610.460.58Marovaoy
0.750.790.690.700.660.410.43Antsirabe
0.210.470.510.190.450.310.81Antalaha
2002200120001999199819971996FGT0
Poverty indicators across years and regions

11
Conference on « Employment and poverty », Lima, Peru, 16-17 October 2003
Identifying the poor
Poverty estimates
Note: Households are identified as being chronically poor if their mean consumption over the period falls below the poverty line.
-61.075.181.0200297.863.175.644.1200197.971.980.342.3200099.164.378.275.8199996.968.781.143.9199899.471.391.151.3199799.367.282.435.31996
ToliaraMarovoayAntsirabeAntalahaShare of poor in current year who are chronically poor (%)

12
Conference on « Employment and poverty », Lima, Peru, 16-17 October 2003
Analysing chronic and transient poverty
Chronic and transient poverty measures [Ravallion, 1998 ; Jalan and Ravallion, 1998]
- Chronic component of poverty:
Ci = P(Eci ,Eci ,…,Eci )
where P(…,…,…) is an aggregate inter-temporal poverty measure for a givenhousehold.
- Transient component of poverty = difference between overall poverty and itschronic component:
Ti = P(ci1 ,ci2 ,…,ciD ) - P(Eci ,Eci ,…,Eci )
Empirical poverty measure used in the paper:
P(cit) = P(1-cit)² if cit ≤ 1
= 0 otherwise
13
Conference on « Employment and poverty », Lima, Peru, 16-17 October 2003
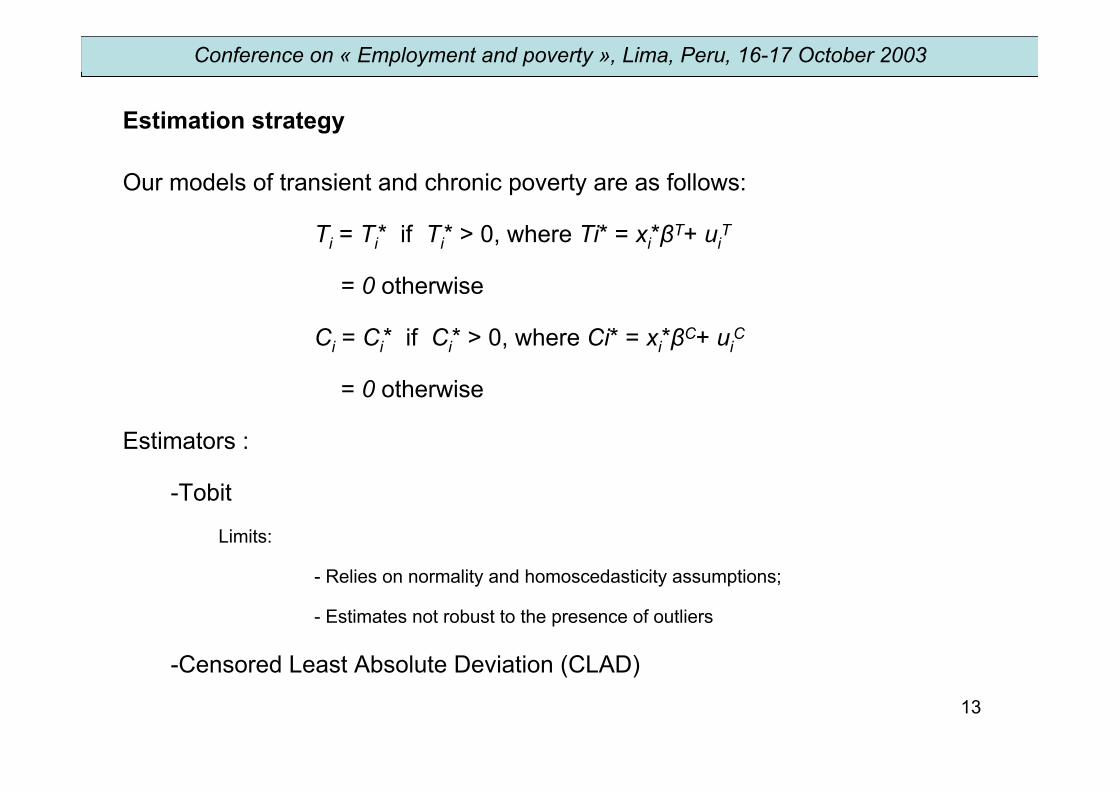
Estimation strategy
Our models of transient and chronic poverty are as follows:
Ti = Ti* if Ti* > 0, where Ti* = xi*βT+ uiT
= 0 otherwise
Ci = Ci* if Ci* > 0, where Ci* = xi*βC+ uiC
= 0 otherwise
Estimators :
-Tobit
Limits:
- Relies on normality and homoscedasticity assumptions;
- Estimates not robust to the presence of outliers
-Censored Least Absolute Deviation (CLAD)

14
Conference on « Employment and poverty », Lima, Peru, 16-17 October 2003
Correlates of chronic and transient poverty - Panel 1996-2002 Censored quantile regression Chronic poverty Transient poverty Coef. t Coef. t Socio-demographic characteristics Household size (log) 0.077 3.24 0.013 1.45 Proportion of babies: 0-5 years 0.334 2.17 0.107 1.68 Proportion of children: 5-15 years 0.234 1.58 0.082 1.32 Proportion of young adults: 15-20 years 0.219 1.55 0.055 0.83 Proportion of active members -0.066 -1.09 0.003 0.12 Proportion of wage earners 0.054 0.85 -0.017 -0.69 Proportion of illiterate adults 0.224 1.73 0.061 1.21 Proportion of primary school educated adults 0.136 1.03 0.030 0.56 Proportion of middle school educated adults 0.090 0.60 0.077 1.26 Characteristics of the head Male head (dummy) -0.032 -0.81 0.011 0.62 Single head (dummy) -0.078 -2.07 0.022 1.19 Age of head 0.005 1.46 -0.001 -0.62 Age² of head 0.000 -0.99 0.000 0.51 Non educated head (dummy) 0.004 0.13 -0.002 -0.10 Primary school educated head (dummy) 0.022 0.61 0.000 0.02 Middle school educated head (dummy) 0.038 0.99 -0.026 -1.16 Agriculture: main activity (dummy) 0.024 0.85 0.002 0.14 Head belongs to main ethnic group (dummy) -0.017 -0.97 -0.009 -1.31 Head is catholic (dummy) 0.041 2.03 -0.003 -0.42 Head is protestant (dummy) 0.045 2.19 0.001 0.10 Livestock Number of oxen 0.005 0.77 -0.003 -1.07 Number of bullocks -0.002 -0.68 -0.001 -0.49 Number of cows -0.062 -3.58 -0.001 -0.27 Number of porks -0.004 -0.91 -0.004 -2.34

15
Conference on « Employment and poverty », Lima, Peru, 16-17 October 2003
Correlates of chronic and transient poverty - Panel 1996-2002 Censored quantile regression Chronic poverty Transient poverty Coef. t Coef. t Characteristics of dwelling Numbers of rooms in dwelling -0.016 -3.04 -0.002 -0.78 Roof: sheet metal (dummy) -0.055 -3.65 -0.007 -1.02 Roof: tiled (dummy) 0.062 0.57 -0.006 -0.27 Permanent walls (dummy) -0.008 -0.19 -0.019 -1.24 Brick walls (dummy) 0.024 1.23 -0.043 -3.27 Water access: pump (dummy) 0.018 0.58 0.011 0.70 Water access: well (dummy) -0.065 -3.07 -0.009 -0.96 Agriculture Owned rice land per capita -0.003 -3.50 0.000 -2.03 Mean rice yield -0.007 -4.04 -0.003 -3.70 Standard deviation of rice yield 0.002 1.47 0.002 2.39 Association membership and social capital HH belongs to a credit association (dummy) -0.041 -2.07 -0.017 -2.01 HH belongs to a producers' association (dummy) -0.057 -2.32 -0.020 -1.75 HH belongs to a water users' association (dummy) -0.033 -1.20 0.009 0.63 Number of ceremonies organised by the HH -0.034 -2.37 -0.001 -0.16 Number of ceremonies the HH has been invited to -0.003 -3.35 0.000 -0.17 Number of members involved in collective actions -0.002 -0.23 -0.005 -1.23 Location (not reported) Number of obserations 256 423 0.54 0.31

16
Conference on « Employment and poverty », Lima, Peru, 16-17 October 2003
Analysing transitions in and out of poverty
Non parametric analysis
Survivor function and exit rates from poverty, for all households beginning a poverty spell (Kaplan-Meier estimates)
Nb. of years since Total number of households at risk of Cumulative prop. Annual exit rate poverty spell started poverty exit at start of period remaining poor from poverty 1 391 1 0 2 197 0.62 0.38 3 123 0.48 0.23 4 83 0.40 0.16 5 61 0.34 0.14 6 15 0.33 0.03
Survivor function and poverty re-entry rates, for all households ending a poverty spell (Kaplan-Meier estimates)
Nb. of years since non- Total number of households at risk of Cumulative prop. Annual re-entry rate poverty spell started poverty re-entry at start of period remaining non-poor to poverty 1 411 1 0 2 179 0.62 0.38 3 98 0.48 0.23 4 57 0.38 0.20 5 31 0.34 0.11 6 18 0.30 0.13

17
Conference on « Employment and poverty », Lima, Peru, 16-17 October 2003
Multivariate approach
We estimate proportional odds discrete-time survival models for poverty exit and for poverty re-entry, by letting the probability of exiting out of (or re-entering into) poverty in any given year be represented by a standard logitspecification.
The estimates are based on models that include, in addition to duration terms, time-varying covariates such as age, education, sex and marital status of the household head, household size and household demographic composition and controls for calendar year and location.

18
Conference on « Employment and poverty », Lima, Peru, 16-17 October 2003
Characteristics of the head
Socio-demographic characteristics
Duration dummies [ref.: 1]
-0.58-0.496-0.50-0.705HH head changed between t-1 and t (dummy)-0.19-0.050-0.47-0.130Head belongs to main ethnic group (dummy)1.530.7910.220.137Middle school educated head (dummy)1.070.512-0.53-0.255Primary school educated head (dummy)1.150.6520.270.151Non educated head (dummy)1.720.001-1.42-0.001Age of head-1.71-0.1001.490.076Age² of head0.130.0710.420.208Single head (dummy)-0.64-0.3450.530.283Male head (dummy)
-0.77-0.936-0.73-1.172Proportion of middle school educated adults-0.86-0.6980.170.147Proportion of primary school educated adults-0.72-0.663-1.69-1.550Proportion of illiterate adults0.420.062-2.58-0.320Dependency ratio1.401.067-1.94-1.828No adult (dummy)6.010.471-5.80-0.435Household size
0.140.084-0.59-0.5675-0.83-0.494-1.37-0.57840.180.065-1.04-0.4033-0.87-0.253-0.97-0.2732
zCoef.zCoef.Poverty re-entry ratePoverty exit ratePoverty exit and re-entry logit regressions

19
Conference on « Employment and poverty », Lima, Peru, 16-17 October 2003
Year dummies [ref.: 2002]
Association membership
Other household characteristics
1.000.334-2.49-0.8112001
1.990.693-0.31-0.1112000
1.160.442-2.13-0.7701999
1.550.561-0.73-0.2901998
1.320.798-0.73-0.331HH belongs to a water users' association (dummy)
-2.14-1.0882.150.926HH belongs to a producers' association (dummy)
1.040.3280.330.103HH belongs to a credit association (dummy)
-2.68-0.409--Non-poverty gap
---4.16-3.126Poverty gap
0.250.0690.230.078Loss of land resources between t-1 and t (dummy)
-1.23-0.4582.550.800Gain in land resources between t-1 and t (dummy)
0.290.0000.720.001Owned rice land per capita
-3.54-0.6943.700.479Numbers of rooms in dwelling
-2.26-0.3861.800.211Number of porks
-2.05-0.1791.720.107Number of cows
-0.37-0.0283.130.225Number of bullocks
-0.66-0.038-0.14-0.010Number of oxen
zCoef.zCoef.
Poverty re-entry ratePoverty exit ratePoverty exit and re-entry logit regressions

20
Conference on « Employment and poverty », Lima, Peru, 16-17 October 2003
0.2480.314Pseudo R²
-302.7-304.4Log likelihood
610706Observations
0.040.0680.831.334Intercept
0.100.043-0.21-0.143Marovoay - village 2
0.400.171-0.12-0.077Marovoay - village 1
2.512.356-1.38-1.191Antsirabe - village 12
4.592.293-2.33-1.610Antsirabe - village 11
3.863.807-3.04-2.413Antsirabe - village 10
3.372.053-1.94-1.512Antsirabe - village 9
3.262.889-3.14-2.452Antsirabe - village 8
3.653.134-1.79-1.395Antsirabe - village 7
2.662.246-2.21-2.161Antsirabe - village 6
1.872.284-2.80-2.578Antsirabe - village 5
---1.88-2.067Antsirabe - village 4
1.941.563-0.91-0.733Antsirabe - village 3
0.720.896-1.85-1.675Antsirabe - village 2
---1.25-1.145Antsirabe - village 1
0.970.3930.250.161Antalaha - village 2
Location [ref.: Antalaha - village 1]
zCoef.zCoef.
Poverty re-entry ratePoverty exit ratePoverty exit and re-entry logit regressions

21
Conference on « Employment and poverty », Lima, Peru, 16-17 October 2003
Conclusion
Measure and analyse the dynamics of rural poverty from 1996 to 2002 using panel data collected in four distinct areas of Madagascar.
Two complementary approaches were implemented, namely the components approach and a spell-based approach.
Results based on the former one show that the models determining chronic and transient poverty differ :
- chronic poverty is associated with traditional determinants of total poverty (socio-demographic variables, variable and fixed physical assets),
- transient poverty is determined by variable physical assets and the riskiness in agriculture.
Analyses of the transitions into and out of poverty based on the spell-based approach reject duration dependency, suggesting heterogeneity within the poor.

22
Conference on « Employment and poverty », Lima, Peru, 16-17 October 2003
Conclusion
Some policy implications : targeting
1. the targeting of the chronic poor can be based on the same observables as the ones typically used as proxies of poverty.
2. much of the transient poor would be missed through such a targeting scheme and finding a good proxy to identify them is not straightforward.
3. our results also speak for regional targeting since there appears to be strong diversity across regions.
Some policy implications : policy content
1. any measure directed towards improvement of household human and physical capital and household productivity may be efficient against poverty
2. measures aimed at improving and stabilizing crop yields should contribute to alleviate both chronic and transient poverty in a relatively short-term.
3. Since targeting the transient poor is difficult, any measure contributing to reduce risks or exposure to risks should be promoted : encouraging the breeding of small livestock should contribute to lowering exposure to transient poverty.

23
Conference on « Employment and poverty », Lima, Peru, 16-17 October 2003
Conclusion
New directions for further research
1. It would be interesting to re-run the regressions for each region in order to check whether the models determining chronic and transient poverty on the one hand and transitions into and out of poverty on the other hand are region-specific. Exploratory work suggests that it is indeed the case.
2. Our analysis of poverty transitions suffers from a lack of data on demographic events. Identifying and coding these events require information at the individual level. The construction of an individual panel from our data set should allow us to address this problem.
3. The exploration of the causal relationship between social capital and poverty deserves more attention, with a focus on endogeneity issues.