Embed Size (px)
Citation preview
Dynamic Pedestrian and Dynamic Pedestrian and Vehicular ModellingVehicular Modelling
J. MacGregor Smith & M. Blakey J. MacGregor Smith & M. Blakey SmithSmith• Department of Mechanical and Department of Mechanical and
Industrial Engineering & Facilities Industrial Engineering & Facilities PlanningPlanning
• University of Massachusetts University of Massachusetts • Amherst MA 01003 Amherst MA 01003
http://www.ecs.umass.edu/mie/faculty/smith/http://www.ecs.umass.edu/mie/faculty/smith/
OverviewOverview
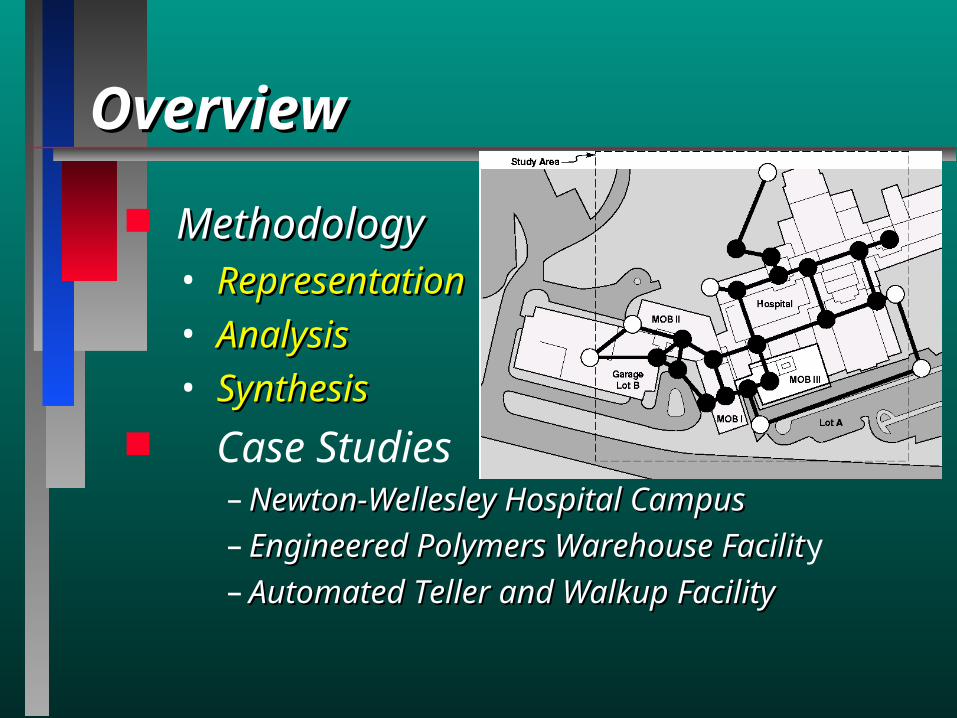
MethodologyMethodology• RepresentationRepresentation• AnalysisAnalysis • SynthesisSynthesis
Case Studies– Newton-Wellesley Hospital Campus Newton-Wellesley Hospital Campus – Engineered Polymers Warehouse FacilitEngineered Polymers Warehouse Facility– Automated Teller and Walkup FacilityAutomated Teller and Walkup Facility
Basic MethodologyBasic Methodology
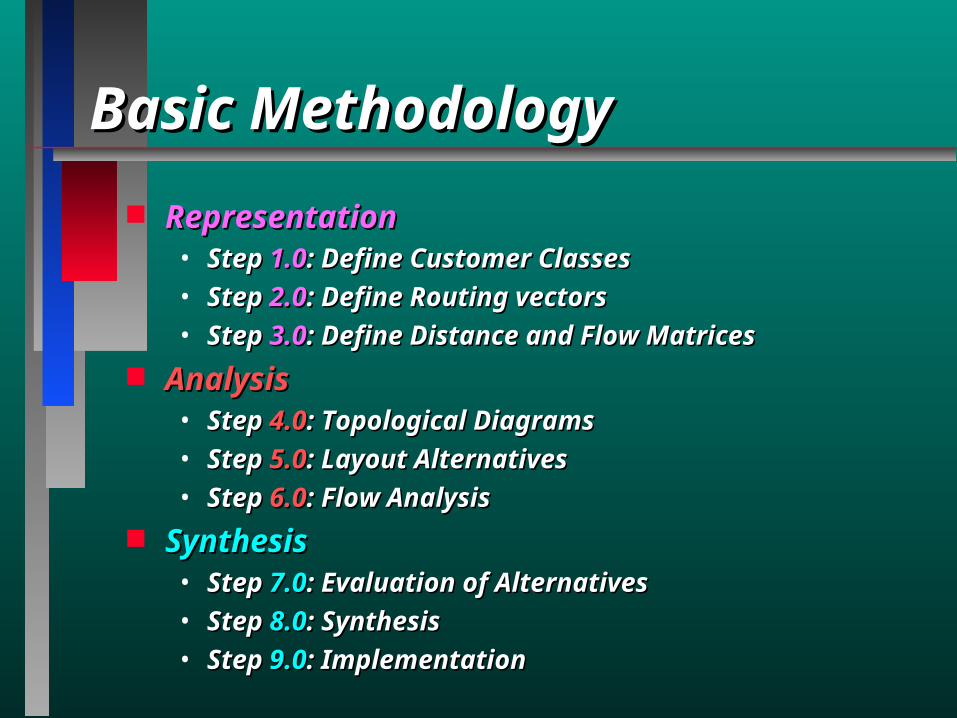
RepresentationRepresentation• Step Step 1.01.0: Define Customer Classes: Define Customer Classes• Step Step 2.02.0: Define Routing vectors: Define Routing vectors• Step Step 3.03.0: Define Distance and Flow Matrices : Define Distance and Flow Matrices
AnalysisAnalysis• Step Step 4.04.0: Topological Diagrams: Topological Diagrams• Step Step 5.05.0: Layout Alternatives: Layout Alternatives• Step Step 6.06.0: Flow Analysis: Flow Analysis
SynthesisSynthesis• Step Step 7.07.0: Evaluation of Alternatives: Evaluation of Alternatives• Step Step 8.08.0: Synthesis: Synthesis• Step Step 9.09.0: Implementation: Implementation
Representation
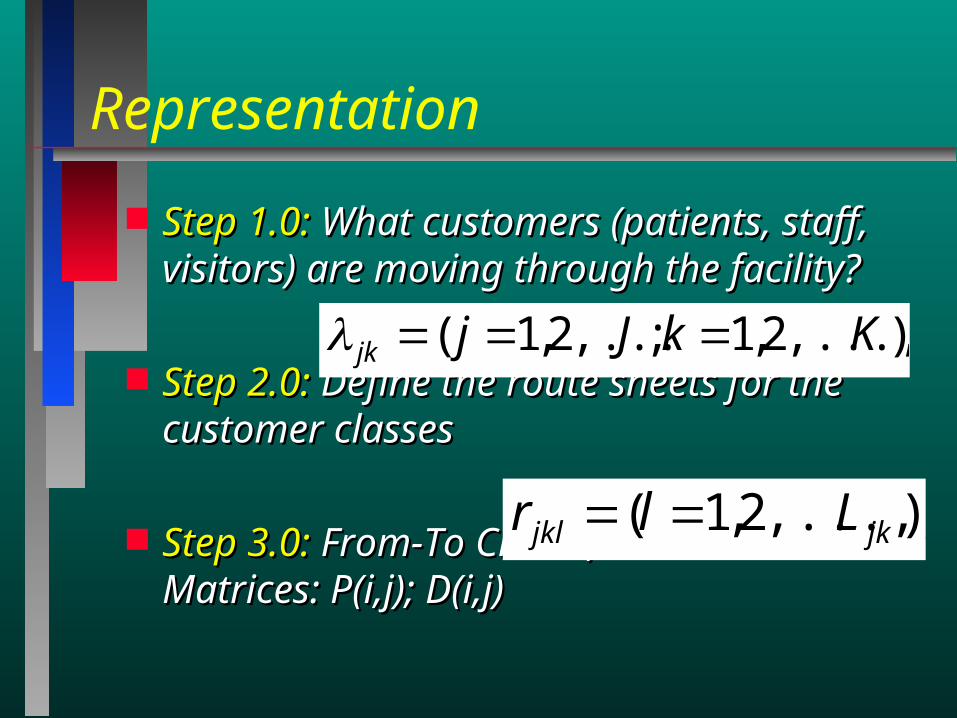
Step 1.0:Step 1.0: What customers (patients, staff, What customers (patients, staff, visitors) are moving through the facility?visitors) are moving through the facility?
Step 2.0: Step 2.0: Define the route sheets for the Define the route sheets for the customer classescustomer classes
Step 3.0:Step 3.0: From-To Charts, Distance and From-To Charts, Distance and Flow Matrices: P(i,j); D(i,j)Flow Matrices: P(i,j); D(i,j)
),...,2,1;,...2,1( KkJjjk
),...,2,1( jkjkl Llr
Analysis
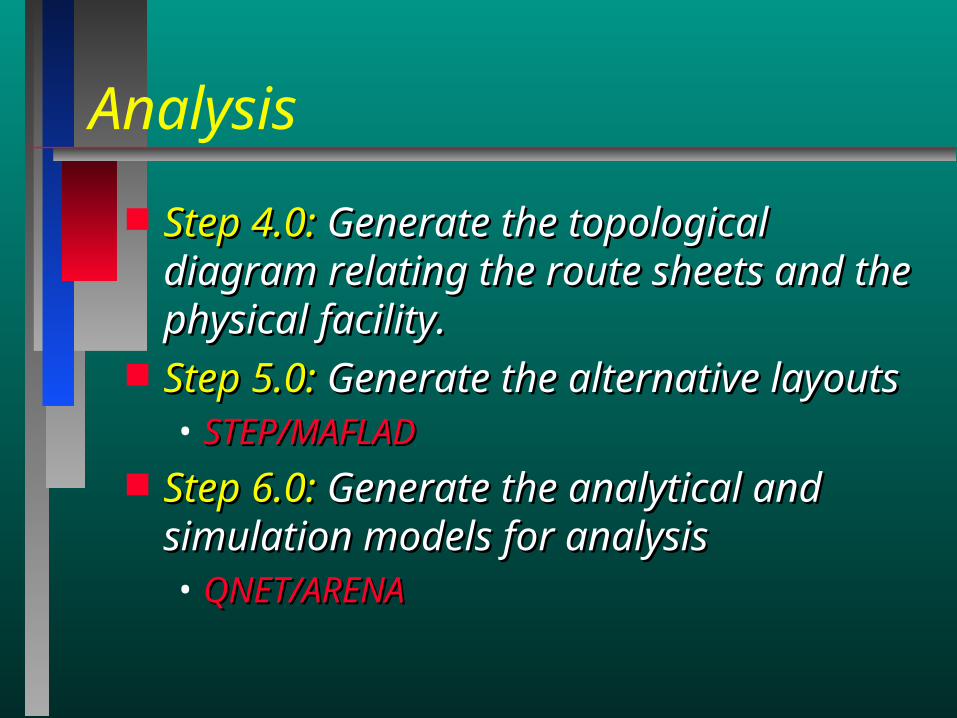
Step 4.0:Step 4.0: Generate the topological Generate the topological diagram relating the route sheets and the diagram relating the route sheets and the physical facility.physical facility.
Step 5.0:Step 5.0: Generate the alternative layouts Generate the alternative layouts• STEP/MAFLADSTEP/MAFLAD
Step 6.0:Step 6.0: Generate the analytical and Generate the analytical and simulation models for analysissimulation models for analysis• QNET/ARENAQNET/ARENA
Synthesis
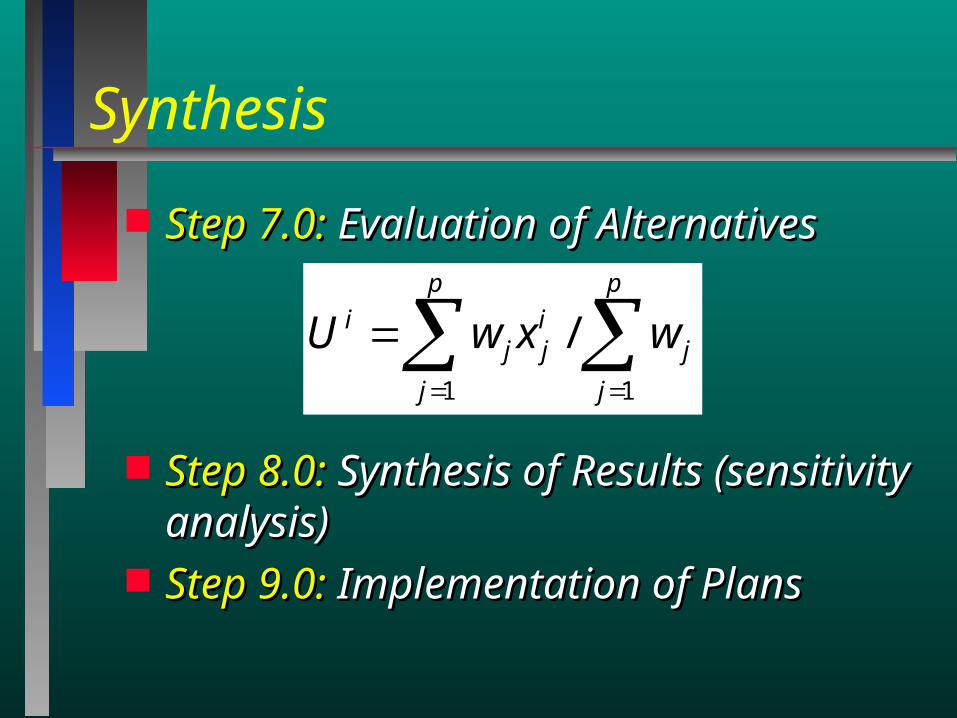
Step 7.0:Step 7.0: Evaluation of Alternatives Evaluation of Alternatives
Step 8.0:Step 8.0: Synthesis of Results Synthesis of Results (sensitivity analysis)(sensitivity analysis)
Step 9.0:Step 9.0: Implementation of Plans Implementation of Plans
p
j
j
p
j
ijj
i wxwU11
/
Design IssuesDesign Issues
What are the fundamental What are the fundamental designdesign and and performanceperformance variables variablesinvolved in designing a circulation involved in designing a circulation system? system?
How are these fundamental design (d), How are these fundamental design (d), performance (p), and contextual (c) performance (p), and contextual (c) variables related? variables related? P=f(c,d)P=f(c,d)
What is What is Congestion?Congestion?
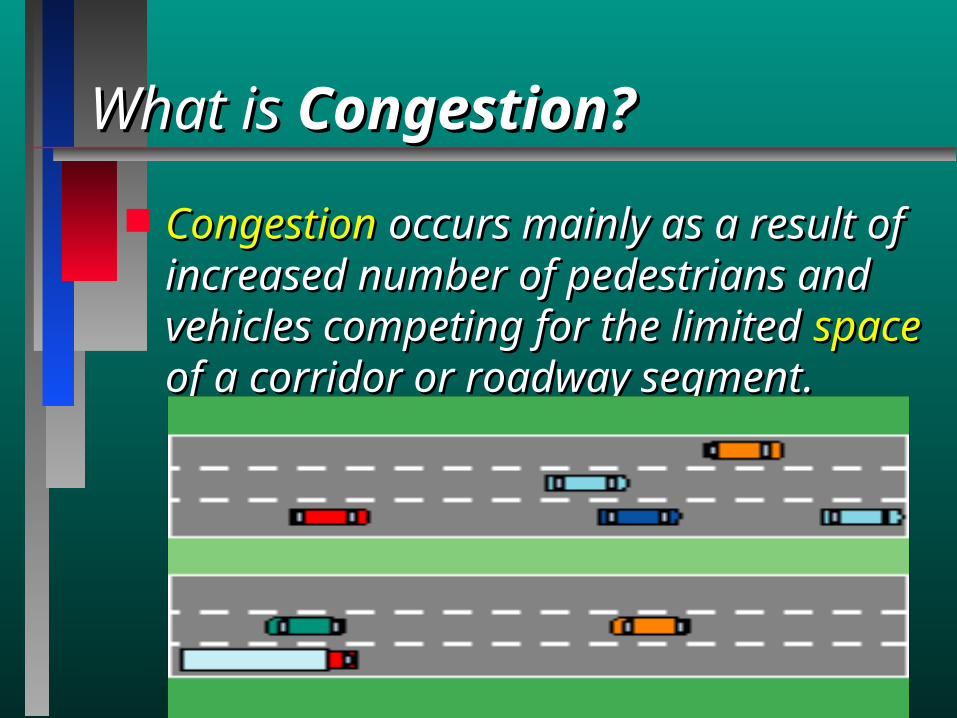
Congestion Congestion occurs mainly as a result of occurs mainly as a result of increased number of pedestrians and increased number of pedestrians and vehicles competing for the limited vehicles competing for the limited spacespace of a corridor or roadway segmentof a corridor or roadway segment. .
Empirical ModelEmpirical Model
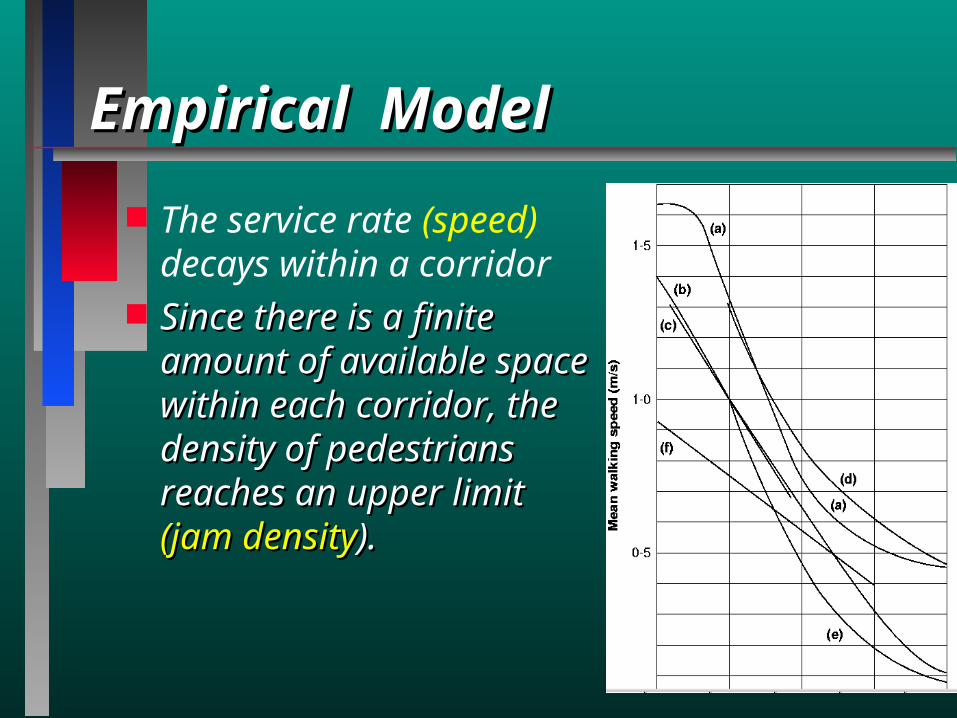
The service rate (speed) decays within a corridor
Since there is a finite Since there is a finite amount of available amount of available space within each space within each corridor, the density of corridor, the density of pedestrians reaches an pedestrians reaches an upper limit upper limit (jam density(jam density).).
•Performance MeasuresPerformance Measures
Flow (q) Output volume or throughput Density Density (k)(k)the number of customers or the number of customers or
vehicles travelling over a unit lengthvehicles travelling over a unit length Pedestrian Speed Pedestrian Speed (()) Time Time (t)(t)
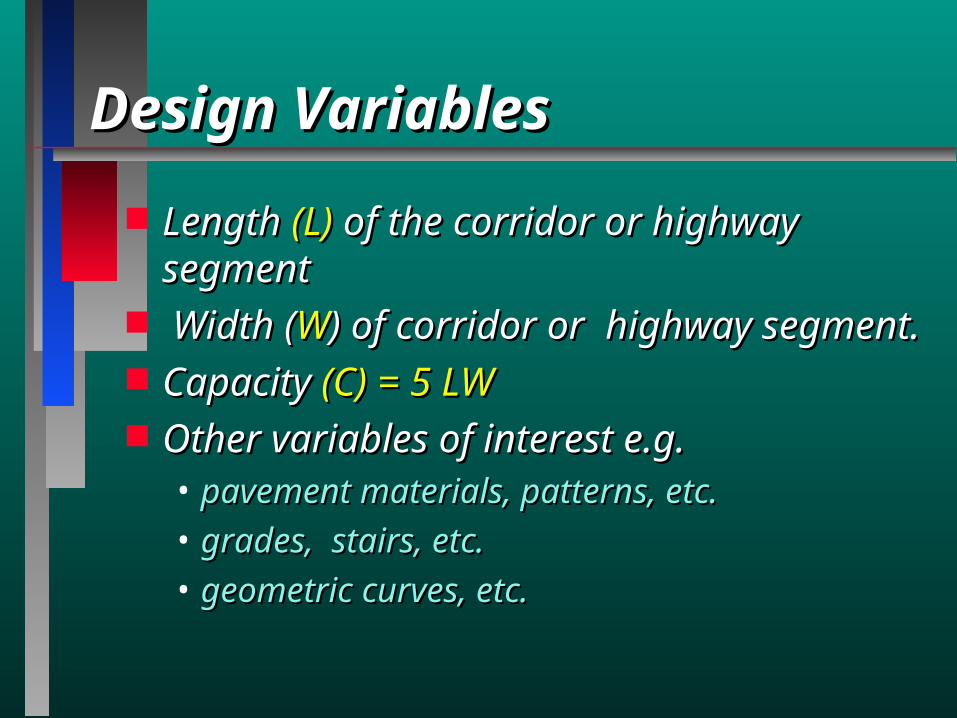
Design VariablesDesign Variables
LengthLength (L) (L) of the corridor or highway of the corridor or highway segmentsegment
Width (Width (WW) of corridor or ) of corridor or highway segment.highway segment. Capacity Capacity (C) = 5 LW(C) = 5 LW Other variables of interest e.g. Other variables of interest e.g.
• pavement materials, patterns, etc.pavement materials, patterns, etc.• grades, stairs, etc.grades, stairs, etc.• geometric curves, etc.geometric curves, etc.
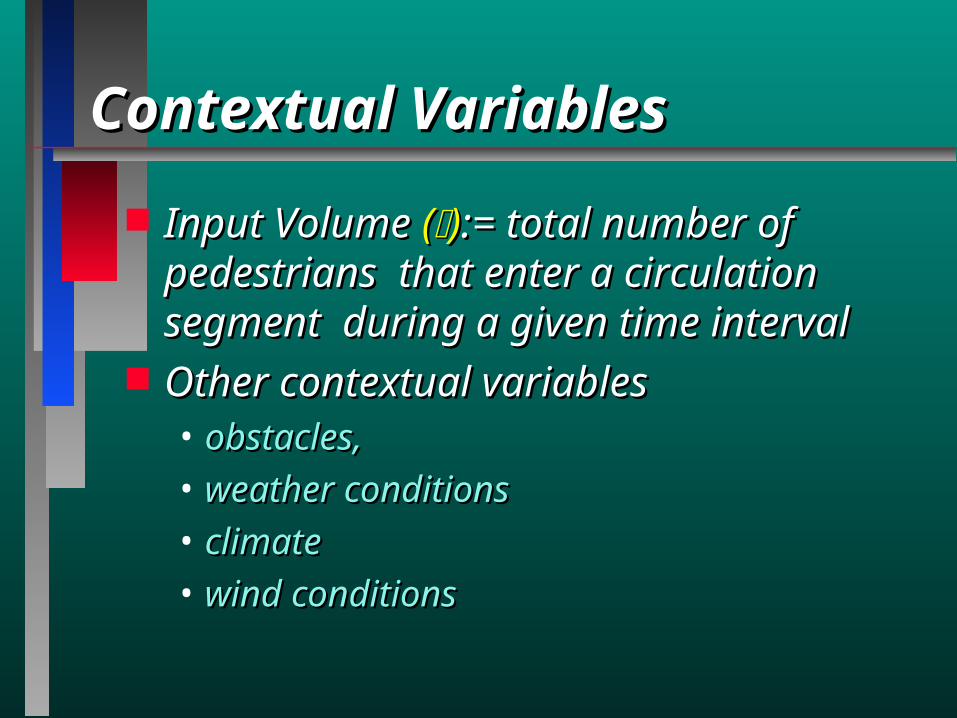
Contextual VariablesContextual Variables
Input Volume Input Volume (()):=:= total number of total number of pedestrians that enter a circulation pedestrians that enter a circulation segment during a given time intervalsegment during a given time interval
Other contextual variablesOther contextual variables• obstacles,obstacles,• weather conditionsweather conditions• climateclimate• wind conditionswind conditions
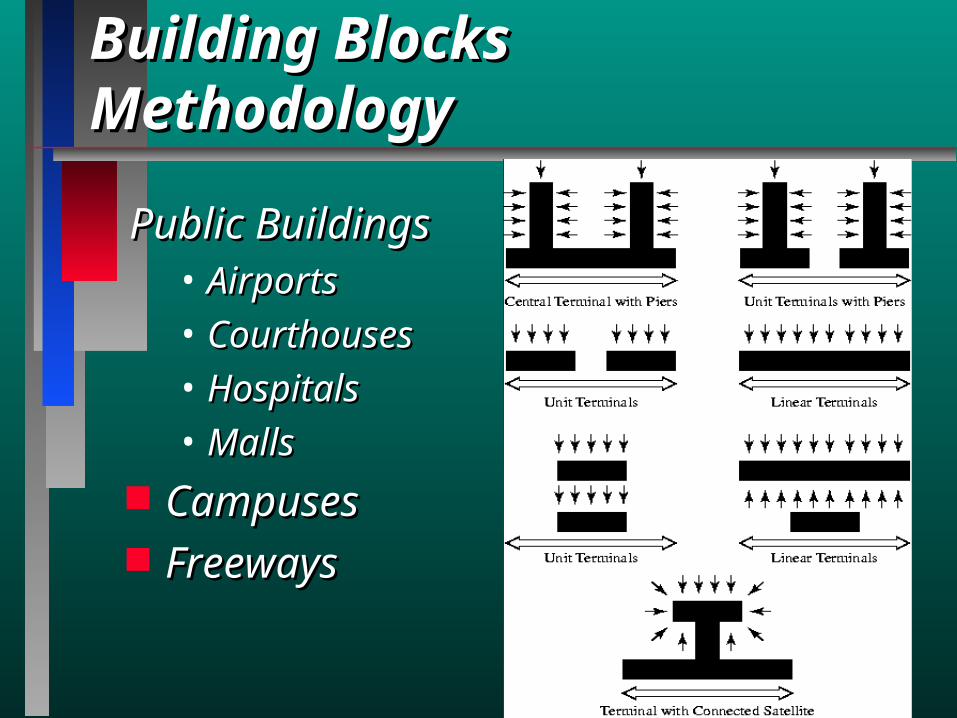
Building Blocks MethodologyBuilding Blocks Methodology
Public BuildingsPublic Buildings• AirportsAirports• CourthousesCourthouses• HospitalsHospitals• MallsMalls
CampusesCampuses FreewaysFreeways
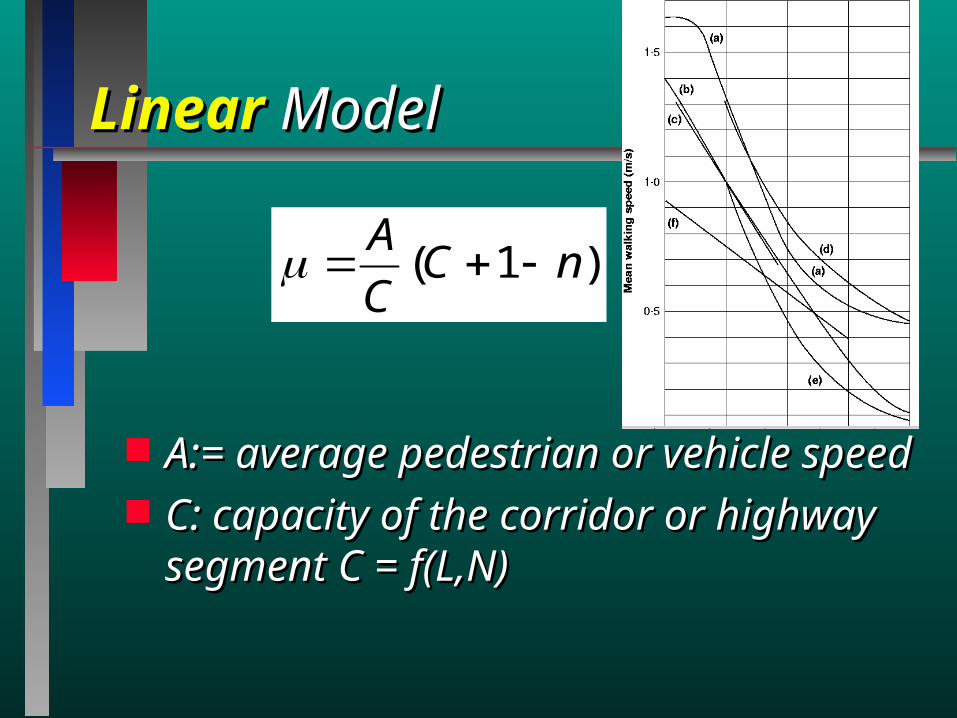
LinearLinear ModelModel
A:= average pedestrian or vehicle A:= average pedestrian or vehicle speedspeed
C: capacity of the corridor or highway C: capacity of the corridor or highway segment C = f(L,N)segment C = f(L,N)
)1( nCC
A
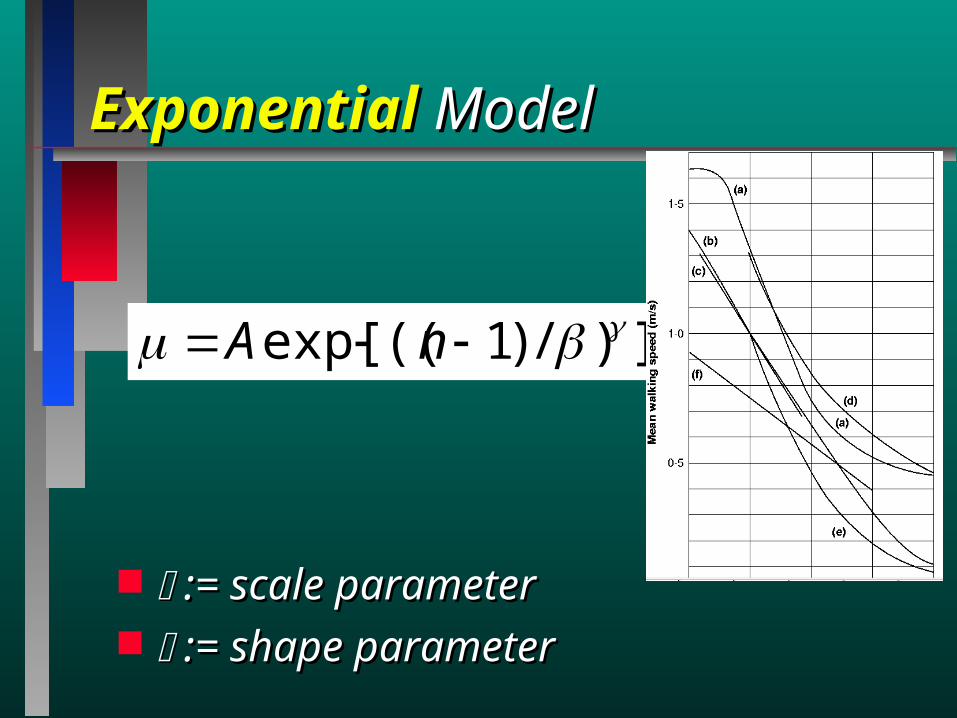
ExponentialExponential ModelModel
:= scale parameter:= scale parameter := shape parameter:= shape parameter
])/)1((exp[ nA
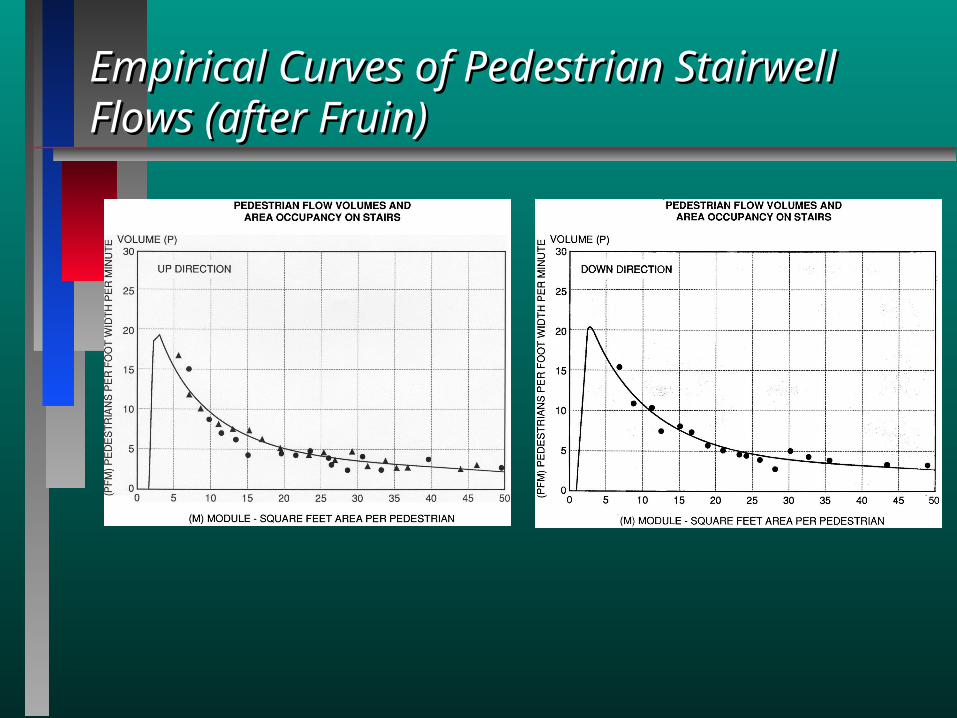
Empirical Curves of Pedestrian Stairwell Empirical Curves of Pedestrian Stairwell Flows (after Fruin)Flows (after Fruin)
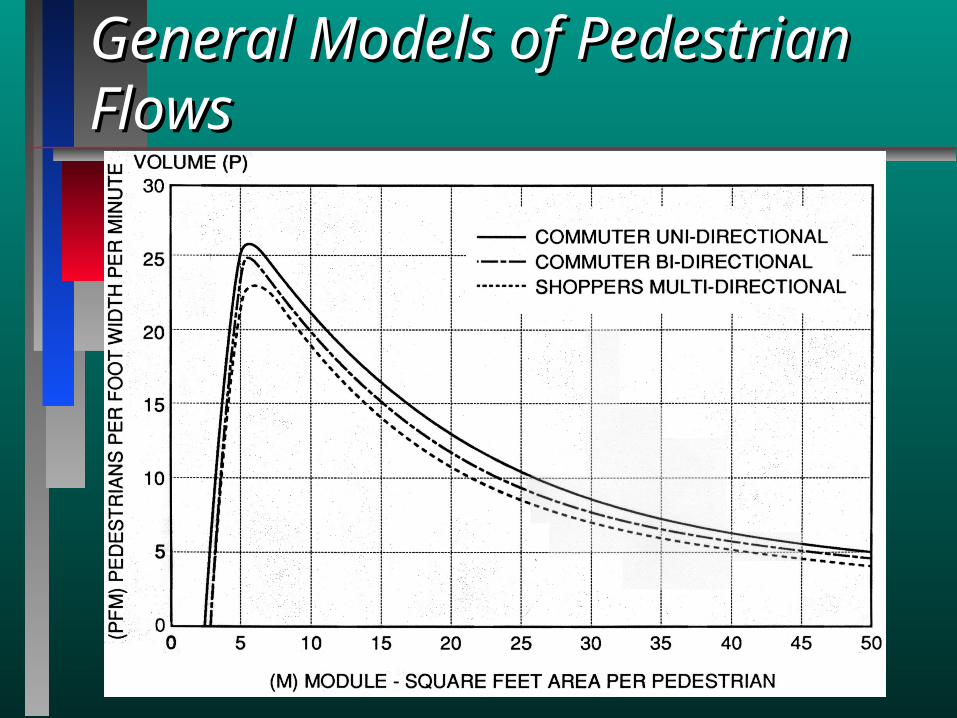
General Models of Pedestrian General Models of Pedestrian FlowsFlows
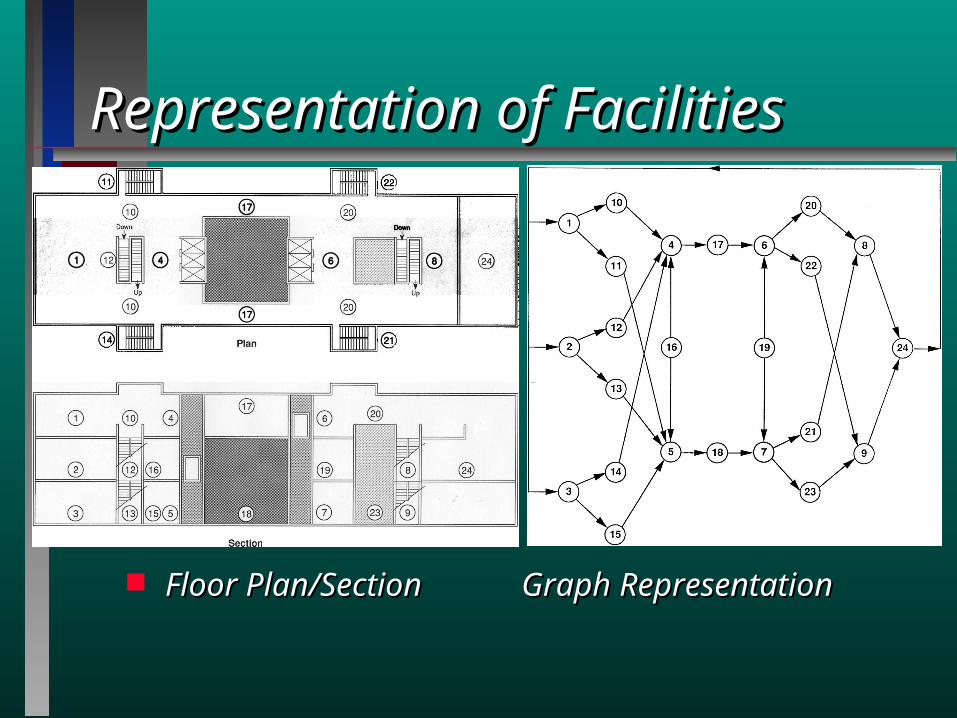
Representation of FacilitiesRepresentation of Facilities
Floor Plan/Section Graph RepresentationFloor Plan/Section Graph Representation
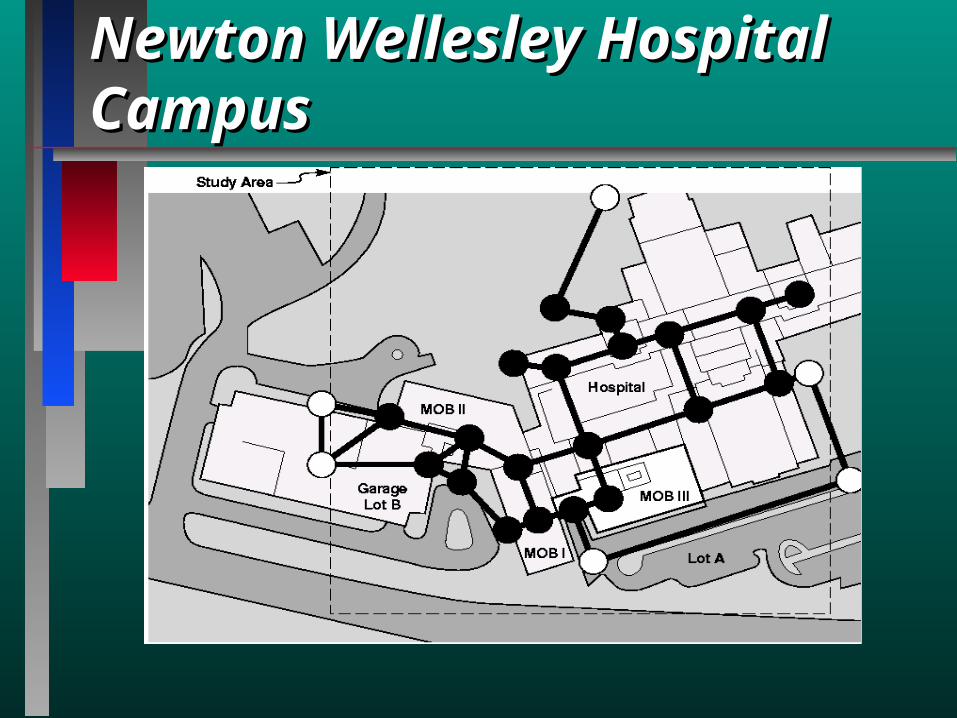
Newton Wellesley Hospital Newton Wellesley Hospital CampusCampus
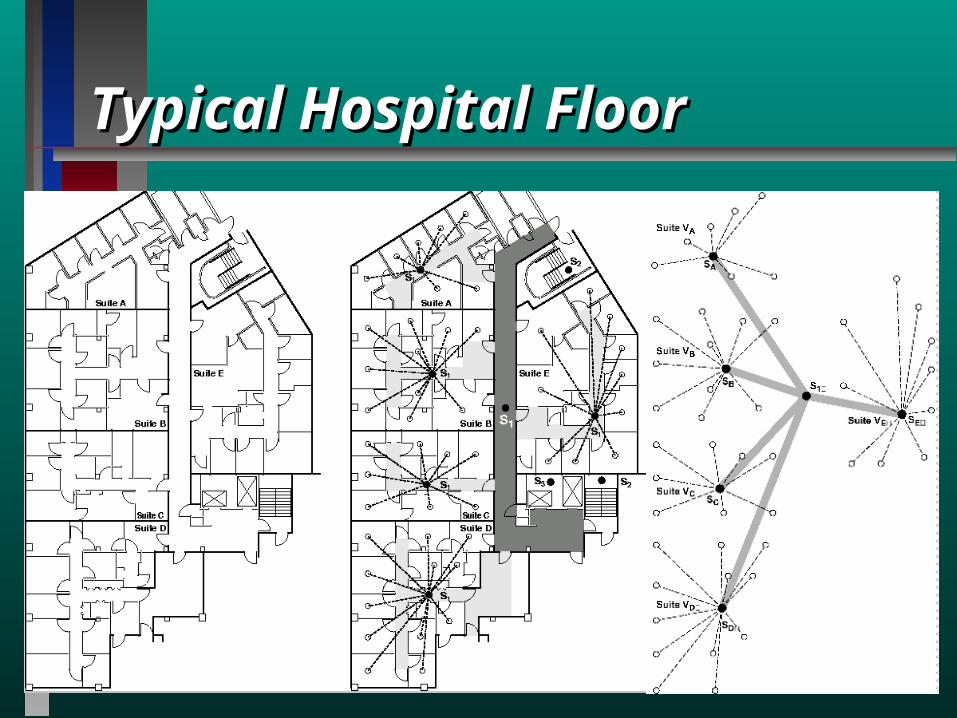
Typical Hospital FloorTypical Hospital Floor
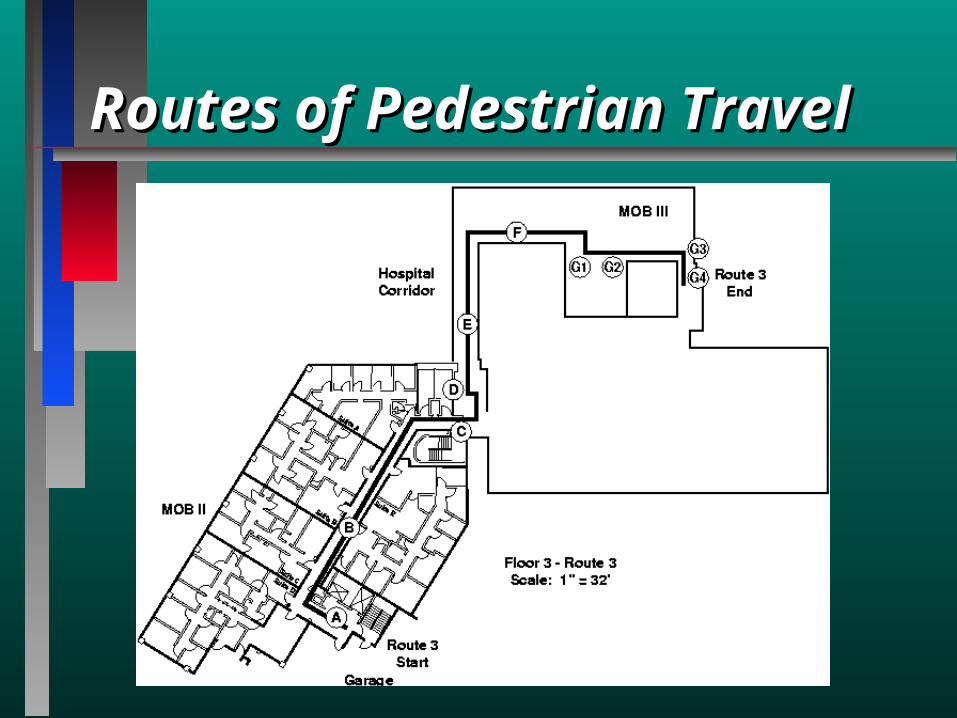
Routes of Pedestrian TravelRoutes of Pedestrian Travel
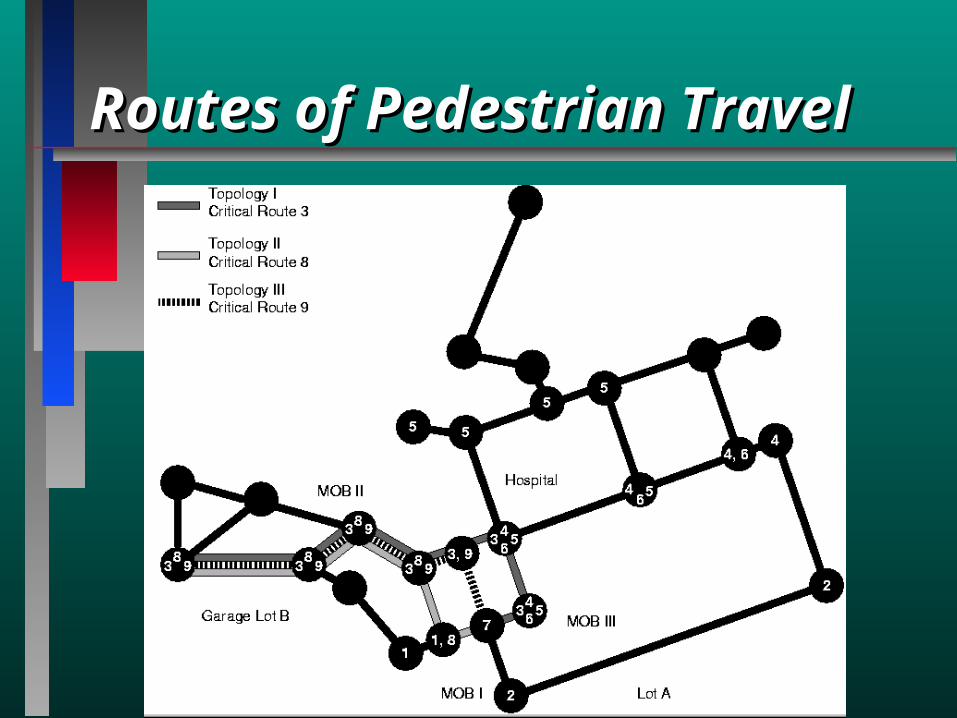
Routes of Pedestrian TravelRoutes of Pedestrian Travel
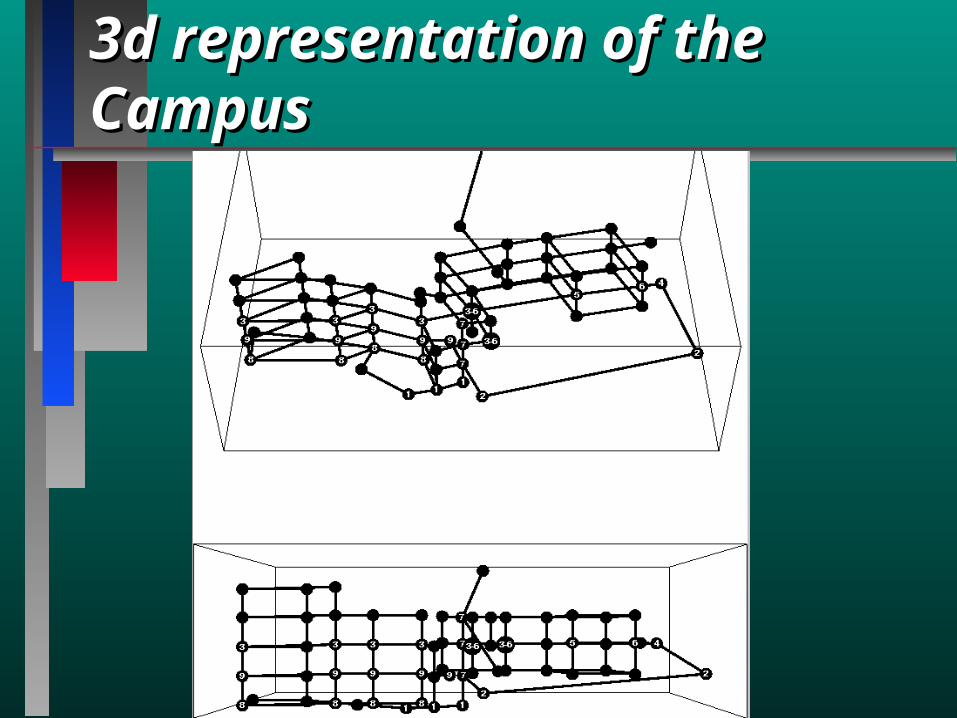
3d representation of the Campus3d representation of the Campus
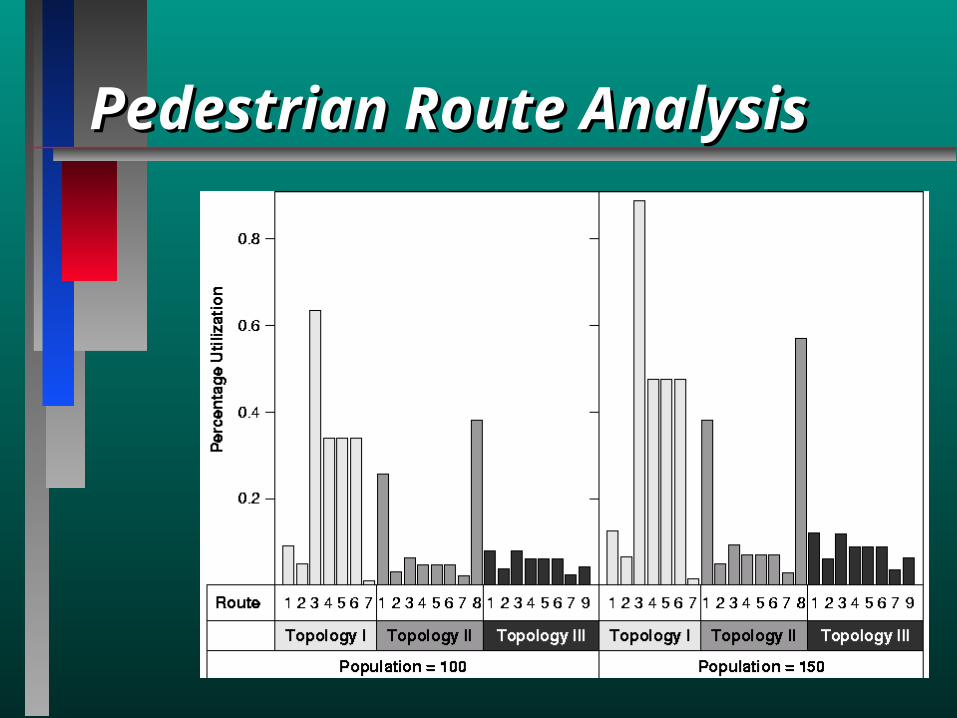
Pedestrian Route AnalysisPedestrian Route Analysis
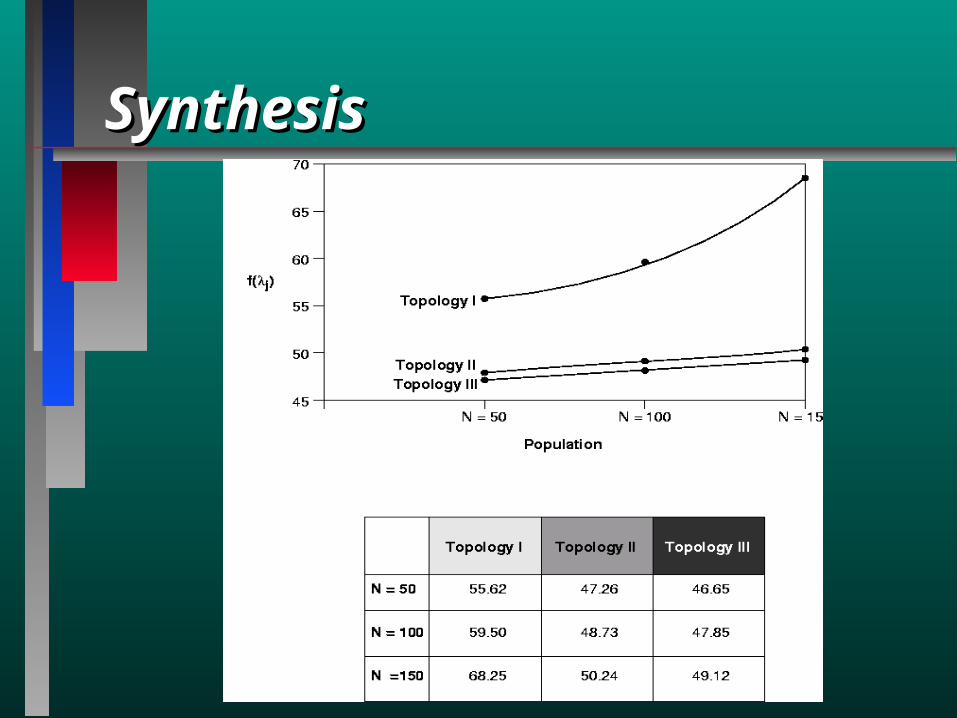
SynthesisSynthesis
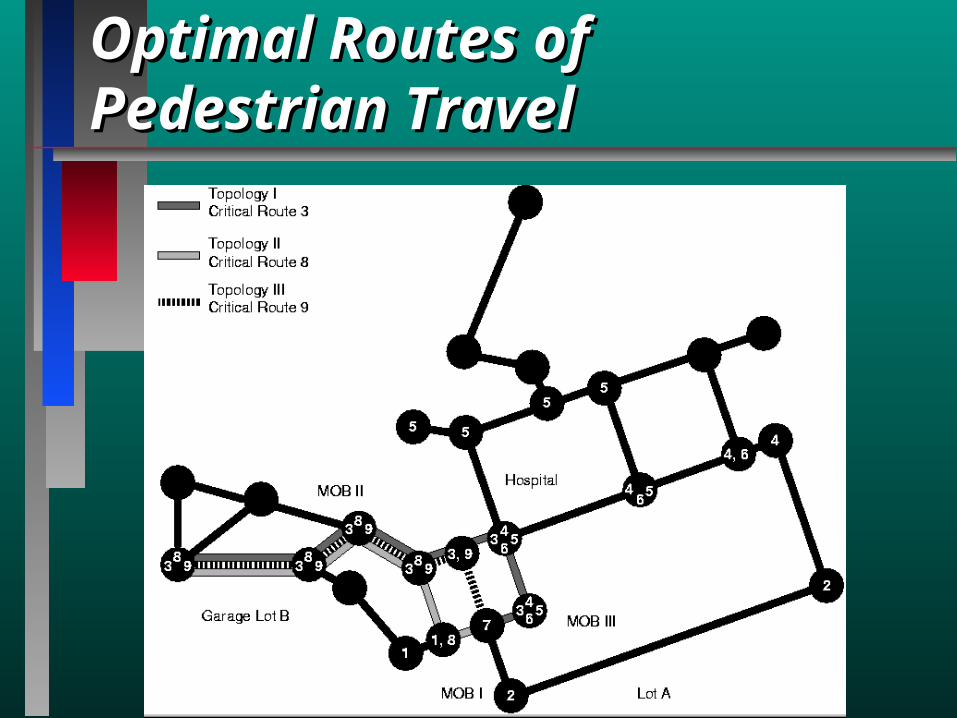
Optimal Routes of Pedestrian Optimal Routes of Pedestrian TravelTravel
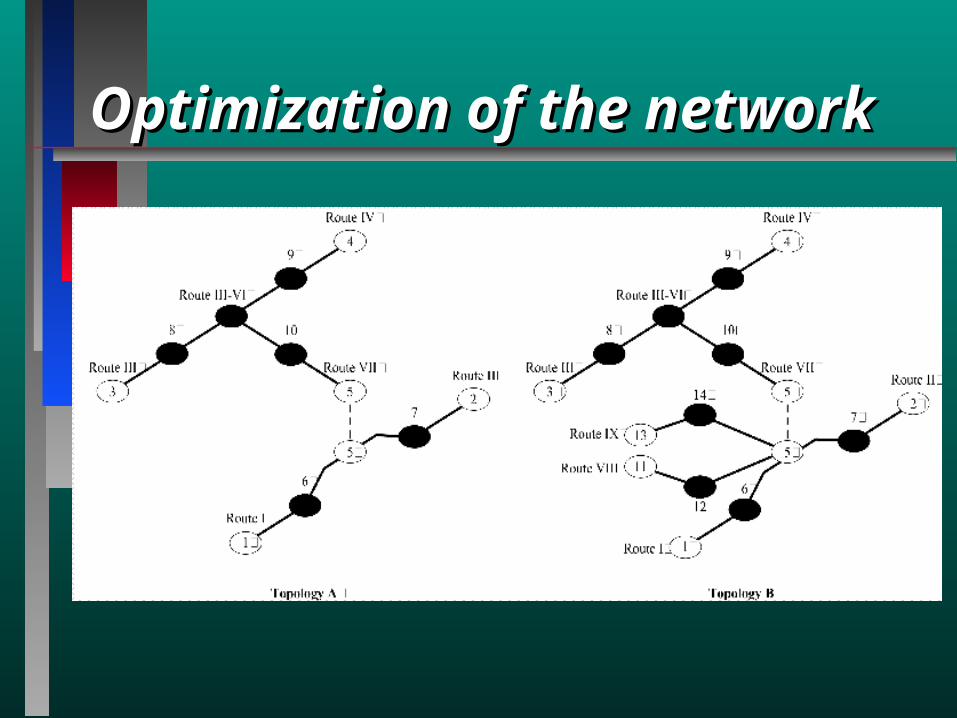
Optimization of the networkOptimization of the network
Engineered Polymers Inc.Engineered Polymers Inc.
Warehouse capacity analysisWarehouse capacity analysis Dynamic material handling designDynamic material handling design
• Layout Layout and equipment needsand equipment needs• ForecastForecast space utilization over time space utilization over time• BottleneckBottleneck analysis analysis
Over to Simulation model animations …Over to Simulation model animations …
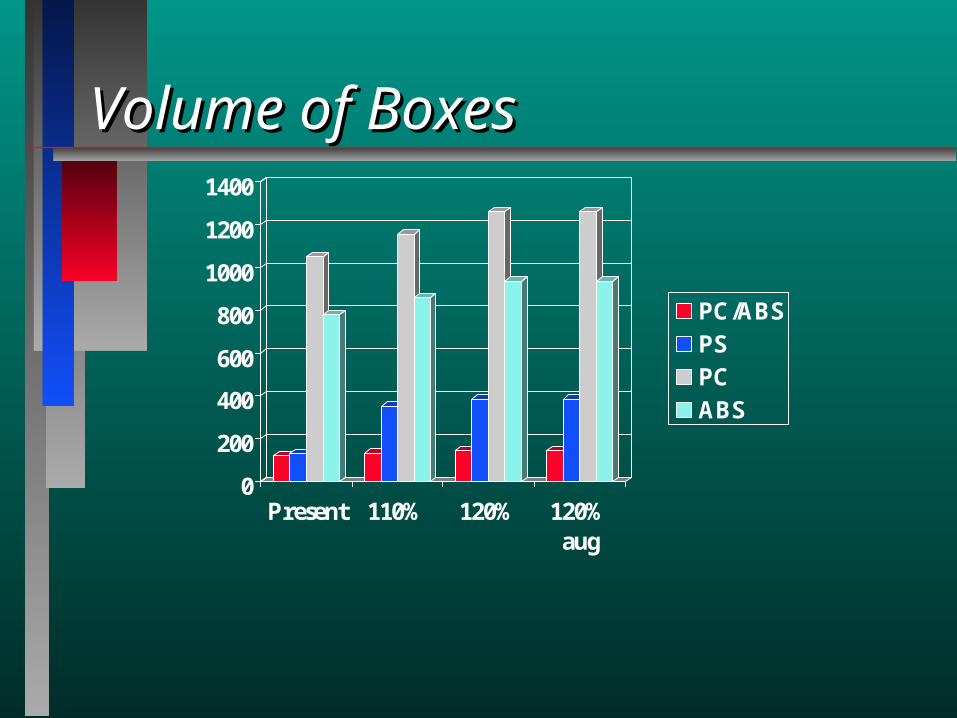
Volume of BoxesVolume of Boxes
0
200
400
600
800
1000
1200
1400
Present 110% 120% 120%aug
PC/ABSPSPCABS
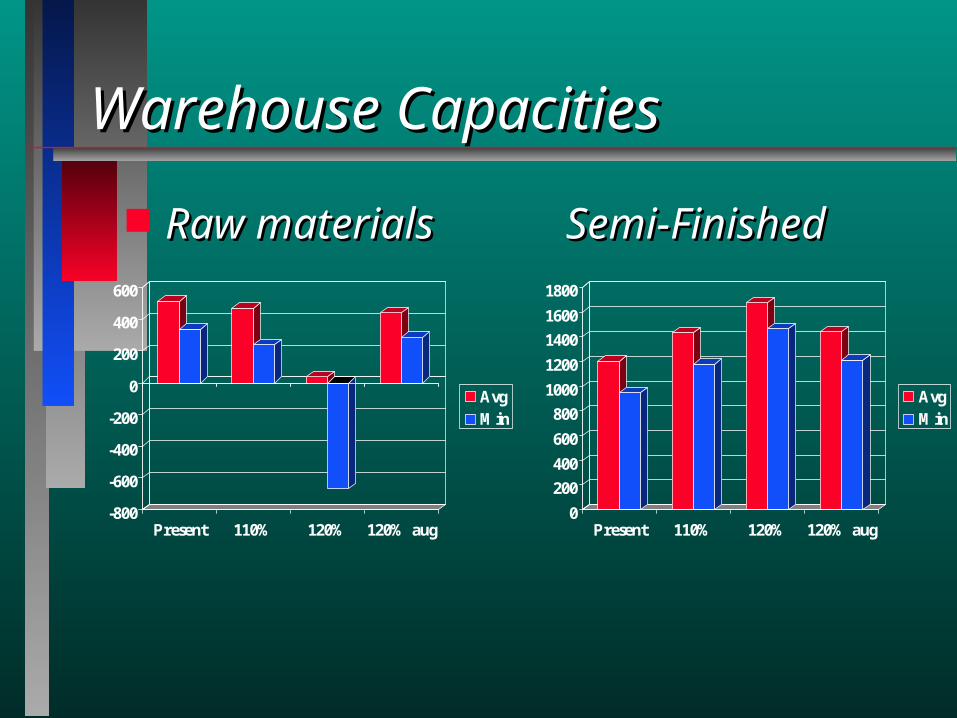
Warehouse CapacitiesWarehouse Capacities
Raw materials Semi-FinishedRaw materials Semi-Finished
-800
-600
-400
-200
0
200
400
600
Present 110% 120% 120% aug
AvgMin
0
200
400
600
800
1000
1200
1400
1600
1800
Present 110% 120% 120% aug
AvgMin
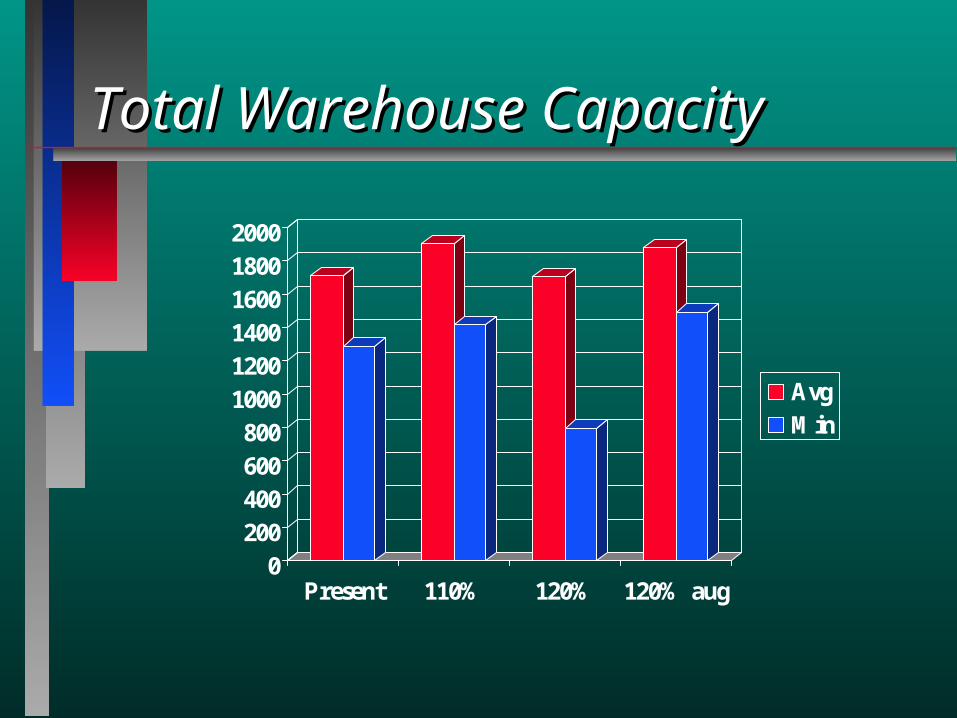
Total Warehouse CapacityTotal Warehouse Capacity
0200400600800
100012001400160018002000
Present 110% 120% 120% aug
AvgMin
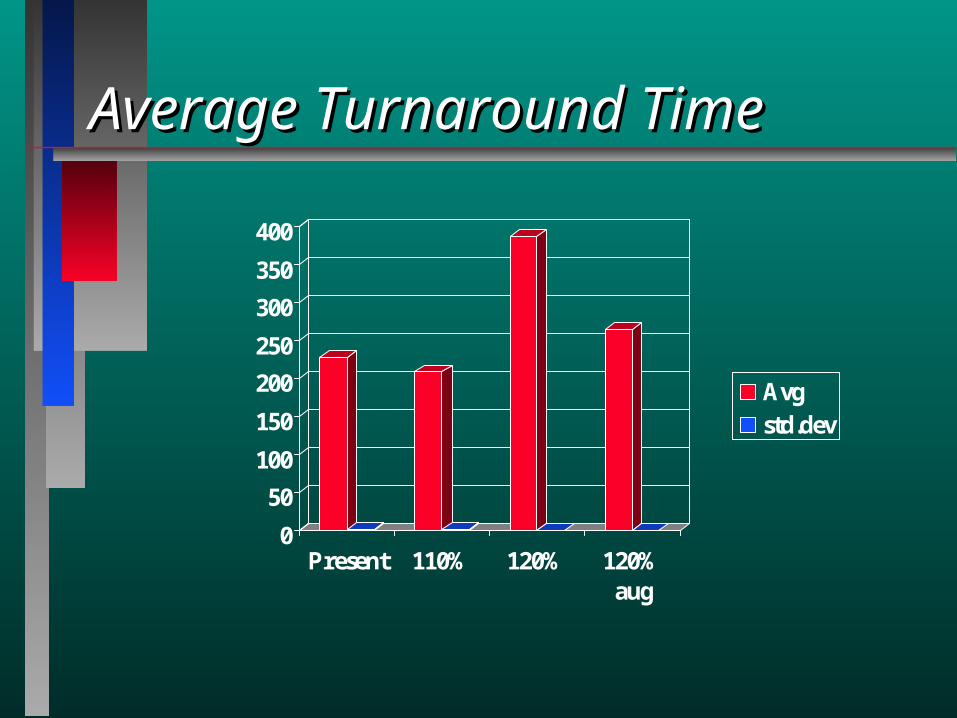
Average Turnaround TimeAverage Turnaround Time
0
50
100
150
200
250
300
350
400
Present 110% 120% 120%aug
Avgstd.dev
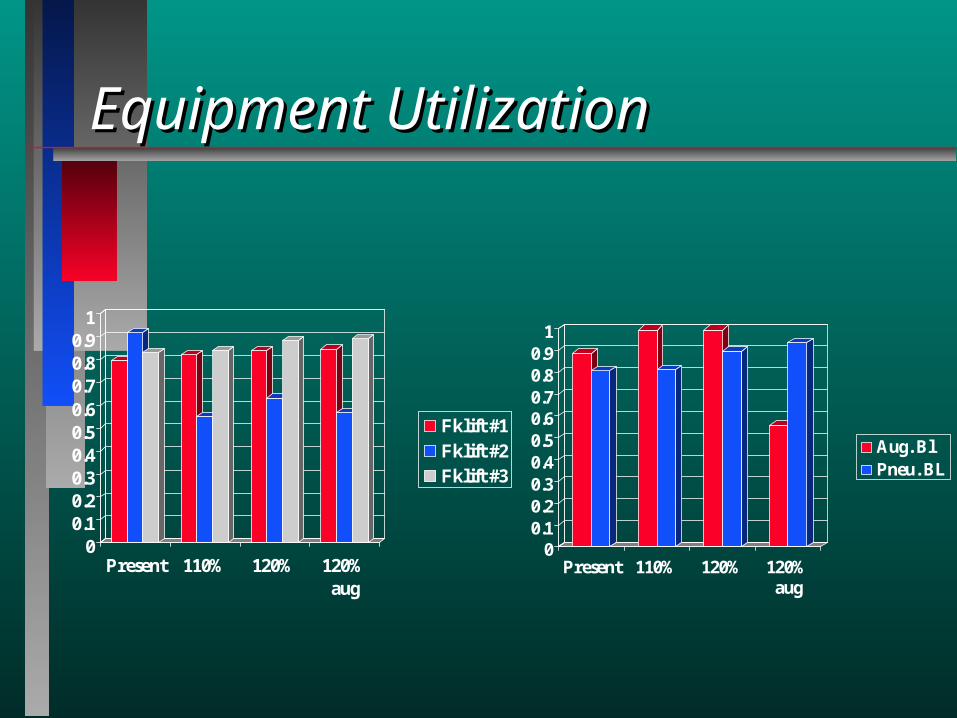
Equipment UtilizationEquipment Utilization
00.10.20.30.40.50.60.70.80.9
1
Present 110% 120% 120%aug
Fklift #1Fklift #2Fklift #3
00.10.20.30.40.50.60.70.80.9
1
Present 110% 120% 120%aug
Aug. BlPneu. BL
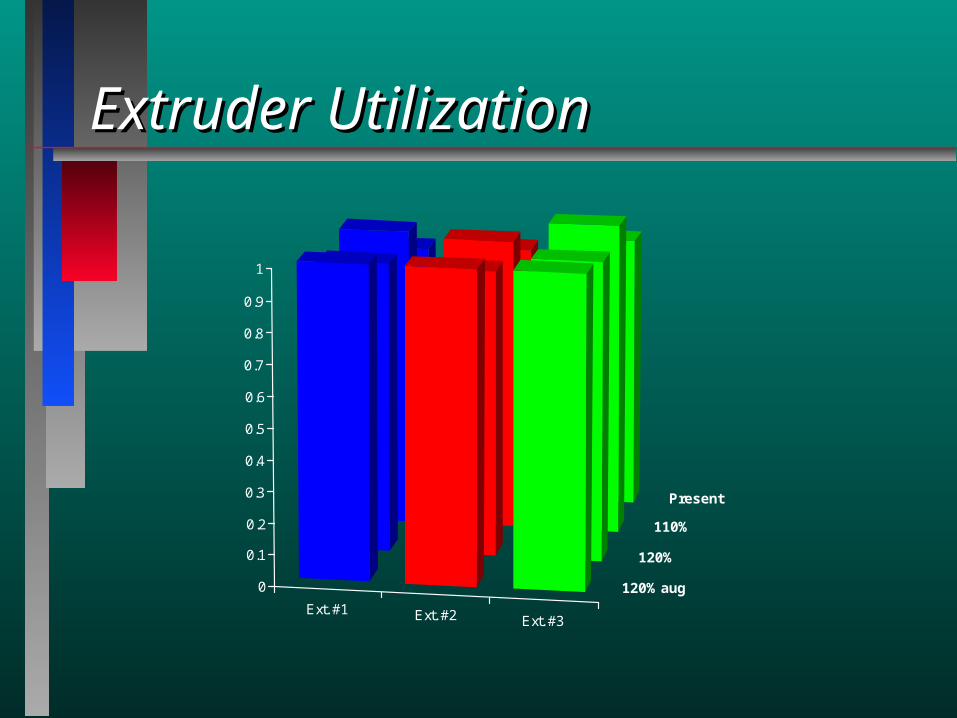
Extruder UtilizationExtruder Utilization
Present
110%
120%
120% aug
Ext. #1 Ext. #2 Ext. #3
0
0.1
0.2
0.3
0.4
0.5
0.6
0.7
0.8
0.9
1
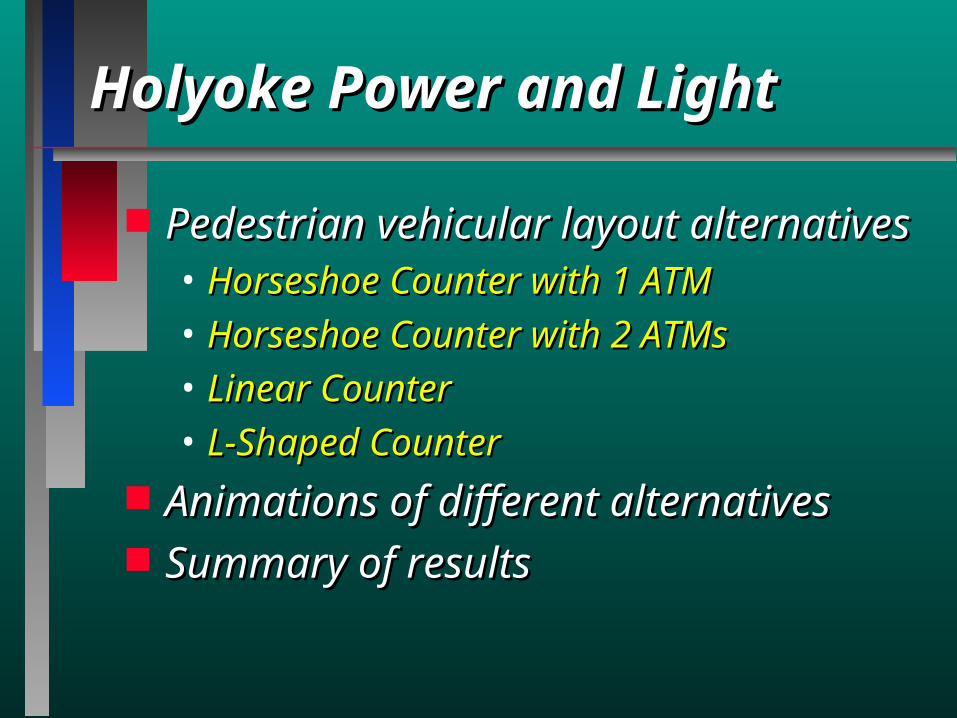
Holyoke Power and LightHolyoke Power and Light
Pedestrian vehicular layout alternativesPedestrian vehicular layout alternatives• Horseshoe Counter with 1 ATM Horseshoe Counter with 1 ATM • Horseshoe Counter with 2 ATMsHorseshoe Counter with 2 ATMs• Linear CounterLinear Counter• L-Shaped CounterL-Shaped Counter
Animations of different alternativesAnimations of different alternatives Summary of resultsSummary of results
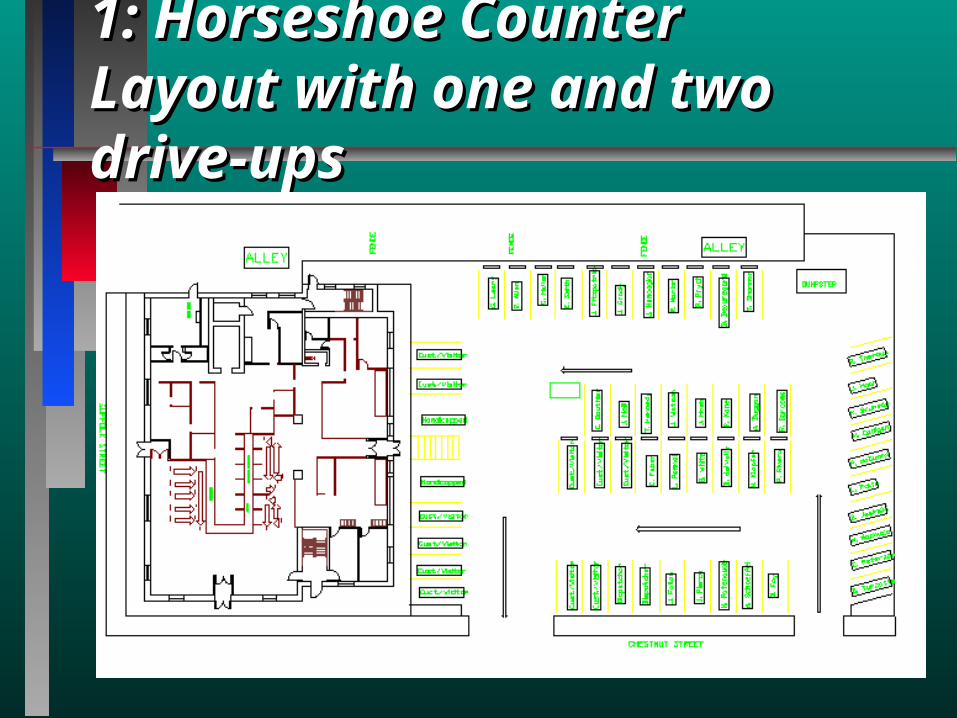
1: Horseshoe Counter Layout 1: Horseshoe Counter Layout with one and two drive-upswith one and two drive-ups
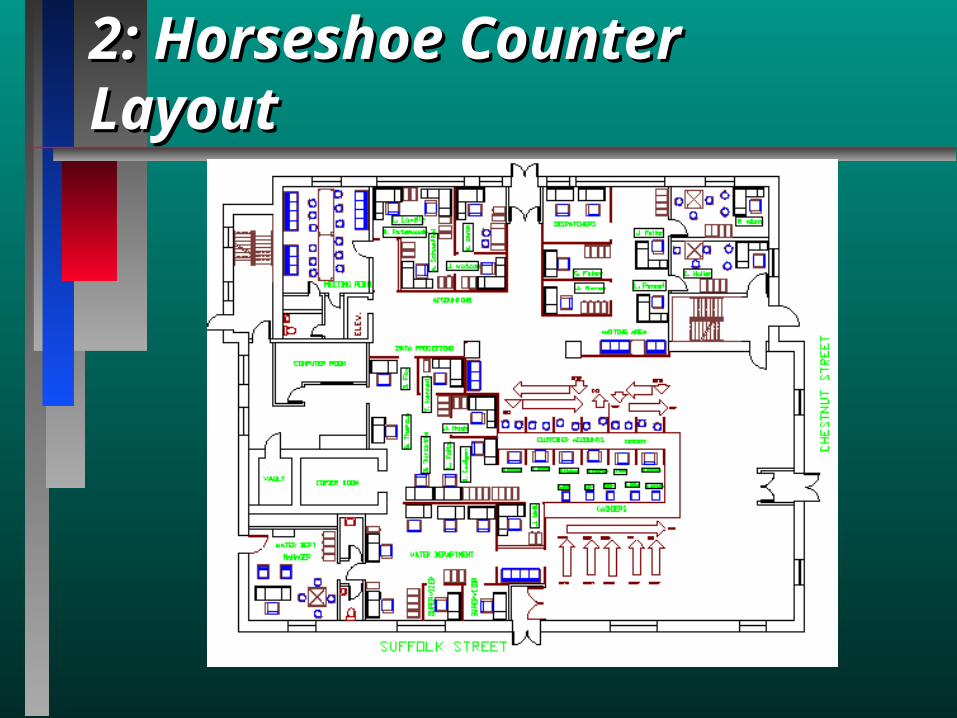
2:2: Horseshoe Counter LayoutHorseshoe Counter Layout
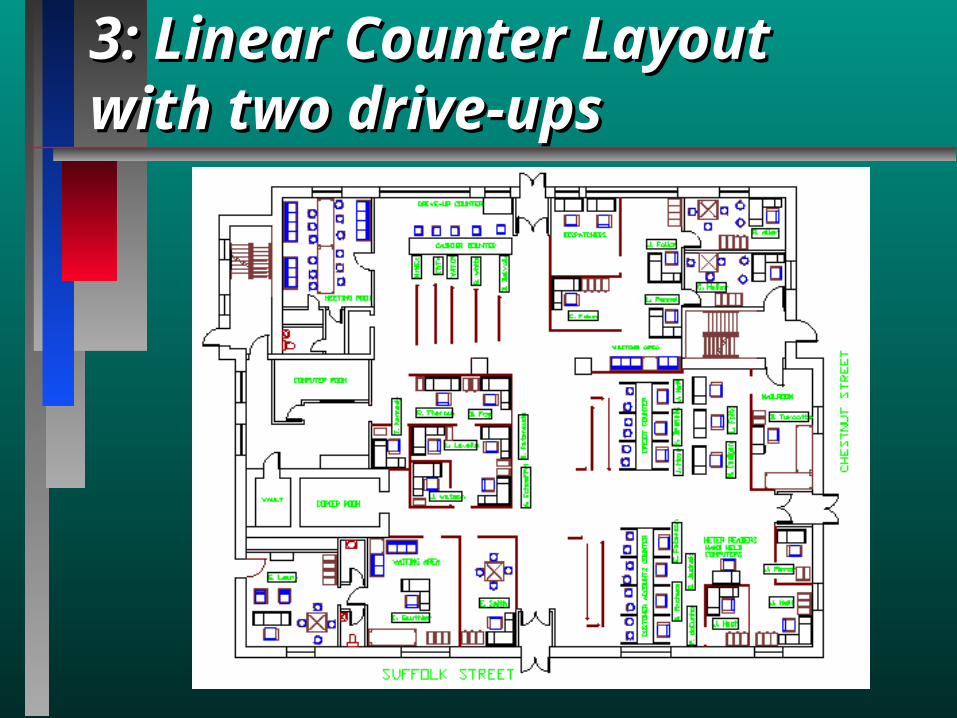
3:3: Linear Counter Layout with Linear Counter Layout with two drive-upstwo drive-ups
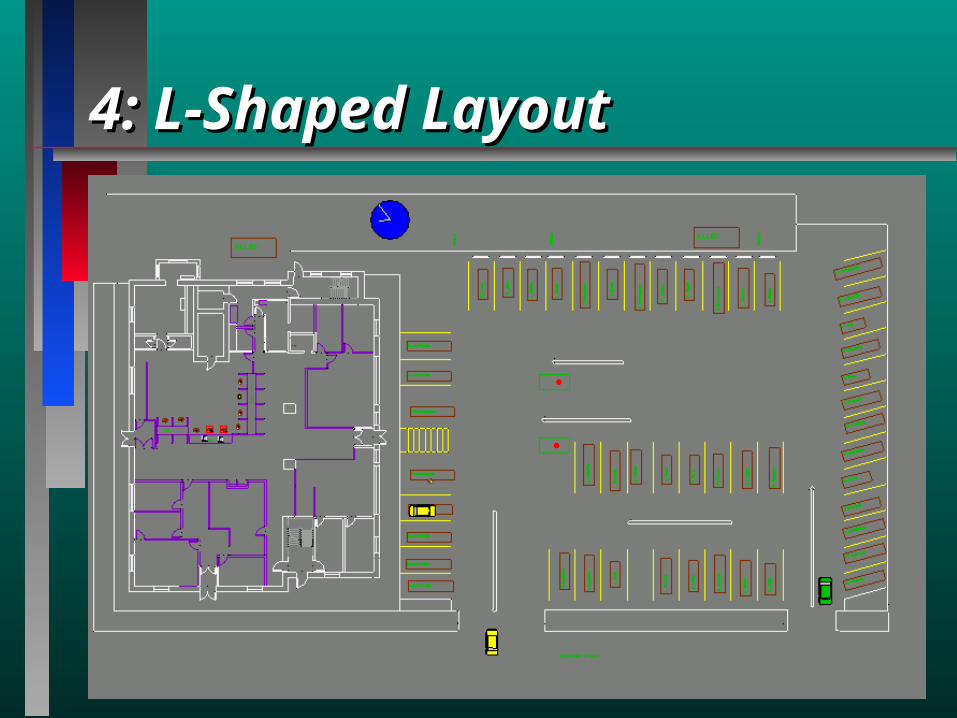
4: L-Shaped Layout4: L-Shaped Layout
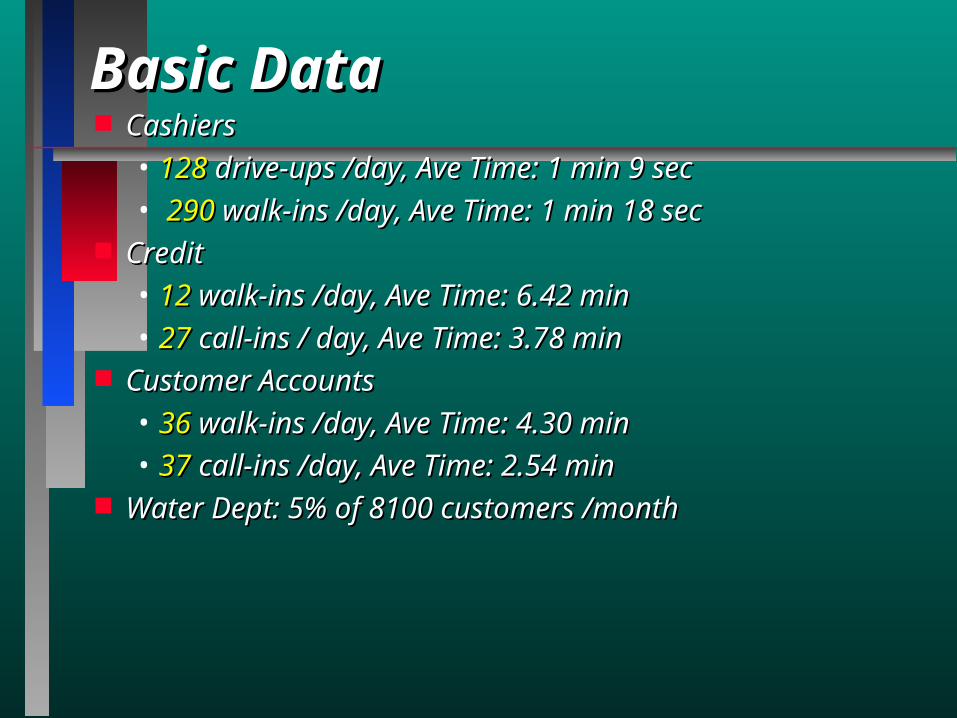
Basic DataBasic Data CashiersCashiers
• 128128 drive-ups /day, Ave Time: 1 min 9 sec drive-ups /day, Ave Time: 1 min 9 sec• 290290 walk-ins /day, Ave Time: 1 min 18 sec walk-ins /day, Ave Time: 1 min 18 sec
CreditCredit• 1212 walk-ins /day, Ave Time: 6.42 min walk-ins /day, Ave Time: 6.42 min• 27 27 call-ins / day, Ave Time: 3.78 mincall-ins / day, Ave Time: 3.78 min
Customer AccountsCustomer Accounts• 36 36 walk-ins /day, Ave Time: 4.30 minwalk-ins /day, Ave Time: 4.30 min• 3737 call-ins /day, Ave Time: 2.54 min call-ins /day, Ave Time: 2.54 min
Water Dept: 5% of 8100 customers /monthWater Dept: 5% of 8100 customers /month
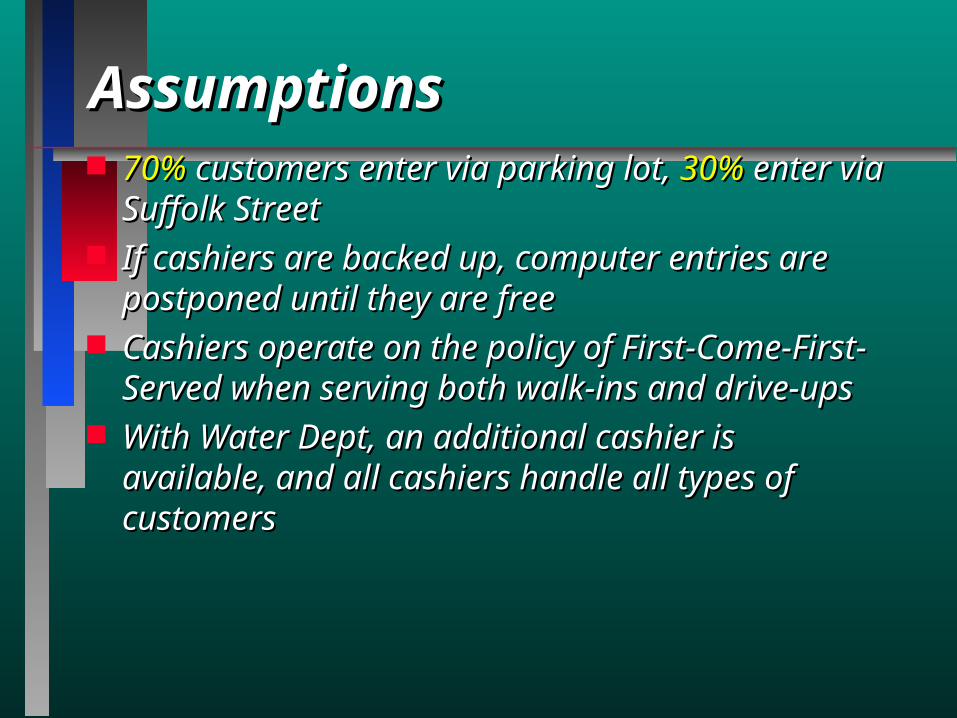
AssumptionsAssumptions 70%70% customers enter via parking lot, customers enter via parking lot, 30%30% enter enter
via Suffolk Streetvia Suffolk Street If cashiers are backed up, computer entries are If cashiers are backed up, computer entries are
postponed until they are freepostponed until they are free Cashiers operate on the policy of First-Come-Cashiers operate on the policy of First-Come-
First-Served when serving both walk-ins and First-Served when serving both walk-ins and drive-upsdrive-ups
With Water Dept, an additional cashier is With Water Dept, an additional cashier is available, and all cashiers handle all types of available, and all cashiers handle all types of customerscustomers
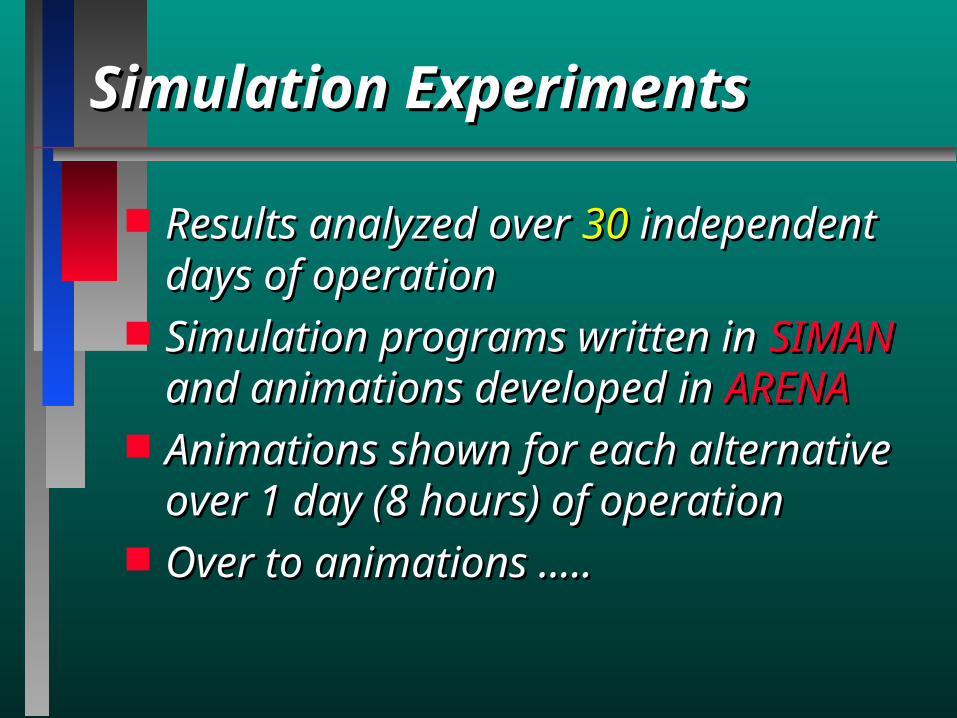
Simulation ExperimentsSimulation Experiments
Results analyzed over Results analyzed over 3030 independent independent days of operationdays of operation
Simulation programs written in Simulation programs written in SIMANSIMAN and animations developed in and animations developed in ARENAARENA
Animations shown for each alternative Animations shown for each alternative over 1 day (8 hours) of operationover 1 day (8 hours) of operation
Over to animations .....Over to animations .....
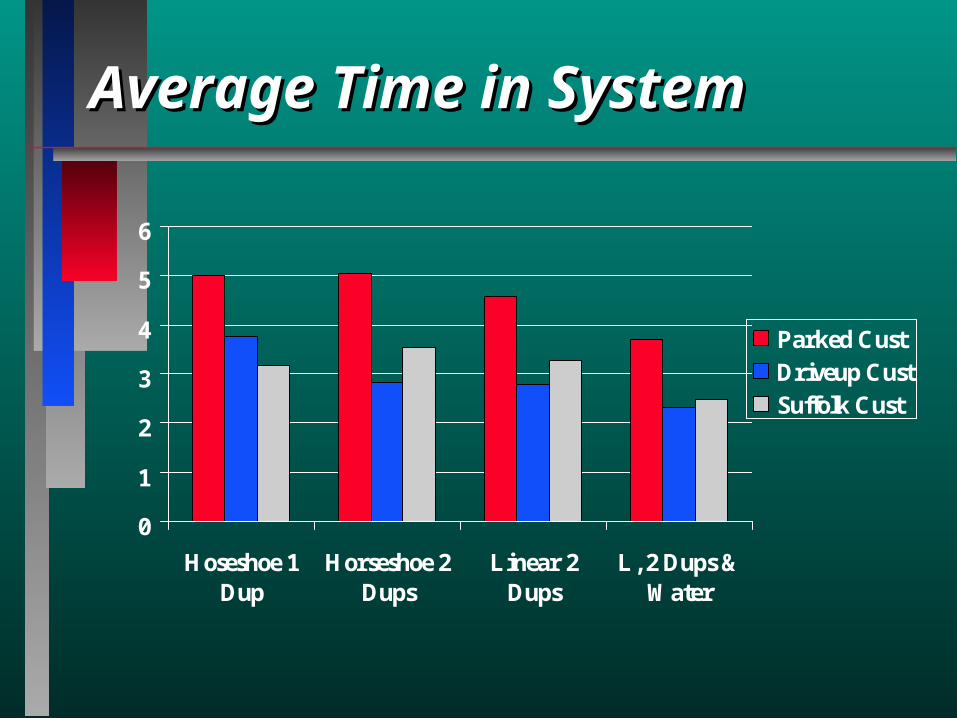
Average Time in SystemAverage Time in System
0
1
2
3
4
5
6
Hoseshoe 1Dup
Horseshoe 2Dups
Linear 2Dups
L, 2 Dups &Water
Parked CustDriveup CustSuffolk Cust

Maximum Times in SystemMaximum Times in System
0
2
4
6
8
10
12
14
Horseshoe 1Dup
Horseshoe 2Dups
Linear 2Dups
L, 2 Dups &Water
Parked CustDriveup CustSuffolk Cust
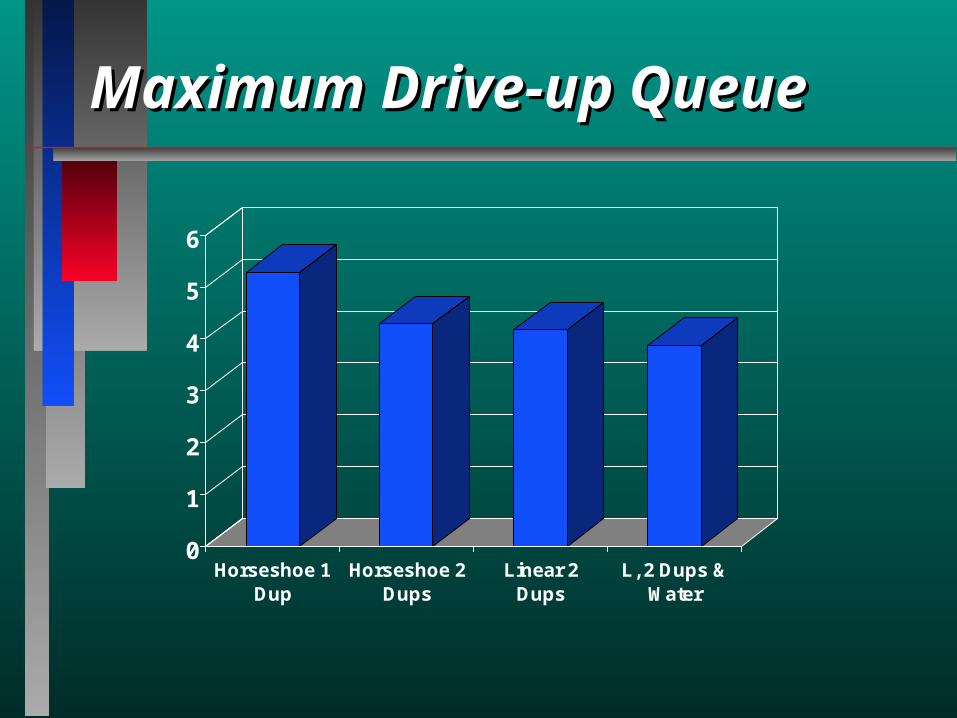
Maximum Drive-up QueueMaximum Drive-up Queue
0
1
2
3
4
5
6
Horseshoe 1Dup
Horseshoe 2Dups
Linear 2Dups
L, 2 Dups &Water
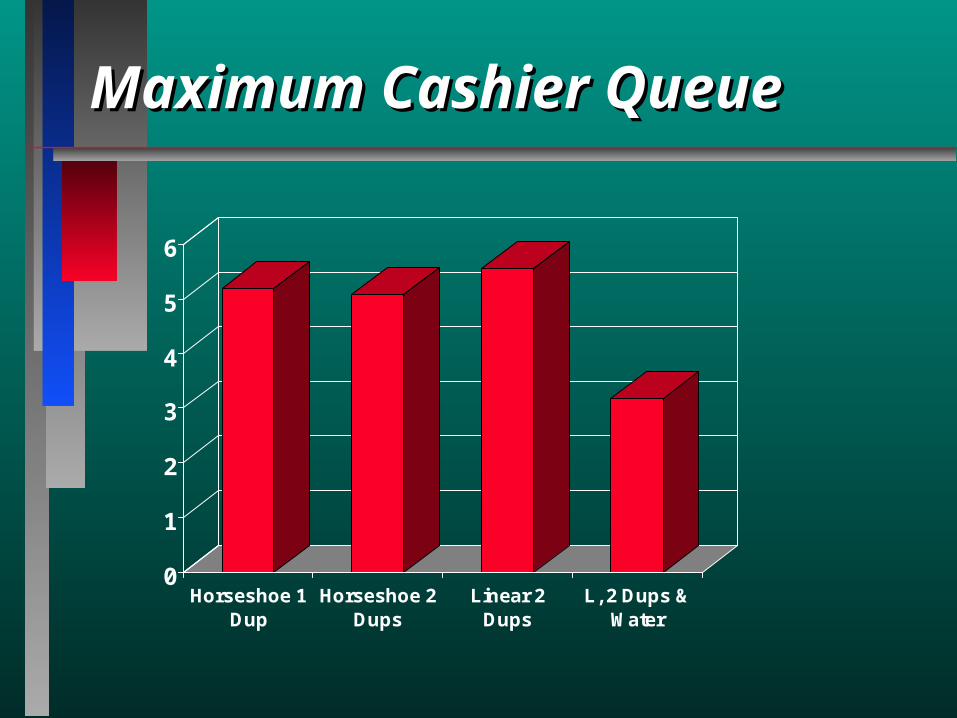
Maximum Cashier QueueMaximum Cashier Queue
0
1
2
3
4
5
6
Horseshoe 1Dup
Horseshoe 2Dups
Linear 2Dups
L, 2 Dups &Water
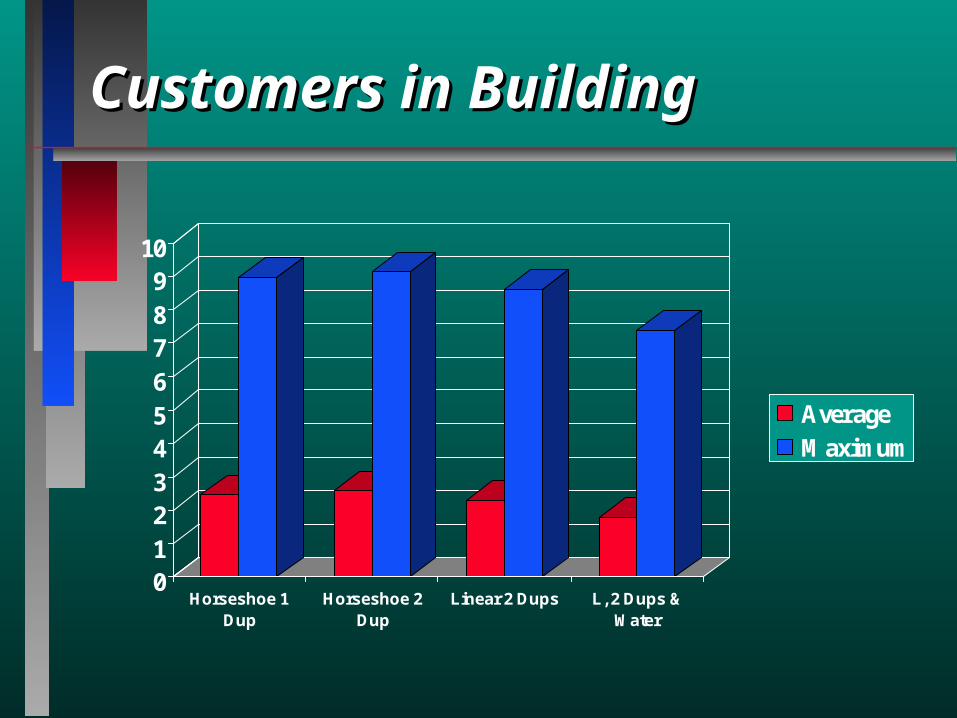
Customers in BuildingCustomers in Building
0123456789
10
Horseshoe 1Dup
Horseshoe 2Dup
Linear 2 Dups L, 2 Dups &Water
AverageMaximum
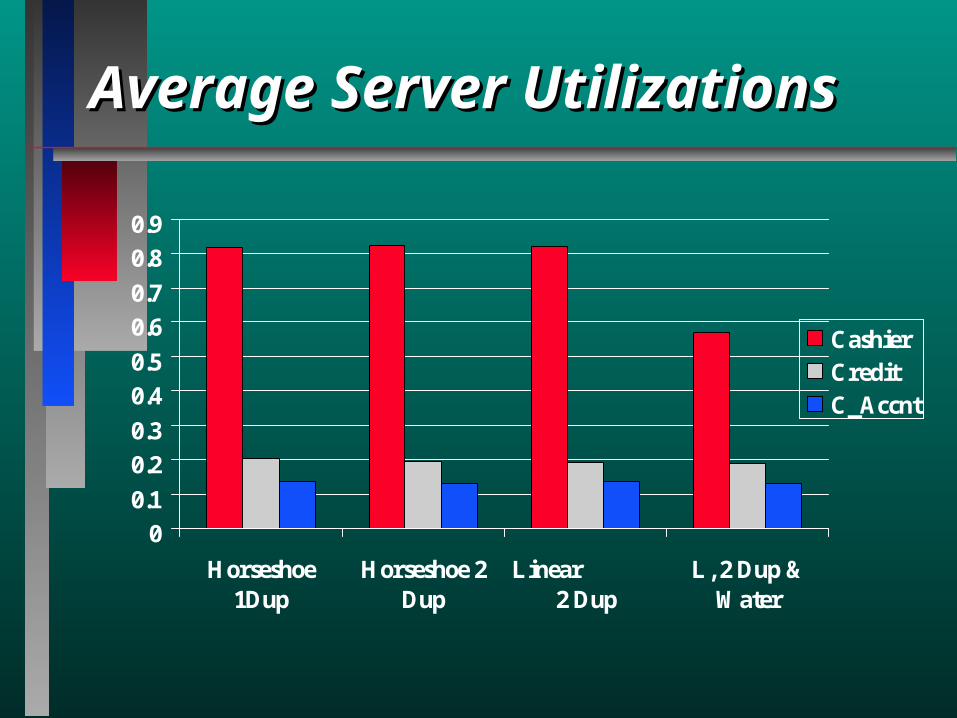
Average Server UtilizationsAverage Server Utilizations
0
0.1
0.2
0.3
0.4
0.5
0.6
0.7
0.8
0.9
Horseshoe1Dup
Horseshoe 2Dup
Linear 2 Dup
L, 2 Dup &Water
CashierCreditC_Accnt
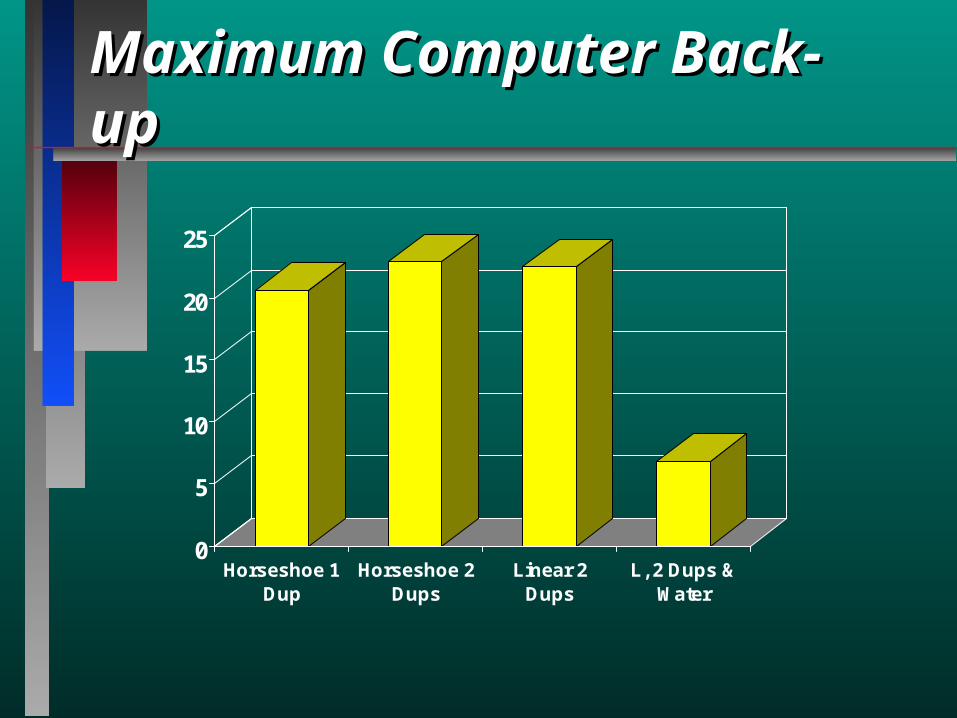
Maximum Computer Back-upMaximum Computer Back-up
0
5
10
15
20
25
Horseshoe 1Dup
Horseshoe 2Dups
Linear 2Dups
L, 2 Dups &Water
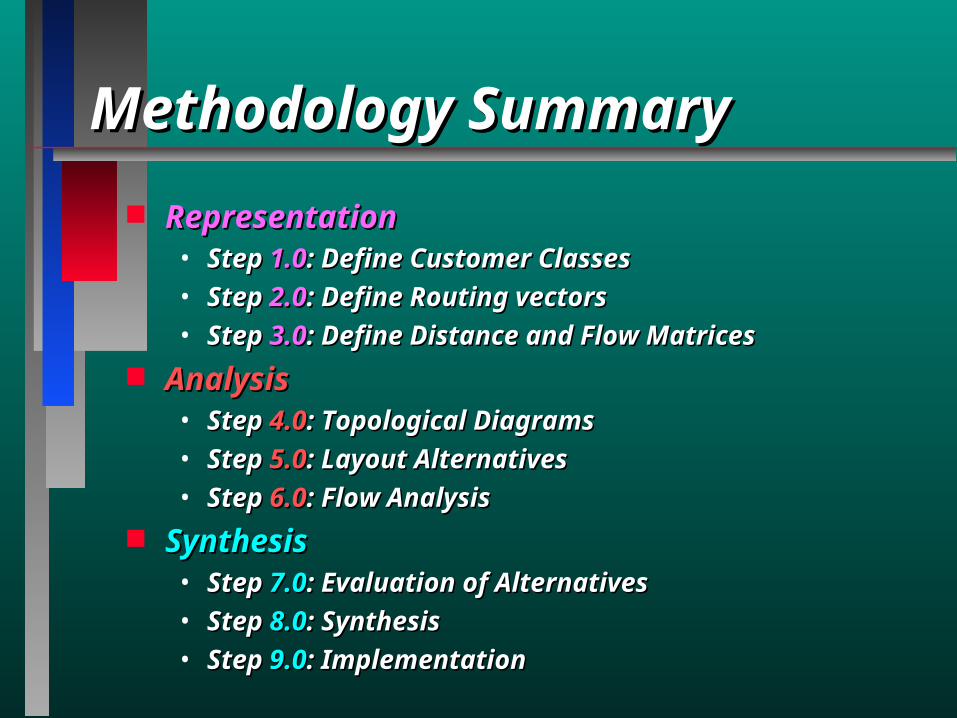
Methodology SummaryMethodology Summary
RepresentationRepresentation• Step Step 1.01.0: Define Customer Classes: Define Customer Classes• Step Step 2.02.0: Define Routing vectors: Define Routing vectors• Step Step 3.03.0: Define Distance and Flow Matrices : Define Distance and Flow Matrices
AnalysisAnalysis• Step Step 4.04.0: Topological Diagrams: Topological Diagrams• Step Step 5.05.0: Layout Alternatives: Layout Alternatives• Step Step 6.06.0: Flow Analysis: Flow Analysis
SynthesisSynthesis• Step Step 7.07.0: Evaluation of Alternatives: Evaluation of Alternatives• Step Step 8.08.0: Synthesis: Synthesis• Step Step 9.09.0: Implementation: Implementation
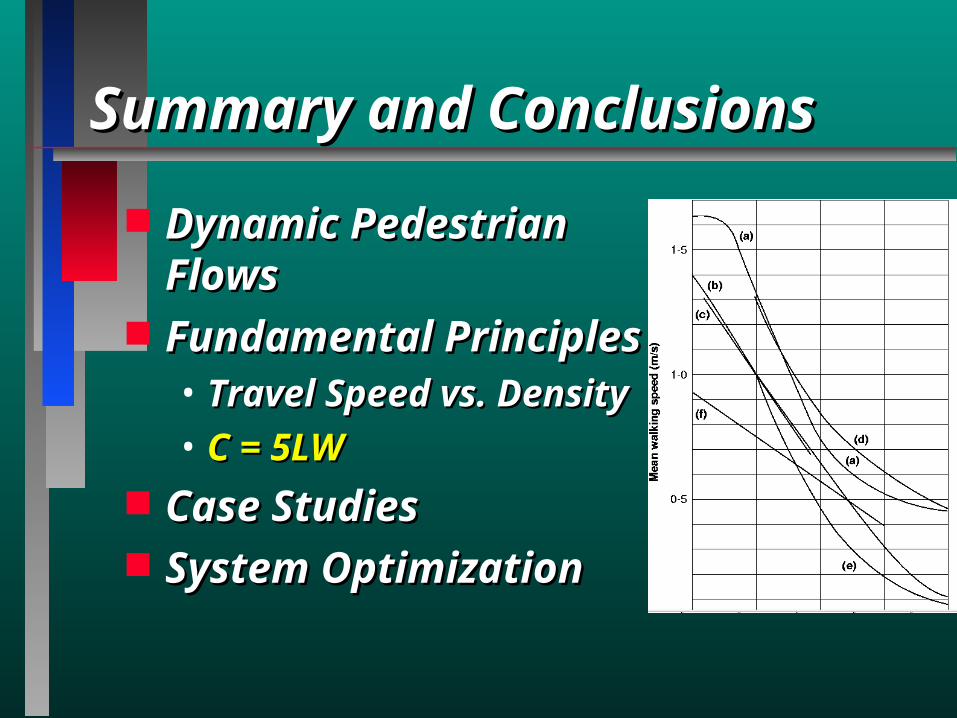
Summary and ConclusionsSummary and Conclusions
Dynamic Pedestrian Dynamic Pedestrian FlowsFlows
Fundamental PrinciplesFundamental Principles• Travel Speed vs. DensityTravel Speed vs. Density• C = 5LWC = 5LW
Case StudiesCase Studies System OptimizationSystem Optimization


![Crim Law Outline Blakey [1] - nd.edundlaw/pad/outlines2/PAD CrimLawOutline... · Page | 1 Crim Law Outline – Fall 2007; Blakey COMMON LAW FELONIES (Mrs. RM Lamb) -MURDER-Unlawful](https://img.dokumen.tips/doc/110x75/5b19a1bb7f8b9a3c258cbcd5/crim-law-outline-blakey-1-ndedu-ndlawpadoutlines2pad-crimlawoutline.jpg)