Embed Size (px)
Citation preview
Page 2 Source: Company, www.dynamiclevels.com
Jubilant Life Sciences- Caring, Sharing and Growing
Company Overview and Stock Price 3
Business Segments 4
Subsidiaries 6
Pharma Sector Outlook 7
Govt Initiatives in Pharma 8
Company Financials 9
Peer Comparison 12
Shareholding Pattern 13
Jubilant Biosys Enters Exclusive licensing 16
Investment Rationale 17
Page 3 Source: Company, www.dynamiclevels.com
Company’s Overview and Stock Price
Jubilant Life Sciences Limited, is an integrated global pharmaceutical and life sciences company engaged in manufacturing and supply of APIs, Solid Dosage Formulations, Radiopharmaceuticals, Allergy Therapy Products, Advance Intermediates, Fine Ingredients, Crop Science Ingredients, Life Science Chemicals and Nutritional Products. It also provides services in Contract Manufacturing of Sterile Injectables and Drug Discovery Solutions. The Company’s strength lies in its unique offerings of Pharmaceutical and Life Sciences products and services
Over the years, Jubilant Life Sciences has extended its footprint beyond India in the USA, Canada, Europe, and other countries across the globe. It has also expanded the business by building capabilities internally, through strategic expansions and acquisitions This resulted in a network of 7 world class manufacturing facilities in India and 5 in North America and a team of around 6100 multicultural people across the globe with 1200 in North America and 900 in R&D.
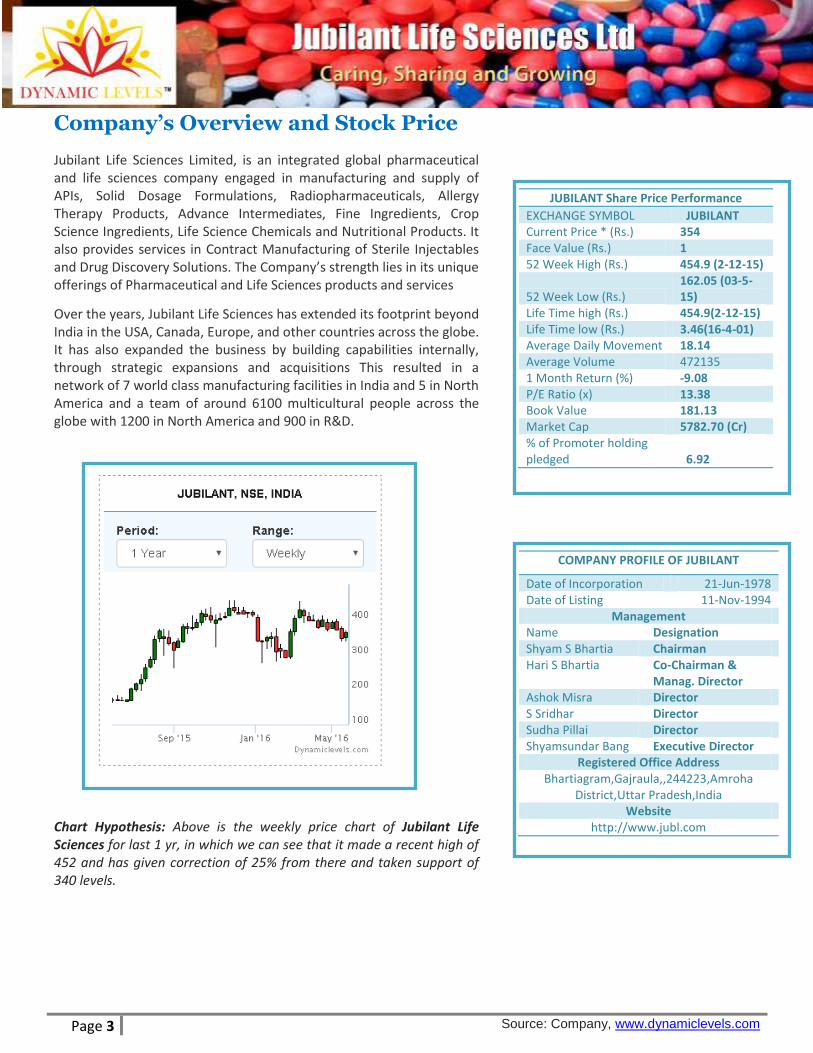
Chart Hypothesis: Above is the weekly price chart of Jubilant Life Sciences for last 1 yr, in which we can see that it made a recent high of 452 and has given correction of 25% from there and taken support of 340 levels.
COMPANY PROFILE OF JUBILANT
Date of Incorporation 21-Jun-1978 Date of Listing 11-Nov-1994
Management Name Designation Shyam S Bhartia Chairman Hari S Bhartia Co-Chairman &
Manag. Director Ashok Misra Director S Sridhar Director Sudha Pillai Director Shyamsundar Bang Executive Director
Registered Office Address Bhartiagram,Gajraula,,244223,Amroha
District,Uttar Pradesh,India Website
http://www.jubl.com
JUBILANT Share Price Performance EXCHANGE SYMBOL JUBILANT Current Price * (Rs.) 354 Face Value (Rs.) 1 52 Week High (Rs.) 454.9 (2-12-15)
52 Week Low (Rs.) 162.05 (03-5-15)
Life Time high (Rs.) 454.9(2-12-15) Life Time low (Rs.) 3.46(16-4-01) Average Daily Movement 18.14 Average Volume 472135 1 Month Return (%) -9.08 P/E Ratio (x) 13.38 Book Value 181.13 Market Cap 5782.70 (Cr) % of Promoter holding pledged 6.92
Page 4 Source: Company, www.dynamiclevels.com
Business Segments: Over the last three decades, Jubilant Life Sciences has
emerged as an integrated Pharmaceutical and Life Sciences
Solution Provider offering products & services to its customers
across the globe.
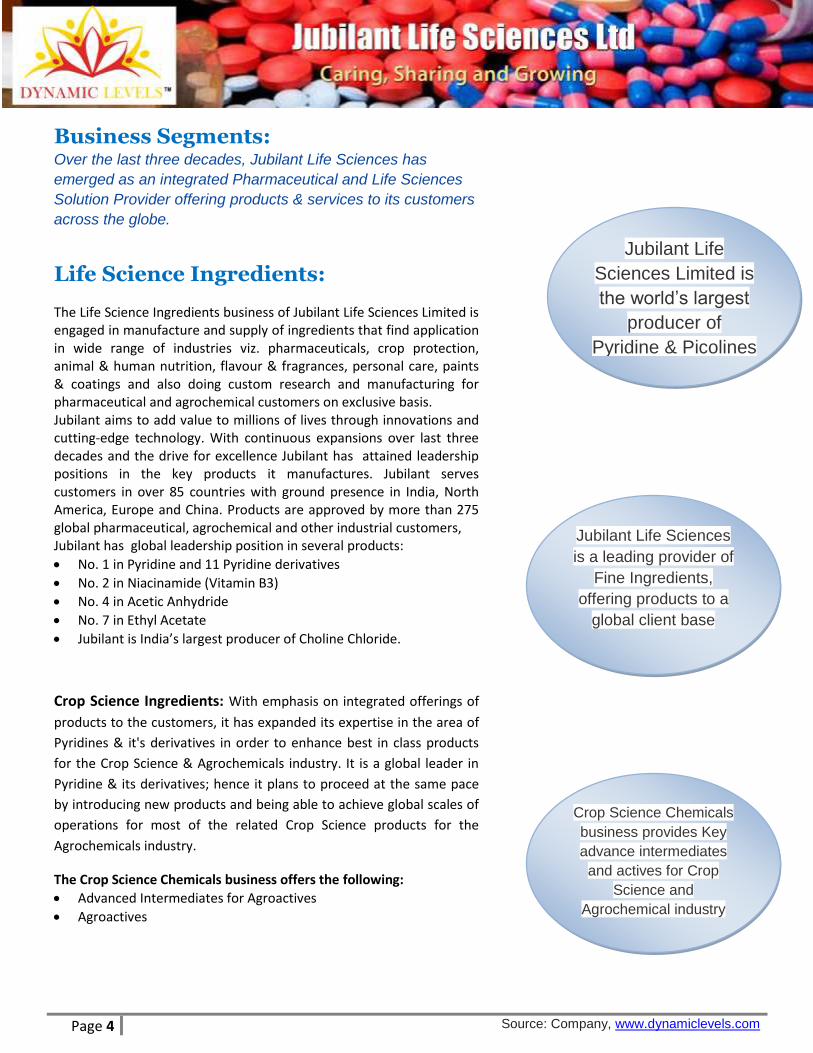
Life Science Ingredients:
The Life Science Ingredients business of Jubilant Life Sciences Limited is engaged in manufacture and supply of ingredients that find application in wide range of industries viz. pharmaceuticals, crop protection, animal & human nutrition, flavour & fragrances, personal care, paints & coatings and also doing custom research and manufacturing for pharmaceutical and agrochemical customers on exclusive basis. Jubilant aims to add value to millions of lives through innovations and cutting-edge technology. With continuous expansions over last three decades and the drive for excellence Jubilant has attained leadership positions in the key products it manufactures. Jubilant serves customers in over 85 countries with ground presence in India, North America, Europe and China. Products are approved by more than 275 global pharmaceutical, agrochemical and other industrial customers, Jubilant has global leadership position in several products:
No. 1 in Pyridine and 11 Pyridine derivatives
No. 2 in Niacinamide (Vitamin B3)
No. 4 in Acetic Anhydride
No. 7 in Ethyl Acetate
Jubilant is India’s largest producer of Choline Chloride.
Crop Science Ingredients: With emphasis on integrated offerings of
products to the customers, it has expanded its expertise in the area of
Pyridines & it's derivatives in order to enhance best in class products
for the Crop Science & Agrochemicals industry. It is a global leader in
Pyridine & its derivatives; hence it plans to proceed at the same pace
by introducing new products and being able to achieve global scales of
operations for most of the related Crop Science products for the
Agrochemicals industry.
The Crop Science Chemicals business offers the following:
Advanced Intermediates for Agroactives
Agroactives
Jubilant Life Sciences
is a leading provider of
Fine Ingredients,
offering products to a
global client base
Jubilant Life
Sciences Limited is
the world’s largest
producer of
Pyridine & Picolines
Crop Science Chemicals
business provides Key
advance intermediates
and actives for Crop
Science and
Agrochemical industry
Page 5 Source: Company, www.dynamiclevels.com
Nutritional products: Nutrition Ingredients business is a fully integrated operation and primarily manufactures and markets Vitamin B3, which is formulated for human, pharmacological, cosmetics and animal feed consumption, as well as Choline Chloride (also referred to as Vitamin B4), an important feed additive for poultry. Vitamin B3 is also used extensively in human nutrition such as flour fortification, food enrichment, sports drinks, energy drinks, baby food and multi-vitamins and in animal nutrition as feed additives for the poultry, dairy and pork industry, and in pharmaceuticals such as diabetes and cholesterol-related drugs in cosmetics for skin color and texture improvement and the manufacture of other life sciences intermediates. The biggest advantage it has is integrated nature of operations. Beta Picoline manufactured under the Proprietary Products is the precursor to Niacin and Niacinamide (Vitamin B3) produced. This provides JUBL with the cost-advantage that is difficult for any player in the industry to match.
Life Science Chemicals: Life Science Chemicals are organic intermediates, also known as Acetyls, which are precursors to Advance Intermediates and Fine Chemicals used in a range of applications such as pharmaceuticals, aromatics, adhesives, food, packaging, beverages, crop protection chemicals, textiles and other solvents. It produces various organic intermediates including Acetic Acid, Monochloro Acetic Acid (MCA), Acetic Anhydride, Ethyl Acetate and Sodium Mono Chlor Acetate (SMCA), which are typically used in the manufacture of downstream products such as pharmaceuticals, crop protection chemicals and solvents. Life Science Chemicals is a capital intensive business in which scale of operations is imperative. It has leadership position in Acetyls in India and sizeable presence globally. We enjoy economies of scale. The business produces ‘Green Solvent’ Ethyl Acetate, which is being preferred by customers in global markets.
Pharmaceuticals: Jubilant provides solutions to global pharmaceutical customers, offering a wide range of products & services. The Company is engaged in development, manufacture and supply of APIs, Solid Dosage Formulations, Radiopharmaceuticals, and Allergy Therapy Products. Services comprise Contract Manufacturing of Sterile Injectable, Ointments, Creams and Liquids. It has amplified the business by building capabilities internally, through strategic expansions and acquisitions, thereby, developing network of world class manufacturing facilities in India and in North America and a team of dedicated people across the globe. It has extended its reach globally with ground presence in India, North America and Europe.
Page 6 Source: Company, www.dynamiclevels.com
Subsidiaries:
The Company had 48 subsidiaries. Some of the major subsidiaries of Jubilant Life Sciences are:
Jubilant Pharma Limited Jubilant Pharma Limited, Singapore is the wholly-owned subsidiary of the Company. Jubilant Pharma holds the global pharmaceutical business of the Company through its subsidiaries in USA, Canada, Europe and India. These subsidiaries of Jubilant Pharma are engaged in manufacturing and marketing of various pharmaceutical products and services like active pharmaceutical ingredients, oral dosage forms (tablets and capsules), contract manufacturing of sterile injectables, ointment, creams and liquids, allergy therapy products and radiopharmaceutical business. Jubilant Generics Limited Jubilant Generics Limited is a wholly-owned subsidiary of the Company through Jubilant Pharma. During the year, JGL has, by way of slump sale, acquired (i) API business and (ii) Dosage Forms business of the Company through Business Transfer Agreement, on a going concern basis. JGL has also acquired investments of the Company in Jubilant Pharma Holdings Inc., USA and Jubilant Pharma NV, Belgium. JGL owns two manufacturing locations; one at Nanjangud, Karnataka and another at Roorkee, Uttarakhand which are engaged in API and Dosage Forms business, respectively. Cadista Holdings Inc. and Jubilant Cadista Pharma Inc. Cadista Holdings Inc a corporation incorporated in Delaware, USA, is a wholly-owned subsidiary of Jubilant Pharma Holdings Inc. Effective December 22, 2014, Jubilant Generics Inc. which held 82.38% shares in Cadista, acquired 17.62% shares held by the minority shareholders in Cadista through Tender Offer. Pursuant to this acquisition, Jubilant Generics Inc. merged into Cadista. ii) Jubilant Cadista pharmaceuticals Inc., a corporation incorporated in Delaware, USA is a wholly-owned subsidiary of Cadista Holdings Inc. This company is in the business of manufacturing solid dosage forms of generic pharmaceuticals at its USFDA approved manufacturing facility in Salisbury, Maryland, USA. Its customer base includes all the large wholesalers, retail and grocery chains. Besides manufacturing its own label products, it also provides Product Development and Contract Manufacturing Services. Jubilant Pharmaceuticals NV This is a wholly-owned subsidiary of JLS through Jubilant pharma NV, Belgium, which holds 99.8% of its shares and Jubilant Pharma holds the balance shares. This company is engaged in the business of licensing generic dosage forms providing regulatory services to generic pharmaceutical companies.
Page 7 Source: Company, www.dynamiclevels.com
Pharmaceutical Sector Outlook
The Indian pharmaceuticals market is the 3rd largest in terms of volume
and 13th largest in terms of value. Branded generics dominate the
pharmaceuticals market, constituting nearly 70 to 80 % of the market.
India is the largest provider of generic drugs globally with the Indian
generics accounting for 20 % of global exports in terms of volume. The
Indian pharmacy industry, which is expected to grow over 15 % p.a.
between 2015 and 2020, will outperform the global pharmacy industry,
which is set to grow 5 % p.a. between the same periods. Presently the
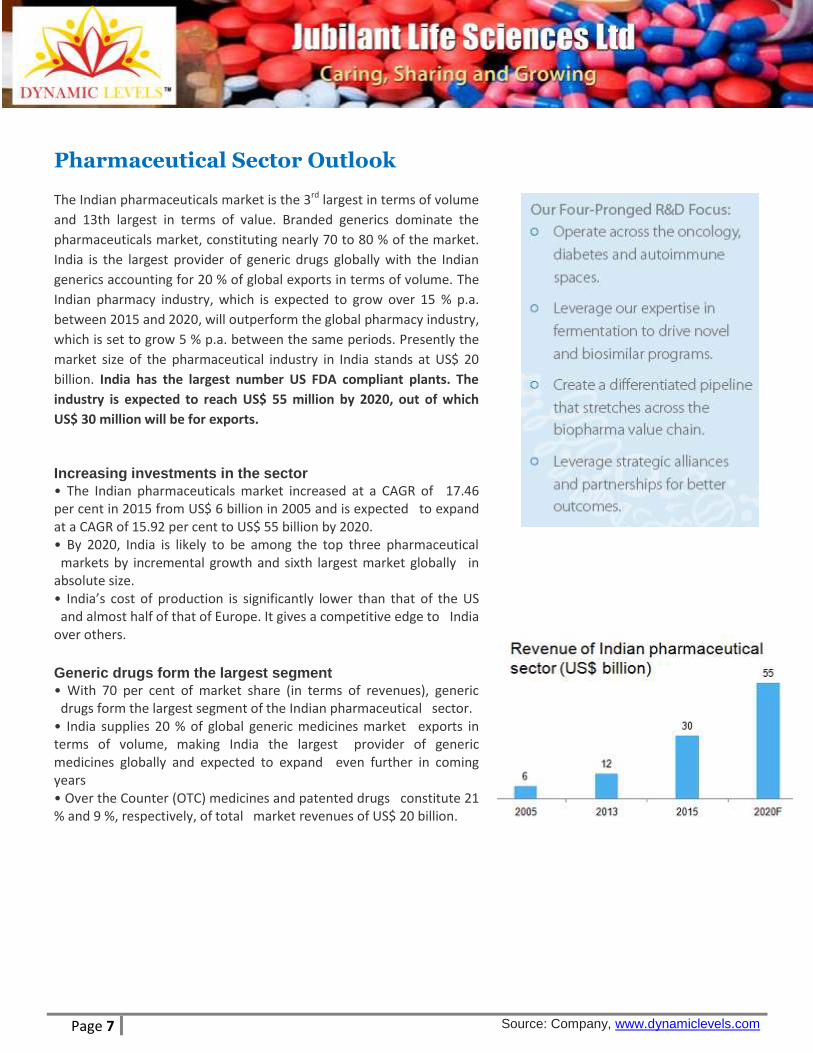
market size of the pharmaceutical industry in India stands at US$ 20
billion. India has the largest number US FDA compliant plants. The
industry is expected to reach US$ 55 million by 2020, out of which
US$ 30 million will be for exports.
Increasing investments in the sector
• The Indian pharmaceuticals market increased at a CAGR of 17.46 per cent in 2015 from US$ 6 billion in 2005 and is expected to expand at a CAGR of 15.92 per cent to US$ 55 billion by 2020. • By 2020, India is likely to be among the top three pharmaceutical markets by incremental growth and sixth largest market globally in absolute size. • India’s cost of production is significantly lower than that of the US and almost half of that of Europe. It gives a competitive edge to India over others.
Generic drugs form the largest segment
• With 70 per cent of market share (in terms of revenues), generic drugs form the largest segment of the Indian pharmaceutical sector. • India supplies 20 % of global generic medicines market exports in terms of volume, making India the largest provider of generic medicines globally and expected to expand even further in coming years • Over the Counter (OTC) medicines and patented drugs constitute 21 % and 9 %, respectively, of total market revenues of US$ 20 billion.
Page 8 Source: Company, www.dynamiclevels.com
Government Initiatives in Pharma
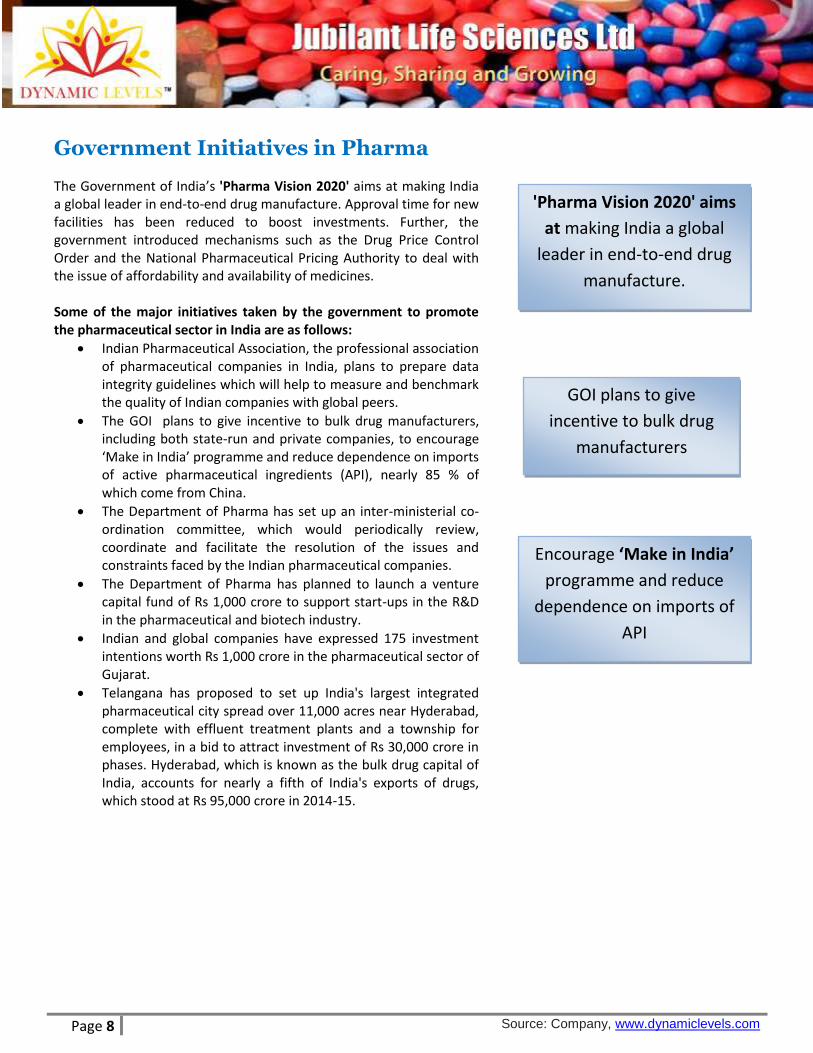
The Government of India’s 'Pharma Vision 2020' aims at making India a global leader in end-to-end drug manufacture. Approval time for new facilities has been reduced to boost investments. Further, the government introduced mechanisms such as the Drug Price Control Order and the National Pharmaceutical Pricing Authority to deal with the issue of affordability and availability of medicines. Some of the major initiatives taken by the government to promote the pharmaceutical sector in India are as follows:
Indian Pharmaceutical Association, the professional association of pharmaceutical companies in India, plans to prepare data integrity guidelines which will help to measure and benchmark the quality of Indian companies with global peers.
The GOI plans to give incentive to bulk drug manufacturers, including both state-run and private companies, to encourage ‘Make in India’ programme and reduce dependence on imports of active pharmaceutical ingredients (API), nearly 85 % of which come from China.
The Department of Pharma has set up an inter-ministerial co-ordination committee, which would periodically review, coordinate and facilitate the resolution of the issues and constraints faced by the Indian pharmaceutical companies.
The Department of Pharma has planned to launch a venture capital fund of Rs 1,000 crore to support start-ups in the R&D in the pharmaceutical and biotech industry.
Indian and global companies have expressed 175 investment intentions worth Rs 1,000 crore in the pharmaceutical sector of Gujarat.
Telangana has proposed to set up India's largest integrated pharmaceutical city spread over 11,000 acres near Hyderabad, complete with effluent treatment plants and a township for employees, in a bid to attract investment of Rs 30,000 crore in phases. Hyderabad, which is known as the bulk drug capital of India, accounts for nearly a fifth of India's exports of drugs, which stood at Rs 95,000 crore in 2014-15.
'Pharma Vision 2020' aims
at making India a global
leader in end-to-end drug
manufacture.
GOI plans to give
incentive to bulk drug
manufacturers
Encourage ‘Make in India’
programme and reduce
dependence on imports of
API
Page 9 Source: Company, www.dynamiclevels.com
Company Financials
Mar-16 Mar-15 Mar-14
Annual Annual Annual
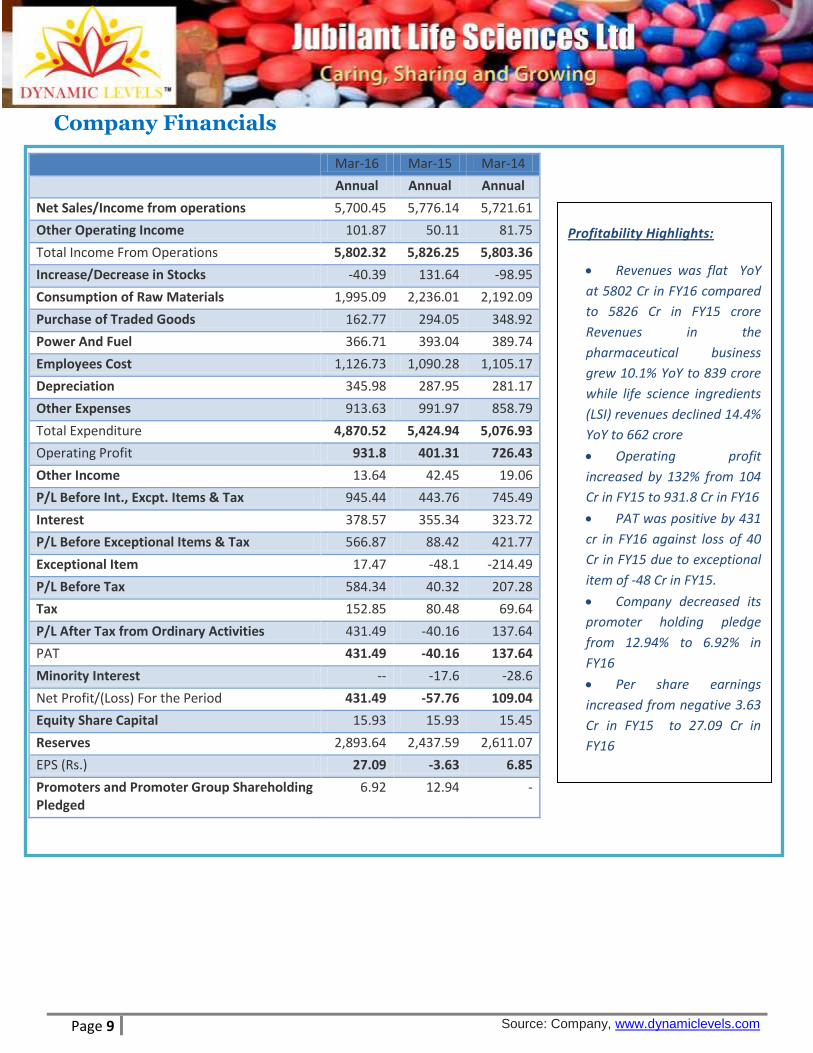
Net Sales/Income from operations 5,700.45 5,776.14 5,721.61
Other Operating Income 101.87 50.11 81.75
Total Income From Operations 5,802.32 5,826.25 5,803.36
Increase/Decrease in Stocks -40.39 131.64 -98.95
Consumption of Raw Materials 1,995.09 2,236.01 2,192.09
Purchase of Traded Goods 162.77 294.05 348.92
Power And Fuel 366.71 393.04 389.74
Employees Cost 1,126.73 1,090.28 1,105.17
Depreciation 345.98 287.95 281.17
Other Expenses 913.63 991.97 858.79
Total Expenditure 4,870.52 5,424.94 5,076.93
Operating Profit 931.8 401.31 726.43
Other Income 13.64 42.45 19.06
P/L Before Int., Excpt. Items & Tax 945.44 443.76 745.49
Interest 378.57 355.34 323.72
P/L Before Exceptional Items & Tax 566.87 88.42 421.77
Exceptional Item 17.47 -48.1 -214.49
P/L Before Tax 584.34 40.32 207.28
Tax 152.85 80.48 69.64
P/L After Tax from Ordinary Activities 431.49 -40.16 137.64
PAT 431.49 -40.16 137.64
Minority Interest -- -17.6 -28.6
Net Profit/(Loss) For the Period 431.49 -57.76 109.04
Equity Share Capital 15.93 15.93 15.45
Reserves 2,893.64 2,437.59 2,611.07
EPS (Rs.) 27.09 -3.63 6.85
Promoters and Promoter Group Shareholding Pledged
6.92 12.94 -
Profitability Highlights:
Revenues was flat YoY
at 5802 Cr in FY16 compared
to 5826 Cr in FY15 crore
Revenues in the
pharmaceutical business
grew 10.1% YoY to 839 crore
while life science ingredients
(LSI) revenues declined 14.4%
YoY to 662 crore
Operating profit
increased by 132% from 104
Cr in FY15 to 931.8 Cr in FY16
PAT was positive by 431
cr in FY16 against loss of 40
Cr in FY15 due to exceptional
item of -48 Cr in FY15.
Company decreased its
promoter holding pledge
from 12.94% to 6.92% in
FY16
Per share earnings
increased from negative 3.63
Cr in FY15 to 27.09 Cr in
FY16
Page 10 Source: Company, www.dynamiclevels.com
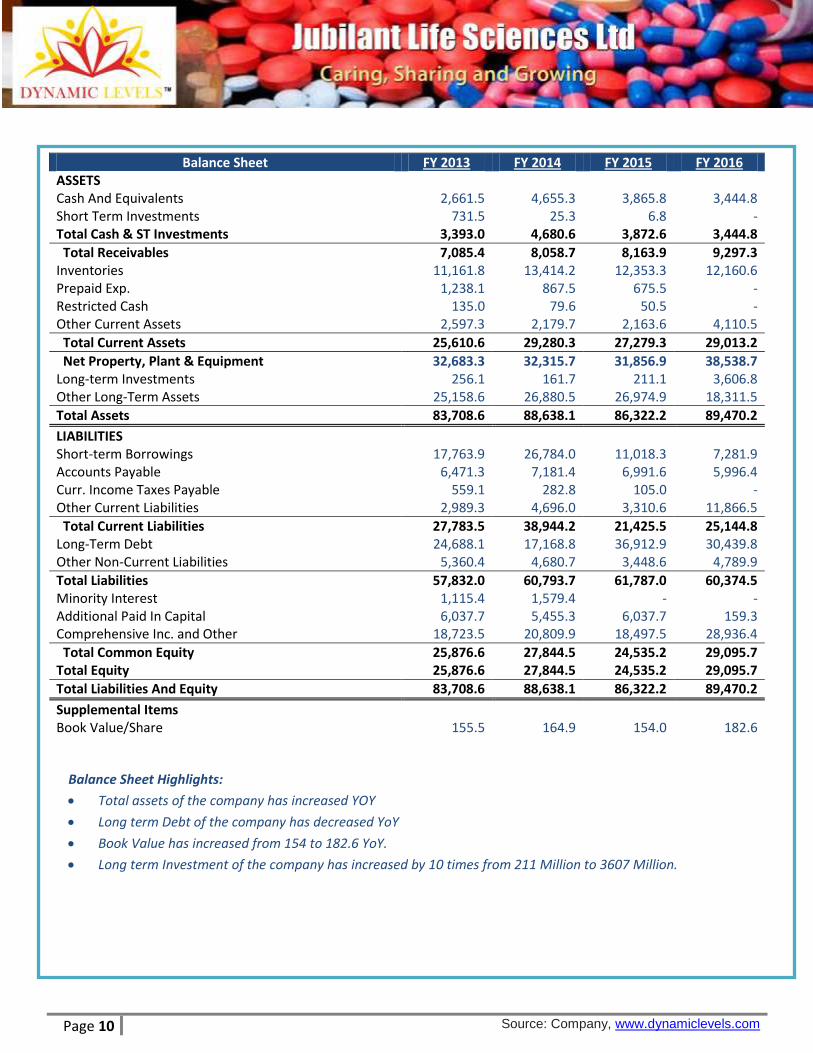
Balance Sheet FY 2013 FY 2014 FY 2015 FY 2016 ASSETS
Cash And Equivalents 2,661.5 4,655.3 3,865.8 3,444.8 Short Term Investments 731.5 25.3 6.8 - Total Cash & ST Investments 3,393.0 4,680.6 3,872.6 3,444.8
Total Receivables 7,085.4 8,058.7 8,163.9 9,297.3 Inventories 11,161.8 13,414.2 12,353.3 12,160.6 Prepaid Exp. 1,238.1 867.5 675.5 - Restricted Cash 135.0 79.6 50.5 - Other Current Assets 2,597.3 2,179.7 2,163.6 4,110.5
Total Current Assets 25,610.6 29,280.3 27,279.3 29,013.2
Net Property, Plant & Equipment 32,683.3 32,315.7 31,856.9 38,538.7 Long-term Investments 256.1 161.7 211.1 3,606.8 Other Long-Term Assets 25,158.6 26,880.5 26,974.9 18,311.5
Total Assets 83,708.6 88,638.1 86,322.2 89,470.2
LIABILITIES Short-term Borrowings 17,763.9 26,784.0 11,018.3 7,281.9 Accounts Payable 6,471.3 7,181.4 6,991.6 5,996.4 Curr. Income Taxes Payable 559.1 282.8 105.0 - Other Current Liabilities 2,989.3 4,696.0 3,310.6 11,866.5
Total Current Liabilities 27,783.5 38,944.2 21,425.5 25,144.8 Long-Term Debt 24,688.1 17,168.8 36,912.9 30,439.8 Other Non-Current Liabilities 5,360.4 4,680.7 3,448.6 4,789.9
Total Liabilities 57,832.0 60,793.7 61,787.0 60,374.5 Minority Interest 1,115.4 1,579.4 - - Additional Paid In Capital 6,037.7 5,455.3 6,037.7 159.3 Comprehensive Inc. and Other 18,723.5 20,809.9 18,497.5 28,936.4
Total Common Equity 25,876.6 27,844.5 24,535.2 29,095.7 Total Equity 25,876.6 27,844.5 24,535.2 29,095.7
Total Liabilities And Equity 83,708.6 88,638.1 86,322.2 89,470.2
Supplemental Items Book Value/Share 155.5 164.9 154.0 182.6
Balance Sheet Highlights:
Total assets of the company has increased YOY
Long term Debt of the company has decreased YoY
Book Value has increased from 154 to 182.6 YoY.
Long term Investment of the company has increased by 10 times from 211 Million to 3607 Million.
Page 11 Source: Company, www.dynamiclevels.com
Peer Comparison
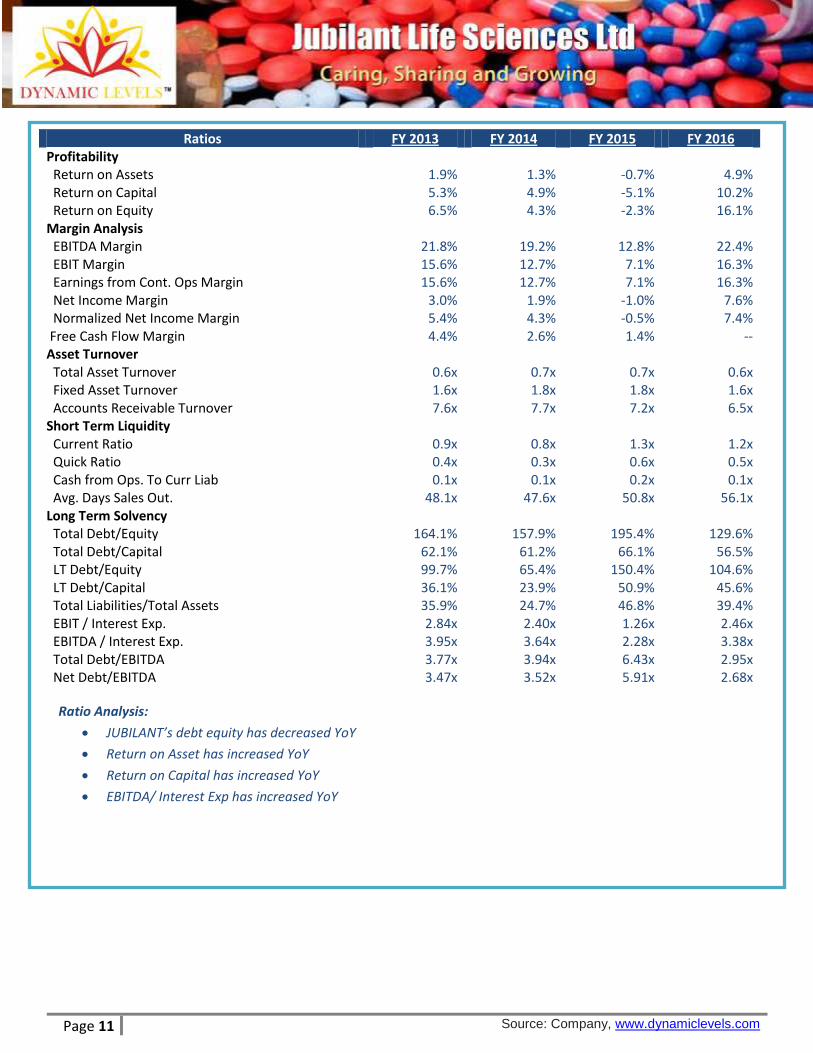
Ratios FY 2013 FY 2014 FY 2015 FY 2016 Profitability Return on Assets 1.9% 1.3% -0.7% 4.9% Return on Capital 5.3% 4.9% -5.1% 10.2% Return on Equity 6.5% 4.3% -2.3% 16.1% Margin Analysis EBITDA Margin 21.8% 19.2% 12.8% 22.4% EBIT Margin 15.6% 12.7% 7.1% 16.3% Earnings from Cont. Ops Margin 15.6% 12.7% 7.1% 16.3% Net Income Margin 3.0% 1.9% -1.0% 7.6% Normalized Net Income Margin 5.4% 4.3% -0.5% 7.4% Free Cash Flow Margin 4.4% 2.6% 1.4% -- Asset Turnover Total Asset Turnover 0.6x 0.7x 0.7x 0.6x Fixed Asset Turnover 1.6x 1.8x 1.8x 1.6x Accounts Receivable Turnover 7.6x 7.7x 7.2x 6.5x Short Term Liquidity Current Ratio 0.9x 0.8x 1.3x 1.2x Quick Ratio 0.4x 0.3x 0.6x 0.5x Cash from Ops. To Curr Liab 0.1x 0.1x 0.2x 0.1x Avg. Days Sales Out. 48.1x 47.6x 50.8x 56.1x Long Term Solvency Total Debt/Equity 164.1% 157.9% 195.4% 129.6% Total Debt/Capital 62.1% 61.2% 66.1% 56.5% LT Debt/Equity 99.7% 65.4% 150.4% 104.6% LT Debt/Capital 36.1% 23.9% 50.9% 45.6% Total Liabilities/Total Assets 35.9% 24.7% 46.8% 39.4% EBIT / Interest Exp. 2.84x 2.40x 1.26x 2.46x EBITDA / Interest Exp. 3.95x 3.64x 2.28x 3.38x Total Debt/EBITDA 3.77x 3.94x 6.43x 2.95x Net Debt/EBITDA 3.47x 3.52x 5.91x 2.68x
Ratio Analysis:
JUBILANT’s debt equity has decreased YoY
Return on Asset has increased YoY
Return on Capital has increased YoY
EBITDA/ Interest Exp has increased YoY
Page 12 Source: Company, www.dynamiclevels.com
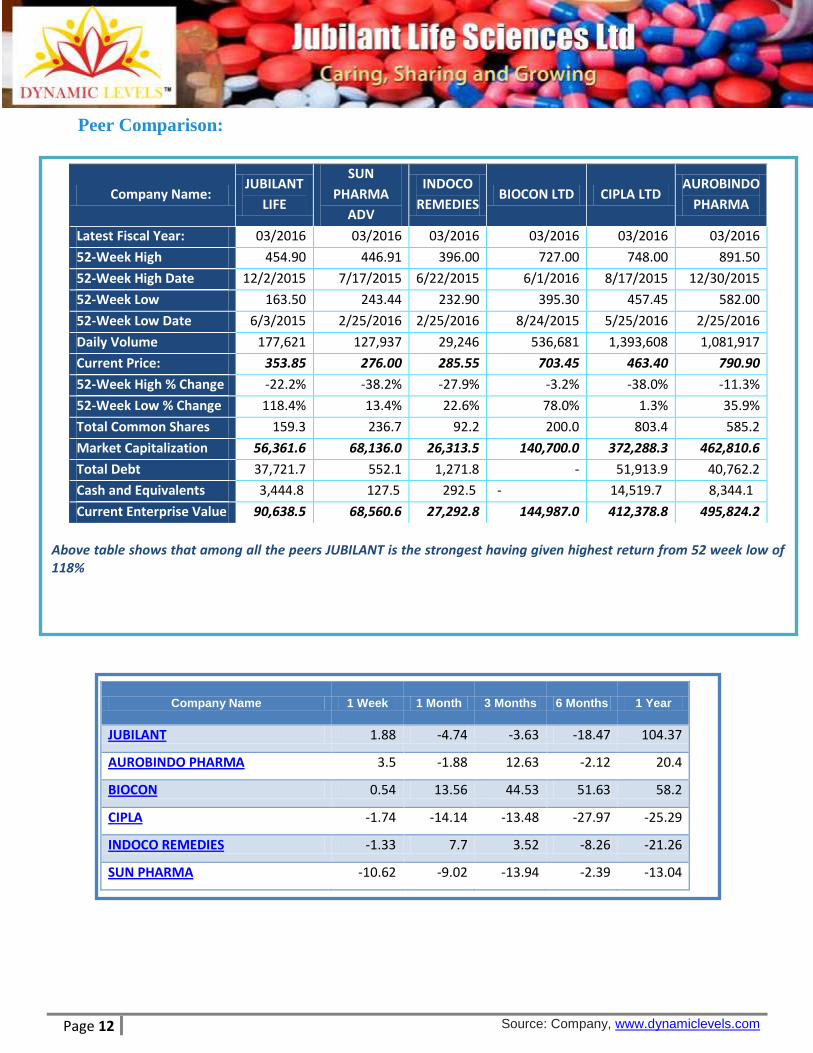
Peer Comparison:
Company Name: JUBILANT
LIFE
SUN
PHARMA
ADV
INDOCO
REMEDIES BIOCON LTD CIPLA LTD
AUROBINDO
PHARMA
Latest Fiscal Year: 03/2016 03/2016 03/2016 03/2016 03/2016 03/2016
52-Week High 454.90 446.91 396.00 727.00 748.00 891.50
52-Week High Date 12/2/2015 7/17/2015 6/22/2015 6/1/2016 8/17/2015 12/30/2015
52-Week Low 163.50 243.44 232.90 395.30 457.45 582.00
52-Week Low Date 6/3/2015 2/25/2016 2/25/2016 8/24/2015 5/25/2016 2/25/2016
Daily Volume 177,621 127,937 29,246 536,681 1,393,608 1,081,917
Current Price: 353.85 276.00 285.55 703.45 463.40 790.90
52-Week High % Change -22.2% -38.2% -27.9% -3.2% -38.0% -11.3%
52-Week Low % Change 118.4% 13.4% 22.6% 78.0% 1.3% 35.9%
Total Common Shares 159.3 236.7 92.2 200.0 803.4 585.2
Market Capitalization 56,361.6 68,136.0 26,313.5 140,700.0 372,288.3 462,810.6
Total Debt 37,721.7 552.1 1,271.8 - 51,913.9 40,762.2
Cash and Equivalents 3,444.8 127.5 292.5 - 14,519.7 8,344.1
Current Enterprise Value 90,638.5 68,560.6 27,292.8 144,987.0 412,378.8 495,824.2
Above table shows that among all the peers JUBILANT is the strongest having given highest return from 52 week low of 118%
Company Name 1 Week 1 Month 3 Months 6 Months 1 Year
JUBILANT 1.88 -4.74 -3.63 -18.47 104.37
AUROBINDO PHARMA 3.5 -1.88 12.63 -2.12 20.4
BIOCON 0.54 13.56 44.53 51.63 58.2
CIPLA -1.74 -14.14 -13.48 -27.97 -25.29
INDOCO REMEDIES -1.33 7.7 3.52 -8.26 -21.26
SUN PHARMA -10.62 -9.02 -13.94 -2.39 -13.04
Page 13 Source: Company, www.dynamiclevels.com
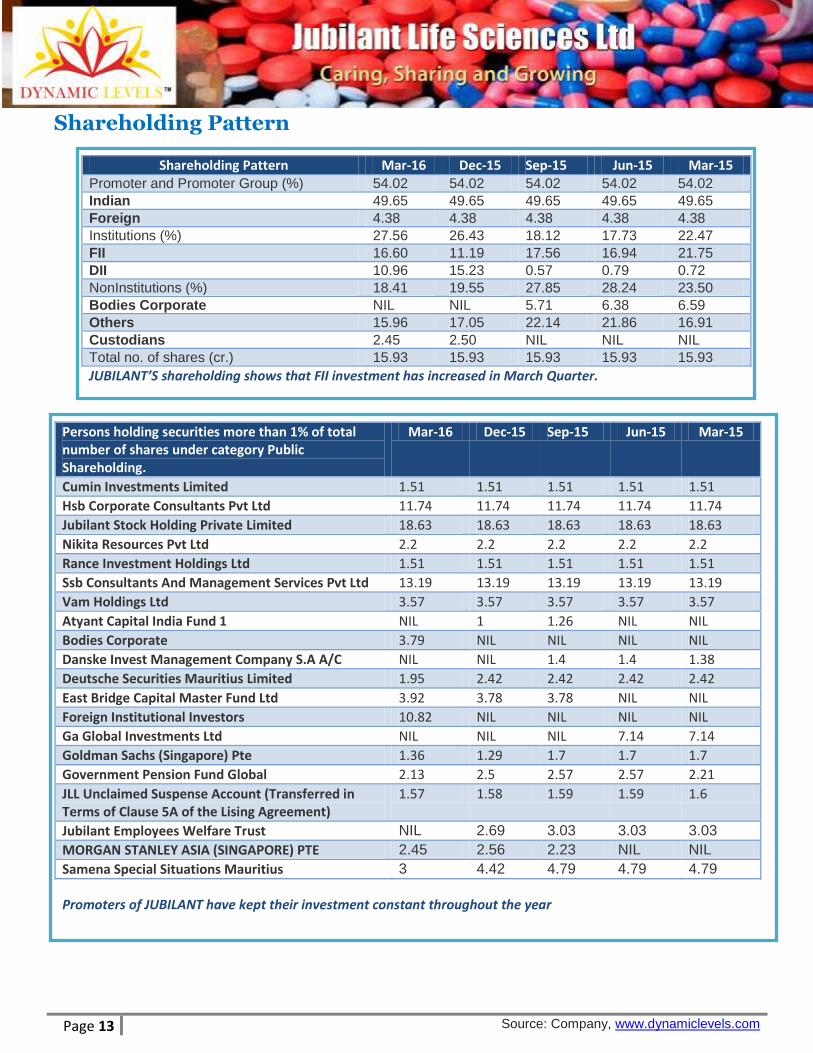
Shareholding Pattern
Shareholding Pattern Mar-16 Dec-15 Sep-15 Jun-15 Mar-15 Promoter and Promoter Group (%) 54.02 54.02 54.02 54.02 54.02
Indian 49.65 49.65 49.65 49.65 49.65
Foreign 4.38 4.38 4.38 4.38 4.38
Institutions (%) 27.56 26.43 18.12 17.73 22.47
FII 16.60 11.19 17.56 16.94 21.75
DII 10.96 15.23 0.57 0.79 0.72
NonInstitutions (%) 18.41 19.55 27.85 28.24 23.50
Bodies Corporate NIL NIL 5.71 6.38 6.59
Others 15.96 17.05 22.14 21.86 16.91
Custodians 2.45 2.50 NIL NIL NIL
Total no. of shares (cr.) 15.93 15.93 15.93 15.93 15.93
JUBILANT’S shareholding shows that FII investment has increased in March Quarter.
Persons holding securities more than 1% of total number of shares under category Public Shareholding.
Mar-16 Dec-15 Sep-15 Jun-15 Mar-15
Cumin Investments Limited 1.51 1.51 1.51 1.51 1.51
Hsb Corporate Consultants Pvt Ltd 11.74 11.74 11.74 11.74 11.74
Jubilant Stock Holding Private Limited 18.63 18.63 18.63 18.63 18.63
Nikita Resources Pvt Ltd 2.2 2.2 2.2 2.2 2.2
Rance Investment Holdings Ltd 1.51 1.51 1.51 1.51 1.51
Ssb Consultants And Management Services Pvt Ltd 13.19 13.19 13.19 13.19 13.19
Vam Holdings Ltd 3.57 3.57 3.57 3.57 3.57
Atyant Capital India Fund 1 NIL 1 1.26 NIL NIL
Bodies Corporate 3.79 NIL NIL NIL NIL
Danske Invest Management Company S.A A/C NIL NIL 1.4 1.4 1.38
Deutsche Securities Mauritius Limited 1.95 2.42 2.42 2.42 2.42
East Bridge Capital Master Fund Ltd 3.92 3.78 3.78 NIL NIL
Foreign Institutional Investors 10.82 NIL NIL NIL NIL
Ga Global Investments Ltd NIL NIL NIL 7.14 7.14
Goldman Sachs (Singapore) Pte 1.36 1.29 1.7 1.7 1.7
Government Pension Fund Global 2.13 2.5 2.57 2.57 2.21
JLL Unclaimed Suspense Account (Transferred in Terms of Clause 5A of the Lising Agreement)
1.57 1.58 1.59 1.59 1.6
Jubilant Employees Welfare Trust NIL 2.69 3.03 3.03 3.03
MORGAN STANLEY ASIA (SINGAPORE) PTE 2.45 2.56 2.23 NIL NIL
Samena Special Situations Mauritius 3 4.42 4.79 4.79 4.79
Promoters of JUBILANT have kept their investment constant throughout the year
Page 14 Source: Company, www.dynamiclevels.com
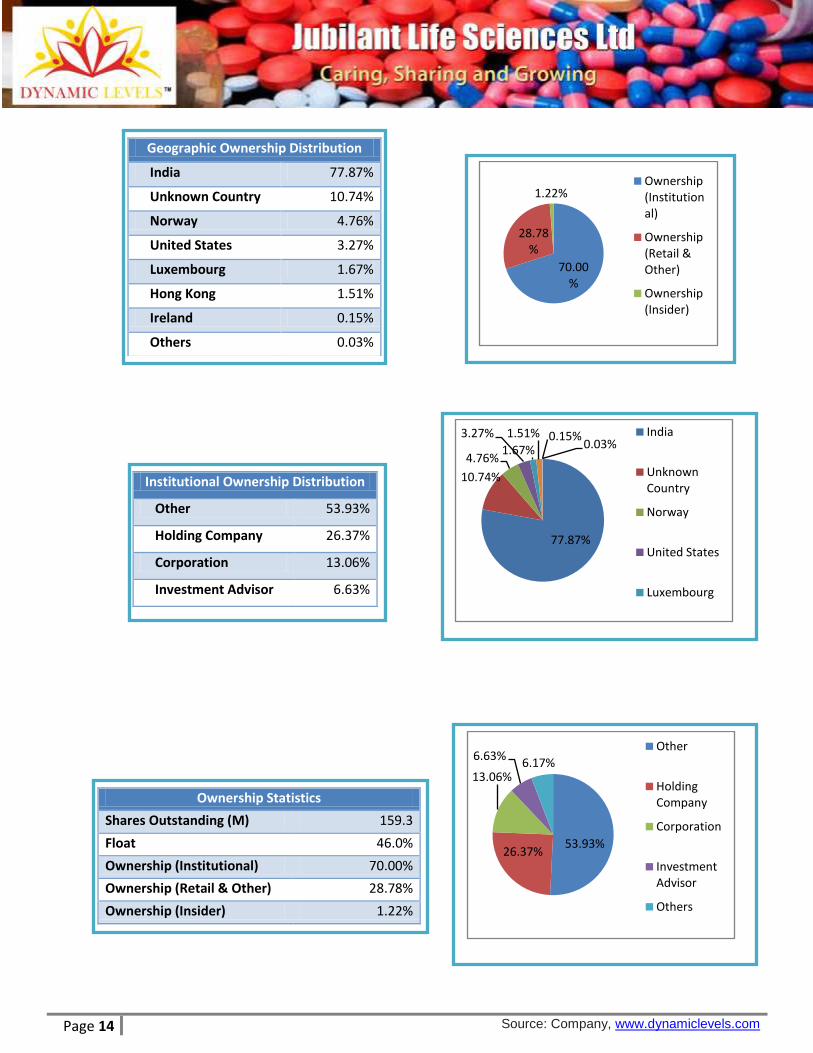
70.00%
28.78%
1.22%Ownership (Institutional)
Ownership (Retail & Other)
Ownership (Insider)
77.87%
10.74%
4.76%
3.27%
1.67%
1.51% 0.15%0.03%
India
Unknown Country
Norway
United States
Luxembourg
Geographic Ownership Distribution
India 77.87%
Unknown Country 10.74%
Norway 4.76%
United States 3.27%
Luxembourg 1.67%
Hong Kong 1.51%
Ireland 0.15%
Others 0.03%
Institutional Ownership Distribution
Other 53.93%
Holding Company 26.37%
Corporation 13.06%
Investment Advisor 6.63%
53.93%26.37%
13.06%
6.63%6.17%
Other
Holding Company
Corporation
Investment Advisor
Others
Ownership Statistics
Shares Outstanding (M) 159.3
Float 46.0%
Ownership (Institutional) 70.00%
Ownership (Retail & Other) 28.78%
Ownership (Insider) 1.22%
Page 15 Source: Company, www.dynamiclevels.com
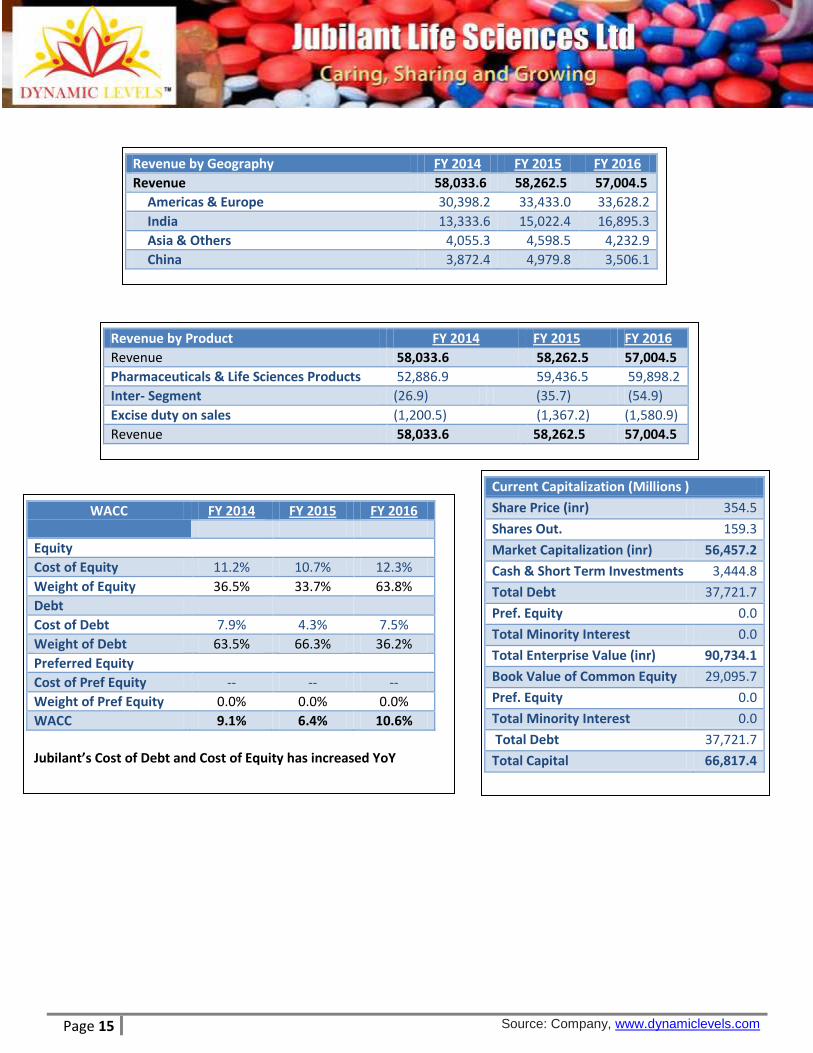
Revenue by Geography FY 2014 FY 2015 FY 2016
Revenue 58,033.6 58,262.5 57,004.5
Americas & Europe 30,398.2 33,433.0 33,628.2
India 13,333.6 15,022.4 16,895.3
Asia & Others 4,055.3 4,598.5 4,232.9
China 3,872.4 4,979.8 3,506.1
Revenue by Product FY 2014 FY 2015 FY 2016
Revenue 58,033.6 58,262.5 57,004.5
Pharmaceuticals & Life Sciences Products 52,886.9 59,436.5 59,898.2
Inter- Segment (26.9) (35.7) (54.9)
Excise duty on sales (1,200.5) (1,367.2) (1,580.9)
Revenue 58,033.6 58,262.5 57,004.5
WACC FY 2014 FY 2015 FY 2016
Equity
Cost of Equity 11.2% 10.7% 12.3%
Weight of Equity 36.5% 33.7% 63.8%
Debt
Cost of Debt 7.9% 4.3% 7.5%
Weight of Debt 63.5% 66.3% 36.2%
Preferred Equity
Cost of Pref Equity -- -- --
Weight of Pref Equity 0.0% 0.0% 0.0%
WACC 9.1% 6.4% 10.6%
Jubilant’s Cost of Debt and Cost of Equity has increased YoY
Current Capitalization (Millions )
Share Price (inr) 354.5
Shares Out. 159.3
Market Capitalization (inr) 56,457.2
Cash & Short Term Investments 3,444.8
Total Debt 37,721.7
Pref. Equity 0.0
Total Minority Interest 0.0
Total Enterprise Value (inr) 90,734.1
Book Value of Common Equity 29,095.7
Pref. Equity 0.0
Total Minority Interest 0.0
Total Debt 37,721.7
Total Capital 66,817.4
Page 16 Source: Company, www.dynamiclevels.com
Jubilant Biosys Enters into Exclusive out - Licensing Agreement with Checkpoint Therapeutics
Jubilant Biosys Ltd a subsidiary of Jubilant Life Sciences Ltd, and Checkpoint Therapeutics, Inc. a subsidiary of Fortress Biotech, Inc. announced the signing of an exclusive, worldwide license agreement under which Jubilant Biosys will out-license to Checkpoint a family of patents covering compounds that inhibit BRD4, a member of the BET (Bromodomain and Extra Terminal) domain for cancer treatment. The deal includes an upfront payment of US $2 million and contingent preclinical, clinical and regulatory payments including commercial milestones totalling up to US $180 million. Jubilant Biosys will also receive research funding and royalty payments on successful commercialization of the compounds. Checkpoint will assume all further preclinical, clinical development and commercialization responsibilities. The field of epigenetics as a treatment for cancer is a rapidly evolving area of focus for the pharmaceutical and biotech industry. Both parties believe that by working together to further develop these compounds, they will better be able to move towards bringing a product to market that will greatly improve the lives of patients.
Mr. Shyam S. Bhartia, Chairman and Mr. Hari S. Bhartia, Co-Chairman and MD of Jubilant Life Sciences, commented, “The Drug Discovery business vertical under Jubilant Biosys and Jubilant Chemsys has acquired many years of extensive expertise and knowledge working with large pharma and biotech companies. Jubilant had decided to make strategic investments in proprietary drug discovery of small molecules with an intent to out-licence the same for upfront payments and phased milestone payments/royalties.”
James F. Oliviero, III, President and CEO of Checkpoint stated, “We are very pleased to be partnering with Jubilant Biosys to license a family of patents covering compounds that inhibit BRD4 for cancer treatment. This agreement enhances our current product portfolio of immuno-oncology and targeted anti-cancer agents. BET inhibitors have generated significant excitement within the oncology community and Jubilant’s asset provides us with additional opportunities to explore proprietary combinations and treatment options for patients. We appreciate Jubilant entrusting our organization to continue development of their exciting technology.”
Page 17 Source: Company, www.dynamiclevels.com
Investment Rationale:
Jubilant Life Sciences Ltd, an integrated global Pharmaceuticals and Life Sciences Company, has received
Abbreviated New Drug Application (ANDA) final approval for Levetiracetam Injection USP, 500 mg/5 mL
(100 mg/mL), the generic version of Keppra® Injection 500mg/5mL (100mg/mL) of UCB, which is used for
the treatment of epilepsy. As on March 31, 2016, Jubilant Life Sciences had a total of 739 filings for
formulations of which 517 have been approved in various regions globally. This includes 72 ANDAs filed in
the US, of which 44 have been approved and 46 Dossier filings in Europe.
Revenues from North America were at Rs. 2,191 Crore, contributing 38% to the revenue mix. Revenues from
Europe and Japan stood at Rs. 1,175 Crore, contributing 20% to the revenue mix. Revenues from ROW
including China stood at Rs. 791 Crore, contributing 14% to the revenue mix. Domestic revenues stood at
Rs. 1,669 crore, up 13% YoY and contributing 29% to the revenue mix. In monetary terms, 40.79 % of the
material was sourced locally whereas 59.21 % was sourced from other countries for Indian operations.
Pharmaceuticals business segment is getting back on track as margin scenario is improving due to generic
launches in the US, launches in the specialty pharma space and successful resolution of two CMO facilities.
Jubilant is one of the few Indian CRAMS players with a vertically integrated business model.
The four key pillars of Jubilant success are: Integrated operations, Global outreach, Innovation and
Sustainability.
Strong margins growth expected: Revenues was down YoY from 5826 Cr to 5802 Cr YoY whereas. EBITDA
margins increased 523 bps YoY to 21.3%.
Revenues was flat YoY at 5802 Cr in FY16 compared to 5826 Cr in FY15 crore Revenues in the
pharmaceutical business grew 10.1% YoY to 839 crore while life science ingredients (LSI) revenues declined
14.4% YoY to 662 crore
Operating profit increased by 132% from 104 Cr in FY15 to 931.8 Cr in FY16
PAT was positive by 431 cr in FY16 against loss of 40 Cr in FY15 due to exceptional item of -48 Cr in FY15.
Company decreased its promoter holding pledge from 12.94% to 6.92% in FY16
Per share earnings increased from negative 3.63 Cr in FY15 to 27.09 Cr in FY16
Jubilant has filed 2 products in Japan and expects ramp up of operations in CMO of sterile injectables and
oral solid facilities
Jubilant has added 2 pyridine derivative products in FY16 and plans to add another product by Q4FY17. All
pharmaceutical facilities were inspected successfully by the USFDA during the year.
Jubilant has planned 7-8 launches and 10-12 ANDA filings in the US in FY17
We recommend BUY in JUBILANT @ 340-350 with the Target of 440 as Jubilant is aiming to improve its Debt situation in FY17 and revenues is expected to grow by 28% in FY18 to 7442.1 crore from 5802 Cr in FY16, driven by formulations, specialty pharma, CMO and nutrition products.
Page 18 Source: Company, www.dynamiclevels.com
Disclaimer: Research Disclaimer and Disclosure inter-alia as required under Securities and Exchange Board of India (Research Analysts) Regulations, 2014. Dynamic Equities Pvt. Ltd. is a member of National Stock Exchange of India Ltd. (NSEIL), Bombay Stock Exchange Ltd (BSE), Multi Stock Exchange of India Ltd (MCX-SX) and also a depository participant with National Securities Depository Ltd (NSDL) and Central Depository Services Ltd.(CDSL). Dynamic is engaged in the business of Stock Broking, Depository Services, Investment Advisory Services and Portfolio Management Services. Dynamic Equities Pvt. Ltd. is holding company of Dynamic Commodities Pvt. Ltd. , a member of Multi Commodities Exchange (MCX) & National Commodity & Derivatives Exchange Ltd.(NCDEX). We hereby declare that our activities were neither suspended nor we have defaulted with any stock exchange authority with whom we are registered. SEBI, Exchanges and Depositories have conducted the routine inspection and based on their observations have issued advise letters or levied minor penalty on for certain operational deviations. Answers to the Best of the knowledge and belief of Dynamic/ its Associates/ Research Analyst who prepared this report
DYANMIC/its Associates/ Research Analyst/ his Relative have any financial interest in the subject company? No
DYANMIC/its Associates/ Research Analyst/ his Relative have actual/beneficial ownership of one per cent or more securities of the subject company? No
DYANMIC/its Associates/ Research Analyst/ his Relative have any other material conflict of interest at the time of publication of the research report or at the time of public appearance? No
DYANMIC/its Associates/ Research Analyst/ his Relative have received any compensation from the subject company in the past twelve months? No
DYANMIC/its Associates/ Research Analyst/ his Relative have managed or co-managed public offering of securities for the subject company in the past twelve months? No
DYANMIC/its Associates/ Research Analyst/ his Relative have received any compensation for investment banking or merchant banking or brokerage services from the subject company in the past twelve months? No
DYANMIC/its Associates/ Research Analyst/ his Relative have received any compensation for products or services other than investment banking or merchant banking or brokerage services from the subject company in the past twelve months? No
DYANMIC/its Associates/ Research Analyst/ his Relative have received any compensation or other benefits from the Subject Company or third party in connection with the research report? No
DYANMIC/its Associates/ Research Analyst/ his Relative have served as an officer, director or employee of the subject company? No
DYANMIC/its Associates/ Research Analyst/ his Relative have been engaged in market making activity for the subject company? No
General Disclaimer: - This Research Report (hereinafter called “Report”) is meant solely for use by the recipient and is not for circulation. This Report does not constitute a personal recommendation or take into account the particular investment objectives, financial situations, or needs of individual clients. The recommendations, if any, made herein are expression of views and/or opinions and should not be deemed or construed to be neither advice for the purpose of purchase or sale of any security, derivatives or any other security through Dynamic nor any solicitation or offering of any investment /trading opportunity on behalf of the issuer(s) of the respective security (ies) referred to herein. These information / opinions / views are not meant to serve as a professional investment guide for the readers. No action is solicited based upon the information provided herein. Recipients of this Report should rely on information/data arising out of their own investigations. Readers are advised to seek independent professional advice and arrive at an informed trading/investment decision before executing any trades or making any investments. This Report has been prepared on the basis of publicly available information, internally developed data and other sources believed by Dynamic to be reliable. Dynamic or its directors, employees, affiliates or representatives do not assume any responsibility for, or warrant the accuracy, completeness, adequacy and reliability of such information / opinions / views. While due care has been taken to ensure that the disclosures and opinions given are fair and reasonable, none of the directors, employees, affiliates or representatives of Dynamic shall be liable for any direct, indirect, special, incidental, consequential, punitive or exemplary damages, including loss profits arising in any way whatsoever from the information / opinions / views contained in this Report. The price and value of the investments referred to in this Report and the income from them may go down as well as up, and investors may realize losses on any investments. Past performance is not a guide for future performance. Dynamic levels do not provide tax advice to its clients, and all investors are strongly advised to consult with their tax advisers regarding taxation aspects of any potential investment. Opinions expressed are our current opinions as of the date appearing on this Research only. We do not undertake to advise you as to any change of our views expressed in this Report. User should keep this risk in mind and not hold dynamic levels, its employees and associates responsible for any losses, damages of any type whatsoever. Dynamic and its associates or employees may; (a) from time to time, have long or short positions in, and buy or sell the investments in/ security of company (ies) mentioned herein and it may not be construed as potential conflict of interest with respect to any recommendation and related information and opinions. Without limiting any of the foregoing, in no event shall Dynamic and its associates or employees or any third party involved in, or related to computing or compiling the information have any liability for any damages of any kind. We and our affiliates/associates, officers, directors, and employees, Research Analyst(including relatives) worldwide may: (a) from time to time, have long or short positions in, and buy or sell the securities thereof, of company (ies) mentioned herein or (b) be engaged in any other transaction involving such securities and earn brokerage or other compensation or act as a market maker in the financial instruments of the subject company/company (ies) discussed herein or act as advisor to such company (ies) or have other potential/material conflict of interest with respect to any recommendation and related information and opinions at the time of publication of Research Report. Dynamic may have proprietary long/short position in the above mentioned scrip(s) and therefore may be considered as interested. The views provided herein are general in nature and does not consider risk appetite or investment objective of particular investor; readers are requested to take independent professional advice before investing. This should not be construed as invitation or solicitation to do business with Dynamic. Dynamic Equities Pvt. Ltd. are also engaged in Proprietary Trading apart from Client Business.
https://www.dynamiclevels.com/en/disclaimer


![[XLS]manage.kimsonline.co.krmanage.kimsonline.co.kr/UFolder/GovNews/식약처... · Web viewTeva API India Ltd. A-2, A-2/1, A-2/2, UPSIDC Industrial Area, Bijnor Road, Gajraula-244235](https://img.dokumen.tips/doc/110x75/5ad9afbd7f8b9a6d318badb7/xls-web-viewteva-api-india-ltd-a-2-a-21-a-22-upsidc-industrial.jpg)


![[XLS] 2016.xls · Web viewA-2, A-2/1, A-2/2, UPSIDC Industrial Area, Bijnor Road, Gajraula M/s. Teva Pharmaceuticals Industries Ltd. Famciclovir Fluvastatin Sodium Olanzapine Irbesartan](https://img.dokumen.tips/doc/110x75/5ad9afbd7f8b9a6d318badbd/xls-2016xlsweb-viewa-2-a-21-a-22-upsidc-industrial-area-bijnor-road-gajraula.jpg)
![ßf'k{kklnuÞ] 17] jkÅt ,oU;] ubfnYyh& 110 002 oclkbV7351002810 NOBLE PUBLIC SCHOOL DELHI ROAD GAJRAULA, UTTAR PRADESH, INDIA Received 44. NEETI TALWAR neeti.talwar@springdaleeducati](https://img.dokumen.tips/doc/110x75/5e7af10d2d52ee71ca076ea6/fkkklnu-17-jkt-ou-ubfnyyh-110-002-7351002810-noble-public-school.jpg)