Embed Size (px)
Citation preview
Dust storms – what do they really cost?
P. TozerA,B and J. LeysC,D,E
AUniversity of New England, Armidale, NSW 2350, Australia.BSchool of Economic Sciences, Washington State University, Pullman, WA 99164-6210, USA.CNSW Office of Environment and Heritage, Gunnedah, NSW 2380, Australia.DAtmospheric Environment Research Centre, Griffith University, Brisbane, Qld, Australia.ECorresponding author. Email: [email protected]
Abstract. Dust storms are frequent in Australia and can have a large impact on the soil resource, the economy and people.There have been few economic studies of the impact of wind erosion worldwide and only one in Australia before this study.While wind erosion impacts on the soil resource at the point of the erosion, the level of economic impact rises as thepopulation and associated infrastructure affected by dust increases. This study estimates the impact on the economy of thestate of New SouthWales of a single large dust storm called Red Dawn that passed over the eastern coast of Australia on 23September 2009. Estimates for rural and urban areas are presented with both on- and off-site costs evaluated. The estimatedcost isA$299million (with a rangeofA$293–A$313million)withmost of the cost being associatedwithhousehold cleaningand associated activities. The dust storm also impacted onmany cities on the coast of the state of Queensland, but their costsare not included in this study. This study demonstrates some, but not all, of the major economic costs associated with winderosion in Australia. Given the annual average cost of dust storms it is suggested that A$9million per year would be aconservative estimate of the level of investment required in rural areas for dustmitigation strategies, based on improved landmanagement that could be justified to achieve a positive impact on soil condition and reduce economic losses in rural townsand the more populous coastal cities.
Additional keywords: dust storms, ecosystem services, Red Dawn, resource economics, soil erosion, Sydney dust storm2009, wind erosion.
Received 22 October 2012, accepted 1 May 2013, published online 5 June 2013
Introduction
Dust storms are the result of soil erosion by wind. They causeconsiderable economic and physical damage both at their site oforigin (e.g. the farm paddock, Leys and McTainsh 1994) anddownwind as they deposit unwanted dust and reduce air quality(Chan et al. 2005). On-site damage occurs through the loss of topsoil, which can result in lowering of the soil surface and scalding,and loss of soil nutrients, organicmatter and soil carbon (Leys andMcTainsh 1994; Leys 2002). Windblown sand can also damagevegetation by burying it or abrading and sand-blasting it off(Bennell et al. 2007).On-site damagecanalsooccur byburyingorsand-blasting infrastructure such as fencing and watering pointsfor livestock (Huszar and Piper 1986).
Off-site damage occurs downwind where dust can drasticallylimit human activities, including closure of transport networksand increased accidents caused by low visibility (Ekhtesasi andSepehr 2009), health impacts (Miri et al. 2009), loss of sales bybusinesses and damage to utility systems, such as electricity linesand transformers, or buildings. Deposited dust also increasescleaning costs and can damage high-value crops (e.g. vegetables)(Huszar and Piper 1986; Williams and Young 1999). Themagnitude of the off-site impact of dust events is to some
extent determinedby thenumberofpeople affectedor the locationof significant damage or interruptions to infrastructure services,such as transport facilities. Ai and Polenske (2008) suggested thatthe impacts of dust storms in China are higher in cities, such asBeijing, due to the large populations and the level of infrastructureand economic activity in these areas, when compared with ruralregions where population and infrastructure levels are lower.
Wind erosion and dust storms can also have several positiveeffects downwind of the erosion site. These benefits are soil andnutrient deposition on land and onwater. Dust fromwind erosionwhen deposited downwind contributes to soil build up in theseareas (McTainsh 1989). This deposited dust also carries organiccarbon and nutrients, such as nitrogen or phosphorus, whichcontribute positively to soil health (Raupach et al. 1994; Cattleet al. 2009). Nutrients in dust can also be used by variousmicroorganisms in the oceans, such as phytoplankton (Boyd et al.2004), perhaps leading to increased fish stocks and the other soilcomponents contribute to marine sediments (Hesse andMcTainsh 2003).
Much is understood about the physical aspects ofwind erosionand dust storms but very few economic studies have beenundertaken, even in countries regularly affected by dust storms.
Journal compilation � Australian Rangeland Society 2013 Open Access www.publish.csiro.au/journals/trj
CSIRO PUBLISHING
The Rangeland Journal, 2013, 35, 131–142http://dx.doi.org/10.1071/RJ12085
There has only been one study of the economic impact of winderosion in Australia (Williams and Young 1999). Their report onthe costs of dust in South Australia, included health costs, andincorporating mortality and morbidity costs, concluded that amajor cost of dust from wind erosion in South Australia wasdue to adverse health effects, particularly on the portion of thepopulation that suffered from respiratory diseases, especiallyasthma sufferers.
This is only the second study of the economic impact of winderosion in Australia after that of Williams and Young (1999).Both studies rely on the North American research of Huszar andPiper (1986) because of the difficulty of obtaining objectiveeconomic data for wind erosion and dust storms in particular. Thescarcity of dust storms in urban areas with large populations inAustralia makes the collection of objective data difficult.Additionally, there has been no on-going research into theeconomics of wind erosion, particularly the off-site impacts. Thishas resulted in a lack of survey data collected shortly after duststorms have occurred, and so this work is confined to the 23September 2009 dust storm, denoted Red Dawn by local media,for which a range of data and information is available.
This study calculates the economic impact of a largeAustralian dust storm (Red Dawn) on the economy of NewSouth Wales (NSW), focusing on off-site costs incurred inSydney. The analysis is extended to regional areas, usingMildura as an example, where smaller more frequent dust eventsoccur. The analysis outlines how the impact of dust stormsvaries between urban and regional areas as a function ofpopulation and infrastructure. The study does not attempt tofully analyse the on-site costs associated with soil loss, lostagricultural production and/or production potential, althoughan estimate is provided based on previous work using off-sitedata. Finally, the study considers the investment in strategiesof erosion control and improved land management practicesin rural areas that the economic cost of dust storms mightjustify.
Methods
Impact cost model
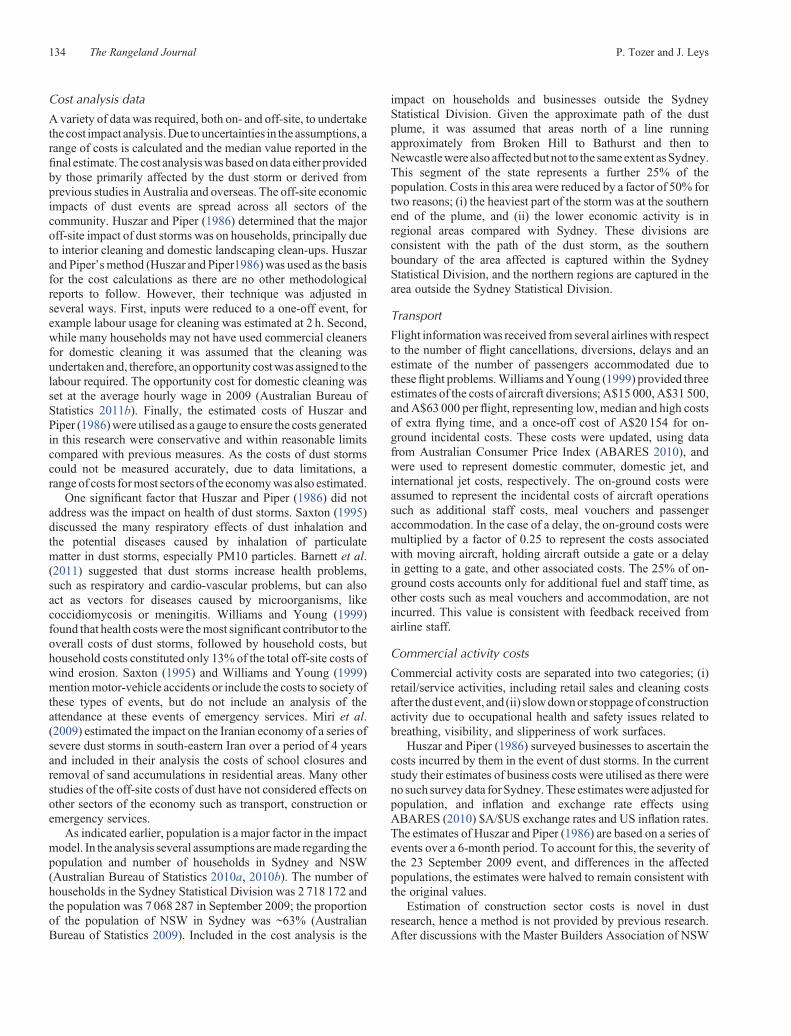
The economic impact of dust storms is strongly driven by thepopulation and the associated infrastructure of large urbanareas, as suggested by Ai and Polenske (2008). This concept isillustrated in Fig. 1. This figure shows three damage curves – fora city and two rural locations. The graph does not have a scaleas it is for illustrative purposes only. Although the severity of adust storm, as measured by dust concentration, may be similar inall locations, due to lower populations and absolute levels ofinfrastructure and economic activity the impact in regionalareas (A1 or A2) would be lower than that in cities (B). Thedifference between points A1, A2 and B varies with the shape ofthe damage curves. Larger rural centres such as Wagga Waggaor Mildura (A2), would have a curve (Rural 2) closer to theshape of the city curve, whereas smaller centres, such asBalranald or Tilpa (A1), may have a curve (Rural 1) below thatof the Rural 2 curve. The essential point is that the shape ofthe three damage functions, City, Rural 1 and Rural 2, determinethe relative impact of a dust storm of equal severity on eachlocation.
Measuring costs
Measuring the costs associated with dust storms requiresknowledge of the frequency and severity of dust storms and theimpacts of these storms on the economy. A large storm such asRed Dawn caused major disruptions to many sectors of theeconomy.Dust storms of similar or slightly lower severity, whichmay not reach major population centres, but affect smallerregional centres at more regular intervals still impact on theeconomy of the region, but at a lower level (Fig. 1). However, thecumulative effect of many smaller events may still be significant;hence the need to know both the severity and frequency of dustevents.
To apply the model of impact costs, data on dust severity andfrequency is required along with economic data on the cost ofinterruption to, or increased demand for, services. Information ondust severity and frequency was obtained for both a rural(Buronga, near Mildura, Victoria) and an urban (Sydney, NSW)site (Fig. 2). Buronga was chosen as the rural site because(i) it has the longest rural dust concentration record in Australiaand (ii) is a rural city with a known dust storm history. Sydneywas chosen as it had a dust (air quality) record, and the mosteconomic and other data available as a result of the recent RedDawn event.
Severity and frequency of dust events
Two data sources were used, one rural from DustWatch (www.environment.nsw.gov.au/dustwatch/, accessed 5 May 2013) andone urban (www.environment.nsw.gov.au/aqms/, accessed 5May 2013). Data on major dust events has been collected forthe last 22 years at the Buronga DustWatch site near Mildura.The best data (i.e. daily sampling) is from the period March2001 to thepresent. Prior toMarch2001, the sampleswereweekly
Economicimpact
Rural 2
Rural 1
Dust severity
City
B
A2
A1
0
Fig. 1. Impact of dust storms on different populations or regions, Rural 1,Rural 2 and City are damage functions in rural areas and metropolitanregions, respectively. A1, A2 and B are the impacts in small rural towns, largerural cities, and metropolitan areas, respectively.
132 The Rangeland Journal P. Tozer and J. Leys
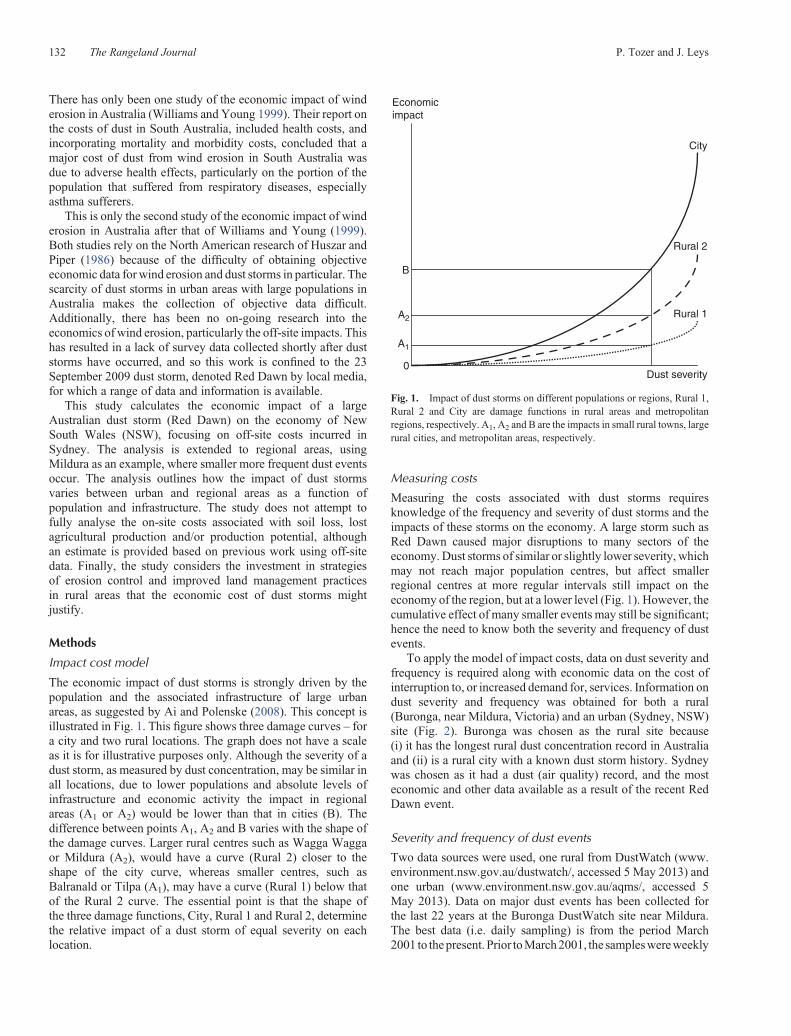
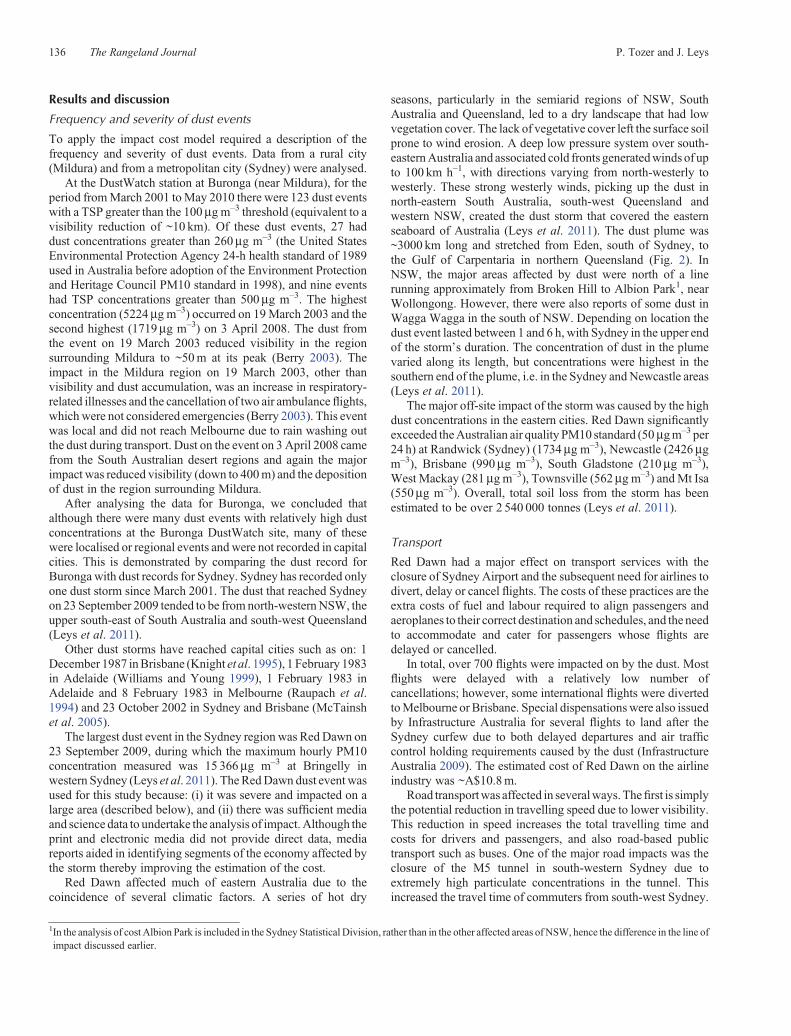
or when dust events were known to be coming. The 2001–10period was extremely dry in eastern Australia and so thefrequency of dust events at Buronga is above the average. Thetime series was used to identify major dust events, definedas those with total suspended particles (TSP) greater than100mgm–3 (Fig. 3).
Records of TSP are not available for Sydney but ParticulateMatter <10mm (PM10) is available from 1994. During duststorms the mass component of PM10 is about half that of theTSP, so a dust event was said to have occurred when Burongarecorded a TSP >100mg m–3 and Sydney recorded a PM10>50mgm–3.
Northern Territory
South Australia
Mildura Sydney
Queensland
New South Wales
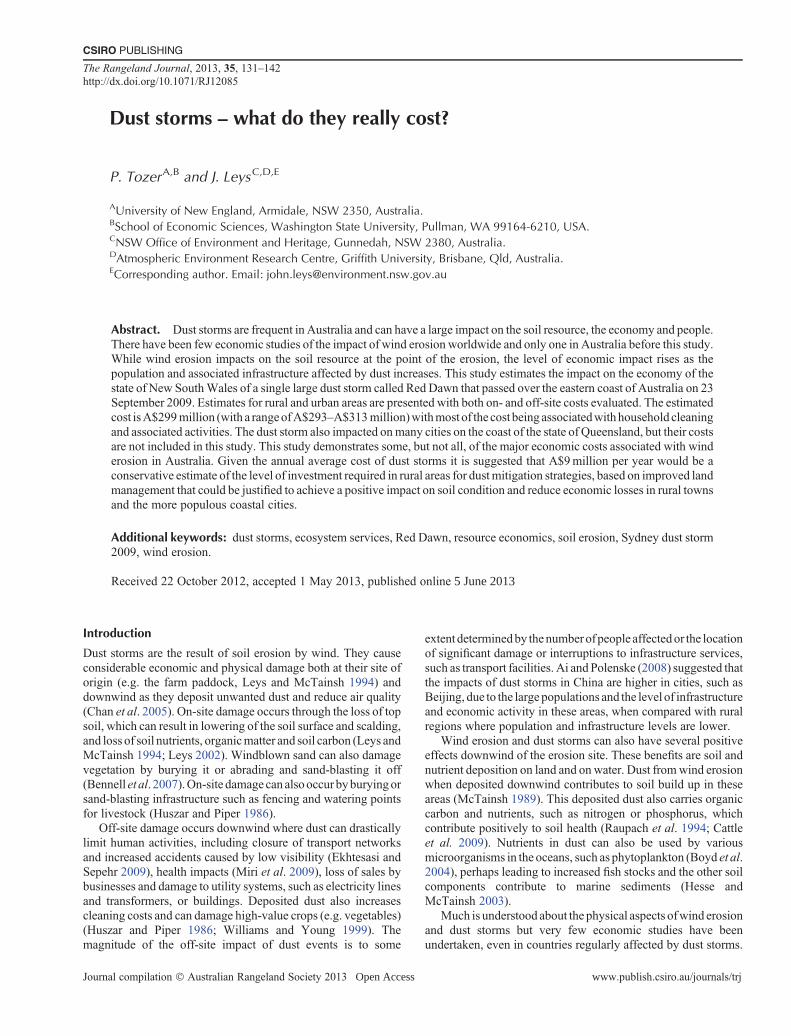
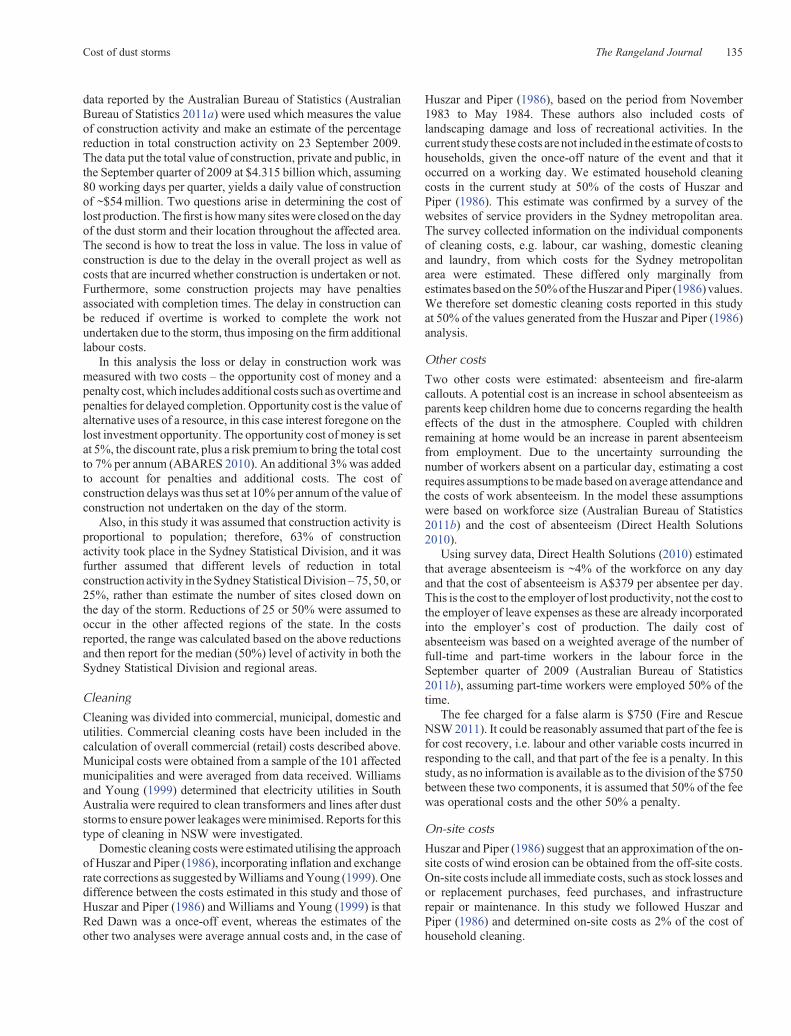
Fig. 2. MODIS image for 0000 UTC 23 September 2009 showing the Red Dawn dust storm plume extendingfrom south of Sydney to the north of Queensland.
0
200
400
600
800
1000
TS
P (
µg m
–3)
5223 1365 1798
30/1
2/19
89
30/1
2/19
90
30/1
2/19
91
30/1
2/19
92
30/1
2/19
93
30/1
2/19
94
30/1
2/19
95
30/1
2/19
96
30/1
2/19
97
30/1
2/19
98
30/1
2/19
99
30/1
2/20
00
30/1
2/20
01
30/1
2/20
02
30/1
2/20
03
30/1
2/20
04
30/1
2/20
05
30/1
2/20
06
30/1
2/20
07
30/1
2/20
08
30/1
2/20
09
30/1
2/20
10
30/1
2/20
11
30/1
2/20
12
Fig. 3. Total suspended particulate (TSP) matter concentrations at Buronga DustWatch site. Dashed line denotes TSP of100mg m–3. Numbers at top of graph indicate the measured TSP level for that day above the maximum y-axis value.
Cost of dust storms The Rangeland Journal 133
Cost analysis data
Avariety of data was required, both on- and off-site, to undertakethe cost impact analysis.Due touncertainties in the assumptions, arange of costs is calculated and the median value reported in thefinal estimate. The cost analysiswas basedondata either providedby those primarily affected by the dust storm or derived fromprevious studies in Australia and overseas. The off-site economicimpacts of dust events are spread across all sectors of thecommunity. Huszar and Piper (1986) determined that the majoroff-site impact of dust storms was on households, principally dueto interior cleaning and domestic landscaping clean-ups. Huszarand Piper’smethod (Huszar and Piper1986) was used as the basisfor the cost calculations as there are no other methodologicalreports to follow. However, their technique was adjusted inseveral ways. First, inputs were reduced to a one-off event, forexample labour usage for cleaning was estimated at 2 h. Second,while many households may not have used commercial cleanersfor domestic cleaning it was assumed that the cleaning wasundertaken and, therefore, anopportunity costwas assigned to thelabour required. The opportunity cost for domestic cleaning wasset at the average hourly wage in 2009 (Australian Bureau ofStatistics 2011b). Finally, the estimated costs of Huszar andPiper (1986)were utilised as a gauge to ensure the costs generatedin this research were conservative and within reasonable limitscompared with previous measures. As the costs of dust stormscould not be measured accurately, due to data limitations, arange of costs formost sectors of the economywas also estimated.
One significant factor that Huszar and Piper (1986) did notaddress was the impact on health of dust storms. Saxton (1995)discussed the many respiratory effects of dust inhalation andthe potential diseases caused by inhalation of particulatematter in dust storms, especially PM10 particles. Barnett et al.(2011) suggested that dust storms increase health problems,such as respiratory and cardio-vascular problems, but can alsoact as vectors for diseases caused by microorganisms, likecoccidiomycosis or meningitis. Williams and Young (1999)found that health costswere themost significant contributor to theoverall costs of dust storms, followed by household costs, buthousehold costs constituted only 13% of the total off-site costs ofwind erosion. Saxton (1995) and Williams and Young (1999)mentionmotor-vehicle accidents or include the costs to society ofthese types of events, but do not include an analysis of theattendance at these events of emergency services. Miri et al.(2009) estimated the impact on the Iranian economy of a series ofsevere dust storms in south-eastern Iran over a period of 4 yearsand included in their analysis the costs of school closures andremoval of sand accumulations in residential areas. Many otherstudies of the off-site costs of dust have not considered effects onother sectors of the economy such as transport, construction oremergency services.
As indicated earlier, population is a major factor in the impactmodel. In the analysis several assumptions aremade regarding thepopulation and number of households in Sydney and NSW(Australian Bureau of Statistics 2010a, 2010b). The number ofhouseholds in the Sydney Statistical Division was 2 718 172 andthe population was 7 068 287 in September 2009; the proportionof the population of NSW in Sydney was ~63% (AustralianBureau of Statistics 2009). Included in the cost analysis is the
impact on households and businesses outside the SydneyStatistical Division. Given the approximate path of the dustplume, it was assumed that areas north of a line runningapproximately from Broken Hill to Bathurst and then toNewcastlewere also affectedbutnot to the sameextent asSydney.This segment of the state represents a further 25% of thepopulation. Costs in this area were reduced by a factor of 50% fortwo reasons; (i) the heaviest part of the storm was at the southernend of the plume, and (ii) the lower economic activity is inregional areas compared with Sydney. These divisions areconsistent with the path of the dust storm, as the southernboundary of the area affected is captured within the SydneyStatistical Division, and the northern regions are captured in thearea outside the Sydney Statistical Division.
Transport
Flight informationwas received from several airlineswith respectto the number of flight cancellations, diversions, delays and anestimate of the number of passengers accommodated due totheseflight problems.Williams andYoung (1999) provided threeestimates of the costs of aircraft diversions; A$15 000, A$31 500,and A$63 000 per flight, representing low, median and high costsof extra flying time, and a once-off cost of A$20 154 for on-ground incidental costs. These costs were updated, using datafrom Australian Consumer Price Index (ABARES 2010), andwere used to represent domestic commuter, domestic jet, andinternational jet costs, respectively. The on-ground costs wereassumed to represent the incidental costs of aircraft operationssuch as additional staff costs, meal vouchers and passengeraccommodation. In the case of a delay, the on-ground costs weremultiplied by a factor of 0.25 to represent the costs associatedwith moving aircraft, holding aircraft outside a gate or a delayin getting to a gate, and other associated costs. The 25% of on-ground costs accounts only for additional fuel and staff time, asother costs such as meal vouchers and accommodation, are notincurred. This value is consistent with feedback received fromairline staff.
Commercial activity costs
Commercial activity costs are separated into two categories; (i)retail/service activities, including retail sales and cleaning costsafter thedust event, and (ii) slowdownor stoppageof constructionactivity due to occupational health and safety issues related tobreathing, visibility, and slipperiness of work surfaces.
Huszar and Piper (1986) surveyed businesses to ascertain thecosts incurred by them in the event of dust storms. In the currentstudy their estimates of business costs were utilised as there wereno such surveydata forSydney.These estimateswere adjusted forpopulation, and inflation and exchange rate effects usingABARES (2010) $A/$US exchange rates and US inflation rates.The estimates of Huszar and Piper (1986) are based on a series ofevents over a 6-month period. To account for this, the severity ofthe 23 September 2009 event, and differences in the affectedpopulations, the estimates were halved to remain consistent withthe original values.
Estimation of construction sector costs is novel in dustresearch, hence a method is not provided by previous research.After discussions with the Master Builders Association of NSW
134 The Rangeland Journal P. Tozer and J. Leys
data reported by the Australian Bureau of Statistics (AustralianBureau of Statistics 2011a) were used which measures the valueof construction activity and make an estimate of the percentagereduction in total construction activity on 23 September 2009.The data put the total value of construction, private and public, inthe September quarter of 2009 at $4.315 billion which, assuming80 working days per quarter, yields a daily value of constructionof ~$54million. Two questions arise in determining the cost oflost production. Thefirst is howmany siteswere closed on the dayof the dust storm and their location throughout the affected area.The second is how to treat the loss in value. The loss in value ofconstruction is due to the delay in the overall project as well ascosts that are incurred whether construction is undertaken or not.Furthermore, some construction projects may have penaltiesassociated with completion times. The delay in construction canbe reduced if overtime is worked to complete the work notundertaken due to the storm, thus imposing on the firm additionallabour costs.
In this analysis the loss or delay in construction work wasmeasured with two costs – the opportunity cost of money and apenalty cost,which includes additional costs such as overtime andpenalties for delayed completion. Opportunity cost is the value ofalternative uses of a resource, in this case interest foregone on thelost investment opportunity. The opportunity cost of money is setat 5%, the discount rate, plus a risk premium to bring the total costto 7% per annum (ABARES 2010). An additional 3%was addedto account for penalties and additional costs. The cost ofconstruction delays was thus set at 10% per annum of the value ofconstruction not undertaken on the day of the storm.
Also, in this study it was assumed that construction activity isproportional to population; therefore, 63% of constructionactivity took place in the Sydney Statistical Division, and it wasfurther assumed that different levels of reduction in totalconstruction activity in theSydneyStatisticalDivision–75, 50, or25%, rather than estimate the number of sites closed down onthe day of the storm. Reductions of 25 or 50% were assumed tooccur in the other affected regions of the state. In the costsreported, the range was calculated based on the above reductionsand then report for the median (50%) level of activity in both theSydney Statistical Division and regional areas.
Cleaning
Cleaning was divided into commercial, municipal, domestic andutilities. Commercial cleaning costs have been included in thecalculation of overall commercial (retail) costs described above.Municipal costs were obtained from a sample of the 101 affectedmunicipalities and were averaged from data received. Williamsand Young (1999) determined that electricity utilities in SouthAustralia were required to clean transformers and lines after duststorms to ensure power leakageswereminimised. Reports for thistype of cleaning in NSW were investigated.
Domestic cleaning costswere estimated utilising the approachof Huszar and Piper (1986), incorporating inflation and exchangerate corrections as suggested byWilliams andYoung (1999).Onedifference between the costs estimated in this study and those ofHuszar and Piper (1986) and Williams and Young (1999) is thatRed Dawn was a once-off event, whereas the estimates of theother two analyses were average annual costs and, in the case of
Huszar and Piper (1986), based on the period from November1983 to May 1984. These authors also included costs oflandscaping damage and loss of recreational activities. In thecurrent study these costs arenot included in the estimate of costs tohouseholds, given the once-off nature of the event and that itoccurred on a working day. We estimated household cleaningcosts in the current study at 50% of the costs of Huszar andPiper (1986). This estimate was confirmed by a survey of thewebsites of service providers in the Sydney metropolitan area.The survey collected information on the individual componentsof cleaning costs, e.g. labour, car washing, domestic cleaningand laundry, from which costs for the Sydney metropolitanarea were estimated. These differed only marginally fromestimates basedon the50%of theHuszar andPiper (1986) values.We therefore set domestic cleaning costs reported in this studyat 50% of the values generated from the Huszar and Piper (1986)analysis.
Other costs
Two other costs were estimated: absenteeism and fire-alarmcallouts. A potential cost is an increase in school absenteeism asparents keep children home due to concerns regarding the healtheffects of the dust in the atmosphere. Coupled with childrenremaining at home would be an increase in parent absenteeismfrom employment. Due to the uncertainty surrounding thenumber of workers absent on a particular day, estimating a costrequires assumptions to bemade based on average attendance andthe costs of work absenteeism. In the model these assumptionswere based on workforce size (Australian Bureau of Statistics2011b) and the cost of absenteeism (Direct Health Solutions2010).
Using survey data, Direct Health Solutions (2010) estimatedthat average absenteeism is ~4% of the workforce on any dayand that the cost of absenteeism is A$379 per absentee per day.This is the cost to the employer of lost productivity, not the cost tothe employer of leave expenses as these are already incorporatedinto the employer’s cost of production. The daily cost ofabsenteeism was based on a weighted average of the number offull-time and part-time workers in the labour force in theSeptember quarter of 2009 (Australian Bureau of Statistics2011b), assuming part-time workers were employed 50% of thetime.
The fee charged for a false alarm is $750 (Fire and RescueNSW2011). It could be reasonably assumed that part of the fee isfor cost recovery, i.e. labour and other variable costs incurred inresponding to the call, and that part of the fee is a penalty. In thisstudy, as no information is available as to the division of the $750between these two components, it is assumed that 50% of the feewas operational costs and the other 50% a penalty.
On-site costs
Huszar and Piper (1986) suggest that an approximation of the on-site costs of wind erosion can be obtained from the off-site costs.On-site costs include all immediate costs, such as stock losses andor replacement purchases, feed purchases, and infrastructurerepair or maintenance. In this study we followed Huszar andPiper (1986) and determined on-site costs as 2% of the cost ofhousehold cleaning.
Cost of dust storms The Rangeland Journal 135
Results and discussion
Frequency and severity of dust events
To apply the impact cost model required a description of thefrequency and severity of dust events. Data from a rural city(Mildura) and from a metropolitan city (Sydney) were analysed.
At the DustWatch station at Buronga (near Mildura), for theperiod fromMarch 2001 toMay 2010 there were 123 dust eventswith a TSP greater than the 100mg m–3 threshold (equivalent to avisibility reduction of ~10 km). Of these dust events, 27 haddust concentrations greater than 260mg m–3 (the United StatesEnvironmental Protection Agency 24-h health standard of 1989used in Australia before adoption of the Environment Protectionand Heritage Council PM10 standard in 1998), and nine eventshad TSP concentrations greater than 500mg m–3. The highestconcentration (5224mg m–3) occurred on 19March 2003 and thesecond highest (1719mg m–3) on 3 April 2008. The dust fromthe event on 19 March 2003 reduced visibility in the regionsurrounding Mildura to ~50m at its peak (Berry 2003). Theimpact in the Mildura region on 19 March 2003, other thanvisibility and dust accumulation, was an increase in respiratory-related illnesses and the cancellation of two air ambulance flights,whichwere not considered emergencies (Berry 2003). This eventwas local and did not reach Melbourne due to rain washing outthe dust during transport. Dust on the event on 3 April 2008 camefrom the South Australian desert regions and again the majorimpact was reduced visibility (down to 400m) and the depositionof dust in the region surrounding Mildura.
After analysing the data for Buronga, we concluded thatalthough there were many dust events with relatively high dustconcentrations at the Buronga DustWatch site, many of thesewere localised or regional events and were not recorded in capitalcities. This is demonstrated by comparing the dust record forBuronga with dust records for Sydney. Sydney has recorded onlyone dust storm since March 2001. The dust that reached Sydneyon 23 September 2009 tended to be fromnorth-westernNSW, theupper south-east of South Australia and south-west Queensland(Leys et al. 2011).
Other dust storms have reached capital cities such as on: 1December 1987 inBrisbane (Knight et al. 1995), 1 February 1983in Adelaide (Williams and Young 1999), 1 February 1983 inAdelaide and 8 February 1983 in Melbourne (Raupach et al.1994) and 23 October 2002 in Sydney and Brisbane (McTainshet al. 2005).
The largest dust event in the Sydney region was RedDawn on23 September 2009, during which the maximum hourly PM10concentration measured was 15 366mg m–3 at Bringelly inwestern Sydney (Leys et al. 2011). TheRedDawn dust event wasused for this study because: (i) it was severe and impacted on alarge area (described below), and (ii) there was sufficient mediaand science data to undertake the analysis of impact.Although theprint and electronic media did not provide direct data, mediareports aided in identifying segments of the economy affected bythe storm thereby improving the estimation of the cost.
Red Dawn affected much of eastern Australia due to thecoincidence of several climatic factors. A series of hot dry
seasons, particularly in the semiarid regions of NSW, SouthAustralia and Queensland, led to a dry landscape that had lowvegetation cover. The lack of vegetative cover left the surface soilprone to wind erosion. A deep low pressure system over south-easternAustralia and associated cold fronts generatedwinds of upto 100 km h–1, with directions varying from north-westerly towesterly. These strong westerly winds, picking up the dust innorth-eastern South Australia, south-west Queensland andwestern NSW, created the dust storm that covered the easternseaboard of Australia (Leys et al. 2011). The dust plume was~3000 km long and stretched from Eden, south of Sydney, tothe Gulf of Carpentaria in northern Queensland (Fig. 2). InNSW, the major areas affected by dust were north of a linerunning approximately from Broken Hill to Albion Park1, nearWollongong. However, there were also reports of some dust inWagga Wagga in the south of NSW. Depending on location thedust event lasted between 1 and 6 h, with Sydney in the upper endof the storm’s duration. The concentration of dust in the plumevaried along its length, but concentrations were highest in thesouthern end of the plume, i.e. in the Sydney andNewcastle areas(Leys et al. 2011).
The major off-site impact of the storm was caused by the highdust concentrations in the eastern cities. Red Dawn significantlyexceeded theAustralian air quality PM10 standard (50mgm–3 per24 h) at Randwick (Sydney) (1734mg m–3), Newcastle (2426mgm–3), Brisbane (990mg m–3), South Gladstone (210mg m–3),West Mackay (281mg m–3), Townsville (562mg m–3) andMt Isa(550mg m–3). Overall, total soil loss from the storm has beenestimated to be over 2 540 000 tonnes (Leys et al. 2011).
Transport
Red Dawn had a major effect on transport services with theclosure of Sydney Airport and the subsequent need for airlines todivert, delay or cancel flights. The costs of these practices are theextra costs of fuel and labour required to align passengers andaeroplanes to their correct destination and schedules, and the needto accommodate and cater for passengers whose flights aredelayed or cancelled.
In total, over 700 flights were impacted on by the dust. Mostflights were delayed with a relatively low number ofcancellations; however, some international flights were divertedtoMelbourne or Brisbane. Special dispensationswere also issuedby Infrastructure Australia for several flights to land after theSydney curfew due to both delayed departures and air trafficcontrol holding requirements caused by the dust (InfrastructureAustralia 2009). The estimated cost of Red Dawn on the airlineindustry was ~A$10.8m.
Road transportwas affected in severalways.Thefirst is simplythe potential reduction in travelling speed due to lower visibility.This reduction in speed increases the total travelling time andcosts for drivers and passengers, and also road-based publictransport such as buses. One of the major road impacts was theclosure of the M5 tunnel in south-western Sydney due toextremely high particulate concentrations in the tunnel. Thisincreased the travel time of commuters from south-west Sydney.
1In the analysis of cost Albion Park is included in the Sydney Statistical Division, rather than in the other affected areas of NSW, hence the difference in the line ofimpact discussed earlier.
136 The Rangeland Journal P. Tozer and J. Leys
However, given the number of workers absent on the day of thestorm, traffic delays may not have occurred in other parts of theSydney region. Data from the NSW Roads and MaritimeAuthority (RMA) indicated that on the dayof the storm therewere~5% fewer cars on major Sydney roads compared with thesame day in the weeks before and after the event (NSW RMA,pers. comm. 2012). Therefore, no cost for impacts on roadtransport is included in the total cost of the storm.
Commercial activity costs
These costs include the impacts on retail activities and theconstruction sector. In thecaseof retail purchases, themajor effectwould be on discretional expenditures, such as coffee shoppurchases, asmany discretional purchasesmay not be undertakenon other days. The impacts on non-discretional expenditure, i.e.essential purchases, such as food, may be large on the day of theevent, but much of the reduced expenditure would be recoveredin subsequent days. Losses in commercial activity amountedto A$8.4million in the Sydney Statistical Division andA$1.7million in the regions outside the Sydney area. These costscapture the loss in revenue from lower retail and service sales,costs of cleaning premises, and losses in productivity due to thedust reducing activity such as transport and outside/outdoorwork. These two values equate to ~5% of the daily retail turnoverin the September quarter of 2009 (Australian Bureau of Statistics2011c).
The cost to the construction industry, estimated as the cost ofinvestment opportunities foregone together with penalties andadditional costs, ranged from A$1.2 to A$3.2million and themedian value of A$2.4million was used. The median value isbased on a reduction in total construction activity of 50% in boththe Sydney Statistical Division and regional areas.
Cleaning
Cleaning costs may be separated into four categories;commercial, municipal, domestic and utilities. Commercialcleaning costs are included in the commercial activity costs in thepreceding section. Municipal and domestic cleaning costs wereestimated separately. There were no reports in NSW associatedwith cleaning electricity utilities and so these costs, if any, are notincluded in this analysis.
Based on data supplied, most municipalities either did notincur significant additional costs to clean up after the dust stormor incurred costs that were not directly measurable. Themunicipalities reported that cleaning after the dust event wasundertaken by crews that would have otherwise been employedon other tasks and, therefore, the costs incurred are due to latercompletion times of other projects, or that cleaning wascompleted in the normal course of regular cleaning cycles.Information from several councils indicated that some specificcleaning costs were incurred, mostly for higher profile locations,and these averaged ~A$2000 per council. In this case it wasassumed that all councils incurred some minor costs of cleaningand the average ofA$2000was used across all 101municipalitiesaffected, yielding a total cost of A$202 000.
Estimates for domestic cleaning costs per person yielded avalue of A$115 per household. These costs include cleaning andlaundry, car washing and repairs, i.e. new air filters, and water for
washing down surfaces, as well as a cost of labour for sweepingandother cleaningactivities.On thedayafter thedust storm,waterrestrictions in Sydney region were relaxed to allow householdsandbusinesses to clean andwashdownsurfaces etc. (Costa2009).On the 2 days following the dust storm, daily water use increasedby 260 Ml and 280 Ml, respectively, or 20%, above the averageuse for 2008 (1310Ml) and 2010 (1285Ml) (SCA2011). In 2009,water for domestic use was valued at A$1.87 kl–1; thus additionalwater cost users ~A$1million or ~A$0.60 per household. At acost of A$115 per household, the total cost to households inthe Sydney Statistical Division was A$196.5million, andA$58.3million to households elsewhere in NSW.
Media reports indicated that many car owners did wash theircars on or after the event, and our survey of car washing sitesshowed that the average cost of a carwash inSydney, in 2009,was~A$35 per car. However, our estimate of domestic cleaning costsdid not include items such as caravans, boats or private swimmingpools. One estimate suggested that the cost was ~A$1000 perpool. These items were not included as there was (i) no reliableestimate of the number of items in the region, and (ii) noinformation on the respective cleaning costs. Whileacknowledging the uncertainty of the estimates, due to the itemsnot included it is believed that they are not unrealistic.
Other costs included
Media reports for the day suggested absentee rates were 25%higher than the daily average of 4% (Hohenboken 2009), whichequates to a 5% absentee rate. However, since the level ofabsenteeism is uncertain, and some associated costs have beencaptured in the loss in value of construction, the costs for threelevels of absenteeism – 4.5, 5 and 6% – were estimated. Thesevalues represent the lowest, most likely and highest levels ofabsenteeism thought to have resulted from the event. Theassociated costs were, respectively, A$2.5, A$7.5 andA$17.3million. The lowest (4.5%) and highest (6%) ratesrepresent lower/higher increases in absenteeism that may haveoccurred but were not observable. Also, included in theabsenteeism costs are the costs of carer absenteeism for health-related issues.
One minor cost included is that of false fire alarm calloutsdirectly attributable to dust activation of alarms. NSW Fire andRescue reported a substantial increase in false alarms on 23September 2009 – 504 additional alarm callouts compared with2008. At an estimated direct cost of A$375 per callout, theseadditional calls represented a cost of A$189 000 to the service.
Off-site costs not estimated
In previous studies, motor vehicle accidents and health costs havebeen included in the costs of dust storms, see for exampleWilliams and Young (1999) or Saxton (1995). However, datareceived from various sources suggest that there was no increasein motor-vehicle accidents in the Sydney metropolitan area on23 September 2009 (NSW Roads and Traffic Authority, pers.comm.). Indeed, data from the NSWRoads and Traffic Authorityindicate that there may have been a reduction in accidents onthat day, possibly attributable in part to the higher workerabsenteeism and reduced traffic volumes.
Cost of dust storms The Rangeland Journal 137
With respect to health costs, the Bureau of Health Information(Bureau of Health Information 2010) reports that there was nosignificant increase in emergency room visits or hospitaladmissions in the week of the Red Dawn event when comparedwith 2008 or 2010. However, this does not indicate thatrespiratory problems did not affect certain groups within thepopulation, e.g. asthma patients. It merely indicates that, if aproblem did arise, these patients may have treated themselves orat least did not seek emergency department treatment. Severalstudies in Australia and the US have shown that in some casesincreasing rural dust does not lead to increased hospitaladmissions (Schwartz et al. 1999; Rutherford et al. 2003).
One possible reason for the minimal impact of the dust stormon health could be the proactive role of the Department of Healthand the then Department of Environment, Climate Change andWater with respect to air-quality monitoring and issuance ofhealth alerts due to poor air quality. On the day of the dust storm,Health Alert SMS and emails were sent to subscribers to thehealth-alert system advising of a high pollution-level event.Alerts were sent from 02.00 to 09.00 hours on the morning of thestorm (S. Quigley, pers comm.), thus those at risk could makeindividual decisions regarding the impact of the dust level on theirhealth.
On-site costs
Due to thecomplexityof the interactionsbetween soil, vegetation,animal andplant productionand the lackofdata for on-site costs, avalue of 2% of the costs of household cleaning was used as thebasis for determining on-site costs based on the calculations ofHuszar and Piper (1986). Therefore, the estimated on-site costsare ~A$5.1million. On-site costs incurred by landowners wouldinclude repairs or reconstruction of farm infrastructure such asfences,water facilities, and roadsor tracks.Additional costs couldalso be incurred by stock-owners for fodder to replace thatdestroyed by the dust storm, for sale of stock necessitated by theloss of feed or fences, or by the direct loss of stock. Thesewere thetypes of costs included in a Natural Disaster Relief Assistancesubmission to the NSW Government by the PastoralistsAssociation of West Darling (Kelly 2009). They estimated thecost ofdamage fromRedDawn to their area atA$4.5million.Thiscost was only for NSW producers and did not include thoseadjacent parts of South Australia affected by the wind erosion orthe costs associated with soil loss, vegetation and decline in soilquality and the impact on future production. It must, therefore, beviewed as a very conservative cost estimate.
A comprehensive analysis of on-site costs would requirequantification of variables such as: amount of soil loss, thenutrient value of soil lost, the recovery rate of lost nutrients, short-term loss of crop, pasture and animal production, and estimates ofthe reduced production potential associated with the soil andnutrient loss. While such an analysis would require a substantialmodelling effort, and is beyond the scope of this paper, estimatesof some of the components can be made readily.
The calculation of soil lost is possible via modelling andmeasurement. Leys et al. (2011) estimated from dustconcentration measurements on the east coast of Australia that2.54million tonnes of dust were lost. Application of theComputational Environmental Management System wind
erosion model (CEMSYS version 5) (Shao et al. 2007) tocalculate the soil loss in the dust storm source area (i.e. dustemission plus dust deposition) resulted in an estimate of3.45million tonnes. The difference in the two estimates isacceptable since the modelled result is for the area erodedand the measured result is for the mass lost off the coast.Unfortunately there is no published method for valuing a tonneof soil loss.
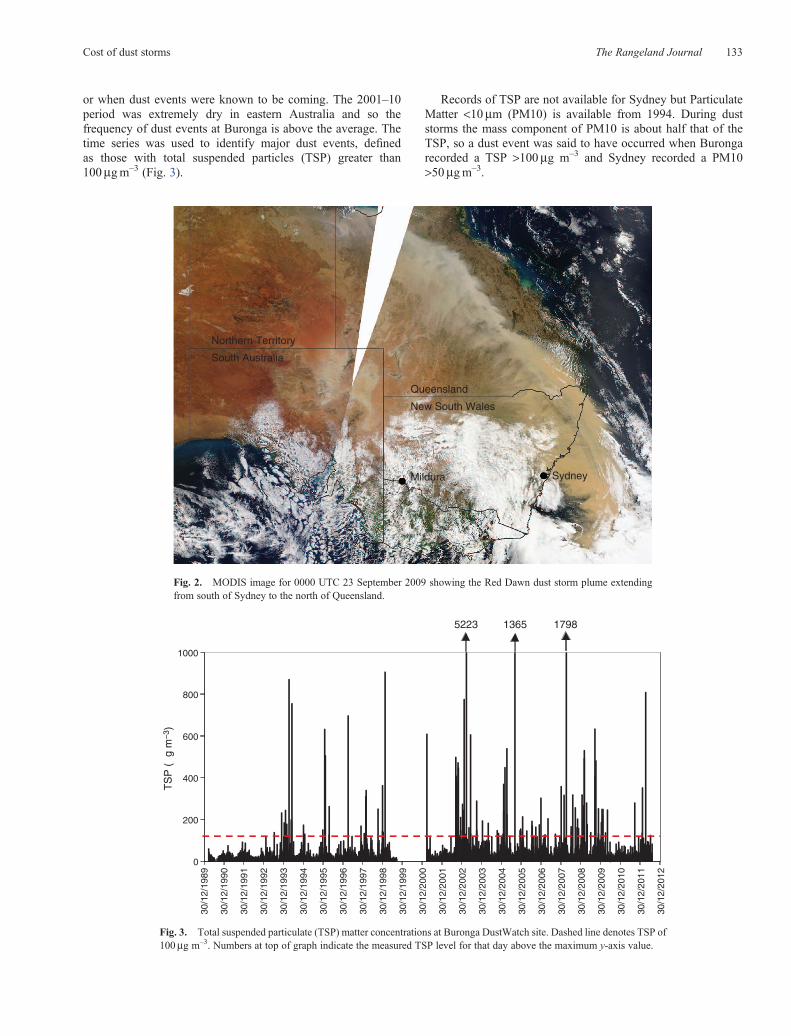
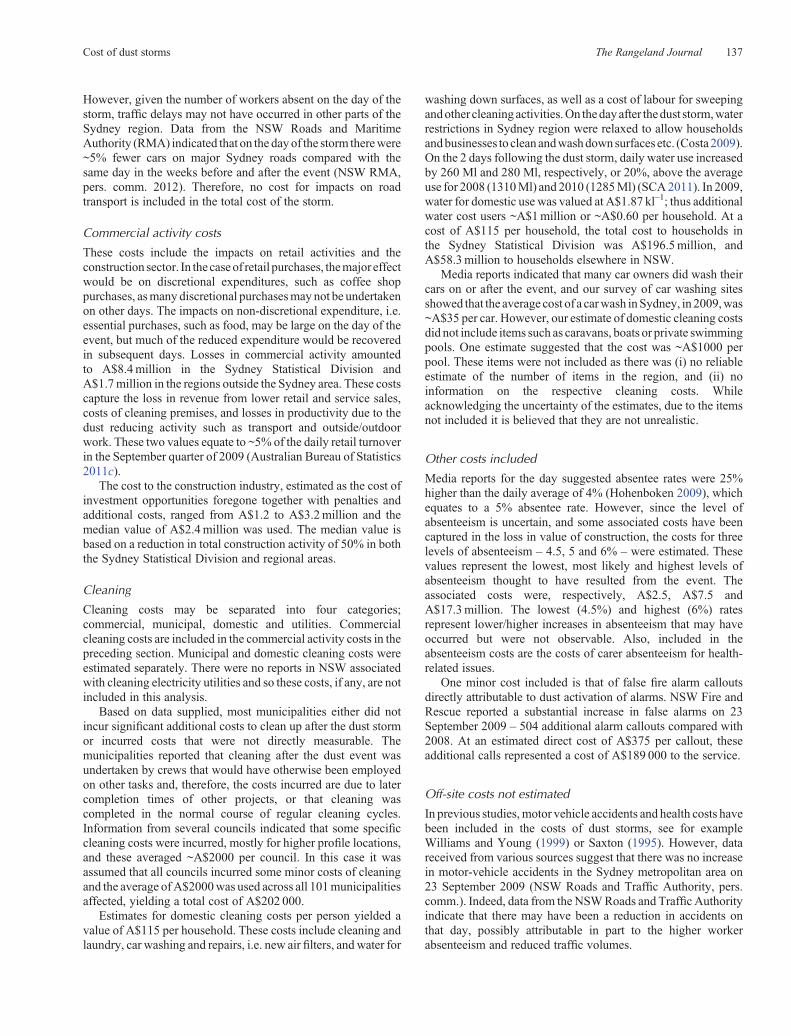
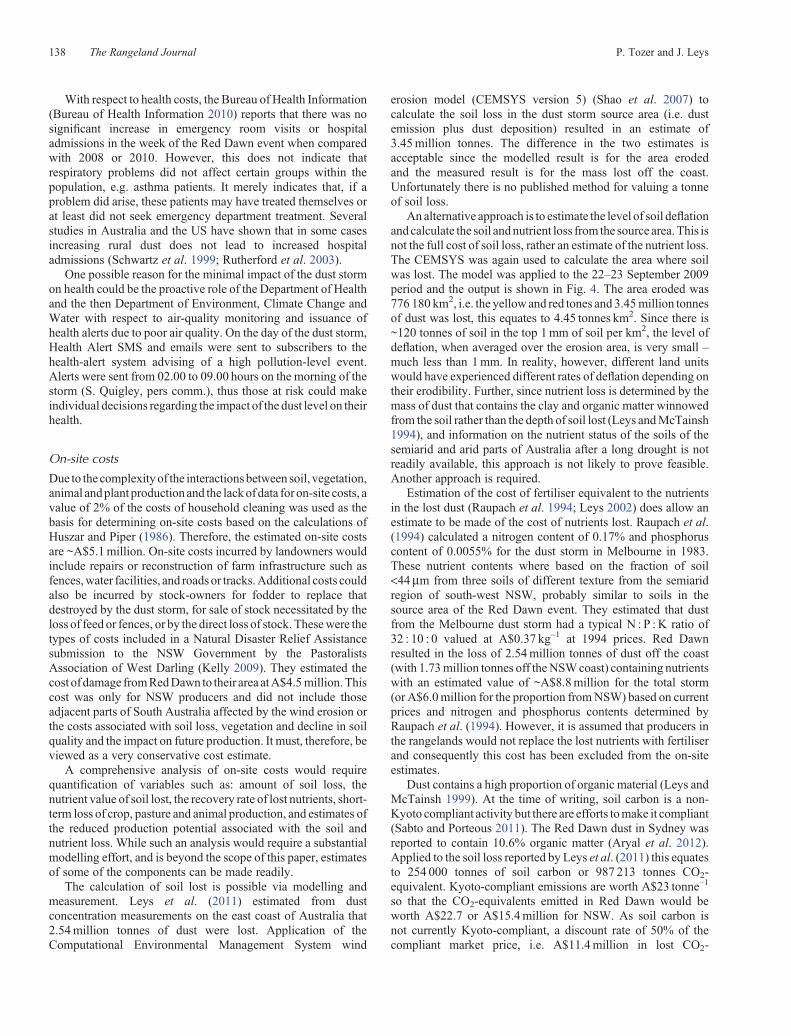
An alternative approach is to estimate the level of soil deflationandcalculate the soil andnutrient loss from the source area. This isnot the full cost of soil loss, rather an estimate of the nutrient loss.The CEMSYS was again used to calculate the area where soilwas lost. The model was applied to the 22–23 September 2009period and the output is shown in Fig. 4. The area eroded was776 180 km2, i.e. the yellowand red tones and 3.45million tonnesof dust was lost, this equates to 4.45 tonnes km2. Since there is~120 tonnes of soil in the top 1mm of soil per km2, the level ofdeflation, when averaged over the erosion area, is very small –much less than 1mm. In reality, however, different land unitswould have experienced different rates of deflation depending ontheir erodibility. Further, since nutrient loss is determined by themass of dust that contains the clay and organic matter winnowedfrom the soil rather than the depth of soil lost (Leys andMcTainsh1994), and information on the nutrient status of the soils of thesemiarid and arid parts of Australia after a long drought is notreadily available, this approach is not likely to prove feasible.Another approach is required.
Estimation of the cost of fertiliser equivalent to the nutrientsin the lost dust (Raupach et al. 1994; Leys 2002) does allow anestimate to be made of the cost of nutrients lost. Raupach et al.(1994) calculated a nitrogen content of 0.17% and phosphoruscontent of 0.0055% for the dust storm in Melbourne in 1983.These nutrient contents where based on the fraction of soil<44mm from three soils of different texture from the semiaridregion of south-west NSW, probably similar to soils in thesource area of the Red Dawn event. They estimated that dustfrom the Melbourne dust storm had a typical N : P : K ratio of32 : 10 : 0 valued at A$0.37 kg–1 at 1994 prices. Red Dawnresulted in the loss of 2.54million tonnes of dust off the coast(with 1.73million tonnes off theNSWcoast) containing nutrientswith an estimated value of ~A$8.8million for the total storm(or A$6.0million for the proportion fromNSW) based on currentprices and nitrogen and phosphorus contents determined byRaupach et al. (1994). However, it is assumed that producers inthe rangelands would not replace the lost nutrients with fertiliserand consequently this cost has been excluded from the on-siteestimates.
Dust contains a high proportion of organic material (Leys andMcTainsh 1999). At the time of writing, soil carbon is a non-Kyoto compliant activity but there are efforts tomake it compliant(Sabto and Porteous 2011). The Red Dawn dust in Sydney wasreported to contain 10.6% organic matter (Aryal et al. 2012).Applied to the soil loss reported by Leys et al. (2011) this equatesto 254 000 tonnes of soil carbon or 987 213 tonnes CO2-equivalent. Kyoto-compliant emissions are worth A$23 tonne–1
so that the CO2-equivalents emitted in Red Dawn would beworth A$22.7 or A$15.4million for NSW. As soil carbon isnot currently Kyoto-compliant, a discount rate of 50% of thecompliant market price, i.e. A$11.4million in lost CO2-
138 The Rangeland Journal P. Tozer and J. Leys
equivalents forRedDawn orA$7.7million forNSW, is assumed.The total on-site cost for NSW, excluding fertiliser, is estimatedat A$12 800 000.
Potential benefits of dust storm
Several benefits could be generated by the dust storm althoughmeasuring some of these may be extremely difficult. The first isthe deposition of sediment (McTainsh 1989) and nutrients in thedust (Cattle et al. 2009) on land in the path of the dust storm.Nutrients in the dust could provide some benefit to landholders inthe form of increased nutrient application at no cash cost. At thestate-wide scale of this study, however, soil and nutrients havesimply been redistributed, with the exception of that dust thatleaves the coast. While there may be losses and benefits toindividual landholders, there is no benefit to the state overall, onlya loss as described in the preceding section.
A second benefit could result from the value of the nutrient-laden soil to sea life. Nutrients in the dust, particularly iron,when deposited on the ocean provide additional nutrients forphytoplankton growth, leading to increased feedstock for othersea life (Cropp et al. 2005) and possibly an increase in fish stocks.However, the timehorizon for this benefit is difficult todetermine.
A potential third benefit is that of carbon sequestration byphytoplankton after fertilisation of the ocean water with iron-richdust (Blain et al. 2007). Measurement of any of these potentialbenefits is difficult and beyond the scope of this paper.
Impacts of dust events on a smaller community
The impact costmodel (Fig. 1) indicates that the costs of anygivenevent to a rural community are lower than for a large urban area.Using the method described above, it is possible to estimate thecost of dust storms on a smaller rural community.Mildura is usedas an example of such a community and two of the major dustevents identified in Fig. 3, those of March 2003 and April 2008,are considered as theywere of a similar or greater intensity to RedDawn. In the Mildura statistical area, the numbers of householdsin the censuses of 2001 and 2006 were 16 496 and 17 770,respectively (Australian Bureau of Statistics 2006). Given themagnitudeof thedust stormson these twodates, it is assumed theyhad a similar impact on the Mildura community as on the non-Sydney population.
The estimated costs of the events in 2003and2008wereA$1.6and A$1.9million, respectively. The cost of the event in 2003includes the cost of a traffic accident reported in the media.
Net soil loss over the 22nd–23rd September 20090.15
0.10
0.05
0
–0.05
–0.10
t km–2 h–1
0 500 1000 km
Fig. 4. Modelled data showing area of soil loss (red and yellow tones) and areas of dust deposition (blue areas) forRed Dawn (22–23 September 2009) (Butler and Pudmenzky 2012).
Cost of dust storms The Rangeland Journal 139
However, as for the Red Dawn event the major costs are those ofdomestic cleaning and the impacts on commercial activities, witha minor impact on the construction sector. The major differencebetween the Red Dawn event and events in the Mildura region isthe frequency of occurrence. In the rural region the number ofevents with significant dust levels is much higher than in Sydneyand the associated costs can, therefore, accumulate over time.Figure 3 indicates that another major dust event occurred in 2005and many smaller events in 2002–03, 2005 and 2009–10. It wasassumed that a comparable level of cleaning to Red Dawn isrequired for events with a TSP greater than 1000mg m–3 and halfthat level for those with a TSP greater than 260mg m–3 but lessthan 1000mgm–3. The region has experienced three events with aTSP greater than 1000mg m–3 and a further 27 events with a TSPgreater than 260mg m–3 since records commenced (Fig. 3). Thetotal costs in the Mildura region are, therefore, ~A$30millionover a period of 10 years, or ~A$3.0million per year excludinghealth costs or the losses in agricultural production due to sand-blasting of crops or loss of stock and infrastructure in agriculturalregions. This figure would thus represent a conservative estimateof the average annual cost incurred by the community due towinderosion and could greatly underestimate the actual cost in anygiven year.
Summary of costs
A summary of the costs estimated above is presented inTable 1. The total costs to the NSW economy of the Red Dawndust storm of 23 September 2009 was ~A$299million, with arange of A$293–A$313million depending on assumptionsincluded in total costs. Most of the cost of the dust storm(A$255million) was incurred by households for cleaning andassociated activities. Commercial activities, including retailand service industries, (A$10.1million) were also significantlyaffected along with air transport (A$10.8million) andconstruction (A$2.4million). In the case of commercial andconstruction sectors, these are costs incurred in loss of business,
cleaning, loss in construction time and other direct costs due tothe dust storm. For the transport sectors the costs were due toflight cancellations, diversions and delays, as well as catering forpassengers affected by these factors.
One significant cost not considered in previous research is thecost of absenteeism of employees, and in this study this is~A$7.5million. A minor cost (A$189 000) included was foremergency services responding to false alarms. Two coststhat are not included in this study that others have includedare health and motor vehicle accidents. Although previousresearch has included these costs, the data collected for thisstudy indicated that there were no significant increases inemergency room attendances or accidents on the day of the duststorm.
Off-site costs for a rural city (Mildura) are estimated atA$3million per year noting that Mildura has a much higherfrequency of dust events than Sydney but the economic impactis lower due to the lower population and infrastructure levels.Benefits in terms of nutrient deposition to soils and into theocean are discussed but require further research to obtain ameaningful estimate.
On-site costs were of the order of A$12.8million withA$5.1million for direct costs and A$7.7million for loss oftradeable CO2-equivalents. However, this cost does not includesoil and nutrient loss and the associated production losses whichcould not be estimated by this study.
Finally, this estimate of A$299million is based on NSWalone. Red Dawn also had significant impact on coastal and ruralcities in Queensland (Leys et al. 2011). The cost of the entire duststorm event, which was 3000 km long, would be significantlylarger than theNSW segment of 1000 km but estimating this totalcost is beyond the scope of the current work.
Benefits of abatement measures
One of the aims of this study was to consider the level ofinvestment in strategies of erosion control and improved landmanagement practices in rural areas that might be justified by thecost of dust storms. It was assumed that such investment wouldhelp mitigate the intensity of large dust storms and, therefore,reduce the off-site impacts on the community. It is also assumedthat improvements in land management will not completely stopdust storms but rather reduce their frequency, and moreimportantly their intensity, thus reducing their impact consistentwith the impact cost model (Fig. 1).
A full analysis and discussion of this cost-benefit issue isbeyond the scope of this study but data presented above allowsome preliminary concepts to be put forward. The dust source, inthe Red Dawn event, was from rural areas but its impact was notconfined to local communities; it extended to metropolitan areas.Red Dawn was conservatively estimated to cost the NSWeconomy A$299million (Table 1), mostly in Sydney. Assumingthis type of event occurs once in 50 years, the average annualcost to NSW would be ~A$6million. Thus, if successful dustmitigation programs were undertaken at a cost equal to or lessthan A$9million per year (A$6million for NSW as a whole plusA$3million for Mildura) then savings could be expected inboth on- and off-site costs. This estimate is illustrative only, andhighly conservative, as it is based on only one rural city and
Table 1. Summary of costs to the New South Wales economy for theRed Dawn dust storm of 23 September 2009
Activity Cost (A$)
CleaningHousehold – SSDA 196 500 000Household – otherB 58 300 000Municipal 202 000Transport – air 10 800 000Construction – 50% reduction in activity 2 400 000Commercial 10 100 000Absenteeism – median (5%) 7 500 000
Emergency servicesFire and rescue 189 000Total off-site costs 28 599 1000On-site costs – infrastructure and stock 5 100 000CO2-e losses 7 700 000
Total on-site costs 12 800 000Total costs 298 791 000
ASydney Statistical Division.BOther: all other parts of NSW.
140 The Rangeland Journal P. Tozer and J. Leys
one metropolitan area. It does illustrate, however, that relativelymodest annual investments in improved land managementpractices could have the potential not only to exert a positiveinfluence on the condition of the soil resource and ruraleconomies, but also to deliver benefits to the more populouscoastal and metropolitan areas of NSW.
Further development of policy along these lines will requireconsideration of several issues,which are beyond the scopeof thispaper. Relevant questions will include: (i) do urban communitieshave the right to clean air or do landholders have the right tomanage their land as they see fit in order to achieve businessgoals, (ii) if clean air is deemed a right, then who pays for thisecosystem service to be delivered, and (iii) if there is privatebenefit to the landholder frompublic investment in improved landmanagement practices, what proportion of public investment isappropriate?
Many of the source areas of dust are on private land but thegreat majority in NSW are on public land. Given that the cost ofwind erosion and dust storms is borne by the whole communityand that most of the impact is off-site, it would be reasonable toassume that much of the investment required to mitigate this costcould be from public funding.
Conclusions
Few studies have attempted to measure the economic impact ofdust storms. In this analysis we attempted to capture as many aspossible of the multiple costs or benefits of these events. Theseincluded costsmeasured in previous studies such as domestic andcommercial cleaning, and impacts on transport and retail activity.New costs due to absenteeism, emergency response and loss oftradeable carbon credits were included. Unlike other studies,health and traffic costswere not included as therewas either a lackof data or no evidence of impact.
The differences in off-site impacts of dust storms have beenshown to be dependent on the severity of the dust storm and thelevel of economic activity in the impacted areas. Comparison ofthe economic impacts of storms of approximately the sameseverity on Sydney and Mildura showed that, because of thegreater economic activity in Sydney, the costs there aresignificantly higher. However, regardless of the location of theoff-site impact, the on-site costs are much lower than the off-sitecosts simply due to the level of economic activity affected by thedust.
The cost of the dust storms to both NSW and rural economiessuggest that investment of up toA$9million per year in improvedland management practices in rural NSW could be justified solong as it achieved a substantial reduction in dust storm intensityand frequency. However, policy development in this area willneed to consider several issues related to property rights andpublic versus private benefits and costs.
Acknowledgements
Funding for this project was provided by the Lower Murray–DarlingCatchmentManagementAuthorityundercontractMD250.11.Theauthors areextremely grateful to themany peoplewho provided data to allow completionof this work but who requested that they remain unnamed so that theircompanies, or company’s data, could not be identified. Gratitude is expressedto David Godden and David Buckland, formerly of the Department of
Environment, Climate Change and Water for initial discussions concerningthe project and the approach to take inmeasuring the impacts of the dust storm.OscarCachoof theUniversity ofNewEnglandprovided excellent guidance toaid in the completion of the project and staff from the LowerMurray–DarlingCatchment Management Authority supplied numerous useful suggestions toensure a quality study.We thankDrHarryButler of theUniversity of SouthernQueensland for the CEMSYSmodel output for Red Dawn. Finally, we thankthe two anonymous reviewers and Ron Hacker for comments on ways toimprove the manuscript.
References
ABARES (2010). ‘Australian Commodity Statistics 2010.’ (ABARES:Canberra.)
Ai, N., and Polenske, K. R. (2008). Socio-economic impact analysis ofyellow dust storms: an approach and case study for Beijing. EconomicSystems Research 20, 187–203. doi:10.1080/09535310802075364
Aryal, R., Kandel, D., Acharya, D., Chong, N., and Beecham, S. (2012).Unusual Sydney dust storm and its mineralogical and organiccharacteristics.Environmental Chemistry 9, 537–546. doi:10.1071/EN12131
Australian Bureau of Statistics (2006). ‘Census of Population and Housingin Mildura (VIC) (Statistical District) – Vic. Household Composition.2068.0 – 2006 Census Tables 2006.’ (Australian Bureau of Statistics:Canberra.)
Australian Bureau of Statistics (2009). ‘National Regional Profile: NewSouth Wales.’ (Australian Bureau of Statistics: Canberra.)
Australian Bureau of Statistics (2010a). ‘13381DO012_201012 NSW Stateand Regional Indicators, Dec. 2010.’ (Australian Bureau of Statistics:Canberra.)
Australian Bureau of Statistics (2010b). ‘13381DO006_201012 NSW Stateand Regional Indicators, Dec. 2010.’ (Australian Bureau of Statistics:Canberra.)
Australian Bureau of Statistics (2011a). ‘Value of Building Work Done,By Sector, Current Prices, States and Territories, Original. 8755.0Construction Work Done, Australia, Preliminary.’ (Australian Bureau ofStatistics: Canberra.)
Australian Bureau of Statistics (2011b). ‘Labour Force Status by Sex – NewSouth Wales – Trend, Seasonally Adjusted and Original. 6202.0 LabourForce, Australia.’ (Australian Bureau of Statistics: Canberra.)
Australian Bureau of Statistics (2011c). ‘Retail Turnover by State. 8501.0Retail Trade Australia.’ (Australian Bureau of Statistics: Canberra.)
Barnett, A. G., Fraser, J. E., and Munck, L. (2011). The effects of the 2009dust storm on emergency admissions to a hospital in Brisbane, Australia.International Journal of Biometeorology doi:10.1007/s00484-011-0473-y
Bennell,M.R.,Leys, J. F., andCleugh,H.A. (2007). Sand-blastingdamageofnarrow-leaf lupin (Lupinus angustifolius L.): a field wind tunnelsimulation. Australian Journal of Soil Research 45, 119–128. doi:10.1071/SR06066
Berry, J. (2003). Dust haze blankets Victoria. The Age (March), p. 20.Available at: www.theage.com.au/articles/2003/03/19/1047749825740.html (accessed 2 November 2011).
Blain, S., Queguiner, B., Armand, L., Belviso, S., Bombled, B., Bopp, L.,Bowie, A., Brunet, C., Brussaard, C., Carlotti, F., Christaki, U., Corbiere,A., Durand, I., Ebersbach, F., Fuda, J.-L., Garcia, N., Gerringa, L.,Griffiths, B., Guigue, C., Guillerm, C., Jacquet, S., Jeandel, C., Laan, P.,Lefevre,D., LoMonaco,C.,Malits,A.,Mosseri, J., Obernosterer, I., Park,Y.-H., Picheral,M., Pondaven,P.,Remenyi, T., Sandroni,V., Sarthou,G.,Savoye, N., Scouarnec, L., Souhaut, M., Thuiller, D., Timmermans, K.,Trull, T., Uitz, J., van Beek, P., Veldhuis, M., Vincent, D., Viollier, E.,Vong, L., and Wagener, T. (2007). Effect of natural iron fertilization oncarbon sequestration in the Southern Ocean. Nature 446, 1070–1074.doi:10.1038/nature05700
Cost of dust storms The Rangeland Journal 141
Boyd, P. W., McTainsh, G., Sherlock, V., Richardson, K., Nichol, S.,Ellwood, M., and Frew, R. (2004). Episodic enhancement ofphytoplankton stocks in New Zealand sub-antarctic waters: contributionof atmospheric and oceanic iron supply. Global Biogeochemical Cycles18, 1–23. doi:10.1029/2002GB002020
Bureau of Health Information (2010). ‘Hospital Quarterly: Performanceof NSW Public Hospitals, October to December 2010.’ (Bureau ofInformation: Sydney.)
Butler, H. J., and Pudmenzky, C. (2012). ‘CEMSYSNet Soil Loss (t/km2/hr)for 22 to 23 September 2009 (map), Wind Erosion Extent and SeverityMaps for Australia (computer files) USQ Toowoomba, Queensland,Australia 2012, Using: Matlab R2011b Natick, MA MathWorks 2011.’(USQ: Toowoomba, Qld.)
Cattle, S. R., McTainsh, G. H., and Elias, S. (2009). Æolian dust depositionrates, particle-sizes and contributions to soils along a transect in semi-aridNew South Wales, Australia. Sedimentology 56, 765–783. doi:10.1111/j.1365-3091.2008.00996.x
Chan, Y. C., McTainsh, G. H., Leys, J. F., McGowan, H. A., and Tews, E. K.(2005). Influence of the 23 October 2002 dust storm on the air quality offour Australian cities. Water, Air, and Soil Pollution 164, 329–348.doi:10.1007/s11270-005-4009-0
Costa, P. (2009). Water-wise rules allow clean up following dust storm.Media release. Available at: www.sydneywater.com.au/WhoWeAre/MediaCentre/documents/ministerial/Costa_Water%20Wise%20Rules%20allow%20clean%20up%20following%20dust%20storm_230909.pdf(accessed 10 November 2011).
Cropp, R. A., Gabric, A. J., McTainsh, G. H., and Braddock, R. D. (2005).Coupling between ocean biota and atmospheric aerosols: dust,dimethylsulphide, or artefact? Global Biogeochemical Cycles 19, 1–16.doi:10.1029/2004GB002436
Direct Health Solutions (2010). Direct Health Solutions 2010 ManagementSurvey Summary. Available at: http://dhs.net.au/NewsDetail.aspx?pid=184 (accessed 14 March 2011).
Ekhtesasi,M.R., andSepehr,A. (2009). Investigationofwind erosionprocessfor estimation, prevention, and control of DSS in Yazd–Ardakan plain.Environmental Monitoring and Assessment 159, 267–280. doi:10.1007/s10661-008-0628-4
Fire and Rescue NSW (2011). Charges for false alarms. Available at: www.fire.nsw.gov.au/page.php?id=78 (accessed 22 November 2011).
Hesse, P., and McTainsh, G. H. (2003). Australian dust deposits: modernprocesses and the quaternary record. Quaternary Science Reviews 22,2007–2035. doi:10.1016/S0277-3791(03)00164-1
Hohenboken, A. (2009). Counting the cost of dust storm while cleaners,well, clean up. The Australian, 25 September. Available at: www.theaustralian.com.au/news/counting-cost-of-dust-storm-while-cleaners-well-clean-up/story-e6frg6o6-1225779333884 (accessed 11 May 2011).
Huszar, P. C., and Piper, S. L. (1986). Estimating the off-site costs of winderosion in New Mexico. Journal of Soil and Water Conservation 41,414–416.
Infrastructure Australia (2009). Sydney Airport Curfew Dispensation Report#08/09. Canberra, ACT.
Kelly, T. (2009). Natural Disaster Relief Assistance – Far West New SouthWales Dust Storm. Media release. New South Wales Department ofLands, Sydney.
Knight, A.W.,McTainsh, G. H., and Simpson, R.W. (1995). Sediment loadsin an Australian dust storm: implications for present and past dustprocesses. Catena 24, 195–213. doi:10.1016/0341-8162(95)00026-O
Leys, J. (2002). Erosion by wind, effects on soil quality and productivity. In:‘Encyclopaedia of Soil Science’. (Ed. R. Lal.) pp. 499–502. (MarcelDekker: New York.)
Leys, J. F., andMcTainsh,G.H. (1994). Soil loss and nutrient decline bywinderosion – cause for concern. Australian Journal of Soil and WaterConservation 7, 30–40.
Leys, J. F., and McTainsh, G. H. (1999). Dust and nutrient deposition toriverine environments of south-eastern Australia. Zeitschrift fürGeomorphologie Supplementband 116, 59–76.
Leys, J. F.,Heidenreich, S.K., Strong,C.L.,McTainsh,G.H., andQuigley, S.(2011). PM10 concentrations and mass transport during ‘Red Dawn’Sydney September 2009. Aeolian Research 3, 327–342. doi:10.1016/j.aeolia.2011.06.003
McTainsh, G. H. (1989). Quaternary aeolian dust processes and sediments intheAustralian region.Quaternary Science Reviews8, 235–253. doi:10.1016/0277-3791(89)90039-5
McTainsh,G.H.,Chan,Y.,McGowan,H., Leys, J. F., andTews,E.K. (2005).The 23 October 2002 dust storm in eastern Australia: characteristics andmeteorological conditions. Atmospheric Environment 39, 1227–1236.doi:10.1016/j.atmosenv.2004.10.016
Miri,A.,Hasan,A., Ekhtesasi,M.R., Panjehkeh,N., andGhanbari,A. (2009).Environmental and socio-economic impacts of dust storms in SistanRegion, Iran. The International Journal of Environmental Studies 66,343–355. doi:10.1080/00207230902720170
Raupach,M.,McTainsh, G. H., and Leys, J. F. (1994). Estimates of dustmassin recent major Australian dust storms. Australian Journal of Soil andWater Conservation 7, 20–24.
Rutherford, S.,Macintosh, K. I., Jarvinen, K. A., McTainsh, G. H., and Chan,A. (2003). Characterisation and health impacts of the October 2002 dustevent in Queensland: a preliminary investigation. In: ‘National Clean AirConference: Linking Air Pollution Science, Policy and Management’.23–27November 2003,Newcastle, NSW. (CleanAir Society ofAustraliaand New Zealand: Newcastle.).
Sabto, M., and Porteous, J. (2011). Australia’s carbon farming initiative:a world first. Ecos 160, 1–4.
Saxton, K. E. (1995).Wind erosion and its impact on off-site air quality in theColumbia Plateau – an integrated research plan. Transactions of theAmerican Society of Agricultural Engineers 38, 1031–1038.
SCA (2011). Water storage and supply report. Available at: www.sca.nsw.gov.au/dams-and-water/weekly-storage-and-supply-reports (accessed2 November 2011).
Schwartz, J., Norris, G., Larson, T., Sheppard, L., Claiborne, C., and Koenig,J. (1999). Episodes of high coarse particle concentrations are notassociated with increased mortality. Environmental Health Perspectives107, 339–342. doi:10.1289/ehp.99107339
Shao, Y., Leys, J. F., McTainsh, G. H., and Tews, T. K. (2007). Numericalsimulation of the October 2002 dust event in Australia. Journal ofGeophysical Research 112, D08207. doi:10.1029/2006JD007767
Williams, P., and Young, M. (1999). ‘Costing Dust: How Much Does WindErosion Cost the People of South Australia.’ (CSIRO Land and Water,Policy and Economic Research Unit: Adelaide.)
142 The Rangeland Journal P. Tozer and J. Leys
www.publish.csiro.au/journals/trj