Embed Size (px)
Citation preview
GERALDINE MATCHETT - CFO
Driving Profitable Growth DSM STRATEGY 2018
4 NOVEMBER 2015 AMSTERDAM ROYAL DSM CAPITAL MARKETS DAY
This presentation may contain forward-looking statements with respect to DSM’s future (financial) performance and position. Such statements are based on current expectations, estimates and projections of DSM and information currently available to the company. DSM cautions readers that such statements involve certain risks and uncertainties that are difficult to predict and therefore it should be understood that many factors can cause actual performance and position to differ materially from these statements. DSM has no obligation to update the statements contained in this presentation, unless required by law.
A more comprehensive discussion of the risk factors affecting DSM’s business can be found in the company’s latest Annual Report, which can be found on the company's corporate website, www.dsm.com
Safe harbor statement
Slide 1
Slide 2
Strategy 2018: financial targets & sensitivities
Financial Policies
Wrap-up
1
2
3
Agenda
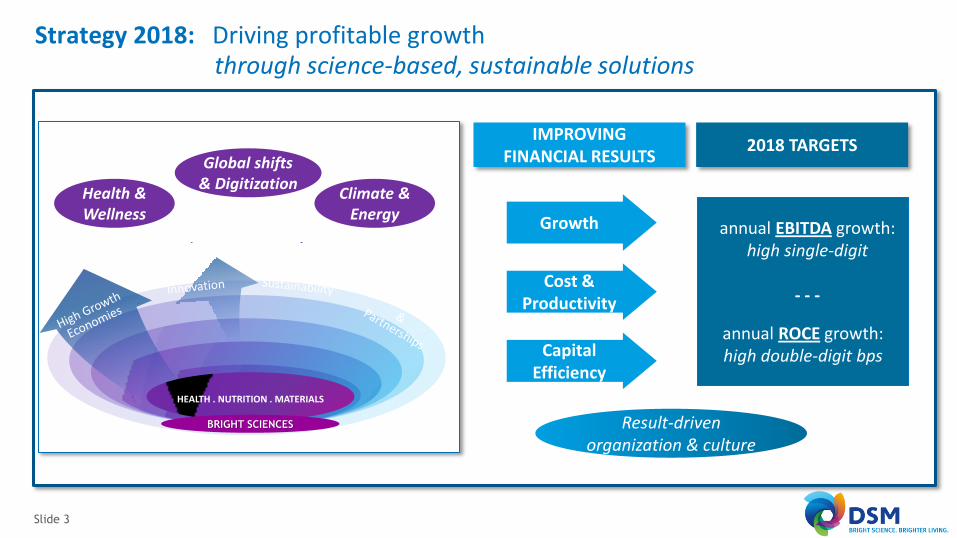
Strategy 2018: Driving profitable growth through science-based, sustainable solutions
Slide 3
HEALTH . NUTRITION . MATERIALS
IMPROVING FINANCIAL RESULTS
Growth
Cost & Productivity
Capital Efficiency
2018 TARGETS
annual EBITDA growth: high single-digit
- - -
annual ROCE growth: high double-digit bps
Health & Wellness
Global shifts & Digitization
Climate & Energy
Result-driven organization & culture
BRIGHT SCIENCES
Above market growth
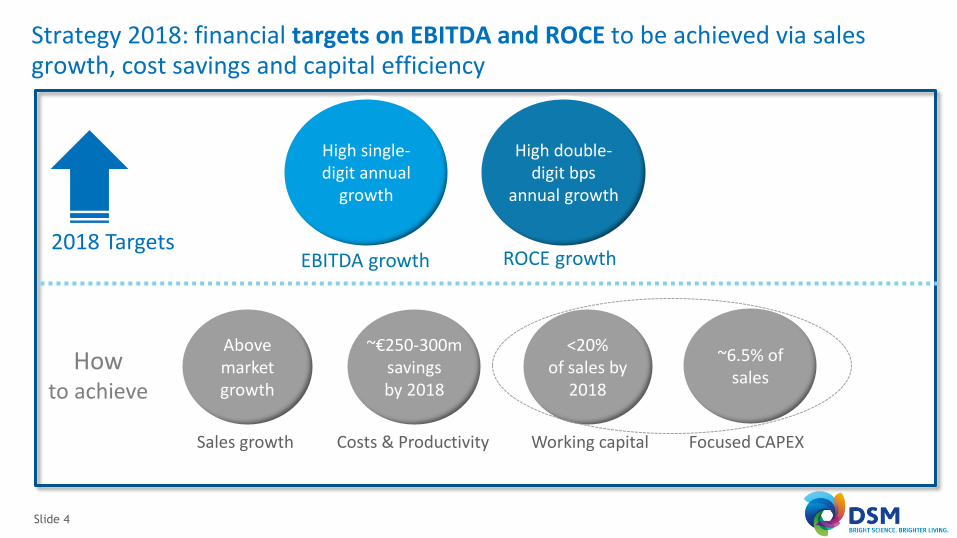
Strategy 2018: financial targets on EBITDA and ROCE to be achieved via sales growth, cost savings and capital efficiency
Slide 4
High single-digit annual
growth
EBITDA growth
High double-digit bps
annual growth
ROCE growth
Sales growth
~€250-300m savings by 2018
Costs & Productivity
<20% of sales by
2018
Working capital
~6.5% of sales
Focused CAPEX
2018 Targets
How to achieve
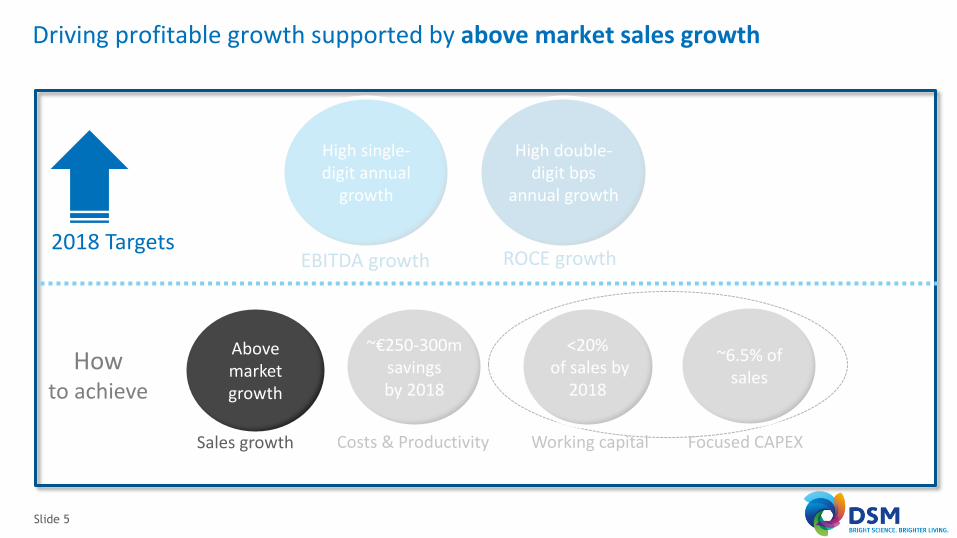
Driving profitable growth supported by above market sales growth
Slide 5
2018 Targets
How to achieve
Above market growth
High single-digit annual
growth
EBITDA growth
High double-digit bps
annual growth
ROCE growth
Sales growth
~€250-300m savings by 2018
Costs & Productivity
<20% of sales by
2018
Working capital
~6.5% of sales
Focused CAPEX
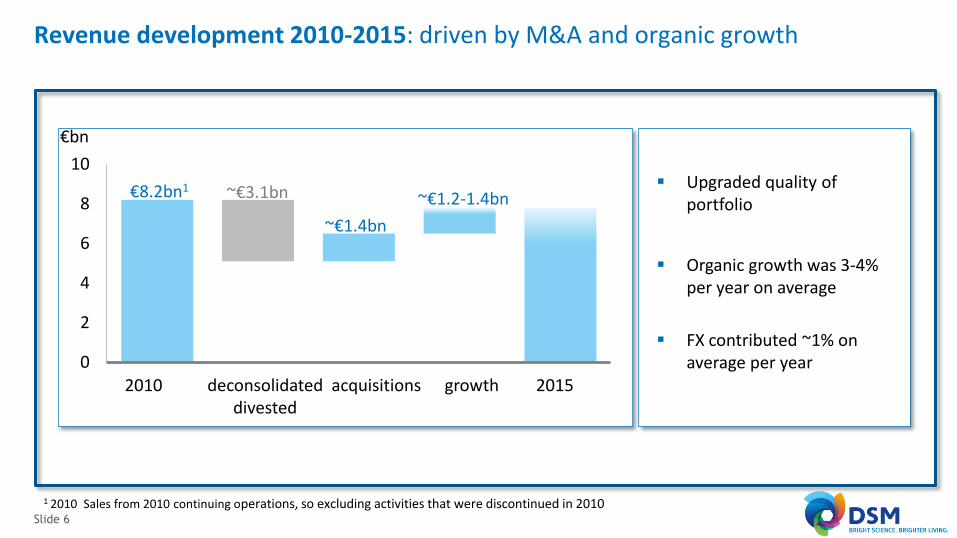
Revenue development 2010-2015: driven by M&A and organic growth
Slide 6
0
2
4
6
8
10
2010
Upgraded quality of portfolio
Organic growth was 3-4% per year on average
FX contributed ~1% on average per year
deconsolidated divested
acquisitions growth 2015
€8.2bn1
~€3.1bn
~€1.4bn
€bn
~€1.2-1.4bn
1 2010 Sales from 2010 continuing operations, so excluding activities that were discontinued in 2010
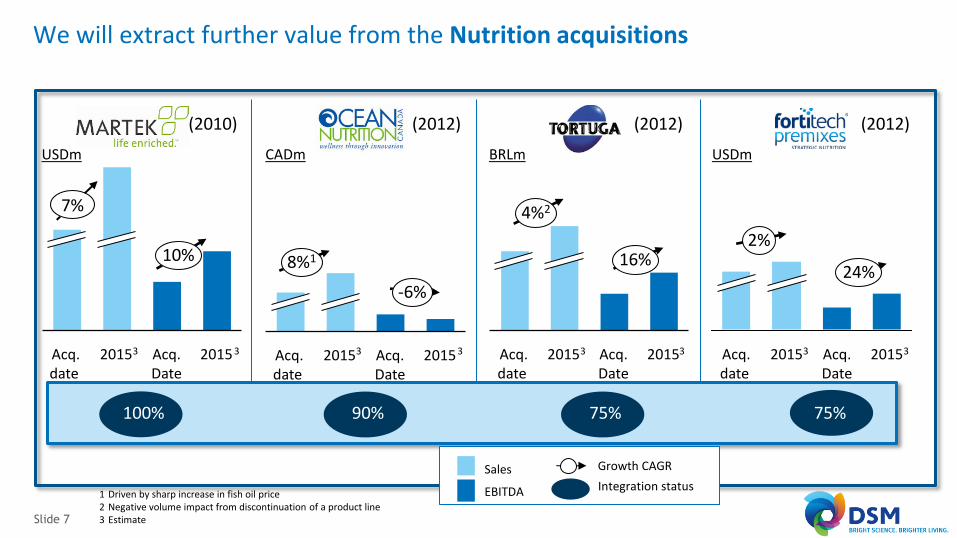
We will extract further value from the Nutrition acquisitions
Slide 7
1 Driven by sharp increase in fish oil price 2 Negative volume impact from discontinuation of a product line 3 Estimate
10%
2015 Acq. Date
2015 Acq. date
USDm
-6%
8%1
2015 Acq. Date
2015 Acq. date
CADm
Acq. Date
2015 Acq. date
16%
4%2
2015
BRLm
2%
24%
2015 Acq. Date
2015 Acq. date
USDm
(2010) (2012) (2012) (2012)
7%
3 3 3 3 3 3 3 3
100% 90% 75% 75%
Growth CAGR
EBITDA
Sales
Integration status
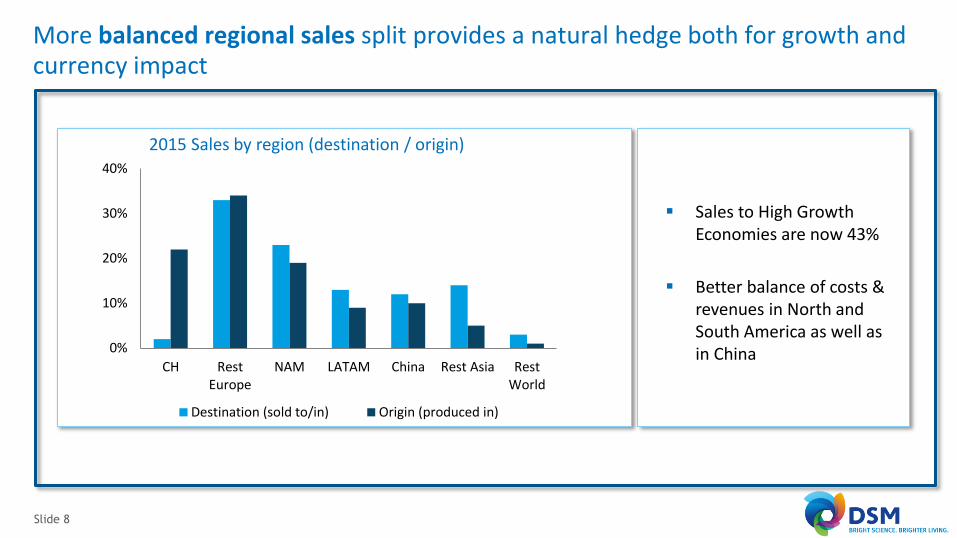
More balanced regional sales split provides a natural hedge both for growth and currency impact
Slide 8
0%
10%
20%
30%
40%
CH RestEurope
NAM LATAM China Rest Asia RestWorld
Destination (sold to/in) Origin (produced in)
2015 Sales by region (destination / origin)
Sales to High Growth Economies are now 43%
Better balance of costs & revenues in North and South America as well as in China
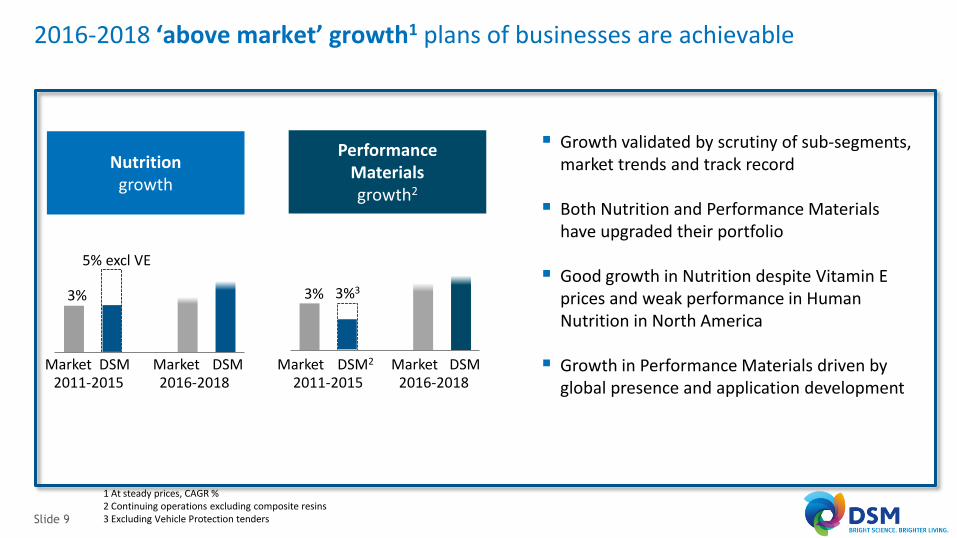
2016-2018 ‘above market’ growth1 plans of businesses are achievable
Slide 9
Nutrition growth
2011-2015 Market DSM
2016-2018 DSM
3%
5% excl VE
Market
Performance Materials growth2
2011-2015 Market DSM2
2016-2018 DSM
3% 3%3
Market
Growth validated by scrutiny of sub-segments, market trends and track record
Both Nutrition and Performance Materials have upgraded their portfolio
Good growth in Nutrition despite Vitamin E prices and weak performance in Human Nutrition in North America
Growth in Performance Materials driven by global presence and application development
1 At steady prices, CAGR % 2 Continuing operations excluding composite resins 3 Excluding Vehicle Protection tenders
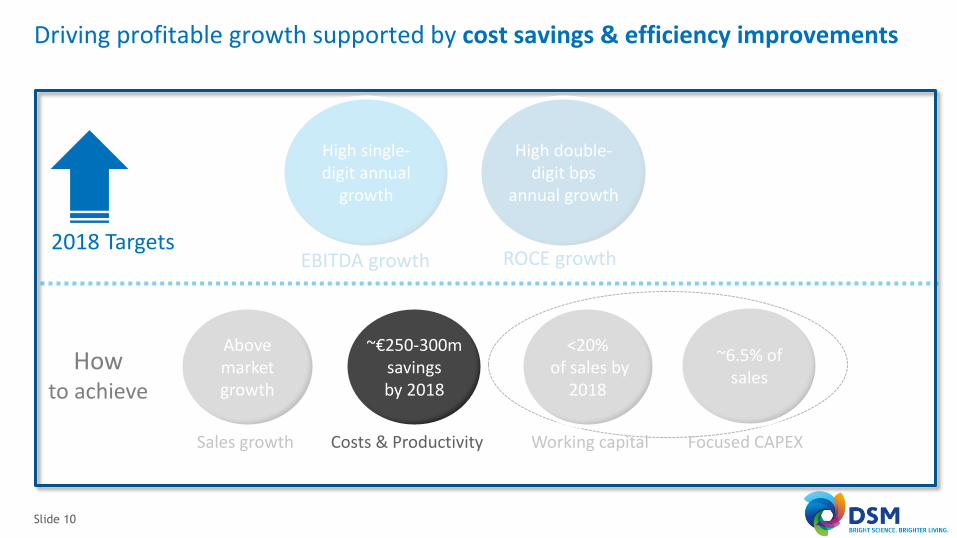
Driving profitable growth supported by cost savings & efficiency improvements
Slide 10
2018 Targets
How to achieve
Above market growth
High single-digit annual
growth
EBITDA growth
High double-digit bps
annual growth
ROCE growth
Sales growth
~€250-300m savings by 2018
Costs & Productivity
<20% of sales by
2018
Working capital
~6.5% of sales
Focused CAPEX
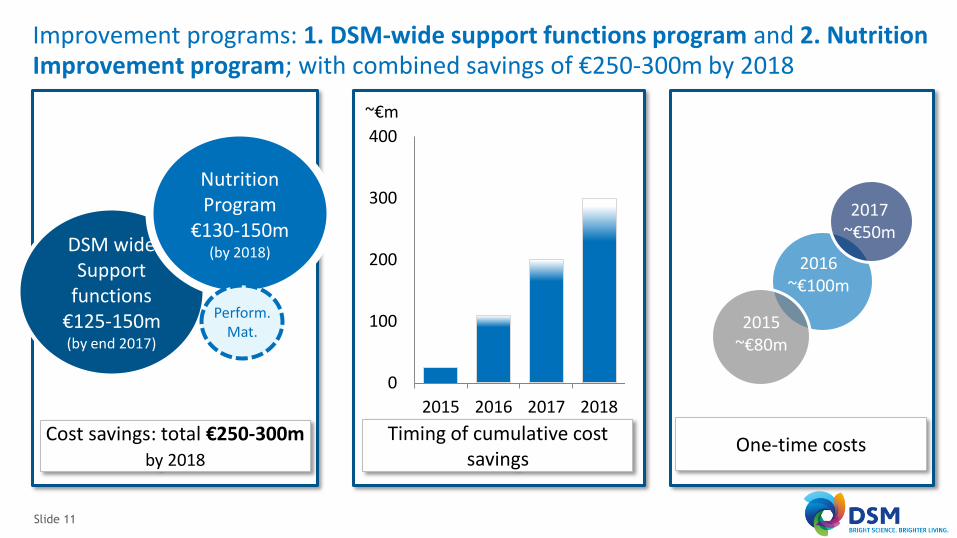
Improvement programs: 1. DSM-wide support functions program and 2. Nutrition Improvement program; with combined savings of €250-300m by 2018
Slide 11
DSM wide Support
functions €125-150m (by end 2017)
Nutrition Program
€130-150m (by 2018)
Cost savings: total €250-300m by 2018
Perform. Mat.
Timing of cumulative cost savings
One-time costs
2016 ~€100m
2017 ~€50m
0
100
200
300
400
2015 2016 2017 2018
~€m
2015 ~€80m
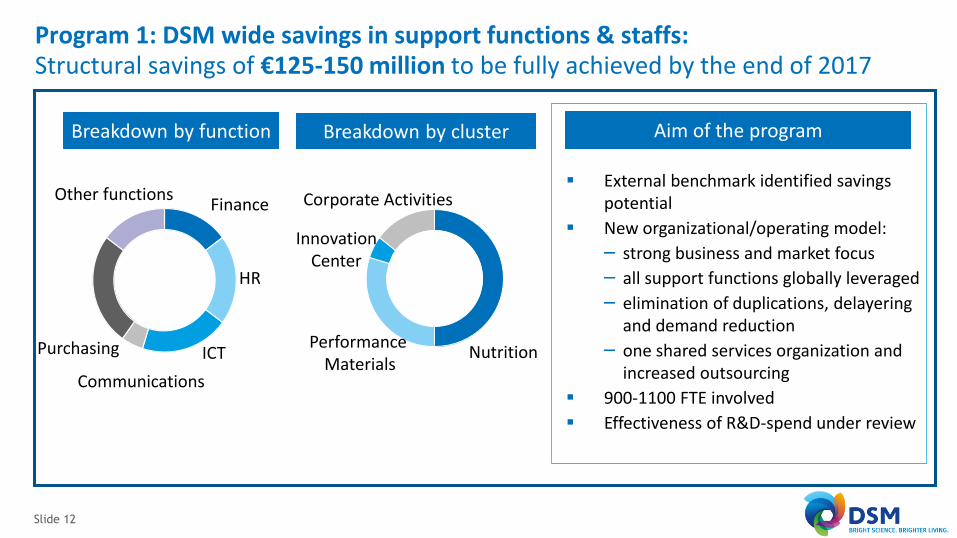
Program 1: DSM wide savings in support functions & staffs: Structural savings of €125-150 million to be fully achieved by the end of 2017
Slide 12
Finance
HR
ICT Purchasing
Communications
Other functions
Nutrition
Corporate Activities
Breakdown by function
Innovation Center
External benchmark identified savings potential
New organizational/operating model:
– strong business and market focus
– all support functions globally leveraged
– elimination of duplications, delayering and demand reduction
– one shared services organization and increased outsourcing
900-1100 FTE involved
Effectiveness of R&D-spend under review
Breakdown by cluster
Performance Materials
Aim of the program
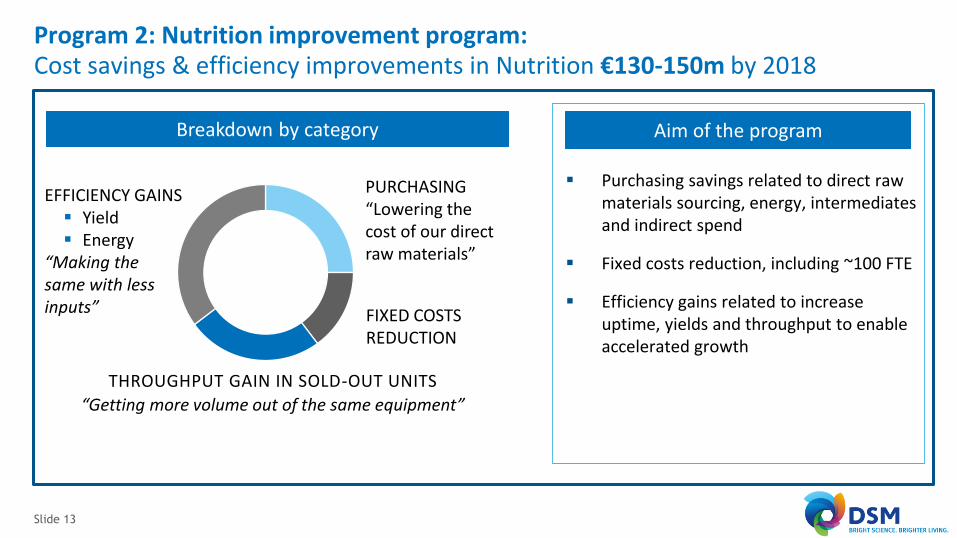
Program 2: Nutrition improvement program: Cost savings & efficiency improvements in Nutrition €130-150m by 2018
Slide 13
Purchasing savings related to direct raw materials sourcing, energy, intermediates and indirect spend
Fixed costs reduction, including ~100 FTE
Efficiency gains related to increase uptime, yields and throughput to enable accelerated growth
PURCHASING “Lowering the cost of our direct raw materials”
FIXED COSTS REDUCTION
THROUGHPUT GAIN IN SOLD-OUT UNITS
“Getting more volume out of the same equipment”
EFFICIENCY GAINS Yield Energy
“Making the same with less inputs”
Aim of the program Breakdown by category

Cost saving and improvement programs: Close monitoring of the design, maturity and achieved benefits
Slide 14
Example monitoring progress cost savings
Governance / Steering: – monthly reporting in Executive
Committee – owner: CEO & CFO (overall), Dimitri de
Vreeze (support functions & staffs), Stephan Tanda (nutrition improvement)
Close monitoring of progress ~ 500 measure sheets, each containing individual actions: – owner – Targeted cost and FTE reductions – milestones – timing – maturity
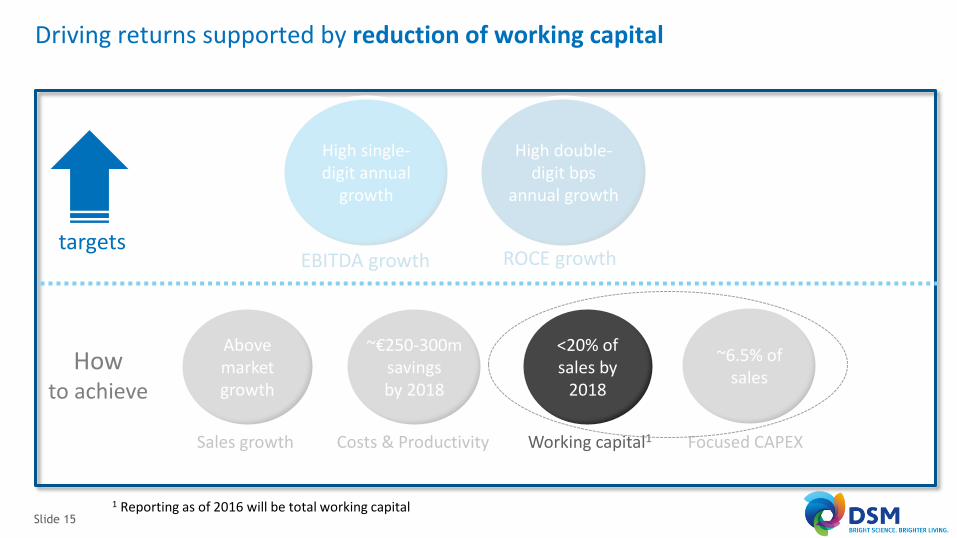
Driving returns supported by reduction of working capital
Slide 15
targets
How to achieve
1 Reporting as of 2016 will be total working capital
Above market growth
High single-digit annual
growth
EBITDA growth
High double-digit bps
annual growth
ROCE growth
Sales growth
~€250-300m savings by 2018
Costs & Productivity
<20% of sales by
2018
Working capital1
~6.5% of sales
Focused CAPEX
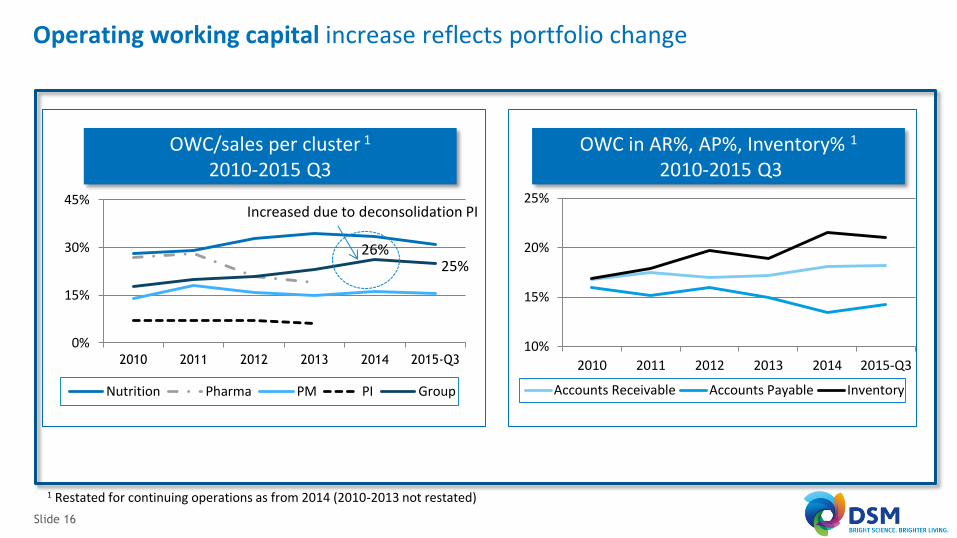
Operating working capital increase reflects portfolio change
Slide 16
2015 0%
15%
30%
45%
2010 2011 2012 2013 2014 2015-Q3
Nutrition Pharma PM PI Group
10%
15%
20%
25%
2010 2011 2012 2013 2014 2015-Q3
Accounts Receivable Accounts Payable Inventory
OWC/sales per cluster 1 2010-2015 Q3
OWC in AR%, AP%, Inventory% 1 2010-2015 Q3
1 Restated for continuing operations as from 2014 (2010-2013 not restated)
Increased due to deconsolidation PI
25% 26%
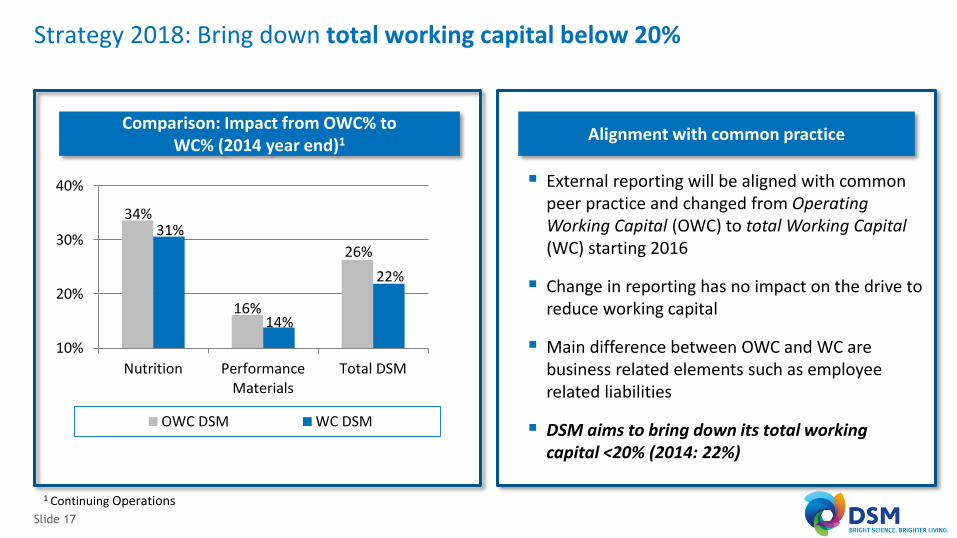
Strategy 2018: Bring down total working capital below 20%
Slide 17
10%
20%
30%
40%
Nutrition PerformanceMaterials
Total DSM
OWC DSM WC DSM
External reporting will be aligned with common peer practice and changed from Operating Working Capital (OWC) to total Working Capital (WC) starting 2016
Change in reporting has no impact on the drive to reduce working capital
Main difference between OWC and WC are business related elements such as employee related liabilities
DSM aims to bring down its total working capital <20% (2014: 22%)
Comparison: Impact from OWC% to WC% (2014 year end)1 Alignment with common practice
1 Continuing Operations
26%
22%
16% 14%
34% 31%
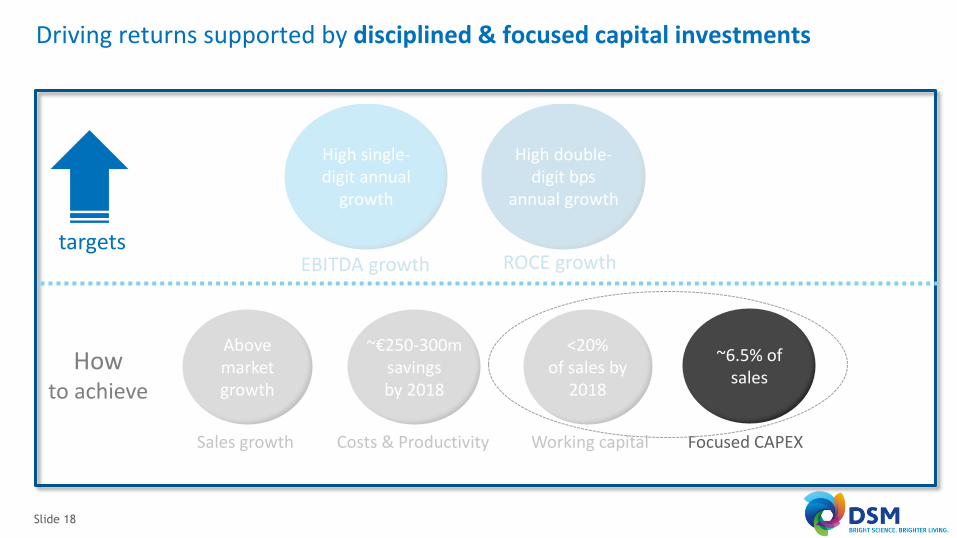
Driving returns supported by disciplined & focused capital investments
Slide 18
targets
How to achieve
Above market growth
High single-digit annual
growth
EBITDA growth
High double-digit bps
annual growth
ROCE growth
Sales growth
~€250-300m savings by 2018
Costs & Productivity
<20% of sales by
2018
Working capital
~6.5% of sales
Focused CAPEX
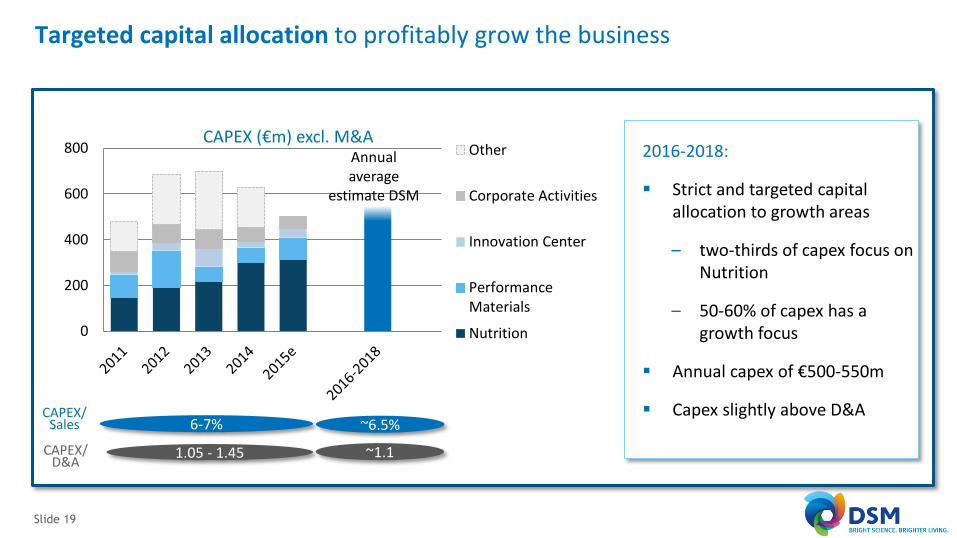
Targeted capital allocation to profitably grow the business
Slide 19
0
200
400
600
800 Other
Corporate Activities
Innovation Center
PerformanceMaterials
Nutrition
CAPEX (€m) excl. M&A
~6.5%
1.05 - 1.45 ~1.1
CAPEX/ Sales
CAPEX/ D&A
2016-2018:
Strict and targeted capital allocation to growth areas
– two-thirds of capex focus on Nutrition
– 50-60% of capex has a growth focus
Annual capex of €500-550m
Capex slightly above D&A
Annual average
estimate DSM
6-7%
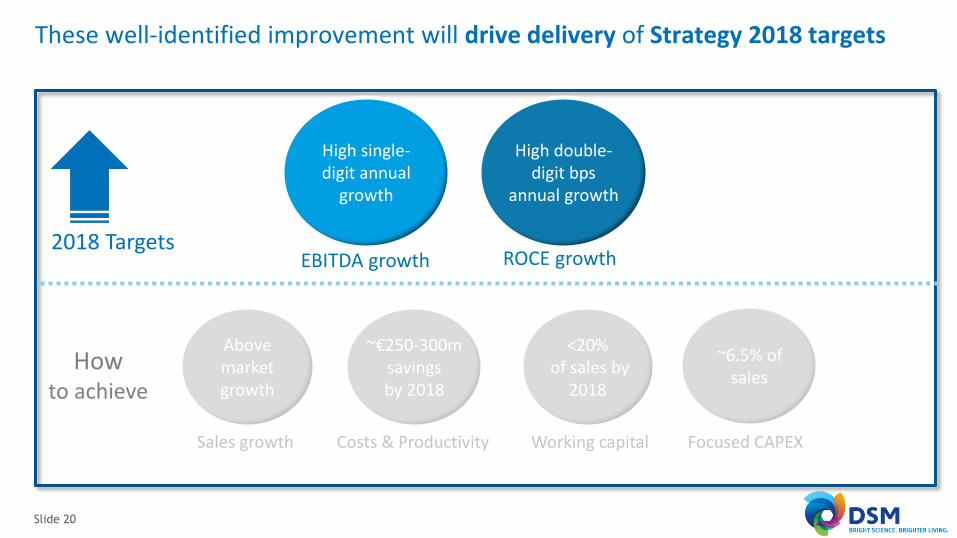
These well-identified improvement will drive delivery of Strategy 2018 targets
Slide 20
High single-digit annual
growth
EBITDA growth
High double-digit bps
annual growth
ROCE growth 2018 Targets
How to achieve
Above market growth
Sales growth
~€250-300m savings by 2018
Costs & Productivity
<20% of sales by
2018
Working capital
~6.5% of sales
Focused CAPEX
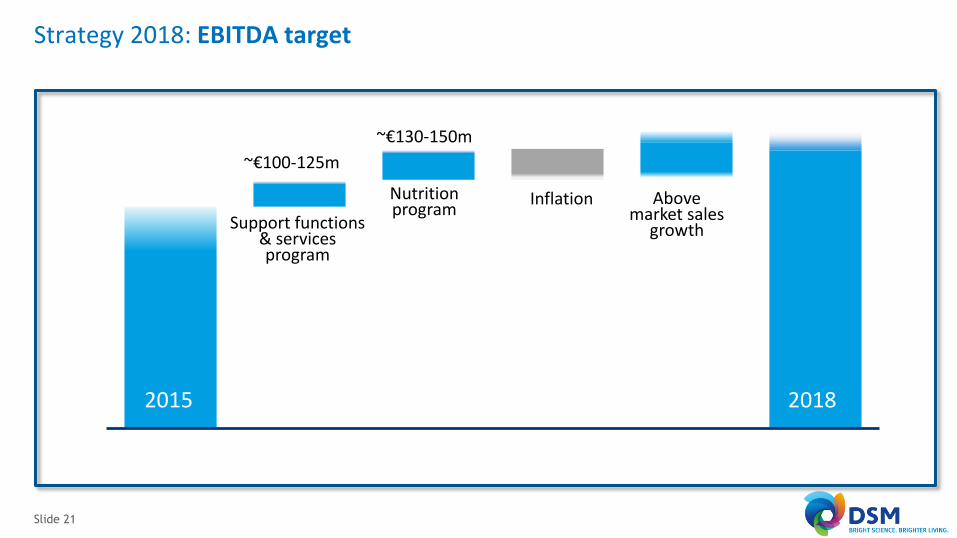
Strategy 2018: EBITDA target
Slide 21
2015
2018 target
~€100-125m
~€130-150m
Inflation
Support functions & services program
Nutrition program
Above market sales
growth
2018
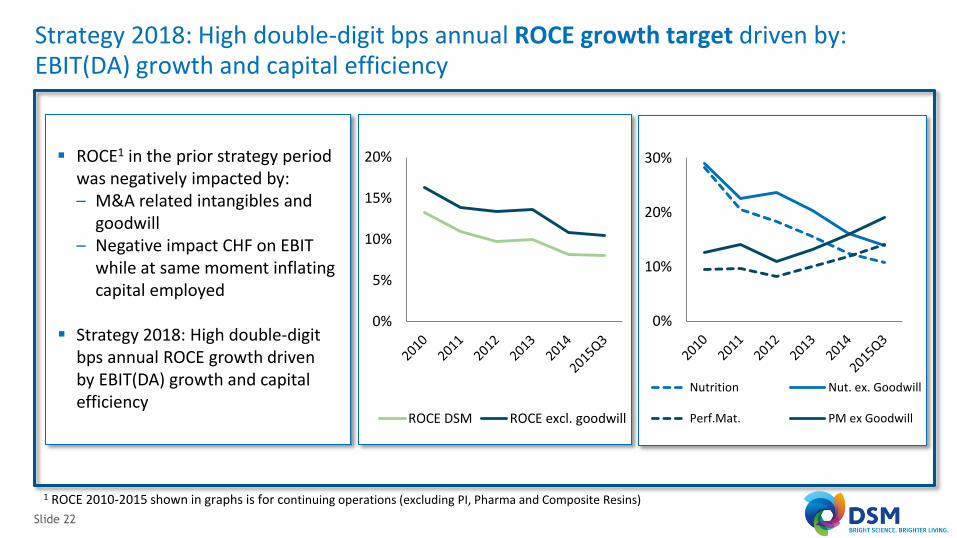
Strategy 2018: High double-digit bps annual ROCE growth target driven by: EBIT(DA) growth and capital efficiency
Slide 22
2015
ROCE1 in the prior strategy period was negatively impacted by: – M&A related intangibles and
goodwill – Negative impact CHF on EBIT
while at same moment inflating capital employed
Strategy 2018: High double-digit bps annual ROCE growth driven by EBIT(DA) growth and capital efficiency
1 ROCE 2010-2015 shown in graphs is for continuing operations (excluding PI, Pharma and Composite Resins)
0%
5%
10%
15%
20%
ROCE DSM ROCE excl. goodwill
0%
10%
20%
30%
Nutrition Nut. ex. Goodwill
Perf.Mat. PM ex Goodwill
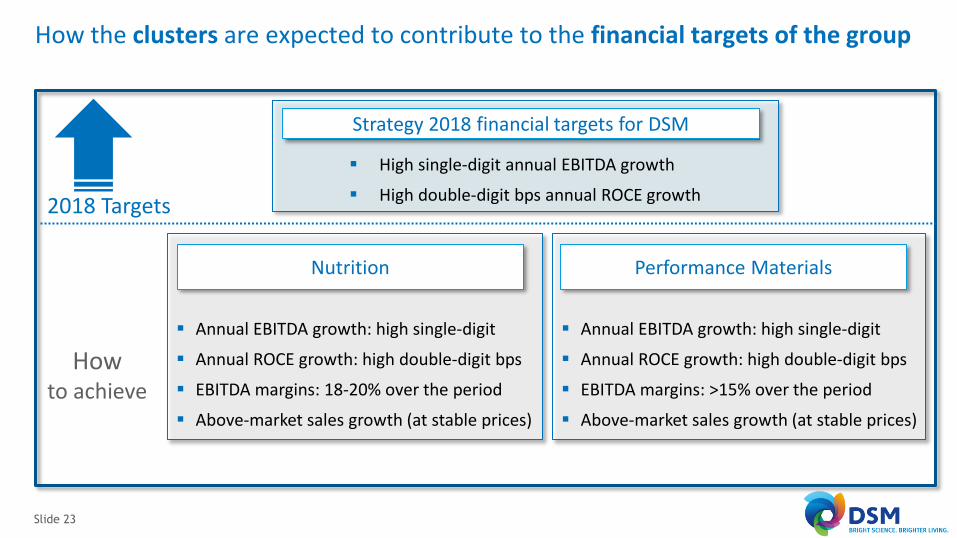
How the clusters are expected to contribute to the financial targets of the group
Slide 23
Annual EBITDA growth: high single-digit
Annual ROCE growth: high double-digit bps
EBITDA margins: 18-20% over the period
Above-market sales growth (at stable prices)
Nutrition
Annual EBITDA growth: high single-digit
Annual ROCE growth: high double-digit bps
EBITDA margins: >15% over the period
Above-market sales growth (at stable prices)
Performance Materials
Strategy 2018 financial targets for DSM
High single-digit annual EBITDA growth
High double-digit bps annual ROCE growth
How to achieve
2018 Targets
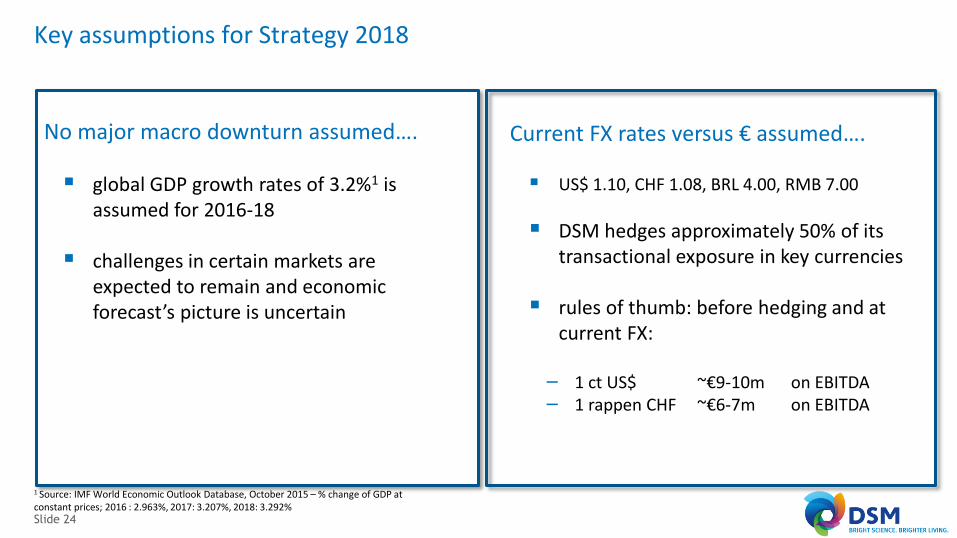
Key assumptions for Strategy 2018
Slide 24
No major macro downturn assumed…. global GDP growth rates of 3.2%1 is
assumed for 2016-18
challenges in certain markets are expected to remain and economic forecast’s picture is uncertain
1 Source: IMF World Economic Outlook Database, October 2015 – % change of GDP at constant prices; 2016 : 2.963%, 2017: 3.207%, 2018: 3.292%
Current FX rates versus € assumed…. US$ 1.10, CHF 1.08, BRL 4.00, RMB 7.00
DSM hedges approximately 50% of its transactional exposure in key currencies
rules of thumb: before hedging and at current FX:
– 1 ct US$ ~€9-10m on EBITDA – 1 rappen CHF ~€6-7m on EBITDA

Strategy 2018: Generate stronger free cash flow (excl. exceptionals)
Slide 25
= EBITDA Growth
Working Capital
Reduction
Balanced CAPEX
Tax Stronger Free cash
flow
High single-digit annual EBITDA growth
total working capital <20%
Disciplined CAPEX, focus on Nutrition
18%-20%
+ + -
Slide 26
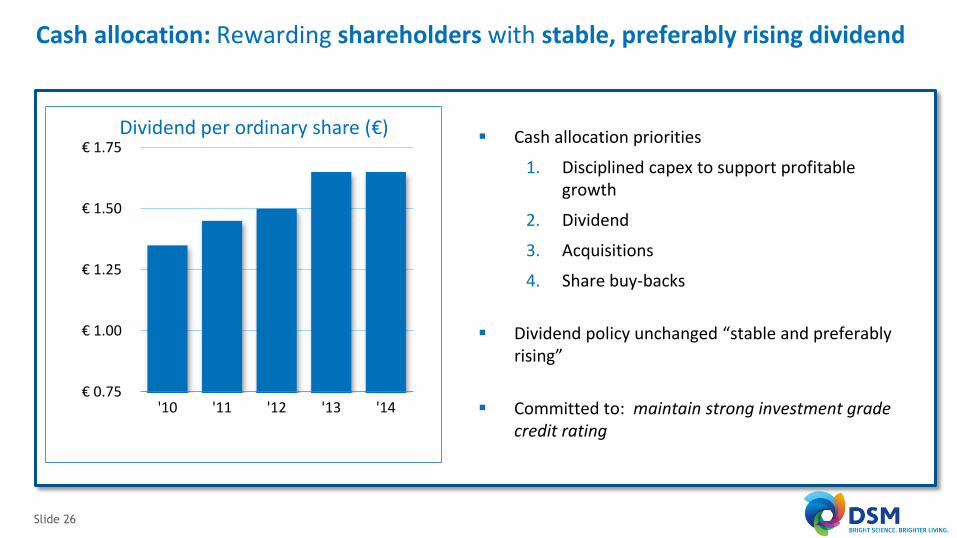
Cash allocation priorities
1. Disciplined capex to support profitable growth
2. Dividend
3. Acquisitions
4. Share buy-backs
Dividend policy unchanged “stable and preferably rising”
Committed to: maintain strong investment grade credit rating
Cash allocation: Rewarding shareholders with stable, preferably rising dividend
€ 0.75
€ 1.00
€ 1.25
€ 1.50
€ 1.75
'10 '11 '12 '13 '14
Dividend per ordinary share (€)
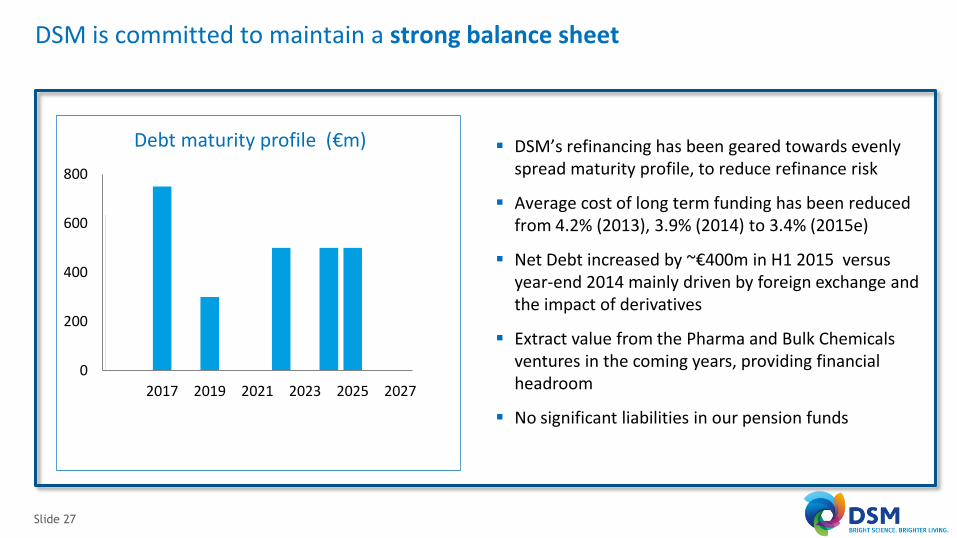
DSM is committed to maintain a strong balance sheet
Slide 27
DSM’s refinancing has been geared towards evenly spread maturity profile, to reduce refinance risk
Average cost of long term funding has been reduced from 4.2% (2013), 3.9% (2014) to 3.4% (2015e)
Net Debt increased by ~€400m in H1 2015 versus year-end 2014 mainly driven by foreign exchange and the impact of derivatives
Extract value from the Pharma and Bulk Chemicals ventures in the coming years, providing financial headroom
No significant liabilities in our pension funds
0
200
400
600
800
2015 2017 2019 2021 2023 2025 2027
Debt maturity profile (€m)
Slide 28
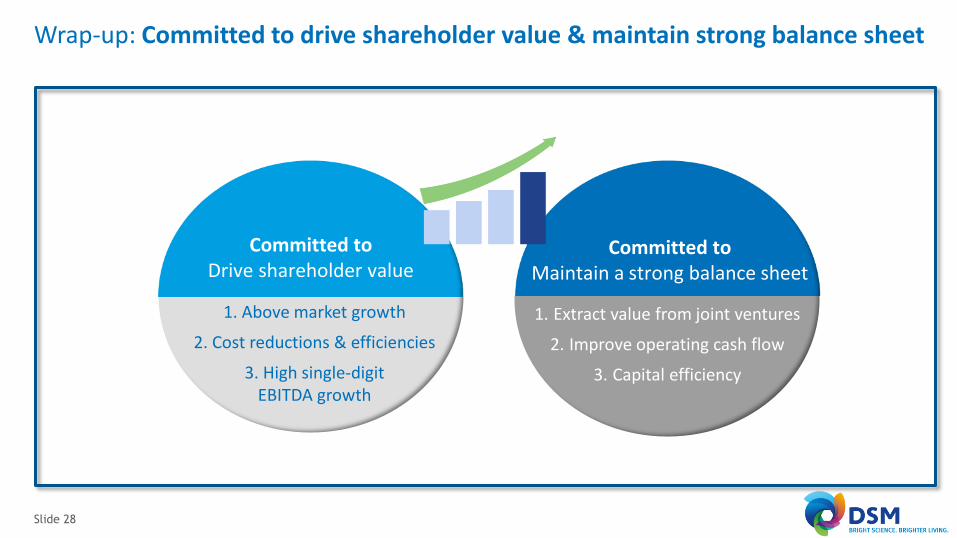
Committed to Drive shareholder value
Committed to Maintain a strong balance sheet
1. Above market growth
2. Cost reductions & efficiencies
3. High single-digit EBITDA growth
1. Extract value from joint ventures
2. Improve operating cash flow
3. Capital efficiency
Wrap-up: Committed to drive shareholder value & maintain strong balance sheet