Embed Size (px)
Citation preview

Early View
Original research article
Drug exposure and susceptibility of second-line drugs correlate with treatment response in patients with multidrug-resistant tuberculosis: a multi-centre prospective cohort study in China
Xubin Zheng, Lina Davies Forsman, Ziwei Bao, Yan Xie, Zhu Ning, Thomas Schön, Judith Bruchfeld, Biao Xu, Jan-Willem Alffenaar, Yi Hu
Please cite this article as: Zheng X, Davies Forsman L, Bao Z, et al. Drug exposure and susceptibility of second-line drugs correlate with treatment response in patients with multidrug-resistant tuberculosis: a multi-centre prospective cohort study in China. Eur Respir J 2021; in press (https://doi.org/10.1183/13993003.01925-2021).
This manuscript has recently been accepted for publication in the European Respiratory Journal. It is published here in its accepted form prior to copyediting and typesetting by our production team. After these production processes are complete and the authors have approved the resulting proofs, the article will move to the latest issue of the ERJ online.
Copyright ©The authors 2021. For reproduction rights and permissions contact [email protected]
Drug exposure and susceptibility of second-line drugs correlate with
treatment response in patients with multidrug-resistant tuberculosis: a
multi-centre prospective cohort study in China
Xubin Zheng 1, Lina Davies Forsman
2,3, Ziwei Bao
4, Yan Xie
5, Zhu Ning
5, Thomas Schön
6,7, Judith Bruchfeld
2,3, Biao Xu
1, Jan-Willem Alffenaar
8,9,10, Yi Hu
1,*
1. Department of Epidemiology, School of Public Health and Key Laboratory of Public
Health Safety, Fudan University, Shanghai, China; 2. Division of Infectious Diseases,
Department of Medicine, Solna, Karolinska Institutet, Stockholm, Sweden; 3. Department of
Infectious Disease, Karolinska University Hospital, Stockholm, Sweden; 4. The Fifth
People's Hospital of Suzhou, Jiangsu, China; 5. Zigong City Centre for Disease Control and
Prevention, Sichuan, China; 6. Department of Infectious Diseases, Linköping University
Hospital and Kalmar County Hospital, Sweden; 7. Division of Inflammation and Infectious
Diseases. Department of Biomedical and Clinical Sciences, Linköping University,
Linköping, Sweden; 8. Faculty of Medicine and Health, School of Pharmacy, University of
Sydney, Sydney, Australia; 9. Westmead hospital, Sydney, Australia; 10. Marie Bashir
Institute of Infectious Diseases and Biosecurity, University of Sydney, Sydney, Australia.
Corresponding author:
Yi Hu, [email protected], Department of Epidemiology, School of Public Health, Fudan
University, No. 130 Dong An Road, Shanghai, China

Co-correspondence Author:
Jan-Willem Alffenaar, [email protected], Faculty of Medicine and Health,
School of Pharmacy, University of Sydney, Sydney, Australia
Take-home message
Drug exposure and susceptibility were proved to be associated with treatment responses
during multidrug-resistant tuberculosis treatment and identified thresholds may serve as
targets for dose adjustment in future clinical studies to improve treatment efficacy.
Abstract
Background. Understanding the impact of drug exposure and susceptibility on treatment
response of multidrug-resistant tuberculosis (MDR-TB) will help to optimize treatment. This
study aimed to investigate the association between drug exposure, susceptibility and
response to MDR-TB treatment.
Methods. Drug exposure and susceptibility for second-line drugs were measured for
patients with MDR-TB. Multivariate analysis was applied to investigate the impact of drug
exposure and susceptibility on sputum culture conversion and treatment outcome.
Probability of target attainment was evaluated. Random Forest and Classification and
Regression Tree (CART) analysis were used to identify key predictors and their clinical
targets among patients on WHO-recommended regimens.
Results. Drug exposure and corresponding susceptibility were available for 197 patients
with MDR-TB. The probability of target attainment was highly variable ranging from 0%

for ethambutol to 97% for linezolid, while patients with fluoroquinolones above targets had
higher probability of two-month culture conversion (56.3% vs. 28.6%, adjusted OR 2.91, 95%
CI 1.42-5.94) and favourable outcome (88.8% vs. 68.8%, adjusted OR 2.89, 95% CI
1.16-7.17). Higher exposure values of fluoroquinolones, linezolid and pyrazinamide were
associated with earlier sputum culture conversion. CART analysis selected moxifloxacin
AUC/MIC of 231 and linezolid AUC/MIC of 287 as best predictors for six-month culture
conversion in patients receiving identical Group A-based regimen. These associations were
confirmed in multivariate analysis.
Conclusions. Our findings indicated that target attainment of second-line drugs was
associated with response to MDR-TB treatment. The CART-derived thresholds may serve as
targets for early dose adjustment in a future randomized controlled study to improve the
treatment outcome.
Background
Multidrug-resistant tuberculosis (MDR-TB) is a global public health crisis and its poor
treatment outcome[1] is threatening achieving the END-TB targets by 2035. The MDR-TB
treatment success rate was 54% in China in 2019 while it has been reported up to 80-85% in
less burdened countries [1]. Adequate drug exposure is key for effective therapy as
suboptimal exposures of anti-TB drugs are correlated with delayed sputum culture
conversion and poor treatment outcome [2]. Well-designed studies linking drug exposure to
treatment outcome are urgently needed to guide dose optimization and implementation of
therapeutic drug monitoring (TDM) [3-5].

TDM is a tool considered in the ATS/CDC/ERS/IDSA Clinical Practice Guideline and the
WHO guideline to individualize drug doses to maximize the therapeutic effects while
minimizing the risk of adverse events, particularly for drugs with narrow therapeutic
windows such as linezolid [3, 4]. Although variability in pharmacokinetics and drug
susceptibility has been reported for second-line TB drugs [5, 6], clinical targets are
predominantly based on pre-clinical models [7-13]. Large clinical studies establishing
targets for drug exposure and susceptibility are still lacking due to logistical and financial
hurdles, including the need for long-time follow-up, variability in drug regimens and
incapability to integrate both drug concentration and susceptibility of Mycobacterium
tuberculosis [14, 15]. Such barriers prevented implementation of individualised, TDM based
therapy [16].
Although new anti-TB drugs and shorter treatment regimens demonstrate improved
treatment outcome, there is still a long way to go before all patients will benefit from them.
Besides, new drugs are not free of variability in drug exposure [17]. Improving treatment
should consider variability in Mycobacterium tuberculosis susceptibility and drug
exposure[5] in addition to other factors like treatment adherence.
Earlier our international TB research consortium showed that treatment outcomes in patients
with drug-susceptible TB could be explained by drug exposure and susceptibility [18]. Thus,
we designed a multicentre, prospective, population-based study to determine the association
between drug exposure – susceptibility targets and MDR-TB treatment responses.

Materials and Methods
Study design and participants
A multi-centre prospective cohort study was conducted between June 2016 and June 2019 in
five hospitals from Guizhou, Henan and Jiangsu Province in China. Eligible patients had an
MDR-TB (Mycobacterium tuberculosis simultaneously resistant to rifampicin and isoniazid)
diagnosis confirmed by bacterial culture and phenotypic drug susceptibility testing (DST),
and were aged between 18 and 70 years. Patients were excluded if they were clinically
abnormal in liver or kidney function, were pregnant or infected with human
immunodeficiency virus, hepatitis B or C virus, having received MDR-TB treatment
previously for more than 1 day, or refused to participate. The study was approved by the
ethics committee of the School of Public Health, Fudan University (IRB#2015-08-0565) and
written informed consent was obtained from all subjects.
MDR-TB treatment and information collection
The patients with MDR-TB were routinely transferred to designated hospitals for two-week
inpatient treatment followed by outpatient treatment. A standardized oral regimen of
fluoroquinolones, bedaquiline, linezolid, clofazimine and cycloserine for six months,
followed by fluoroquinolones, linezolid, clofazimine and cycloserine for 18 months, was
used [4, 19]. Treatment modification was made according to phenotypic DST results,
clinical characteristics of patients and drug availability. Directly Observed Therapy was
implemented daily by study nurses during in-patient treatment and by community healthcare

workers during the outpatient phase [19]. Missing doses and/or treatment interruption and
the reasons for these were recorded. Patients were routinely examined once a month during
the intensive phase and once every two months during the consolidation phase. A
questionnaire was used to collect demographic data, while medical and laboratory data were
extracted from hospital records. Sputum samples were collected at each visit and were sent
to up-level quality-controlled prefectural TB reference laboratory for analysis [20].
Drug susceptibility testing
Bacterial culture, phenotypic DST and minimum inhibitory concentration (MIC) values for
the studied drugs were performed using the BACTEC MGIT 960 system (Becton Dickinson,
Franklin Lakes, NJ, USA). Critical concentrations were used for the classification of drug
susceptibility of the isolates [21]. The following concentrations were used for MIC testing:
levofloxacin 0.06-32 mg/L, moxifloxacin 0.03-16 mg/L, linezolid 0.06-4 mg/L, bedaquiline
0.015-4 mg/L, cycloserine 2-64 mg/L, clofazimine 0.03-4 mg/L, prothionamide 0.3-20 mg/L,
pyrazinamide 16-1024 mg/L and ethambutol 0.5-32 mg/L. The MIC was defined as the
lowest concentration of a drug that inhibited the bacterial growth. For details see supplement
S1.
Drug exposure
After two weeks of inpatient treatment, blood samples were collected via a venous catheter
at pre-dose and at 1, 2, 4, 6 and 8 hours after witnessed intake of anti-TB drugs (steady-state)
[22]. Additional blood samples at 12 and 18 hours post-dose were collected in patients

receiving bedaquiline. Samples were measured using a validated liquid chromatography
tandem mass spectrometry method previously established [23] (see S2 for details).
Non-Compartmental Analysis was applied to calculate area under the concentration-time
curve (AUC0-24h) for all drugs and percentage of time that concentration persisted above
MIC (%T>MIC) for cycloserine. Cmax was defined as the maximum drug concentration
observed.
Response to treatment and main definitions
The response to treatment in this study was evaluated by: a) two-month sputum culture
conversion as a marker of early treatment response; b) six-month culture conversion,
previously reported to be predictive of treatment outcome [24]; c) time to culture conversion
using time-to-event analysis; and d) final treatment outcome. Sputum culture conversion
was defined as two consecutive negative cultures of samples taken at least 30 days apart [25].
The treatment outcome was defined according to the WHO guidelines [25]. Cure and
treatment completion were considered as a successful treatment outcome, while failure,
death and lost to follow-up were considered as unfavourable outcomes. Severe disease was
defined as the TB score ≥8 [26]. Timika score was used to assess chest X-ray (CXR)
severity and a score ≥71 was defined as extensive pulmonary disease [27]. Effective drugs
were defined as those with confirmed susceptibility by phenotypic DST or no previous
exposure history.
Statistical analyses

The statistics for patients’ characteristics and treatment response were presented, in line with
the STROBE statement (www.strobestatement.org) for observational cohort studies.
Between-group differences were evaluated by Chi-square test, Fisher’s exact test or
Mann-Whitney U test as appropriate. P value below 0.05 was considered statistically
significant and 95% confidence interval (CI) was calculated. Due to the lack of clinical
pharmacokinetic/pharmacodynamic targets, the probability of target attainment for drug
exposure - susceptibility ratio (AUC0-24h/MIC) was based on previous in vitro studies (the
targets for moxifloxacin 56, levofloxacin 160, linezolid 119, cycloserine 25.8, pyrazinamide
11.3, prothionamide 56.2 and ethambutol 119 [7-13]). Patients were grouped based on the
quartiles of AUC0-24h/MIC ratio. The association between these groups and time to sputum
culture conversion was investigated by Kaplan-Meier survival analysis and then adjusted for
potential confounders in Cox proportional hazard regression models with death and lost to
follow-up as censored data, while the association with sputum culture conversion at two/six
months and treatment outcome was investigated in univariate and multivariate logistic
regression models.
In the subgroup analysis of treatment arms of WHO-recommended Group A-based regimens,
Random Forest was used to rank variable importance for all demographic characteristics,
clinical features and drug AUC0-24h/MIC ratios. The top ten variables were selected for
subsequent analysis. To detect interactions and deal with missing values, Classification and
Regression Tree (CART) analysis was used to identify the AUC0-24h/MIC thresholds
predictive of treatment response using Salford Predictive Miner System software (San Diego,

CA, USA). The association of derived targets with treatment response was further
investigated in modified Poisson regression and Cox proportional hazard regression models.
Further statistical analyses details are summarized in supplement S3.
Results
Study patients
In total, 246 patients were newly diagnosed with MDR-TB in the study hospitals during the
study period and 201 of them were included, of which data were available for analysis for
197 patients (Figure 1). Of the 197 patients, 71.1% were male, and the mean age and median
weight were 42.0 (±9.9) years and 54 (IQR: 48-66) kg, respectively (Table 1). Baseline DST
identified 37 (18.8%) Mycobacterium tuberculosis strains with additional resistance to
fluoroquinolones.
Treatment regimens and procedures
The number of patients receiving an all-Group A + B drug regimen was 111 (56.3%) and
those received a personalized regimen was 86 (43.7%). All patients received a treatment
regimen consisting of at least 4 effective drugs.
Of the 197 patients, 1 patient died due to cardiovascular disease after 12-month treatment,
while 2 patients were lost to follow-up. During the treatment, 125 patients reported 219
adverse events, including gastrointestinal disorders (33.5%), psychiatric disorders (14.7%)
and anaemia (13.2%). Dose reductions were performed for cycloserine (n=5), linezolid (n=4)

and bedaquiline (n=2), while cycloserine was discontinued in 10 patients after a median of 7
(range 6-10) months of treatment. (Table S2)
Treatment responses and risk factors
Sputum culture conversion was achieved in 88 (44.7%) patients after two-month MDR-TB
treatment, 128 (65.0%) achieved six-month culture conversion while 156 (79.2%) finally
had favourable outcome during follow-up (Table 1). The median time to culture conversion
was 4 (IQR: 2-14) months. As shown in Table S1, baseline time to culture positivity (TTP)
was found to be significantly associated with two/six-month culture conversion and
treatment outcome (P<0.001). Patients who had diabetes mellitus type 2 (50.0% vs.68.8%, P
= 0.026) or currently smoked (57.9%. vs.73.3%, P=0.024) were less likely to achieve
six-month culture conversion. Sex, severe disease and extensive pulmonary disease were not
associated with any treatment responses (P>0.05). Compared to patients receiving at least
two Group A drugs, patients taking only one drug of group A had a lower probability of
two-month (23.1% vs. 50.0%, P=0.002) and six-month culture conversion (48.7% vs.
69.0%%, P=0.017) as well as a lower probability of favourable outcome (53.8% vs. 85.4%,
P<0.001). Patients receiving three Group A drugs had higher treatment success rate
comparted to others (100.0% vs. 73.9%, P<0.001). (Figure S1)
Association between drug exposure – susceptibility ratio and treatment responses
Patients with a higher exposure – susceptibility ratio for fluoroquinolones, linezolid and
pyrazinamide had better treatment responses (P<0.05), while prothionamide and ethambutol

had little impact (Table 2 and Table S3). A more favourable exposure – susceptibility ratio
for bedaquiline (2890.1 vs. 1527.2, P=0.001), cycloserine (111.0 vs. 79.2, P<0.001) and
clofazimine (101.1 vs. 51.7, P=0.005) were strongly associated with six-month culture
conversion. As shown in Figure 2, time to sputum culture conversion was observed to be
significantly shorter in patients with a higher exposure – susceptibility ratio of
fluoroquinolones, linezolid, cycloserine and pyrazinamide (P<0.001). Similar effects were
not observed in bedaquiline, clofazimine and prothionamide (P>0.05). These associations
were confirmed in a multivariate analysis (Table 3 and 4).
The probabilities of target attainment for moxifloxacin, linezolid and cycloserine were above
85%, while below 45% for levofloxacin, pyrazinamide, prothionamide and ethambutol
(Table 5 and Figure S4). Multivariate analysis showed that patients with fluoroquinolone
exposure above the previously suggested targets had higher probability of two-month culture
conversion (aOR 2.91, 95% CI 1.42-5.94) and treatment success (aOR 2.89, 95% CI
1.16-7.17). Patients with a moxifloxacin exposure above target were more likely to achieve
six-month culture conversion (aOR 15.6, 95% CI 1.48-165.0).
CART analysis for clinical drug exposure – susceptibility targets
Random Forest and CART analysis was performed among subgroups of patients receiving
“moxifloxacin+linezolid+/-bedaquiline” (n=67) or “levofloxacin+linezolid+/-bedaquiline”
(n=61) based regimen. The results showed that the primary node for
“moxifloxacin+linezolid+/-bedaquiline” based regimen was moxifloxacin AUC0-24h/MIC of

231, where 97.6% of patients exceeding this target achieved six-month culture conversion
compared to 3.8% in those below the target (Figure 3). For
“levofloxacin+linezolid+/-bedaquiline” based regimen, linezolid was selected as the primary
node with an AUC0-24h/MIC cut-off value of 287 and patients with linezolid above the target
had higher probability of sputum culture conversion at six months of treatment (82.4% vs.
10.0%). After adjusting for current smoking, diabetes mellitus type 2, baseline TTP and
number of effective drugs, patients with moxifloxacin or linezolid exposure above target had
greater probability of six-month culture conversion and showed earlier culture conversion
(Table S4).
Discussion
In this large multi-centre study, higher drug exposure in relation to susceptibility for all
drugs, except prothionamide and ethambutol, were found to be associated with favourable
treatment responses in patients with MDR-TB. This is the first study demonstrating that
adequate exposure to fluoroquinolones, bedaquiline and linezolid is strongly associated with
sputum culture conversion at various time points during MDR-TB treatment in
programmatic regimen.
It is well known that current Group A drugs contribute to improved treatment response. Our
study demonstrates that adequate exposure to these drugs translated in higher two-month
and six-month culture conversion rates compared to patients below these targets. By
showing that targets established in in vitro studies are associated with improved treatment
response across the two- and six-month culture conversion, time to culture conversion and
overall treatment outcome, our study is the first to bridge the gap between pre-clinical
studies and clinical trials evaluating treatment outcome [28-31]. Although the efficacy of
levofloxacin and moxifloxacin is believed to be comparable in MDR-TB treatment [4],
moxifloxacin was found to play a more important role in driving treatment response in our
study. However, the observed difference may well be attributed to under-dosing of
levofloxacin [5]. Although a standard levofloxacin dose of 750 mg was recommended [4,
19], physicians still tended to prescribe 500mg, due to the lack of clear dose
recommendations for domestically manufactured levofloxacin, as well as concerns of
potential adverse events. Under-dosing of fluoroquinolones should be avoided and there is
room for treatment optimization using TDM. We urgently request that no country uses 500
mg of levofloxacin as standard dose, as this has been shown to lead to sub-therapeutic drug
levels [5, 32, 33].
Having a higher exposure – susceptibility ratio of linezolid and bedaquiline was also
associated with a better treatment response. This underpins the critical importance of
interpretation of the highly variable exposures of bedaquiline and linezolid in relation to the
baseline drug susceptibility [17, 34]. Although the mean bedaquiline exposure after 2 weeks
of MDR-TB treatment (AUC0-24h of 41.5 mg*h/L) in our study was higher (P=0.04) than a
previous study (33.0 mg*h/L) [29], the clinical relevance is unclear. The study by Conradie
and colleagues has fuelled the discussion on linezolid dosing as over 80% of the patients in
that study experienced toxicity, prompting a dose reduction or interruption of treatment

when receiving a dose of 1200 mg daily [35]. In our study, the linezolid dose was reduced in
4 patients. Meanwhile, most patients (92.9%, 156/168) were eligible for dose reduction
while maintaining adequate drug exposure. Clearly there is some room for linezolid dose
optimization to balance efficacy and toxicity [6, 30].
Adequate exposure to cycloserine and clofazimine contributed to improved treatment
response in our study. A high probability of target attainment for cycloserine supports the
use of the agent with currently recommended dose of 10-15 mg/kg [12]. Regarding
treatment optimization in the Chinese setting, more efforts are needed to promote the use of
Group B drugs since nearly one third of patients received only one of them. The main reason
was that these two drugs were not covered by medical insurance in China and needed to be
paid by the patient. When susceptibility is proven, our study shows that pyrazinamide is a
valuable addition for composing an MDR-TB treatment regimen, as it increased the
probability of sputum culture conversion and reduced the time to culture conversion,
confirming previous studies [36, 37]. However, as only 11.1% of patients reached the target
for pyrazinamide [10], the need of higher dose of pyrazinamide (40mg/kg) should be
considered to increase the benefits without compromising its tolerability [38]. The fact that
prothionamide and ethambutol had little impact on treatment responses, reflecting their
limited bactericidal and/or sterilizing effect compared to other second -line drugs.
This study has some important implications for future randomized controlled studies on
personalized dosing. Though TDM is recommended to optimize MDR-TB treatment in

guidelines, our study is the first to identify clinical targets for moxifloxacin and linezolid.
The CART-derived clinical targets are higher compared to the targets reported in in vitro
studies [11, 13]. However, these differences need to be viewed in a clinical context and
methodology of MIC determination, as MIC determination has inherent variability due to
laboratory and strain variability [39] and with each two-fold change in the MIC, the target as
calculated by AUC0-24h/MIC will double. Moreover, free drug concentrations and tissue
penetration to the site of infection (e.g. cavitary disease) need to be considered when
applying AUC0-24h/MIC targets in clinical practice. Considering the delay and complexity of
phenotypic DST in routine care, we foresee that genotypic testing to determine drug
susceptibility in combination with drug exposure assessment would allow for early treatment
modifications. Establishing AUC0-24h targets solely based on clinical breakpoints would
result in significant overexposure in many patients as most isolates have an MIC lower than
the breakpoint.
Our study has some limitations. We excluded patients aged over 70 and patients co-infected
with human immunodeficiency virus, hepatitis B or C virus, to reduce heterogeneity of study
participants. Therefore, results cannot be extrapolated to these patients. Sputum culture
conversion was used to assess treatment response but more sensitive biomarkers should be
considered in future studies evaluating interventions on drug dosing in relation to treatment
response. We assessed drug exposure after two weeks of treatment (steady-state) and we
assumed that intra-patient variability in drug exposure was limited compared to inter-patient
variability, as sputum culture conversion at 2 and 6 months were comparable. It’s important
to realize that analysing the interaction between drug concentrations, pathogen susceptibility
and treatment outcome is complex, and thresholds derived from a population depend on the
distribution of different variables in that population [40]. This must be considered when
comparing or translating study results.
In conclusion, our findings indicate that targets based on drug exposure – susceptibility ratio
are associated with response to treatment for most anti-TB drugs used in MDR-TB treatment,
especially for Group A drugs and pyrazinamide. For fluoroquinolones, linezolid and
pyrazinamide, there is a clear opportunity for dose optimization in general, in addition to
individualisation. We recommend clinical targets for efficacy to be evaluated in a
randomized controlled study as a strategy to improve MDR-TB treatment outcome, adjusted
for differences in susceptibility testing.
Acknowledgements
This work was supported by grants from the National Natural Science Foundation of China
(NSFC) (PI, Yi Hu, No. 81874273) and the Three-Year Action Plan of Shanghai Public
Health System Construction - Key Discipline Construction (2020-2022) (No.
GWV-10.1-XK16).
We thank Brian Davies for language revision.
Competing interests

None to declare.
Reference
1. WHO. Global Tuberculosis Report 2020. Date last updated:
https://www.who.int/tb/publications/global_report/en/.
2. Pasipanodya JG, McIlleron H, Burger A, Wash PA, Smith P, Gumbo T. Serum drug
concentrations predictive of pulmonary tuberculosis outcomes. J Infect Dis 2013: 208(9): 1464-1473.
3. Nahid P, Mase SR, Migliori GB, Sotgiu G, Bothamley GH, Brozek JL, Cattamanchi A, Cegielski
JP, Chen L, Daley CL, Dalton TL, Duarte R, Fregonese F, Horsburgh CR, Jr., Ahmad Khan F, Kheir F,
Lan Z, Lardizabal A, Lauzardo M, Mangan JM, Marks SM, McKenna L, Menzies D, Mitnick CD, Nilsen
DM, Parvez F, Peloquin CA, Raftery A, Schaaf HS, Shah NS, Starke JR, Wilson JW, Wortham JM,
Chorba T, Seaworth B. Treatment of Drug-Resistant Tuberculosis. An Official ATS/CDC/ERS/IDSA
Clinical Practice Guideline. Am J Respir Crit Care Med 2019: 200(10): e93-e142.
4. WHO. WHO consolidated guidelines on drug-resistant tuberculosis treatment. Date last updated:
https://apps.who.int/iris/bitstream/handle/10665/311389/9789241550529-eng.pdf.
5. Davies Forsman L, Niward K, Kuhlin J, Zheng X, Zheng R, Ke R, Hong C, Werngren J, Paues J,
Simonsson USH, Eliasson E, Hoffner S, Xu B, Alffenaar JW, Schon T, Hu Y, Bruchfeld J. Suboptimal
moxifloxacin and levofloxacin drug exposure during treatment of patients with multidrug-resistant
tuberculosis: results from a prospective study in China. Eur Respir J 2020.
6. Bolhuis MS, van der Werf TS, Kerstjens HAM, de Lange WCM, Alffenaar JC, Akkerman OW.
Treatment of multidrug-resistant tuberculosis using therapeutic drug monitoring: first experiences with
sub-300 mg linezolid dosages using in-house made capsules. Eur Respir J 2019: 54(6).
7. Deshpande D, Pasipanodya JG, Mpagama SG, Bendet P, Srivastava S, Koeuth T, Lee PS,

Bhavnani SM, Ambrose PG, Thwaites G, Heysell SK, Gumbo T. Levofloxacin
Pharmacokinetics/Pharmacodynamics, Dosing, Susceptibility Breakpoints, and Artificial Intelligence
in the Treatment of Multidrug-resistant Tuberculosis. Clin Infect Dis 2018: 67(suppl_3): S293-S302.
8. Deshpande D, Pasipanodya JG, Mpagama SG, Srivastava S, Bendet P, Koeuth T, Lee PS,
Heysell SK, Gumbo T. Ethionamide Pharmacokinetics/Pharmacodynamics-derived Dose, the Role of
MICs in Clinical Outcome, and the Resistance Arrow of Time in Multidrug-resistant Tuberculosis. Clin
Infect Dis 2018: 67(suppl_3): S317-S326.
9. Srivastava S, Musuka S, Sherman C, Meek C, Leff R, Gumbo T. Efflux-pump-derived multiple
drug resistance to ethambutol monotherapy in Mycobacterium tuberculosis and the pharmacokinetics
and pharmacodynamics of ethambutol. J Infect Dis 2010: 201(8): 1225-1231.
10. Gumbo T, Dona CSWS, Meek C, Leff R. Pharmacokinetics-Pharmacodynamics of Pyrazinamide
in a Novel In Vitro Model of Tuberculosis for Sterilizing Effect: a Paradigm for Faster Assessment of
New Antituberculosis Drugs. Antimicrob Agents Chemother 2009: 53(8): 3197-3204.
11. Srivastava S, Magombedze G, Koeuth T, Sherman C, Pasipanodya JG, Raj P, Wakeland E,
Deshpande D, Gumbo T. Linezolid Dose That Maximizes Sterilizing Effect While Minimizing Toxicity
and Resistance Emergence for Tuberculosis. Antimicrob Agents Chemother 2017: 61(8).
12. Deshpande D, Alffenaar JC, Koser CU, Dheda K, Chapagain ML, Simbar N, Schon T,
Sturkenboom MGG, McIlleron H, Lee PS, Koeuth T, Mpagama SG, Banu S, Foongladda S, Ogarkov
O, Pholwat S, Houpt ER, Heysell SK, Gumbo T. d-Cycloserine Pharmacokinetics/Pharmacodynamics,
Susceptibility, and Dosing Implications in Multidrug-resistant Tuberculosis: A Faustian Deal. Clin
Infect Dis 2018: 67(suppl_3): S308-S316.
13. Gumbo T, Louie A, Deziel MR, Parsons LM, Salfinger M, Drusano GL. Selection of a

moxifloxacin dose that suppresses drug resistance in Mycobacterium tuberculosis, by use of an in
vitro pharmacodynamic infection model and mathematical modeling. J Infect Dis 2004: 190(9):
1642-1651.
14. Alffenaar JC, Gumbo T, Dooley KE, Peloquin CA, McIlleron H, Zagorski A, Cirillo DM, Heysell SK,
Silva DR, Migliori GB. Integrating Pharmacokinetics and Pharmacodynamics in Operational Research
to End Tuberculosis. Clin Infect Dis 2020: 70(8): 1774-1780.
15. van der Burgt EP, Sturkenboom MG, Bolhuis MS, Akkerman OW, Kosterink JG, de Lange WC,
Cobelens FG, van der Werf TS, Alffenaar JW. End TB with precision treatment! Eur Respir J 2016:
47(2): 680-682.
16. Kim HY, Heysell SK, Mpagama S, Marais BJ, Alffenaar JW. Challenging the management of
drug-resistant tuberculosis. Lancet 2020: 395(10226): 783.
17. Alffenaar JWC, Akkerman OW, Tiberi S, Sotgiu G, Migliori GB, Beda GTN. Should we worry
about bedaquiline exposure in the treatment of multidrug-resistant and extensively drug-resistant
tuberculosis? Eur Respir J 2020: 55(2).
18. Zheng X, Bao Z, Forsman LD, Hu Y, Ren W, Gao Y, Li X, Hoffner S, Bruchfeld J, Alffenaar JW.
Drug exposure and minimum inhibitory concentration predict pulmonary tuberculosis treatment
response. Clin Infect Dis 2020.
19. Tang S, Li L. Expert consensus on the treatment of multidrug-resistant/rifampicin-resistant
tuberculosis in China (2019 edition). Chinese Journal of Tuberculosis and Respiratory Diseases 2019:
42(10): 733-749.
20. Shu W, Du J, Liu Y, Wang Y, Huo F, Jiang G, Li L, Pang Y. External quality control of phenotypic
drug susceptibility testing for Mycobacterium tuberculosis in China. Eur J Clin Microbiol Infect Dis

2020: 39(5): 871-875.
21. WHO. Technical manual for drug susceptibility testing of medicines used in the treatment of
tuberculosis. Date last updated:
https://www.who.int/tb/publications/2018/WHO_technical_drug_susceptibility_testing/en/.
22. Alsultan A, Peloquin CA. Therapeutic drug monitoring in the treatment of tuberculosis: an update.
Drugs 2014: 74(8): 839-854.
23. Zheng X, Jongedijk EM, Hu Y, Kuhlin J, Zheng R, Niward K, Paues J, Xu B, Davies Forsman L,
Schon T, Bruchfeld J, Alffenaar JC. Development and validation of a simple LC-MS/MS method for
simultaneous determination of moxifloxacin, levofloxacin, prothionamide, pyrazinamide and
ethambutol in human plasma. J Chromatogr B Analyt Technol Biomed Life Sci 2020: 1158: 122397.
24. Gunther G, Lange C, Alexandru S, Altet N, Avsar K, Bang D, Barbuta R, Bothamley G, Ciobanu
A, Crudu V, Danilovits M, Dedicoat M, Duarte R, Gualano G, Kunst H, de Lange W, Leimane V,
Magis-Escurra C, McLaughlin AM, Muylle I, Polcova V, Popa C, Rumetshofer R, Skrahina A,
Solodovnikova V, Spinu V, Tiberi S, Viiklepp P, van Leth F, for T. Treatment Outcomes in
Multidrug-Resistant Tuberculosis. N Engl J Med 2016: 375(11): 1103-1105.
25. WHO. Definitions and reporting framework for tuberculosis - 2013 revision (updated December
2014 and January 2020). Date last updated: January 2020.
https://www.who.int/publications/i/item/9789241505345.
26. Rudolf F, Lemvik G, Abate E, Verkuilen J, Schon T, Gomes VF, Eugen-Olsen J, Ostergaard L,
Wejse C. TBscore II: refining and validating a simple clinical score for treatment monitoring of patients
with pulmonary tuberculosis. Scand J Infect Dis 2013: 45(11): 825-836.
27. Chakraborthy A, Shivananjaiah AJ, Ramaswamy S, Chikkavenkatappa N. Chest X ray score

(Timika score): an useful adjunct to predict treatment outcome in tuberculosis. Adv Respir Med 2018:
86(5): 205-210.
28. Olaru ID, Heyckendorf J, Andres S, Kalsdorf B, Lange C. Bedaquiline-based treatment regimen
for multidrug-resistant tuberculosis. Eur Respir J 2017: 49(5).
29. Diacon AH, Pym A, Grobusch MP, de los Rios JM, Gotuzzo E, Vasilyeva I, Leimane V, Andries K,
Bakare N, De Marez T, Haxaire-Theeuwes M, Lounis N, Meyvisch P, De Paepe E, van Heeswijk RP,
Dannemann B, Group TCS. Multidrug-resistant tuberculosis and culture conversion with bedaquiline.
N Engl J Med 2014: 371(8): 723-732.
30. Bolhuis MS, Akkerman OW, Sturkenboom MGG, Ghimire S, Srivastava S, Gumbo T, Alffenaar
JC. Linezolid-based Regimens for Multidrug-resistant Tuberculosis (TB): A Systematic Review to
Establish or Revise the Current Recommended Dose for TB Treatment. Clin Infect Dis 2018:
67(suppl_3): S327-S335.
31. Gosling RD, Uiso LO, Sam NE, Bongard E, Kanduma EG, Nyindo M, Morris RW, Gillespie SH.
The bactericidal activity of moxifloxacin in patients with pulmonary tuberculosis. Am J Respir Crit Care
Med 2003: 168(11): 1342-1345.
32. Nunn AJ, Phillips PPJ, Meredith SK, Chiang CY, Conradie F, Dalai D, van Deun A, Dat PT, Lan
N, Master I, Mebrahtu T, Meressa D, Moodliar R, Ngubane N, Sanders K, Squire SB, Torrea G, Tsogt
B, Rusen ID, Collaborators SS. A Trial of a Shorter Regimen for Rifampin-Resistant Tuberculosis. N
Engl J Med 2019: 380(13): 1201-1213.
33. Borisov S, Danila E, Maryandyshev A, Dalcolmo M, Miliauskas S, Kuksa L, Manga S, Skrahina A,
Diktanas S, Codecasa LR, Aleksa A, Bruchfeld J, Koleva A, Piubello A, Udwadia ZF, Akkerman OW,
Belilovski E, Bernal E, Boeree MJ, Cadinanos Loidi J, Cai Q, Cebrian Gallardo JJ, Dara M,

Davidaviciene E, Forsman LD, De Los Rios J, Denholm J, Draksiene J, Duarte R, Elamin SE,
Escobar Salinas N, Ferrarese M, Filippov A, Garcia A, Garcia-Garcia JM, Gaudiesiute I, Gavazova B,
Gayoso R, Gomez Rosso R, Gruslys V, Gualano G, Hoefsloot W, Jonsson J, Khimova E, Kunst H,
Laniado-Laborin R, Li Y, Magis-Escurra C, Manfrin V, Marchese V, Martinez Robles E, Matteelli A,
Mazza-Stalder J, Moschos C, Munoz-Torrico M, Mustafa Hamdan H, Nakceriene B, Nicod L, Nieto
Marcos M, Palmero DJ, Palmieri F, Papavasileiou A, Payen MC, Pontarelli A, Quiros S, Rendon A,
Saderi L, Smite A, Solovic I, Souleymane MB, Tadolini M, van den Boom M, Vescovo M, Viggiani P,
Yedilbayev A, Zablockis R, Zhurkin D, Zignol M, Visca D, Spanevello A, Caminero JA, Alffenaar JW,
Tiberi S, Centis R, D'Ambrosio L, Pontali E, Sotgiu G, Migliori GB. Surveillance of adverse events in
the treatment of drug-resistant tuberculosis: first global report. Eur Respir J 2019: 54(6).
34. Huang HR, Ding N, Yang TT, Li CD, Jia XM, Wang GR, Zhong J, Zhang J, Jiang GL, Wang SQ,
Zong ZJ, Jing W, Zhao YL, Xu SF, Chen F. Cross-sectional Whole-genome Sequencing and
Epidemiological Study of Multidrug-resistant Mycobacterium tuberculosis in China. Clin Infect Dis
2019: 69(3): 405-413.
35. Conradie F, Diacon AH, Ngubane N, Howell P, Everitt D, Crook AM, Mendel CM, Egizi E,
Moreira J, Timm J, McHugh TD, Wills GH, Bateson A, Hunt R, Van Niekerk C, Li M, Olugbosi M,
Spigelman M, Nix TBTT. Treatment of Highly Drug-Resistant Pulmonary Tuberculosis. N Engl J Med
2020: 382(10): 893-902.
36. Sun F, Li Y, Chen Y, Guan WL, Jiang XG, Wang XM, Ren PF, Li JL, Shi JC, He GQ, Wu MY,
Tang PJ, Wang F, Sheng YF, Huang FL, Zhou ZM, Huang HQ, Hong L, Liu QH, Zhang Y, Zhang WH.
Introducing molecular testing of pyrazinamide susceptibility improves multidrug-resistant tuberculosis
treatment outcomes: a prospective cohort study. Eur Respir J 2019: 53(3).

37. Forsman LD, Jonsson J, Wagrell C, Werngren J, Mansjo M, Wijkander M, Groenheit R, Hammar
U, Giske CG, Schon T, Bruchfeld J. Minimum Inhibitory Concentrations of Fluoroquinolones and
Pyrazinamide Susceptibility Correlate to Clinical Improvement in Multidrug-resistant Tuberculosis
Patients: A Nationwide Swedish Cohort Study Over 2 Decades. Clin Infect Dis 2019: 69(8):
1394-1402.
38. Pasipanodya JG, Gumbo T. Clinical and toxicodynamic evidence that high-dose pyrazinamide is
not more hepatotoxic than the low doses currently used. Antimicrob Agents Chemother 2010: 54(7):
2847-2854.
39. Mouton JW, Meletiadis J, Voss A, Turnidge J. Variation of MIC measurements: the contribution
of strain and laboratory variability to measurement precision. J Antimicrob Chemother 2018: 73(9):
2374-2379.
40. Chirehwa MT, Velasquez GE, Gumbo T, McIlleron H. Quantitative assessment of the activity of
antituberculosis drugs and regimens. Expert Rev Anti Infect Ther 2019: 17(6): 449-457.

Table 1. Demographic characteristics, clinical features and treatment outcome of
study participants with multidrug-resistant tuberculosis
Characteristics No.(%)
Age, years a 42.0±9.9
Sex, male 140 (71.1)
Weight, kg b 54 (48, 66)
Current smoking 107 (54.3)
Diabetes mellitus type 2 40 (20.3)
Pulmonary cavities 78 (39.6)
Extensive pulmonary disease 38 (19.3)
Severe disease 56 (28.4)
Time to positivity, days a 11.9±3.0
Drug susceptibility profile
MDR-TB alone 160 (81.2)
Pre-XDR-TB 37 (18.8)
Drug intake (mg/kg) b
Levofloxacin (500mg, QD) 7.7 (6.7, 8.4)
Moxifloxacin (400mg, QD) 8.6 (7.2, 10.4)
Linezolid (600mg, QD) 11.3 (9.2, 12.8)
Bedaquiline (400mg, QD) 7.5 (6.2, 8.3)
Clofazimine (100mg, QD) 9.3 (7.6, 10.4)
Cycloserine (500mg, BID) 3.8 (3.2, 4.3)
Prothionamide (600mg, TID) 10.8 (9.3, 12)
Pyrazinamide (1500mg, TID) 26.8 (21.7, 30)
Ethambutol (750mg, QD) 13.9 (11.3, 15.6)
Number of drugs in a
Group A 2.0±0.6
Group B 1.6±0.5
Group C 2.0±1.1
Effective drugs a 5.6±0.7
Two-month culture conversion 88 (44.7)
Six-month culture conversion 128 (65.0)
Time to culture conversion, months b 4 (2, 14)
Treatment outcome
Success 156 (79.2)
Failure 38 (19.3)
Death 1(0.5)
Lost to follow-up 2(1.0)
Group A, B and C drugs were referred to the multidrug-resistant tuberculosis treatment
guidelines released by the World Health Organization. MDR: multidrug-resistant tuberculosis;
XDR-TB: extensively drug-resistant tuberculosis; QD: once daily; BID: twice daily; TID:

three times a day. a: mean ± standard deviation
b: median (interquartile range)
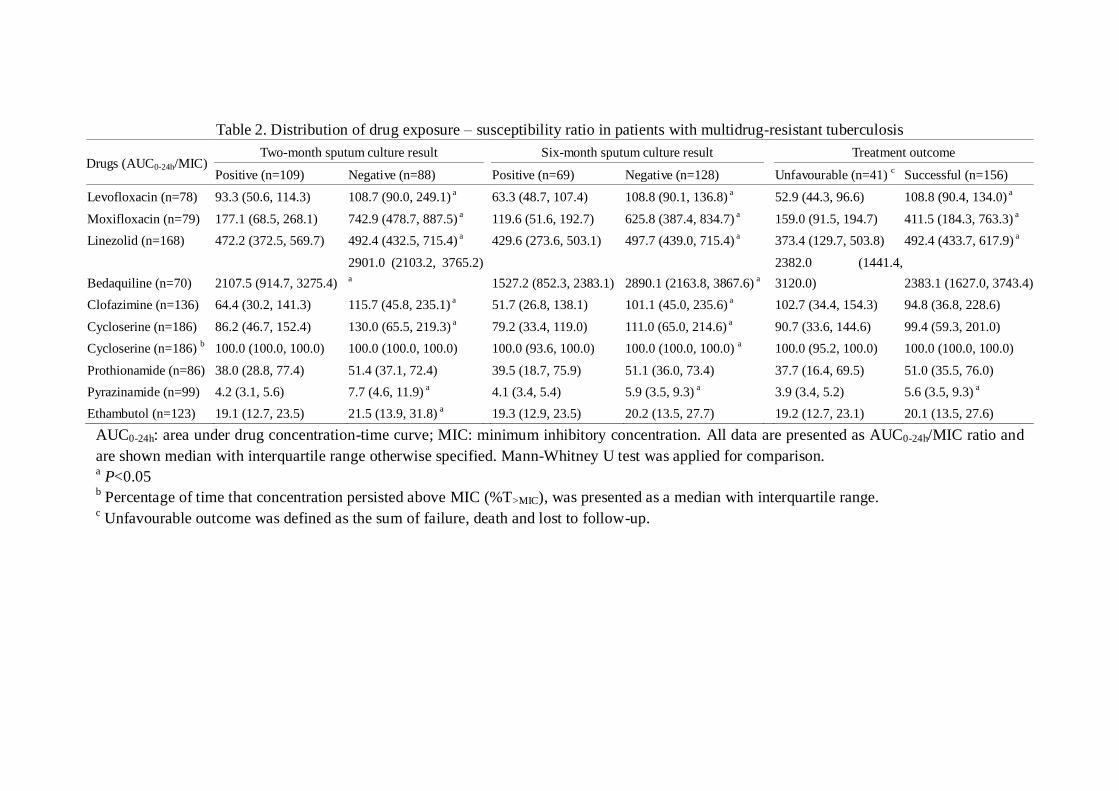
Table 2. Distribution of drug exposure – susceptibility ratio in patients with multidrug-resistant tuberculosis
Drugs (AUC0-24h/MIC) Two-month sputum culture result Six-month sputum culture result Treatment outcome
Positive (n=109) Negative (n=88) Positive (n=69) Negative (n=128) Unfavourable (n=41) c Successful (n=156)
Levofloxacin (n=78) 93.3 (50.6, 114.3) 108.7 (90.0, 249.1) a
63.3 (48.7, 107.4) 108.8 (90.1, 136.8) a
52.9 (44.3, 96.6) 108.8 (90.4, 134.0) a
Moxifloxacin (n=79) 177.1 (68.5, 268.1) 742.9 (478.7, 887.5) a
119.6 (51.6, 192.7) 625.8 (387.4, 834.7) a
159.0 (91.5, 194.7) 411.5 (184.3, 763.3) a
Linezolid (n=168) 472.2 (372.5, 569.7) 492.4 (432.5, 715.4) a
429.6 (273.6, 503.1) 497.7 (439.0, 715.4) a
373.4 (129.7, 503.8) 492.4 (433.7, 617.9) a
Bedaquiline (n=70) 2107.5 (914.7, 3275.4)
2901.0 (2103.2, 3765.2)
a
1527.2 (852.3, 2383.1) 2890.1 (2163.8, 3867.6) a
2382.0 (1441.4,
3120.0) 2383.1 (1627.0, 3743.4)
Clofazimine (n=136) 64.4 (30.2, 141.3) 115.7 (45.8, 235.1) a
51.7 (26.8, 138.1) 101.1 (45.0, 235.6) a
102.7 (34.4, 154.3) 94.8 (36.8, 228.6)
Cycloserine (n=186) 86.2 (46.7, 152.4) 130.0 (65.5, 219.3) a
79.2 (33.4, 119.0) 111.0 (65.0, 214.6) a
90.7 (33.6, 144.6) 99.4 (59.3, 201.0)
Cycloserine (n=186) b 100.0 (100.0, 100.0) 100.0 (100.0, 100.0) 100.0 (93.6, 100.0) 100.0 (100.0, 100.0)
a 100.0 (95.2, 100.0) 100.0 (100.0, 100.0)
Prothionamide (n=86) 38.0 (28.8, 77.4) 51.4 (37.1, 72.4)
39.5 (18.7, 75.9) 51.1 (36.0, 73.4)
37.7 (16.4, 69.5) 51.0 (35.5, 76.0)
Pyrazinamide (n=99) 4.2 (3.1, 5.6) 7.7 (4.6, 11.9) a
4.1 (3.4, 5.4) 5.9 (3.5, 9.3) a
3.9 (3.4, 5.2) 5.6 (3.5, 9.3) a
Ethambutol (n=123) 19.1 (12.7, 23.5) 21.5 (13.9, 31.8) a
19.3 (12.9, 23.5) 20.2 (13.5, 27.7)
19.2 (12.7, 23.1) 20.1 (13.5, 27.6)
AUC0-24h: area under drug concentration-time curve; MIC: minimum inhibitory concentration. All data are presented as AUC0-24h/MIC ratio and
are shown median with interquartile range otherwise specified. Mann-Whitney U test was applied for comparison. a P<0.05
b Percentage of time that concentration persisted above MIC (%T>MIC), was presented as a median with interquartile range.
c Unfavourable outcome was defined as the sum of failure, death and lost to follow-up.

Table 3 Univariate and multivariate analysis for drug exposure - susceptibility ratio with two-month/six-month culture conversion
Two-month culture results
Six-month culture results
Negative (%) OR (95%CI) aOR (95%CI) a
Negative (%) OR (95%CI) aOR (95%CI) a
Fluoroquinolones (n=157)
The first quartile 3 (7.5) 1 1
7 (17.5) 1 1
The second quartile 9 (23.1) 3.70 (0.92, 14.9) 4.02 (0.91, 17.7)
22 (56.4) 6.10 (2.17, 17.1) 5.92 (1.93, 18.2)
The third quartile 26 (65.0) 22.9 (5.97, 87.8) 31.3 (6.61, 148.0)
33 (82.5) 22.2 (7.01, 70.4) 23.4 (6.38, 85.6)
The fourth quartile 29 (76.3) 39.7 (9.86, 160.2) 53.3 (10.6, 268.8)
34 (89.5) 40.1 (10.7, 149.8) 36.4 (8.31, 159.3)
Linezolid (n=168)
The first quartile 13 (31.0) 1 1
17 (40.5) 1 1
The second quartile 25 (59.5) 3.28 (1.34, 8.06) 2.91 (1.11, 7.64)
33 (78.6) 5.39 (2.06, 14.1) 4.92 (1.74, 13.9)
The third quartile 18 (42.9) 1.67 (0.68, 4.10) 1.36 (0.52, 3.57)
30 (71.4) 3.68 (1.48, 9.13) 2.85 (1.06, 7.64)
The fourth quartile 24 (57.1) 2.97 (1.22, 7.28) 2.59 (0.99, 6.78)
36 (85.7) 8.82 (3.05, 25.5) 8.52 (2.74, 26.4)
Bedaquiline (n=70)
The first quartile 6 (35.3) 1 1
7 (41.2) 1 1
The second quartile 10 (55.6) 2.29 (0.59, 8.94) 2.70 (0.62, 11.8)
14 (77.8) 5.00 (1.15, 21.8) 7.71 (1.43, 41.6)
The third quartile 15 (83.3) 9.17 (1.87, 44.9) 9.74 (1.64, 57.9)
15 (83.3) 7.14 (1.48, 34.4) 6.38 (1.04, 39.1)
The fourth quartile 11 (64.7) 3.36 (0.82, 13.7) 2.69 (0.52, 14.0)
15 (88.2) 10.7 (1.84, 62.5) 8.35 (1.11, 63.0)
Cycloserine (n=186)
The first quartile 17 (36.2) 1 1
23 (48.9) 1 1
The second quartile 16 (34.8) 0.94 (0.40, 2.20) 0.93 (0.37, 2.30)
28 (60.9) 1.62 (0.71, 3.70) 1.58 (0.65, 3.83)
The third quartile 17 (36.2) 1.00 (0.43, 2.32) 1.07 (0.44, 2.64)
30 (63.8) 1.84 (0.81, 4.20) 2.05 (0.84, 5.01)
The fourth quartile 30 (65.2) 3.31 (1.41, 7.74) 3.45 (1.38, 8.61)
38 (82.6) 4.96 (1.91, 12.9) 5.26 (1.88, 14.7)
Clofazimine (n=136)
The first quartile 10 (29.4) 1 1
18 (52.9) 1 1
The second quartile 16 (47.1) 2.13 (0.79, 5.79) 2.23 (0.79, 6.27)
25 (73.5) 2.47 (0.89, 6.83) 2.66 (0.91, 7.76)

The third quartile 17 (50.0) 2.40 (0.89, 6.51) 2.34 (0.83, 6.59)
20 (58.8) 1.27 (0.49, 3.31) 1.13 (0.41, 3.13)
The fourth quartile 21 (61.8) 3.88 (1.41, 10.7) 3.81 (1.34, 10.9)
30 (88.2) 6.67 (1.93, 23.1) 6.57 (1.81, 23.8)
Pyrazinamide (n=99)
The first quartile 5 (20.0) 1 1
14 (56.0) 1 1
The second quartile 5 (20.0) 1.00 (0.25, 4.00) 1.21 (0.27, 5.47)
9 (36.0) 0.44 (0.14, 1.38) 0.39 (0.11, 1.35)
The third quartile 8 (32.0) 1.88 (0.52, 6.84) 2.05 (0.51, 8.15)
14 (56.0) 1.00 (0.33, 3.06) 0.96 (0.30, 3.12)
The fourth quartile 17 (70.8) 9.71 (2.60, 36.3) 12.5 (2.81, 55.3)
20 (83.3) 3.93 (1.04, 14.9) 3.30 (0.81, 13.5)
Prothionamide (n=86)
The first quartile 8 (36.4) 1 1
11 (50.0) 1 1
The second quartile 9 (42.9) 1.31 (0.39, 4.47) 1.08 (0.25, 4.64)
15 (71.4) 2.50 (0.71, 8.84) 3.16 (0.78, 12.8)
The third quartile 15 (68.2) 3.75 (1.08, 13.1) 5.88 (1.33, 25.9)
17 (77.3) 3.40 (0.93, 12.5) 4.08 (1.00, 16.7)
The fourth quartile 8 (38.1) 1.08 (0.31, 3.71) 1.11 (0.27, 4.53)
13 (61.9) 1.63 (0.48, 5.47) 1.77 (0.47, 6.60)
Ethambutol (n=123)
The first quartile 11 (35.5) 1 1
19 (61.3) 1 1
The second quartile 11 (35.5) 1.00 (0.35, 2.83) 0.77 (0.25, 2.42)
19 (61.3) 1.00 (0.36, 2.78) 0.70 (0.23, 2.17)
The third quartile 11 (35.5) 1.00 (0.35, 2.83) 0.83 (0.27, 2.53)
17 (54.8) 0.77 (0.28, 2.11) 0.52 (0.17, 1.60)
The fourth quartile 19 (63.3) 3.14 (1.10, 8.93) 2.38 (0.76, 7.40)
24 (80.0) 2.53 (0.80, 7.98) 1.47 (0.42, 5.17)
OR: odds ratio; CI: confidence interval a adjusted according to current smoking, diabetes mellitus type 2, time to culture positivity at baseline and effective drug numbers at the onset of
treatment

Table 4 Univariate and multivariate analysis for drug exposure - susceptibility ratio with treatment outcome and time to culture conversion
Treatment outcome
Time to culture conversion
Successful (%) OR (95%CI) aOR (95%CI) a
Time to conversion (IQR) HR (95%CI) aHR (95%CI) a
Fluoroquinolones (n=157)
The first quartile 22 (55.0) 1 1
20 (12.5, 24) 1 1
The second quartile 30 (76.9) 2.73 (1.03, 7.2) 2.09 (0.73, 6.04)
6 (4, 10) 2.14 (1.22, 3.74) 1.97 (1.10, 3.52)
The third quartile 35 (87.5) 5.73 (1.86, 17.64) 4.16 (1.19, 14.49)
2 (1, 6) 3.62 (2.10, 6.26) 3.82 (2.14, 6.83)
The fourth quartile 37 (97.4) 30.27 (3.78, 242.72) 24.81 (2.68, 229.61)
1 (1, 2.5) 6.26 (3.61, 10.9) 6.49 (3.53, 12.0)
Linezolid (n=168)
The first quartile 25 (59.5) 1 1
14 (1.8, 24) 1 1
The second quartile 41 (97.6) 27.88 (3.49, 222.54) 30.29 (3.51, 261.57)
2 (1, 6) 2.71 (1.63, 4.49) 2.45 (1.45, 4.14)
The third quartile 37 (88.1) 5.03 (1.64, 15.4) 4.93 (1.45, 16.72)
4 (1.8, 10.5) 1.98 (1.19, 3.30) 1.79 (1.06, 3.03)
The fourth quartile 39 (92.9) 8.84 (2.35, 33.3) 8.94 (2.25, 35.56)
2 (1.8, 6) 2.58 (1.54, 4.31) 2.30 (1.35, 3.90)
Bedaquiline (n=70)
The first quartile 16 (94.1) 1 1
10 (1.5, 14) 1 1
The second quartile 16 (88.9) 0.5 (0.04, 6.08) 0.92 (0.06, 15.18)
2 (1, 6.5) 1.31 (0.65, 2.64) 1.57 (0.76, 3.26)
The third quartile 16 (88.9) 0.5 (0.04, 6.08) 0.85 (0.06, 12.23)
1 (0.9, 2) 1.67 (0.83, 3.37) 1.96 (0.89, 4.33)
The fourth quartile 17 (100) / /
2 (1, 6) 1.98 (0.98, 4.02) 1.76 (0.76, 4.11)
Cycloserine (n=186)
The first quartile 34 (72.3) 1 1
8 (2, 24) 1 1
The second quartile 38 (82.6) 1.82 (0.67, 4.91) 1.84 (0.62, 5.4)
6 (2, 20) 1.22 (0.77, 1.94) 1.17 (0.73, 1.87)
The third quartile 32 (68.1) 0.82 (0.34, 1.98) 0.9 (0.34, 2.38)
6 (2, 24) 0.98 (0.61, 1.60) 0.99 (0.61, 1.61)
The fourth quartile 42 (91.3) 4.01 (1.2, 13.44) 4.87 (1.28, 18.49)
2 (1, 4) 2.18 (1.38, 3.45) 2.06 (1.30, 3.27)
Clofazimine (n=136)
The first quartile 28 (82.4) 1 1
6 (2, 15.5) 1 1
The second quartile 29 (85.3) 1.24 (0.34, 4.54) 0.83 (0.2, 3.45)
4 (1, 8.5) 1.29 (0.76, 2.17) 1.22 (0.72, 2.06)

The third quartile 25 (73.5) 0.6 (0.19, 1.91) 0.48 (0.13, 1.76)
3 (1, 24) 1.03 (0.6, 1.77) 0.98 (0.57, 1.69)
The fourth quartile 31 (91.2) 2.21 (0.51, 9.7) 2.14 (0.43, 10.74)
2 (1, 6) 1.7 (1.01, 2.84) 1.65 (0.98, 2.78)
Pyrazinamide (n=99)
The first quartile 16 (64.0) 1 1
4 (4, 24) 1 1
The second quartile 12 (48.0) 0.52 (0.17, 1.61) 0.44 (0.13, 1.51)
24 (4, 24) 0.65 (0.31, 1.38) 0.64 (0.30, 1.37)
The third quartile 17 (68.0) 1.2 (0.37, 3.86) 1.15 (0.34, 3.94)
6 (2, 24) 1.17 (0.59, 2.32) 1.14 (0.57, 2.26)
The fourth quartile 23 (95.8) 12.94 (1.49, 112.4) 9.51 (1.04, 87.14)
2 (2, 5.5) 2.47 (1.30, 4.72) 2.24 (1.14, 4.39)
Prothionamide (n=86)
The first quartile 14 (63.6) 1 1
7 (2, 24) 1 1
The second quartile 19 (90.5) 5.43 (1, 29.61) 8.16 (1.2, 55.34)
4 (2, 20) 1.69 (0.85, 3.37) 1.48 (0.73, 3.00)
The third quartile 18 (81.8) 2.57 (0.64, 10.31) 3.36 (0.7, 16.09)
2 (0.5, 9) 2.12 (1.05, 4.27) 2.46 (1.18, 5.09)
The fourth quartile 17 (81.0) 2.43 (0.6, 9.78) 2.72 (0.58, 12.75)
4 (2, 11) 1.57 (0.77, 3.19) 1.49 (0.72, 3.08)
Ethambutol (n=123)
The first quartile 23 (74.2) 1 1
4 (2, 24) 1 1
The second quartile 22 (71.0) 0.85 (0.28, 2.6) 0.64 (0.19, 2.19)
4 (2, 24) 0.92 (0.51, 1.64) 0.78 (0.43, 1.43)
The third quartile 20 (64.5) 0.63 (0.21, 1.88) 0.48 (0.15, 1.58)
6 (2, 24) 0.84 (0.46, 1.52) 0.75 (0.41, 1.39)
The fourth quartile 27 (90.0) 3.13 (0.74, 13.2) 1.7 (0.36, 8.05)
2 (1, 6) 1.92 (1.10, 3.36) 1.58 (0.88, 2.84)
OR: odds ratio; IQR: interquartile range; HR: hazard ratio; CI: confidence interval a adjusted according to current smoking, diabetes mellitus type 2, time to culture positivity at baseline and effective drug numbers at the onset of
treatment

Table 5 Association between drug exposure – susceptibility targets and treatment response in patients with multidrug-resistant tuberculosis a
Drugs (AUC0-24h/MIC) Overall Two-month sputum culture result
Six-month sputum culture result
Treatment outcome
Negative (%) aOR (95%CI) b
Negative (%) aOR (95%CI) b
Successful (%) aOR (95%CI) b
Moxifloxacin (n=79)
≤56 10 (12.7) 0 (0.0) /
1 (10.0) 1
8 (80.0) 1
>56 69 (87.3) 34 (49.3) /
45 (65.2) 15.6 (1.48, 165.0) C
60 (87.0) 1.15 (0.08, 6.95)
Levofloxacin (n=78)
≤160 67 (85.9) 22 (32.8) /
39 (58.2) /
45 (67.2) /
>160 11 (14.1) 11 (100.0) /
11 (100.0) /
11 (100.0) /
Fluoroquinolones (n=157)
≤target 77 (49.0) 22 (28.6) 1
40 (51.9) 1
53 (68.8) 1
>target 80 (51.0) 45 (56.3) 2.91 (1.42, 5.94) c
56 (70.0) 1.63 (0.79, 3.36)
71 (88.8) 2.89 (1.16, 7.17) c
Linezolid (n=168)
≤119 5 (3.0) 0 (0.0) /
0 (0.0) /
0 (0.0) /
>119 163 (97.0) 80 (49.1) /
116 (71.2) /
142 (87.1) /
Cycloserine (n=186)
≤25.8 18 (9.7) 7 (38.9) 1
8 (44.4) 1
11 (61.1) 1
>25.8 168 (90.3) 73 (43.5) 1.03 (0.36, 2.96)
111 (66.1) 2.21 (0.78, 6.32)
135 (80.4) 2.37 (0.78, 7.21)
Pyrazinamide (n=99)
≤11.3 88 (88.9) 25 (28.4) 1
46 (52.3) /
57 (64.8) /
>11.3 11 (11.1) 10 (90.9) 31.4 (3.50, 281.1) c
11 (100.0) /
11 (100.0) /
Prothionamide (n=86)
≤56.2 48 (55.8) 21 (43.8) 1
30 (62.5) 1
37 (77.1) 1
>56.2 38 (44.2) 19 (50.0) 1.63 (0.60, 4.45)
26 (68.4) 1.36 (0.51, 3.61)
31 (81.6) 1.49 (0.46, 4.79)
Ethambutol (n=123)

≤119 123 (100.0) 52 (42.3) /
79 (64.2) /
92 (74.8) /
>119 0 (0.0) / /
/ /
/ /
AUC0-24h: area under drug concentration-time curve; MIC: minimum inhibitory concentration. “/” indicates the 95%CI was infinite due to the
small number of patients in subgroup. a No AUC0-24h/MIC targets were found for prothionamide, bedaquiline and clofazimine in published studies. As an alternative, the AUC0-24h/MIC
target of ethionamide was applied for prothionamide in this study. b adjusted according to current smoking, diabetes mellitus type 2, time to culture positivity at baseline and effective drug numbers at the onset of
treatment c P<0.05 and 95%CI of OR did not include 1
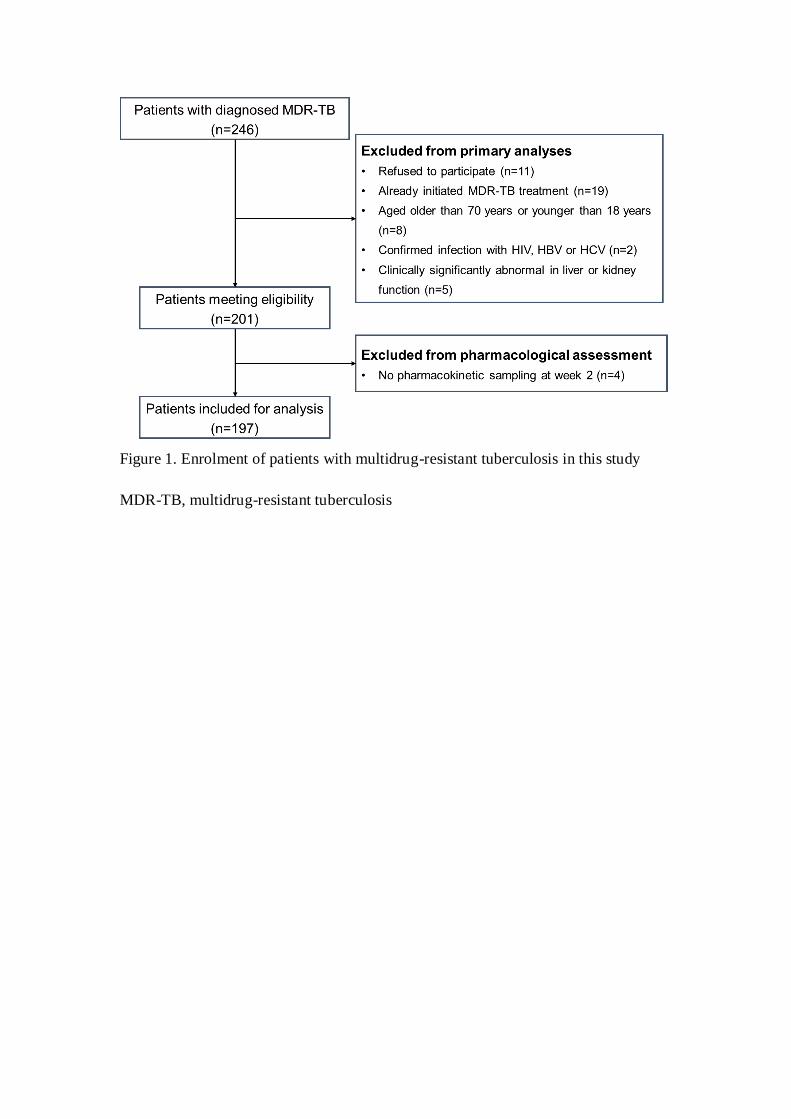
Figure 1. Enrolment of patients with multidrug-resistant tuberculosis in this study
MDR-TB, multidrug-resistant tuberculosis

Figure 2. Time to culture conversion among patients with multidrug-resistant
tuberculosis grouped by quartiles of drug exposure – susceptibility ratio

Figure 3. Random Forest and Classification and Regression Tree analysis for six-month sputum culture conversion among patients receiving
“Moxifloaxin+Linezolid+/-Bedaquiline” (A) and “Levofloxacin+Linezolid+/-Bedaquiline” (B) based regimen. AUC0-24h: area under drug
concentration-time curve; MIC: minimum inhibitory concentration; TTP: time to culture positivity.

S1 Microbiological laboratory work
Cultures
For the diagnosis of tuberculosis, primary isolation and culture were performed using
the BD MGIT960 system according to the manufacturer (BACTEC MGIT 960,
Becton Dickinson, Franklin Lakes, NJ, USA). After turning positive, MGIT 960
inoculum was directly used for phenotypic drug susceptibility testing and also
inoculated onto Lowenstein-Jensen medium for determination of minimum inhibitory
concentration.
Chemicals
All studied drugs were ordered in chemical pure form including: prothionamide
(Riemser, Germany), bedaquiline (Janssen, USA), clofazimine (Sigma-Aldrich,
Germany), linezolid (Sigma-Aldrich, Germany), moxifloxacin (Bayer Health Care
AG, Germany), levofloxacin (Spring Hourse, PA), cycloserine (Sigma-Aldrich,
Germany), pyrazinamide (Sigma-Aldrich, Germany) and ethambutol (Sigma-Aldrich,
Germany). As manufacturer recommended, all the chemicals were stored at -20℃.
Levofloxacin was dissolved in deionized water, while moxifloxacin was in 0.1 M
NaOH with subsequent dilutions in deionized water. All stock solutions were
sterilized using 0.22 μm-pore sized membrane filtration (Millipore, Bedford, MA) and
then stored at -80℃ until use. The frozen solution was used immediately after thawing.
The working solution was prepared freshly from the stock solution and the serial
dilutions were carried out to achieve the desired concentrations.

Phenotypic drug susceptibility testing (DST)
The inoculum prepared from MGIT tubes was standardized to a 0.5 McFarland
standard and 0.5ml of bacterial suspension was inoculated to each drug containing
tube. For the drug-free growth control preparation, the M. tuberculosis suspension
was diluted 1:100 in sterile saline and 0.5ml of dilution was inoculated (proportion
testing). Due to specific pH requirements, pyrazinamide (PZA) susceptibility was
determined using the BACTEC MGIT 960 PZA susceptibility test, with a pH of 5.9 as
previously described (1). Referred to the WHO technical guideline, critical
concentrations were used for the classification of strains into resistant or susceptible.
Minimum inhibitory concentration (MIC) determination
MIC determination was performed with MGIT 960 growth supplement in the
BACTEC MGIT 960 system (Becton Dickinson) as well. Briefly, the bacterial
suspension was prepared from 2- to 3-week fresh subcultures performed on
Lowenstein-Jensen medium. A suspension of 1.0 McFarland Standard was prepared
and allowed to rest for around 20 min in order for large bacterial clumps to settle. The
supernatant was transferred to another sterile tube and allowed to rest for another 15
min before transferring the supernatant to another tube and adjusted to 0.5 mg/ml
using M7H9. This suspension was diluted 1:5 in sterile physiological water to be used
as MIC inoculum. The drug-free control was inoculated with 0.5 ml of a 1:100
dilution of inoculum representing 1% of the bacterial population. The MIC was
determined to be the lowest drug concentration that tested susceptible.

Quality assurance
All these tests were done in duplicates of the studied isolates. In addition, H37Rv
reference strains (ATCC 27294) were included in each batch for inter- and intra-run
quality control. For internal quality assurance, DST was repeated for 10% of the
isolates by the collaborating Jiangsu Province-level reference laboratory who had
passed the WHO’s external quality control with a consistency of over 98%. For
external quality assessment, 5% of isolates were sent to Shanghai Public Health
Clinical Centre, serving as WHO collaborating centre for clinical management,
training and research on emerging and re-emerging infectious diseases. The
consistency between the two rounds was over 95%.
Reference
1. WHO. Technical manual for drug susceptibility testing of medicines used in the
treatment of tuberculosis. 2018. [Available from:
https://www.who.int/tb/publications/2018/WHO_technical_drug_susceptibility_testin
g/en/]

S2 LC-MS/MS methods for measurement of linezolid, bedaquiline, cycloserine
and clofazimine
Plasma concentrations of linezolid, bedaquiline, cycloserine and clofazimine were
determined using a validated liquid chromatography with tandem mass spectrometry
method (LC-MS/MS) in Agilent co-constructed laboratory, department of
environment science, Fudan University. The linezolid-d3, bedaquiline-d6,
carbamazepine and clofazimine-d7 were used as the internal standards.
Chromatographic separations were performed on a 30 mm Polaris C18 column
(Agilent Technology) with a gradient elution. Mobile phases consisted of 25% 0.01 M
ammonium formate (pH 4) and 75% methanol, with a flow rate of 1.5 ml/min.
Positive ionization mode and multiple reaction monitoring were applied for detection
of linezolid, bedaquiline, cycloserine and clofazimine with m/z of 338.01 → 296.03,
555.2 → 58.0, 335.9 →157.2 and 473.8→431.4, respectively. The analytical ranges
for linezolid, bedaquiline, cycloserine and clofazimine were 0.001~30, 0.001~40.0,
0.0033~40.0 and 0.004~40.0 mg/L, respectively, with good linearity of r2 > 99.83%
for all analyses. The inter- and intra-day variation ranged from 2.3% to 8.5% for all
drugs.

S3 Random Forest, Classification and Regression Tree and modified Poisson
regression analysis
To control heterogeneity within and between study populations, Random Forest and
Classification and Regression Tree (CART) analysis were performed among patients
receiving identical Group A-based regimen. A two-step approach was applied for data
analysis. Firstly, Random Forest was used to generate relative variable importance
ranking scores for each variable in prediction of six-month culture conversion. One
thousand trees were conducted with out of bag data for testing. Variable importance
was calculated on the basis of the number of times each variable was used for splitting
the data. The most important variable was applied as the reference, i.e. a score of
100%, while subsequent variables were scored relative to the first one. Overall, 22
potential predictors were assessed in the model, including AUC0-24h/MIC of
levofloxacin, moxifloxacin, linezolid, bedaquiline, cycloserine, clofazimine,
prothionamide, pyrazinamide and ethambutol, number of group A, group B and group
C drugs, sex, age, weight, current smoking, diabetes mellitus type 2, baseline time to
culture positivity, severe disease, extensive pulmonary disease, pulmonary cavity and
baseline drug susceptibility profile.
Then, CART analysis was used to identify the key predictors predictive of six-month
sputum culture conversion and to determine their cut-off values from the top ten
variables identified in Random Forest. As a nonparametric method, CART analysis

uses binary recursive partitioning to assign patients to homogenous groups on the
basis of Gini criterion function. The results were presented in the form of intuitive and
easy-to-interpret decision trees, which had the advantage of handling missing data by
identifying and using surrogate variables to minimize ascertainment bias. The root
node, considered as the primary predictor, was applied for splitting nodes. The fully
growing trees were pruned to avoid overmatching. The tree within one standard error
of minimum was chosen as the optimal one, which is comparable to the minimum
cost tree but less complex. We applied receiver operating characteristic (ROC)
analysis and 10-fold cross-validation to evaluate the goodness-of-fit for each model.
Finally, given the advantages of numerically stable procedure and no convergence
problem, modified Poisson regression model was applied to estimate risk ratio.
Subsequently, the Cox proportional hazard regression model was used to calculate
hazard ratio for the cut-off values derived from CART analysis. Both these two
analyses were adjusted for current smoking, diabetes mellitus type 2, time to culture
positivity at baseline and effective drug numbers at the onset of treatment.

Table S1. Demographic and clinical characteristics of patients with
multidrug-resistant tuberculosis in different treatment response groups
No. (%) of patients with No. (%) of patients with No. (%) of patients with
Characteristics
two-month sputum culture
six-month sputum culture
treatment outcome
Positive
(n=109)
Negative
(n=88)
Positive
(n=69)
Negative
(n=128)
Unfavourable
(n=41)
Successful
(n=156)
Age, years a 42.2±10.0 41.9±9.9
43.2±10.7 41.4±9.4
44.6±11.8 41.4±9.3
Sex
Male 75 (53.6) 65 (46.4)
45 (32.1) 95 (67.9)
27 (19.3) 113 (80.7)
Female 34 (59.6) 23 (40.4)
24 (42.1) 33 (57.9)
14 (24.6) 43 (75.4)
Body mass index a 21.1±4.8 20.4±4.2
21.5±5.0 20.4±4.3
21.8±5.2 20.5±4.4
Current smoking
No 43 (47.8) 47 (52.2)
24 (26.7) 66 (73.3) b
15 (16.7) 75 (83.3)
Yes 66 (61.7) 41 (38.3)
45 (42.1) 62 (57.9)
26 (24.3) 81 (75.7)
Diabetes type 2
No 83 (52.9) 74 (47.1)
49 (31.2) 108 (68.8) b
29 (18.5) 128 (81.5)
Yes 26 (65.0) 14 (35.0)
20 (50.0) 20 (50.0)
12 (30.0) 28 (70.0)
Severe disease
No 77 (54.6) 64 (45.4) 48 (34.0) 93 (66.0) 26 (18.4) 115 (81.6)
Yes 32 (57.1) 24 (42.9) 21 (37.5) 35 (62.5) 15 (26.8) 41 (73.2)
Extensive pulmonary disease
No 85 (53.5) 74 (46.5) 53 (33.3) 106 (66.7) 29 (18.2) 130 (81.8)
Yes 24 (63.2) 14 (36.8) 16 (42.1) 22 (57.9) 12 (31.6) 26 (68.4)
TTP, days a 11.2±3.0 12.8±2.7 b
10.9±2.8 12.5±2.9 b
10.2±2.7 12.4±2.9 b
DST profile
MDR-TB alone 91 (56.9) 69 (43.1) 62 (38.8) 98 (61.2) b
34 (21.3) 126 (78.7)
Pre-XDR-TB 18 (48.6) 19 (51.4) 7 (18.9) 30 (81.1)
7 (18.9) 30 (81.1)
Drug intake
Levofloxacin 45 (57.7) 33 (42.3)
28 (35.9) 50 (64.1)
22 (28.2) 56 (71.8) b
Moxifloxacin 45 (57.0) 34 (43.0)
33 (41.8) 46 (58.2)
11 (13.9) 68 (86.1)
Linezolid 88 (52.4) 80 (47.6)
52 (31.0) 116 (69.0) b
26 (15.5) 142 (84.5) b
Bedaquiline 28 (40.0) 42 (60.0)
19 (27.1) 51 (72.9)
5 (7.1) 65 (92.9) b
Clofazimine 72 (52.9) 64 (47.1)
43 (31.6) 93 (68.4)
23 (16.9) 113 (83.1) b
Cycloserine 106 (57.0) 80 (43.0)
67 (36.0) 119 (64.0)
40 (21.5) 146 (78.5)
Prothionamide 46 (53.5) 40 (46.5)
30 (34.9) 56 (65.1) b
18 (20.9) 68 (79.1)
Pyrazinamide 64 (64.6) 35 (35.4)
42 (42.4) 57 (57.6)
31 (31.3) 68 (68.7) b
Ethambutol 71 (57.7) 52 (42.3)
44 (35.8) 79 (64.2)
31 (25.2) 92 (74.8)
Number of drugs in a
Group A 1.9±0.7 2.2±0.6 b
1.9±0.7 2.1±0.6
1.6±0.5 2.1±0.6 b
Group B 1.6±0.5 1.6±0.5
1.7±0.5 1.6±0.5
1.7±0.5 1.6±0.5
Group C 2.0±1.1 2.1±1.1
2.0±1.0 2.0±1.1
2.0±0.9 2.0±1.1
Effective drugs a 5.6±0.6 5.7±0.7
5.7±0.6 5.6±0.7
5.6±0.6 5.7±0.7

DST: drug susceptibility testing; TTP: time to culture positivity recorded by the MGIT 960
system. Group A, B and C drugs were referred to the multidrug-resistant tuberculosis
treatment guidelines released by the World Health Organization. a: mean ± standard deviation
b: P<0.05

Figure S1. Treatment responses in patients with multidrug-resistant tuberculosis receiving different type and number of Group A drugs

Table S2. Drug change and adverse events during the treatment in correspondence to
the treatment categories
No. (%) of Patients treated with
FQs+LZD+BDQ
(n=40)
FQs+LZD
(n=88)
LZD+BDQ
(n=30)
Others
(n=39)
Drug change during the treatment
Group A regimen 3(7.5) 1(1.1) 2(6.7) 0(0.0)
Group B regimen 6(15.0) 4(4.5) 3(10.0) 3(7.7)
Group C regimen 0(0) 1(1.1) 0(0) 1(2.6)
Adverse events a
Gastrointestinal disorders 13(32.5) 31(35.2) 10(33.3) 12(30.8)
Psychiatric disorders 5(12.5) 12(13.6) 6(20.0) 6(15.4)
Central nerve system disorders 1(2.5) 3(3.4) 3(10.0) 3(7.7)
Peripheral neuropathy 3(7.5) 6(6.8) 2(6.7) 1(2.6)
Liver injury 2(5.0) 7(8.0) 2(6.7) 5(12.8)
Kidney injury 1(2.5) 4(4.5) 2(6.7) 0(0.0)
Anaemia 5(12.5) 14(15.9) 5(16.7) 2(5.1)
QTc prolongation 12(30) 3(3.4) 8(26.7) 2(5.1)
Others (pain, skin hyperpigmentation, et al) 5(12.5) 14(15.9) 4(13.3) 6(15.4)
FQs: fluoroquinolones; LZD: linezolid; BDQ: bedaquiline a Adverse events were defined as follows:
Gastrointestinal disorders: presence of nausea, vomiting, abdominal pain, diarrhea,
epigastric discomfort, hematemesis, melena, and positive endoscopic findings;
Psychiatric disorders: presence of depression, anxiety, psychosis, suicide, nightmares,
and convulsion;
Central nervous system disorders: headache and seizure activity as reported by patient
or witness;
Peripheral neuropathy: numbness, weakness, tingling, dizziness, burning/pain in the
extremities, diagnosed by physician or electromyography;
Liver injury: alanine transaminase elevations above five times the upper limit of
normal (ULN) or above three times the ULN with total bilirubin above 2 times the
ULN;
Kidney injury: an abnormal estimated glomerular filtration rate based on serum
creatinine using the Modification of Diet in Renal Disease formula;
Anaemia: haemoglobin level below 120 g/L for women and 130 g/L for men;
QTc prolongation: a corrected QT interval with the use of Fridericia's formula of more
than 450 msec.
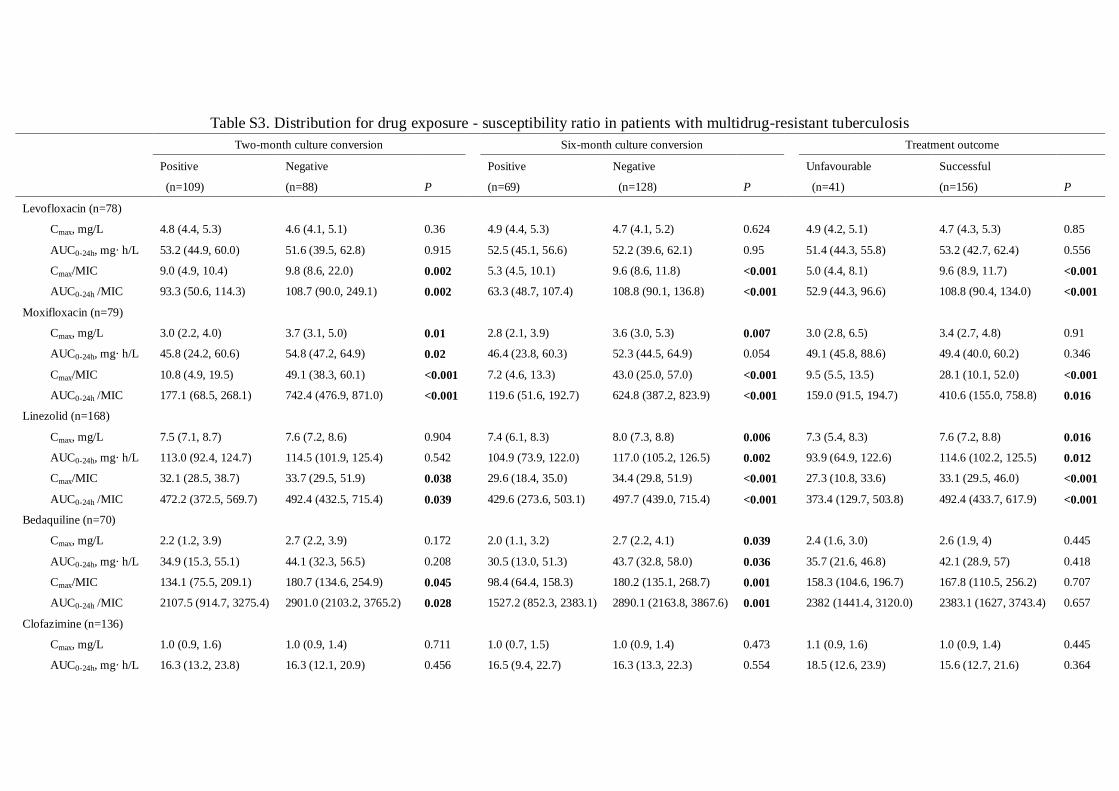
Table S3. Distribution for drug exposure - susceptibility ratio in patients with multidrug-resistant tuberculosis
Two-month culture conversion
Six-month culture conversion
Treatment outcome
Positive
(n=109)
Negative
(n=88) P
Positive
(n=69)
Negative
(n=128) P
Unfavourable
(n=41)
Successful
(n=156) P
Levofloxacin (n=78)
Cmax, mg/L 4.8 (4.4, 5.3) 4.6 (4.1, 5.1) 0.36
4.9 (4.4, 5.3) 4.7 (4.1, 5.2) 0.624
4.9 (4.2, 5.1) 4.7 (4.3, 5.3) 0.85
AUC0-24h, mg· h/L 53.2 (44.9, 60.0) 51.6 (39.5, 62.8) 0.915
52.5 (45.1, 56.6) 52.2 (39.6, 62.1) 0.95
51.4 (44.3, 55.8) 53.2 (42.7, 62.4) 0.556
Cmax/MIC 9.0 (4.9, 10.4) 9.8 (8.6, 22.0) 0.002
5.3 (4.5, 10.1) 9.6 (8.6, 11.8) <0.001
5.0 (4.4, 8.1) 9.6 (8.9, 11.7) <0.001
AUC0-24h /MIC 93.3 (50.6, 114.3) 108.7 (90.0, 249.1) 0.002
63.3 (48.7, 107.4) 108.8 (90.1, 136.8) <0.001
52.9 (44.3, 96.6) 108.8 (90.4, 134.0) <0.001
Moxifloxacin (n=79)
Cmax, mg/L 3.0 (2.2, 4.0) 3.7 (3.1, 5.0) 0.01
2.8 (2.1, 3.9) 3.6 (3.0, 5.3) 0.007
3.0 (2.8, 6.5) 3.4 (2.7, 4.8) 0.91
AUC0-24h, mg· h/L 45.8 (24.2, 60.6) 54.8 (47.2, 64.9) 0.02
46.4 (23.8, 60.3) 52.3 (44.5, 64.9) 0.054
49.1 (45.8, 88.6) 49.4 (40.0, 60.2) 0.346
Cmax/MIC 10.8 (4.9, 19.5) 49.1 (38.3, 60.1) <0.001
7.2 (4.6, 13.3) 43.0 (25.0, 57.0) <0.001
9.5 (5.5, 13.5) 28.1 (10.1, 52.0) <0.001
AUC0-24h /MIC 177.1 (68.5, 268.1) 742.4 (476.9, 871.0) <0.001
119.6 (51.6, 192.7) 624.8 (387.2, 823.9) <0.001
159.0 (91.5, 194.7) 410.6 (155.0, 758.8) 0.016
Linezolid (n=168)
Cmax, mg/L 7.5 (7.1, 8.7) 7.6 (7.2, 8.6) 0.904
7.4 (6.1, 8.3) 8.0 (7.3, 8.8) 0.006
7.3 (5.4, 8.3) 7.6 (7.2, 8.8) 0.016
AUC0-24h, mg· h/L 113.0 (92.4, 124.7) 114.5 (101.9, 125.4) 0.542
104.9 (73.9, 122.0) 117.0 (105.2, 126.5) 0.002
93.9 (64.9, 122.6) 114.6 (102.2, 125.5) 0.012
Cmax/MIC 32.1 (28.5, 38.7) 33.7 (29.5, 51.9) 0.038
29.6 (18.4, 35.0) 34.4 (29.8, 51.9) <0.001
27.3 (10.8, 33.6) 33.1 (29.5, 46.0) <0.001
AUC0-24h /MIC 472.2 (372.5, 569.7) 492.4 (432.5, 715.4) 0.039
429.6 (273.6, 503.1) 497.7 (439.0, 715.4) <0.001
373.4 (129.7, 503.8) 492.4 (433.7, 617.9) <0.001
Bedaquiline (n=70)
Cmax, mg/L 2.2 (1.2, 3.9) 2.7 (2.2, 3.9) 0.172
2.0 (1.1, 3.2) 2.7 (2.2, 4.1) 0.039
2.4 (1.6, 3.0) 2.6 (1.9, 4) 0.445
AUC0-24h, mg· h/L 34.9 (15.3, 55.1) 44.1 (32.3, 56.5) 0.208
30.5 (13.0, 51.3) 43.7 (32.8, 58.0) 0.036
35.7 (21.6, 46.8) 42.1 (28.9, 57) 0.418
Cmax/MIC 134.1 (75.5, 209.1) 180.7 (134.6, 254.9) 0.045
98.4 (64.4, 158.3) 180.2 (135.1, 268.7) 0.001
158.3 (104.6, 196.7) 167.8 (110.5, 256.2) 0.707
AUC0-24h /MIC 2107.5 (914.7, 3275.4) 2901.0 (2103.2, 3765.2) 0.028
1527.2 (852.3, 2383.1) 2890.1 (2163.8, 3867.6) 0.001
2382 (1441.4, 3120.0) 2383.1 (1627, 3743.4) 0.657
Clofazimine (n=136)
Cmax, mg/L 1.0 (0.9, 1.6) 1.0 (0.9, 1.4) 0.711
1.0 (0.7, 1.5) 1.0 (0.9, 1.4) 0.473
1.1 (0.9, 1.6) 1.0 (0.9, 1.4) 0.445
AUC0-24h, mg· h/L 16.3 (13.2, 23.8) 16.3 (12.1, 20.9) 0.456
16.5 (9.4, 22.7) 16.3 (13.3, 22.3) 0.554
18.5 (12.6, 23.9) 15.6 (12.7, 21.6) 0.364

Cmax/MIC 4.2 (1.9, 9.0) 7.8 (3.4, 15.4) 0.009
3.8 (1.9, 8.1) 7.0 (3.2, 15.5) 0.005
6.3 (2.0, 12.6) 5.9 (2.5, 15.0) 0.495
AUC0-24h /MIC 64.4 (30.2, 141.3) 115.7 (45.8, 235.1) 0.013
51.7 (26.8, 138.1) 101.1 (45.0, 235.6) 0.005
102.7 (34.4, 154.3) 94.8 (36.8, 228.6) 0.548
Cycloserine (n=186)
Cmax, mg/L 22.7 (15.4, 42) 27.9 (20.6, 43.0) 0.216
22.8 (11.7, 41.8) 24.1 (18.6, 43.0) 0.189
23.6 (15.8, 42.1) 23.0 (18.3, 42.8) 0.73
AUC0-24h, mg· h/L 465.4 (257.3, 688.9) 563.3 (349.2, 718) 0.274
478 (187.9, 679.7) 478.3 (318.4, 718.3) 0.24
479.3 (263.9, 678.6) 478.2 (313.9, 716.4) 0.683
Cmax/MIC 100.0 (100.0, 100.0) 100.0 (100.0, 100.0) 0.269
100.0 (93.6, 100.0) 100.0 (100.0, 100.0) 0.011
100.0 (95.2, 100.0) 100.0 (100.0, 100.0) 0.073
AUC0-24h /MIC 86.2 (46.7, 152.4) 130.0 (65.5, 219.3) 0.004
79.2 (33.4, 119) 111.0 (65.0, 214.6) 0.001
90.7 (33.6, 144.6) 99.4 (59.3, 201.0) 0.048
Prothionamide (n=86)
Cmax, mg/L 1.3 (1.1, 1.5) 1.3 (1.2, 1.7) 0.225
1.3 (1.1, 1.5) 1.3 (1.2, 1.6) 0.514
1.2 (1.0, 1.4) 1.3 (1.2, 1.6) 0.08
AUC0-24h, mg· h/L 21.6 (18.8, 25.2) 23.1 (21.0., 28.6) 0.158
20.9 (18.8, 25.5) 22.3 (20.5, 28.3) 0.306
20.2 (18.1, 24.4) 22.6 (20.7, 28.3) 0.06
Cmax/MIC 2.2 (1.5, 4.5) 3.0 (2.1, 4.4) 0.239
2.2 (1.1, 4.4) 3.0 (2.0, 4.4) 0.186
2.0 (1.0, 4.2) 2.9 (2.0, 4.5) 0.14
AUC0-24h /MIC 38.0 (28.8, 77.4) 51.4 (37.1, 72.4) 0.25
39.5 (18.7, 75.9) 51.1 (36.0, 73.4) 0.195
37.7 (16.4, 69.5) 51.0 (35.5, 76.0) 0.161
Pyrazinamide (n=99)
Cmax, mg/L 15.6 (12.4, 20.2) 16.5 (9.1, 19.2) 0.473
15.9 (12.6, 19.6) 16.3 (10.7, 20.4) 0.821
16.0 (13.2, 19.5) 16.0 (10.9, 20.4) 0.587
AUC0-24h, mg· h/L 253.5 (191.7, 332.4) 253.5 (150.5, 310.5) 0.409
248.3 (195.4, 332.3) 255.1 (169.5, 316.2) 0.605
250.2 (215.7, 332.3) 254.3 (169.6, 323.0) 0.449
Cmax/MIC 0.3 (0.2, 0.4) 0.5 (0.3, 0.7) <0.001
0.3 (0.2, 0.3) 0.4 (0.2, 0.6) 0.004
0.2 (0.2, 0.3) 0.4 (0.2, 0.5) 0.001
AUC0-24h /MIC 4.2 (3.1, 5.6) 7.7 (4.6, 11.9) <0.001
4.1 (3.4, 5.4) 5.9 (3.5, 9.3) 0.014
3.9 (3.4, 5.2) 5.6 (3.5, 9.3) 0.005
Ethambutol (n=123)
Cmax, mg/L 2.1 (1.5, 3.1) 2.7 (1.8, 3.3) 0.097
2.1 (1.5, 3.5) 2.4 (1.8, 3.2) 0.507
2.1 (1.5, 3.8) 2.3 (1.6, 3.2) 0.998
AUC0-24h, mg· h/L 19.4 (13.8, 26.4) 24.3 (15.5, 30.2) 0.132
19.5 (13.8, 37.9) 22.3 (15.4, 28.0) 0.839
19.4 (13.8, 40.3) 21.9 (14.4, 27.9) 0.749
Cmax/MIC 2.1 (1.4, 2.6) 2.3 (1.6, 3.6) 0.024
2.0 (1.4, 2.3) 2.2 (1.5, 3.2) 0.061
2.0 (1.5, 2.3) 2.2 (1.5, 3.2) 0.192
AUC0-24h /MIC 19.1 (12.7, 23.5) 21.5 (13.9, 31.8) 0.035
19.3 (12.9, 23.5) 20.2 (13.5, 27.7) 0.213
19.2 (12.7, 23.1) 20.1 (13.5, 27.6) 0.053
Cmax: maximum drug concentration; AUC0-24h: area under drug concentration-time curve; MIC: minimum inhibitory concentration. Results are
shown median with interquartile range. Mann-Whitney U test was applied for comparison.

Figure S2. The distribution of minimum inhibitory concentrations for second-line anti-tuberculosis drugs in study patients with
multidrug-resistant tuberculosis (n=197). Critical concentrations, recommended by the technical manual for drug susceptibility testing of
medicines used in the treatment of tuberculosis 2018, were presented as the dotted lines.
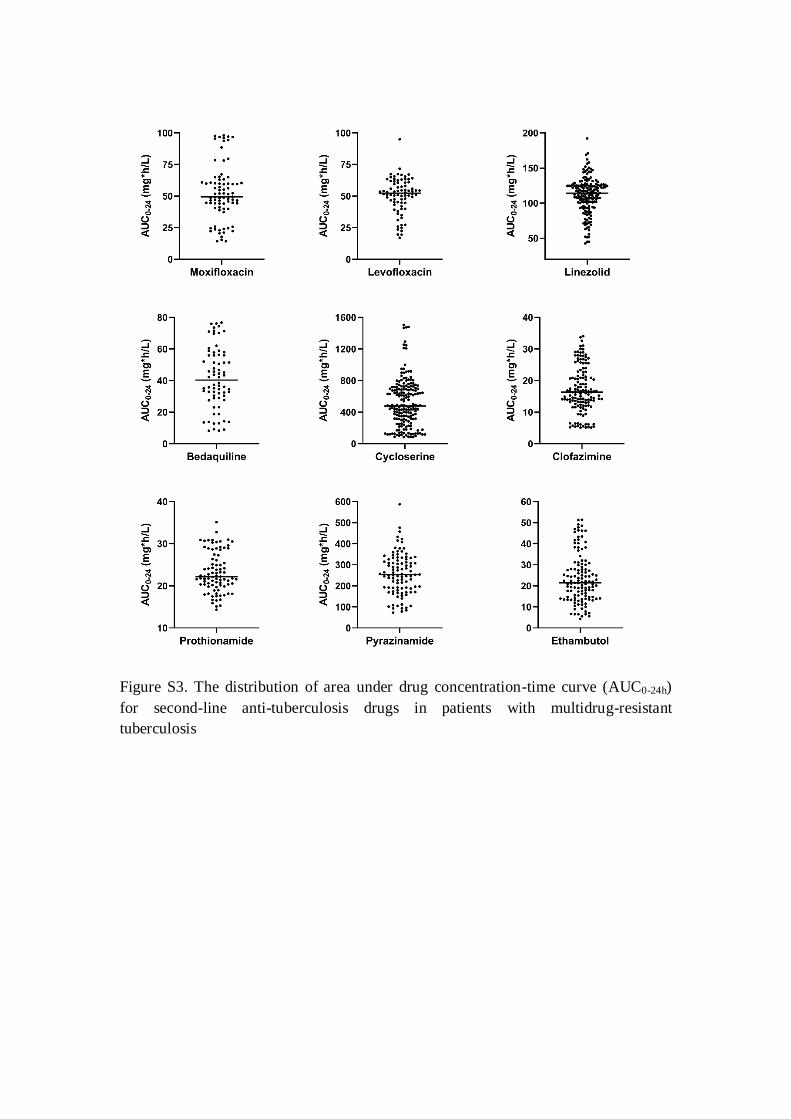
Figure S3. The distribution of area under drug concentration-time curve (AUC0-24h)
for second-line anti-tuberculosis drugs in patients with multidrug-resistant
tuberculosis

Table S4. Association between CART-derived drug exposure – susceptibility targets and six-month sputum culture conversion
Modified Poisson regression model
Cox proportional hazards regression model
No. of patients with
Sputum culture
conversion in
Month 6 (%)
RR (95%CI) aRR (95%CI) a
Median Time to
culture conversion
(IQR)
HR (95%CI) aHR (95%CI) a
“Moxifloxacin+Linezolid+/-Bedaquiline” (n=67)
Moxifloxacin AUC0-24h/MIC≤231 1 (3.8) 1 1
6 (6, 6) 1 1
Moxifloxacin AUC0-24h/MIC>231 40 (97.6) 25.4 (3.7, 173.5) 24.5 (3.4, 176.2)
1 (1, 1) 65.9 (8.8, 493.0) 71.7 (9.3, 550.9)
“Levofloxacin+Linezolid+/-Bedaquiline” (n=61)
Linezolid AUC0-24h/MIC≤287 1 (10.0) 1 1
6 (6, 6) 1 1
Linezolid AUC0-24h/MIC>287 42 (82.4) 8.2 (1.3, 53.1) 7.8 (1.2, 50.1)
2 (2, 2) 12.9 (1.8, 93.9) 13.4 (1.8, 100.3)
CART: classification and regression tree; IQR: interquartile range; RR: rate ratio; HR: hazard ratio. a adjusted according to smoking, diabetes mellitus type 2, time to culture positivity at baseline and effective drug numbers at the onset of
treatment

Figure S4. The distribution of minimum inhibitory concentration (MIC) and probability of target attainment for anti-tuberculosis drugs in
patients with multidrug-resistant tuberculosis. Patients were divided into four groups according to the quartiles of respective area under drug
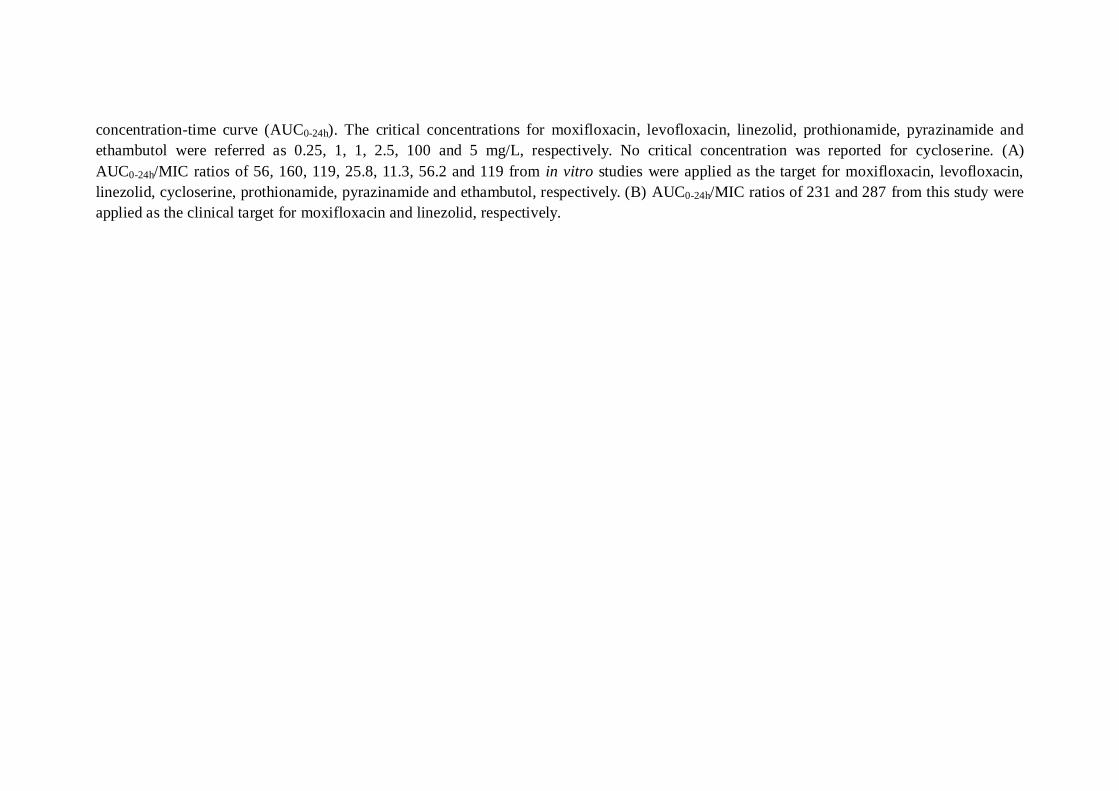
concentration-time curve (AUC0-24h). The critical concentrations for moxifloxacin, levofloxacin, linezolid, prothionamide, pyrazinamide and
ethambutol were referred as 0.25, 1, 1, 2.5, 100 and 5 mg/L, respectively. No critical concentration was reported for cycloserine. (A)
AUC0-24h/MIC ratios of 56, 160, 119, 25.8, 11.3, 56.2 and 119 from in vitro studies were applied as the target for moxifloxacin, levofloxacin,
linezolid, cycloserine, prothionamide, pyrazinamide and ethambutol, respectively. (B) AUC0-24h/MIC ratios of 231 and 287 from this study were
applied as the clinical target for moxifloxacin and linezolid, respectively.