Embed Size (px)
Citation preview

Simplified Understanding
M a r c h 2 0 1 7
DRIVING HABITS

Table of Contents
Introduction 3
Key Insights 7
Detailed Findings 11
2

Simplified Understanding
INTRODUCTION

Background & Objectives
4
• ICBC sought better understand current perceptions, attitudes, knowledge, skills and behaviours of BC drivers and establish potential baseline metrics for future waves of research to track progress on:
• Driving Knowledge (Self appraisal, Need for information - self and others) • Driving Skills (Appraisal, Need for improvement – self and others) • Behaviours (Quantify self-reported behavior, behavior of others) • Attitudes (Confidence in ability, sense of personal responsibility, openness to
change) • Perceptions (Self and Others, of risk and consequence, of driving quality,
challenges/concerns for drivers, recent changes to driving quality) • On road influences (such as courtesy, anger, emerging technologies, etc.)

Methodology & Sample
5
• The data presented in this report was collected via a 19-minute random online survey managed by Insights West.
• The survey was in-field February 20-28, 2017. • A total of interviews 1,126 interviews were conducted across British Columbia,
which was collected via Insights West’s Your Insights panel (1035n) and Maru panel (91n).
• Quotas set across regions to ensure minimum level of completes and data weighted to BC Census Population of Age, Gender and Region
• Participants screened to ensure they:• Live in British Columbia• Are over the age of 21• Have a valid driver’s licence • Not part of Graduated Licence Program, or only have motorcycle license• Do not have a job that mainly requires them to drive (e.g. Bus, taxi, truck driver)• Drive during the week (screened out if they average 0 hours/week)
Region Sample SizeLower Mainland 565Fraser Valley 91Vancouver Island 191Southern BC 94Northern BC 185Total 1126

Observations on the Data
6
• Findings cited as T2/B2 refer to the “Top 2” and “Bottom 2” answers for a particular question with a four-scale (i.e. “strongly agree” and “somewhat agree” would be T2, and “somewhat disagree” or “strongly disagree” would be B2.
• A sample of 1,126 British Columbians would yield a margin of error of +/- 2.9%, 19 times out of 20, for the entire province. The margin of error is higher among sub-groups, and in questions were a split-sample was utilized.

Simplified Understanding
KEY INSIGHTS

Key Insights
8
The Good
Practically All Drivers Are Aware of Their Own Importance in Keeping Roads SaferA strong majority (96%) of drivers feel everyone has a role to play in making the roads safer.
Most Drivers Give Themselves Pretty High Marks on their Prowess The majority of drivers (73%) feel they are “above average” drivers overall, and give themselves high ratings on safety (82%), attentiveness (79%), knowledge (78%) and courteousness (76%).
Some Drivers Tend to be More Careful When Passengers Are with ThemTwo-in-five drivers (43% say they “drive safer when others are in the car” with them, but the proportion drops with age: 54% for drivers aged 21-34, 43% for drivers aged 35-54 and 38% for drivers aged 55+.

Key Insights
9
The Bad
Drivers Report Having a Tougher Time Behind the WheelThe perception of greater congestion and traffic has led almost half of drivers (46%) to think that driving is now more challenging or harder than it was five years ago.
Drivers Are More Critical of their PeersAlmost three-in-five drivers (58%) believe that drivers are worse than they were five years ago. The top reasons cited are distractions while driving (31%) and drivers becoming more impatient or aggressive (30%).
The Impatience of Drivers Is Evident on Some QuestionsThe biggest “sin” (committed by more than half of drivers) is “passing someone who they thought was driving too slow” (56%). However, more than one-in-five have “gone well over the speed limit” (26%) or were “the second or third car in an intersection at a yellow light” (22%).

Key Insights
10
The Ugly
Some Drivers Admit to Not Following All RulesOne third of drivers believe it’s OK to bend the rules if there are no other drivers around, while 37% say that they try to make up time while driving if late for an appointment.
Not “Everyone Else” is AggressiveNearly one-in-five drivers (18%) say they have a high level of aggressiveness when they drive.
Distractions, Impatience Are Obvious ProblemsInattentive/distracted drivers are the most commonly cited frustration from drivers (32%), followed by aggressive/impatient drivers (29%).
“Not My Fault”Two-in-five drivers (43%) say someone else was responsible for the last “near miss” they experienced, while 25% blamed both parties and 18% acknowledged personal responsibility.

Simplified Understanding
DETAILED FINDINGS

About the
Same
38%
45%
The majority of drivers believe other drivers are worse than they were five years ago. Few drivers believe that driving is easier than five years ago, while nearly half believe it’s harder.
Driving Trends
12
Base: All respondents (n=1,126)A2. All things considered, would you say driving is now easier, about the same, or harder than five years ago? A4. Overall, would you say driversare better, about the same, or worse than they were five years ago?
58%
46%
2%
8%
BetterWorse OVERALL DRIVERSARE ____ Than 5
Years Ago
EasierHarder DRIVING IS ____ Than 5 Years Ago

About the
Same
45%
More congestion/traffic 79% More experienced / confident / better driver 39%
Bad driving behaviours / more bad drivers 37% Better/improved roads 22%
Poor road maintenance / infrastructure 9% Don't have to drive as much / driving less 14%Bad cyclist behaviours / more cyclists / more
bike lanes 8% Moved to area less busy/moved closer to work 12%
Construction 7%
Distracted driving / cell phones / texting 5%
More congestion/traffic is the top reason for drivers to believe that driving is harder now. The few who think driving is easier than cite their greater experience and improved roads.
Reasons DRIVING is Easier/Harder
13
A3.
46% 8%
EasierHarder
Reasons Driving is Harder(n=511)
Reasons Driving is Easier(n=75)
DRIVING IS ____ Than 5 Years Ago
About the
Same
38%
Distracted drivers 31%
Impatient drivers / Aggressive drivers 30%Speeding 13%
Lack of respect for driving rules/laws 13%More traffic/congestion 8%
Lack of skill/training 8%
Careless drivers 7%
Not signaling 7%Lack of knowledgeable of driving rules/laws 7%
The top reasons given as to why drivers are thought to be worse than five years ago are that they are more “distracted” and “impatient”.
Reasons DRIVERS Are Better/Worse
14
A3.
58% 2%
BetterWorse
Reasons Drivers are Worse(n=651)
Reasons Drivers are Better(n=22**) Base size too small to report.
Drivers Are ____ Than 5 Years Ago

Drivers are frustrated by a wide variety of factors, particularly distracted and disrespectful drivers.
Frustrations While Driving
15
Inattentive/distracted drivers (phones/texting)
Disrespectful drivers (aggressive, impatient)
Heavy traffic / congestion
SpeedingGeneral poor drivers/lack of skills/not following rules of
roadSlow drivers/driving slow in passing lane
Not signalingPoor lane usage/passing/merging/yielding/lane
changesRoads and lights poorly planned
Poor road maintenance
Tailgating
Other drivers don't know rules of road
Running a light/Not stopping at intersections
Weather /natural conditions
Bikers and cyclists/bike lanes
11%
9%
15%
8%
6%
8%
7%
3%
5%
5%
5%
2%
1%
3%
2%
32%29%
25%24%
20%17%17%16%
13%11%11%
6%6%5%5%
#1 Frustration Top Frustrations
Base: All respondents (n=1,126)B3. What are the top three things that frustrate you about driving in British Columbia?

OVERALL
Safety 18% 22%
Attentiveness 20% 23%
Knowledge 22% 35%
Courteousness 22% 23%
Confidence 25% 41%
Skill 28% 37%
Aggressiveness 38% 25%
Base: All respondents (n=1,126)B2. How would you rate your driving on the following attributes? B3. How would you rate yourself on the same characteristics, as compared to other drivers?
Approximately three-quarters of drivers rate their driving as “above average”. Most drivers believe their level of safety, attentiveness, knowledge, courteousness and skill is higher than other drivers on the road.
Personal Driving Ratings
16
20%
21%
22%
16%
14%
15%
4%
76%
75%
74%
63%
50%
60%
15%
Much higher HigherVery high Somewhat high
Rating of Self
Self Compared To Other Drivers
17%
36%
33%
31%
31%
31%
26%
3%
73%
82%
79%
78%
76%
71%
71%
18%
Excellent Above Average About the sameAverage

Average
OVERALL 26%
Safety 18%
Attentiveness 20%
Knowledge 22%
Courteousness 22%
Confidence 25%
Skill 28%
Aggressiveness 38%
Few drivers acknowledge that their skills are below average. Fewer than half of drivers say their level of aggressiveness while driving is low.
Rating of Self as Driver
17
Base: All respondents (n=1,126)B1. How would you rate your driving overall? Would you rate it as…? B2. How would you rate your driving on the following attributes?
15%
1%
<1%
1%
1%
1%
4%
1%
44%
17%
36%
33%
31%
31%
31%
26%
3%
73%
82%
79%
78%
76%
71%
71%
18%
Very high Somewhat highVery lowSomewhat low
Excellent Above averageVery poorBelow average
OVERALL
Neutral
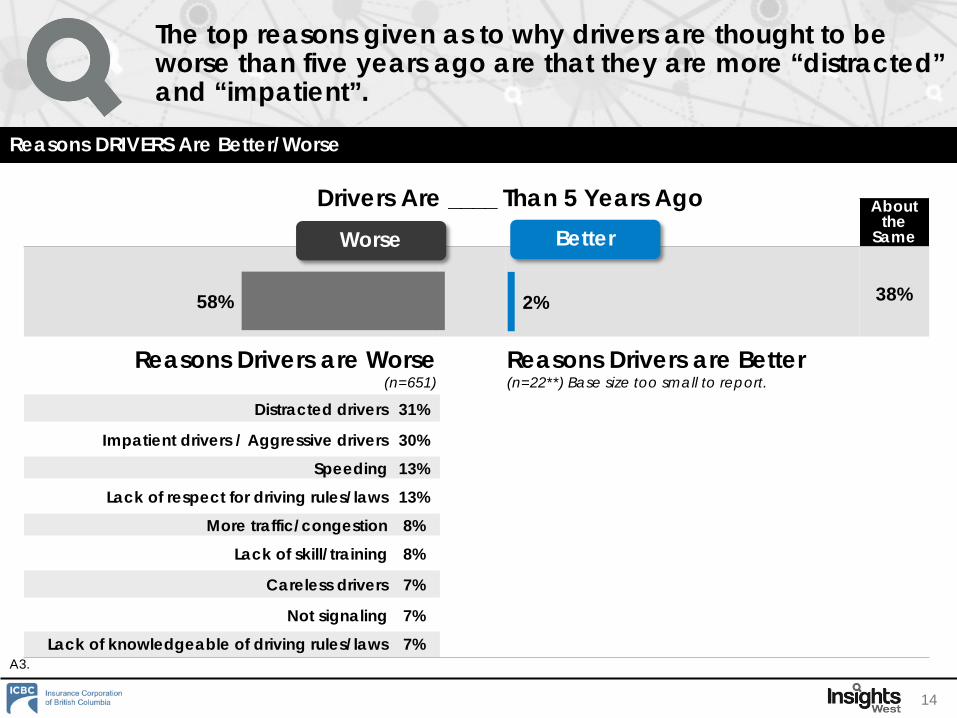
As drivers, we all have a role to play in keeping our roads safe 3%
I am always fully in control of my driving 11%
Often get frustrated how others are driving 20%
Most other drivers acknowledge when I make a considerate/friendly action or
gesture22%
Over past few months, I've made conscious effort to be a more considerate/careful
driver42%
Driving is generally a safe activity 28%
Drive safer when others are in car with me 33%
The majority of drivers acknowledge that road safety is a collective effort. However, only half of drivers say they’re being acknowledged when they make friendly/considerate actions or gestures on the road.
Driver Agreement Statements
18
Base: All respondents (n=1,126)B4. How much do you agree or disagree with the following statements?
AgreeDisagree
6%
3%
4%
7%
1%
3%
11%
28%
11%
25%
23%
81%
39%
21%
5%
12%
10%
16%
96%
85%
69%
50%
48%
47%
43%
Strongly agree Somewhat agreeStrongly disagreeSomewhat disagree

Neutral
Technological advances have made driving a safer activity than in the past 29%
Try to make up time while driving if I'm behind schedule or late for appointment 22%
Sometimes it's ok to bend the rules if no other drivers are around 24%
Over past few months, I've thought about changing some of my driving habits to be a
more considerate/careful driver37%
Sometimes have other things on my mind/forget how I got from one place to
another20%
I do whatever I need to, to get ahead in traffic 15%
One-fifth of drivers say they sometimes have other things on their mind and forget how they got from one place to another, while over one-third say they try to make up time while driving.
Driver Agreement Statements (Continued)
19
Base: All respondents (n=1,126)B4. How much do you agree or disagree with the following statements?
AgreeDisagree
9%
13%
16%
13%
28%
43%
30%
41%
44%
36%
59%
77%
12%
6%
5%
5%
2%
2%
41%
37%
32%
27%
21%
8%
Strongly agree Somewhat agreeStrongly disagreeSomewhat disagree

Drivers who rate themselves as above average, more knowledgeable and safer, are more likely to say they’re always fully in control of their driving, but also become frustrated by the driving of others.
Driver Agreement Statements (Continued)
20
Total
OVERALLDRIVINGABILITY
COMPARSION TO OTHER DRIVERS
KNOWLEGDGE SAFETY COURTEOUSAbove
Average Average Higher Same/ Lower Higher Same/
Lower Higher Same/ Lower
As drivers, we all have a role to play in keeping our roads safe 96% 97% 96% 98% 94% 97% 93% 98% 92%
I am always fully in control of my driving 85% 90% 72% 91% 75% 88% 76% 87% 79%Often get frustrated how others are driving 69% 71% 62% 76% 56% 72% 59% 70% 66%
Most other drivers acknowledge when I make a considerate/friendly action or gesture 50% 52% 46% 49% 52% 50% 52% 51% 48%
Over past few months, I've made conscious effort to be a more considerate/careful driver 48% 47% 49% 49% 46% 48% 46% 51% 39%
Driving is generally a safe activity 47% 51% 38% 48% 46% 47% 47% 47% 48%Drive safer when others are in car with me 43% 45% 39% 47% 38% 45% 40% 43% 46%
Technological advances have made driving a safer activity than in the past 41% 42% 39% 41% 41% 41% 40% 39% 45%
Try to make up time while driving if I'm behind schedule or late for appointment 37% 39% 32% 39% 32% 34% 45% 37% 37%
Sometimes it's ok to bend the rules if no other drivers are around 32% 33% 29% 34% 29% 31% 36% 29% 40%
Over past few months, I've thought about changing some of my driving habits to be a more considerate/careful driver 27% 24% 33% 25% 31% 25% 33% 25% 31%
Sometimes have other things on my mind/forget how I got from one place to another 21% 20% 26% 18% 27% 19% 28% 20% 24%
I do whatever I need to, to get ahead in traffic 8% 9% 4% 9% 6% 8% 8% 6% 15%
Base: All respondents (n=1,126)B4. How much do you agree or disagree with the following statements?
Statistically significantly higher than other subgroup(s)

Nearly all drivers say they’re driving in an emotional state at least some of the time. The most frequently experienced emotions are being impatient, rushed, tired and stressed.
Driving Emotions
21
Base: All respondents (n=1,126)B5. When you’re driving, how often are you ….?
NET – ANY EMOTION
Impatient
Rushed
Tired
Stressed
Pre-occupied
Angry
Anxious
Fearful
91%
11%
6%
5%
8%
3%
4%
5%
5%
48%
44%
48%
41%
31%
28%
29%
22%
8%
36%
43%
39%
41%
53%
54%
49%
49%
99%
96%
94%
92%
91%
88%
86%
84%
77%
Always Regularly Sometimes Rarely
NET – Any Emotion NET: Always/ Regularly/ Sometimes

No Impact
Impatient 24%
Rushed 23%
Tired 18%
Stressed 30%
Pre-occupied 21%
Angry 26%
Anxious 36%
Fearful 34%
The majority of drivers generally acknowledge that driving in these emotional states has a negative impact on how they drive.
Driving Emotions Impact
22
Base: All respondents (n=1,126)B6. How much do you think the following factors impact how you drive?
PositiveNegative
75%
76%
81%
68%
79%
74%
62%
56%
1%
1%
1%
1%
<1%
1%
3%
10%

NET: ANY
Going well over the speed limit
Turning or changing lanes without signaling
Talking or texting on a hand-held cell phone
Passing someone who you thought was driving too slow
Cutting someone off
Not letting someone into your lane
Being the second or third car in an intersection at a yellow light
Not stopping for a pedestrian at a crosswalk
Blocking oncoming traffic/pedestrian crosswalk at intersection
Not following road signs, signals, or road markings
Honking, screaming, or gesturing at another driver
Reading a text message
Nearly hitting a cyclist or pedestrian
Not shoulder checking
Reversing without checking mirrors
Taking a photo or video of something
Watching a video
The biggest “sin” (committed by more than half of drivers) is passing someone who they thought was driving too slow.” However, more than one-quarter have “gone well over the speed limit” (26%) or were “the second or third car in an intersection at a yellow light” (22%). They are claiming to see other drivers commit these infractions at a much higher level.
Bad Driving Habits
23
Base: All respondents (n=1,126)B8. Over the past few months, have you caught yourself doing any of the following things while driving? B9. Over the past few months, have you personally witnessed someone else doing any of the following things while driving?
82%26%
16%12%
56%5%
18%22%
12%7%
10%16%17%
5%12%
3%3%<1%
99%92%
87%84%
82%79%
76%73%71%
68%68%
66%63%
43%42%
28%19%
9%
Seen Others DonePersonally Done

Self-defined “above average” drivers are significantly more likely to pass someone they think is driving too slow, honk or scream at another driver, and talk or text on a cellphone.
Bad Driving Habits
24
Base: All respondents (n=1,126)B8. Over the past few months, have you caught yourself doing any of the following things while driving? B9. Over the past few months, have you personally witnessed someone else doing any of the following things while driving?
Personally Done Total
OVERALLDRIVINGABILITY
COMPARSION TO OTHER DRIVERSKNOWLEGDGE SAFETY COURTEOUS
Above Average Average Higher Same/
Lower Higher Same/ Lower Higher Same/
Lower
NET: ANY 82% 82% 83% 83% 81% 82% 83% 81% 85%
Passing someone who you thought was driving too slow 56% 59% 48% 61% 48% 56% 55% 56% 57%
Going well over the speed limit 26% 27% 23% 28% 22% 24% 32% 24% 31%
Being the second or third car in an intersection at a yellow light 22% 21% 25% 22% 23% 20% 29% 23% 21%
Not letting someone into your lane 18% 19% 14% 20% 15% 18% 17% 16% 23%Reading a text message 17% 19% 14% 18% 16% 15% 25% 15% 24%
Honking, screaming, or gesturing at another driver 16% 18% 11% 20% 10% 16% 16% 17% 15%Turning or changing lanes without signaling 16% 16% 17% 16% 17% 17% 14% 15% 21%
Not stopping for a pedestrian at a crosswalk 12% 11% 14% 12% 13% 11% 15% 12% 12%Not shoulder checking 12% 9% 20% 10% 16% 11% 15% 10% 17%
Talking or texting on a hand-held cell phone 12% 13% 8% 13% 10% 10% 16% 11% 16%
Not following road signs, signals, or road markings (e.g. left hand turn, U-turn, double solid yellow) 10% 10% 11% 10% 10% 9% 13% 9% 15%
Driving into an intersection and blocking either oncoming traffic or a pedestrian crosswalk 7% 6% 10% 7% 9% 6% 11% 8% 5%
Cutting someone off 5% 5% 4% 5% 5% 5% 6% 4% 7%
Nearly hitting a cyclist or pedestrian 5% 4% 6% 5% 4% 5% 4% 5% 5%
Statistically significantly higher than other subgroup(s)

One-in-five drivers admit to have been “distracted or inattentive” over the past few months. Those who believe they’re a safer driver than others are just as likely to admit to speeding and running a light or a stop sign.
Bad Driving Activities
25
Driver Rating Safety Rating
Open Ended Responses Total(n=1126)
AboveAverage
Driver(n=809)
Average or Less Driver)
(n=317)
T2B Safety(n=857)
B2B Safety(n=269)
Distracted or inattentive driving (texting) 21% 20% 22% 19% 28%
Speeding 17% 17% 14% 16% 18%
Running a light/stop sign 11% 10% 15% 11% 11%
Gotten angry/ impatient / aggressive 5% 5% 3% 5% 3%
Inappropriate passing/merging/lane change 3% 3% 2% 3% 3%
Driving in poor conditions/no snow tires/ poor visibility 2% 3% 0% 3% 1%
Base: All respondents (n=1,126)B7 - Thinking back over the past few months, what (if anything) have you done while driving that you know you probably shouldn’t have?
Statistically significantly higher than other subgroup(s)

Slowed down to let someone merge into your lane when there was traffic
Waved at, or acknowledged another driver for something helpful
or friendly they did for you
Stopped or slowed down to allow someone to turn
Nearly all drivers say they have slowed down to let others merge into a lane and have waved/acknowledged friendly gestures. However, they are not seeing these actions reciprocated by other drivers to the same degree.
Good Driving Habits
26
Base: All respondents (n=1,126)B10. Over the past few months, have you done any of the following while driving? B11. Over the past few months, have you, personally, had another driver do any of the following things for you?
Seen Others DonePersonally Done
94%
93%
79%
75%
74%
57%

Overall, nearly nine-in-ten drivers report having had a “near-miss”, but are more likely to say another driver was responsible. Those who admit to driving with something on their mind are significantly more likely to have had a “near miss” and admit their fault.
Near Misses
27
Base: All respondents (n=1,126)C1. Thinking about your last “near miss”, that is, an occasion when you almost had a collision with another vehicle, pedestrian, cyclist, or someone else, who do you think was responsible?
TOTAL
Personal Driver Rating
Excellent
Above average
Average
Have OtherThings
on Mind
T2B Agree
B2B Disagree
Emotional Driving
At least sometimes
Rarely/never
18%
9%
18%
24%
27%
15%
18%
16%
25%
17%
27%
26%
26%
24%
26%
22%
43%
55%
42%
37%
39%
46%
43%
40%
86%
81%
87%
87%
92%
84%
87%
78%
I was Shared Someone else
TOTAL
Statistically significantly higher than other subgroup(s)
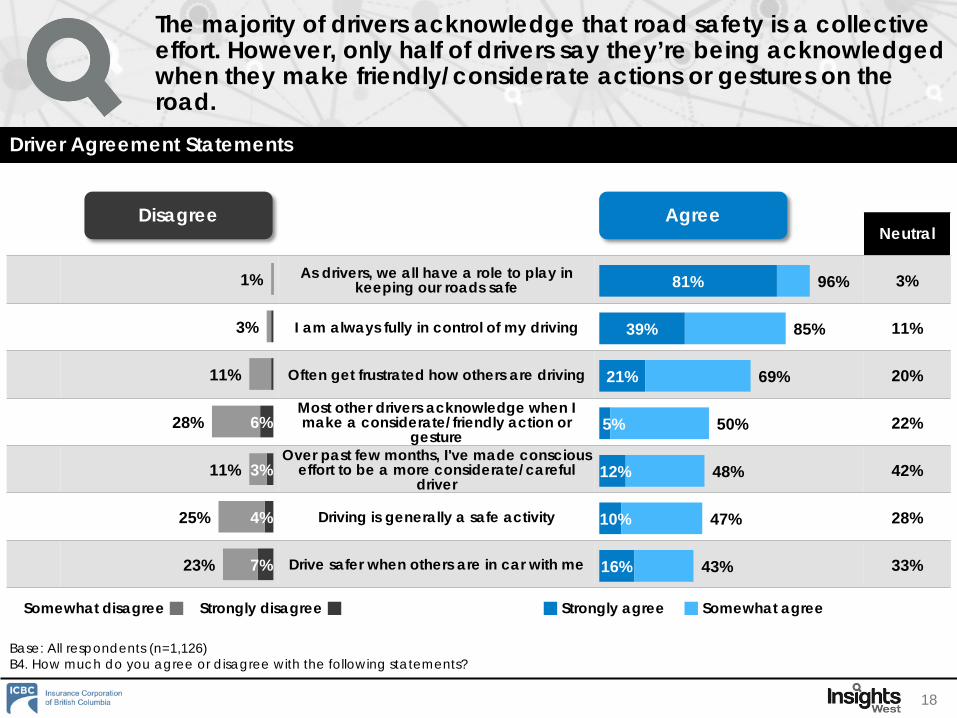
Those who rate themselves lower on their knowledge, skill, and safety are significantly more likely to admit that they were responsible for the most recent “near miss” they had.
Near Misses (Continued)
28
Base: All respondents (n=1,126)C1. Thinking about your last “near miss, that is, an occasion when you almost had a collision with another vehicle, pedestrian, cyclist, or someone else, who do you think was responsible?
TOTAL
Knowledge
T2B Higher
B2B Lower
Safety
T2B Higher
B2B Lower
Skill
T2B Higher
B2B Lower
18%
16%
22%
15%
27%
16%
22%
25%
24%
27%
24%
30%
24%
28%
43%
48%
33%
46%
31%
47%
36%
86%
88%
82%
85%
88%
86%
85%
I was Shared Someone else
TOTAL

TOTAL
I was responsiblen=207
There was shared responsibilityn=292
Someone else was responsiblen=471
The greater responsibility a driver assumes for a “near miss”, the more likely it is that it will influence them to change their driving behaviour.
Impact of Near Miss
29
Base: Ever had a near miss encounter (n=970)C2. How much did having a “near miss” encounter while you are driving change how you drive afterwards?
54%
83%
67%
34%
21%
13%
21%
23%
26%
3%
12%
43%
Adjusted driving to avoid similar situations in future
Short-term impact No impact
TOTAL

Simplified Understanding
Driver’s Test

Road Test
Written Test
Drivers are generally confident in their ability to pass the written and road tests if they had to take them again. However, the level of “strong confidence” is lower on the written test.
Driving Test – Confidence in Passing
31
Base: All respondents (n=1,126)D1. If you had to take your driving test again today, how confident are you that you would pass?
ConfidentNot Confident
5%
9%
61%
48%
95%
91%
Very confident Somewhat confidentNot at all confidentNot too confident

Confidence BEFORE Taking Test Confidence AFTER Taking Test Perceived Self
Driving Knowledge
Confident NotConfident Very Somewhat Not too/
Not at allT2B
HigherB2B
Lower(n=1,022) (n=104) (n=334) (n=716) (n=76*) (n=714) (n=412)
Got 5/5 22% 18% 33% 18% 9% 22% 21%
Got 4/5 37% 40% 38% 38% 30% 39% 35%
Got 3/5 26% 25% 23% 27% 29% 25% 27%
Got 2/5 12% 13% 5% 14% 24% 11% 13%
Got 1/5 3% 4% 2% 3% 8% 2% 4%
Fewer than one-quarter of drivers answered all of the driving questions correctly. Those who believe they are knowledgeable drivers are, in fact, no more knowledgeable than those who give themselves lower ratings.
Combined Score
32
*Small sample size, interpret with caution.Base: All respondents (n=1,126)T1-T25. This sign means…?
22%
37%
26%
12%
3%
Statistically significantly higher than other subgroup(s)