Embed Size (px)
Citation preview
Titre
Limites perceptives des conducteurs automobiles. Modèle et Application à la simulation de trafic
Drivers with limited perception: model and application to traffic simulation
Abstract
We propose a model of the driver perception suited for microscopic, agent-based traffic simulations. The model includes both top-down and bottom-up perception, and takes into account the limited amount of perceptive resource which gain access to short-term memory. The driving task is split into sub-tasks, which can be activated in parallel (e.g. car following and crossroads passing). Perceived entities (percepts) as well as subtasks are ranked with respect to their subjective value, and due to the bounded perception, only the more "valuable" percepts are sent to the decision module of the cognitive model. The competition among percepts to gain access to the short-term memory simulates attentional processes. A computational implementation of the model is proposed for the driver, using agent-based modeling. It is implemented in a traffic simulation environment and allows the driver-agent to manage the conflicts and the longitudinal space in the middle of the crossroads. This way, we improve the realism of the simulation. Furthermore, this model can lead to a new way of identifying and explaining near accidents. We illustrate some benefits for a microscopic traffic simulation at crossroads in two situations. The first scenario explores the traffic parameters at a crossroads, simulating various distributions of the driver's age. The second one demonstrates the adaptive behavior of simulated drivers facing a dangerous (e.g. hypo-vigilant) driver.
Keywords: driver behavior, perception, attention, traffic simulation
Résumé
Nous proposons un modèle de perception pour la simulation de trafic microscopique, utilisant une architecture multi-agent. Le modèle traite la perception ascendante (bottom-up) et descendante (top-down), et simule le fait que seul un nombre limité d’entités perçues a accès à la mémoire à court terme, et donc au module de décision. La tâche de conduite est divisée en sous-tâches qui peuvent être actives simultanément (par exemple, suivi de véhicule et passage de carrefour). Les entités perçues (les « percepts ») sont classées en fonction de leur valeur subjective pour le conducteur, et du fait des limites perceptives et attentionnelles, seuls les percepts les plus importants sont envoyés au module de décision du modèle cognitif. La compétition entre percepts pour accéder à la mémoire à court terme simule un processus attentionnel. Une implémentation computationnelle de ce modèle est proposée, utilisant un système multi-agent. Il est implémenté dans un environnement de simulation de trafic et permet au conducteur simulé de gérer les conflits et l’espace à l’intérieur du carrefour. Ce modèle permet notamment d’explorer et d’identifier des presque-accidents. Les bénéfices d’une simulation microscopique de l’intérieur des carrefours sont illustrés par des simulations, d’une part en simulant différentes distribution de l’âge des conducteurs, d’autre part en simulant l’adaptation des conducteurs à un comportement dangereux (hypo-vigilant).
Mots clé : comportement de conduite, perception, attention, simulation de trafic
1. Introduction
Traffic simulations can be split into two groups. One includes the models that describe the road traffic at the macroscopic level, inspired by fluid mechanics, and the other considers the road traffic as composed of individual particles. In the following, we address the second group of models. These microscopic traffic models are used in two main applications:
The first application analyses how the particles move and interact in the road network. The aim is to be able to control and predict the traffic flows. In urban environments, one key point concerns the intersections and how the particles go through intersections. In most models, the inner intersection is not described, and thus the simulation tools cannot reproduce the interactions in the centre of the intersection without artifact. Thus, road safety studies at crossroads are not possible with such tools. Improving the driver behavior model for microscopic traffic simulations is then a challenge to make more relevant transport studies at intersections.
The second application of microscopic traffic modeling is related to virtual reality studies. In a driving simulator, a human faces a virtual scene with virtual cars, and interacts with the virtual traffic. The simulated drivers of this virtual traffic need to be as credible as possible, in order for the participant to feel himself in the real world.
In this paper, we focus on how visual attention is taken into account in driver behavior models for traffic simulation applications. We propose that a model with limited perception capability may improve the driver’s simulated behavior and (more important) the emerging traffic, based on a multi-agent, distributed model of traffic simulation.
The choice of visual perception as a key parameter to improve microscopic traffic simulation models is based on two points. First, most behavioral driver models available for traffic simulation skip the perception issue, in the sense that the simulated driver has a potentially unlimited capacity and accuracy when perceiving his environment. Second, common knowledge have pointed out that visual attention deals with limited resources (see section 2). Finally, linking these two findings, we propose a simple model of the driver perception in order to improve the emerging traffic in situations where driver’s interactions are an important factor of the behavior. We use a two-step approach:
1. In section 3, we propose a new model of the driver perception, which takes into account some key psychological factors: limited resources, visual attention, top-down and bottom-up processes [1].
2. In section 4, this model of the driver perception is implemented in a computational driver model. We use the theoretical framework of the situated agent [2] to implement a driver with limited perception into traffic simulations [3,4].
Finally, traffic situations can be simulated at a microscopic level, and examples are given at crossroads in section 5.
2. Models of the driver behavior
In this section, we review some quantitative models of the driver behavior, and look at the way perception is described; these models are denoted as computational models, even if they are grounded on psychological models of the driver or of the driving task. Then, qualitative psychological models of the driver and of the driving task are considered, as well as current knowledge about vision and attention in driving. This overview gives some insights about a new agent-based architecture of the driver with an improved visual perception model.
2.1. Quantitative Models
The purpose of computational models of the driving activity is to compute quantitative behavioral parameters, such as speed control, lane changing, etc., based on an underlying model of the driver (or of the driving task). These models need a quantitative perception model, in order to provide inputs for the computation of behavioral outputs to run the driving scenarios.
Although no general-purpose driver model is available to date, the computational approach can already help road and car designer to understand the driver's reactions to a change in the car/road environment, and may help, in the future, traffic managers. For instance, Donges’ classical model splits the visual information into two parallel processes, fed by different visual inputs [5]:
1. Near information (a few meters in front of the car) are visual feedbacks, and allow the driver to control her/his lateral position. It is described as a closed loop, needing a continuous attention.
2. Far information drives the anticipation of future events, e.g. a change in the road curvature. This process is described as an open loop, with a discontinuous feedback.
In this model, the driver is omniscient, in the sense that he has full access to all information about the environment; however, the model is restricted to traffic-free and junction-free driving. This is also the case with Land model of visual control in curves [6].
Some detailed computational models, such as those proposed by Salvucci or Bellet, simulate the driver’s main processes in terms of cognition and action. Based on the ACT-R psychological model [7], Salvucci proposed a driver model which focuses on control, monitoring and decision making in highway environments [8,9]. Given a set of chunks of declarative knowledge, specific conditions activate specific rules which operate on these chunks. Salvucci’s model simulates attention sharing while driving. This allows investigating perceptive and cognitive distraction, such as the impact of a secondary task (use of cellular phone) onto execution of the primary (driving) task [10]. Bellet et al. proposed a driver behavior model [11,12] based on experimental results from laboratory studies [13]. In his model, the driving task drives visual search and information processing. The mental representation is at the heart of this model, called CosmoDrive. The representation guides perception, because it includes expectations about what may happen, and about the

consequences of possible actions: the representation includes some anticipation of the near future. The underlying theoretical frameworks are situated cognition and situated action, and the authors refer to the Situation Awareness paradigm [14]. However, these models were too complex, in terms of parameter number and tuning, to be implemented in an agent-based driver model.
On the other hand, usual traffic simulations allow predicting the speed and inter-distance on a given road network, thanks to calibrated models linking traffic parameters to environmental parameters (number of lanes, lane width, road capacity, etc.). The individual behavior is not simulated, and the road network regulation is considered as a macroscopic flow dynamic problem. Another approach uses “Microscopic” traffic simulations, which include computational driver models [15,16]. In this case, realistic simulations of local interactions are needed. For instance, quantitative models of car following describe the vehicle motion as a result of internal (desired speed, etc.) and external variables (surrounding vehicles) [17]. Most existing models are closer to robotic models than to human behavior, although driver models are also considered in the field. The ArchiSim model is an example of such an approach: a model of the tactical level of the driving task [18] allows virtual drivers to interact according to a set of behavioral rules, which are context-dependent. This model was calibrated in highway environment [19], and also addresses crossroads [20,21].
The above models are consistent with the idea that the driver is omniscient, in the sense that relevant visual information is always available. We will see that in psychological science, visual perception reaches some limits, and the driver's visual needs cannot always be satisfied.
2.2. Qualitative Models
In an old and still questioning paper, Gibson and Crooks considered the contextual constraints which apply to the driver [22]. They described the field of safe travel as the set of all safe trajectories a driver may follow. In their view, the driver controls his trajectory by keeping safety margins around the car, both in time and space. Perception drives the regulation of these safety margins through affordances of relevant items in the environment. The field of safe travel is limited by potential obstacles, either static (a post) or dynamic (a car). These obstacles are perceived with a negative valence, while a positive valence is attributed to safe areas (the road surface). Driving is seen as a task-oriented representation of the environment, taken from perceptive inputs.
Apart from this significant exception, psychological models of the driver were first proposed in the 1970'. The focus was put on the analytical description of the driving task. The most famous model during this period is the one from Allen et al. where information needs (visual, kinesthesis, etc.) are described according to 3 levels of performance [23]. This hierarchy was reconsidered by Michon [18] in the context of cognitive psychology:
The Guidance task addresses car navigation, at a strategic level: the driver plans his trip.

The Maneuver task addresses the current situation management, at a tactical level. The driver interacts with other drivers, pedestrians, etc.
The Control task addresses the vehicle control, at an operational level (steering, speed control). Control tasks are massively automatized.
The operational level may be seen as a continuous anticipation/regulation of the trajectory. The tactical level includes car following, lane changing, reactions to pedestrians and to traffic lights. Both papers, Allen [23] and Michon [18] are unclear about what exactly is the visual information needed for driving.
In the early 1980', the limits of these models led to new approaches, focusing on motivational factors rather than on the information-processing factors in the previous period. The driving activity was seen as a risk management activity, with a key role devoted to motivation. Näätänen and Summala proposed the “zero-risk” theory [24], Wilde proposed the risk homeostasis framework [25], Fuller proposed the “threat avoidance” model [26], and Van der Molen and Bötticher developed a hierarchical model of risk [27]. According to Wilde, risk taking depends on a conscious deliberation, based on symbolic information. Conversely, most posterior authors consider that risk evaluation is based on a perceptive process, unconscious, and sub-symbolic. The Hierarchical Risk Model proposed by Van der Molen emphasizes activity planning, and underlines the role of mental representations in this planning process [27]. They used the Allen/Michon model and Rasmussen framework [28] to describe the interactions between risk level and task level. Due to the focus on the motivational aspects of driving, these models can hardly take into account visual perception as a key factor. Indeed, the perceptive and even cognitive processes are strongly simplified and practical issues about visual perception are not addressed.
In the 1990', the concept of risk has become less important, and the intra- and inter-individual variability was considered with more attention. Summala and Fuller proposed new models, where the focus moves towards behavioral adaptation [29] and task difficulty [30]. Instead of risk regulation, Summala proposed that motivation, perception and the current task control the time and workload allocation. Fuller proposed a model of “task difficulty” [30] where the driver’s capability is limited by his skills (including visual performance) and temporary states (alcohol, temporal pressure, etc.). Speed regulation allows the driver to keep the task difficulty below a chosen threshold. Fastenmeier and Gstalter used Fuller's model and proposed a method for the driving task analysis, called SAFE [31], where perception follows a bottom-up information processing paradigm. Some visual cues are taken into account in Summala's model for the vehicle's control, while Fuller's approach is implicit as far as perception is concerned.
More recently, Hollnagel et al. proposed to describe the driver and the vehicle as a joint system with two components in interaction [32]. They considered that sub-tasks are performed simultaneously, with a variable performance (e.g. keeping lateral position, while overtaking and controlling the oil level). In their model, called Driver-in-Control, the regulation and control tasks are emphasized [33]. They describe a tracking loop, for low-level processes such as Car Following and Lane Keeping, and a regulating loop which anticipates the goals of the tracking loop. They also consider a monitoring loop, which takes into account hazards, and the traffic, in order to plan the near future. Finally, a targeting loop
drives the whole system. Visual perception is left implicit in this model; however the authors claim that specific models (e. g. for visual perception) may be included in the future. To some extent, our work may contribute to this objective.
After this overview of driver models, both quantitative and qualitative, we describe a new computational model, relevant for microscopic traffic simulations, and focusing on the driver’s perception.
3. Drivers with limited perception
From our overview, it appears that perceptive limits are not taken into account in most computational models, which include the implicit idea of perfect information selection and information processing. Visual perception was included with more care in some recent models, however with little room to understand perceptive errors. For instance, driving during daytime or at night cannot be distinguished in most implementations. Thus, the integration of perceptual skills in the general framework of the driving task is not achieved. This aspect of the driver's performance has been neglected in this literature, with the result that driver models often include visual components based on an idealized visual behavior. We agree with Barton statement that vision is still idealized, which weakens the whole models, by weakening the model's inputs [34].
At this point, we are looking for a computational architecture to describe the driver perception in an agent-based framework. This architecture should take into account the main processes of visual perception, including perceptive limits. We want it to allow a computational implementation, leading to traffic simulations in situations where these perceptive limits emerge, and allowing the simulation of near-accident situations.
3.1. First Principles
Driver behavior models for microscopic traffic simulation use collision avoidance mechanisms, in order to produce an emerging traffic flow without collisions. On the road, avoiding collisions depends on the detection of hazards, by the driver, early enough to react properly and safely. A large number of accidents involve perception failures, including those associated with information acquisition and information processing [35], for which vision is the main sensory channel [36]. Rumar discussed perception failures in driving, and proposed that they fall into two main categories: cognitive and perceptive failures [37]. It seems, then, that perception should be a key issue in driver behavior models. We found, however, that in microscopic traffic simulations, most authors have considered perception as a scanning routine, allowing the drivers to know the current state of their environment. There is a need, then, for psychological foundations if one wants to include perceptive limits in a computational, agent-based driver model.
In the mainstream cognitive paradigm, detection is the first step of information processing. In a driving context, hazard perception leads to a decision which is an attempt to avoid a collision. Other theoretical paradigms are worth mentioning however. For instance, in

situated action, a mental representation is not needed for perception [38]. According to this paradigm, derived from Gibson's ecological theory of perception [39], the current situation includes a number of resources, either physical or social, which make sense for action. Dependencies are emphasized between action, goal and context, which in turn emphasize the top-down perception of the environment (the context).
The usual view of a driver with unlimited perception is inconsistent with current knowledge that humans have limited perceptive resources [40, 41, 42, 43]. Although there is no limit with respect to automatic processes which run in parallel, we are limited with respect to the amount of data in the focus of attention [44, 45] that is, in short term memory [46]. If the current goal needs an amount of data above the agent's perceptive resource, the most relevant elements (called “percepts” in the following) should be selected [43]. This means that some selection process is needed among percepts, to compete for a rare resource (in a cognitive architecture, an access to short term memory, and thus to the Decision module).
Top-down information processing is goal-driven: humans pay attention to some environmental cues in order to achieve their current goal [47, 48]. Thus, information is selected according to its relevance with respect to this goal. Conversely, bottom-up information processes are data-driven: Salient data attracts one's attention [49]. Non-salient items are not (or weakly) perceived. Most authors consider that the driving activity is dominated by top-down attentional process [50, 51], which may explain some perceptive errors such as looked, but failed to see [37].
Percept selection appears as a balance between these two information processing channels. It may happen that a top-down information prevents the acquisition of bottom-up salient data (focusing on pedestrians, not seeing a salient advertising), as well as the reverse (looking at a car crash on the other side of the road, and missing the car in front of you).
3.2. Subtasks
For a better understanding of perception in driving, we have split the driving task into several subtasks, for which the visual needs are not the same. We follow Hollnagel [32] and describe the driving task thanks to a limited set of subtasks, which may run in parallel (e.g. Car Following and Lane Keeping)1. These subtasks (e.g. overtaking, hazard detection) all contribute to the driving task. They should be derived from psychological knowledge about the driving behavior. Thus, driving is seen as a multi-task activity [52].
The main reason why the driving task is split into subtasks is that visual needs are different across subtasks. Moreover, some subtasks are mandatory all along a trip, such as lane keeping and hazard detection, some are optional, depending on the situation, such as overtaking and parking.
1 This is somehow different from the usual definition of subtasks [31]. The usual approach is to describe a set of
driving situations, called subtasks (e.g. approaching a crossroads, parking, etc.) and to classify any driving situation as belonging to one and only one subtask.
The information processing cost of a subtask is always above zero; thus, with limited resources, it is important to know, at a given moment, which subtasks are active and which one are not. This framework is not limited to driving, and could address any locomotion task, including pedestrians, 2-wheels, animals and robots. In the following however, we restrict the model to the driving task.
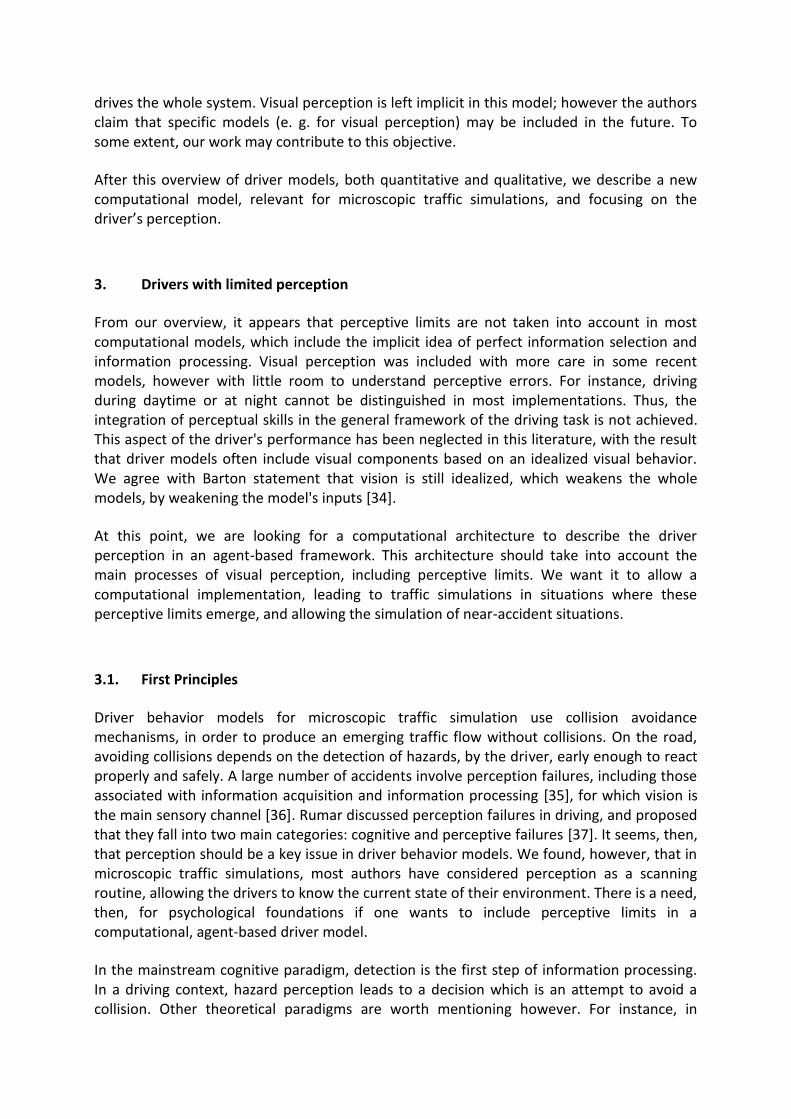
Figure 1: Framework of the proposed information processing model. Percepts come from the environment, but the resources are limited: only a subset of the relevant percepts reach the Decision module. The model distinguishes two kinds of sub-tasks (mandatory in red, optional in green). A continuous scanning is associated to every optional subtask, in order to decide when to activate/inhibit it.
Fig. 1 shows the general framework of the proposed information processing model, which will be further implemented in a computational model (section 4). The figure shows how the decision module (blue box on the right) is fed with percepts selected by subtasks which may be either mandatory (in red) or optional (in green). For instance, vehicle control is mandatory (always activated), while overtaking is optional (either activated or not). Active subtasks get perceptive inputs from the environment via top-down selection (see the arrows towards the “Environment”), and try to send outputs (that is, percepts) to the Decision module. However, due to the limited resource, the number of percepts which can reach this module is limited by a threshold (the yellow triangle in Fig. 1 symbolizes this selection rule).
Optional subtasks are activated, when needed, by specific scanning processes. Based on prior knowledge, each of these processes scan specific information in the environment (see the scanning module in Fig. 1, in red), to decide whether to activate/inhibit the associated subtask (ON/OFF arrow on Fig. 1). For instance, a car in front of the driver, at the appropriate distance, should activate the execution of the “Car Following” subtask. The green arrows on Fig. 1 show that the percept selection and transmission to the Decision module only happen when the corresponding subtask is activated.
3.3. Driver Model
In most cognitive architectures, the driver is described as a perception-decision-action loop. Perception is the ability to capture and process information: the driver gets information from the environment, and uses this information to update his internal representation of the current situation, and to make motor decisions. These decisions drive the motor behavior (speed control, steering), through the physical capacity of the available actuators (the car, the bicycle, etc.) in a physical context (slope, wet road, etc.).
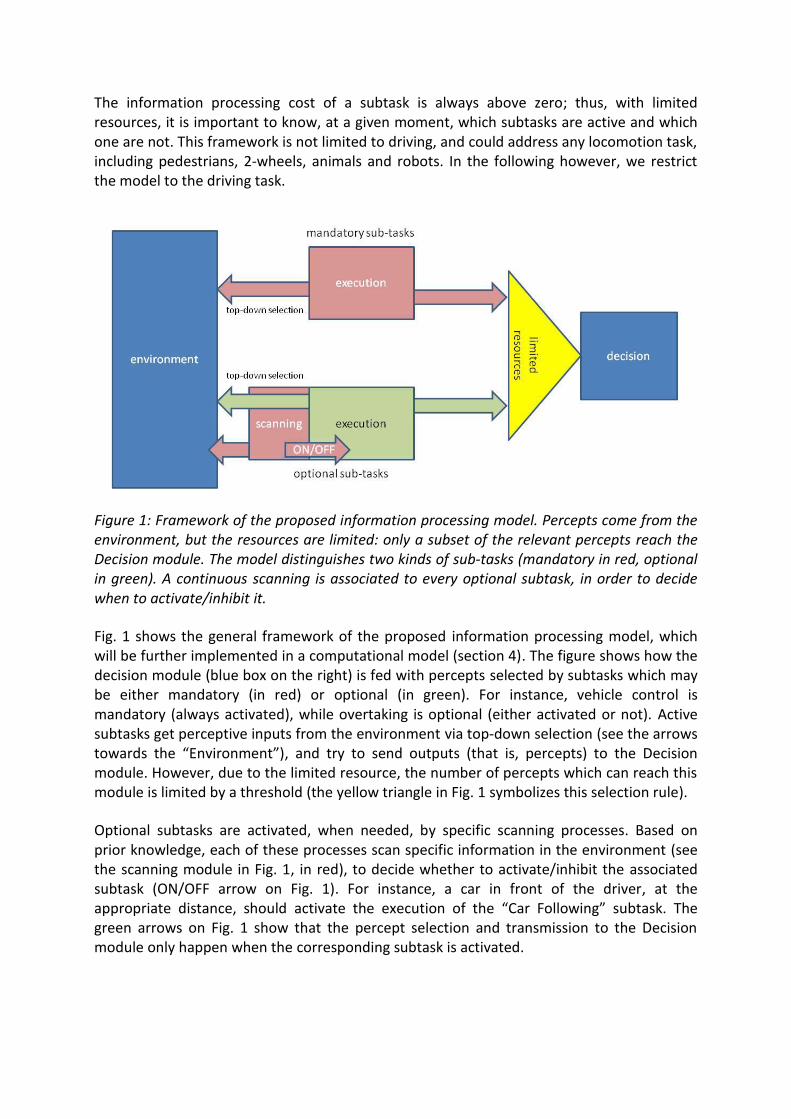
In a simplified model of the driving task, we consider that perception contributes to seven subtasks: Lane Keeping, Car Following, Lane Changing, Crossroads Passing, Itinerary Check, Local Rules detection, and Hazard Detection. Each subtask is associated to a specific focus of attention, both spatial (where to look?) and in terms of expected stimuli (what to look for?), see Table 1.
subtask focus Michon (1985)
Lane Keeping (LK) the road O
Hazard Detection (HD) road, kerbs O
Car Following (CF) the car in front O
Lane Changing (LC) left lane, mirrors T
Crossroads Passing (CP) incoming lanes T
Local Rules (LR) road signs, traffic lights T
Itinerary Control (IC) road signs S
Table 1: Driving subtasks, the associated focus and the associated hierarchical levels: Operational (O), tactical (T) and Strategic (S).
Lane Keeping (LK) includes the ability to stay in a safe trajectory. The focus is on the road surface, with two distinct channels for control and anticipation [5, 6].
Car Following (CF) only needs a focus on the vehicle(s) in front of the driver [17]. The Crossroads Passing (CP) subtask needs visual information from the adverse lanes in
the crossroads, in order to regulate speed. The spatial focus of Hazard Detection (HD) is at least the road itself, and may include the
kerbs and other places, depending on the environment (e.g. urban vs. motorway). The Local Rule detection (LR) subtask consists in getting information about the current
rules (e.g. speed limit, traffic lights). We have limited the strategic level of driving [18] to Itinerary search and Control (IC),
which uses visual indexes such as road signs and anchors. Once the driver decides to change lane, the Lane Changing (LC) subtask needs
information from the left lane, directly and from the mirrors.
The proposed model is consistent with the hierarchical description of the driving task into strategic, tactical and operational levels [23, 18, 53]. The operational level includes sensory-motor loops for the control of the trajectory. The tactical level can be seen as the set of usual conscious decisions one needs to take when driving: stop/go at a crossroads, decide to

overcome a vehicle, to change lane, to stop in front of a road hazard, etc. Tab. 1 summarizes the main characteristics of the subtasks, with respect to Michon’s model, and with respect to the focus of attention.
Four among these subtasks are mandatory all along the driving task: Lane Keeping (LK), Hazard Detection (HD), Local Rules detection (LR) and Itinerary Check (IC). We assume that the required sampling rate for LR and IC is lower than for LK and HD, and depends on the driver expertise and prior knowledge. The spatial focus of HD is large, as it includes any place where unexpected events could happen. Local Rules Detection focuses on road marking, regulatory road signs and traffic lights, while IC uses directional road signs as well as anchors in the landscape.
The same framework could possibly apply to pedestrian's perception, only the subtasks should be reconsidered. Some subtasks, such as Lane Keeping, Car Following (changed to ``Pedestrian Following"), Hazard Detection and Itinerary Check would still be valid; however their implementation should be different. Quantitative models are available for some components of the pedestrian behavior [54, 55, 56].
3.4. Percept Importance
Some rules are needed in order to rank the percepts and select the more relevant ones. We propose that a top-down ranking first applies to the subtasks, which vary in subjective relevance. Then, some ranking is also needed in order to select percepts relevant for a given subtask. Finally, the bottom-up saliency of the percepts modulates their top-down relevance, and a threshold on the ranked percepts selects the more important ones and sent them to the Short Term Memory. This means that in situations where too many information is present, some relevant information may not be processed by the Decision module, leading in some cases to accidents or near-accidents. This is consistent with the idea that a model of the human behavior should also be able to model human errors.
One very simple assumption about the perceptive cost of the driving task refers to the visual sketchpad part of the short-term memory [46]. We consider that each percept, whatever the subtask, roughly uses the same amount of visual short-term memory. For instance, once the CP subtask is activated, the driver gets information in the associated spatial focus: the incoming roads. Relevant information includes the position and speed of incoming vehicles and the potential conflicts. We assume that this subtask uses (“costs”) a given number of percepts in the visual sketchpad, that is, the number of vehicles in potential conflict with the driver.
We assume that the operational subtasks (LK, CF and HD), having all a high frequency of visual sampling, have some priority over the remaining subtasks. The HD subtasks has a lower priority compared to LK and CF, because it belongs to the Regulating loop [32]. LC and CP are tactical subtasks, associated to the driver's own safety. We set them to the same priority level, although it can be argued that the LC subtask can always be postponed after a crossroads; but this concerns the Decision module. If a driver decides to overtake the car in front of him, and is suddenly surprised because he arrives at a crossroads, he should either
decide to give up overtaking, or to run both subtasks at the same time. In this last situation, LC and CP will have the same priority level.
The importance of a percept depends on two factors: its top-down relevance for the subtask, and its bottom-up saliency, which does not depend on the subtask. Relevance depends on task-dependent features [47]. The object's saliency represents its baseline ability to capture attention. According to most computational models, it mainly depends on contrasts of some elementary features, such as luminance, color and motion [49]. The implementation of these factors is discussed in the next section.
4. Computational Model
We demonstrate in this section how our model of the driver perception can be implemented in computational traffic simulations. Then, in the next section, examples of such simulations are given at crossroads: it is a node in a road network where perception issues are highlighted, and where the limited capacity of the driver perception can emerge. Of course, such a quantitative model needs a strong simplification of the driver behavior.
Most current microscopic traffic and crowd simulations are based on limited interactions, such as car following regulation [57] and social forces [58]. Various classes of implementations can be found, such as cellular automata and agent-based models [59, 60]. We follow the Agent-Based approach, which allows microscopic simulations based on behavioral rules [61].
Weyns proposes a generic model of Situated Agent [2, 62], where the Perception module makes the agent aware of the environmental changes. The output of this Perception module is a set of percepts which describe the state of the agent's environment. Moreover, top-down filters can apply to the percepts, before they are sent to the Decision module. This allowed us to implement the resource-bounded perception module proposed in the previous section of this paper in an agent architecture [3]. In Weyns situated agent, the main components of the Perception module are Sensing, Interpreting and Filtering. We have implemented the filter routine as a ranking, based on the percept importance, followed by a threshold based on the resource allocation. An agent (i.e., a simulated driver) selects the most important percepts (in the sense of the percept ranking) and sends them to the Decision module. If the number of percepts is higher than the perceptive resource threshold, the filter removes the less important ones.
Our model is included in a traffic simulation environment in which the decisional part of the driver behavior is based on previous work [63]. The driver's decisions are made at each time step, based on the current perception. Given that in these previous models the simulated drivers were omniscient, our main contribution is an implementation of a Limited Perception module consistent with the main perceptive processes described in section 3.
The perception part of the agent model integrates information flood from the environment and the limit on the percepts that are processed for decision making. The top-down perception is directed by the driving tasks: the driver knows what to look in order to control his trajectory, to detect hazards, etc. The bottom-up perception comes from any item in the
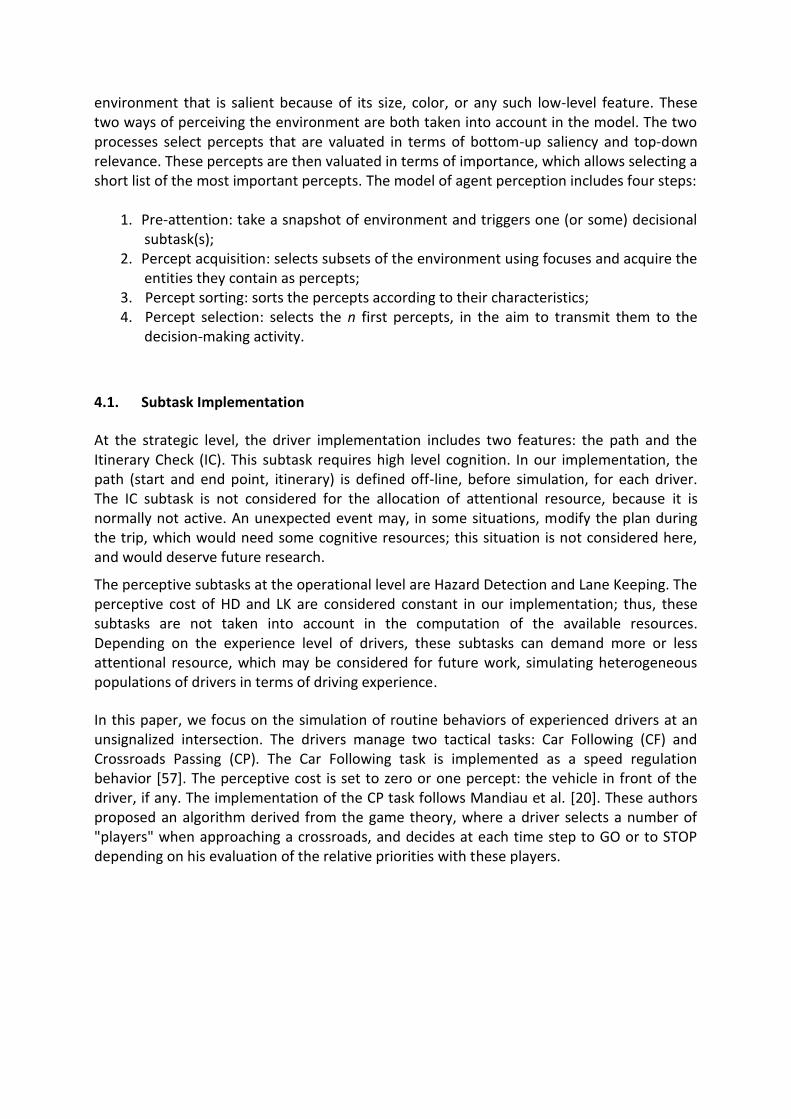
environment that is salient because of its size, color, or any such low-level feature. These two ways of perceiving the environment are both taken into account in the model. The two processes select percepts that are valuated in terms of bottom-up saliency and top-down relevance. These percepts are then valuated in terms of importance, which allows selecting a short list of the most important percepts. The model of agent perception includes four steps:
1. Pre-attention: take a snapshot of environment and triggers one (or some) decisional subtask(s);
2. Percept acquisition: selects subsets of the environment using focuses and acquire the entities they contain as percepts;
3. Percept sorting: sorts the percepts according to their characteristics; 4. Percept selection: selects the n first percepts, in the aim to transmit them to the
decision-making activity.
4.1. Subtask Implementation
At the strategic level, the driver implementation includes two features: the path and the Itinerary Check (IC). This subtask requires high level cognition. In our implementation, the path (start and end point, itinerary) is defined off-line, before simulation, for each driver. The IC subtask is not considered for the allocation of attentional resource, because it is normally not active. An unexpected event may, in some situations, modify the plan during the trip, which would need some cognitive resources; this situation is not considered here, and would deserve future research.
The perceptive subtasks at the operational level are Hazard Detection and Lane Keeping. The perceptive cost of HD and LK are considered constant in our implementation; thus, these subtasks are not taken into account in the computation of the available resources. Depending on the experience level of drivers, these subtasks can demand more or less attentional resource, which may be considered for future work, simulating heterogeneous populations of drivers in terms of driving experience.
In this paper, we focus on the simulation of routine behaviors of experienced drivers at an unsignalized intersection. The drivers manage two tactical tasks: Car Following (CF) and Crossroads Passing (CP). The Car Following task is implemented as a speed regulation behavior [57]. The perceptive cost is set to zero or one percept: the vehicle in front of the driver, if any. The implementation of the CP task follows Mandiau et al. [20]. These authors proposed an algorithm derived from the game theory, where a driver selects a number of "players" when approaching a crossroads, and decides at each time step to GO or to STOP depending on his evaluation of the relative priorities with these players.
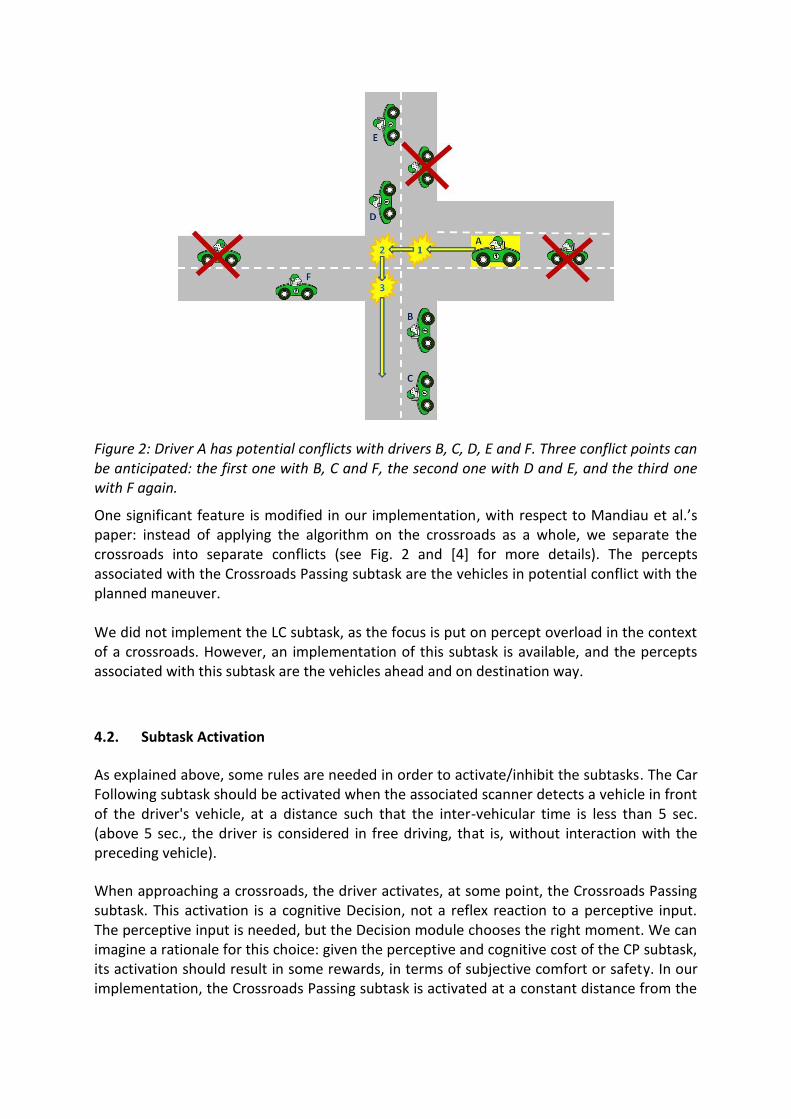
Figure 2: Driver A has potential conflicts with drivers B, C, D, E and F. Three conflict points can be anticipated: the first one with B, C and F, the second one with D and E, and the third one with F again.
One significant feature is modified in our implementation, with respect to Mandiau et al.’s paper: instead of applying the algorithm on the crossroads as a whole, we separate the crossroads into separate conflicts (see Fig. 2 and [4] for more details). The percepts associated with the Crossroads Passing subtask are the vehicles in potential conflict with the planned maneuver. We did not implement the LC subtask, as the focus is put on percept overload in the context of a crossroads. However, an implementation of this subtask is available, and the percepts associated with this subtask are the vehicles ahead and on destination way.
4.2. Subtask Activation
As explained above, some rules are needed in order to activate/inhibit the subtasks. The Car Following subtask should be activated when the associated scanner detects a vehicle in front of the driver's vehicle, at a distance such that the inter-vehicular time is less than 5 sec. (above 5 sec., the driver is considered in free driving, that is, without interaction with the preceding vehicle).
When approaching a crossroads, the driver activates, at some point, the Crossroads Passing subtask. This activation is a cognitive Decision, not a reflex reaction to a perceptive input. The perceptive input is needed, but the Decision module chooses the right moment. We can imagine a rationale for this choice: given the perceptive and cognitive cost of the CP subtask, its activation should result in some rewards, in terms of subjective comfort or safety. In our implementation, the Crossroads Passing subtask is activated at a constant distance from the
crossroads (50 meters), however alternative triggers can be used instead (e.g. activation at a given time-to-arrival threshold, in seconds).
4.2. Percept Importance
The top-down (TD) and bottom-up (BU) processes are executed in parallel. TD information process is task-driven, therefore its input are selected from the focus of the activated subtasks, while BU information process is data-driven. These processes produce two separate lists of percepts with their relevance (TD) and saliency (BU) values. These lists are integrated and ordered with respect to the importance value of each percept.
The subjective importance of a percept p (from the driver's point of view) is estimated as the product of two factors: the percept's saliency S(p) and its relevance R(p). In our very simple implementation, the object saliency is estimated from basic visual features as:
S(p) = V(p) A(p)
where V(p) is the percept's relative speed (with respect to the driver). A(p) is the percept's apparent size (again, as viewed from the driver). Of course a more complex model of the object's conspicuity could be implemented, for instance using luminance and color contrasts [49, 64]. However, there were some limitation in the simulation environment about what kind of object feature were available for computation, and we have limited our model to the object's speed and size.
Then, the percept's relevance R(p) is associated to the conflict with the corresponding entity:
R(p) = 1 / [d(p)+1]
where d(p) is the percept's distance to the conflict point (in meters), computed from the knowledge of the two trajectories. In our implementation, it is assumed that the driver has the knowledge of the other vehicles trajectories (as in real life, you know the other car’s trajectories from their indicators). The rationale for this estimate of the percept relevance is that the distance to the conflict point is the simplest objective parameters which can describe the percept in terms of “who's next?”.
Finally, the percept importance is set to I = SR, that is:
I(p) = [V(p) A(p)] / [ d(p) + 1 ]
This simple model of the percept importance applies to all subtasks were the relevant percepts are the other road users (Car Following, Lane Changing, Crossroads Passing). In the proposed implementation, at crossroads, we did not compute the percept importance for the Lane Keeping percepts (vanishing point, tangent point) and Hazard Detection percepts, as the corresponding subtasks were considered with highest priority. We did not implement either the percept importance for the Local Rule Detection and Itinerary Check subtasks, because they were not relevant for the simulated scenarios described in the next section.
5. First Results
Most of the time (at least for traffic engineers) the crossroads is not an issue in itself but a node in a network [65]. Thus, traffic simulation models do not consider what happens inside the crossroads, they simulate the flow modifications at the crossroads (macroscopic models). Microscopic models (e.g. VISSIM, AIMSUN) simulate interactions when approaching the crossroads with a gap acceptance model [66], but do not simulate interactions inside the crossroads.
We argue that crossroads passing is a key issue which is hardly tackled by current microscopic models, if you want to simulate the crossroads itself, which is more than just the traffic flow performance. There are a lot of interactions, a lot of relevant information available for the drivers, and drivers may be overloaded with this information.
The proposed active bounded perception model is illustrated in the following with examples of traffic simulations at a crossroads, in order to emphasize the benefit of a computational model of the driver behavior with limited perception. First, we show that such a distributed model is consistent with available traffic data at a crossroads. The impact of the perception threshold on traffic variables is considered. Then, we show that a mixture of several populations (in terms of perception threshold) can be simulated, with a consistent traffic behavior, leading to a range of interesting applications, because it appears that the global behavior is different between the heterogeneous population and a simulated population set to the mean behavior (this could apply, for instance, to the driver's age distribution). As a limit example of such a mixed population, we have also simulated how drivers adapt their behavior when confronted to a deviant behavior (e.g. a hypo-vigilant driver).
This is not to say that these examples give a full validation of this simple implementation of our model, and a true validation is still needed against real data. We hope that the following results illustrate both the consistency and the potential benefits of such a bounded perception model in the field of microscopic traffic simulations.
5.1. Crossroads Simulations
A crossroads in Reggio di Calabria (Italy) was simulated (see Fig. 3), using traffic data measured every 5 minutes on each of the 4 incoming branches of the crossroads [20] as well as the origin-destination (OD) matrix at the crossroads. One hundred simulations of one simulated hour each were computed, where the simulated cars were randomly generated 400 meters away from the crossroads. The desired speed of the simulated drivers followed a normal distribution N(sd,sv) where the mean desired speed was 50 km/h and its standard deviation was 1.66 km/h.
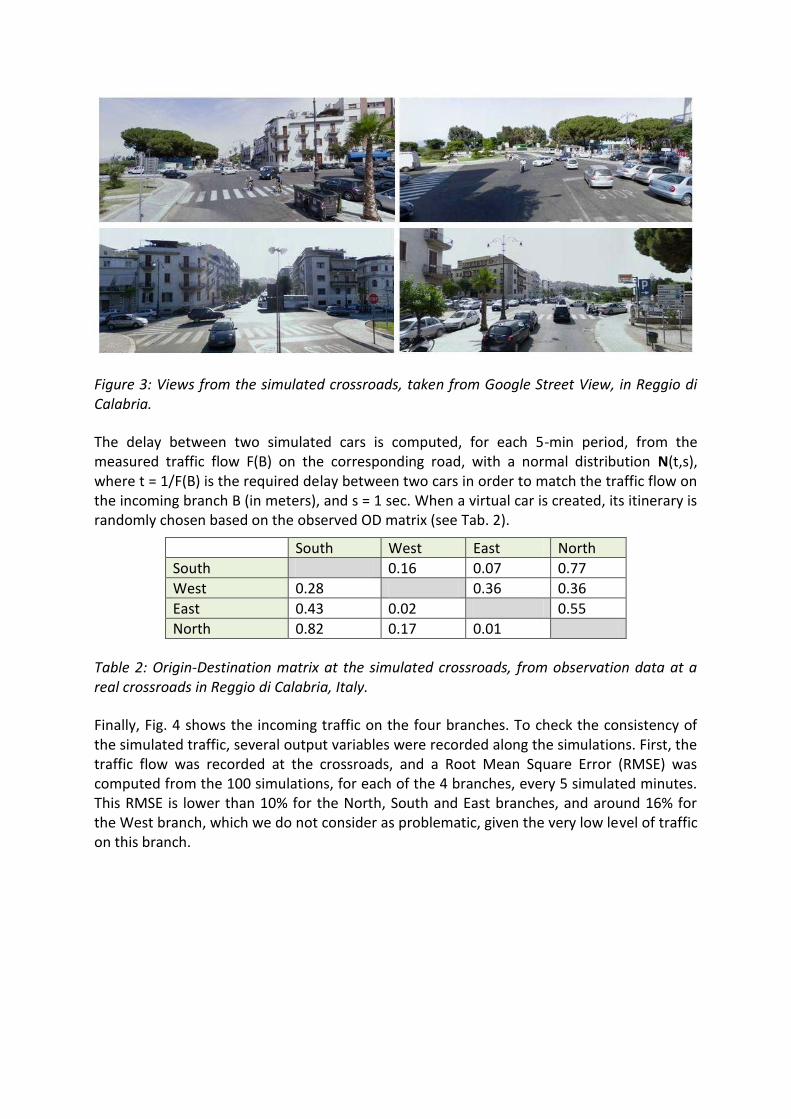
Figure 3: Views from the simulated crossroads, taken from Google Street View, in Reggio di Calabria.
The delay between two simulated cars is computed, for each 5-min period, from the measured traffic flow F(B) on the corresponding road, with a normal distribution N(t,s), where t = 1/F(B) is the required delay between two cars in order to match the traffic flow on the incoming branch B (in meters), and s = 1 sec. When a virtual car is created, its itinerary is randomly chosen based on the observed OD matrix (see Tab. 2).
South West East North
South 0.16 0.07 0.77
West 0.28 0.36 0.36
East 0.43 0.02 0.55
North 0.82 0.17 0.01
Table 2: Origin-Destination matrix at the simulated crossroads, from observation data at a real crossroads in Reggio di Calabria, Italy.
Finally, Fig. 4 shows the incoming traffic on the four branches. To check the consistency of the simulated traffic, several output variables were recorded along the simulations. First, the traffic flow was recorded at the crossroads, and a Root Mean Square Error (RMSE) was computed from the 100 simulations, for each of the 4 branches, every 5 simulated minutes. This RMSE is lower than 10% for the North, South and East branches, and around 16% for the West branch, which we do not consider as problematic, given the very low level of traffic on this branch.
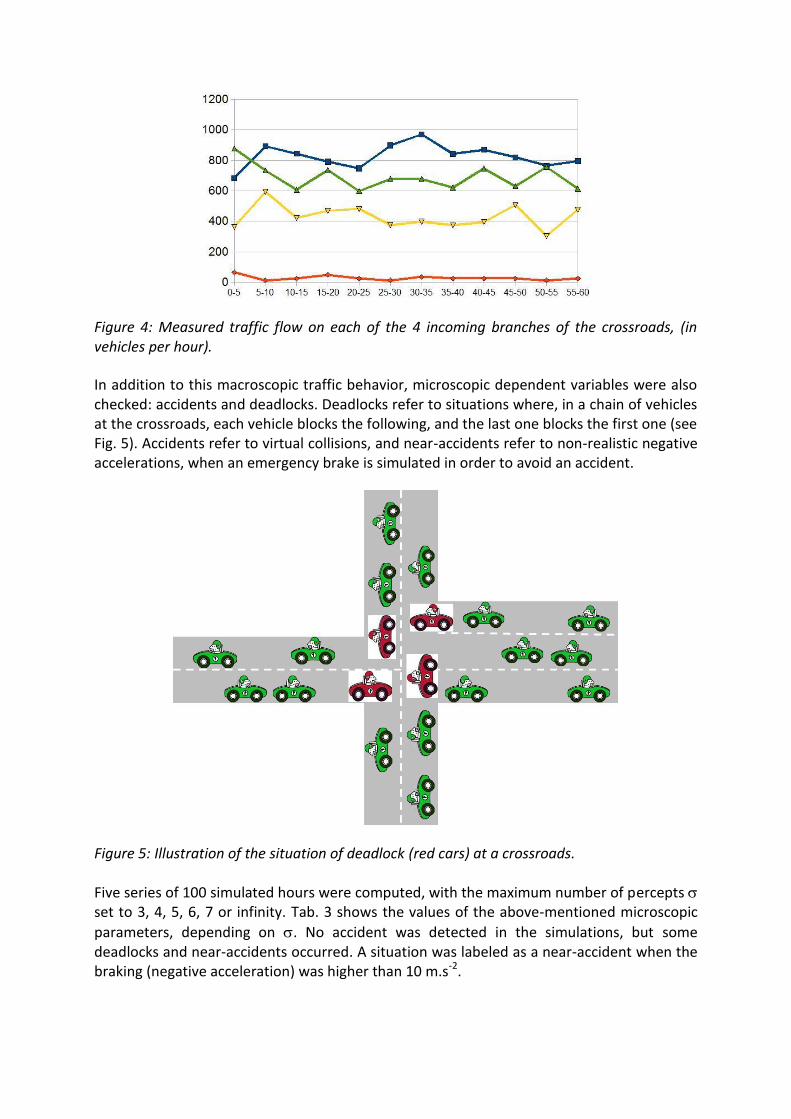
Figure 4: Measured traffic flow on each of the 4 incoming branches of the crossroads, (in vehicles per hour).
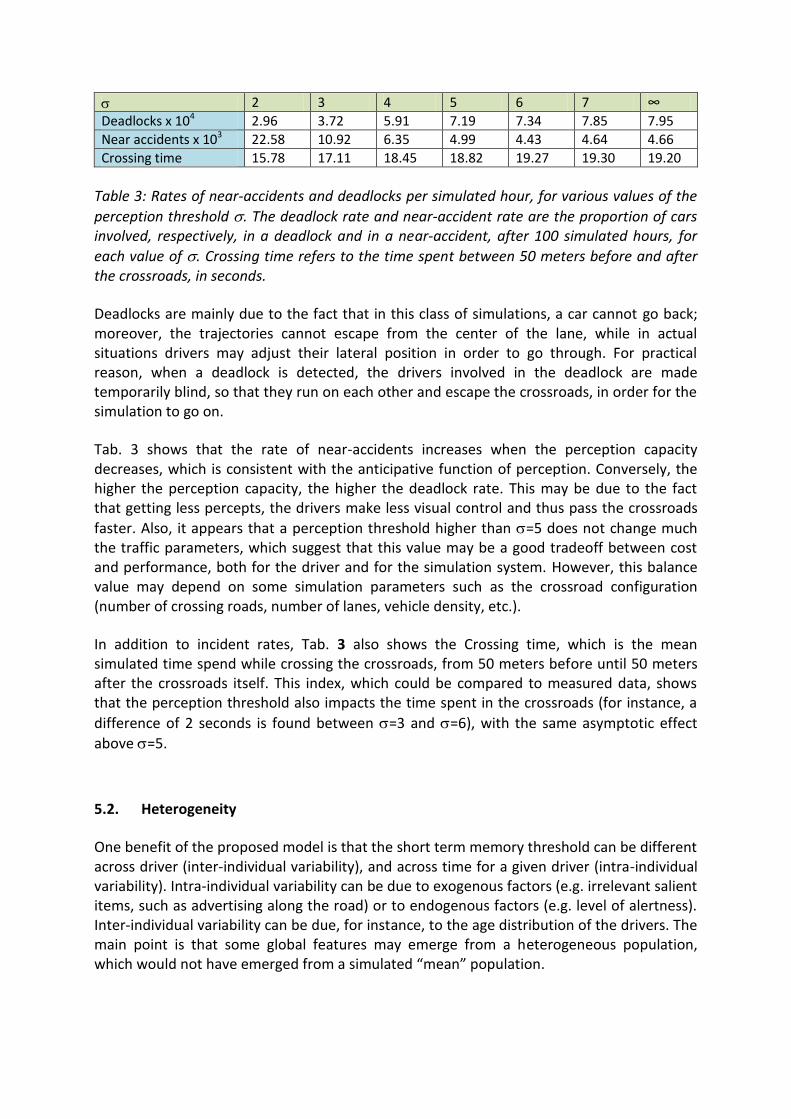
In addition to this macroscopic traffic behavior, microscopic dependent variables were also checked: accidents and deadlocks. Deadlocks refer to situations where, in a chain of vehicles at the crossroads, each vehicle blocks the following, and the last one blocks the first one (see Fig. 5). Accidents refer to virtual collisions, and near-accidents refer to non-realistic negative accelerations, when an emergency brake is simulated in order to avoid an accident.
Figure 5: Illustration of the situation of deadlock (red cars) at a crossroads.
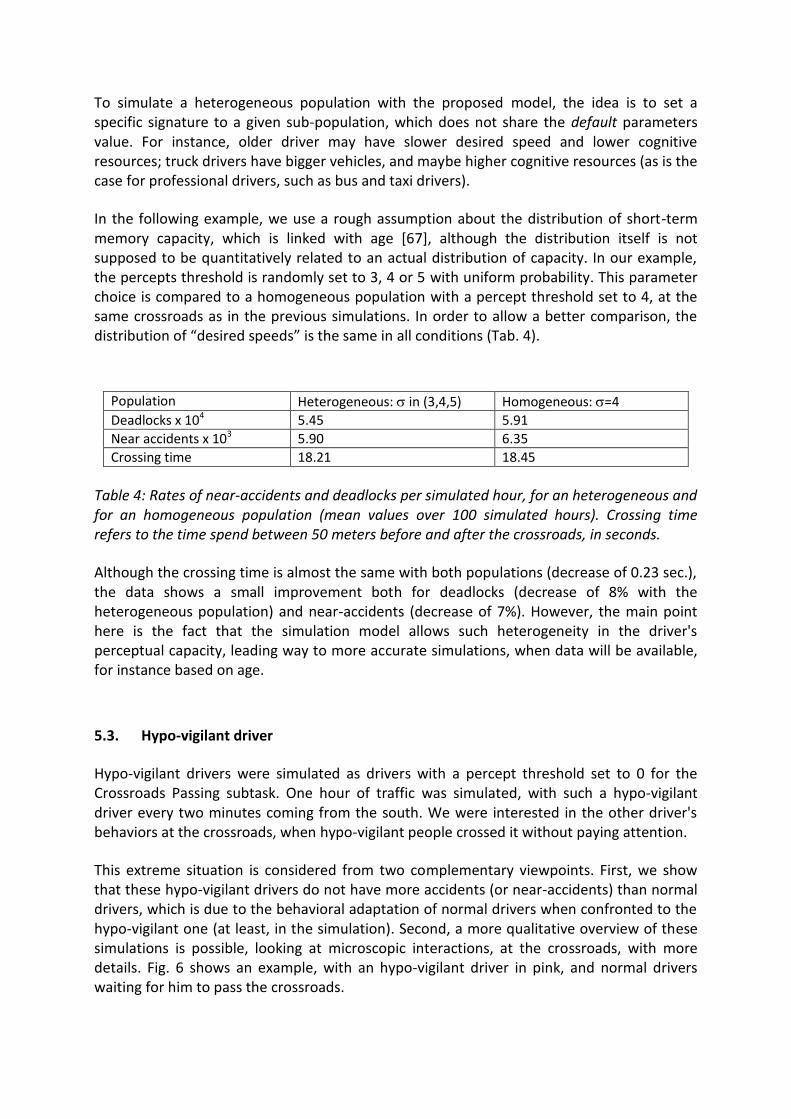
Five series of 100 simulated hours were computed, with the maximum number of percepts set to 3, 4, 5, 6, 7 or infinity. Tab. 3 shows the values of the above-mentioned microscopic
parameters, depending on . No accident was detected in the simulations, but some deadlocks and near-accidents occurred. A situation was labeled as a near-accident when the braking (negative acceleration) was higher than 10 m.s-2.
2 3 4 5 6 7 ∞
Deadlocks x 104 2.96 3.72 5.91 7.19 7.34 7.85 7.95
Near accidents x 103 22.58 10.92 6.35 4.99 4.43 4.64 4.66
Crossing time 15.78 17.11 18.45 18.82 19.27 19.30 19.20
Table 3: Rates of near-accidents and deadlocks per simulated hour, for various values of the
perception threshold . The deadlock rate and near-accident rate are the proportion of cars involved, respectively, in a deadlock and in a near-accident, after 100 simulated hours, for
each value of . Crossing time refers to the time spent between 50 meters before and after the crossroads, in seconds.
Deadlocks are mainly due to the fact that in this class of simulations, a car cannot go back; moreover, the trajectories cannot escape from the center of the lane, while in actual situations drivers may adjust their lateral position in order to go through. For practical reason, when a deadlock is detected, the drivers involved in the deadlock are made temporarily blind, so that they run on each other and escape the crossroads, in order for the simulation to go on.
Tab. 3 shows that the rate of near-accidents increases when the perception capacity decreases, which is consistent with the anticipative function of perception. Conversely, the higher the perception capacity, the higher the deadlock rate. This may be due to the fact that getting less percepts, the drivers make less visual control and thus pass the crossroads
faster. Also, it appears that a perception threshold higher than =5 does not change much the traffic parameters, which suggest that this value may be a good tradeoff between cost and performance, both for the driver and for the simulation system. However, this balance value may depend on some simulation parameters such as the crossroad configuration (number of crossing roads, number of lanes, vehicle density, etc.).
In addition to incident rates, Tab. 3 also shows the Crossing time, which is the mean simulated time spend while crossing the crossroads, from 50 meters before until 50 meters after the crossroads itself. This index, which could be compared to measured data, shows that the perception threshold also impacts the time spent in the crossroads (for instance, a
difference of 2 seconds is found between =3 and =6), with the same asymptotic effect
above =5.
5.2. Heterogeneity
One benefit of the proposed model is that the short term memory threshold can be different across driver (inter-individual variability), and across time for a given driver (intra-individual variability). Intra-individual variability can be due to exogenous factors (e.g. irrelevant salient items, such as advertising along the road) or to endogenous factors (e.g. level of alertness). Inter-individual variability can be due, for instance, to the age distribution of the drivers. The main point is that some global features may emerge from a heterogeneous population, which would not have emerged from a simulated “mean” population.
To simulate a heterogeneous population with the proposed model, the idea is to set a specific signature to a given sub-population, which does not share the default parameters value. For instance, older driver may have slower desired speed and lower cognitive resources; truck drivers have bigger vehicles, and maybe higher cognitive resources (as is the case for professional drivers, such as bus and taxi drivers).
In the following example, we use a rough assumption about the distribution of short-term memory capacity, which is linked with age [67], although the distribution itself is not supposed to be quantitatively related to an actual distribution of capacity. In our example, the percepts threshold is randomly set to 3, 4 or 5 with uniform probability. This parameter choice is compared to a homogeneous population with a percept threshold set to 4, at the same crossroads as in the previous simulations. In order to allow a better comparison, the distribution of “desired speeds” is the same in all conditions (Tab. 4).
Population Heterogeneous: in (3,4,5) Homogeneous: =4
Deadlocks x 104 5.45 5.91
Near accidents x 103 5.90 6.35
Crossing time 18.21 18.45
Table 4: Rates of near-accidents and deadlocks per simulated hour, for an heterogeneous and for an homogeneous population (mean values over 100 simulated hours). Crossing time refers to the time spend between 50 meters before and after the crossroads, in seconds.
Although the crossing time is almost the same with both populations (decrease of 0.23 sec.), the data shows a small improvement both for deadlocks (decrease of 8% with the heterogeneous population) and near-accidents (decrease of 7%). However, the main point here is the fact that the simulation model allows such heterogeneity in the driver's perceptual capacity, leading way to more accurate simulations, when data will be available, for instance based on age.
5.3. Hypo-vigilant driver
Hypo-vigilant drivers were simulated as drivers with a percept threshold set to 0 for the Crossroads Passing subtask. One hour of traffic was simulated, with such a hypo-vigilant driver every two minutes coming from the south. We were interested in the other driver's behaviors at the crossroads, when hypo-vigilant people crossed it without paying attention.
This extreme situation is considered from two complementary viewpoints. First, we show that these hypo-vigilant drivers do not have more accidents (or near-accidents) than normal drivers, which is due to the behavioral adaptation of normal drivers when confronted to the hypo-vigilant one (at least, in the simulation). Second, a more qualitative overview of these simulations is possible, looking at microscopic interactions, at the crossroads, with more details. Fig. 6 shows an example, with an hypo-vigilant driver in pink, and normal drivers waiting for him to pass the crossroads.
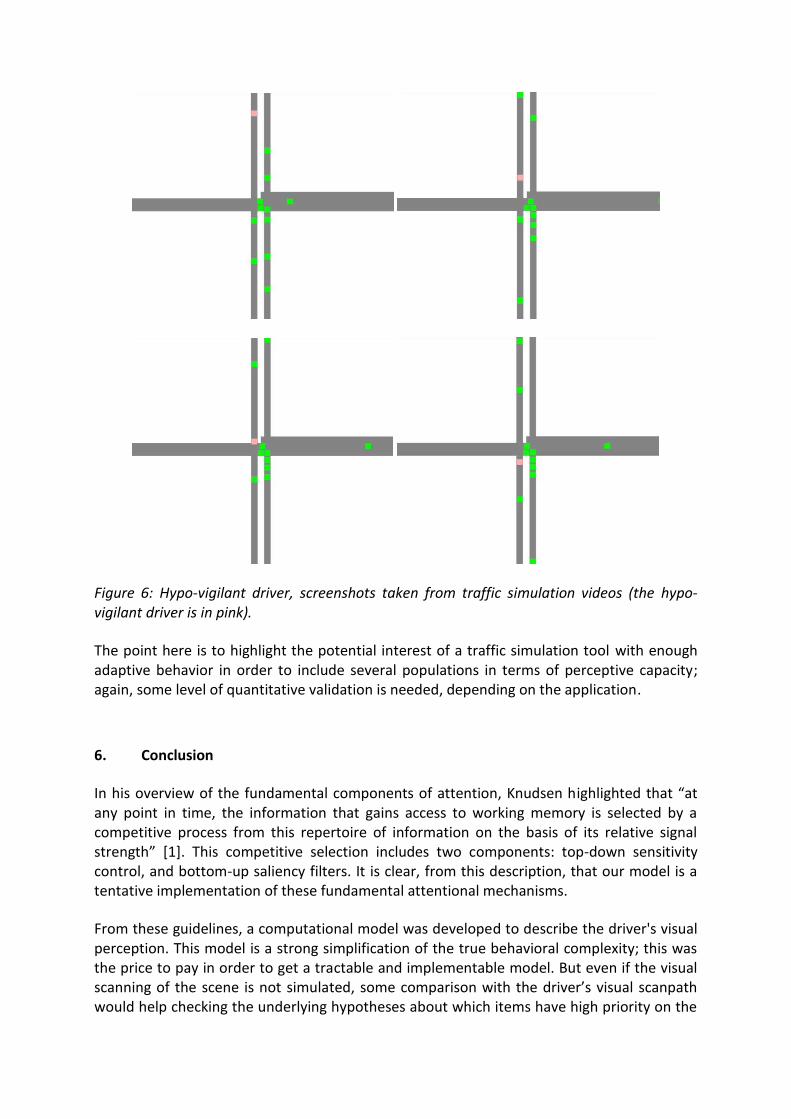
Figure 6: Hypo-vigilant driver, screenshots taken from traffic simulation videos (the hypo-vigilant driver is in pink).
The point here is to highlight the potential interest of a traffic simulation tool with enough adaptive behavior in order to include several populations in terms of perceptive capacity; again, some level of quantitative validation is needed, depending on the application.
6. Conclusion
In his overview of the fundamental components of attention, Knudsen highlighted that “at any point in time, the information that gains access to working memory is selected by a competitive process from this repertoire of information on the basis of its relative signal strength” [1]. This competitive selection includes two components: top-down sensitivity control, and bottom-up saliency filters. It is clear, from this description, that our model is a tentative implementation of these fundamental attentional mechanisms.
From these guidelines, a computational model was developed to describe the driver's visual perception. This model is a strong simplification of the true behavioral complexity; this was the price to pay in order to get a tractable and implementable model. But even if the visual scanning of the scene is not simulated, some comparison with the driver’s visual scanpath would help checking the underlying hypotheses about which items have high priority on the
road for the attentional system. This would be a way to check the validity of the model, which is at this point the main issue where future research is needed.
Still, the main purpose of the model was not to catch individual behavioral validity in traffic simulations, rather to improve the global validity of the emerging behavior in microscopic traffic simulations. We did not compare our simulations to naturalistic observations, and thus we do not claim that we fully reproduce the individual or emerging behavior in any given crossroads. At this point, future research is needed to test the model against road data; obviously, individual behavioral data around and inside a crossroads (and inside various types of crossroads) is needed in order to test the model’s validity.
The computational model allows the simulation of complex traffic situations, where the driver's interactions with each other play an important role. This is why we have demonstrated our algorithm at a crossroads. Of course, other complex situations would be interesting to simulate with the same paradigm. For instance, the implementation of a pedestrian model, following the same "limited perception" framework, is a promising area for future research. Indeed, realistic driver-pedestrian interactions are needed in order to simulate urban traffic at a microscopic level.
The proposed model is mainly a framework, and would deserve improvements. For instance, in the current version of the model, a bottom-up distractor, such as advertising on the road side, can hardly be quoted as salient and gain access to the working memory: the bottom-up mechanism which is implemented is restricted to percepts which already have some level of relevance with respect to the driving task.
Applications of this model may address road operators concerns, such as crossroads design, for instance comparing with vs. without traffic lights, or roundabout vs. crossroads, depending on the incoming traffic. We have also suggested that the impact of ageing population on the traffic parameters may, to some extent, be considered with our model, which may help to estimate the road capacity in the future years. It is worth noting that, even if we have no data at the moment to calibrate safety indexes such as accelerations and distances in the crossroads, the simulation tools allows the recording of such variables, which is not the case with current microscopic traffic simulation tools such as AIMSUN.
Also, virtual reality applications of this model are to be considered. Taking into account the heterogeneity of the simulated driver's behaviors is a key issue in order to make driving simulation more realistic, which in turn is expected to lead to a better level of behavioral realism in driving simulators.
Aknowledgments
We would like to thank Anaïs Nouailles-Mayeur, for fruitful discussions on psychological models, and Sophie Lemonnier for her suggestions which helped to improve the manuscript.
References
1. Knudsen, E. I. (2007). Fundamental components of attention. Annual Review Neuroscience 30:57–78.
2. Weyns, D., Steegmans, E., & Holvoet, T. (2004). Towards active perception in situated multi-agent systems. Applied Artificial Intelligence 18:867–883.
3. Ketenci, U.-G., Brémond, R., Auberlet, J.-M., & Grislin-Le Strugeon, E. (2010). Bounded active perception. In Proc. 8th European Workshop on Multi-Agent Systems. Paris.
4. Ketenci, U.-G., Brémond, R., Auberlet, J.-M., & Grislin-Le Strugeon, E. (2012). Improved road crossing behavior with active perception approach. In Proc. Transportation Research Board Annual Meeting. Washington DC.
5. Donges, E. (1978). A two-level model of driver steering behavior. Human Factors 20:691–707.
6. Land, M. F., & Lee, D. N. (1994). Where we look when we steer. Nature, 369:742–744.
7. Anderson, J. R., Bothell, D., Byrne, M. D., Douglass, S., Lebiere, C., & Quin, Y. (2004). An integrated theory of mind. Psychological Review 111:1036–1060.
8. Salvucci, D. D., Boer, E. R., & Liu, A. (2001). Toward an integrated model of driver behavior in a cognitive architecture. Transportation Research Record, 1779.
9. Salvucci, D. D. (2006). Modeling driver behavior in a cognitive architecture. Human Factors, 48:362–380.
10. Salvucci, D. D. (2002). Modeling driver distraction from cognitive tasks. In Proc. 24th annual Conference of the Cognitive Science Society, 792-797.
11. Bellet, T., Bailly, B., Mayenobe, P., & Georgeon, O. (2007). Cognitive modelling and computational simulation of drivers mental activities. In P. Cacciabue (Ed.), Modelling driver behaviour in automotive environment: critical issues in driver interactions with intelligent transport systems pp. 315–343. Springer Verlag.
12. Bellet, T., Bailly-Asuni, B., Mayenobe, P., & Banet, A. (2009). A theoretical and methodological framework for studying and modelling drivers’ mental representations. Safety Science, 47 :1205–1221.
13. Bellet, T., & Tattegrain-Veste, H. (2003). Cosmodrive : un modèle de simulation cognitive du conducteur automobile. In J. Spérandio, & M. Wolf (Eds.), Formalismes de modélisation pour l’analyse du travail et l’ergonomie (pp. 77–110. Paris : PUF.
14. Endsley, M. (1995). Toward a theory of situation awareness in dynamic systems. Human Factors, 37:32–64.
15. Toledo, T., Koutsopoulos, H. N., & Ben-Akiva, M. (2009). Estimation and integrated driving behavior model. Transportation Research, Part C, 17:365–380.
16. Wang, W., Zhang, W., Guo, H., Bubb, H., & Ikeuchi, K. (2011). A safety-based approaching behavioural model with various driving characteristics. Transportation Research Part C, 19:1202-1214.
17. Brackstone, M., & McDonald, M. (1999). Car-following: a historical review. Transportation Research Part F, 2:181–196.
18. Michon, J. (1985). A critical view of driver behavior models. What do we know, what should we do? In L. Evans, & R. Schwing (Eds.), Human behavior and traffic safety (pp. 485–521). NY, USA: Plenum Press.
19. Champion, A., Zhang, M., Auberlet, J., & Espié, S. (2002). Behavioral simulation: Towards high-density network traffic studies. In Proc. Third International Conference on Traffic and Transportation Studies (pp. 988–995). Guilin (China).
20. Mandiau, R., Champion, A., Auberlet, J.-M., Espié, S., & Kolski, C. (2008). Behaviour based on decision matrices for a coordination between agents in a urban traffic simulation. Applied Intelligence, 28 :121–138.
21. Doniec, A., Mandiau, R., Piechowiak, S., & Espié, S. (2008). A behavioral multi-agent model for road traffic simulation. Engineering Applications of Artificial Intelligence, 21:1443–1454.
22. Gibson, J. J., & Crooks, L. E. (1938). A theoretical field-analysis of automobile driving. The American journal of psychology, 51:453–471.
23. Allen, T. M., Lunenfeld, H., & Alexander, G. J. (1971). Driver information needs. Highway Research Board, 36:102–115.
24. Näätänen, R., & Summala, H. (1974). A model for the role of motivational factors in driver’s decision making. Accident Analysis & Prevention, 6:243–261.
25. Wilde, G. J. S. (1988). Risk homeostasis theory and traffic accidents: propositions, deductions and discussions of dissersion in recent reactions. Ergonomics, 31:441–468.
26. Fuller, R. (1984). A conceptualization of driving behaviour as threat avoidance. Ergonomics, 27:1139–1155.
27. Van der Molen, H. H., & Bötticher, A. M. T. (1988). A hierarchical risk model for traffic participants. Ergonomics, 31:537–555.
28. Rasmussen, J. (1983). Skills, rules, and knowledge: signals, signs, and symbols, and other distinctions in human performance models. IEEE Transactions on Systems, Man, and Cybernetics, 13:257–266.
29. Summala, H. (1996). Accident risk and driver behaviour. Safety Science, 22:103–117.
30. Fuller, R. (2005). Towards a general theory of driver behaviour. Accident Analysis & Prevention, 37:461–472.
31. Fastenmeier, W., & Gstalter, H. (2007). Driving task analysis as a tool in traffic safety research and practice. Safety Science, 45:952–979.
32. Hollnagel, E. (2006). A function-centered approach to Joint Driver-Vehicle System design. Cognition, Technology & Work, 8:169–173.
33. Hollnagel, E., Nabo, A., & Lau, I. V. (2003). A systemic model for driver-in-control. In Proc. International Driving Symposium on Human Factors in Driver Assessment, Training and Vehicle Design (pp. 86–91). Park City, Utah.
34. Barton, J. E., Cohn, T. E., & Tomizuka, M. (2006). Towards a complete human driver model: the effect of vision on driving performance. In Proc. American Control Conference (pp. 2591–2598). Minneapolis, Minnesota.
35. Hills, B. L. (1980). Vision, visibility, and perception in driving. Perception, 9:183–216.
36. Sivak, M. (1996). The information that drivers use: is it indeed 90% visual? Perception, 25:1081–1089.
37. Rumar, K. (1990). The basic driver error: late detection. Ergonomics, 33:1281–1290.
38. Suchman, L. A. (1987). Plans and situated actions. Cambridge University Press.
39. Gibson, J. J. (1979). The ecological approach to visual perception. LEA, London.
40. Miller, G. (1956). The magical number seven, plus or minus two: Some limits on our capacity for processing information. Psychological Review, 63:81–97.
41. Sperling, G. (1960). The information available in brief visual presentations. Psychological Monographs: General and Applied, 74:1–29.
42. Cowan, N. (2001). The magic number 4 in short-term memory: a reconsideration of mental storage capacity. Behavioral and Brain Science, 24:87–185.
43. Marois, R., & Ivanoff, J. (2005). Capacity limits of information processing in the brain. Trends in Cognitive Sciences, 9:296–305.
44. Schneider, W., & Shiffrin, R. M. (1977). Controlled and automatic human information processing: I. detection, search, and attention. Psychological Review, 84:1–66.
45. Shiffrin, R. M., & Schneider, W. (1977). Controlled and automatic human information processing: II perceptual learning, automatic attending and a general theory. Psychological Review, 84:127–190.
46. Baddeley, A. (1992). Working memory. Science, 255(5044):556-559.
47. Baluch, F., & Itti, L. (2011). Mechanisms of top-down attention. Trends in Neuroscience, 34:210–224.
48. Tatler, B. W., Hayhoe, M. M., Land, M. F., & Ballard, D. H. (2011). Eye guidance in natural vision: Reinterpreting salience. Journal of vision, 11, art. 5.
49. Itti, L., & Koch, C. (2001). Computational modeling of visual attention. Nature Reviews Neuroscience, 2:194–203.
50. Shinoda, H., Hayhoe, M. M., & Shrivastava, A. (2001). What controls attention in natural environments? Vision research, 41:3535–3545.
51. Martens, M. H., & Fox, M. (2007). Does road familiarity change eye fixations? A comparaison between watching a video and real driving. Transportation Research Part F: Traffic Psychology and Behaviour, 10:33–47.
52. Salvucci, D. D. (2005). A multitasking general executive for compound continuous tasks. Cognitive Science 29(3):457–492.
53. Ranney, T. A. (1994). Models of driving behavior: A review of their evolution. Accident Analysis and Prevention 26(6):733-750.
54. Lobjois, R., & Cavallo, V. (2007). Age-related differences in street crossing decisions: the effects of vehicle speed and time constraints on gap selection in an estimation task. Accident Analysis and Prevention, 39:934–943.
55. Papadimitriou, E., Yannis, G., & Golias, J. (2009). A critical assessment of pedestrian behaviour models. Transportation Research Part F: Traffic Psychology and Behaviour, 12:242-255.
56. Brémond, R., Tom, A., Désiré, L., Gigout, E., Granié, M.-A., & Auberlet, J.-M. (2012). Visual cues in pedestrian’s crossing decision: in search of a quantitative model. In Proc. Transportation Research Board Annual Meeting. Washington DC.
57. Kesting, A., Treiber, M., & Helbing, D. (2009). Agents for traffic simulation. In Multi-Agents sytems: Simulations and Applications (pp. 325–356). Taylor and Francis.
58. Teknomo, K. (2006). Application of microscopic pedestrian simulation model. Transportation Research Part F, 9:15–27.
59. Brooks, R. A. (1991). Intelligence without representation. Artificial Intelligence, 47:139–159.
60. Ferber, J. (1999). Multi-Agent Systems: An Introduction to Artificial Intelligence. Addison-Wesley.
61. Ferber, J., & Gutknecht, O. (1998). A meta-model for the analysis and design of organizations in multi-agent systems. In Proceedings of Third International Conference on Multi- Agent Systems (pp. 128–135). IEEE Computer Society.
62. Weyns, D., & Holvoet, T. (2004). A formal model for situated multiagent systems. Fundamenta Informaticae, 63.
63. Champion A., Auberlet JM, Mandiau R., Espié S. and Kolski C. (2008). Cas des Intersections en Simulation Comportementale de Trafic Routier : Mécanisme de résolution de conflit. Recherche Transport Sécurité, 25:185-194
64. Wolfe, J. M., & Horowitz, T. S. (2004). What attributes guide the deployment of visual attention and how do they do it? Nature Reviews Neuroscience, 5:495–501.

65. Kotusevski, G., & Hawick, K. (2009). A Review of Traffic Simulation Software. Technical Report CSTN-095 Institute of Information and Mathematical Sciences Massey University, Auckland, New Zealand.
66. Mahmassani, H., & Sheffi, Y. (1981). Using gap sequences to estimate gap acceptance functions. Transportation Research Part B: Methodological , 15:143 – 148.
67. Anders, T. R., Fozard, J. L., & Lillyquist, T. D. (1972). Effects of age upon retrieval from short-term memory. Developmental Psychology, 6, 214–217.