Embed Size (px)
Citation preview

© 2015, T. Albers et al. 1 diffusion-fundamentals.org 23 (2015) 3, pp 1–25
The Open-Access Journal for the Basic Principles of Diffusion Theory, Experiment and Application
Driven diffusion in nanoscaled materials
Tony Albers1, Michael Bauer1, Christian von Borczyskowski1*, Frank Gerlach1,3, Mario Heidernätsch1,
Jörg Kärger2, Daria Kondrashova2, Günter Radons1#, Sebastian Schubert1,4, Alexander Shakhov2,
Daniela Täuber1,5, Rustem Valiullin2§, Philipp Zeigermann2
1Institute of Physics, Technische Universität Chemnitz, Chemnitz, Germany
2Institute for Experimental Physics I, Universität Leipzig, Leipzig, Germany
3now at Fibotec Fiberoptics GmbH, Meiningen, Germany
4now at MPI for Biophysical Chemistry, Göttingen, Germany
5now at Lund University, Lund, Sweden
*[email protected], #[email protected],
Abstract
Mass transfer processes in which specific interactions with environments lead to complex diffusion
patterns, such as the occurrence of transient sub-diffusive behaviors or of heterogeneous diffusion,
were studied by means of two different experimental techniques, namely single-particle tracking
operating with single molecules and nuclear magnetic resonance operating with large molecular
ensembles. As an important point, the combined application of these techniques allowed for a deeper
insight into the microscopic diffusion mechanism in such complex systems, including those with broken
ergodicity.
Particle tracking concentrated on the “Influence of substrate surface properties on heterogeneous
diffusion of probe molecules in ultrathin liquid films”. The mobility of liquids at solid-liquid interfaces is
influenced by substrate heterogeneities. Here we study the distribution of surface silanols on differently
treated silicon wafers with thermal oxide by confocal florescence microscopy of adsorbed Rhodamine
G molecules. We further investigate the influence of the substrate properties on probe molecule diffusion
in ultrathin liquid TEHOS films by single molecule tracking. The results are compared to simulations of
two-layer diffusion employing heterogeneous substrates.
Nuclear magnetic resonance has been applied to study translational diffusion of small organic
molecules in nanopores and of polymer globules in the presence of larger polymer species. In both
cases, the experiments revealed the occurrence of normal diffusion on the time scale of NMR
experiments from ten to hundreds of milliseconds. While single particle tracking revealed the identical
diffusivities for the former case, thus experimentally confirming the validity of the ergodicity theorem for
diffusion, the discrepancies were noted for the latter case. More complex behavior revealing non-ergodic

© 2015, T. Albers et al. 2 diffusion-fundamentals.org 23 (2015) 3, pp 1–25
behavior for propagation of solid-liquid interfaces in disordered nanopores has further been studied
using nuclear magnetic resonance cryoporometry.
A common basis for comparing and analyzing the experimental observables accessed by the two
methods is the distribution of diffusivities, which provides the probability of observing a given diffusivity
fluctuation along a trajectory or in an ensemble. An overview of its properties is given and the
advantages in analyzing heterogeneous, anisotropic, or anomalous diffusion processes are elaborated.
Keywords: Surface silanols, ultrathin liquid films, single molecule detection, tracer diffusion, NMR,
solid-liquid interface, simulation, distribution of diffusivities, heterogeneous diffusion, anisotropy,
ergodicity
1 Influence of substrate surface properties on heterogeneous diffusion of probe
molecules in ultrathin liquid films
1.1 Introduction
The mobility of liquids at solid-liquid interfaces is influenced by substrate heterogeneities. Here we study
the distribution of surface silanols on differently treated silicon wafers with thermal oxide by confocal
fluorescence microscopy of adsorbed Rhodamine G molecules. Silicon wafers with native or thermal
oxide are widely used in technical applications, for example in solar cells or for chip fabrication [1]. The
performance of such devices is influenced by surface chemistry [2] and by local interface properties [3].
In particular, silica surfaces are covered by hydroxyl groups (silanols) and water, depending on
fabrication and temperature treatment [4, 5]. Due to the high fabrication temperature (1000 °C) of the
thermal oxide, the silanol coverage is significantly lower compared to fumed silica [5]. Yet, the amount
and distribution of surface silanols is known to affect nanotechnical fabrication routines, for example
nanolithography [6] and coatings with self-assembled monolayers [7]. However, up to now only average
silanol coverages were known from ensemble measurements on macroscopic scales [4]. Here we use
laser scanning confocal microscopy to investigate the distribution of fluorescent rhodamine 6G (R6G)
adsorbed on 100 nm thermal oxide of Si wafers. According to Iler [8] charged dye molecules
preferentially physisorb to surface silanols. Thus, the derived spatial distribution of adsorbed R6G
molecules unravels the distribution of surface silanols on a submicron range.
Interactions at solid-liquid interfaces influence dynamic properties of fluids [9, 10] and guest
molecules therein, which in particular plays a role in surface processes [11]. Optical investigation of
single molecule diffusion in ultrathin liquid films on quartz cover slips revealed anisotropic diffusion of
probe molecules [12]. This has been related to liquid layering at solid-liquid interfaces [13, 14]. On the
other hand, also heterogeneous interface chemistry and morphology causes anisotropies in probe
molecule diffusion, see for example Figure 1 [15], showing trajectories with position related
heterogeneities obtained from diffusing Rhodamine B (RhB) molecules in ultrathin TEHOS films on
silicon substrates with 100 nm thermally grown SiO2.

© 2015, T. Albers et al. 3 diffusion-fundamentals.org 23 (2015) 3, pp 1–25
Figure 1: (left) Spatial plot of several immobile (bright areas) and three mobile (colored trajectories) obtained for a
10 nm thick TEHOS film on SiO2 doped with RhB. (right) Diffusivities 𝑑diff over total time 𝑡 for light green and purple
trajectory from the left image. The center of the solid and dashed circles in the left image mark areas with repeated periods of immobilization. The corresponding sets of periods are marked by solid and dashed arrows in the right image [15].
We use a homebuilt wide-field microscope [15] to study the influence of surface silanols on tracer
diffusion in ultrathin liquid films. A common way to analyze diffusion experiments is to calculate mean
square displacements (MSD) along detected trajectories [16]. However, long trajectories are necessary
for good statistics [17]. In particular, heterogeneous or anomalous diffusion may be concealed due to
the strong time averaging [18]. Moreover, the length of observed trajectories of single dye molecules is
often limited by photobleaching and fluorescence intermittency [19]. Improved statistics can be achieved
by detecting square displacements (Δ𝑟)2 for succeeding time steps at a fixed time lag 𝜏 [20]. Thus,
probability distributions 𝐶(𝐷)𝜏 of time scaled (Δ𝑟)2 between succeeding steps (diffusivities 𝑑diff =
(Δ𝑟)2/(4𝜏)) provide a promising alternative [15, 21], since time averaging is realized and statistics are
increased. 𝐶(𝐷)𝜏 is defined as the probability of finding a diffusivity 𝑑diff > 𝐷. By scaling the squared
displacements by the corresponding time lag 𝜏 the trivial dependence on 𝜏 is removed and thus
facilitates the comparability for different 𝜏. However, for heterogeneous diffusion the shape of the
probability distribution of diffusivities may still depend on 𝜏 [22]. For this reason, 𝜏 is noted as index. In
case of homogeneous diffusion with diffusion coefficient 𝐷, the cumulative probability distribution of
diffusivities amounts to
𝐶(𝐷)𝜏 = exp(−𝐷/𝐷0). (1)
In this case, probability distributions of diffusivities show a linear behavior in semi-log plots. In case
of heterogeneous or anomalous diffusion, deviations from the mono-exponential function will appear.
The further analysis then depends on the origin of such deviations [22].
Our findings show that the most regular distribution of surface silanols is obtained after etching the
substrates in H2O2:H2SO4 (piranha) solution. Larger silanol clusters (on hydroxylated substrates) and
larger distances between clusters (on tempered substrates) both enhance the heterogeneity of probe
molecule diffusion.
1.2 Experimental
Si(100) wafers with 100 nm thermal oxide (dry O2/HCl processed at 1000 °C) were obtained from the
Center for Microtechnologies (ZfM, Chemnitz, Germany). In particular, for optical single molecule

© 2015, T. Albers et al. 4 diffusion-fundamentals.org 23 (2015) 3, pp 1–25
investigations clean substrates are needed. In addition to commonly applied cleaning procedures [15],
some substrates were boiled in ultraclean water for 20 h (“hydroxylated”), while others were tempered
for 0.5 h at 800 °C in air (“tempered”). Substrates which underwent no additional treatment besides
cleaning were used for comparison (“piranha”).
1.2.1 Determination of local silanol densities
The substrates were dipcoated in solutions of 10-6 mol/l Rhodamine 6G (R6G, Radiant Dyes) in ethanol
using a stand-alone dipcoater (KSV-DX2, KSV Instruments). Similar concentrated solutions of R6G in
toluene and in n-hexane were used for comparison (all solvents of spectroscopic grade, Merck). The
withdrawal speed was 5 mm/min. Thereby a thin film of the solution is generated on the substrate. This
film evaporates within 30 minutes, while dye molecules remain on the substrate at silanol binding sites.
Fluorescence images of the R6G distribution were recorded with a homebuilt laser scanning confocal
microscope [23]. Confocal images (100±20 µm2) were analyzed using WSxM 5.0 [24]. First, an
intensity threshold was set for each image at its mean intensity minus one standard deviation. Then the
images were smoothed with a Gaussian profile. From the processed images cluster sizes and
coverages were determined using a cluster threshold size of 0.05 µm2 [15, 25].
1.2.2 Probe diffusion measurements
Probe molecule diffusion at the solid liquid interface was investigated using ultrathin liquid films of
Tetrakis-2-ethylhexoxy-silane (TEHOS, abcr). Due to the small film thickness of 5±1 nm probe
molecules remain close to the substrate. TEHOS films were obtained by dipcoating the substrates in
solutions of few ppt TEHOS in n-hexane (spectroscopic grade, Merck) [15]. The solutions were doped
with fluorescent Rhodamine B (RhB) resulting in a nanomolar concentration of dye molecules in the
TEHOS film. The diffusion of RhB was recorded with a wide-field microscope with epi-illumination [15].
Since the z-focus (about 1 µm) is considerably larger than the film thickness, the 3D motion is projected
onto a 2D motion parallel to the substrate. Thus, the obtained diffusion coefficients are effective diffusion
coefficients parallel to the substrate. Series of 1800 succeeding images were recorded with a CCD
camera (iXon DU 885K, Andor) at a frame rate of 1 fps, resulting in 30 min observation time for each
measurement. The diffusion tracks were analyzed using home-written C/C++ programs [15, 26].
Immobile RhB molecules were excluded from further analysis.
1.3 Results and Discussion
1.3.1 Variation of Hydroxylation
Fluorescence intensities from R6G after evaporation of the solvent show an inhomogeneous distribution.
In Figure 2 fluorescence intensities from three differently treated substrates are shown after evaporation
of ethanol. Raw images have been processed with WSxM 5.0 [24]. Similar results were obtained using
toluene and n-hexane as solvents (not shown). Thus, the distribution of R6G molecules on the thermal
oxide is not influenced by the kind of solvent, but is determined by the properties of the substrate surface.
© 2015, T. Albers et al. 5 diffusion-fundamentals.org 23 (2015) 3, pp 1–25
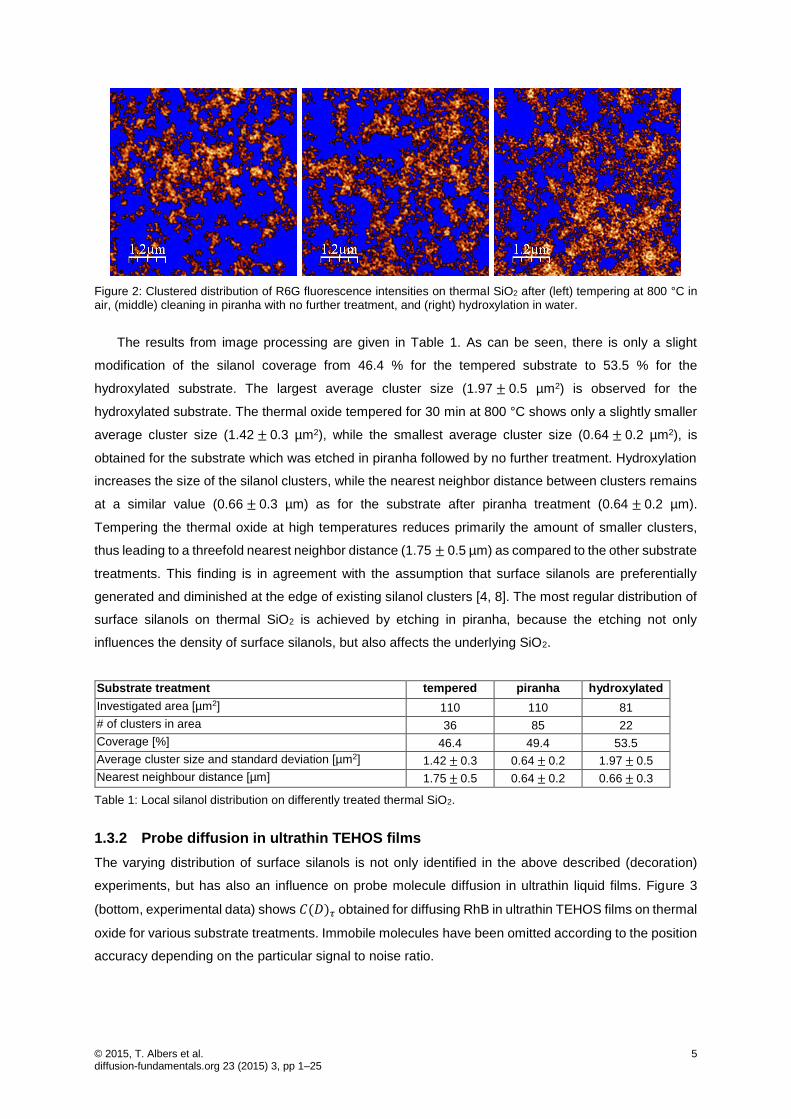
Figure 2: Clustered distribution of R6G fluorescence intensities on thermal SiO2 after (left) tempering at 800 °C in air, (middle) cleaning in piranha with no further treatment, and (right) hydroxylation in water.
The results from image processing are given in Table 1. As can be seen, there is only a slight
modification of the silanol coverage from 46.4 % for the tempered substrate to 53.5 % for the
hydroxylated substrate. The largest average cluster size (1.97±0.5 µm2) is observed for the
hydroxylated substrate. The thermal oxide tempered for 30 min at 800 °C shows only a slightly smaller
average cluster size (1.42±0.3 µm2), while the smallest average cluster size (0.64±0.2 µm2), is
obtained for the substrate which was etched in piranha followed by no further treatment. Hydroxylation
increases the size of the silanol clusters, while the nearest neighbor distance between clusters remains
at a similar value (0.66±0.3 µm) as for the substrate after piranha treatment (0.64±0.2 µm).
Tempering the thermal oxide at high temperatures reduces primarily the amount of smaller clusters,
thus leading to a threefold nearest neighbor distance (1.75±0.5 µm) as compared to the other substrate
treatments. This finding is in agreement with the assumption that surface silanols are preferentially
generated and diminished at the edge of existing silanol clusters [4, 8]. The most regular distribution of
surface silanols on thermal SiO2 is achieved by etching in piranha, because the etching not only
influences the density of surface silanols, but also affects the underlying SiO2.
Substrate treatment tempered piranha hydroxylated
Investigated area [µm2] 110 110 81
# of clusters in area 36 85 22
Coverage [%] 46.4 49.4 53.5
Average cluster size and standard deviation [µm2] 1.42±0.3 0.64±0.2 1.97±0.5
Nearest neighbour distance [µm] 1.75±0.5 0.64±0.2 0.66±0.3
Table 1: Local silanol distribution on differently treated thermal SiO2.
1.3.2 Probe diffusion in ultrathin TEHOS films
The varying distribution of surface silanols is not only identified in the above described (decoration)
experiments, but has also an influence on probe molecule diffusion in ultrathin liquid films. Figure 3
(bottom, experimental data) shows 𝐶(𝐷)𝜏 obtained for diffusing RhB in ultrathin TEHOS films on thermal
oxide for various substrate treatments. Immobile molecules have been omitted according to the position
accuracy depending on the particular signal to noise ratio.

© 2015, T. Albers et al. 6 diffusion-fundamentals.org 23 (2015) 3, pp 1–25
Figure 3: (bottom) Cumulative probability distributions of diffusivities 𝐶(𝐷)𝜏 from simulations (●) and experiment (○)
together with fits according to (2), for simulations (dotted line) and experiment (dashed line) obtained for different experimentally determined silanol distributions such as shown in Figure 2: (left) tempered, (middle) piranha treated and (right) hydroxylated substrates. (top) heterogeneous substrate coverage used for the simulation, areas with slow diffusion are black. (middle) time integrated fluorescence intensities obtained from tracking analysis with tracking.sh.
As can be seen, the 𝐶(𝐷)𝜏 (Figure 3 bottom) deviate from a mono-exponential behavior for all three
kinds of substrate treatments. The analysis of heterogeneous diffusion is not straightforward and the
diffusion coefficients may be derived from fitting experimental data only in some particular cases using
only two distinct components [15, 22, 26]. Nevertheless, an approximation using a sum of two
exponentials, Eq. (2), provides further insights into probe diffusion behavior.
𝐶(𝐷)𝜏 = 𝐴1 exp(−𝐷/𝐷1) + 𝐴2exp(−𝐷/𝐷2), with 𝐴1 + 𝐴2 = 1. (2)
This simplified approach has been used since we suggest a simple 2-layer model as described in
Figures 4 and 5. Naturally, more complex fitting functions would fit the data more closely. The results
from fitting the data with (2) are given in Table 2. In case of the piranha treated substrate, the bi-
exponential approximation fits the experimental data quite well, whereas for the hydroxylated substrates
larger diffusivities are observed. These deviations are even more pronounced in case of the tempered
substrate. However, deviations only occur in the amplitude range of 10-2 to 10-3. Moreover, only a few
C(D
) =
1s
D [m2/s] D [m2/s] D [m2/s]

© 2015, T. Albers et al. 7 diffusion-fundamentals.org 23 (2015) 3, pp 1–25
data points can be collected for fast diffusion in case of high silanol coverage (middle and right graph).
The amplitudes 𝐴1 for the slow component increase from the “tempered” to the “hydroxylated” substrate
thereby following the increase of coverage with surface silanols as given in Table 1.
These findings can be interpreted using a simple lateral two-region model as depicted in Figure 4.
We assume that probe molecules diffuse on top of the silanol clusters with an effective diffusion
coefficient 𝐷slow, whereas they diffuse with 𝐷fast between the clusters. The slow diffusion on the silanol
clusters is caused by adsorption/desorption kinetics during the image exposure time. In case of probe
molecules with two possible H-bonding sites (as it is the case for RhB), also some kind of surface gliding
by successive building and breaking of H-bonds with neighboring surface silanols may be considered,
as suggested by Honciuc et al. [27]. The here described experiment did not allow for discrimination
between fast re-adsorbtion dynamics and surface gliding. The slow effective diffusion will depend on
the particular probe molecule chemistry.
𝐷fast cannot be directly derived from the silanol density distribution. The diffusion coefficient of RhB
in bulk TEHOS is about 50 µm2/s [15]. Thus, the probe molecule would diffuse across an effective area
of about 50 µm2 during an exposure time of 1 s which is considerably larger than the average area
separating neighboring silanol clusters (see Figure 2). Therefore probe molecules diffuse with 𝐷fast only
part of the image exposure time. The remaining time they will diffuse with 𝐷slow on top of the silanol
clusters.
Figure 4. Influence of interface heterogeneity on probe molecule diffusion including physi- or chemisorption [15].
For this reason, the geometry of the silanol clusters and the interspacing region has an essential
influence on the probability distribution of diffusivities. On the piranha treated substrate, silanols
constitute many small clusters resulting in a narrow cluster size distribution with a small and quite regular
interspacing distance. Thus, the correlated diffusivities show an almost mono-exponential dependence
for diffusion coefficient 𝐷2. In this case, 𝐷2 resembles the average diffusion coefficient for fast probe
molecules. On contrary, in case of the tempered and the hydroxylated substrate, silanol cluster sizes
and the interspacing distances show a much broader distribution. Therefore, diffusivities are not mono-
exponentially distributed. For the tempered substrate, the much larger interspacing areas lead to a
stronger contribution from longer transients, increasing the probability for larger diffusivities.

© 2015, T. Albers et al. 8 diffusion-fundamentals.org 23 (2015) 3, pp 1–25
1.3.3 Simulation of diffusion influenced by surface heterogeneities
To further evaluate the influence of substrate surface heterogeneities on diffusion coefficients, we
performed simulations using a vertical two layer model. Within the software package dsaa, Heidernätsch
had developed a simulation tool which allowed to incorporate structured substrates into a multi-layer
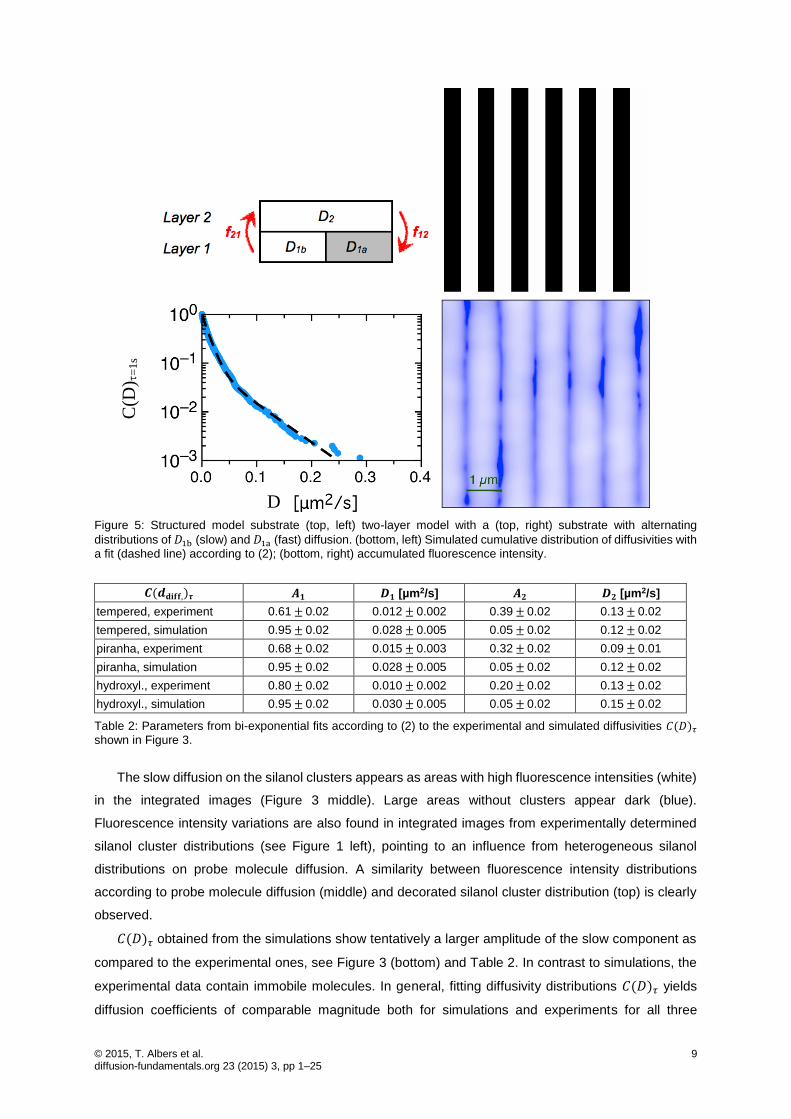
model and simulates also wide-field acquisition of probe molecule diffusion [26]. Figure 5 (top) illustrates
two-layer diffusion for a model substrate (top, right) containing stripes with reduced mobility (black). In
the model (top, left), a reduced diffusion coefficient 𝐷1a is used in layer 1 on the black areas of the
substrate, while on the white areas, the diffusion coefficient 𝐷1b was set equal to the top-layer diffusion
coefficient 𝐷2. Figure 5 (bottom) shows the results from analyzing simulated wide-field data with the
tracking package tracking.sh [12, 15]. For this simulation the diffusion coefficients have been set to
𝐷2∗ = 𝐷1b∗ =1 µm2/s and 𝐷1a∗ =0.01 µm2/s with exchange rates 𝑓12 =0.5 s-1 and 𝑓21 =0.01 s-1
between the upper and lower layer and a time step d𝑡 =0.1 ms. The wide-field acquisition was
simulated with an exposure time 𝛥𝑡 =1 s for each frame and a total number of 1800 subsequent frames.
Figure 5 (bottom right) shows simulated intensities integrated over all 1800 frames on a scale ranging
from low (blue) to high (white) fluorescence intensities. The stripes with slow diffusion (black) in layer 1
correspond to high fluorescence intensities, separated by low intensity stripes marking the areas with
fast diffusion. The lower intensity between stripes of slow diffusion is related to the fact that for fast
diffusing molecules the detected intensity will be smeared out over a wider area during one time step.
Additionally, the stationary distribution of probe molecules yields a higher probability for molecules on
the stripes with correlated slow diffusion.
Figure 5 (bottom, left) shows the simulation of the cumulated probability distribution of diffusivities
from all detected trajectories together with a fit according to (2). On the time scale of the observation,
the diffusion is heterogeneous, as can be seen from the fit deviating from a straight line. We obtain
effective diffusion coefficients 𝐷1 =0.012 µm2/s and 𝐷2 =0.055 µm2/s with amplitudes 𝐴1 =0.9 and
𝐴2 =0.1, respectively. The obtained effective diffusion coefficients are intermediates between the
diffusion coefficients 𝐷1a∗ =0.01 µm2/s and 𝐷2∗ = 𝐷1b∗ =1 µm2/s used for the simulation and do not
correspond to the real diffusion coefficients. While 𝐷slow = 𝐷1 =0.012 µm2/s gives a reasonable value
for diffusion across silanol clusters with short excursion into the upper film region, Dfast cannot be
retrieved from these simulations, whereby 𝐷2 =0.055 µm2/s gives rather an average for very fast and
the slow diffusion.
To proceed further towards a more realistic silanol related cluster model, we used the experimentally
obtained silanol distributions (see Figure 2) as heterogeneous substrates as a base for the simulations
using the same diffusion parameters as for the previously described model simulations. Figure 3 (top)
shows the heterogeneous substrates with (left) tempered, (middle) piranha treated, and (right)
hydroxylated surface. Again, areas of slow diffusion are shown in black. The related integrated
intensities from analysis of the simulated acquisitions using tracking.sh are shown in Figure 3 (middle).
Figure 3 (bottom) shows probability distributions 𝐶(𝐷)𝜏 obtained from the detected trajectories from
simulation (●) and in comparison to experimental (○) diffusion of RhB in ultrathin TEHOS films on the
differently treated substrates. Fitting data are collected in Table 2.
© 2015, T. Albers et al. 9 diffusion-fundamentals.org 23 (2015) 3, pp 1–25
Figure 5: Structured model substrate (top, left) two-layer model with a (top, right) substrate with alternating
distributions of 𝐷1b (slow) and 𝐷1a (fast) diffusion. (bottom, left) Simulated cumulative distribution of diffusivities with
a fit (dashed line) according to (2); (bottom, right) accumulated fluorescence intensity.
𝑪(𝒅𝐝𝐢𝐟𝐟,)𝝉 𝑨𝟏 𝑫𝟏 [µm2/s] 𝑨𝟐 𝑫𝟐 [µm2/s]
tempered, experiment 0.61±0.02 0.012±0.002 0.39±0.02 0.13±0.02
tempered, simulation 0.95±0.02 0.028±0.005 0.05±0.02 0.12±0.02
piranha, experiment 0.68±0.02 0.015±0.003 0.32±0.02 0.09±0.01
piranha, simulation 0.95±0.02 0.028±0.005 0.05±0.02 0.12±0.02
hydroxyl., experiment 0.80±0.02 0.010±0.002 0.20±0.02 0.13±0.02
hydroxyl., simulation 0.95±0.02 0.030±0.005 0.05±0.02 0.15±0.02
Table 2: Parameters from bi-exponential fits according to (2) to the experimental and simulated diffusivities 𝐶(𝐷)𝜏 shown in Figure 3.
The slow diffusion on the silanol clusters appears as areas with high fluorescence intensities (white)
in the integrated images (Figure 3 middle). Large areas without clusters appear dark (blue).
Fluorescence intensity variations are also found in integrated images from experimentally determined
silanol cluster distributions (see Figure 1 left), pointing to an influence from heterogeneous silanol
distributions on probe molecule diffusion. A similarity between fluorescence intensity distributions
according to probe molecule diffusion (middle) and decorated silanol cluster distribution (top) is clearly
observed.
𝐶(𝐷)𝜏 obtained from the simulations show tentatively a larger amplitude of the slow component as
compared to the experimental ones, see Figure 3 (bottom) and Table 2. In contrast to simulations, the
experimental data contain immobile molecules. In general, fitting diffusivity distributions 𝐶(𝐷)𝜏 yields
diffusion coefficients of comparable magnitude both for simulations and experiments for all three
C(D
) =
1s
D

© 2015, T. Albers et al. 10 diffusion-fundamentals.org 23 (2015) 3, pp 1–25
substrate treatments. The best overall agreement between simulation and experiment is obtained for
the piranha treated substrate. Here the almost regularly distributed small silanol clusters result in a
rather homogeneous substrate surface leading to a more homogeneous lateral diffusion. Consequently,
the slow and fast components obtained from fits to experimental data yield the smallest difference with
𝐷1 =0.015 µm2/s and 𝐷2 =0.09 µm2/s (see Table 2). The largest deviation between 𝐶(𝐷)𝜏 from
experiment and simulation is found for the tempered substrate (see Figure 3 bottom left). In this case
the simulation can be described nearly bi-exponential. According to Table 1 the nearest neighbor
distance is in the tempered case much larger than for the other 2 surfaces. However, the simulation is
– if restricting to a simple bi-exponentially approximation – not very sensitive to the kind of substrate.
Additionally, the fitted amplitudes of the fast component are with respect to the experiment
underestimated, especially for the tempered substrate for which an apparently third still faster
component does not show up at all.
The reason for these deviations is probably due to the fact that the simple approximation of only 2
diffusion coefficients and exchange rates, respectively, does not hold. However, in a first step we
intended to keep the simulation model as simple as possible. We suggest that the exchange rates
between the layers depend on the underlying structure itself and the ratio 𝑓21/𝑓12 should be increased
for the tempered substrate. Moreover, the diffusion in the upper film layer and the silanol-free areas was
set to 𝐷2∗ =1 µm2/s for the simulation. However, the bulk diffusion coefficient of RhB in TEHOS is about
50 µm2/s [15], which is much faster than 1 µm2/s set for diffusion in the upper film layer. Keeping in mind
that all diffusion parameters (including exchange rates 𝑓𝑖𝑗) have been assumed to be the same for all 3
substrates the general trend of the simulations of 𝐶(𝐷)𝜏 supports the concept of slowed lateral diffusion
on surface silanol clusters.
In this study we have used surface silanol distributions on differently treated silicon substrates with
thermally grown oxide to show how substrate surface heterogeneities influence probe molecule diffusion
in ultrathin liquid films. Increasing the heterogeneity by either increasing the average silanol cluster size
or the mean distance between the clusters, enhances the heterogeneity in probe molecule diffusion.
Simulations employing an oversimplified two-layer model with a (realistic) heterogeneous substrate
structure support the concept of slow and fast lateral diffusion across areas on the substrate containing
silanol clusters and silanol-free areas, respectively. However, the simulations have to be extended to
allow for structure related variations of the simulation parameters.
Two further studies not discussed here, investigate the influence of heterogeneous substrate
structures on diffusion of nanoscale Ag clusters in surface water layers on silicon oxide substrates [28,
29]. Additionally to the superficial heterogeneities, also long-range interactions, as for example van der
Waals forces, have an impact on interfacial mobility and probe molecule diffusion [30]. For intrinsically
structured materials such as liquid crystals, there is an additional impact of structure related changes at
solid-liquid interfaces on probe molecule diffusion [31–33].

© 2015, T. Albers et al. 11 diffusion-fundamentals.org 23 (2015) 3, pp 1–25
2 Comparing transport properties obtained using single particle and ensemble
observations
2.1 Introduction
Mass transfer processes occurring in materials with specific interactions may lead to complex diffusion
behavior, such as the occurrence of transient sub-diffusion or of heterogeneous diffusion. Diffusion is
the irregular, omnipresent motion of the elementary constituents of matter. Historically, diffusion
measurements were based on the observations of large ensembles of diffusing particles [34]. The
recently emerged single-particle tracking (SPT) or fluorescence correlation spectroscopy (FCS), in
which either single molecules or their small ensembles are traced, have provided a totally new view of
diffusion [35–37]. At the same time, these developments posed a problem of inter-relating the messages
delivered by these two classes of experimental techniques. The latter was in the focus of the present
work. The results and their discussions presented here concern several selected systems, in which the
traced markers were small molecules [38, 39], polymer globules [40], and crystal-fluid interfaces in
channel-like disordered pores [41–43]. These three different systems considered represented three
different situations in which the relevant characteristic time scales of the underlying transport processes
were (i) notably shorter, (ii) of the order of, and (iii) notably longer than the experimental time scale,
respectively. In this way, with the former (i) and the latter situations (iii) we have mimicked ergodic and
non-ergodic systems, respectively; for the intermediate case (ii), according to the literature data
anomalous diffusion consistent with the fractional Brownian motion or obstructed diffusion was
anticipated to occur [44].
To address these problems experimentally, we used two different techniques of NMR, namely
pulsed field gradient (PFG) NMR [45] to directly probe the mean square displacements (MSD) and NMR
cryoporometry [46] to follow propagation of the solid-liquid interfaces in nanochannels. The thus
assessed quantities represented ones averaged over large ensembles. The results obtained were
compared to those obtained either using SPT or FCS. Starting with the most simple system exhibiting
normal diffusion we experimentally demonstrate the validity of the ergodic theorem for diffusion. For
more complex systems, we report on the discrepancies existing between the two methods and discuss
the underlying reasons.
2.2 Results and discussion
2.2.1 Experimental confirmation of the ergodic theorem
As a trivial, but as a necessary and experimentally challenging step, before any studies in which time-
and ensemble-averaged transport quantities are correlated, one shall be concerned with the
experimental demonstration of the validity of the ergodic theorem for systems, in which it is expected to
be valid. In these systems, all microscopic time scales should be notably shorter than the experimental
one. Despite being generally accepted, the proof of the equivalency of the ensemble- and time-averaged
MSD,
⟨𝑟2(𝑡)⟩ensemble = ⟨𝑟2(𝑡)⟩time, (3)

© 2015, T. Albers et al. 12 diffusion-fundamentals.org 23 (2015) 3, pp 1–25
remained not addressed experimentally. Mainly, this was caused by the mutually contradicting
measuring conditions inherent in the two experimental approaches, in particular in NMR and in SPT. In
SPT, the trajectories of the diffusing single molecules are constructed by fitting the positions of the
molecules over time [35]. Therefore the fluorescence signals of the molecules have to be clearly
separated from each other, demanding their very low concentrations. Additionally the measurements
are limited by the signal-to-noise ratio, which is determined by the brightness of the dye molecules and
the integration time. Hence, there is an upper limit for the detectable diffusivity in SPT. Exactly the
opposite conditions, namely high concentrations (for generating sufficiently strong NMR signal requiring
at least 1018 nuclear spins in the samples) and high diffusivities (for giving rise to observable
displacements) must be fulfilled for PFG NMR [45].
Figure 6: (a) Normalized spin-echo diffusion attenuations measured for Atto532 dissolved in deuterated methanol in nanoporous glass using PFG NMR. The two slopes correspond to the Atto532 diffusivities in the nanopores and in the excess bulk phase. (b) Cumulative distributions of the diffusivities measured using SPT (from Ref. [38]).
In order to match the measurements conditions for PFG NMR and SPT studies, we have applied
nanoporous glass as a host system for the solution of Atto532 dye molecules in an organic solvent as
a guest ensemble. The diffusivity of Atto532 in a nanoporous glass depends on their concentration. For
high concentrations it is governed by guest-guest and host-guest interactions, whereas for low
concentrations the latter mechanism dominates. While single-molecule experiments were performed in
the low-concentration regime (~10-11 mol/l), we managed to reduce the concentration in the PFG NMR
experiments to approach this concentration regime corresponding to about 1018 protons of Atto532 in
the sample contributing to the NMR signal. Further on, by purposeful tuning the pore diameter of the
nanoporous glass down to 3 nm, the diffusivity of Atto532 was adjusted to a range of the values
accessible by both techniques. As an example, Figures 6a and 6b show the NMR signal diffusion
attenuation and the cumulative diffusivity distribution (defined in Section 3.1) measured for identical
samples and under identical conditions using PFG NMR and SPT, respectively. They yield within the
experimental accuracy the equal average diffusivities of Atto532 in the nanopores of (1.2±0.5)⋅10-11
m2/s.
For the first time, single-molecule and ensemble diffusion measurements were found to
experimentally confirm the hypothesis of ergodicity for a simple system exhibiting normal diffusion. With
this important step being made, the experimental approach developed can be extended to more

© 2015, T. Albers et al. 13 diffusion-fundamentals.org 23 (2015) 3, pp 1–25
complex systems, including those for which Eq. (3) may not hold. Our current activities concern, in
particular, with systems exhibiting normal diffusion but having broad distributions of diffusivities of the
diffusing species. This can be observed, e.g., in diluted polymer solutions with high polydispersity
indices. Intrinsic peculiarities inherent in the two experimental methods render the distributions of the
measured diffusivities to deviate from each other. Elucidating the particular mechanisms for this
observation is currently under progress.
2.2.2 Systems displaying anomalous diffusion
With the experiments described in the preceding section, the two so-far separated worlds of diffusion
measurements have been brought together for a situation where the rules of normal diffusion are
obeyed. However, single particle observations of, e.g., biological systems [47, 48] often seem to exhibit
patterns of anomalous diffusion in which
⟨𝑟2(𝑡)⟩ ∝ 𝑡𝛼 , (4)
where <1. It is further anticipated that weak-ergodicity breaking may also accompany these
processes. Most importantly, Eq. (4) has been found to hold also in artificial polymeric mixtures,
mimicking overcrowded environments in bio-systems. In particular, anomalous diffusion of different
tracer molecules in aqueous solutions of high-molecular-mass dextran acting as a crowding agent as
studied using fluorescence correlation spectroscopy (FCS) operating with very small molecular
ensembles has been reported [49, 50]. The dependencies of the anomaly exponent on different
parameters, such as molecular mass of probe and matrix molecules have been reported. This allows
for comparative studies of similarly prepared model samples using different techniques, which may shed
further light into microscopic mechanisms leading to anomalous diffusion.
Figure 7: (a) Spin-echo diffusion attenuations measured using PFG NMR for aqueous solution of dextran mixture. Different symbols refer to different diffusion times shown in the inset. (b) Mean square displacements as a function
of diffusion time 𝑡 obtained from the data of Figure 2a. The solid line is a function 𝐾𝑡0.8 showing the slope resulting
from FCS studies of a similar system.
Among different model systems exhibiting anomalous diffusion reported in Refs. [49, 50], we have
chosen a mixture of 40 kDa and 500 kDa dextranes dissolved in deuterated water (the water mass
fraction of about 20 %). This choice was dictated by the fact that this particular system yielded the most
optimal conditions for the diffusion measurements using PFG NMR in a broad range of the diffusion
times from 30 ms to 800 ms. This primarily concerned (i) the diffusivities accessible by this technique

© 2015, T. Albers et al. 14 diffusion-fundamentals.org 23 (2015) 3, pp 1–25
(above 10-14 m2/s) and (ii) the sufficiently long nuclear magnetic relaxation times allowing the PFG NMR
experiments to be performed, but still keeping the anomaly exponent notably below 1. Thus, for the
particular system studied it was expected to be about 0.8.
In systems with normal diffusion the NMR spin-echo signal diffusion attenuation has the simple form
𝑆(𝑞, 𝑡) ∝ exp(−𝑞2𝑡𝐷0), (5)
where 𝑞 is the wave number and 𝑡 is the diffusion time. The measured diffusion attenuations 𝑆, which
are shown in Figure 7a, exhibited no dependency on the diffusion time 𝑡, i.e. collapsed into one master
curve by plotting ln(𝑆) versus 𝑞2𝑡. Note that this way of plotting corresponds to a rescaling of the
squared displacements by the time lag, as it is done in the definition of the distribution of diffusivities
(Section 3). This fact reveals that the diffusivities are constant over intervals of the diffusion times 𝑡 from
30 ms to 800 ms. In turn, this means that the MSD grows linearly with time as shown in Figure 7b. For
comparison, the solid line in Figure 7b also shows the prediction for a similar system obtained using
FCS which covers, however, notably shorter diffusion times. The gap existing between the diffusion data
obtained using two techniques does not allow making definitive conclusions whether the discrepancy is
due to a transient behavior at short time scales or whether there is a fundamental issue resulting in the
discrepancy.
2.2.3 Propagation of solid-liquid interfaces in disordered nanopores
The third class of the systems studies concerned those in which the time scales of the microscopic
processes notably exceeded the laboratory time scale. Such situations can experimentally be realized
and studied by following phase transitions occurring in nanoporous materials. Because these transitions
are intrinsically activated processes, i.e. they require overcoming of the barriers in the free energy, and
exploiting the fact that, under the conditions of spatial confinements in nanoporous solids, these energy-
barriers becomes pore-size-dependent, mesoscopic disorder of the pore structure may give rise to a
broad distribution of the barrier heights. Consequently, this disorder is translated into the respective
disorder in the spatial phase transition rates [51, 52]. Under suitable conditions, translational dynamics
of the interface between the two phases can be probed.
As nanoporous material, we used silicon wafers in which macroscopically long channels possessing
mesoscopic variation of the channel diameter were etched electrochemically [53]. In our work we have
studied kinetics of the freezing transition of the fluids confined to the thus obtained nanochannels. By
choosing a suitable liquid, for which homogeneous nucleation of the crystals phase was strongly
suppressed, transition was forced to occur solely via invasion of the crystalline phase from the pore
openings, where the seed of the crystal were provided. By carefully tuning the experimental
temperature, which determines the gradient in the chemical potential between the intra-pore and outer-
pore fluids, the freezing transition was adjusted to occur by extremely slow propagation of the invading
crystal front or of the fluid-crystal interface.
The typical MSD of the ice freezing fronts’ positions propagating into nanochannels measured using
NMR cryoporometry [41, 54], is shown in Figure 8a. Notably, the results obtained represent an average
over more than 106 channels with different statistical disorder realizations. It is important to note that the

© 2015, T. Albers et al. 15 diffusion-fundamentals.org 23 (2015) 3, pp 1–25
results obtained reveal the occurrence of aging, i.e. the kinetics measured immediately after the
temperature quench depended on how long the system was kept (aged) at a higher temperature. Our
intention was to access the interface dynamics on a single channel level, which however had turned to
be a difficult experimental task. We have therefore followed an alternative route by developing a
microscopic (theoretical) model being capable to capture the most important experimental observations
reported in the literature concerning freezing and melting transitions in confined spaces without any a
priori assumptions inherent to theoretical models developed so far. The model developed [43] for the
freezing and melting transitions occurring in pore spaces with arbitrary pore geometries was based on
the Kossel-Stranski crystal-growth model [55]. It is reminiscent of the random field Ising model and can
most efficiently be analyzed using Dynamic Monte Carlo (GCMC) simulations. Dynamics of other
transitions, e.g. of liquid-gas, can as well be analyzed [56].
Figure 8: (a) Propagation of the freezing front for water into mesoporous silicon with 5 nm average pore diameter after the temperature quench to −35 °C from −34 °C. At −34 °C the system was kept 100 s (circles) and 3600 s
(squares). The solid and broken lines show the ensemble- and moving time averaged MSD obtained in computer simulations, respectively. (b) Average mean square ice-front position in disordered channels at the pore equilibrium temperature exhibiting Sinai diffusion behavior.
In addition to the experimentally measured freezing kinetics Figure 8a shows the ensemble-
averaged MSD for the interface positions obtained using the model developed. They were calculated
using Dynamic Monte Carlo simulations modelling the transition kinetics in the channel-like pores with
disorder and are found to reproduce qualitatively the experimental ones. In addition to the ensemble-
averaged ⟨𝑥2(𝑡)⟩ensemble also the similar quantity ⟨𝑥2(𝑡)⟩timeobtained using moving time average of
the transition progress in a single channel is shown. The notable discrepancy between ⟨𝑥2(𝑡)⟩ensemble
and ⟨𝑥2(𝑡)⟩timesignals formally about the ergodicity breaking. This becomes especially clear when the
quench temperature is chosen to remove the bias in the chemical potential. In this case, as
demonstrated by Figure 8b, the Sinai diffusion regime emerges. For this regime the occurrence of the
weak-ergodicity breaking is known [57].
In this work we have addressed correlation between the diffusion data obtained using two different
experimental approaches based on single molecule and ensemble observations. By first selecting a
system exhibiting normal diffusive behavior, we experimentally prove the ergodic theorem for diffusion
by directly comparing the results obtained for the mean square displacements measured using NMR
(ensemble average over about 1018 molecules) and single particle tracking (moving time average of a
single molecule trajectory) [38]. As the next step, we considered diffusion of large, several nanometer
big polymer globules diffusing in a medium containing larger polymer species [40]. The latter, which
b)

© 2015, T. Albers et al. 16 diffusion-fundamentals.org 23 (2015) 3, pp 1–25
mimics crowded environments in biological cells, has been shown to give rise to anomalous sub-
diffusion as observed using fluorescence correlation spectroscopy. Our studies performed using pulsed
field gradient NMR revealed no anomaly, but on larger time scales. As a challenging future task,
eliminating the still existing lag between the two techniques may provide further insight into microscopic
dynamics. Finally, using NMR cryoporometry method we addressed spatial propagation of solid-liquid
interfaces in disordered nanoporous channels [43, 52]. It was found that this dynamics is reminiscent of
translational dynamics with disordered transition rates. A microscopic model of the phenomenon has
been developed. The transition dynamics assessed using this model has proven that propagation of the
solid-liquid interfaces in disordered pores exhibits non-ergodic behavior consistent with aging observed
in the experiments.
3 Analyzing heterogeneous, anisotropic, and anomalous diffusion processes by the
distribution of diffusivities
3.1 Introduction
Experimental or numerical data from diffusion processes are typically evaluated in terms of the mean-
squared displacement (MSD). However, for heterogeneous and anisotropic systems, which are
characterized by more than one diffusion coefficient, as well as for anomalous diffusion, where different
physical mechanism can lead to the same temporal behavior of the MSD, a more advanced analysis is
needed. For this purpose, the distribution of diffusivities is well suited. We give an overview of its basic
properties and discuss its benefits.
Investigations of heterogeneous diffusion processes, where the diffusion coefficient changes with
time revealed that well-established methods such as mean-squared displacement (MSD) analysis
conceal the effects of inhomogeneous processes [58]. Hence, a new analysis tool has been suggested
which was applied successfully to heterogeneous processes observed with SPT [22]. Furthermore, its
relation to the signal attenuation of ensemble-based techniques such as pulsed-field gradient nuclear
magnetic resonance was shown [22].
The displacements of diffusive motion are a fluctuating quantity along a trajectory. However, due to
averaging for the MSDs only a mean value is analyzed and the characteristic fluctuations are lost. In
order to avoid this disadvantage, we introduced the distribution of diffusivities as a powerful tool for
analyzing trajectories of complex diffusion processes [58]. It considers the fluctuating diffusivities along
a trajectory, which are displacements rescaled by their corresponding time lag, in an intuitive way.
The definition of the distribution of diffusivities is briefly recalled as
𝑝(𝐷, 𝜏) = ⟨𝛿[𝐷 − 𝐷𝑡(𝜏)]⟩, (6)
where ⟨… ⟩ either denotes an ensemble average or a time average ⟨… ⟩ = lim𝑇→∞
1 𝑇⁄ ∫ ⋯d𝑡𝑇
0, which is
typically applied for SPT experiments. The diffusivities 𝐷𝑡(𝜏) are calculated from the displacements
𝐫𝑡(𝜏) = 𝐱(𝑡 + 𝜏) − 𝐱(𝑡) during a given time lag 𝜏 between two snapshots of the 𝑑-dimensional trajectory

© 2015, T. Albers et al. 17 diffusion-fundamentals.org 23 (2015) 3, pp 1–25
by
𝐷𝑡(𝜏) =[𝐱(𝑡 + 𝜏) − 𝐱(𝑡)]2
2𝑑𝜏. (7)
These definitions can easily be applied to experimental data from trajectories obtained from the video
microscope. The corresponding displacements are transformed to diffusivities, which are binned into a
normalized histogram to estimate their probability density function. Note that for statistical reasons the
cumulative distributions of diffusivities were considered in the experimental sections, Sections 2 and 3,
which are just integrals of the density defined in Eq. (6). I.e. C(D)𝜏 used in Eqs. (1) and (2), is given by
C(D)𝜏 = ∫ 𝑝(𝐷′, 𝜏)𝑑𝐷′∞
𝐷, and the distribution used in Section 1.3.3 is given by 1 − C(D)𝜏. Differentiating
these cumulative distributions gives the density treated here.
Important quantities are the moments 𝑀𝑚(𝜏) of order 𝑚
𝑀𝑚(𝜏) = ⟨𝐷𝑡(𝜏)𝑚⟩ = ∫ d𝐷𝐷𝑚𝑝(𝐷, 𝜏)
∞
0
. (8)
Their 𝜏-dependence can reveal characteristic properties of the underlying process such as time scales
on which the diffusion coefficient changes. In the limit 𝜏 → ∞ for normal diffusion the first moment
coincides with the mean diffusion coefficient ⟨𝐷⟩ which determines the slope of the MSD ⟨𝐫(𝜏)2⟩ ∝
2𝑑⟨𝐷⟩𝜏 [17].
For 𝑑-dimensional isotropic homogeneous diffusion processes, which are governed by one single
diffusion coefficient 𝐷𝑐, the distribution of diffusivities yields
𝑝(𝐷, 𝜏) = 𝑝𝐷𝑐(𝐷) = (𝑑
2𝐷𝑐)𝑑 2⁄ 𝐷𝑑 2⁄ −1
Γ(𝑑 2⁄ )exp (−
𝑑
2𝐷𝑐𝐷), (9)
where Γ(x) denotes the gamma function. Equation (9) directly results from the sum of the squares of 𝑑
independent and identically distributed Gaussian random variables with zero mean and variance 𝐷𝑐 𝑑⁄ .
Hence, it is known as the 𝜒2-distribution of 𝑑 degrees of freedom.
Based on these definitions and elementary results more complex processes such as anisotropic
diffusion, processes with extended state space, heterogeneous, or anomalous diffusion can be
investigated.
3.2 Results and discussion
3.2.1 Anisotropic processes
Anisotropic diffusion processes have been found in many applications comprising transport in
anisotropic media [21, 31, 59]. Instead of a characterization by one single diffusion coefficient, the
transport properties depend on the direction of the motion. Hence, advanced data analysis has to be
applied to determine the characteristic quantities of the process which are concealed by methods such
as MSD. Quite formally these processes are described by a propagator involving a diffusion tensor �̂�
with eigenvalues corresponding to the diffusion coefficients 𝐷1, 𝐷2, … , 𝐷𝑑 along the principal axes of the
𝑑-dimensional system [60]. This propagator can be transformed to the distribution of diffusivities [67].

© 2015, T. Albers et al. 18 diffusion-fundamentals.org 23 (2015) 3, pp 1–25
The asymptotic behavior of the distribution of diffusivities can be exploited to identify the anisotropy
of homogeneous diffusion processes. An asymptotic expansion for large 𝐷 yields the leading behavior
of the distribution of diffusivities in the logarithmic representation given by
log 𝑝�̂�(𝐷) ~𝐷→∞
−𝑑
2𝐷∞𝐷, (10)
where 𝐷∞ = max(𝐷1, 𝐷2, … , 𝐷𝑑). Hence, Eq. (10) denotes an exponential decay proportional to the
largest diffusion coefficient which contributes to the anisotropic system.
For homogeneous isotropic systems the exponential decay in Eq. (10) is governed by the isotropic
diffusion coefficient 𝐷∞ = 𝐷𝑐. The first moment ⟨𝐷⟩ of the distribution of diffusivities coincides with 𝐷𝑐
whereas for anisotropic systems ⟨𝐷⟩ < 𝐷∞. Due to this difference the distribution of diffusivities deviates
from the 𝜒2-distribution given by Eq. (9). Hence, it is natural to define the quantitative measure
𝜂 =𝐷∞⟨𝐷⟩
− 1 (11)
for characterizing the deviation from the isotropic homogeneous case. A discrepancy between ⟨𝐷⟩ and
𝐷∞ detects the existence of several distinct diffusion coefficients contributing to the process. Given the
assumption of a homogeneous process, heterogeneities are ruled out such that the discrepancy can
only be caused by an anisotropy in the system. Hence, 𝜂 quantifies the anisotropy of the homogeneous
process. For isotropic systems ⟨𝐷⟩ and 𝐷∞ coincide and result in a vanishing 𝜂. In contrast, the largest
possible anisotropy of a 𝑑-dimensional system will be reached if one diffusion coefficient, denoted by
𝐷∞ as defined in Eq. (10), is much larger than the others. This yields 𝜂 = 𝑑 − 1 since the first moment
is dominated by 𝐷∞ and ⟨𝐷⟩ → 𝐷∞ 𝑑⁄ . It should be noted that the maximum of 𝜂 depends on the
dimensionality 𝑑 of the system.
The advantage of the measure of anisotropy as defined in Eq. (11) is obvious since it is easy to
obtain the two necessary quantities from experimental data. By averaging the observed diffusivities the
first moment of the distribution of diffusivities is determined, which corresponds to the mean diffusion
coefficient ⟨𝐷⟩. The largest diffusion coefficient of the system is obtained from a fit to 𝑓(𝐷) =
𝑐 exp(−𝜆fit𝐷) to determine 𝐷∞ = 𝑑 (2𝜆fit)⁄ . The effective dimensionality 𝑑eff of processes observed in
𝑑 ≥ 𝑑eff dimensions is estimated by 𝑑eff = 2⟨𝐷⟩𝜆fit resulting in 𝜂 = 𝑑 𝑑eff⁄ − 1. Hence, a process
observed in 𝑑 dimensions will yield the largest 𝜂 = 𝑑 − 1 if the motion is effectively one-dimensional.
Since in general the distribution of diffusivities cannot be calculated analytically, some explicit
examples are given. For instance, for two-dimensional anisotropic diffusion it is given by
𝑝�̂�(𝐷) =exp [−
12 (
1𝐷1
+1𝐷2)𝐷]
√𝐷1𝐷2
𝐼0 [1
2(1
𝐷1−
1
𝐷2)𝐷], (12)
where 𝐼0(𝑥) denotes the modified Bessel function of the first kind. The moments of the distribution of
diffusivities can be calculated analytically as functions of 𝐷1and 𝐷2. In contrast, the evaluation of
experimental data aims at obtaining the diffusion tensor from the distribution of diffusivities. By solving
their simultaneous equations, the diffusion coefficients corresponding to the main directions of the

© 2015, T. Albers et al. 19 diffusion-fundamentals.org 23 (2015) 3, pp 1–25
anisotropic system are related to the moments by 𝐷1,2 = 𝑀1 ±√𝑀2 − 2𝑀12. The measure to
characterize the anisotropy of the two-dimensional anisotropic process is directly related to the moments
by
𝜂 =|𝐷1 − 𝐷2|
𝐷1 + 𝐷2=√𝑀2 − 2𝑀1
2
𝑀1 (13)
which again vanishes for isotropic processes.
For three-dimensional processes a limiting case is given by a diffusion tensor �̌� where two
eigenvalues coincide. This corresponds to systems where the mobility of a particle in one direction
differs from the other two. Hence, such an anisotropy can be induced by the shape of the diffusing
particle and is typical for uniaxial molecules. The distribution of diffusivities for three-dimensional
homogeneous anisotropic diffusion is reduced to
𝑝�̌�(𝐷) =3
2
exp(−3𝐷2𝐷II)erf (√
32 (
1𝐷I −
1𝐷II)𝐷)
√(𝐷II − 𝐷I)𝐷II
(14)
with the eigenvalues of �̌� denoted by 𝐷I and the two-fold degenerate one by 𝐷II. Hence, the particle is
disc-shaped for 𝐷I < 𝐷II in contrast to a rod-like shape with 𝐷I > 𝐷II which is typical for elongated
molecules. The difference between these cases is depicted in Figure 9.
Figure 9: Distributions of diffusivities of homogeneous anisotropic diffusion processes in three dimensions. For uniaxial molecules the distribution is given by Eq. (14), where the curvature after the peak changes from concave
for disc-shaped molecules (blue squares; 𝐷I = 1, 𝐷II = 5) to convex in the rod-like shapes (violet pentagons; 𝐷I =5,𝐷II = 1). A further general anisotropic process (green circles; 𝐷1 = 5, 𝐷2 = 3, 𝐷3 = 1) obviously shows a
qualitative deviation from the isotropic process with the same asymptotic decay (black triangles; 𝐷𝑐 = 5) which is
always concave. The inset depicts the identical asymptotic decays of all processes.
The moments 𝑀1 and 𝑀2 of Eq. (14) are obtained from Eq. (8). These equations can be solved to
obtain the eigenvalues of �̌� by 𝐷I = 𝑀1 ∓√3𝑀2 − 5𝑀12 and 𝐷II = 𝑀1 ±
1
2√3𝑀2 − 5𝑀1
2, where the sign
has to be chosen to satisfy the constraint of positive diffusion coefficients. For 5
3𝑀1
2 < 𝑀2 < 2𝑀12 both
variants of the signs result in positive diffusion coefficients. Then the third moment 𝑀3has to be
calculated from each pair of 𝐷I and 𝐷II and coincides with the values determined from the data if the
correct pair is chosen. Hence, different diffusion coefficients can yield distributions of diffusivities with

© 2015, T. Albers et al. 20 diffusion-fundamentals.org 23 (2015) 3, pp 1–25
identical first and second moments respectively. For vanishing anisotropy, 𝑀2 →5
3𝑀1
2 and 𝐷I and 𝐷II
approach each other. Hence the single isotropic diffusion coefficient is directly given by the first moment.
Close to that limit a decision of the correct pair by 𝑀3 cannot be obtained since both values do not differ
significantly.
3.2.2 Processes with extended state space
Evaluating many particles simultaneously can be interpreted as the analysis of a process in an extended
state space. As an example, current research addresses the tracking of the motion of elongated
molecules, such as deoxyribonucleic acid (DNA), which is labeled with fluorescent dyes at both ends
[62]. By combining the positions of both dyes into one state vector a process with extended state space
is observed effectively. In this example the contributing positions are highly correlated and do not diffuse
independently. The resulting process from simultaneous observation comprises 𝑑-dimensional
trajectories of 𝑁 particles. The corresponding state vector 𝐱(𝑡) of the extended state space with effective
dimensionality 𝑑eff = 𝑁𝑑 of such a process can be interpreted as an 𝑑eff-dimensional trajectory. It
should be noted that the considerations are independent of the actual structure of the extended state
space, i.e., even processes of different dimensionality can contribute. The diffusivities of such processes
are determined according to Eq. (7) where the dimensionality 𝑑 is substituted by the effective one, 𝑑eff.
In the simplest case, many particles diffuse simultaneously and independently. Trajectories in the
extended state space of non-interacting particles are closely related to anisotropic processes. In
general, each of the 𝑁 independent trajectories is characterized by a different diffusion coefficient,
because they may belong to different species. This leads to different diffusive properties in the various
directions of the state space. Hence, the distribution of diffusivities can be obtained analogously to
anisotropic processes [61], e.g., from the convolution of the contributing processes by 𝑝(𝐷, 𝜏) =
{𝑝1 ∗ ⋯∗ 𝑝𝑁}(𝐷, 𝜏). As an example, consider the simultaneous tracking of two non-interacting two-
dimensional isotropic processes with different diffusion constants 𝐷1 and 𝐷2, respectively, which may
stem from the particles diffusing in regions with distinct transport properties, or, from different
conformations of a molecule. Such a process is characterized by a diffusion tensor with two two-fold
degenerate eigenvalues given by 𝐷1 and 𝐷2. The convolution of the two contributing distributions of
diffusivities, which are given by Eq. (9) with 𝑑 = 2 and 𝐷𝑐 = 𝐷1 2⁄ or 𝐷𝑐 = 𝐷2 2⁄ , respectively, yields
𝑝(𝐷) = 2exp(−
2𝐷𝐷1
) − exp(−2𝐷𝐷2
)
𝐷1 − 𝐷2. (15)
Since the asymptotic exponential decay defined in Eq. (10), is determined by the larger diffusion
coefficient, 𝐷∞ = max(𝐷1, 𝐷2) > ⟨𝐷⟩ = (𝐷1 + 𝐷2)/2 holds. Hence, the anisotropy measure Eq. (11)
does not vanish and clearly indicates an anisotropic process. Of course, in the limit 𝐷1 → 𝐷2 the 4-
dimensional isotropic process with the distribution of diffusivities given by the 𝜒42-distribution of Eq. (9)
is recovered.
© 2015, T. Albers et al. 21 diffusion-fundamentals.org 23 (2015) 3, pp 1–25
3.2.3 Heterogeneous processes
The examples we have presented so far, resulted in a distribution of diffusivities 𝑝(𝐷, 𝜏), which turned
out to be independent of𝜏, i.e. 𝑝(𝐷, 𝜏) = 𝑝(𝐷). This is a consequence of the homogeneity and the
presence of only one simple scaling law in the previous examples. But for instance, in the example of
diffusion of a pair of particles, it is easy to show that the presence of e.g. harmonic interactions already
leads to a non-trivial 𝜏-dependence of 𝑝(𝐷, 𝜏), which vanishes only in the limit 𝜏 → ∞. An analytically
solvable example of such a non-trivial 𝜏-dependence of 𝑝(𝐷, 𝜏) was worked out for a two layer (region)
model in [22]. In this example, which is popular in the NMR and SPT community, one could see that
𝑝(𝐷, 𝜏) changes from a bi-exponential form for small 𝜏 to a mono-exponential form for 𝜏 → ∞. In the
intermediate 𝜏-regime fitting multi-exponential behavior is bound to be inaccurate. This example is a
simplification of the heterogeneous model introduced in the first experimental part of this contribution,
where also a non-trivial 𝜏-dependence of 𝑝(𝐷, 𝜏) is present. The latter provides the information
necessary for distinguishing the models leading to the same behavior in the mean square displacement.
As an example we mention the form for the van Hove self-diffusion function proposed for heterogeneous
systems in [63], which consists of a weighted superposition of Gaussian propagators. In terms of our
distribution of diffusivities, Eq. (6), this would result in a superposition of infinitely many, basically
exponential contributions of the form given in Eq. (9). With such a superposition almost arbitrarily
decaying distributions can be described. Note, however, that the resulting distribution of diffusivities
would be again independent of the time lag, 𝑝(𝐷, 𝜏) = 𝑝(𝐷), which neglects that the different diffusive
properties typically dominate also on different time scales. An example for the latter for the case of
anomalous diffusion is provided below.
3.2.4 Anomalous diffusion processes
Diffusion processes in nature often deviate from the mathematical laws of normal diffusion and behave
anomalously, a fact which is often reflected in an asymptotically non-linear increase of the mean-
squared displacement ⟨𝒓2(𝜏)⟩~𝐷𝛼𝜏𝛼. In the literature, many theoretical models of anomalous diffusion
which can lead to the same diffusion exponent 𝛼 are known [64]. Therefore, the mean-squared
displacement is not suitable to discriminate between these models. In this context, an analysis by the
distribution of diffusivities provides a significant advantage. To incorporate the non-linear increase of
the MSD, the definition of the diffusivities needs to be modified,
𝐷𝑡𝛽(𝜏) =
[𝒙(𝑡 + 𝜏) − 𝒙(𝑡)]2
𝜏𝛽 (16)
and we now call them generalized diffusivities. The distribution of generalized diffusivities is defined as
𝑝𝛽(𝐷, 𝜏) = ⟨𝛿 [𝐷 − 𝐷𝑡𝛽(𝜏)]⟩ , (17)
where ⟨… ⟩ again denotes an ensemble average or a time average. If the scaling exponent 𝛽 is chosen
to be equal to the diffusion exponent 𝛼, the mean value of the distribution of generalized diffusivities
asymptotically corresponds to the generalized diffusion coefficient 𝐷𝛼 [65].
© 2015, T. Albers et al. 22 diffusion-fundamentals.org 23 (2015) 3, pp 1–25
Anomalous diffusion processes often show weak ergodicity breaking, which means that the
ensemble-averaged MSD and the time-averaged MSD do not coincide and the latter becomes a random
variable, which varies from one trajectory to another, despite the fact that the corresponding state or
phase space of the considered system is not divided into mutually inaccessible regions. The reason for
the non-ergodic behavior is a diverging characteristic time scale of the process which means that the
measurement time can never be long enough to reach this diverging time scale of the system [65]. The
probably most investigated example for such a weakly non-ergodic, anomalous diffusion process is the
subdiffusive continuous time random walk (CTRW) [18, 66]. For this CTRW, the distributions of
generalized diffusivities which are obtained from ensemble and time averages, respectively, strongly
differ. However, analytical formulas for the distributions and their explicit 𝜏-dependence are known [65]
and can be used to identify this process in experiments.
The distribution of diffusivities is a new, promising tool for analyzing data from heterogeneous,
anisotropic, and anomalous diffusion processes. It characterizes the diffusivity fluctuations along a
trajectory or in an ensemble. For instance, it provides simple means for identifying and characterizing
anisotropies in the system. An explicit 𝜏-dependence indicates the presence of a complex underlying
process, and its analysis characterizes the latter. Its determination is easily accomplished from
experimental data.
4 Conclusions
We have investigated experimentally and theoretically the influence of spatially heterogeneous
environments and of anisotropies on the diffusive behavior of particles, as well as the question of
ergodicity and weak ergodicity breaking, respectively. These questions were addressed via single
particle tracking and NMR experiments, which measure time and ensemble averages, respectively. In
this way the question of (weak) ergodicity breaking could be addressed. As a tool for the evaluation of
these experimental data the concept of the distribution of diffusivities was applied and its properties
were elucidated analytically for various model scenarios relevant in this context.
Acknowledgements
The research reported here has been supported by the Deutsche Forschungsgemeinschaft within
project P4 “Driven diffusion in nanoscaled materials” of the Saxon Research Group FOR 877 “From
Local Constraints to Macroscopic Transport”.
References
[1] L. Venema: Silicon electronics and beyond. Nature 479, 309 (2011)
[2] P. Shemella, S.K. Nayak: Electronic structure and band-gap modulation of graphene via substrate surface chemistry. App. Phys. Lett. 94, 032101 (2009)
[3] F. Lüttich, D. Lehmann, M. Friedrich, Z. Chen, A. Facchetti, C. von Borczyskowski, D.R.T. Zahn, H. Graaf: Interface properties of OFETs based on an air-stable n-channel perylene tetracarboxylic diimide semiconductor. phys. stat. sol. A 209, 585–593 (2012)
[4] L.T. Zhuravlev: The surface chemistry of amorphous silica. Zhuravlev model. Colloids and Surfaces A 173, 1–38 (2000)
[5] V. Dugas, Y. Chevalier: Surface hydroxylation and silane grafting on fumed and thermal silica. J. Coll. Interf. Science 264, 354–361 (2000)

© 2015, T. Albers et al. 23 diffusion-fundamentals.org 23 (2015) 3, pp 1–25
[6] T. Baumgärtel, H. Graaf: Local anodic oxidation nanolithography on silicon: Chemical routes to functional nanostructures. In Lithography: Principles, processes and materials, ed. T.C. Hennessy, 175–193, Nova Science Publishers (2011)
[7] C. Belgardt, H. Graaf, T. Baumgärtel, C. von Borczyskowski: Self-assembled monolayers on silicon oxide. phys. stat. sol. C 7, 227–230 (2010)
[8] R.K. Iler: The surface chemistry of silica. In The chemistry of silica, Wiley (1979)
[9] J. Schuster, F. Cichos, J. Wrachtrup, C. von Borczyskowski: Diffusion of single molecules close to interfaces. Single Molecules 1, 299–305 (2000)
[10] J.B. Fleury, O. Claussen, S. Herminghaus, M. Brinkmann, R. Seemann: Mechanical stability of ordered droplet packings in microfluidic channels. Appl. Phys. Lett. 99, 244104 (2010)
[11] R. Wüthrich, E.A. Baranova, H. Bleuler, C. Comninellis: A phenomenological model for macroscopic deactivation of surface processes. Electrochemistry Communications 6, 1199–1205 (2004)
[12] J. Schuster, F. Cichos, C. von Borczyskowski: Anisotropic diffusion of single molecules in thin liquid films. Europ. Phys. J. E: Soft Matter and Biological Physics 12, 75–80 (2003)
[13] M.L. Forcada, C.M. Mate: Molecular layering during evaporation of ultrathin liquid films. Nature 363, 527–529 (1993)
[14] C.J. Yu, A.G. Richter, J. Kmetko, A. Datta, P. Dutta: X-ray diffraction evidence of ordering in a normal liquid near the solid-liquid interface. Europhys. Lett. 50, 487–493 (2000)
[15] D. Täuber: Characterization of heterogeneous diffusion in confined soft matter. PhD Thesis, TU Chemnitz (2011)
[16] M.J. Saxton: Single particle tracking: The distribution of diffusion coefficients. Biophys. J. 72, 1744–1753 (1997)
[17] H. Qian, M.P. Sheetz, E.L. Elson: Single particle tracking. Analysis of diffusion and flow in two-dimensional systems. Biophys. J. 60, 910–921 (1991)
[18] A. Lubelski, I.M. Sokolov, J. Klafter: Nonergodicity mimics inhomogneity in single particle tracking. Phys. Rev. Lett. 100, 250602 (2008)
[19] J. Schuster, J. Brabandt, C. von Borczyskowski: Discrimination of photoblinking and photobleaching on the single molecule level. J. of Luminesc. 127, 224–229 (2007)
[20] C. Hellriegel, J. Kirstein, C. Bräuchle, V. Latour, T. Pigot, R. Olivier, S. Lacombe, R. Brown, V.Guieu, C. Payraste, A. Izquiredo, P. Mocho: Diffusion of single streptocyanine molecules in the nanoporous network of sol-gel glasses. J. Phys. Chem. B 108, 14699–14709 (2004)
[21] B. Schulz, D. Täuber, F. Friedriszik, H. Graaf, J. Schuster, C. von Borczyskowski: Optical detection of heterogeneous single molecule diffusion in thin liquid crystal films. Phys. Chem. Chem. Phys. 12, 11555–11564 (2010)
[22] M. Bauer, R. Valiullin, G. Radons, J. Kärger: How to compare diffusion processes assessed by single-particle tracking and pulsed field gradient nuclear magnetic resonance. J. Chem. Phys. 135, 144118 (2011)
[23] S. Krause, P.F. Aramendía, D. Täuber, C. von Borczyskowski: Freezing single molecule dynamics on interfaces and in polymers. Phys. Chem. Chem. Phys. 13, 1754–1761 (2011)
[24] I. Horcas, R. Fernandez, J.M. Gomez-Rodriguez, J. Colchero, J. Gomez-Herrero, A.M. Baro: WSXM: A software for scanning probe microscopy and a tool for nanotechnology. Rev. Sci. Instr. 78, 013705 (2007)
[25] S. Schubert: Untersuchung der Diffusion und der Anbindung von Farbstoffen an nano-strukturierten Grenzflächen. Diploma Thesis, TU Chemnitz (2010)
[26] M. Heidernätsch: Development of a computer program for simulation and analysis of particle movement in thin liquid films. Master Thesis, TU Chemnitz (2009)
[27] A. Honciuc, A.W. Harant, D.K. Schwartz: Single molecule observations of surfactant diffusion at the solution-solid interface. Langmuir 24, 6562–6566 (2008)
[28] S. Krause, M. Hartmann, I. Kahle, M. Neuman, M. Heidernätsch, S. Spange, C. von Borczyskowski: Optical tracking of single Ag clusters in nanostructured water films. J. Phys. Chem. C 117, 24822–24829 (2013)
[29] S. Krause, M. Heidernätsch, M. Hartmann, C. von Borczyskowski: Optical investigation of diffusion of single Ag markers in confined water films. J. Nanopart. Res. 16, 2700 (2014)

© 2015, T. Albers et al. 24 diffusion-fundamentals.org 23 (2015) 3, pp 1–25
[30] D. Täuber, I. Trenkmann, C. von Borczyskowski: Influence of van der Waals interactions on morphology and dynamics in ultrathin liquid films at silicon oxide interfaces. Langmuir 29, 3583–3593 (2013)
[31] B. Schulz, D. Täuber, J. Schuster, T. Baumgärtel, C. von Borczyskowski: Influence of mesoscopic structures on single molecule dynamics in thin smectic liquid crystal films. Soft Matter 7, 7431–7440 (2011)
[32] D. Täuber, K. Radscheit, R. Camacho, I. Scheblykin, C. von Borczyskowski: Guest molecule diffusion and conformation influenced by local liquid crystal structure. diffusion-fundamentals.org 20, 103 (2013)
[33] D. Täuber, C. von Borczyskowski, M. Schulz: Fluorescence correlation spectroscopy in thin films at reflecting substrates as a means to study nanoscale structure and dynamics at soft matter interfaces. submitted to Phys. Rev. E
[34] E. Frey, K. Kroy: Brownian motion: a paradigm of soft matter and biological physics. Annalen der Physik 14, 20–50 (2005)
[35] C. Bräuchle, D.C. Lamb, J. Michaelis: Single particle tracking and single molecule energy transfer. Wiley-VCH, Weinheim (2010)
[36] J. Ries, P. Schwille: Fluorescence correlation spectroscopy. BioEssays 34, 361–368 (2012)
[37] M. Hellmann, J. Klafter, D.W. Heermann, M. Weiss: Challenges in determining anomalous diffusion in crowded fluids. Journal of Physics-Condensed Matter 23, 234113 (2011)
[38] F. Feil, S. Naumov, J. Michaelis, R. Valiullin, D. Enke, J. Kärger, C. Bräuchle: Single-particle and ensemble diffusivities—test of ergodicity. Angewandte Chemie 124, 1178–1181 (2012)
[39] A. Shakhov, J. Kärger, R. Valiullin: Diffusion properties of liquid crystal-based microemulsions. Colloid and Polymer Science 292, 1961–1969 (2014)
[40] A. Shakhov, R. Valiullin, J. Kärger: Tracing molecular propagation in dextran solutions by pulsed field gradient NMR. Journal of Physical Chemistry Letters 3, 1854–1857 (2012)
[41] D. Kondrashova, A. Khokhlov, R. Valiullin, J. Kärger: Propagation of solid-liquid interfaces in disordered linear pores. diffusion-fundamentals.org 11, 60 (2009)
[42] D. Kondrashova, M. Dvoyashkin, R. Valiullin: Structural characterization of porous solids by simultaneously monitoring the low-temperature phase equilibria and diffusion of intrapore fluids using nuclear magnetic resonance. New Journal of Physics 13, 015008 (2011)
[43] D. Kondrashova, R. Valiullin: Freezing and melting transitions under mesoscalic confinement: Application of the Kossel–Stranski crystal-growth model. The Journal of Physical Chemistry C 119, 4312–4323 (2015)
[44] J. Szymanski, M. Weiss: Elucidating the origin of anomalous diffusion in crowded fluids. Phys. Rev. Lett. 103, 038102 (2009)
[45] W.S. Price: NMR studies of translational motion. University Press, Cambridge (2009)
[46] O.V. Petrov, I. Furó: NMR cryoporometry: Principles, applications and potential. Progress in Nuclear Magnetic Resonance Spectroscopy 54, 97–122 (2009)
[47] J.-H. Jeon, V. Tejedor, S. Burov, E. Barkai, C. Selhuber-Unkel, K. Berg-Sørensen, L. Oddershede, R. Metzler: In vivo anomalous diffusion and weak ergodicity breaking of lipid granules. Phys. Rev. Lett. 106, 048103 (2011)
[48] F. Höfling, T. Franosch: Anomalous transport in the crowded world of biological cells. Reports on Progress in Physics 76, 046602 (2013)
[49] M. Weiss, M. Elsner, F. Kartberg, T. Nilsson: Anomalous subdiffusion is a measure for cytoplasmic crowding in living cells. Biophysical Journal 87, 3518–3524 (2004)
[50] D.S. Banks, C. Fradin: Anomalous diffusion of proteins due to molecular crowding. Biophysical Journal 89, 2960–2971 (2005)
[51] J.P. Bouchaud, A. Georges: Anomalous diffusion in disordered media – Statistical mechanisms, models and physical applications. Physics Reports-Review Section of Physics Letters 195, 127–293 (1990)
[52] R. Valiullin: Diffusion in nanoporous host systems. Annual Reports on NMR Spectroscopy 79, 23–72 (2013)
[53] A. Khokhlov, R. Valiullin: Mesoporous silicon. In Handbook of porous silicon, ed. L. Canham, Springer International Publishing, pp. 1–12 (2014)
© 2015, T. Albers et al. 25 diffusion-fundamentals.org 23 (2015) 3, pp 1–25
[54] M. Dvoyashkin, A. Khokhlov, R. Valiullin, J. Kärger: Freezing of fluids in disordered mesopores. The Journal of Chemical Physics 129, 154702–154706 (2008)
[55] K.A. Jackson: Kinetic processes: Crystal growth, diffusion, and phase transitions in materials. Wiley-VCH, Weinheim (2004)
[56] D. Schneider, R. Valiullin, P.A. Monson: Filling dynamics of closed end nanocapillaries. Langmuir 30, 1290–1294 (2014)
[57] G. Aljaž, V.C. Aleksei, B. Eli, K. Holger, M. Ralf: Localisation and universal fluctuations in ultraslow diffusion processes. Journal of Physics A: Mathematical and Theoretical 47, 492002 (2014)
[58] M. Bauer, M. Heidernätsch, D. Täuber, C. von Borczyskowski, G. Radons: Investigations of heterogeneous diffusion based on the probability density of scaled squared displacements observed from single molecules in ultra-thin liquid films. diffusion-fundamentals.org 11, 104 (2009)
[59] D. Täuber, C. von Borczyskowski: Single molecule studies on dynamics in liquid crystals. Int. J. Mol. Sci. 14, 19506–19525 (2013)
[60] H. Risken: The Fokker-Planck equation: Methods of solution and applications. Springer Series in Synergetics 18, Springer, Berlin, second edition (1989)
[61] M. Heidernätsch, M. Bauer, G. Radons: Characterizing N-dimensional anisotropic Brownian motion by the distribution of diffusivities. J. Chem. Phys. 139, 184105 (2013)
[62] J. Guan, B. Wang, S.C. Bae, S. Granick: Modular stitching to image single-molecule DNA transport. J. Am. Chem. Soc. 135, 6006–6009 (2013)
[63] B. Wang, J. Kuo, S.C. Bae, S. Granick: When Brownian diffusion is not Gaussian. Nature Materials 11, 481–485 (2012)
[64] R. Klages, G. Radons, I.M. Sokolov: Anomalous transport: Foundations and applications. Wiley-VCH, Weinheim (2008)
[65] T. Albers, G. Radons: Subdiffusive continuous time random walks and weak ergodicity breaking analyzed with the distribution of generalized diffusivities. EPL 102, 40006 (2013)
[66] G. Bel, E. Barkai: Weak ergodicity breaking in the continuous-time random walk. Phys. Rev. Lett. 94, 240602 (2005)
[67] Y. He, S. Burov, R. Metzler, E. Barkai: Random time-scale invariant diffusion and transport coefficients. Phys. Rev. Lett. 101, 058101 (2008)


![Design of nanoscaled materials based on tetraoxa[8]circulene · 2014-01-10 · 1 Design of nanoscaled materials based on tetraoxa[8]circulene Gleb V. Baryshnikov,*a Boris F. Minaev,a](https://img.dokumen.tips/doc/110x75/5e4d6659f8cc9165d22249f5/design-of-nanoscaled-materials-based-on-tetraoxa8-2014-01-10-1-design-of-nanoscaled.jpg)