Embed Size (px)
Citation preview
Racelogic Ltd Introduction
- 1 -
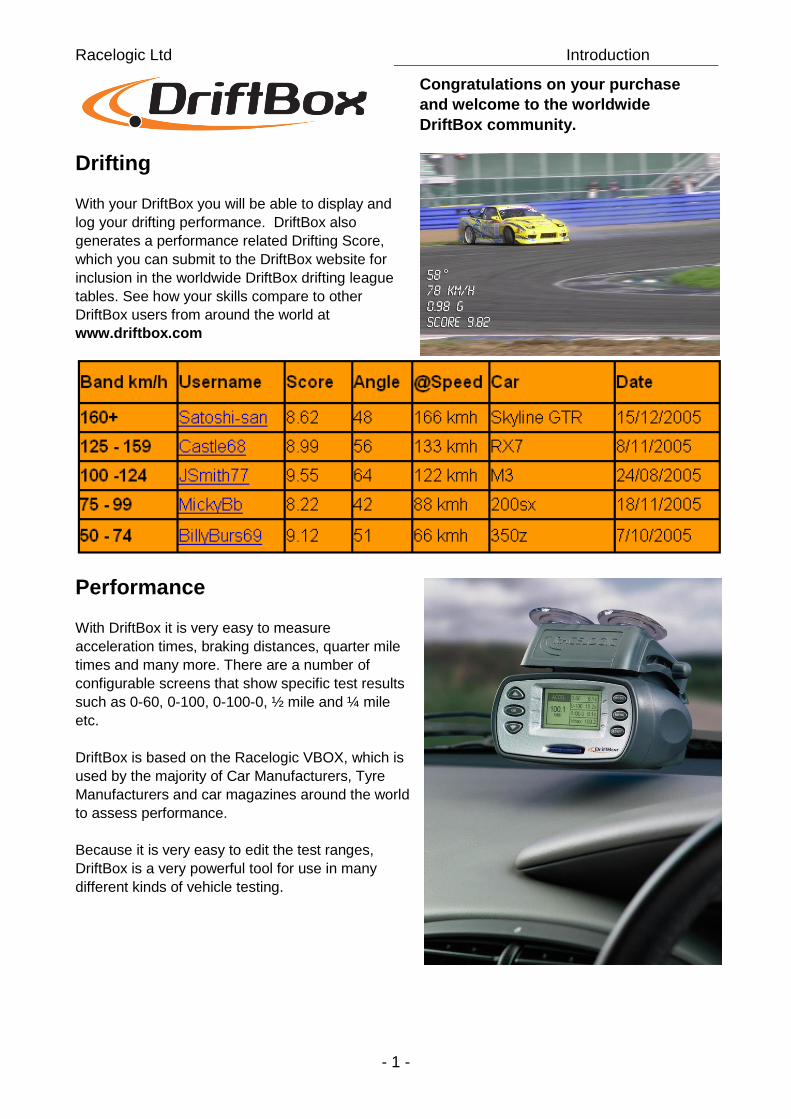
Drifting
With your DriftBox you will be able to display and
log your drifting performance. DriftBox also
generates a performance related Drifting Score,
which you can submit to the DriftBox website for
inclusion in the worldwide DriftBox drifting league
tables. See how your skills compare to other
DriftBox users from around the world at
www.driftbox.com
Performance With DriftBox it is very easy to measure
acceleration times, braking distances, quarter mile
times and many more. There are a number of
configurable screens that show specific test results
such as 0-60, 0-100, 0-100-0, ½ mile and ¼ mile
etc.
DriftBox is based on the Racelogic VBOX, which is
used by the majority of Car Manufacturers, Tyre
Manufacturers and car magazines around the world
to assess performance.
Because it is very easy to edit the test ranges,
DriftBox is a very powerful tool for use in many
different kinds of vehicle testing.
Congratulations on your purchase
and welcome to the worldwide
DriftBox community.
Racelogic Ltd Introduction
- 2 -
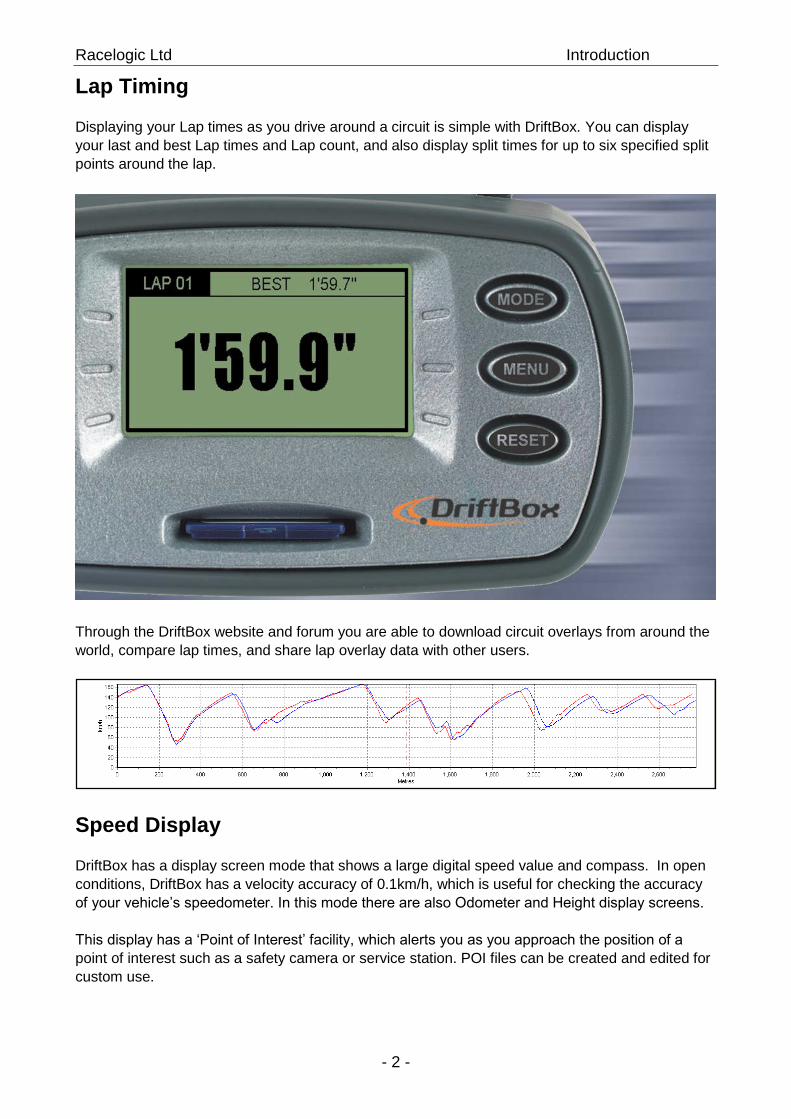
Lap Timing Displaying your Lap times as you drive around a circuit is simple with DriftBox. You can display
your last and best Lap times and Lap count, and also display split times for up to six specified split
points around the lap.
Through the DriftBox website and forum you are able to download circuit overlays from around the
world, compare lap times, and share lap overlay data with other users.
Speed Display DriftBox has a display screen mode that shows a large digital speed value and compass. In open
conditions, DriftBox has a velocity accuracy of 0.1km/h, which is useful for checking the accuracy
of your vehicle’s speedometer. In this mode there are also Odometer and Height display screens.
This display has a ‘Point of Interest’ facility, which alerts you as you approach the position of a
point of interest such as a safety camera or service station. POI files can be created and edited for
custom use.
Racelogic Ltd Introduction
- 3 -
Power Calculations
DriftBox can help you to measure the power developed by your car’s engine, either at the wheels
or flywheel. Having set the vehicle weight, results are calculated from the measurements taken by
the fast GPS engine to give you useful guidelines to the car’s brake horsepower or kilowatt output.
Because these calculations are made from the GPS data rather than accelerometers, your results
are likely to be more consistent and accurate.
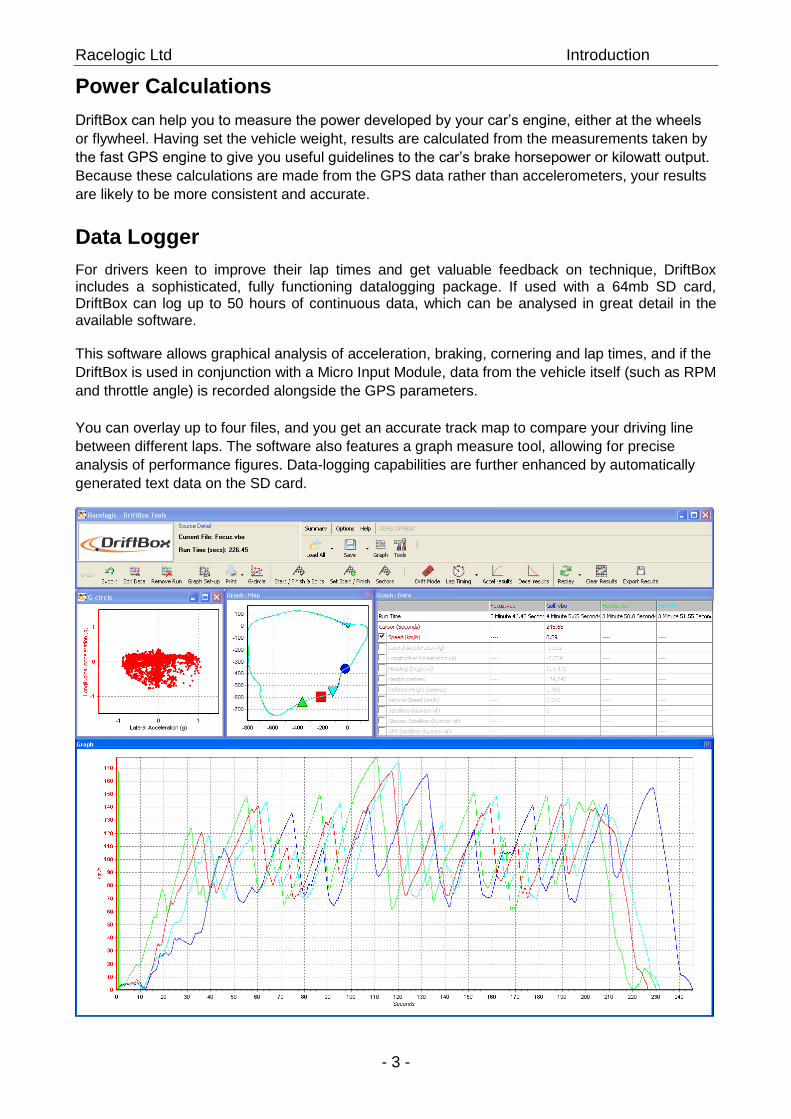
Data Logger
For drivers keen to improve their lap times and get valuable feedback on technique, DriftBox includes a sophisticated, fully functioning datalogging package. If used with a 64mb SD card, DriftBox can log up to 50 hours of continuous data, which can be analysed in great detail in the available software. This software allows graphical analysis of acceleration, braking, cornering and lap times, and if the
DriftBox is used in conjunction with a Micro Input Module, data from the vehicle itself (such as RPM
and throttle angle) is recorded alongside the GPS parameters.
You can overlay up to four files, and you get an accurate track map to compare your driving line
between different laps. The software also features a graph measure tool, allowing for precise
analysis of performance figures. Data-logging capabilities are further enhanced by automatically
generated text data on the SD card.
Racelogic Ltd Contents
- 4 -
Contents
............................................................................................................................................. 1
DRIFTING ............................................................................................................................ 8
DRIFTING TECHNIQUES ........................................................................................................ 8
QUICK START GUIDE ...................................................................................................... 10
CONNECTIONS .................................................................................................................. 10 MOUNTING DRIFTBOX IN YOUR CAR .................................................................................... 10
Aligning Your DriftBox ................................................................................................. 11
REGISTERING YOUR DRIFTBOX AND ACTIVATING ALL AVAILABLE FUNCTIONS. ......................... 11 Registering Your DriftBox ........................................................................................... 11
Activating Your DriftBox additional functions .............................................................. 12
OPTIONAL ACCESSORIES / REPLACEMENT PARTS ............................................................... 12
USING DRIFTBOX ............................................................................................................ 13
DRIFTBOX KEYPAD ........................................................................................................... 13 CHANGING MODES ............................................................................................................ 13 CHANGING THE UNITS OF MEASUREMENT ........................................................................... 14
SATELLITE RECEPTION ...................................................................................................... 14 Searching for satellites at power up ............................................................................ 14
DRIFT MODE .................................................................................................................... 15
PRACTICE ........................................................................................................................ 15 SECTORS ......................................................................................................................... 15
Selecting Sector Mode ................................................................................................ 15
DRIFT MODE DISPLAY SCREENS ........................................................................................ 16 Resetting the screens ................................................................................................. 16 Score Codes ............................................................................................................... 16
SECTORS ......................................................................................................................... 17 Creating Sectors ......................................................................................................... 17 Loading and Saving Sectors ....................................................................................... 18
PERFORMANCE MODE ................................................................................................... 19
MEASURING THE 0-60 TIME OF YOUR VEHICLE ..................................................................... 21
EDITING A PERFORMANCE MODE TEST RANGE .................................................................... 22 1 FOOT ROLLOUT ............................................................................................................. 23
RESULTS FILES ................................................................................................................ 23 SPEED BUZZER ................................................................................................................ 23 EVENT MARKING ............................................................................................................... 23
LAPTIMING MODE ........................................................................................................... 24
MEASURING LAP TIMES ..................................................................................................... 24 Simple Lap Timing ...................................................................................................... 24 Lap Count ................................................................................................................... 25 Lap Timing Including Split Points ................................................................................ 25 Big Speed @ Split display .......................................................................................... 25 Split to Split Time ........................................................................................................ 26
Split Widths ................................................................................................................. 26
Clearing your Best Lap time ....................................................................................... 26
Laptime Telemetry ...................................................................................................... 26 Laptime Pulse ............................................................................................................. 27 Split Output ................................................................................................................. 27
Racelogic Ltd Contents
- 5 -
ONE SHOT MODE ............................................................................................................. 27 START / FINISH AND SPLIT LINES ......................................................................................... 28
Setting start / finish lines ............................................................................................. 28 Saving start / finish and Split Lines ............................................................................. 28 Clearing start / finish and split Lines ........................................................................... 29
RECORDING AND REVIEWING LAP AND SPLIT TIMES ............................................................. 29
SPEED DISPLAY MODE .................................................................................................. 34
POINTS OF INTEREST (POI) ............................................................................................... 34 ODOMETER ...................................................................................................................... 35 ALTIMETER ....................................................................................................................... 35
EVENT MARKING ............................................................................................................... 35
POWER MODE ................................................................................................................. 36
POWER TESTING .............................................................................................................. 36 Setting the Vehicle Weight .......................................................................................... 36 Power Runs ................................................................................................................ 37
CALCULATING LOSSES ...................................................................................................... 37
INPUT MODULE SCREEN ................................................................................................ 39
INPUT MODULE CONNECTION .............................................................................................. 39 INITIALISING THE MICRO INPUT MODULE. ............................................................................. 39
CONFIGURING THE INPUTS AND OUTPUTS ........................................................................... 39
DATA LOGGING ............................................................................................................... 40
USING THE SD CARD ......................................................................................................... 40
FILE TYPES ....................................................................................................................... 40
CONNECTING DRIFTBOX TO EXTERNAL DEVICES ..................................................... 41
DRIFT DATA OUTPUT ......................................................................................................... 41 NMEA DATA OUTPUT ........................................................................................................ 41
SETUP MENU ................................................................................................................... 42
LOGGING MODE ................................................................................................................ 42
ALIGNMENT ...................................................................................................................... 42 CONTRAST & BRIGHTNESS ................................................................................................ 42
DIAGNOSTIC SCREENS ...................................................................................................... 43 GPS Diagnostic Screen .............................................................................................. 43
Yaw-rate Sensor Diagnostic Screen ........................................................................... 43
COLD START .................................................................................................................... 43 Performing a Coldstart ................................................................................................ 44
SPEED BUZZER ................................................................................................................ 44
UPGRADING THE DRIFTBOX FIRMWARE ..................................................................... 46
TROUBLESHOOTING ...................................................................................................... 47
DRIFTBOX TOOLS SOFTWARE ...................................................................................... 49
INSTALLATION ................................................................................................................... 49 DRIFTBOX TOOLS WINDOWS ............................................................................................. 49
Graph Window ............................................................................................................ 50
Graph: Map Window ................................................................................................... 50 Graph: Data Window .................................................................................................. 50
Window Sizes and Positions ....................................................................................... 50
Racelogic Ltd Contents
- 6 -
SOFTWARE BASICS ........................................................................................................... 50 Opening DriftBox Files – Load All ............................................................................... 50
Data Display ............................................................................................................... 51 Graph Set-up .............................................................................................................. 51
MOVING AROUND THE GRAPHS .......................................................................................... 51 Cursor ......................................................................................................................... 51
Zoom .......................................................................................................................... 52 Pan ............................................................................................................................. 52 Graph Screen X Axis .................................................................................................. 52 Graph Screen Y Axis .................................................................................................. 52
ADDITIONAL FILE FUNCTIONS ............................................................................................. 53 Load Compare File ..................................................................................................... 53 Append File to Main .................................................................................................... 53
Open in Notepad......................................................................................................... 53 Load Circuit Map......................................................................................................... 53
EDITING DRIFTBOX FILES .................................................................................................. 54 SAVING DRIFTBOX FILES ................................................................................................... 54 PRINTING GRAPH DATA ..................................................................................................... 54
EXPORTING GRAPH DATA .................................................................................................. 54 SELECTING CHANNELS ...................................................................................................... 55 CHANNEL AND AXIS SETUP ................................................................................................ 57
Channel Setup ............................................................................................................ 57
Axis Setup .................................................................................................................. 59
DRIFT RESULTS ................................................................................................................ 61
SECTORS ......................................................................................................................... 62 Defining Drifting Sectors in DriftBox Tools .................................................................. 62
Loading and Saving Sectors ....................................................................................... 62 Clearing Sectors ......................................................................................................... 62 Displaying Drifting Data from a Logged file. ................................................................ 63
REPLAYING DRIFTBOX DATA ............................................................................................. 63 Replaying data with the drifting table active ................................................................ 63
LAP TIMING ...................................................................................................................... 64 START / FINISH LINES AND SPLITS ...................................................................................... 65
Defining start / finish lines and splits in the DriftBox software ..................................... 65 Loading and Saving start / finish line and split data .................................................... 66
Clearing start / finish line and split data ...................................................................... 66 Moving Splits .............................................................................................................. 66
Show Split Info on Graph Chart .................................................................................. 66 Gate Width .................................................................................................................. 66 Split Names ................................................................................................................ 67
DISPLAYING LAP TIMES ..................................................................................................... 67 Including Split times .................................................................................................... 67
Exporting Lap Time Results ........................................................................................ 68 Clearing Lap Time Results ......................................................................................... 68 Lap Highlight ............................................................................................................... 68 Loading and comparing individual laps from the same file ......................................... 69 Loading and comparing individual laps from different files ......................................... 70
Replaying Laps ........................................................................................................... 73 Set Position Cursor Type ............................................................................................ 73
CREATING A CIRCUIT OVERLAY .......................................................................................... 74 Creating an Overlay File by Driving the Circuit ........................................................... 74 Creating an Overlay File in Google EarthTM ................................................................ 74
Racelogic Ltd Contents
- 7 -
Loading a Circuit Overlay File ..................................................................................... 74 Aligning Circuit Overlays and Laps ............................................................................. 75
.................................................................................................................................... 76 Importing a background image in to the Graph Map ................................................... 77
PERFORMANCE RESULTS .................................................................................................. 78 Producing Acceleration Results .................................................................................. 78
Creating a Custom Acceleration test .......................................................................... 79 Producing Deceleration Results ................................................................................. 79 Creating a Custom Deceleration test .......................................................................... 79
ADDITIONAL DATA ANALYSIS FEATURES ............................................................................. 80
THE G-CIRCLE ................................................................................................................. 80 Creating a Measure Tool Window............................................................................... 81 Saving and Printing the Measure Tool Data Table ..................................................... 81
EVENT MARKING ............................................................................................................... 82 TOOLS ............................................................................................................................. 83
Arrange Windows ....................................................................................................... 83 Export Data ................................................................................................................. 83 Formatting MMC/SD Cards ........................................................................................ 84
Import Data ................................................................................................................. 84 File Repair .................................................................................................................. 84 Radius of Turn set-up ................................................................................................. 85
OTHER FEATURES ............................................................................................................ 85 Export Results ............................................................................................................ 85 Summary .................................................................................................................... 85
Units of Measurement ................................................................................................. 85
Help ............................................................................................................................ 85
INDEX ................................................................................................................................ 86
SPECIFICATION ............................................................................................................... 87
CONTACT INFORMATION ............................................................................................... 87
Racelogic Ltd Drifting
- 8 -
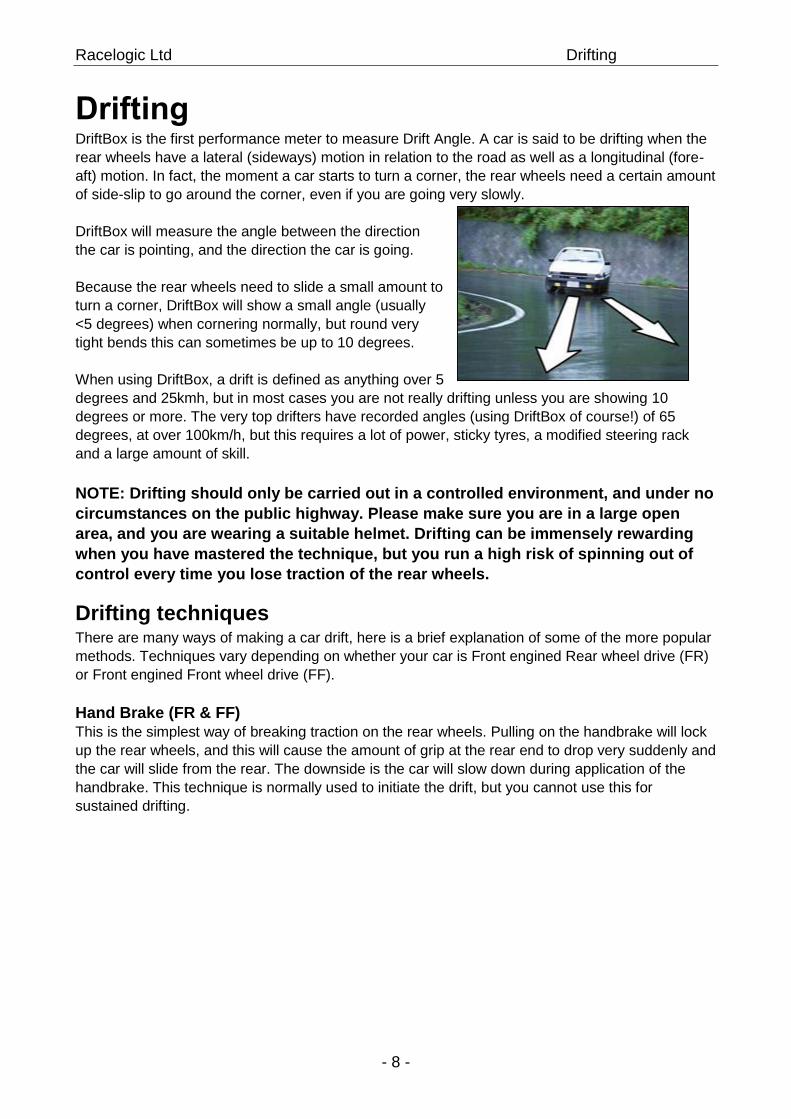
Drifting DriftBox is the first performance meter to measure Drift Angle. A car is said to be drifting when the
rear wheels have a lateral (sideways) motion in relation to the road as well as a longitudinal (fore-
aft) motion. In fact, the moment a car starts to turn a corner, the rear wheels need a certain amount
of side-slip to go around the corner, even if you are going very slowly.
DriftBox will measure the angle between the direction
the car is pointing, and the direction the car is going.
Because the rear wheels need to slide a small amount to
turn a corner, DriftBox will show a small angle (usually
<5 degrees) when cornering normally, but round very
tight bends this can sometimes be up to 10 degrees.
When using DriftBox, a drift is defined as anything over 5
degrees and 25kmh, but in most cases you are not really drifting unless you are showing 10
degrees or more. The very top drifters have recorded angles (using DriftBox of course!) of 65
degrees, at over 100km/h, but this requires a lot of power, sticky tyres, a modified steering rack
and a large amount of skill.
NOTE: Drifting should only be carried out in a controlled environment, and under no
circumstances on the public highway. Please make sure you are in a large open
area, and you are wearing a suitable helmet. Drifting can be immensely rewarding
when you have mastered the technique, but you run a high risk of spinning out of
control every time you lose traction of the rear wheels.
Drifting techniques There are many ways of making a car drift, here is a brief explanation of some of the more popular
methods. Techniques vary depending on whether your car is Front engined Rear wheel drive (FR)
or Front engined Front wheel drive (FF).
Hand Brake (FR & FF) This is the simplest way of breaking traction on the rear wheels. Pulling on the handbrake will lock
up the rear wheels, and this will cause the amount of grip at the rear end to drop very suddenly and
the car will slide from the rear. The downside is the car will slow down during application of the
handbrake. This technique is normally used to initiate the drift, but you cannot use this for
sustained drifting.
Racelogic Ltd Drifting
- 9 -
Power Oversteer (FR)
In a powerful car, flooring the throttle whilst turning the steering will cause the rear wheels to start
spinning, which will reduce the amount of grip at the rear end, causing the tail to try and overtake
the front of the car. Applying opposite lock on the steering, and then modulating the throttle to keep
the rear wheels spinning is the method of controlling this situation. However, the more the wheels
spin, the less grip they give, so if you apply too much throttle, the car will spin out, and if you use
too little, the car will stop sliding. Get the balance right, and you’ve cracked it!
Feint or Scandinavian Flick (FR & FF)
In a high speed corner, you can usually make the rear end start to slide by turning one way under
power, lifting off, and then quickly turn the other way, so you are making a ‘feint’ the opposite way
before you go round the corner. There is a weight transfer to the front of the car making it grip,
whilst the rear becomes unloaded and should start to slide.
Clutch kick or Diff-lock (FR)
To perform a clutch kick, the throttle is floored and then the clutch is very briefly disengaged (the
‘kick’). This causes the engine revs to rise suddenly and then immediately transfer the extra
momentum of the engine/flywheel to the rear wheels, thereby promoting wheel spin. If you are
going round a bend when you use this technique, the car should start to slide immediately.
Be prepared to wind on opposite lock very quickly, and come off the throttle because there is a
very quick transition from gripping to sliding using this method. Ideally the throttle should then be
re-applied to keep the car sliding.
Trail Braking
This involves keeping the brakes on as you turn into a fast corner, this works best on a downhill
corner as less speed is lost.
There are many ways to drift a car, and we have only covered the basics. For more detailed
information please use resources such as www.drifting.com, www.dailydrifter.com,
www.driftworks.co.uk and www.driftbox.com.
Racelogic Ltd Quick Start Guide
- 10 -
Quick Start Guide
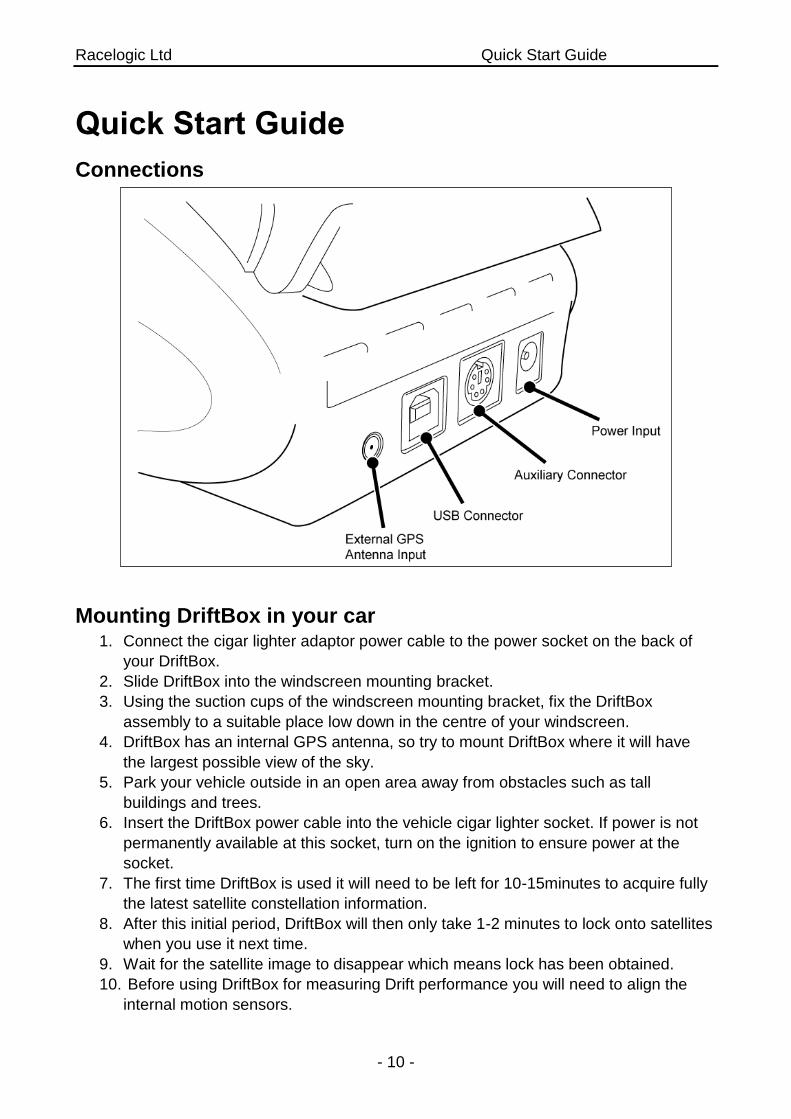
Connections
Mounting DriftBox in your car
1. Connect the cigar lighter adaptor power cable to the power socket on the back of
your DriftBox.
2. Slide DriftBox into the windscreen mounting bracket.
3. Using the suction cups of the windscreen mounting bracket, fix the DriftBox
assembly to a suitable place low down in the centre of your windscreen.
4. DriftBox has an internal GPS antenna, so try to mount DriftBox where it will have
the largest possible view of the sky.
5. Park your vehicle outside in an open area away from obstacles such as tall
buildings and trees.
6. Insert the DriftBox power cable into the vehicle cigar lighter socket. If power is not
permanently available at this socket, turn on the ignition to ensure power at the
socket.
7. The first time DriftBox is used it will need to be left for 10-15minutes to acquire fully
the latest satellite constellation information.
8. After this initial period, DriftBox will then only take 1-2 minutes to lock onto satellites
when you use it next time.
9. Wait for the satellite image to disappear which means lock has been obtained.
10. Before using DriftBox for measuring Drift performance you will need to align the
internal motion sensors.
Racelogic Ltd Quick Start Guide
- 11 -
Aligning Your DriftBox 1. Park your vehicle on flat ground and turn the engine off.
2. Press the MENU button, then highlight ‘Setup’ and press the OK button.
3. Highlight the ‘ALIGNMENT’ option and press OK
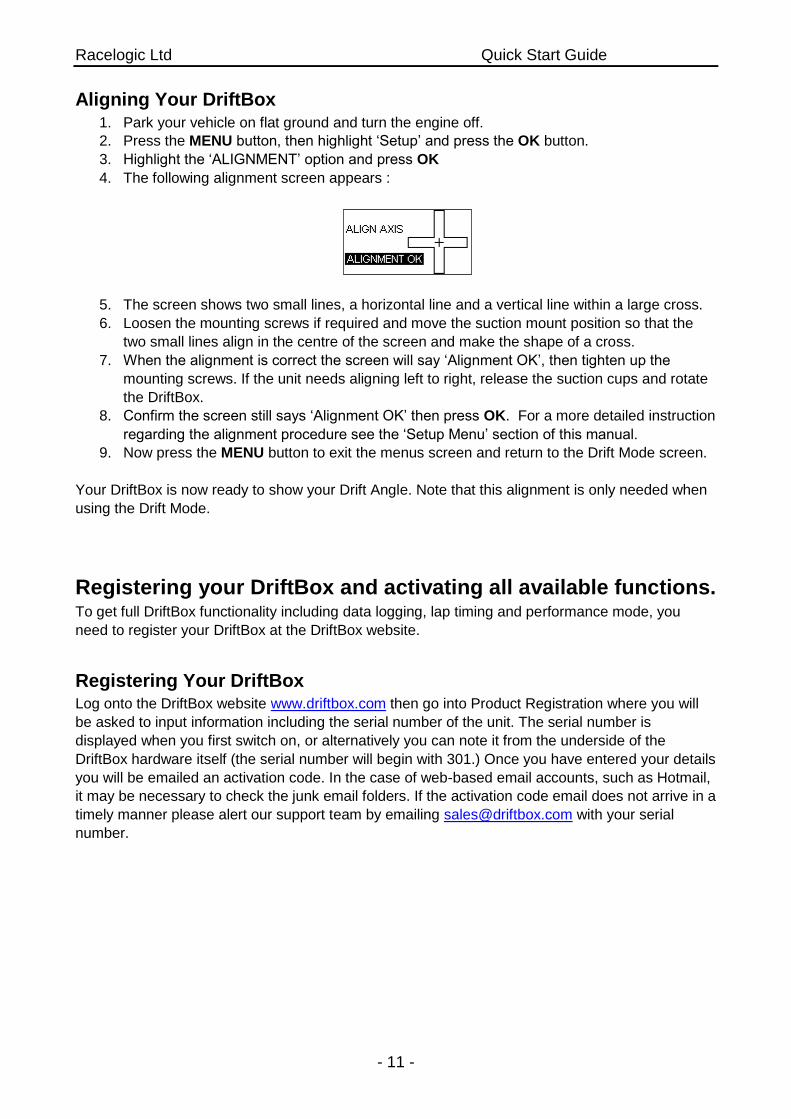
4. The following alignment screen appears :
5. The screen shows two small lines, a horizontal line and a vertical line within a large cross.
6. Loosen the mounting screws if required and move the suction mount position so that the
two small lines align in the centre of the screen and make the shape of a cross.
7. When the alignment is correct the screen will say ‘Alignment OK’, then tighten up the
mounting screws. If the unit needs aligning left to right, release the suction cups and rotate
the DriftBox.
8. Confirm the screen still says ‘Alignment OK’ then press OK. For a more detailed instruction
regarding the alignment procedure see the ‘Setup Menu’ section of this manual.
9. Now press the MENU button to exit the menus screen and return to the Drift Mode screen.
Your DriftBox is now ready to show your Drift Angle. Note that this alignment is only needed when
using the Drift Mode.
Registering your DriftBox and activating all available functions. To get full DriftBox functionality including data logging, lap timing and performance mode, you
need to register your DriftBox at the DriftBox website.
Registering Your DriftBox Log onto the DriftBox website www.driftbox.com then go into Product Registration where you will
be asked to input information including the serial number of the unit. The serial number is
displayed when you first switch on, or alternatively you can note it from the underside of the
DriftBox hardware itself (the serial number will begin with 301.) Once you have entered your details
you will be emailed an activation code. In the case of web-based email accounts, such as Hotmail,
it may be necessary to check the junk email folders. If the activation code email does not arrive in a
timely manner please alert our support team by emailing [email protected] with your serial
number.
Racelogic Ltd Quick Start Guide
- 12 -
Activating Your DriftBox additional functions 1. Switch on DriftBox
2. Press MENU and select ‘SETUP’
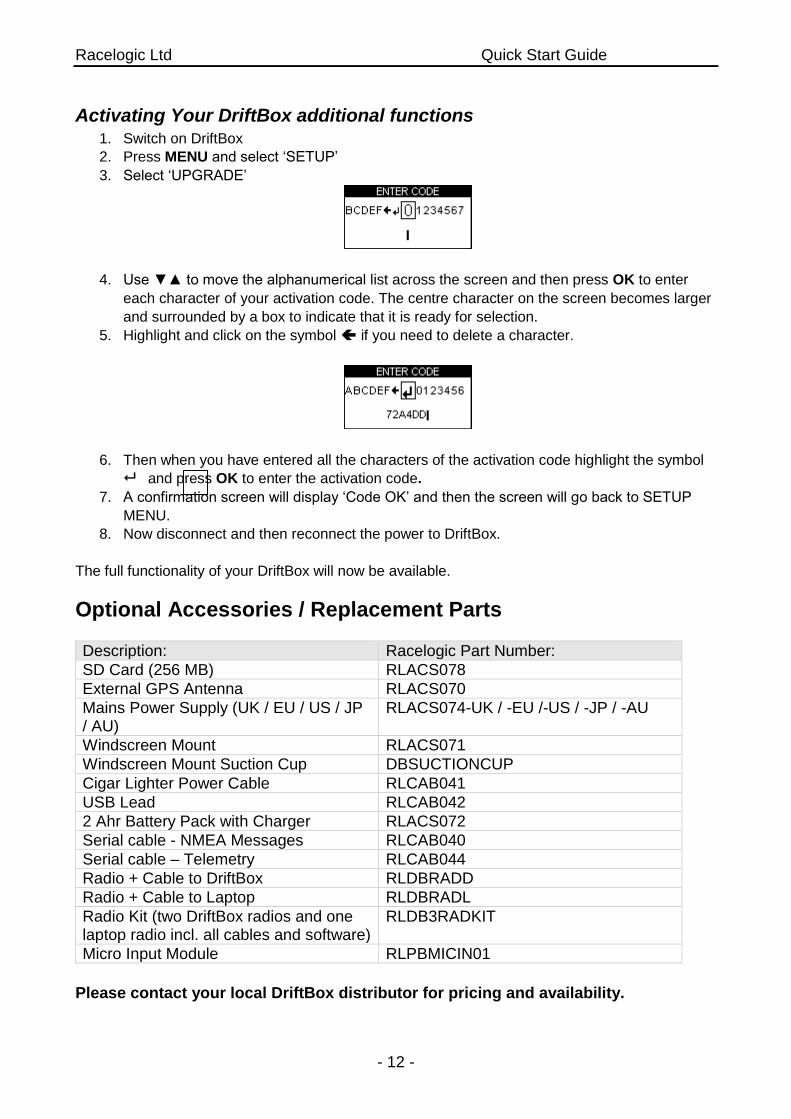
3. Select ‘UPGRADE’
4. Use ▼▲ to move the alphanumerical list across the screen and then press OK to enter
each character of your activation code. The centre character on the screen becomes larger
and surrounded by a box to indicate that it is ready for selection.
5. Highlight and click on the symbol if you need to delete a character.
6. Then when you have entered all the characters of the activation code highlight the symbol
and press OK to enter the activation code.
7. A confirmation screen will display ‘Code OK’ and then the screen will go back to SETUP
MENU.
8. Now disconnect and then reconnect the power to DriftBox.
The full functionality of your DriftBox will now be available.
Optional Accessories / Replacement Parts
Description: Racelogic Part Number:
SD Card (256 MB) RLACS078
External GPS Antenna RLACS070
Mains Power Supply (UK / EU / US / JP / AU)
RLACS074-UK / -EU /-US / -JP / -AU
Windscreen Mount RLACS071
Windscreen Mount Suction Cup DBSUCTIONCUP
Cigar Lighter Power Cable RLCAB041
USB Lead RLCAB042
2 Ahr Battery Pack with Charger RLACS072
Serial cable - NMEA Messages RLCAB040
Serial cable – Telemetry RLCAB044
Radio + Cable to DriftBox RLDBRADD
Radio + Cable to Laptop RLDBRADL
Radio Kit (two DriftBox radios and one laptop radio incl. all cables and software)
RLDB3RADKIT
Micro Input Module RLPBMICIN01
Please contact your local DriftBox distributor for pricing and availability.
Racelogic Ltd Using DriftBox
- 13 -
Using DriftBox Your DriftBox can be used in a variety of modes, as described in this section.
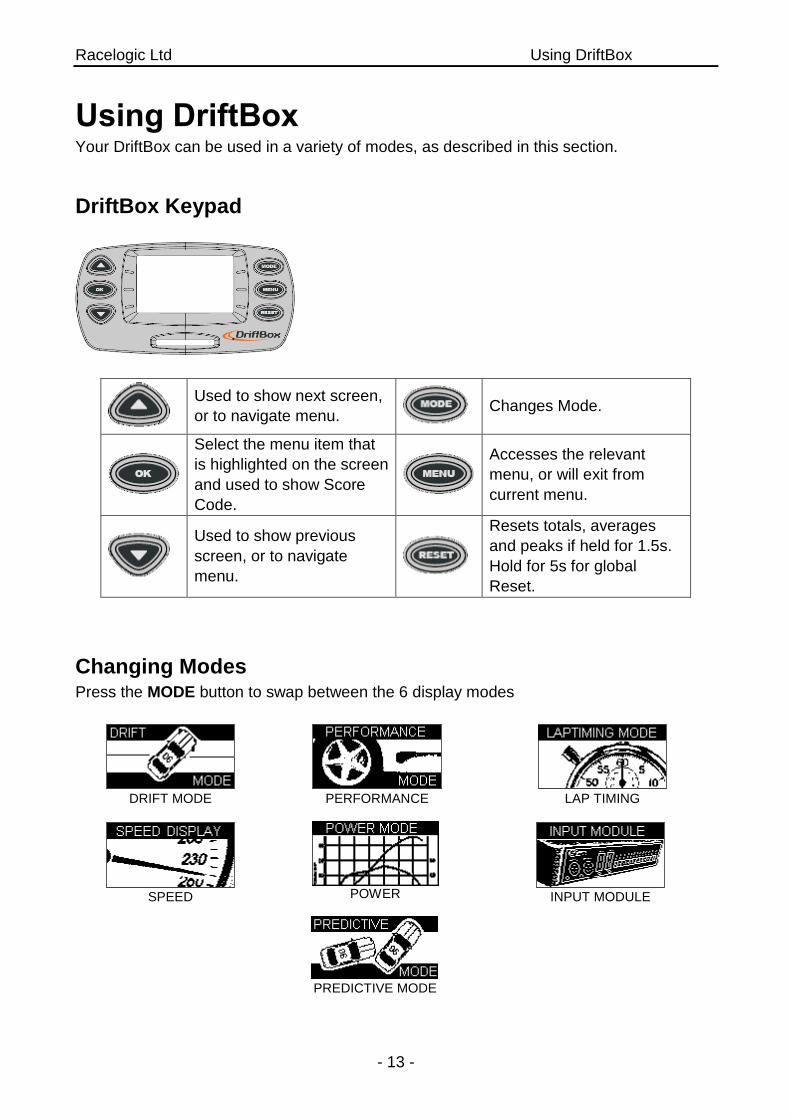
DriftBox Keypad
Used to show next screen,
or to navigate menu. Changes Mode.
Select the menu item that
is highlighted on the screen
and used to show Score
Code.
Accesses the relevant
menu, or will exit from
current menu.
Used to show previous
screen, or to navigate
menu.
Resets totals, averages
and peaks if held for 1.5s.
Hold for 5s for global
Reset.
Changing Modes Press the MODE button to swap between the 6 display modes
DRIFT MODE
PERFORMANCE
LAP TIMING
SPEED
POWER
INPUT MODULE
PREDICTIVE MODE
Racelogic Ltd Using DriftBox
- 14 -
Changing the Units of Measurement
1. Press the MENU button from any of the Display Modes. 2. Highlight UNITS and press OK. 3. Highlight SPEED and press OK. 4. Highlight KMH or MPH and then press OK to tick that selection. 5. Highlight EXIT and press OK.
To change the Distance units from metres to feet, follow the same procedure but highlight DISTANCE and press OK.
Satellite Reception DriftBox calculates all of its logged data from the information it receives from GPS satellites and
relies on being able to get a good lock to produce this data. So it is imperative that DriftBox (or
optional external antenna) is placed in the best possible position for a clear view of the sky.
If you are using an external antenna, ensure that it is connected before you power up DriftBox.
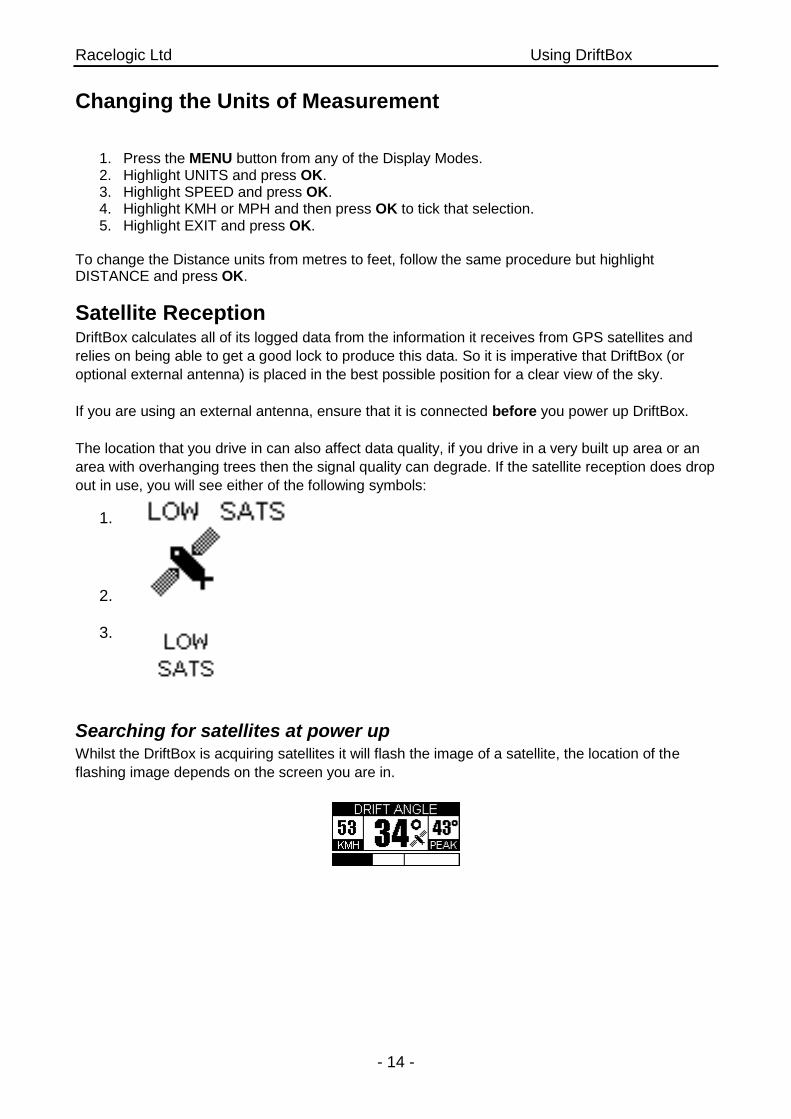
The location that you drive in can also affect data quality, if you drive in a very built up area or an
area with overhanging trees then the signal quality can degrade. If the satellite reception does drop
out in use, you will see either of the following symbols:
1.
2.
3.
Searching for satellites at power up Whilst the DriftBox is acquiring satellites it will flash the image of a satellite, the location of the
flashing image depends on the screen you are in.
Racelogic Ltd Drift Mode
- 15 -
Drift Mode
Drift Mode is used to measure your drifting ability, showing current and maximum drift angles and
give a grading of your performance as a score between 0 and 10 points. Scores can be sent to the
DriftBox website for publishing on the Top Scores database.
On a fully activated DriftBox an SD card can be inserted to log your scores and data from your runs
that can then be downloaded and viewed on your computer and in the DriftBox Tools PC software.
The Drift Mode can be used in two different ways; Sectors and Practice. The default is Practice,
but you can turn on Sectors in the Drift Menu.
Practice Without Sectors enabled, the DriftBox measures a single run at a time, where a run is defined as
anything larger than 5o of drift and a speed greater than 25Km/h. The run finishes when you go
below these thresholds. You can then see Peak Drift angle, speed at which that drift angle
occurred, the peak Lateral G during the run and the overall Score which is based on Lateral G and
Drift Angle.
Sectors When Sector Mode is selected, a run starts at one virtual gate and finishes at another, see the
‘Sectors’ section later on for more details.
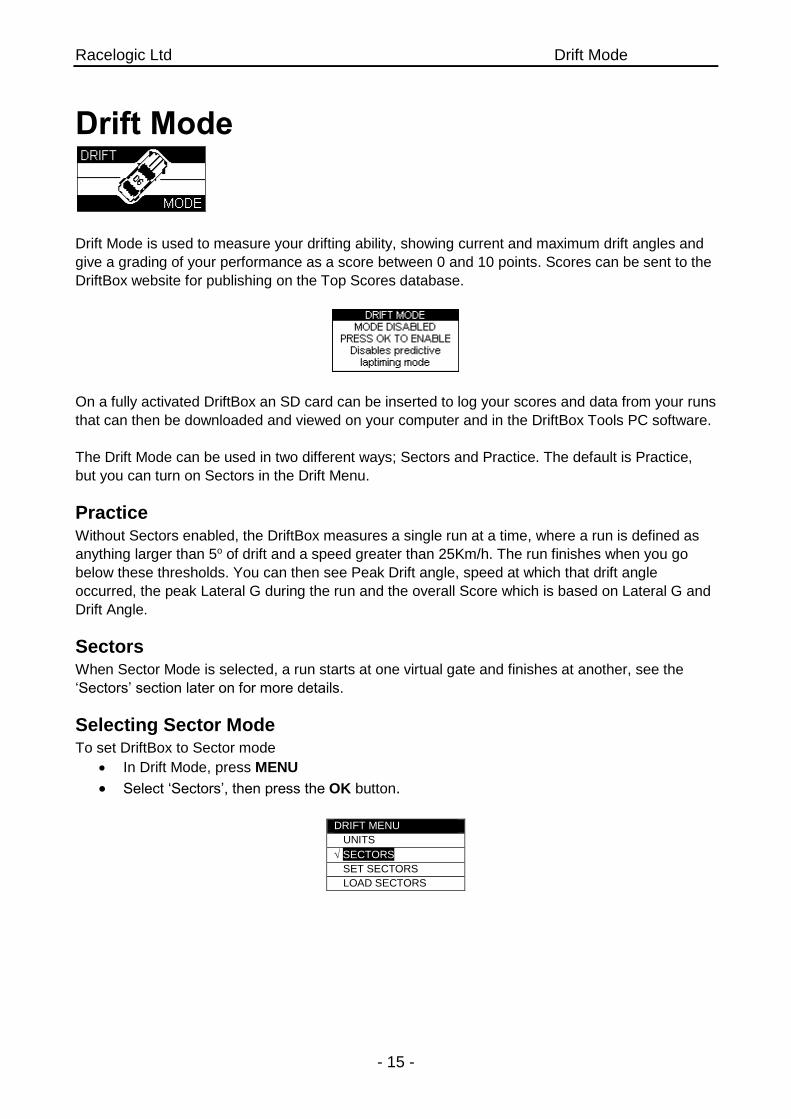
Selecting Sector Mode To set DriftBox to Sector mode
In Drift Mode, press MENU
Select ‘Sectors’, then press the OK button.
DRIFT MENU
UNITS
SECTORS
SET SECTORS
LOAD SECTORS
Racelogic Ltd Drift Mode
- 16 -
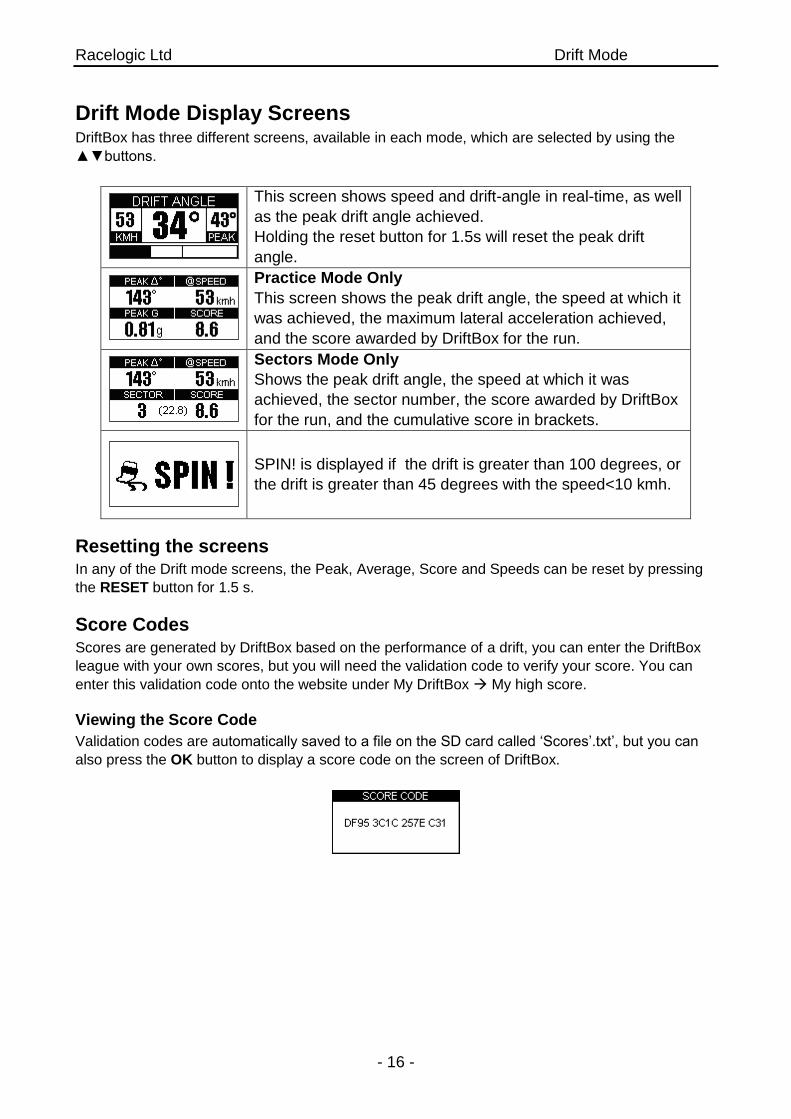
Drift Mode Display Screens DriftBox has three different screens, available in each mode, which are selected by using the
▲▼buttons.
This screen shows speed and drift-angle in real-time, as well
as the peak drift angle achieved.
Holding the reset button for 1.5s will reset the peak drift
angle.
Practice Mode Only
This screen shows the peak drift angle, the speed at which it
was achieved, the maximum lateral acceleration achieved,
and the score awarded by DriftBox for the run.
Sectors Mode Only
Shows the peak drift angle, the speed at which it was
achieved, the sector number, the score awarded by DriftBox
for the run, and the cumulative score in brackets.
SPIN! is displayed if the drift is greater than 100 degrees, or
the drift is greater than 45 degrees with the speed<10 kmh.
Resetting the screens In any of the Drift mode screens, the Peak, Average, Score and Speeds can be reset by pressing
the RESET button for 1.5 s.
Score Codes Scores are generated by DriftBox based on the performance of a drift, you can enter the DriftBox
league with your own scores, but you will need the validation code to verify your score. You can
enter this validation code onto the website under My DriftBox My high score.
Viewing the Score Code
Validation codes are automatically saved to a file on the SD card called ‘Scores’.txt’, but you can
also press the OK button to display a score code on the screen of DriftBox.
Racelogic Ltd Drift Mode
- 17 -
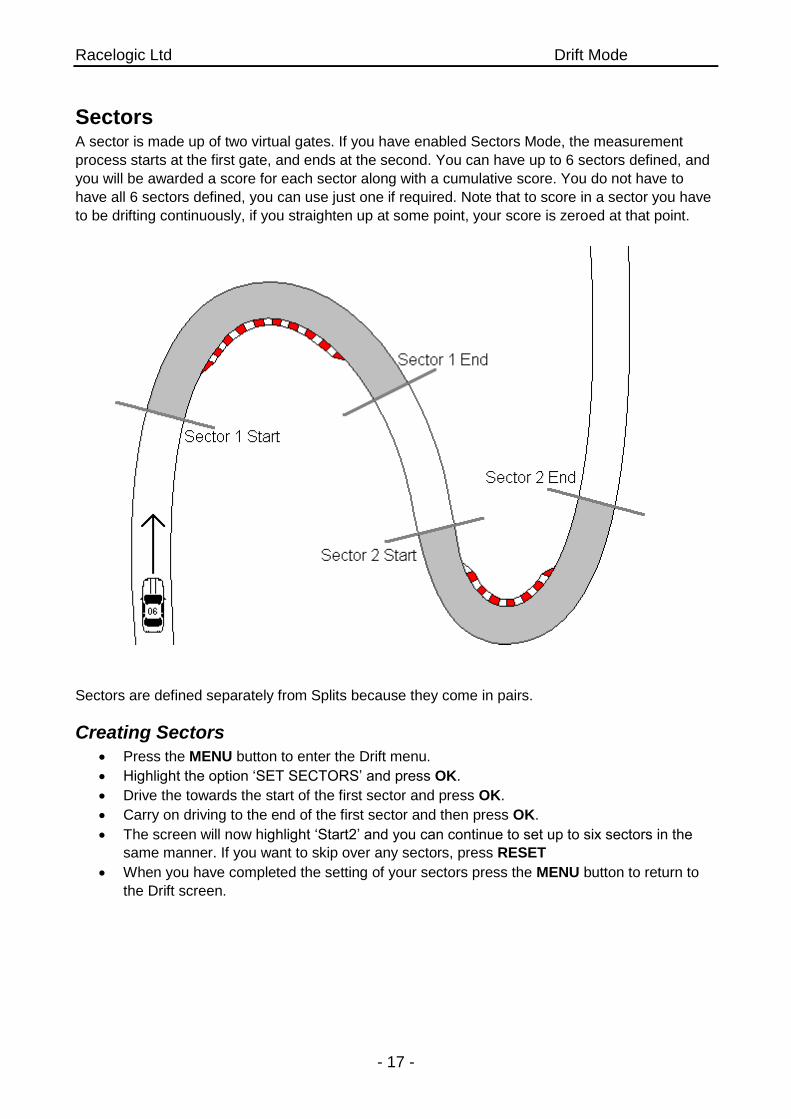
Sectors A sector is made up of two virtual gates. If you have enabled Sectors Mode, the measurement
process starts at the first gate, and ends at the second. You can have up to 6 sectors defined, and
you will be awarded a score for each sector along with a cumulative score. You do not have to
have all 6 sectors defined, you can use just one if required. Note that to score in a sector you have
to be drifting continuously, if you straighten up at some point, your score is zeroed at that point.
Sectors are defined separately from Splits because they come in pairs.
Creating Sectors
Press the MENU button to enter the Drift menu.
Highlight the option ‘SET SECTORS’ and press OK.
Drive the towards the start of the first sector and press OK.
Carry on driving to the end of the first sector and then press OK.
The screen will now highlight ‘Start2’ and you can continue to set up to six sectors in the
same manner. If you want to skip over any sectors, press RESET
When you have completed the setting of your sectors press the MENU button to return to
the Drift screen.
Racelogic Ltd Drift Mode
- 18 -
Loading and Saving Sectors After creating sector information in your DriftBox you can then save this information to a sector file
on the SD card. This allows the sector information to be copied onto your computer and used in the
DriftBox software when you analyse your logged data. The sector file will be named DBOX.sct –
this is the only file name that DriftBox will recognise as a sector file (see page 57 ‘Defining Drifting
Sectors in DriftBox Tools’ for further details.)
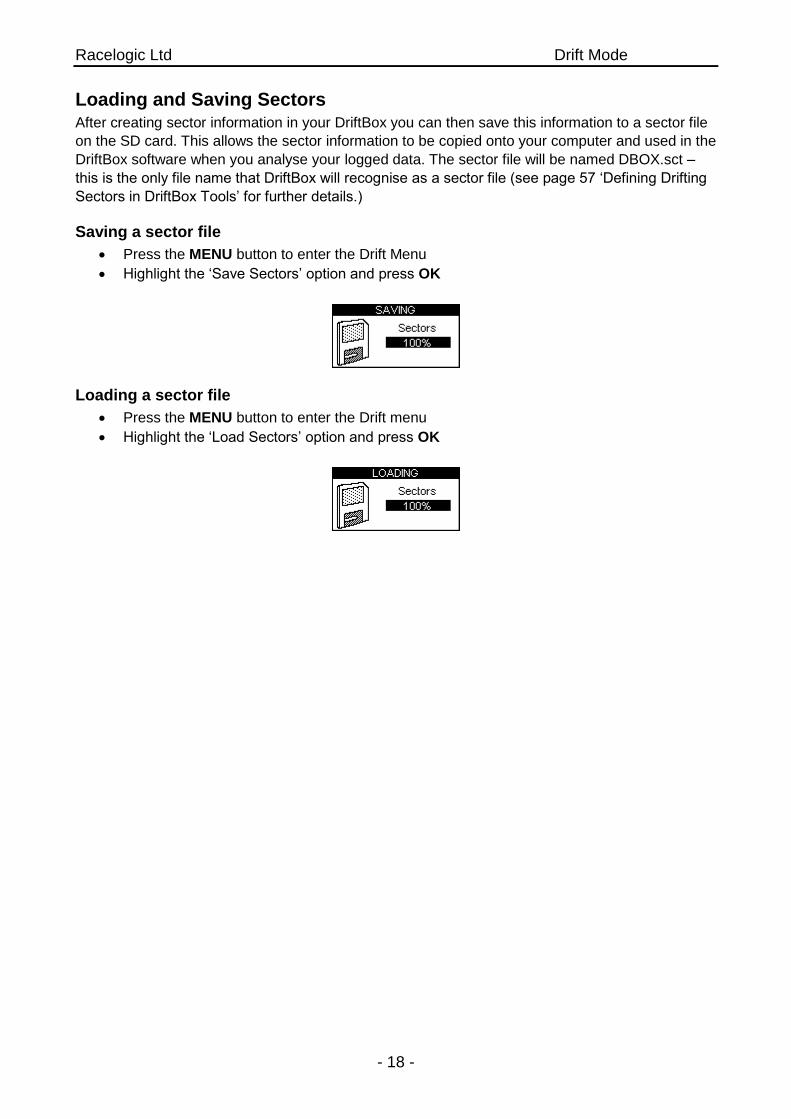
Saving a sector file
Press the MENU button to enter the Drift Menu
Highlight the ‘Save Sectors’ option and press OK
Loading a sector file
Press the MENU button to enter the Drift menu
Highlight the ‘Load Sectors’ option and press OK
Racelogic Ltd Performance Mode
- 19 -
Performance Mode
The Performance mode is used to measure the acceleration and braking performance of your
vehicle. Press the MODE button to scroll to the Performance Mode screen. This mode is divided
into six screens, each of which displays different performance data. Navigate between these
screens by using the▲▼buttons. Each screen will automatically display the results as they happen,
e.g. if you drive from 0 Mph to 60 Mph then the 0-60 section will show the time taken.
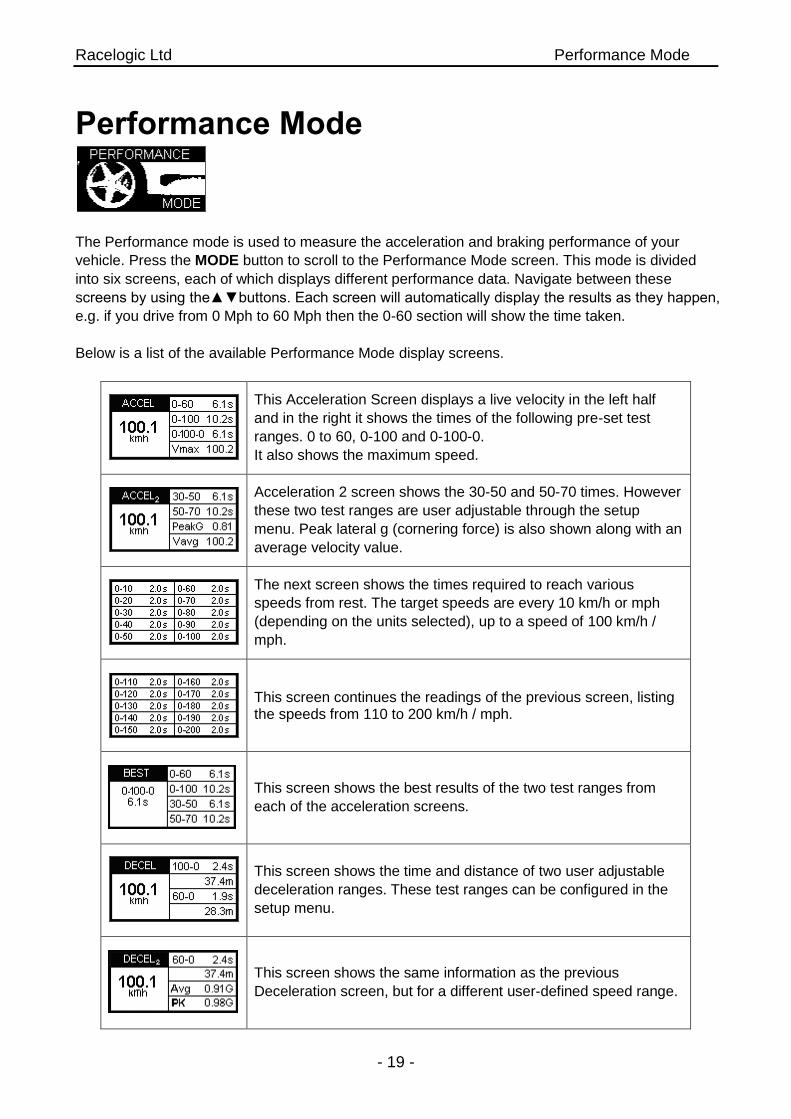
Below is a list of the available Performance Mode display screens.
This Acceleration Screen displays a live velocity in the left half
and in the right it shows the times of the following pre-set test
ranges. 0 to 60, 0-100 and 0-100-0.
It also shows the maximum speed.
Acceleration 2 screen shows the 30-50 and 50-70 times. However
these two test ranges are user adjustable through the setup
menu. Peak lateral g (cornering force) is also shown along with an
average velocity value.
The next screen shows the times required to reach various
speeds from rest. The target speeds are every 10 km/h or mph
(depending on the units selected), up to a speed of 100 km/h /
mph.
This screen continues the readings of the previous screen, listing the speeds from 110 to 200 km/h / mph.
This screen shows the best results of the two test ranges from
each of the acceleration screens.
This screen shows the time and distance of two user adjustable
deceleration ranges. These test ranges can be configured in the
setup menu.
This screen shows the same information as the previous
Deceleration screen, but for a different user-defined speed range.
Racelogic Ltd Performance Mode
- 20 -
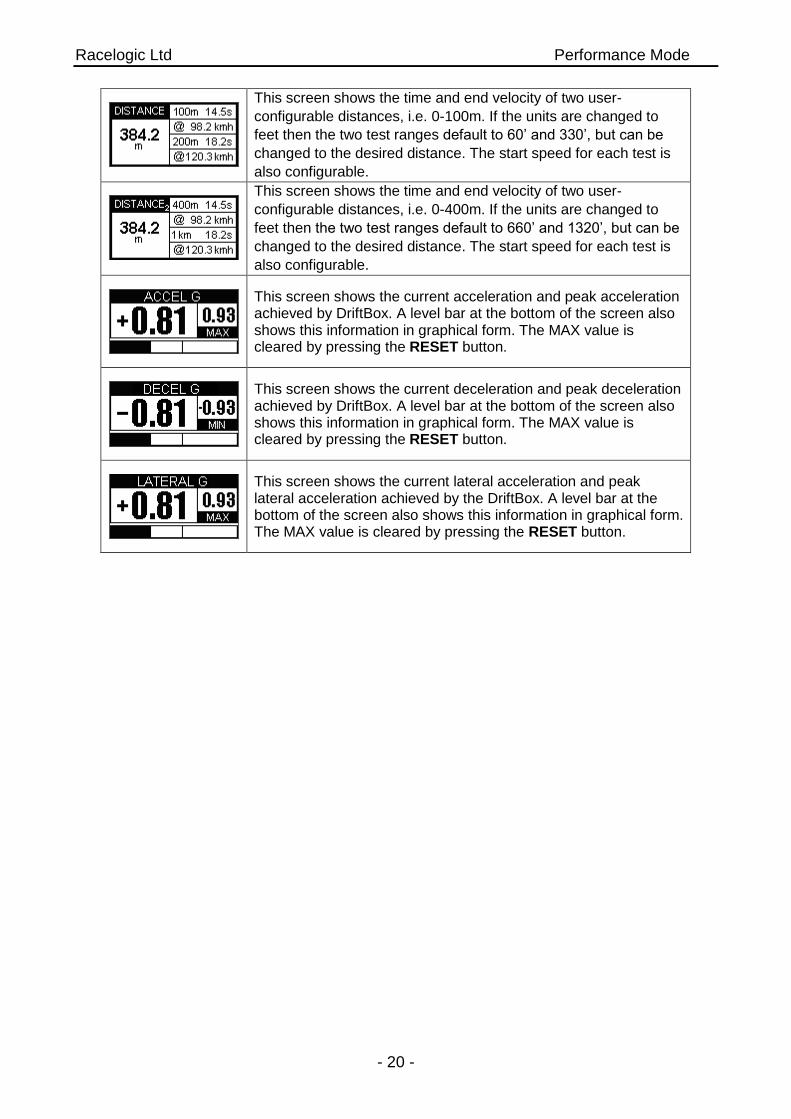
This screen shows the time and end velocity of two user-
configurable distances, i.e. 0-100m. If the units are changed to
feet then the two test ranges default to 60’ and 330’, but can be
changed to the desired distance. The start speed for each test is
also configurable.
This screen shows the time and end velocity of two user-
configurable distances, i.e. 0-400m. If the units are changed to
feet then the two test ranges default to 660’ and 1320’, but can be
changed to the desired distance. The start speed for each test is
also configurable.
This screen shows the current acceleration and peak acceleration achieved by DriftBox. A level bar at the bottom of the screen also shows this information in graphical form. The MAX value is cleared by pressing the RESET button.
This screen shows the current deceleration and peak deceleration achieved by DriftBox. A level bar at the bottom of the screen also shows this information in graphical form. The MAX value is cleared by pressing the RESET button.
This screen shows the current lateral acceleration and peak lateral acceleration achieved by the DriftBox. A level bar at the bottom of the screen also shows this information in graphical form. The MAX value is cleared by pressing the RESET button.
Racelogic Ltd Performance Mode
- 21 -
Measuring the 0-60 time of your vehicle
1. Install DriftBox into your vehicle as described in the ‘Quick Start Guide’ section of this
manual.
2. Press the MENU button to select the Performance Mode.
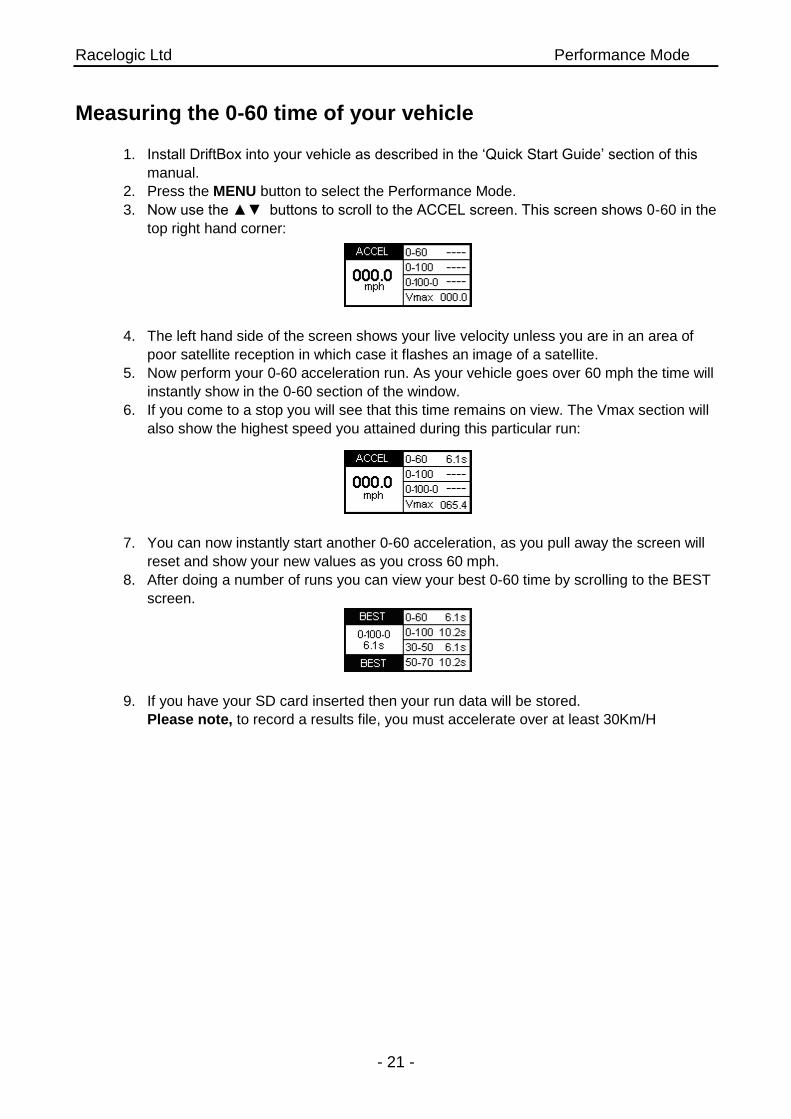
3. Now use the ▲▼ buttons to scroll to the ACCEL screen. This screen shows 0-60 in the
top right hand corner:
4. The left hand side of the screen shows your live velocity unless you are in an area of
poor satellite reception in which case it flashes an image of a satellite.
5. Now perform your 0-60 acceleration run. As your vehicle goes over 60 mph the time will
instantly show in the 0-60 section of the window.
6. If you come to a stop you will see that this time remains on view. The Vmax section will
also show the highest speed you attained during this particular run:
7. You can now instantly start another 0-60 acceleration, as you pull away the screen will
reset and show your new values as you cross 60 mph.
8. After doing a number of runs you can view your best 0-60 time by scrolling to the BEST
screen.
9. If you have your SD card inserted then your run data will be stored.
Please note, to record a results file, you must accelerate over at least 30Km/H
Racelogic Ltd Performance Mode
- 22 -
Editing a Performance mode Test Range You can configure the two speed ranges of the Accel2 and Decel screen to create your own
custom tests.
If you wish to change the speed range over which performance is measured, press the MENU
button from any of the performance mode screens and select the range you wish to change from
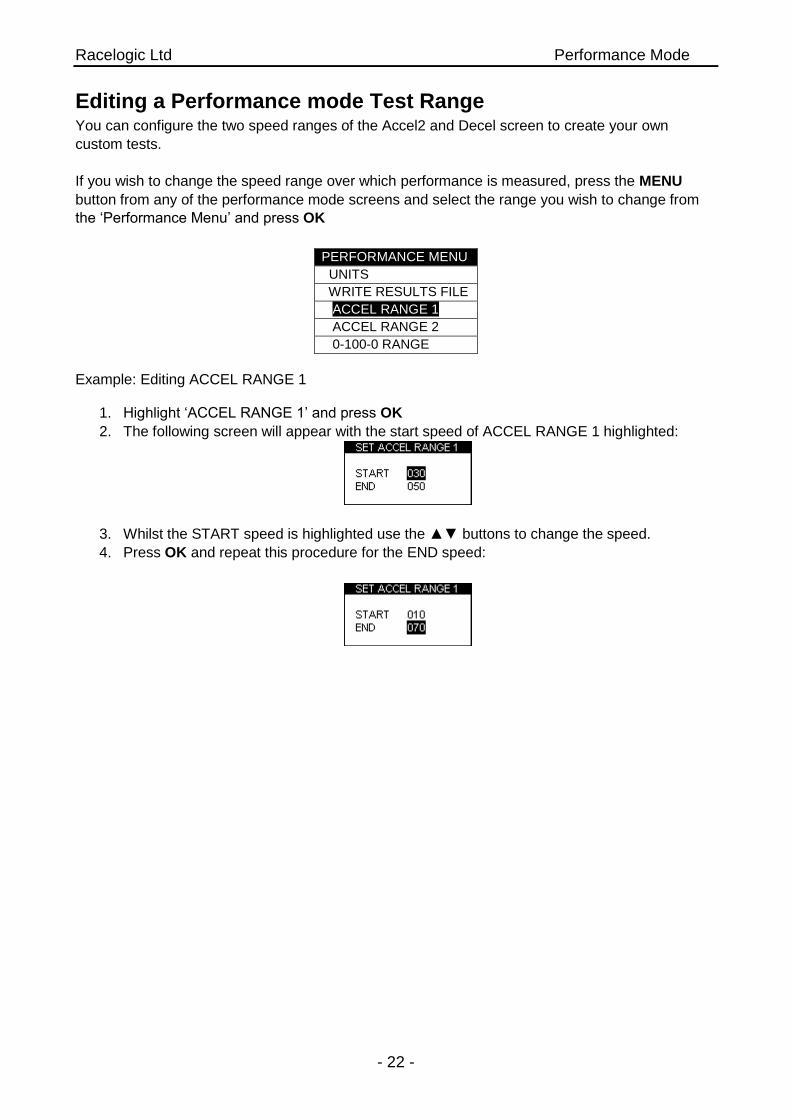
the ‘Performance Menu’ and press OK
PERFORMANCE MENU
UNITS
WRITE RESULTS FILE
ACCEL RANGE 1
ACCEL RANGE 2
0-100-0 RANGE
Example: Editing ACCEL RANGE 1
1. Highlight ‘ACCEL RANGE 1’ and press OK
2. The following screen will appear with the start speed of ACCEL RANGE 1 highlighted:
3. Whilst the START speed is highlighted use the ▲▼ buttons to change the speed.
4. Press OK and repeat this procedure for the END speed:
Racelogic Ltd Performance Mode
- 23 -
1 Foot Rollout The DriftBox normally takes the start of a performance run at the point at which the vehicle moves,
but at drag strips the vehicle starts 1 foot behind the timing start line. You can make the DriftBox
start all timing runs from 1 foot by enabling this feature.
Enabling 1 Foot Rollout correction
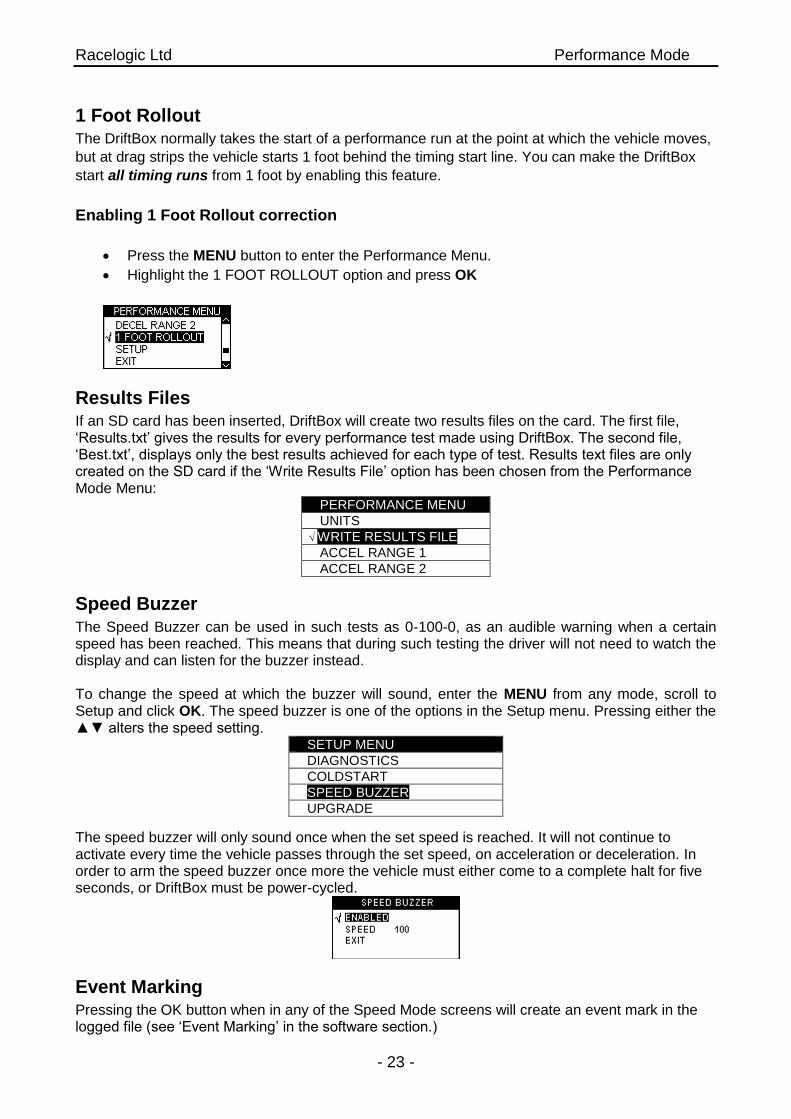
Press the MENU button to enter the Performance Menu.
Highlight the 1 FOOT ROLLOUT option and press OK
Results Files If an SD card has been inserted, DriftBox will create two results files on the card. The first file, ‘Results.txt’ gives the results for every performance test made using DriftBox. The second file, ‘Best.txt’, displays only the best results achieved for each type of test. Results text files are only created on the SD card if the ‘Write Results File’ option has been chosen from the Performance Mode Menu:
PERFORMANCE MENU
UNITS
WRITE RESULTS FILE
ACCEL RANGE 1
ACCEL RANGE 2
Speed Buzzer The Speed Buzzer can be used in such tests as 0-100-0, as an audible warning when a certain speed has been reached. This means that during such testing the driver will not need to watch the display and can listen for the buzzer instead. To change the speed at which the buzzer will sound, enter the MENU from any mode, scroll to Setup and click OK. The speed buzzer is one of the options in the Setup menu. Pressing either the ▲▼ alters the speed setting.
SETUP MENU
DIAGNOSTICS
COLDSTART
SPEED BUZZER
UPGRADE
The speed buzzer will only sound once when the set speed is reached. It will not continue to activate every time the vehicle passes through the set speed, on acceleration or deceleration. In order to arm the speed buzzer once more the vehicle must either come to a complete halt for five seconds, or DriftBox must be power-cycled.
Event Marking Pressing the OK button when in any of the Speed Mode screens will create an event mark in the logged file (see ‘Event Marking’ in the software section.)
Racelogic Ltd Laptiming Mode
- 24 -
Laptiming Mode
DriftBox can be used to measure lap times by storing the position of a virtual gate and using this to trigger the start and end of a lap. Further locations can be added to represent split and dedicated finish lines.
Start/Finish Line: Defines the point at which one lap ends and another starts. It also defines the start of a test that ends in a different location, such as a sprint or slalom stage.
Split Line: Defines a point on the track or stage at which intermediate time and speed measurements are displayed.
Finish Line: Used only in point-to-point tests (such as sprint or slalom tests), to mark a finish point that is in a different location to the start point.
Measuring Lap times There are two ways of measuring lap times as you drive round a circuit: by setting the start/finish and split points through the DriftBox menu screens, or by using the ‘Simple Lap Timing’ option. The latter is useful if the user is in a situation where several button presses are difficult to achieve, such as during a qualifying run.
Simple Lap Timing
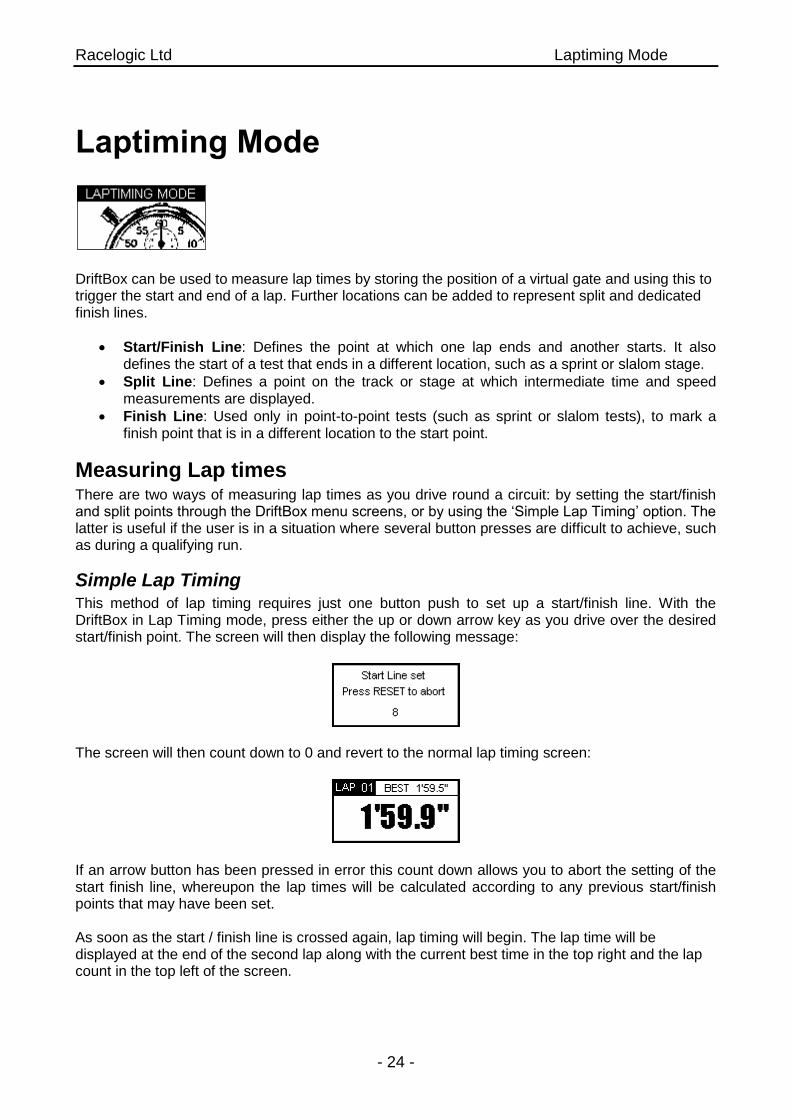
This method of lap timing requires just one button push to set up a start/finish line. With the DriftBox in Lap Timing mode, press either the up or down arrow key as you drive over the desired start/finish point. The screen will then display the following message:
The screen will then count down to 0 and revert to the normal lap timing screen:
If an arrow button has been pressed in error this count down allows you to abort the setting of the start finish line, whereupon the lap times will be calculated according to any previous start/finish points that may have been set. As soon as the start / finish line is crossed again, lap timing will begin. The lap time will be displayed at the end of the second lap along with the current best time in the top right and the lap count in the top left of the screen.
Racelogic Ltd Laptiming Mode
- 25 -
Lap Count A count of the number of completed Laps is displayed in the top left corner of the Lap timing screen. To reset the Lap count and the Best Lap time, press the RESET button.
Lap Timing Including Split Points
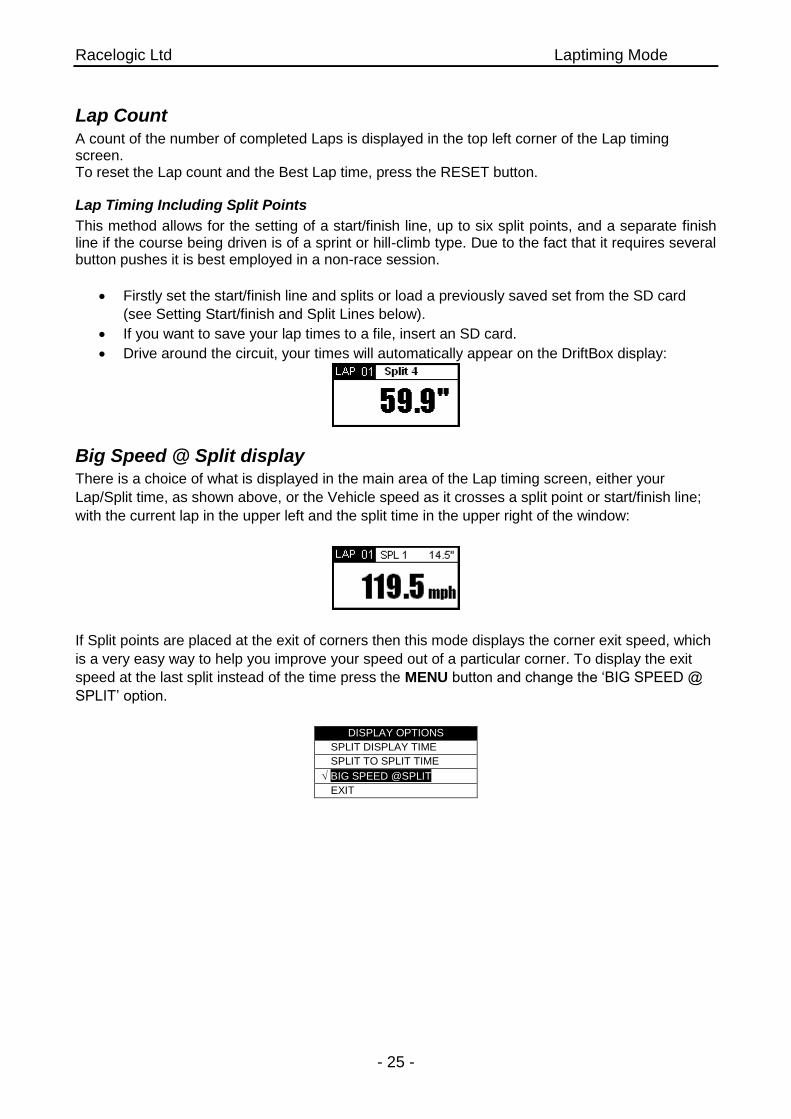
This method allows for the setting of a start/finish line, up to six split points, and a separate finish line if the course being driven is of a sprint or hill-climb type. Due to the fact that it requires several button pushes it is best employed in a non-race session.
Firstly set the start/finish line and splits or load a previously saved set from the SD card
(see Setting Start/finish and Split Lines below).
If you want to save your lap times to a file, insert an SD card.
Drive around the circuit, your times will automatically appear on the DriftBox display:
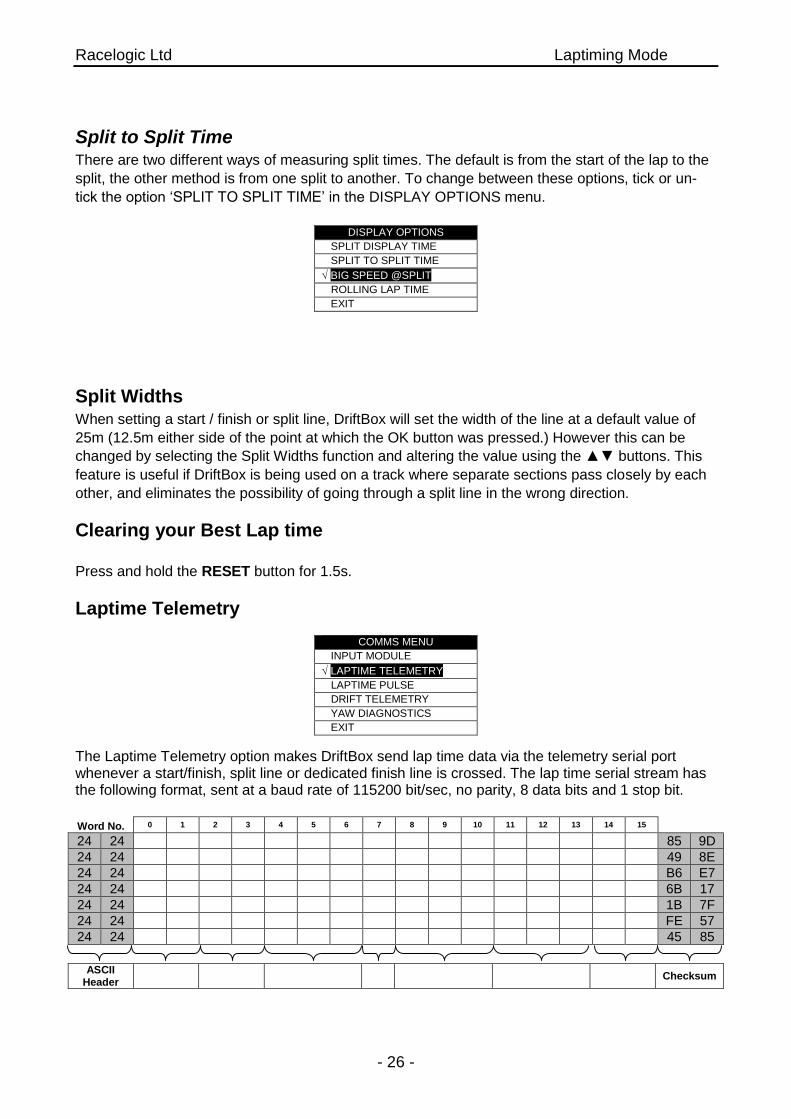
Big Speed @ Split display There is a choice of what is displayed in the main area of the Lap timing screen, either your
Lap/Split time, as shown above, or the Vehicle speed as it crosses a split point or start/finish line;
with the current lap in the upper left and the split time in the upper right of the window:
If Split points are placed at the exit of corners then this mode displays the corner exit speed, which
is a very easy way to help you improve your speed out of a particular corner. To display the exit
speed at the last split instead of the time press the MENU button and change the ‘BIG SPEED @
SPLIT’ option.
DISPLAY OPTIONS
SPLIT DISPLAY TIME
SPLIT TO SPLIT TIME
BIG SPEED @SPLIT
EXIT
Racelogic Ltd Laptiming Mode
- 26 -
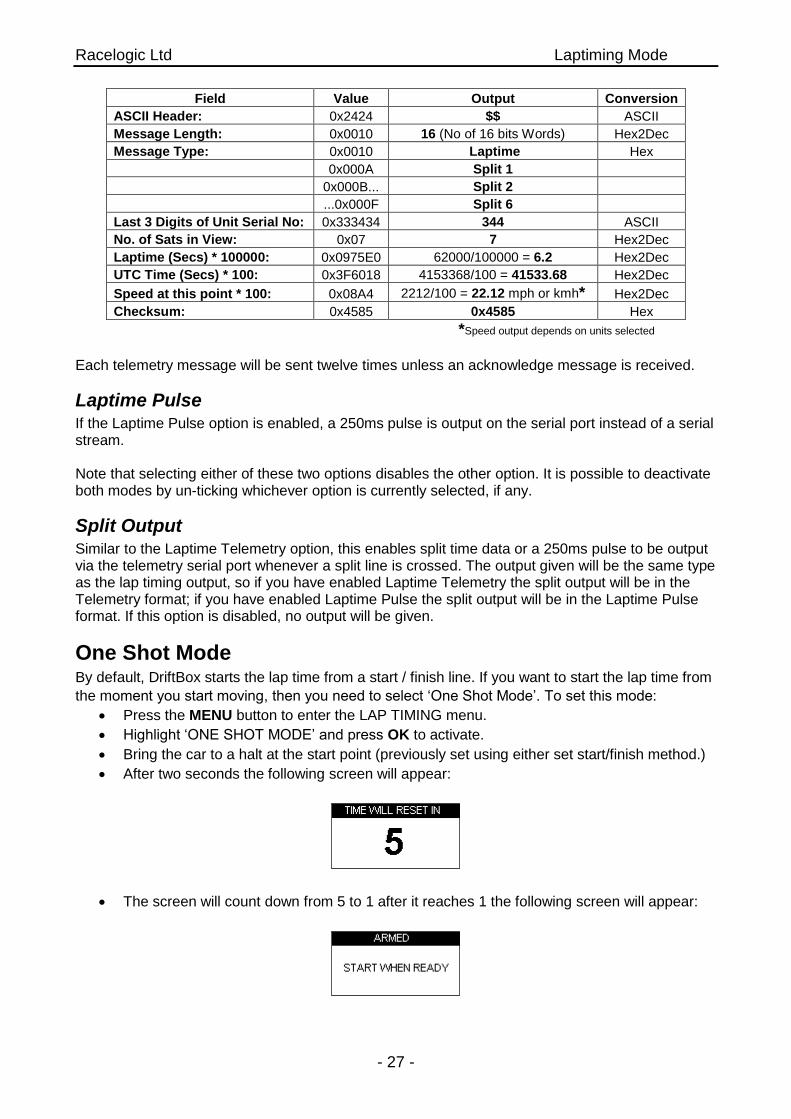
Split to Split Time There are two different ways of measuring split times. The default is from the start of the lap to the
split, the other method is from one split to another. To change between these options, tick or un-
tick the option ‘SPLIT TO SPLIT TIME’ in the DISPLAY OPTIONS menu.
DISPLAY OPTIONS
SPLIT DISPLAY TIME
SPLIT TO SPLIT TIME
BIG SPEED @SPLIT
ROLLING LAP TIME
EXIT
Split Widths When setting a start / finish or split line, DriftBox will set the width of the line at a default value of
25m (12.5m either side of the point at which the OK button was pressed.) However this can be
changed by selecting the Split Widths function and altering the value using the ▲▼ buttons. This
feature is useful if DriftBox is being used on a track where separate sections pass closely by each
other, and eliminates the possibility of going through a split line in the wrong direction.
Clearing your Best Lap time
Press and hold the RESET button for 1.5s.
Laptime Telemetry
COMMS MENU
INPUT MODULE
LAPTIME TELEMETRY
LAPTIME PULSE
DRIFT TELEMETRY
YAW DIAGNOSTICS
EXIT
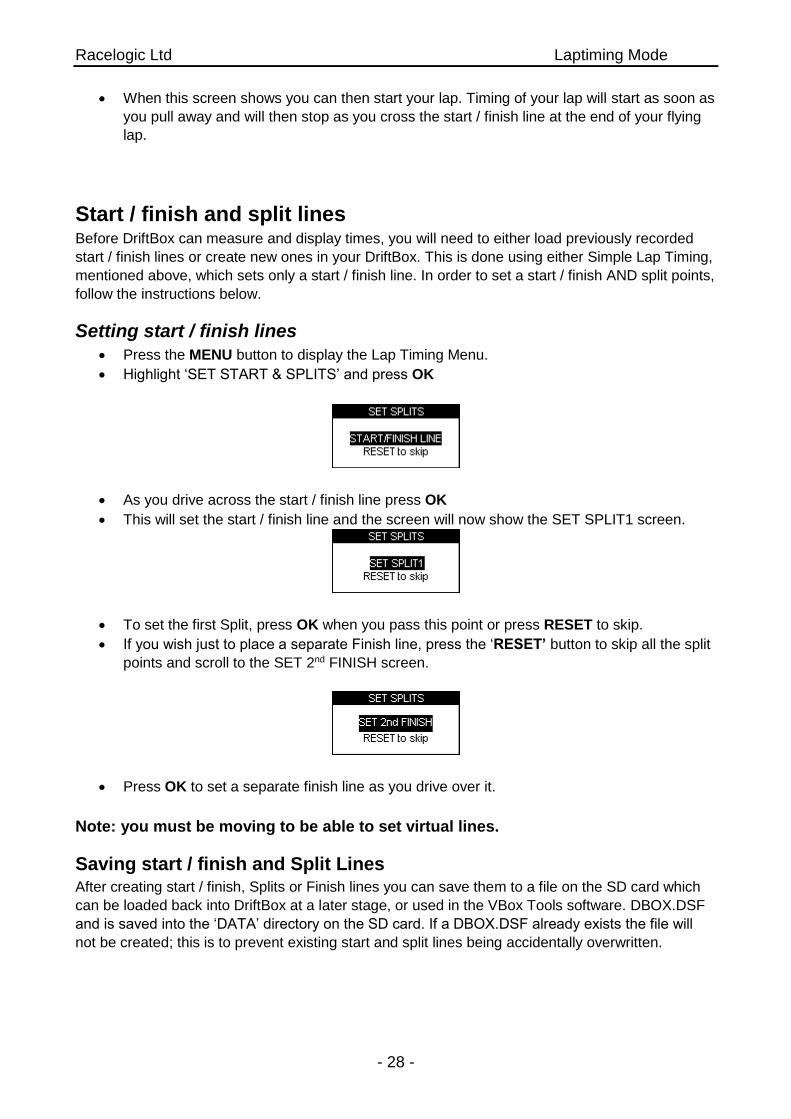
The Laptime Telemetry option makes DriftBox send lap time data via the telemetry serial port whenever a start/finish, split line or dedicated finish line is crossed. The lap time serial stream has the following format, sent at a baud rate of 115200 bit/sec, no parity, 8 data bits and 1 stop bit.
Word No. 0 1 2 3 4 5 6 7 8 9 10 11 12 13 14 15
24 24 00 10 00 10 33 34 34 08 12 76 90 14 E1 B4 22 17 85 9D
24 24 00 10 00 0A 33 34 34 06 99 32 C0 3E D9 B8 08 BD 49 8E
24 24 00 10 00 0B 33 34 34 06 08 B2 90 3E EF FC 07 51 B6 E7
24 24 00 10 00 0C 33 34 34 06 0B 23 90 3F 0C 80 08 C6 6B 17
24 24 00 10 00 0D 33 34 34 05 07 7A 10 3F 1F A4 09 EB 1B 7F
24 24 00 10 00 0E 33 34 34 06 0F B7 70 3F 47 E0 06 B1 FE 57
24 24 00 10 00 0F 33 34 34 07 09 75 E0 3F 60 18 08 A4 45 85
ASCII
Header Message Length
Message Type
Unit Serial No. Sat Laptime (Secs) UTC (Secs) Speed Checksum
Racelogic Ltd Laptiming Mode
- 27 -
Field Value Output Conversion
ASCII Header: 0x2424 $$ ASCII
Message Length: 0x0010 16 (No of 16 bits Words) Hex2Dec
Message Type: 0x0010 Laptime Hex
0x000A Split 1
0x000B... Split 2
...0x000F Split 6
Last 3 Digits of Unit Serial No: 0x333434 344 ASCII
No. of Sats in View: 0x07 7 Hex2Dec
Laptime (Secs) * 100000: 0x0975E0 62000/100000 = 6.2 Hex2Dec
UTC Time (Secs) * 100: 0x3F6018 4153368/100 = 41533.68 Hex2Dec
Speed at this point * 100: 0x08A4 2212/100 = 22.12 mph or kmh* Hex2Dec
Checksum: 0x4585 0x4585 Hex
*Speed output depends on units selected
Each telemetry message will be sent twelve times unless an acknowledge message is received.
Laptime Pulse If the Laptime Pulse option is enabled, a 250ms pulse is output on the serial port instead of a serial stream. Note that selecting either of these two options disables the other option. It is possible to deactivate both modes by un-ticking whichever option is currently selected, if any.
Split Output Similar to the Laptime Telemetry option, this enables split time data or a 250ms pulse to be output via the telemetry serial port whenever a split line is crossed. The output given will be the same type as the lap timing output, so if you have enabled Laptime Telemetry the split output will be in the Telemetry format; if you have enabled Laptime Pulse the split output will be in the Laptime Pulse format. If this option is disabled, no output will be given.
One Shot Mode By default, DriftBox starts the lap time from a start / finish line. If you want to start the lap time from
the moment you start moving, then you need to select ‘One Shot Mode’. To set this mode:
Press the MENU button to enter the LAP TIMING menu.
Highlight ‘ONE SHOT MODE’ and press OK to activate.
Bring the car to a halt at the start point (previously set using either set start/finish method.)
After two seconds the following screen will appear:
The screen will count down from 5 to 1 after it reaches 1 the following screen will appear:
Racelogic Ltd Laptiming Mode
- 28 -
When this screen shows you can then start your lap. Timing of your lap will start as soon as
you pull away and will then stop as you cross the start / finish line at the end of your flying
lap.
Start / finish and split lines Before DriftBox can measure and display times, you will need to either load previously recorded
start / finish lines or create new ones in your DriftBox. This is done using either Simple Lap Timing,
mentioned above, which sets only a start / finish line. In order to set a start / finish AND split points,
follow the instructions below.
Setting start / finish lines
Press the MENU button to display the Lap Timing Menu.
Highlight ‘SET START & SPLITS’ and press OK
As you drive across the start / finish line press OK
This will set the start / finish line and the screen will now show the SET SPLIT1 screen.
To set the first Split, press OK when you pass this point or press RESET to skip.
If you wish just to place a separate Finish line, press the ‘RESET’ button to skip all the split
points and scroll to the SET 2nd FINISH screen.
Press OK to set a separate finish line as you drive over it.
Note: you must be moving to be able to set virtual lines.
Saving start / finish and Split Lines After creating start / finish, Splits or Finish lines you can save them to a file on the SD card which
can be loaded back into DriftBox at a later stage, or used in the VBox Tools software. DBOX.DSF
and is saved into the ‘DATA’ directory on the SD card. If a DBOX.DSF already exists the file will
not be created; this is to prevent existing start and split lines being accidentally overwritten.
Racelogic Ltd Laptiming Mode
- 29 -
To Save the lines you have created:
Ensure the SD card is inserted.
Press the MENU button to enter the Lap timing menu.
Highlight the SAVE SPLITS option and press OK
Loading start / finish and split Lines You can load start and split line information from a file stored on the SD card into your DriftBox. By
default the DriftBox looks for a file it has saved out; DBOX.DSF in the „DATA‟ directory. If no
DBOX.DSF file is found the DriftBox will look for a „DSF‟ directory and display a list of all *.DSF
files in that directory. This facility allows you to keep a library of split lines files on the DriftBox from
multiple test areas or circuits.
To Load a split line file:
Press the MENU button to enter the Lap timing menu.
Highlight ‘START & SPLITS’ and press OK
Highlight the ‘LOAD SPLITS’ option and press OK
Clearing start / finish and split Lines This option will erase the split line information from the DriftBox memory, not from the SD card.
Split line information remains in the DriftBox memory until they are either cleared or re-entered,
even if the unit is power cycled.
Press the MENU button to enter the Lap timing menu.
Highlight ‘START & SPLITS’ and press OK
Highlight the ‘LOAD SPLITS’ option and press OK
Recording and Reviewing Lap and Split Times To record your run data and lap and split times, simply insert a SD card into DriftBox, the run data
will be recorded in a ‘.dbn’ file on the SD card and the Lap Time information will be recorded in a
text file e.g. ‘Laps-01’.txt’
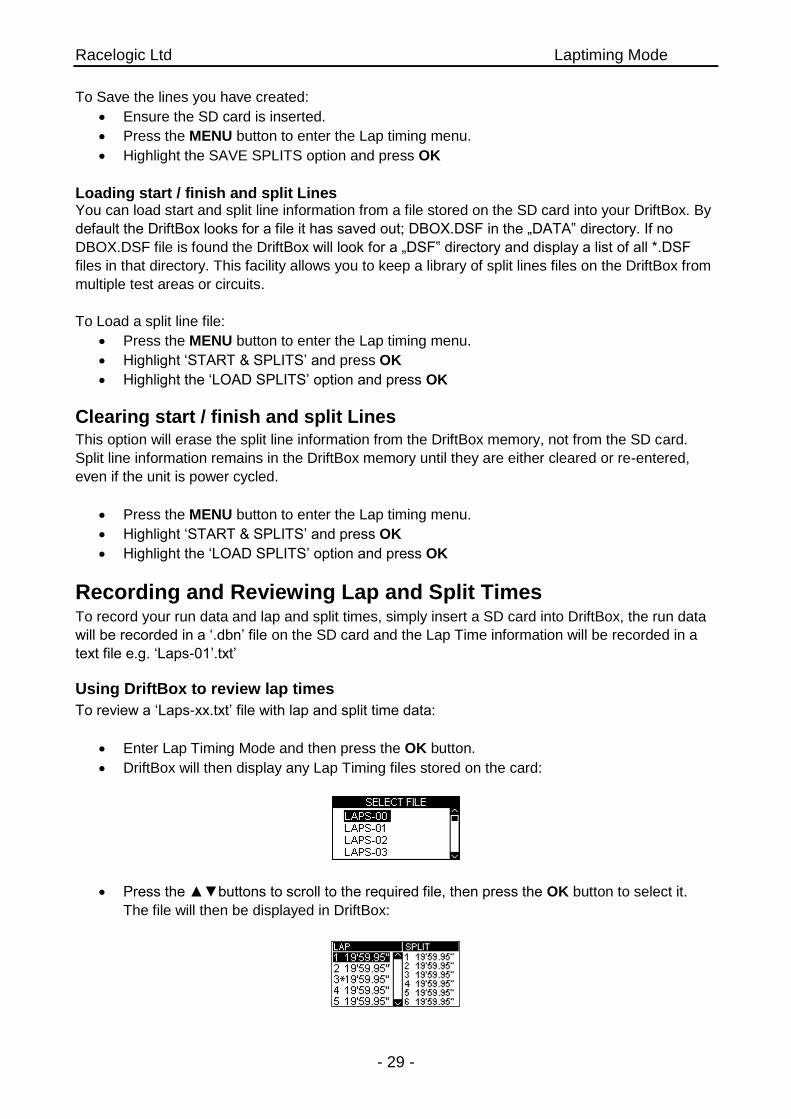
Using DriftBox to review lap times
To review a ‘Laps-xx.txt’ file with lap and split time data:
Enter Lap Timing Mode and then press the OK button.
DriftBox will then display any Lap Timing files stored on the card:
Press the ▲▼buttons to scroll to the required file, then press the OK button to select it.
The file will then be displayed in DriftBox:

Racelogic Ltd Laptiming Mode
- 30 -
In each file, the best lap is indicated with an asterisk. To change the lap for which split times are
displayed, use the▲▼ buttons to scroll between the laps; the split times will update automatically.
Pressing the OK button in this screen will return you to the Lap Timing Mode’s main screen.
Racelogic Ltd Laptiming Mode
- 31 -
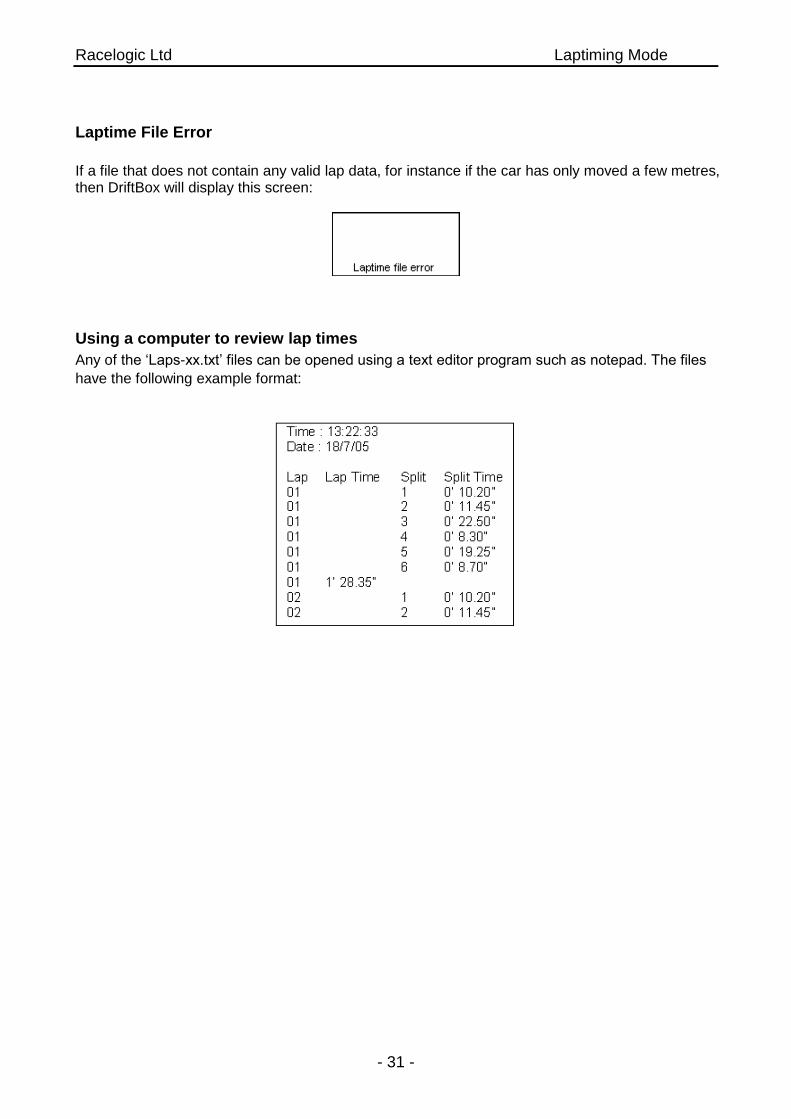
Laptime File Error
If a file that does not contain any valid lap data, for instance if the car has only moved a few metres, then DriftBox will display this screen:
Using a computer to review lap times
Any of the ‘Laps-xx.txt’ files can be opened using a text editor program such as notepad. The files
have the following example format:
Racelogic Ltd Speed Display Mode
- 32 -
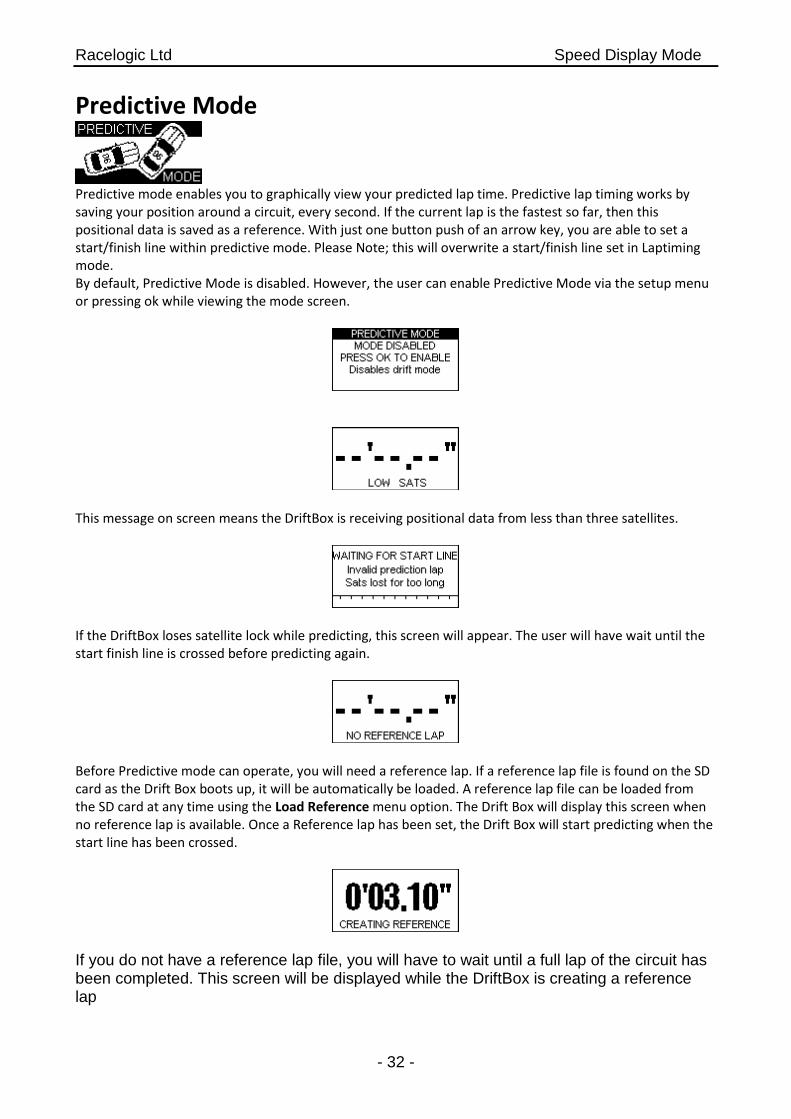
Predictive Mode
Predictive mode enables you to graphically view your predicted lap time. Predictive lap timing works by saving your position around a circuit, every second. If the current lap is the fastest so far, then this positional data is saved as a reference. With just one button push of an arrow key, you are able to set a start/finish line within predictive mode. Please Note; this will overwrite a start/finish line set in Laptiming mode. By default, Predictive Mode is disabled. However, the user can enable Predictive Mode via the setup menu or pressing ok while viewing the mode screen.
This message on screen means the DriftBox is receiving positional data from less than three satellites.
If the DriftBox loses satellite lock while predicting, this screen will appear. The user will have wait until the start finish line is crossed before predicting again.
Before Predictive mode can operate, you will need a reference lap. If a reference lap file is found on the SD card as the Drift Box boots up, it will be automatically be loaded. A reference lap file can be loaded from the SD card at any time using the Load Reference menu option. The Drift Box will display this screen when no reference lap is available. Once a Reference lap has been set, the Drift Box will start predicting when the start line has been crossed.
If you do not have a reference lap file, you will have to wait until a full lap of the circuit has been completed. This screen will be displayed while the DriftBox is creating a reference lap
Racelogic Ltd Speed Display Mode
- 33 -
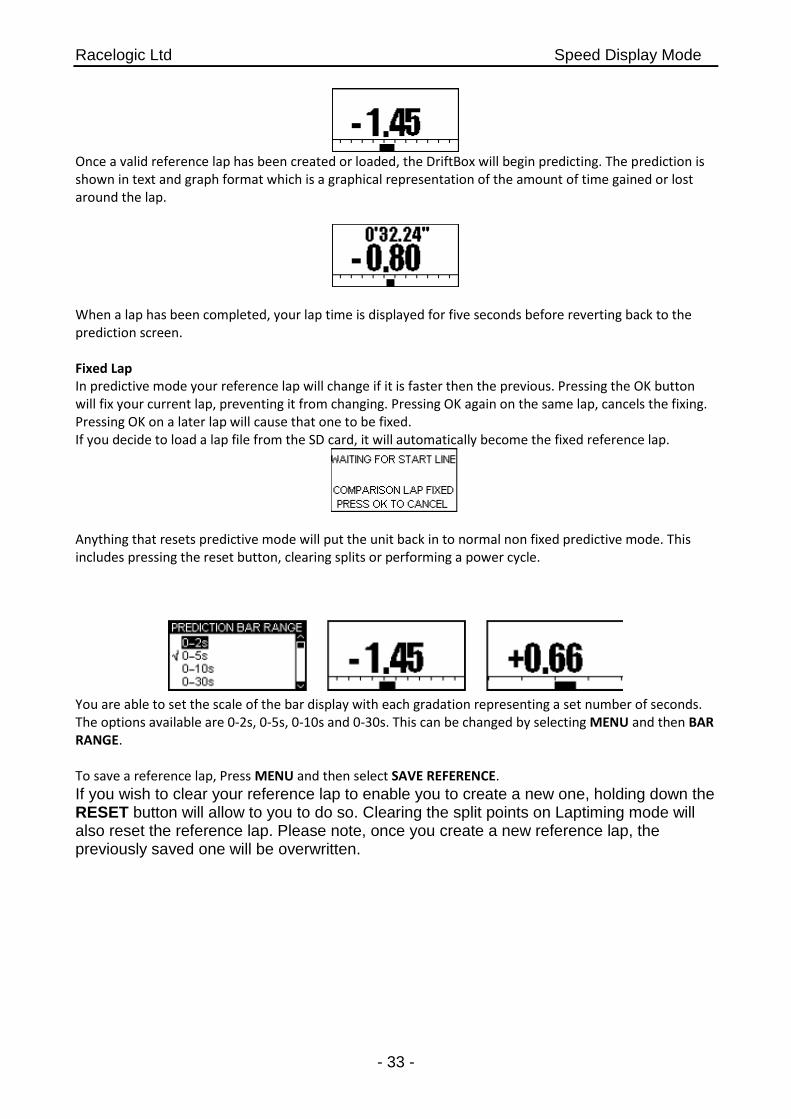
Once a valid reference lap has been created or loaded, the DriftBox will begin predicting. The prediction is shown in text and graph format which is a graphical representation of the amount of time gained or lost around the lap.
When a lap has been completed, your lap time is displayed for five seconds before reverting back to the prediction screen. Fixed Lap In predictive mode your reference lap will change if it is faster then the previous. Pressing the OK button will fix your current lap, preventing it from changing. Pressing OK again on the same lap, cancels the fixing. Pressing OK on a later lap will cause that one to be fixed. If you decide to load a lap file from the SD card, it will automatically become the fixed reference lap.
Anything that resets predictive mode will put the unit back in to normal non fixed predictive mode. This includes pressing the reset button, clearing splits or performing a power cycle.
You are able to set the scale of the bar display with each gradation representing a set number of seconds. The options available are 0-2s, 0-5s, 0-10s and 0-30s. This can be changed by selecting MENU and then BAR RANGE. To save a reference lap, Press MENU and then select SAVE REFERENCE.
If you wish to clear your reference lap to enable you to create a new one, holding down the RESET button will allow to you to do so. Clearing the split points on Laptiming mode will also reset the reference lap. Please note, once you create a new reference lap, the previously saved one will be overwritten.
Racelogic Ltd Speed Display Mode
- 34 -
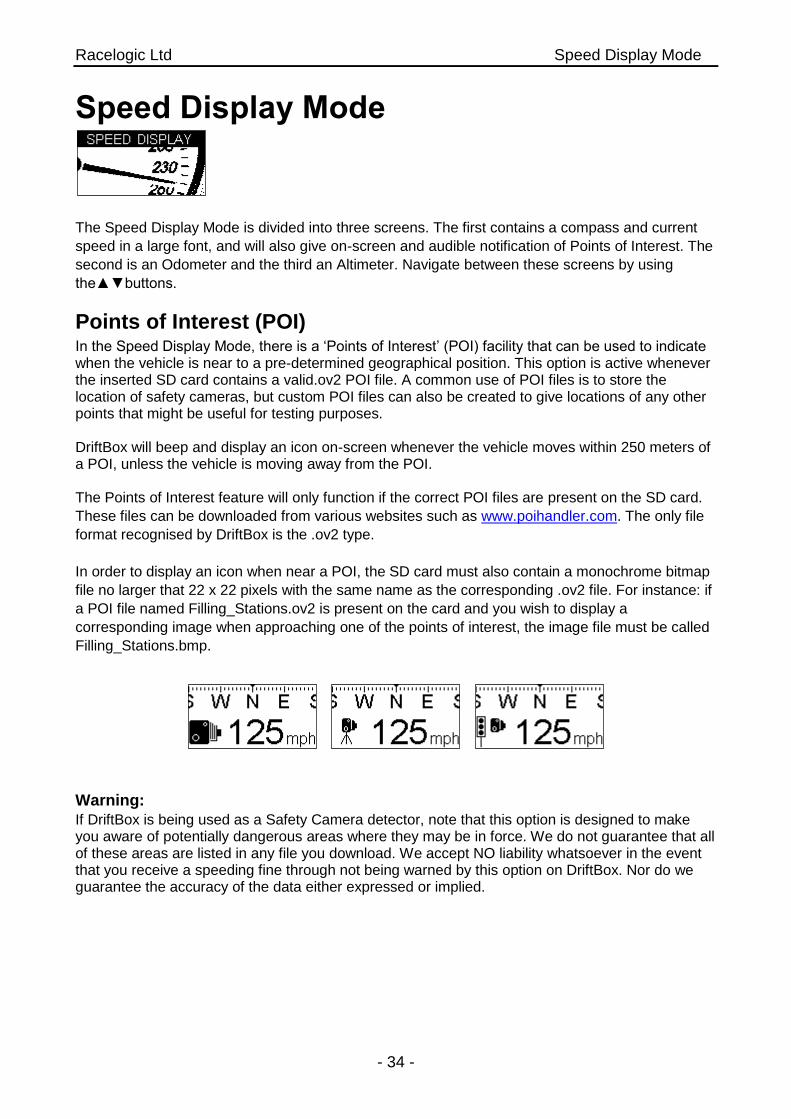
Speed Display Mode
The Speed Display Mode is divided into three screens. The first contains a compass and current
speed in a large font, and will also give on-screen and audible notification of Points of Interest. The
second is an Odometer and the third an Altimeter. Navigate between these screens by using
the▲▼buttons.
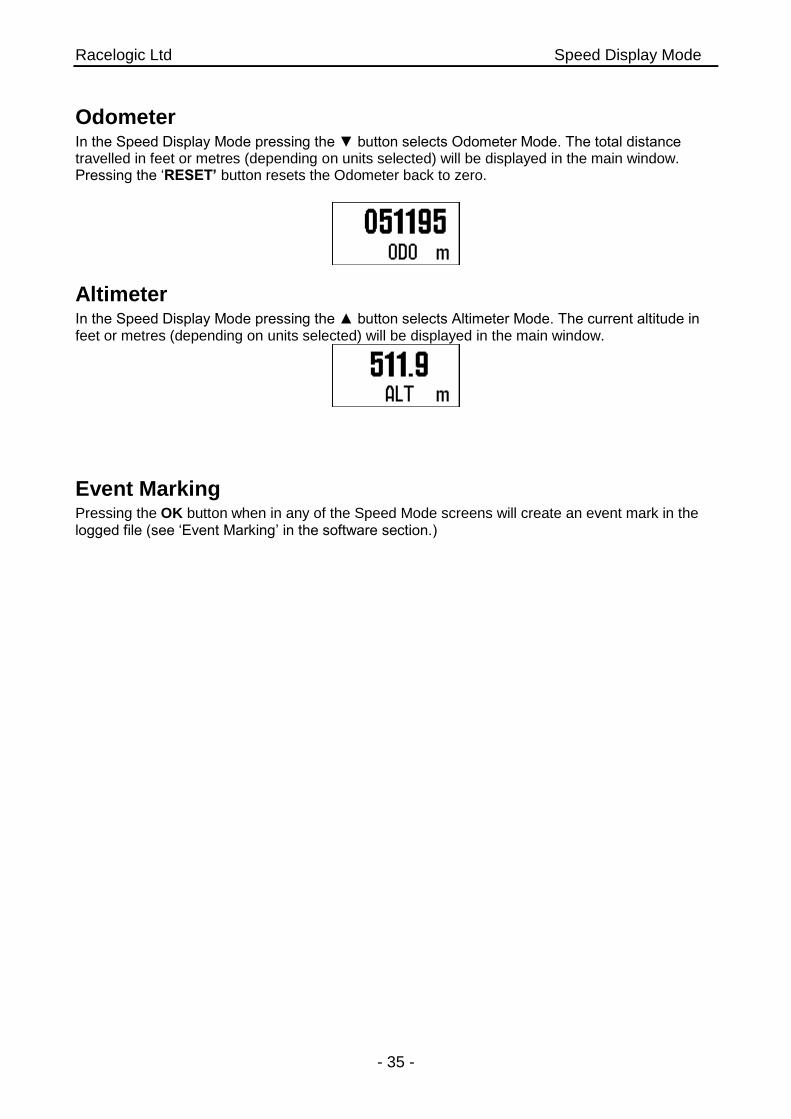
Points of Interest (POI) In the Speed Display Mode, there is a ‘Points of Interest’ (POI) facility that can be used to indicate when the vehicle is near to a pre-determined geographical position. This option is active whenever the inserted SD card contains a valid.ov2 POI file. A common use of POI files is to store the location of safety cameras, but custom POI files can also be created to give locations of any other points that might be useful for testing purposes. DriftBox will beep and display an icon on-screen whenever the vehicle moves within 250 meters of a POI, unless the vehicle is moving away from the POI. The Points of Interest feature will only function if the correct POI files are present on the SD card.
These files can be downloaded from various websites such as www.poihandler.com. The only file
format recognised by DriftBox is the .ov2 type.
In order to display an icon when near a POI, the SD card must also contain a monochrome bitmap
file no larger that 22 x 22 pixels with the same name as the corresponding .ov2 file. For instance: if
a POI file named Filling_Stations.ov2 is present on the card and you wish to display a
corresponding image when approaching one of the points of interest, the image file must be called
Filling_Stations.bmp.
Warning:
If DriftBox is being used as a Safety Camera detector, note that this option is designed to make you aware of potentially dangerous areas where they may be in force. We do not guarantee that all of these areas are listed in any file you download. We accept NO liability whatsoever in the event that you receive a speeding fine through not being warned by this option on DriftBox. Nor do we guarantee the accuracy of the data either expressed or implied.
Racelogic Ltd Speed Display Mode
- 35 -
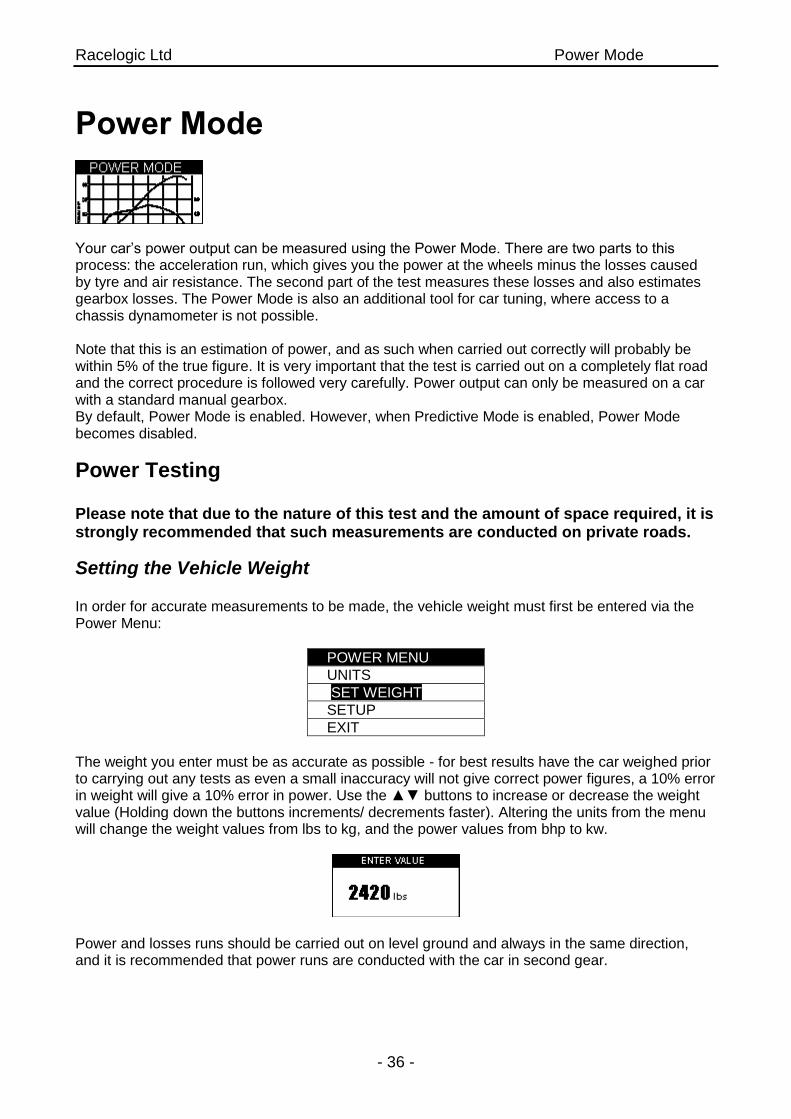
Odometer In the Speed Display Mode pressing the ▼ button selects Odometer Mode. The total distance travelled in feet or metres (depending on units selected) will be displayed in the main window. Pressing the ‘RESET’ button resets the Odometer back to zero.
Altimeter In the Speed Display Mode pressing the ▲ button selects Altimeter Mode. The current altitude in feet or metres (depending on units selected) will be displayed in the main window.
Event Marking Pressing the OK button when in any of the Speed Mode screens will create an event mark in the logged file (see ‘Event Marking’ in the software section.)
Racelogic Ltd Power Mode
- 36 -
Power Mode
Your car’s power output can be measured using the Power Mode. There are two parts to this process: the acceleration run, which gives you the power at the wheels minus the losses caused by tyre and air resistance. The second part of the test measures these losses and also estimates gearbox losses. The Power Mode is also an additional tool for car tuning, where access to a chassis dynamometer is not possible. Note that this is an estimation of power, and as such when carried out correctly will probably be within 5% of the true figure. It is very important that the test is carried out on a completely flat road and the correct procedure is followed very carefully. Power output can only be measured on a car with a standard manual gearbox. By default, Power Mode is enabled. However, when Predictive Mode is enabled, Power Mode becomes disabled.
Power Testing Please note that due to the nature of this test and the amount of space required, it is strongly recommended that such measurements are conducted on private roads.
Setting the Vehicle Weight
In order for accurate measurements to be made, the vehicle weight must first be entered via the Power Menu:
POWER MENU
UNITS
SET WEIGHT
SETUP
EXIT
The weight you enter must be as accurate as possible - for best results have the car weighed prior to carrying out any tests as even a small inaccuracy will not give correct power figures, a 10% error in weight will give a 10% error in power. Use the ▲▼ buttons to increase or decrease the weight value (Holding down the buttons increments/ decrements faster). Altering the units from the menu will change the weight values from lbs to kg, and the power values from bhp to kw.
Power and losses runs should be carried out on level ground and always in the same direction, and it is recommended that power runs are conducted with the car in second gear.
Racelogic Ltd Power Mode
- 37 -
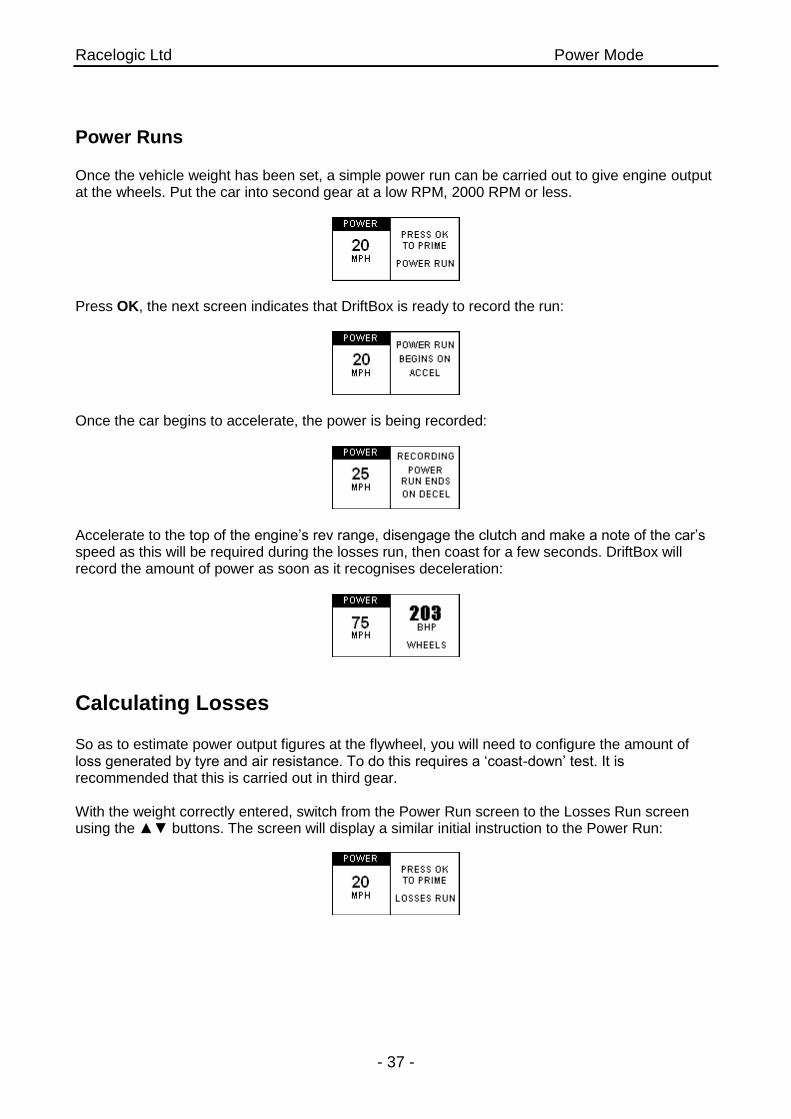
Power Runs
Once the vehicle weight has been set, a simple power run can be carried out to give engine output at the wheels. Put the car into second gear at a low RPM, 2000 RPM or less.
Press OK, the next screen indicates that DriftBox is ready to record the run:
Once the car begins to accelerate, the power is being recorded:
Accelerate to the top of the engine’s rev range, disengage the clutch and make a note of the car’s speed as this will be required during the losses run, then coast for a few seconds. DriftBox will record the amount of power as soon as it recognises deceleration:
Calculating Losses So as to estimate power output figures at the flywheel, you will need to configure the amount of loss generated by tyre and air resistance. To do this requires a ‘coast-down’ test. It is recommended that this is carried out in third gear. With the weight correctly entered, switch from the Power Run screen to the Losses Run screen using the ▲▼ buttons. The screen will display a similar initial instruction to the Power Run:
Racelogic Ltd Power Mode
- 38 -
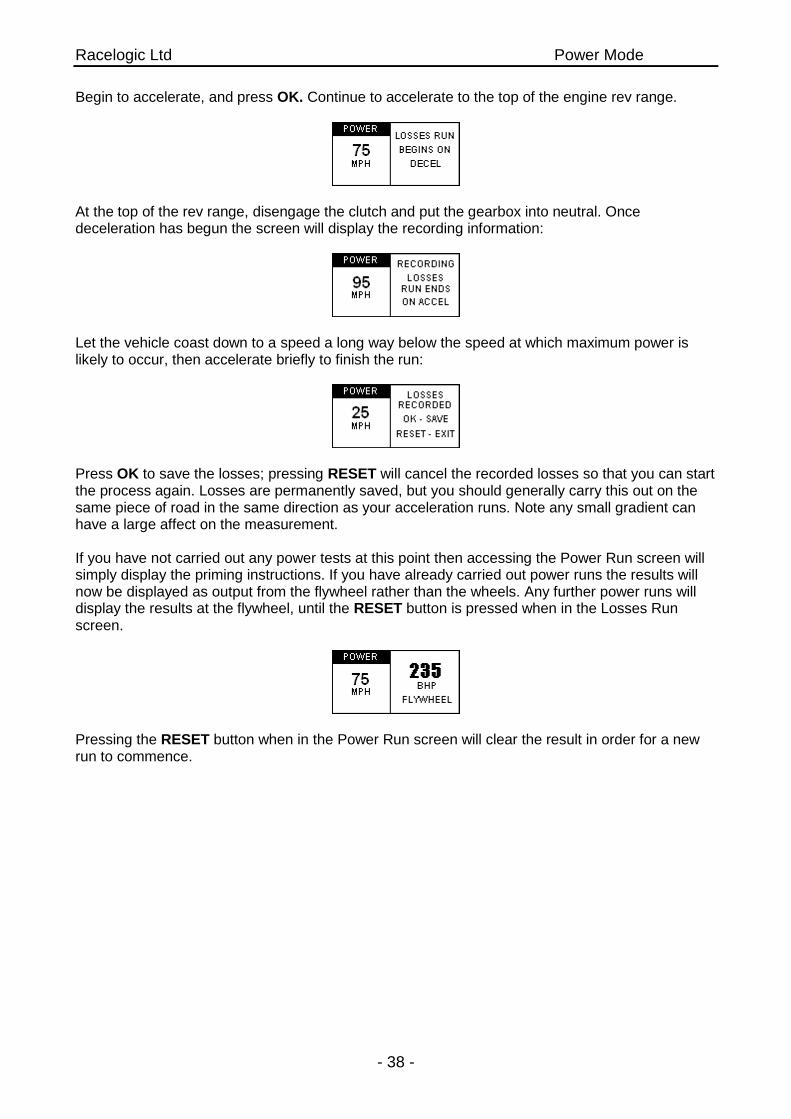
Begin to accelerate, and press OK. Continue to accelerate to the top of the engine rev range.
At the top of the rev range, disengage the clutch and put the gearbox into neutral. Once deceleration has begun the screen will display the recording information:
Let the vehicle coast down to a speed a long way below the speed at which maximum power is likely to occur, then accelerate briefly to finish the run:
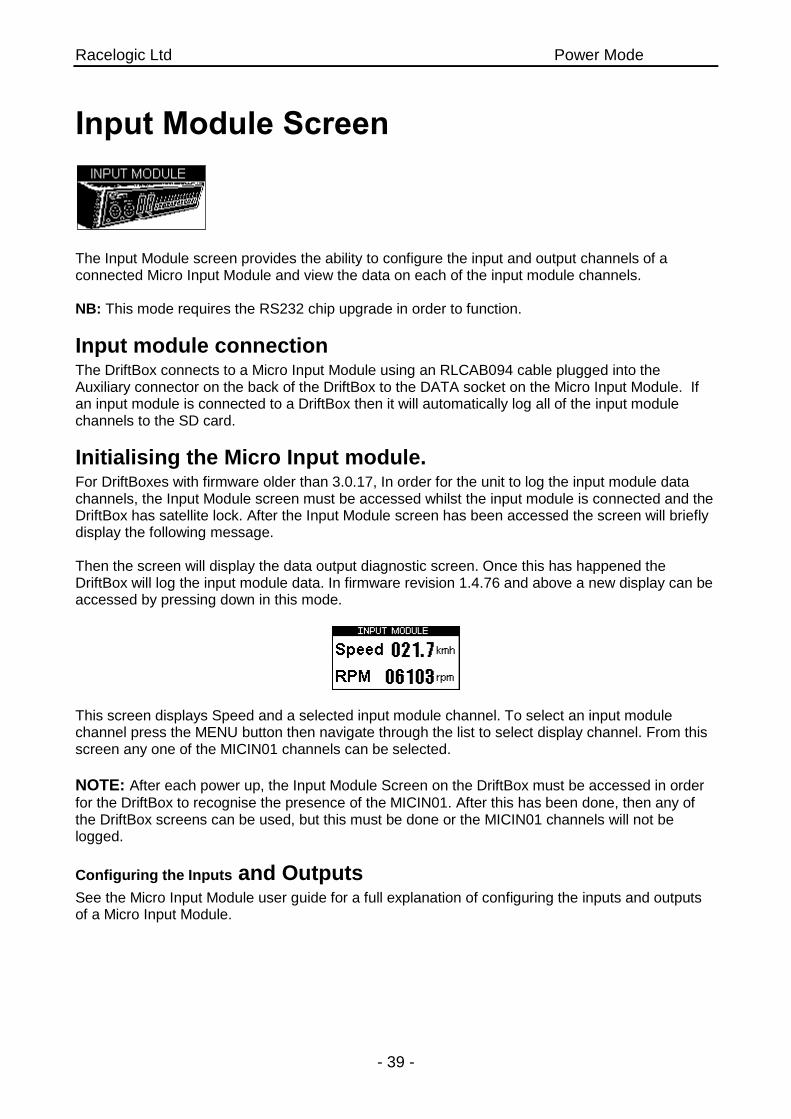
Press OK to save the losses; pressing RESET will cancel the recorded losses so that you can start the process again. Losses are permanently saved, but you should generally carry this out on the same piece of road in the same direction as your acceleration runs. Note any small gradient can have a large affect on the measurement. If you have not carried out any power tests at this point then accessing the Power Run screen will simply display the priming instructions. If you have already carried out power runs the results will now be displayed as output from the flywheel rather than the wheels. Any further power runs will display the results at the flywheel, until the RESET button is pressed when in the Losses Run screen.
Pressing the RESET button when in the Power Run screen will clear the result in order for a new run to commence.
Racelogic Ltd Power Mode
- 39 -
Input Module Screen
The Input Module screen provides the ability to configure the input and output channels of a connected Micro Input Module and view the data on each of the input module channels. NB: This mode requires the RS232 chip upgrade in order to function.
Input module connection The DriftBox connects to a Micro Input Module using an RLCAB094 cable plugged into the Auxiliary connector on the back of the DriftBox to the DATA socket on the Micro Input Module. If an input module is connected to a DriftBox then it will automatically log all of the input module channels to the SD card.
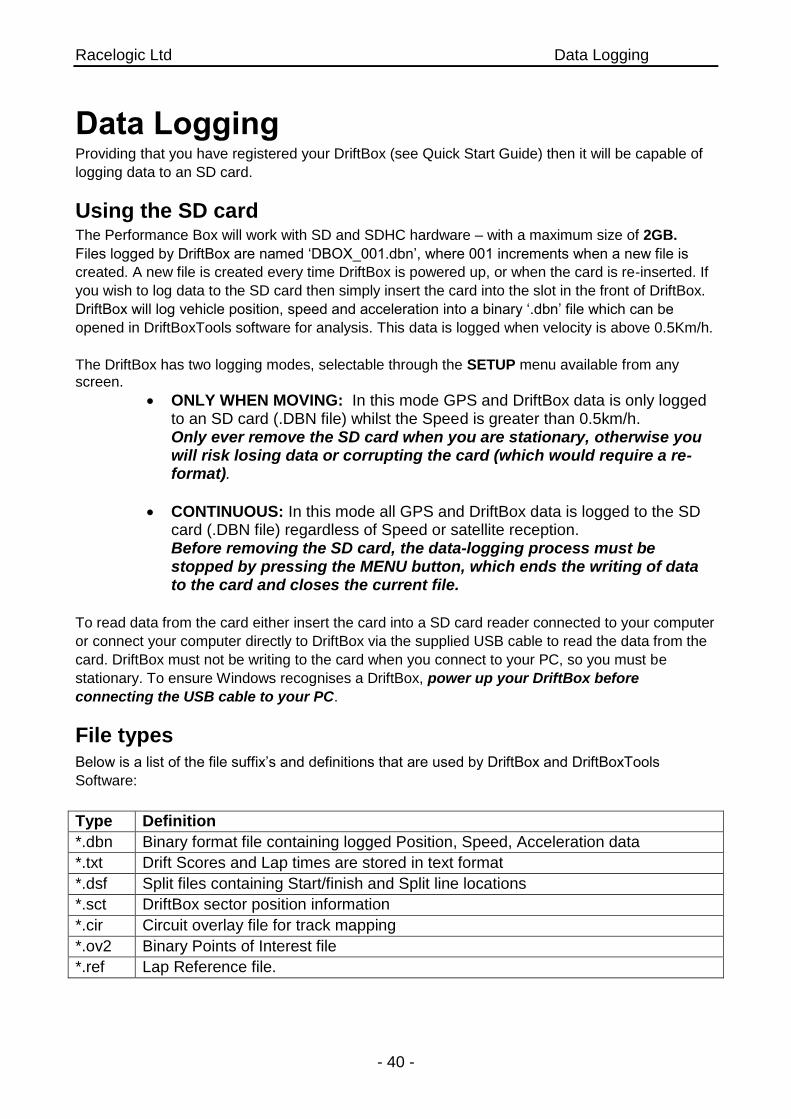
Initialising the Micro Input module. For DriftBoxes with firmware older than 3.0.17, In order for the unit to log the input module data channels, the Input Module screen must be accessed whilst the input module is connected and the DriftBox has satellite lock. After the Input Module screen has been accessed the screen will briefly display the following message. Then the screen will display the data output diagnostic screen. Once this has happened the DriftBox will log the input module data. In firmware revision 1.4.76 and above a new display can be accessed by pressing down in this mode.
This screen displays Speed and a selected input module channel. To select an input module channel press the MENU button then navigate through the list to select display channel. From this screen any one of the MICIN01 channels can be selected.
NOTE: After each power up, the Input Module Screen on the DriftBox must be accessed in order
for the DriftBox to recognise the presence of the MICIN01. After this has been done, then any of the DriftBox screens can be used, but this must be done or the MICIN01 channels will not be logged.
Configuring the Inputs and Outputs See the Micro Input Module user guide for a full explanation of configuring the inputs and outputs of a Micro Input Module.
Racelogic Ltd Data Logging
- 40 -
Data Logging Providing that you have registered your DriftBox (see Quick Start Guide) then it will be capable of
logging data to an SD card.
Using the SD card The Performance Box will work with SD and SDHC hardware – with a maximum size of 2GB.
Files logged by DriftBox are named ‘DBOX_001.dbn’, where 001 increments when a new file is
created. A new file is created every time DriftBox is powered up, or when the card is re-inserted. If
you wish to log data to the SD card then simply insert the card into the slot in the front of DriftBox.
DriftBox will log vehicle position, speed and acceleration into a binary ‘.dbn’ file which can be
opened in DriftBoxTools software for analysis. This data is logged when velocity is above 0.5Km/h.
The DriftBox has two logging modes, selectable through the SETUP menu available from any screen.
ONLY WHEN MOVING: In this mode GPS and DriftBox data is only logged to an SD card (.DBN file) whilst the Speed is greater than 0.5km/h. Only ever remove the SD card when you are stationary, otherwise you will risk losing data or corrupting the card (which would require a re-format).
CONTINUOUS: In this mode all GPS and DriftBox data is logged to the SD card (.DBN file) regardless of Speed or satellite reception. Before removing the SD card, the data-logging process must be stopped by pressing the MENU button, which ends the writing of data to the card and closes the current file.
To read data from the card either insert the card into a SD card reader connected to your computer
or connect your computer directly to DriftBox via the supplied USB cable to read the data from the
card. DriftBox must not be writing to the card when you connect to your PC, so you must be
stationary. To ensure Windows recognises a DriftBox, power up your DriftBox before
connecting the USB cable to your PC.
File types Below is a list of the file suffix’s and definitions that are used by DriftBox and DriftBoxTools
Software:
Type Definition
*.dbn Binary format file containing logged Position, Speed, Acceleration data
*.txt Drift Scores and Lap times are stored in text format
*.dsf Split files containing Start/finish and Split line locations
*.sct DriftBox sector position information
*.cir Circuit overlay file for track mapping
*.ov2 Binary Points of Interest file
*.ref Lap Reference file.
Racelogic Ltd Connecting DriftBox to external devices
- 41 -
Connecting DriftBox to external devices
Drift Data output DriftBox transmits live data on its serial port at the rear of the DriftBox when it is in Drift Mode. Any
other devices with a serial input, such as a video overlay unit, can use this data. A serial output
cable will be required (part number RLCAB032), please see the DriftBox website or contact your
local supplier for details.
In Drift Practice Mode, the RS232 serial port outputs the following message at 115200bps at 10Hz
intervals:
$DBOX,sss.s,±gg.g,±ll.l,±ddd.d,pp.p<CR><LF>
sss.s = speed in kmh
±gg.g = g-force in g (lateral)
±ll.l = g-force in g (longitudinal)
±ddd.d = drift angle
pp.p = points
Note: ensure that the ‘Sectors’ option has not been selected, as the output when in this
mode is different.
NMEA data output* When DriftBox diagnostic mode is active the DriftBox serial port outputs NMEA standard format
GPS information. This makes it directly compatible for use as GPS input to mapping software
programs for navigation use, such as Microsoft’s Streets and Trips, Route 66 or similar software. A
serial output cable will be required (part number RLCAB040), please see the DriftBox website or
contact your local supplier for details. NMEA data is output at a baud rate of 4800bps.
*Please note this function is not supported on units purchased after August 2012, for more
information contact [email protected]
Racelogic Ltd Upgrading Firmware
- 42 -
Setup Menu There is a single Setup Menu that is accessible in all of the DriftBox’s modes.
To access the Setup Menu, press the MENU button in any mode and select the ‘SETUP’ option
and press OK
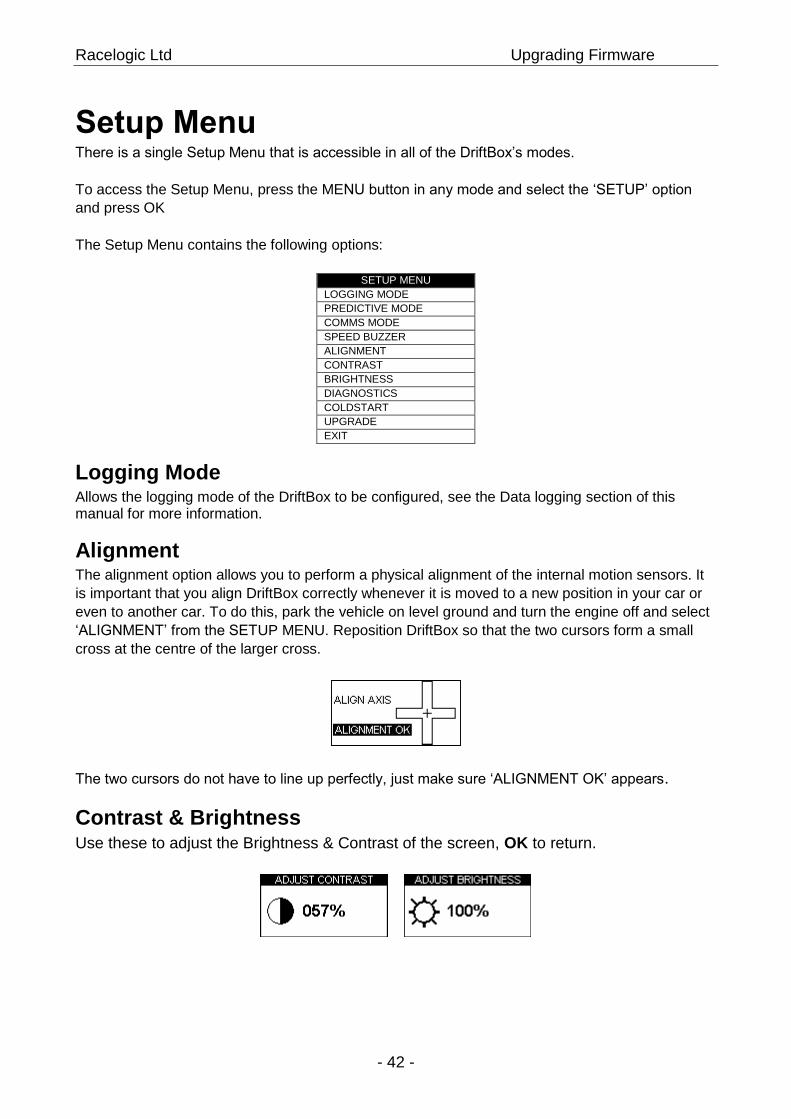
The Setup Menu contains the following options:
SETUP MENU
LOGGING MODE
PREDICTIVE MODE
COMMS MODE
SPEED BUZZER
ALIGNMENT
CONTRAST
BRIGHTNESS
DIAGNOSTICS
COLDSTART
UPGRADE
EXIT
Logging Mode Allows the logging mode of the DriftBox to be configured, see the Data logging section of this manual for more information.
Alignment The alignment option allows you to perform a physical alignment of the internal motion sensors. It
is important that you align DriftBox correctly whenever it is moved to a new position in your car or
even to another car. To do this, park the vehicle on level ground and turn the engine off and select
‘ALIGNMENT’ from the SETUP MENU. Reposition DriftBox so that the two cursors form a small
cross at the centre of the larger cross.
The two cursors do not have to line up perfectly, just make sure ‘ALIGNMENT OK’ appears.
Contrast & Brightness Use these to adjust the Brightness & Contrast of the screen, OK to return.
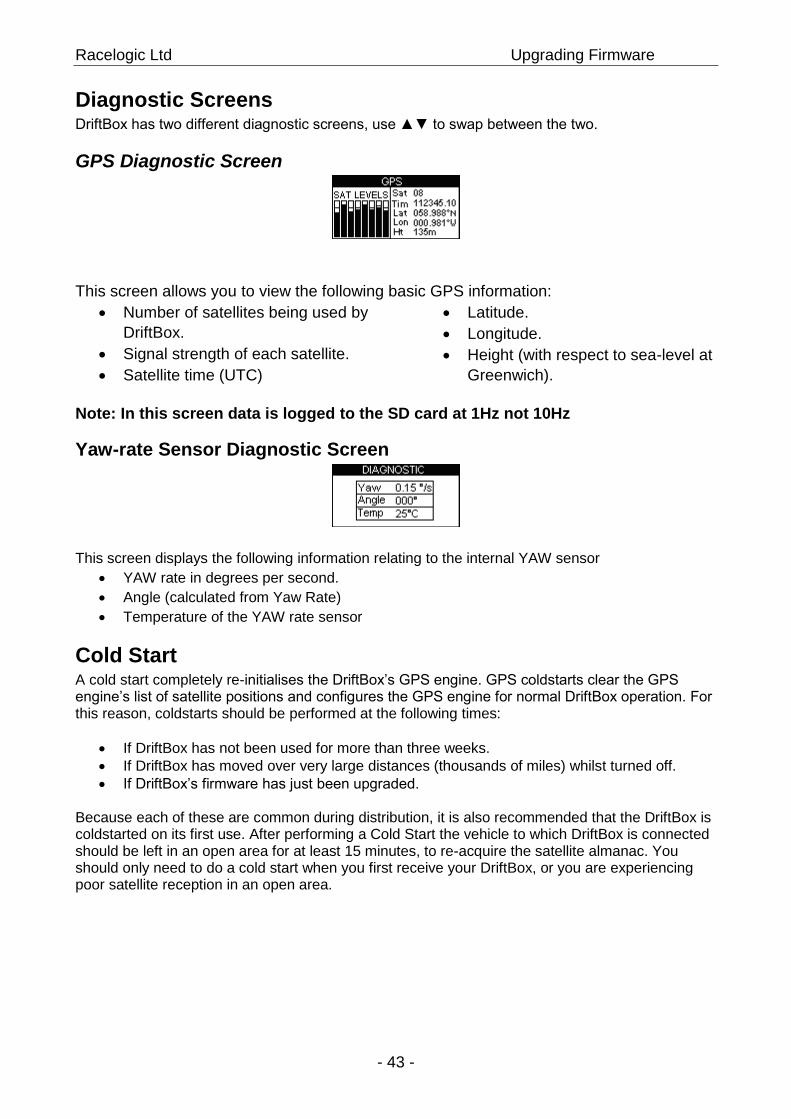
Racelogic Ltd Upgrading Firmware
- 43 -
Diagnostic Screens DriftBox has two different diagnostic screens, use ▲▼ to swap between the two.
GPS Diagnostic Screen
This screen allows you to view the following basic GPS information:
Number of satellites being used by
DriftBox.
Signal strength of each satellite.
Satellite time (UTC)
Latitude.
Longitude.
Height (with respect to sea-level at
Greenwich).
Note: In this screen data is logged to the SD card at 1Hz not 10Hz
Yaw-rate Sensor Diagnostic Screen
This screen displays the following information relating to the internal YAW sensor
YAW rate in degrees per second.
Angle (calculated from Yaw Rate)
Temperature of the YAW rate sensor
Cold Start A cold start completely re-initialises the DriftBox’s GPS engine. GPS coldstarts clear the GPS engine’s list of satellite positions and configures the GPS engine for normal DriftBox operation. For this reason, coldstarts should be performed at the following times:
If DriftBox has not been used for more than three weeks.
If DriftBox has moved over very large distances (thousands of miles) whilst turned off.
If DriftBox’s firmware has just been upgraded. Because each of these are common during distribution, it is also recommended that the DriftBox is coldstarted on its first use. After performing a Cold Start the vehicle to which DriftBox is connected should be left in an open area for at least 15 minutes, to re-acquire the satellite almanac. You should only need to do a cold start when you first receive your DriftBox, or you are experiencing poor satellite reception in an open area.
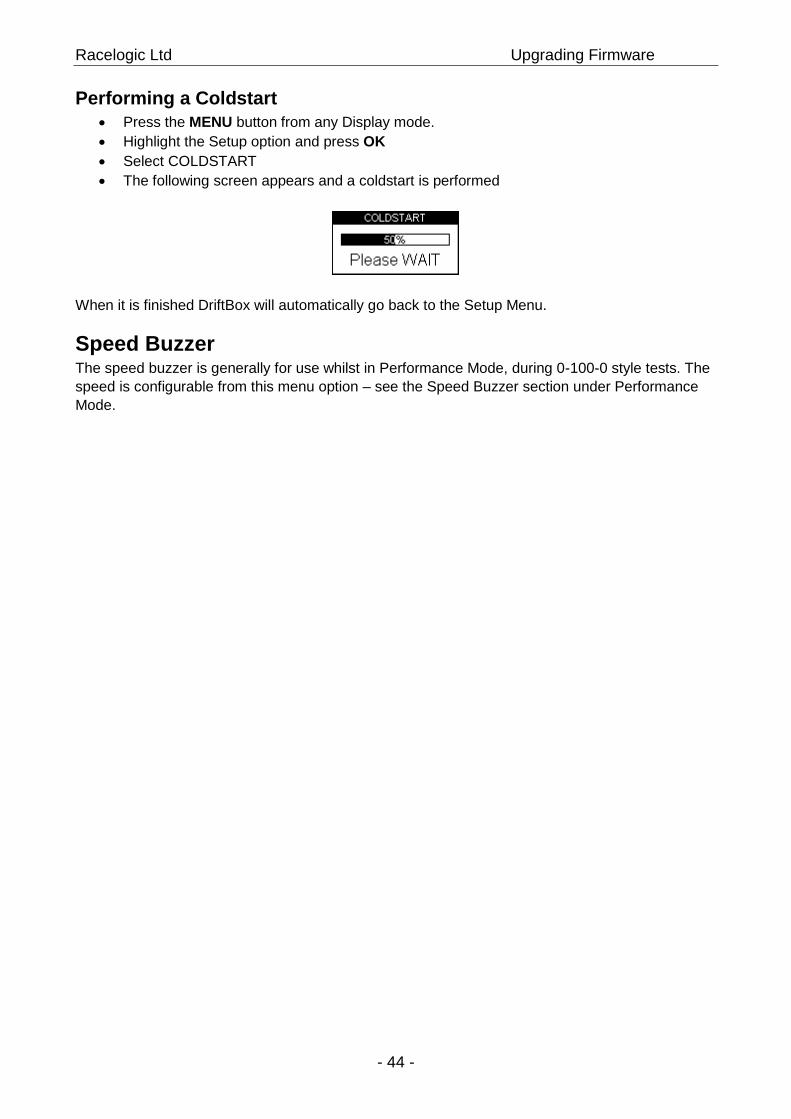
Racelogic Ltd Upgrading Firmware
- 44 -
Performing a Coldstart
Press the MENU button from any Display mode.
Highlight the Setup option and press OK
Select COLDSTART
The following screen appears and a coldstart is performed
When it is finished DriftBox will automatically go back to the Setup Menu.
Speed Buzzer The speed buzzer is generally for use whilst in Performance Mode, during 0-100-0 style tests. The
speed is configurable from this menu option – see the Speed Buzzer section under Performance
Mode.
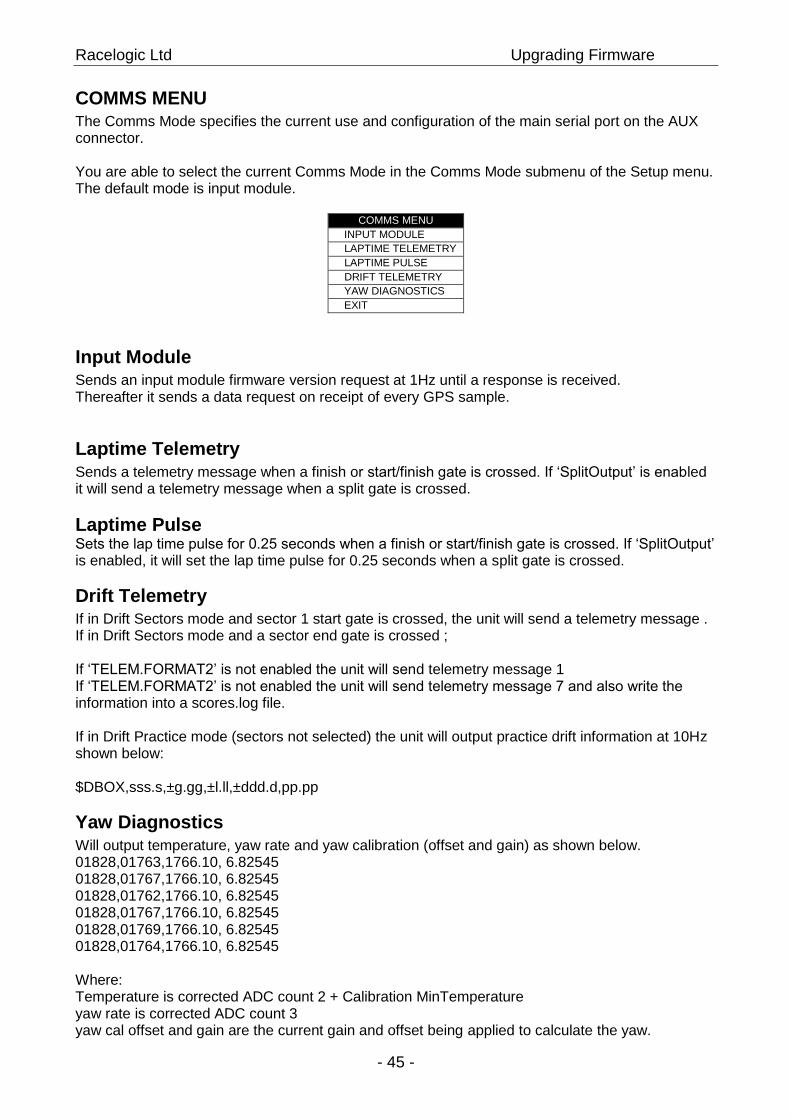
Racelogic Ltd Upgrading Firmware
- 45 -
COMMS MENU The Comms Mode specifies the current use and configuration of the main serial port on the AUX connector. You are able to select the current Comms Mode in the Comms Mode submenu of the Setup menu. The default mode is input module.
COMMS MENU
INPUT MODULE
LAPTIME TELEMETRY
LAPTIME PULSE
DRIFT TELEMETRY
YAW DIAGNOSTICS
EXIT
Input Module Sends an input module firmware version request at 1Hz until a response is received. Thereafter it sends a data request on receipt of every GPS sample.
Laptime Telemetry Sends a telemetry message when a finish or start/finish gate is crossed. If ‘SplitOutput’ is enabled it will send a telemetry message when a split gate is crossed.
Laptime Pulse Sets the lap time pulse for 0.25 seconds when a finish or start/finish gate is crossed. If ‘SplitOutput’ is enabled, it will set the lap time pulse for 0.25 seconds when a split gate is crossed.
Drift Telemetry If in Drift Sectors mode and sector 1 start gate is crossed, the unit will send a telemetry message . If in Drift Sectors mode and a sector end gate is crossed ; If ‘TELEM.FORMAT2’ is not enabled the unit will send telemetry message 1 If ‘TELEM.FORMAT2’ is not enabled the unit will send telemetry message 7 and also write the information into a scores.log file. If in Drift Practice mode (sectors not selected) the unit will output practice drift information at 10Hz shown below: $DBOX,sss.s,±g.gg,±l.ll,±ddd.d,pp.pp
Yaw Diagnostics Will output temperature, yaw rate and yaw calibration (offset and gain) as shown below. 01828,01763,1766.10, 6.82545 01828,01767,1766.10, 6.82545 01828,01762,1766.10, 6.82545 01828,01767,1766.10, 6.82545 01828,01769,1766.10, 6.82545 01828,01764,1766.10, 6.82545 Where: Temperature is corrected ADC count 2 + Calibration MinTemperature yaw rate is corrected ADC count 3 yaw cal offset and gain are the current gain and offset being applied to calculate the yaw.
Racelogic Ltd Upgrading Firmware
- 46 -
Upgrading the DriftBox Firmware It may be necessary in the future for you to perform an upgrade to the firmware inside your
DriftBox to add new features. Connect your DriftBox to the computer onto which you have installed
the DriftBox software.
Download the upgrade file from the website and save it to your computer.
Press and hold the MODE button whilst you connect power to your DriftBox.
This will force the DriftBox into Upgrade mode.
Connect the USB lead from DriftBox to your computer.
Double click on the upgrade file, this will auto run the upgrader software.
If this doesn’t happen automatically, run the ‘Upgrader.exe’ software, which should have
been installed when the installation CD was used, and load in the relevant file.
If you want to read your SD card through USB directly after this upgrade you will need to
disconnect then reconnect power.
Racelogic Ltd Troubleshooting
- 47 -
Troubleshooting My DriftBox does not pick up or lock onto satellites
Some modern cars are fitted with a special windscreen that cuts down the amount of UV (Ultra Violet) rays that will be transferred through the windscreen which help cut down on glare. These windscreens are called Athermic, or UV Coated and will dampen/reduce GPS signals coming through the windscreen, so if you have an Athermic windscreen, it means you will not receive the same quality of signal as you would do by taking the DriftBox outside of the car.
How do I know if I have an Athermic Windscreen ? You can either contact the manufacturer of your vehicle, or talk to the main authorised dealer who may be able to tell you. If you cannot receive a firm yes or no, then another way to check is to power up the DriftBox and hold it outside of the vehicle, receive a satellite fix and use the GPS diagnostic screen to see how many satellites you can see. Once you have noted this down, move the GPS inside the car and see if the GPS signal drops by 2-4 sats. If it does immediately then you probably have an Athermic windscreen.
There is list of cars in the table below that we believe have had Athermic windscreens fitted throughout part of their history. Please note that manufacturers don't always use the same windscreens through the life of a car model, so even though a model may be listed below, it does not necessarily mean that the current model that you have may have an Athermic windscreen. If you are unsure, try the above test or talk to your car manufacturer/dealership.
BMW 3 Series Ford Mondeo Renault Laguna
BMW 5 Series Fiat Multipla Renault Clio
BMW 7 Series Mercedes W220-S Class Renault Master
BMW X5 Mercedes Vaneo Renault Kangoo
Citreon Picasso Peugeot 206 Renault Scenic
Citreon C5 Peugeot 306 Renault Espace
Citreon Xsara Peugeot 307 Renault Megane
Citreon Xantia Peugeot 607 Renault Safrane
Ford Galaxy Renault Traffic Vauxhall Zafira
If your car does have this type of windscreen you will need to use an external GPS antenna that
magnetically fixes to the roof of your car. An external antenna is available as an optional extra -
see the website for details.
If you still have reception problems:
Obstructions to the open sky will reduce GPS performance. Try to ensure placement of
DriftBox is away from the windscreen edges so it has the widest view of the skies possible.
With an external antenna place it away from roof bars and at least 10 cm way from any
other roof mounted items.
Driving in built up areas and close to tall trees reduces satellite reception.
DriftBox may require a Coldstart, see the DriftBox setup section of this manual for more
information.
DriftBox displays a drift angle when the vehicle is not drifting
Values of Drift up to 10o can be expected on a normal corner without drifting.
Racelogic Ltd Troubleshooting
- 48 -
DriftBox displays an angle > 10o when the vehicle is not drifting
Check the ‘Alignment’ of the DriftBox; see the alignment section of Setup Menu in this
manual for further information.
If the road has a severe camber / gradient this will slightly affect the Drift angle calculation.
If you are in an area of poor reception quality then this will affect the Drift angle calculation.
The Drift angle reading appears too big or too small
Check the ‘Alignment’ of DriftBox; see the alignment section of Setup Menu in this manual
for further information.
If the road has a severe camber or gradient this will affect the Drift angle calculation.
If you are in an area of poor reception quality then this will affect the Drift angle calculation.
If the Drift angle is consistently incorrect in good conditions then the YAW sensor may need
to be zero’d, but this is very unusual.
To check whether you need to zero the YAW sensor:
Use the Yaw sensor diagnostic screen and sit DriftBox very still on a flat surface. The angle
reading will change slowly over time. If the angle changes every three seconds or less, go to the
Diagnostic screen, press and hold the RESET button for two seconds then follow the on-screen
instructions. The process will take thirty seconds, during which the unit must be kept very still. If the
sensor is subjected to a sudden movement, the procedure will be cancelled.
Note: If you wish to cancel the procedure, press any key other than OK to return to the diagnostic
screen.
The Alignment Bars are in the wrong position when DriftBox is held flat
If the horizontal and vertical alignment bars, which are used as a guide to correctly align DriftBox in
the windscreen, are no longer postioned correctly when DriftBox is held on a flat surface they may
need resetting. To do this, hold DriftBox very still on a flat surface when in this screen, and press
and hold reset. The alignment bars will then be repositioned in the middle of the DriftBox display
and can once again be used as a guide to DriftBox alignment.
No data files are appearing on the SD card
Make sure the SD card is not full. If your DriftBox does not beep twice when you insert the card,
then you may have to re-format the card - you should use the utility in DriftBox Tools. If purchasing
a new SD card, ensure that it is of high quality from a reputable manufacture
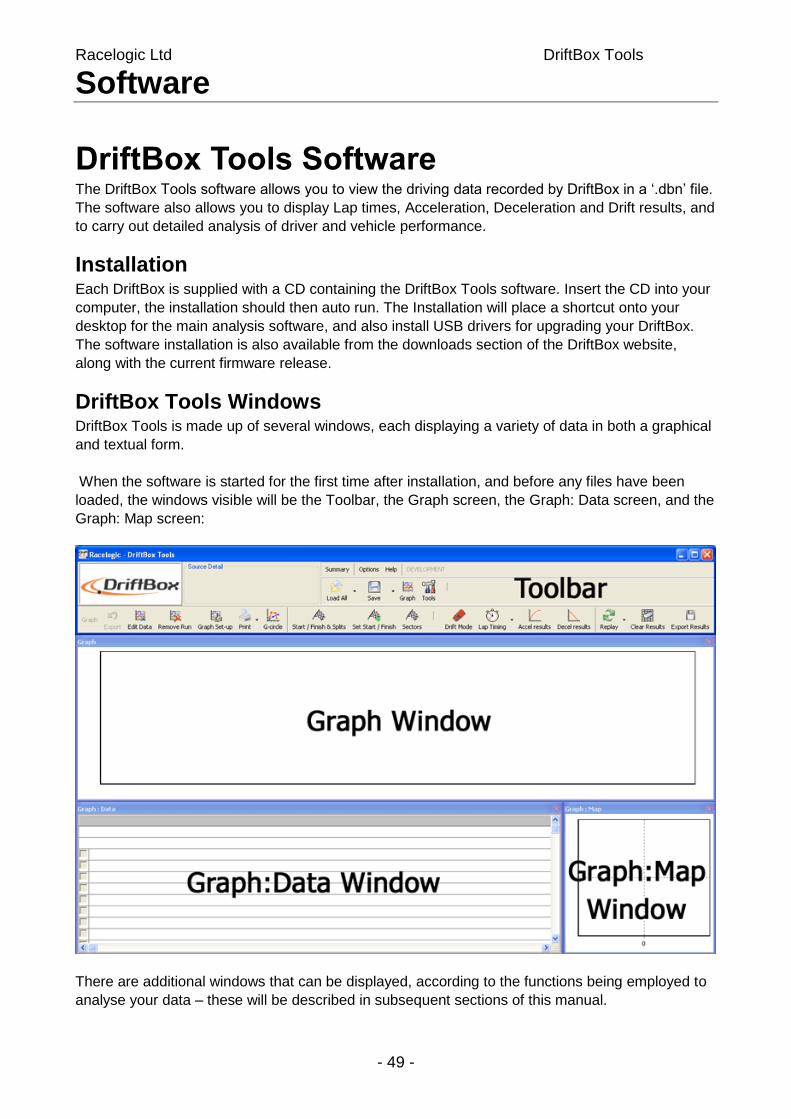
Racelogic Ltd DriftBox Tools Software
- 49 -
DriftBox Tools Software The DriftBox Tools software allows you to view the driving data recorded by DriftBox in a ‘.dbn’ file.
The software also allows you to display Lap times, Acceleration, Deceleration and Drift results, and
to carry out detailed analysis of driver and vehicle performance.
Installation Each DriftBox is supplied with a CD containing the DriftBox Tools software. Insert the CD into your
computer, the installation should then auto run. The Installation will place a shortcut onto your
desktop for the main analysis software, and also install USB drivers for upgrading your DriftBox.
The software installation is also available from the downloads section of the DriftBox website,
along with the current firmware release.
DriftBox Tools Windows DriftBox Tools is made up of several windows, each displaying a variety of data in both a graphical
and textual form.
When the software is started for the first time after installation, and before any files have been
loaded, the windows visible will be the Toolbar, the Graph screen, the Graph: Data screen, and the
Graph: Map screen:
There are additional windows that can be displayed, according to the functions being employed to
analyse your data – these will be described in subsequent sections of this manual.
Racelogic Ltd DriftBox Tools Software
- 50 -
Graph Window In the Graph window different channels can be plotted, either against time or against distance, and
up to four ‘.dbn’ files can be overlaid on the graph. The Graph window can display large amounts
of data at once, with the addition of various axes to aid analysis.
Graph: Map Window
The Graph: Map window shows the path of the vehicle, calculated from the latitude and longitude
data. In addition, a circuit overlay can be applied to the map window, allowing you to see the
position of the vehicle in relation to the bounds of a track.
Graph: Data Window The Graph: Data window shows a table of the data of the following available channels:
Speed
Lateral Acceleration
Longitudinal Acceleration
Heading
Height
Satellites
Yaw Rate
Latitude
Longitude
Brake Trigger
UTC Time
Distance
Time
Radius of Turn
Drift
There are a number of other channels which are shown, but these are not relevant to the DriftBox
and will be blank. For reference, these channels are: Relative Height, Vertical Speed, Glonass
Satellites, GPS Satellites, Lat Acc from Yaw Rate, DGPS, Speed Quality, Centre Line Deviation,
Solution Type, and RMS Error Position.
Window Sizes and Positions Each of the three display windows can be resized by stretching the window (by holding the mouse
pointer over a window corner and then click-dragging when the pointer shape changes to ); each
window can be repositioned; and all of these windows can be printed. The default position and size
of each window can be reset from a function in the Tools menu called ‘Arrange Windows’ (see
page 78.)
Software Basics
Opening DriftBox Files – Load All To load a file that has been recorded by your DriftBox, click on
the Load All button on the Toolbar. An ‘Open’ window will appear
– navigate to the directory on your PC that contains your DriftBox
files and select the file you wish to view.
By default the ‘Files of Type:’ will be ‘DriftBox Binary Files (*.dbn)’, with a further option of ‘VBOX
Data Files (*.vbo)’. Unless you are loading files that have been recorded using Racelogic VBOX
equipment you will not need to select the .vbo file type.
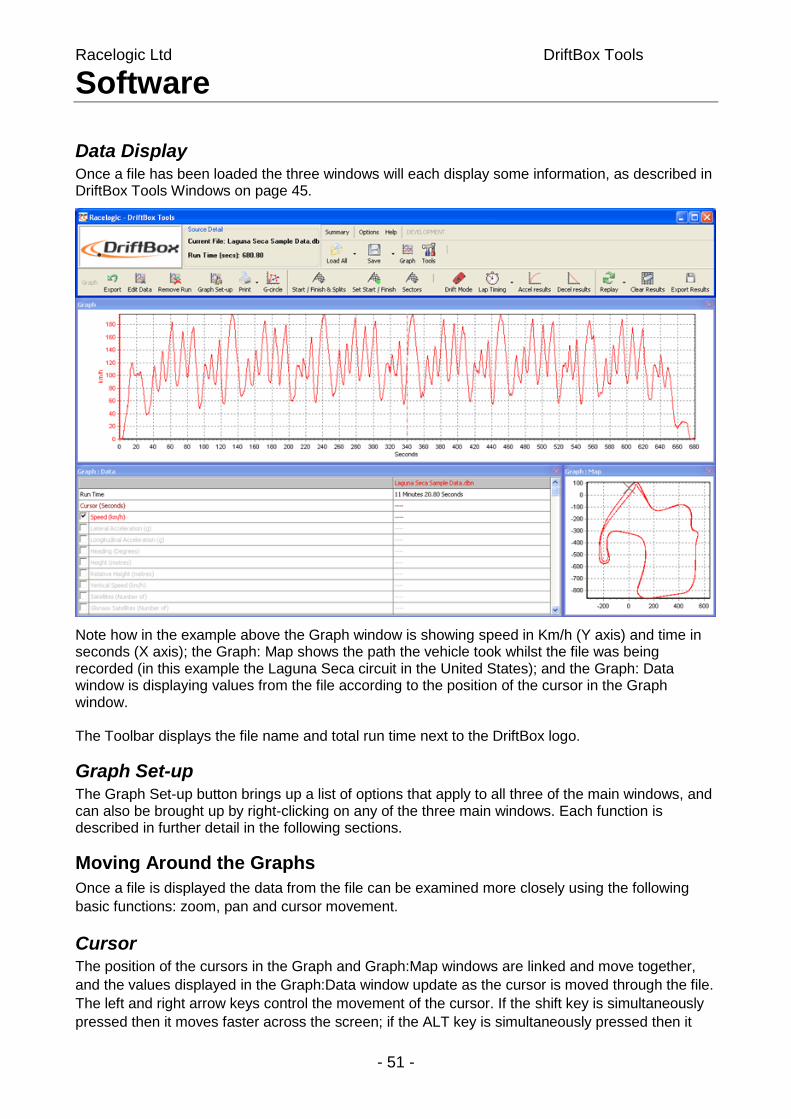
Racelogic Ltd DriftBox Tools Software
- 51 -
Data Display Once a file has been loaded the three windows will each display some information, as described in DriftBox Tools Windows on page 45.
Note how in the example above the Graph window is showing speed in Km/h (Y axis) and time in seconds (X axis); the Graph: Map shows the path the vehicle took whilst the file was being recorded (in this example the Laguna Seca circuit in the United States); and the Graph: Data window is displaying values from the file according to the position of the cursor in the Graph window. The Toolbar displays the file name and total run time next to the DriftBox logo.
Graph Set-up The Graph Set-up button brings up a list of options that apply to all three of the main windows, and can also be brought up by right-clicking on any of the three main windows. Each function is described in further detail in the following sections.
Moving Around the Graphs
Once a file is displayed the data from the file can be examined more closely using the following
basic functions: zoom, pan and cursor movement.
Cursor The position of the cursors in the Graph and Graph:Map windows are linked and move together,
and the values displayed in the Graph:Data window update as the cursor is moved through the file.
The left and right arrow keys control the movement of the cursor. If the shift key is simultaneously
pressed then it moves faster across the screen; if the ALT key is simultaneously pressed then it
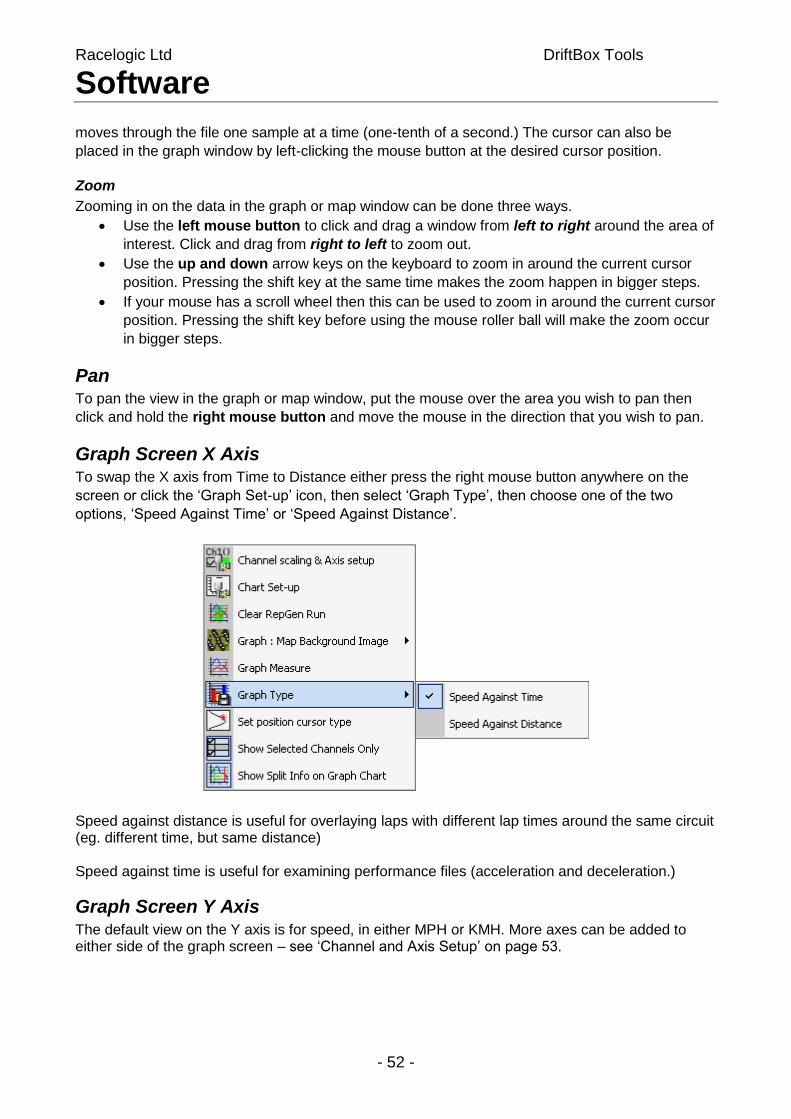
Racelogic Ltd DriftBox Tools Software
- 52 -
moves through the file one sample at a time (one-tenth of a second.) The cursor can also be
placed in the graph window by left-clicking the mouse button at the desired cursor position.
Zoom
Zooming in on the data in the graph or map window can be done three ways.
Use the left mouse button to click and drag a window from left to right around the area of
interest. Click and drag from right to left to zoom out.
Use the up and down arrow keys on the keyboard to zoom in around the current cursor
position. Pressing the shift key at the same time makes the zoom happen in bigger steps.
If your mouse has a scroll wheel then this can be used to zoom in around the current cursor
position. Pressing the shift key before using the mouse roller ball will make the zoom occur
in bigger steps.
Pan To pan the view in the graph or map window, put the mouse over the area you wish to pan then
click and hold the right mouse button and move the mouse in the direction that you wish to pan.
Graph Screen X Axis To swap the X axis from Time to Distance either press the right mouse button anywhere on the
screen or click the ‘Graph Set-up’ icon, then select ‘Graph Type’, then choose one of the two
options, ‘Speed Against Time’ or ‘Speed Against Distance’.
Speed against distance is useful for overlaying laps with different lap times around the same circuit (eg. different time, but same distance) Speed against time is useful for examining performance files (acceleration and deceleration.)
Graph Screen Y Axis The default view on the Y axis is for speed, in either MPH or KMH. More axes can be added to either side of the graph screen – see ‘Channel and Axis Setup’ on page 53.
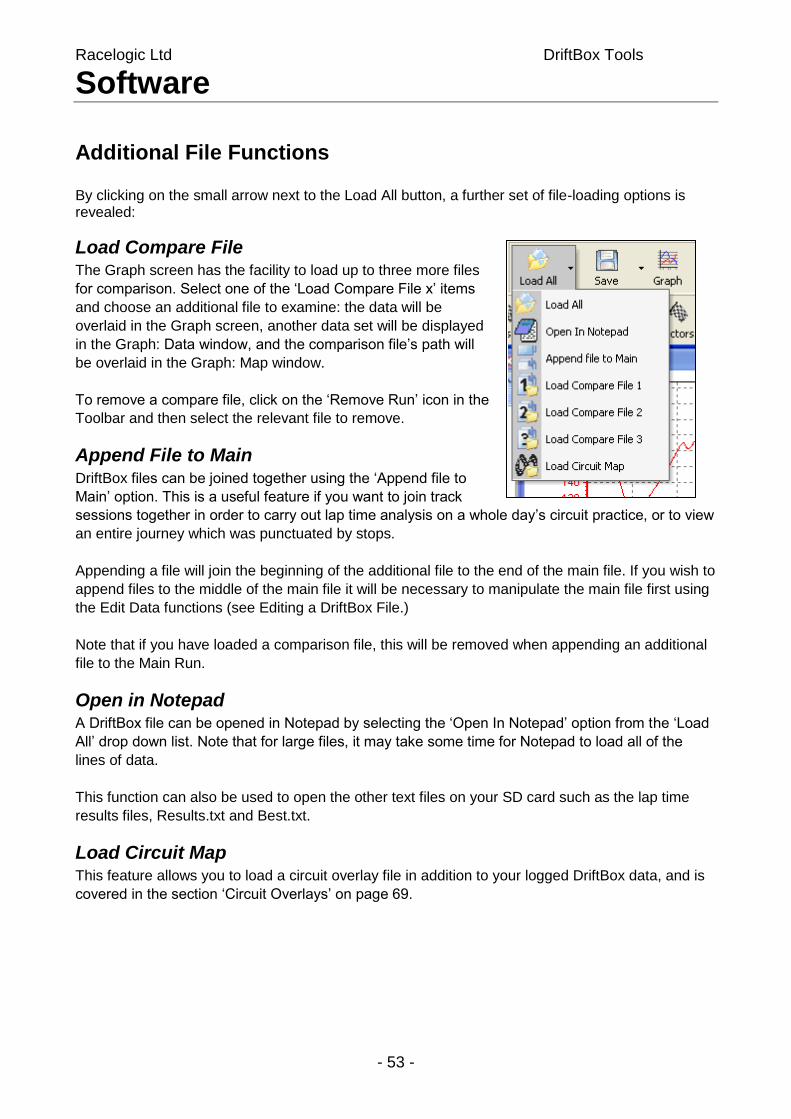
Racelogic Ltd DriftBox Tools Software
- 53 -
Additional File Functions By clicking on the small arrow next to the Load All button, a further set of file-loading options is revealed:
Load Compare File The Graph screen has the facility to load up to three more files
for comparison. Select one of the ‘Load Compare File x’ items
and choose an additional file to examine: the data will be
overlaid in the Graph screen, another data set will be displayed
in the Graph: Data window, and the comparison file’s path will
be overlaid in the Graph: Map window.
To remove a compare file, click on the ‘Remove Run’ icon in the
Toolbar and then select the relevant file to remove.
Append File to Main DriftBox files can be joined together using the ‘Append file to
Main’ option. This is a useful feature if you want to join track
sessions together in order to carry out lap time analysis on a whole day’s circuit practice, or to view
an entire journey which was punctuated by stops.
Appending a file will join the beginning of the additional file to the end of the main file. If you wish to
append files to the middle of the main file it will be necessary to manipulate the main file first using
the Edit Data functions (see Editing a DriftBox File.)
Note that if you have loaded a comparison file, this will be removed when appending an additional
file to the Main Run.
Open in Notepad A DriftBox file can be opened in Notepad by selecting the ‘Open In Notepad’ option from the ‘Load
All’ drop down list. Note that for large files, it may take some time for Notepad to load all of the
lines of data.
This function can also be used to open the other text files on your SD card such as the lap time
results files, Results.txt and Best.txt.
Load Circuit Map This feature allows you to load a circuit overlay file in addition to your logged DriftBox data, and is
covered in the section ‘Circuit Overlays’ on page 69.
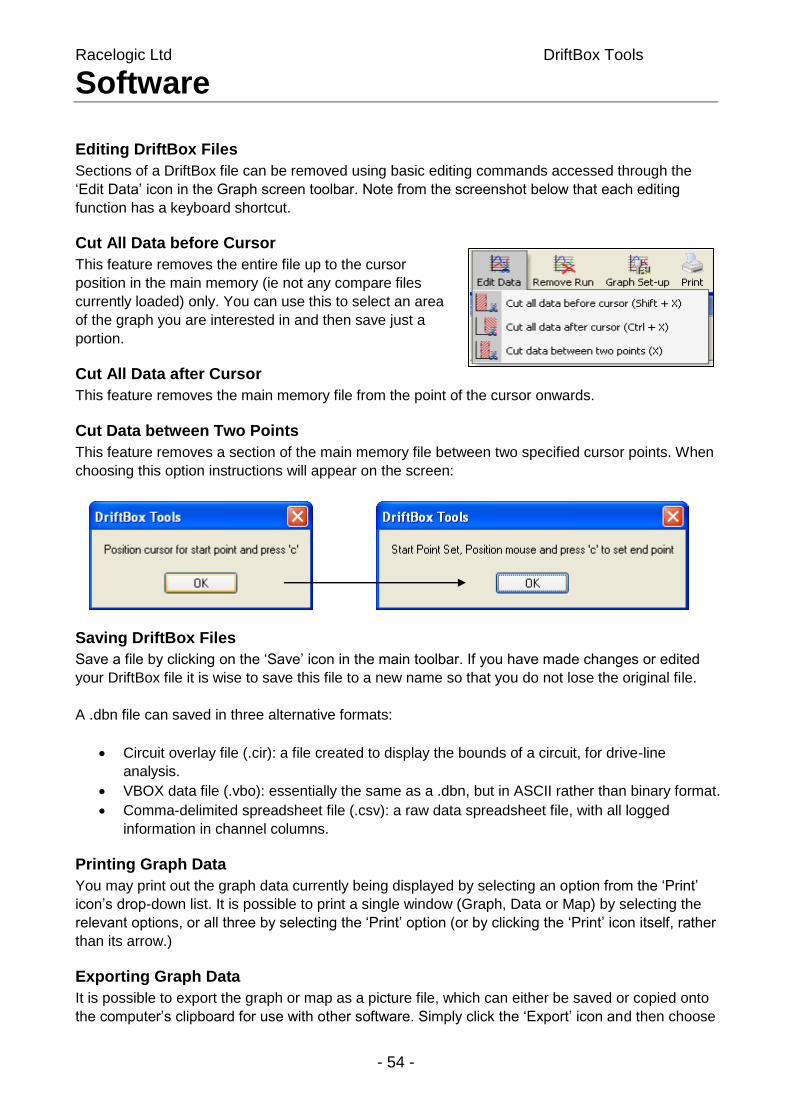
Racelogic Ltd DriftBox Tools Software
- 54 -
Editing DriftBox Files
Sections of a DriftBox file can be removed using basic editing commands accessed through the
‘Edit Data’ icon in the Graph screen toolbar. Note from the screenshot below that each editing
function has a keyboard shortcut.
Cut All Data before Cursor
This feature removes the entire file up to the cursor
position in the main memory (ie not any compare files
currently loaded) only. You can use this to select an area
of the graph you are interested in and then save just a
portion.
Cut All Data after Cursor
This feature removes the main memory file from the point of the cursor onwards.
Cut Data between Two Points
This feature removes a section of the main memory file between two specified cursor points. When
choosing this option instructions will appear on the screen:
Saving DriftBox Files
Save a file by clicking on the ‘Save’ icon in the main toolbar. If you have made changes or edited
your DriftBox file it is wise to save this file to a new name so that you do not lose the original file.
A .dbn file can saved in three alternative formats:
Circuit overlay file (.cir): a file created to display the bounds of a circuit, for drive-line
analysis.
VBOX data file (.vbo): essentially the same as a .dbn, but in ASCII rather than binary format.
Comma-delimited spreadsheet file (.csv): a raw data spreadsheet file, with all logged
information in channel columns.
Printing Graph Data
You may print out the graph data currently being displayed by selecting an option from the ‘Print’
icon’s drop-down list. It is possible to print a single window (Graph, Data or Map) by selecting the
relevant options, or all three by selecting the ‘Print’ option (or by clicking the ‘Print’ icon itself, rather
than its arrow.)
Exporting Graph Data
It is possible to export the graph or map as a picture file, which can either be saved or copied onto
the computer’s clipboard for use with other software. Simply click the ‘Export’ icon and then choose
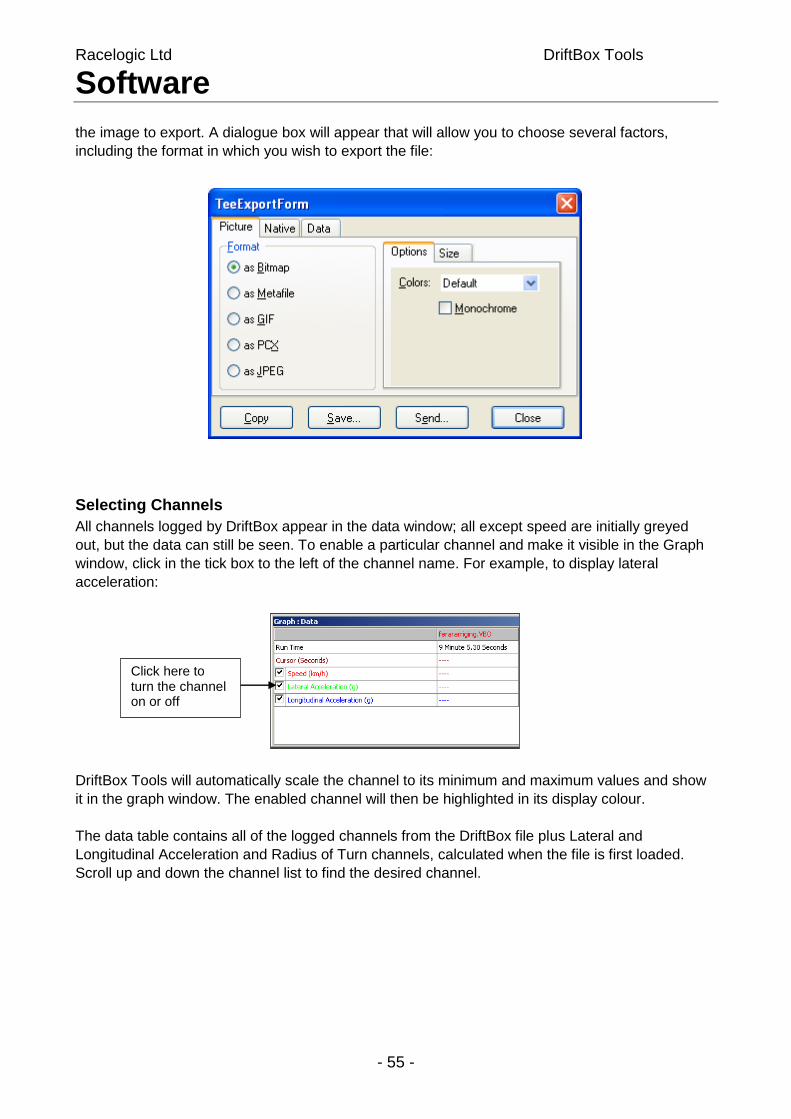
Racelogic Ltd DriftBox Tools Software
- 55 -
the image to export. A dialogue box will appear that will allow you to choose several factors,
including the format in which you wish to export the file:
Selecting Channels
All channels logged by DriftBox appear in the data window; all except speed are initially greyed
out, but the data can still be seen. To enable a particular channel and make it visible in the Graph
window, click in the tick box to the left of the channel name. For example, to display lateral
acceleration:
DriftBox Tools will automatically scale the channel to its minimum and maximum values and show
it in the graph window. The enabled channel will then be highlighted in its display colour.
The data table contains all of the logged channels from the DriftBox file plus Lateral and
Longitudinal Acceleration and Radius of Turn channels, calculated when the file is first loaded.
Scroll up and down the channel list to find the desired channel.
Click here to turn the channel on or off
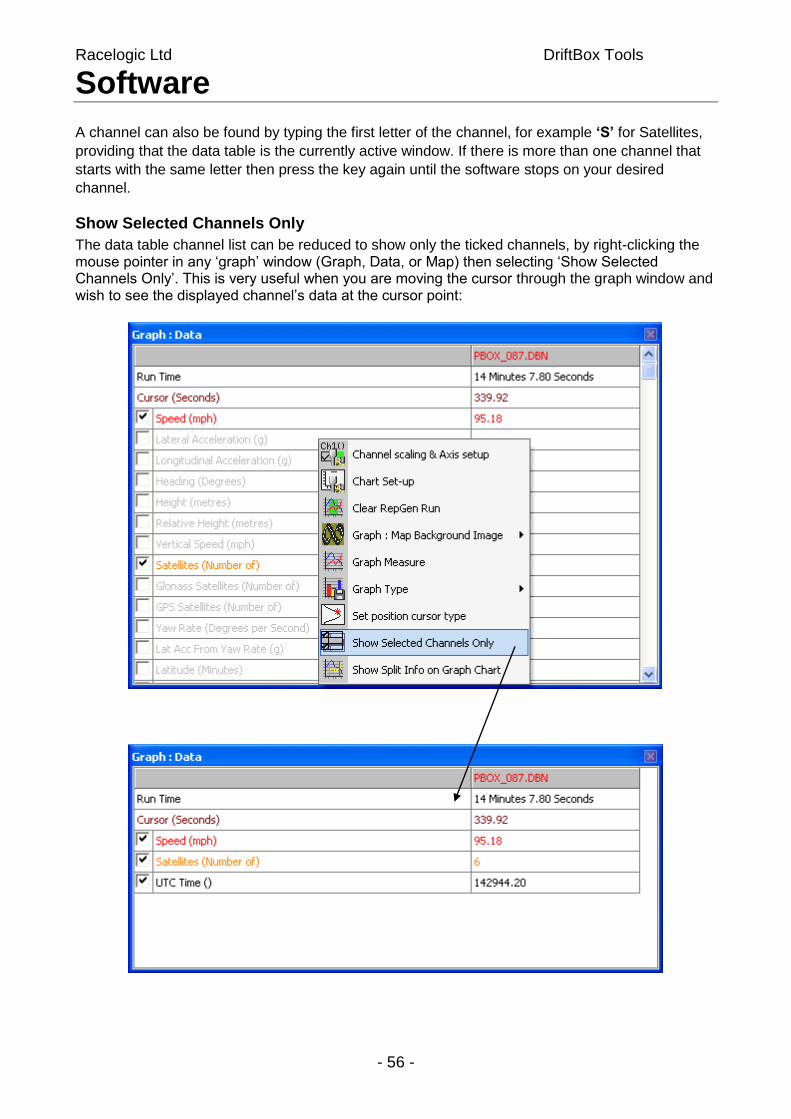
Racelogic Ltd DriftBox Tools Software
- 56 -
A channel can also be found by typing the first letter of the channel, for example ‘S’ for Satellites,
providing that the data table is the currently active window. If there is more than one channel that
starts with the same letter then press the key again until the software stops on your desired
channel.
Show Selected Channels Only
The data table channel list can be reduced to show only the ticked channels, by right-clicking the mouse pointer in any ‘graph’ window (Graph, Data, or Map) then selecting ‘Show Selected Channels Only’. This is very useful when you are moving the cursor through the graph window and wish to see the displayed channel’s data at the cursor point:
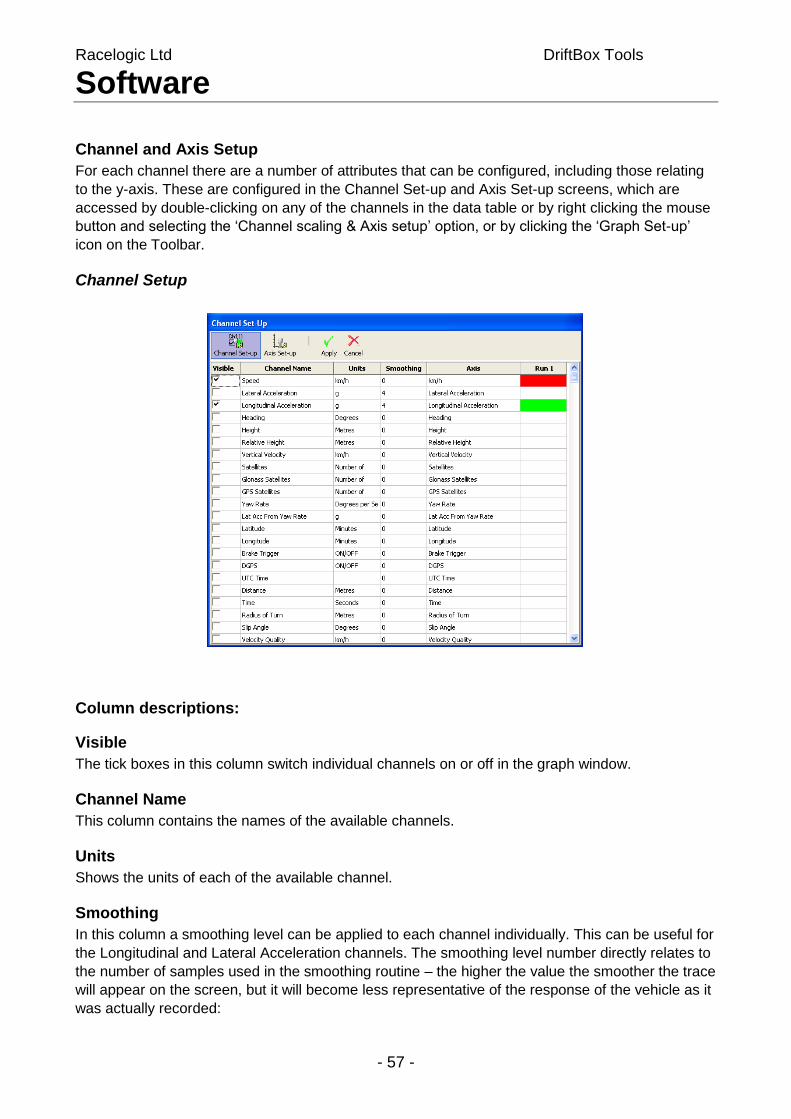
Racelogic Ltd DriftBox Tools Software
- 57 -
Channel and Axis Setup
For each channel there are a number of attributes that can be configured, including those relating
to the y-axis. These are configured in the Channel Set-up and Axis Set-up screens, which are
accessed by double-clicking on any of the channels in the data table or by right clicking the mouse
button and selecting the ‘Channel scaling & Axis setup’ option, or by clicking the ‘Graph Set-up’
icon on the Toolbar.
Channel Setup
Column descriptions:
Visible
The tick boxes in this column switch individual channels on or off in the graph window.
Channel Name
This column contains the names of the available channels.
Units
Shows the units of each of the available channel.
Smoothing
In this column a smoothing level can be applied to each channel individually. This can be useful for
the Longitudinal and Lateral Acceleration channels. The smoothing level number directly relates to
the number of samples used in the smoothing routine – the higher the value the smoother the trace
will appear on the screen, but it will become less representative of the response of the vehicle as it
was actually recorded:
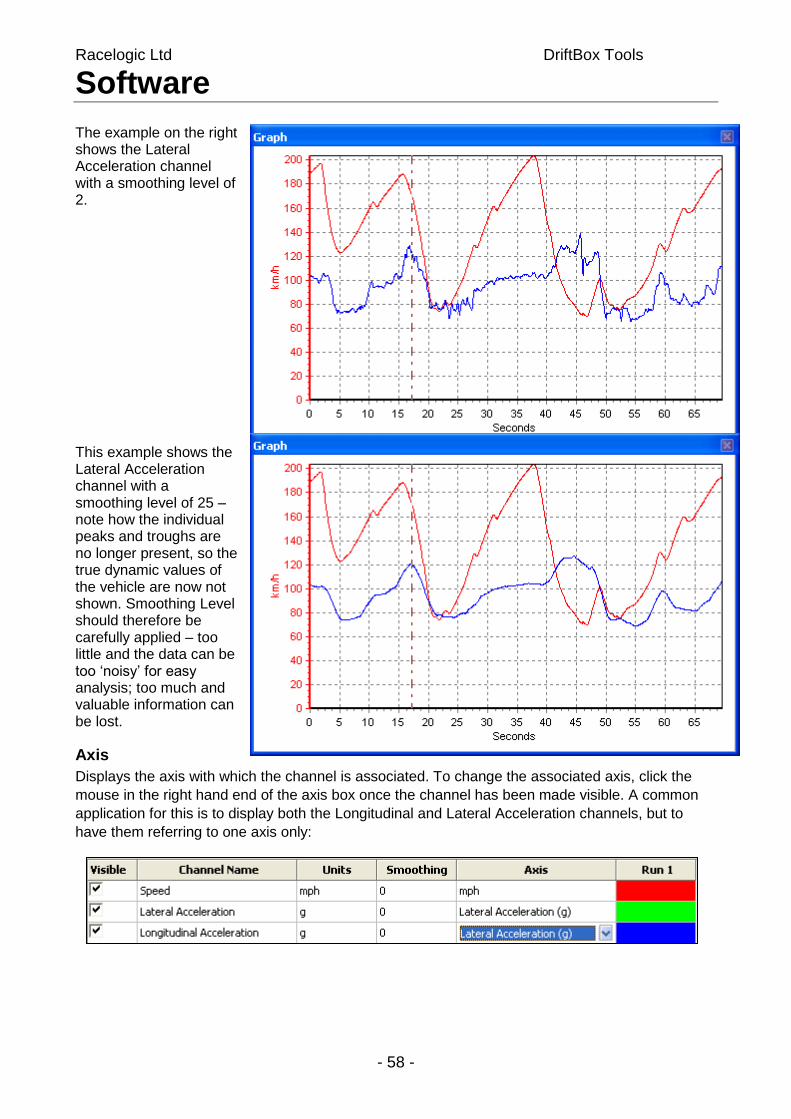
Racelogic Ltd DriftBox Tools Software
- 58 -
The example on the right shows the Lateral Acceleration channel with a smoothing level of 2. This example shows the Lateral Acceleration channel with a smoothing level of 25 – note how the individual peaks and troughs are no longer present, so the true dynamic values of the vehicle are now not shown. Smoothing Level should therefore be carefully applied – too little and the data can be too ‘noisy’ for easy analysis; too much and valuable information can be lost.
Axis
Displays the axis with which the channel is associated. To change the associated axis, click the
mouse in the right hand end of the axis box once the channel has been made visible. A common
application for this is to display both the Longitudinal and Lateral Acceleration channels, but to
have them referring to one axis only:
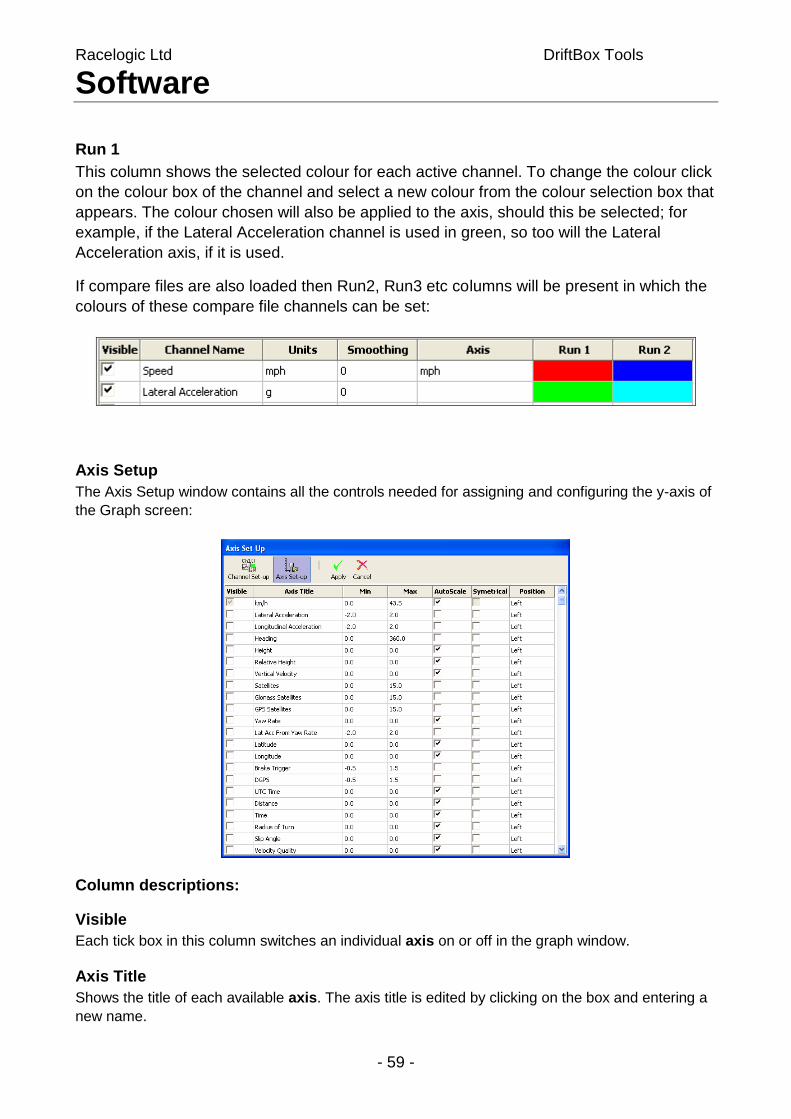
Racelogic Ltd DriftBox Tools Software
- 59 -
Run 1
This column shows the selected colour for each active channel. To change the colour click
on the colour box of the channel and select a new colour from the colour selection box that
appears. The colour chosen will also be applied to the axis, should this be selected; for
example, if the Lateral Acceleration channel is used in green, so too will the Lateral
Acceleration axis, if it is used.
If compare files are also loaded then Run2, Run3 etc columns will be present in which the
colours of these compare file channels can be set:
Axis Setup
The Axis Setup window contains all the controls needed for assigning and configuring the y-axis of
the Graph screen:
Column descriptions:
Visible
Each tick box in this column switches an individual axis on or off in the graph window.
Axis Title
Shows the title of each available axis. The axis title is edited by clicking on the box and entering a
new name.
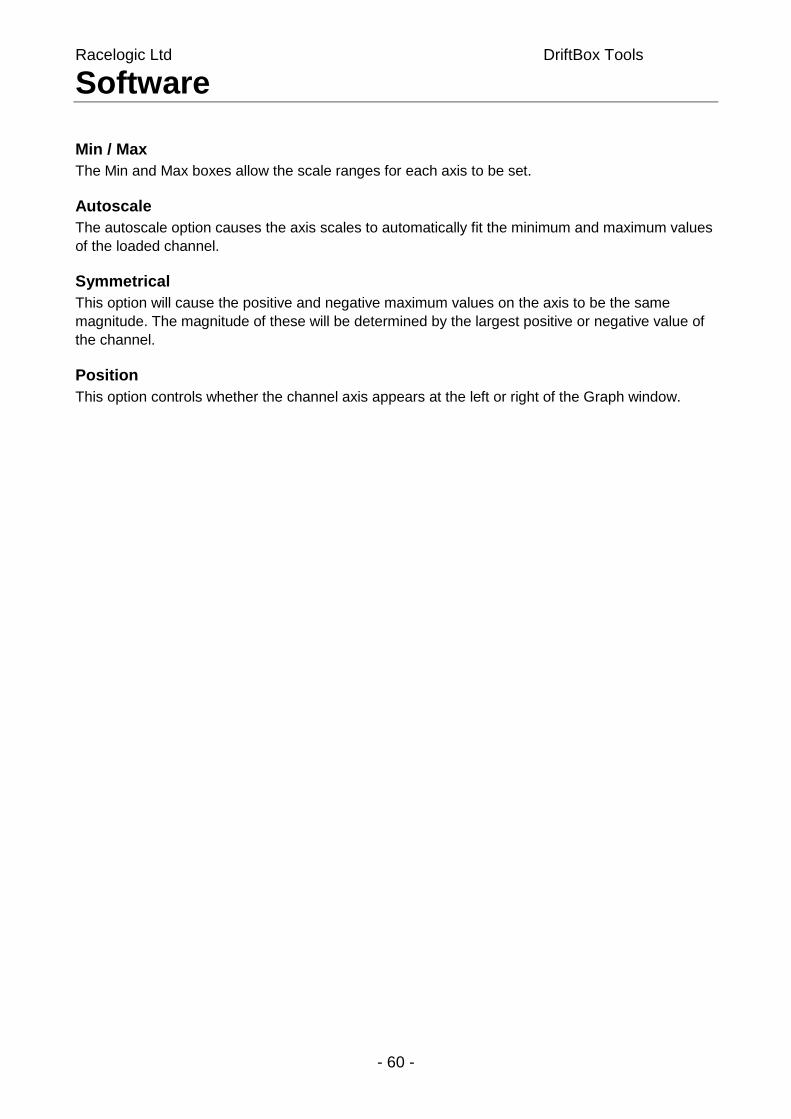
Racelogic Ltd DriftBox Tools Software
- 60 -
Min / Max
The Min and Max boxes allow the scale ranges for each axis to be set.
Autoscale
The autoscale option causes the axis scales to automatically fit the minimum and maximum values
of the loaded channel.
Symmetrical
This option will cause the positive and negative maximum values on the axis to be the same
magnitude. The magnitude of these will be determined by the largest positive or negative value of
the channel.
Position
This option controls whether the channel axis appears at the left or right of the Graph window.
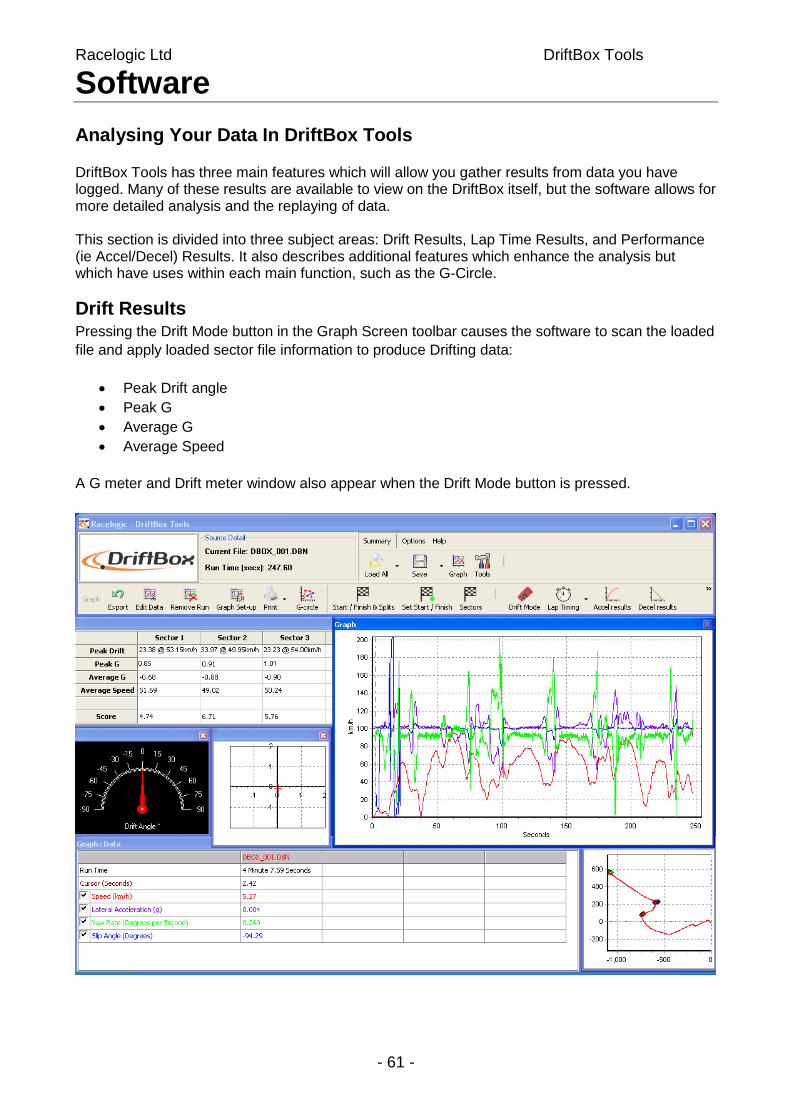
Racelogic Ltd DriftBox Tools Software
- 61 -
Analysing Your Data In DriftBox Tools DriftBox Tools has three main features which will allow you gather results from data you have logged. Many of these results are available to view on the DriftBox itself, but the software allows for more detailed analysis and the replaying of data. This section is divided into three subject areas: Drift Results, Lap Time Results, and Performance (ie Accel/Decel) Results. It also describes additional features which enhance the analysis but which have uses within each main function, such as the G-Circle.
Drift Results Pressing the Drift Mode button in the Graph Screen toolbar causes the software to scan the loaded
file and apply loaded sector file information to produce Drifting data:
Peak Drift angle
Peak G
Average G
Average Speed
A G meter and Drift meter window also appear when the Drift Mode button is pressed.
Racelogic Ltd DriftBox Tools Software
- 62 -
Sectors Before you can display any Drift results you need to set up sectors.
Defining Drifting Sectors in DriftBox Tools
Each sector that you set requires that you define a start line and an end line. Each sector is
numbered from 1-6.
Setting sector Start
Move the cursor in the Graph window to the start point of the sector.
Press the key ‘1’
A green dot will appear at this position in the Map window
Setting sector End
Move the cursor in the Graph window to the end point of the sector.
Press + ‘1’
A red dot will appear at this position in the Map window.
To define other sectors use the ‘2’, ‘3’ etc. buttons.
Loading and Saving Sectors
Saving Click on the ‘Save’ option in the Sectors drop down menu to save to the sectors created in the
Graph screen to a ‘.sct’ file.
Loading Click on the ‘Load’ button in the Sectors drop down menu. You can then browse for a previously
generated sector file containing sector information.
Clearing Sectors
If the current sector information in the graph screen needs to be cleared from the background memory and display screens, select ‘Clear All’ from the ‘Sectors’ menu in the Graph screen toolbar, or press + ‘C’.
Displaying Drifting Results To extract and display Drifting results from a file press the Drift Mode button in the
Graph screen toolbar. This causes the software to scan the loaded file and apply
loaded sector file information to produce a Drifting data grid showing the following
data:
Peak Drift angle
Peak G
Average G
Average Speed
A G meter and Drift meter window also appear when the Drift Mode button is pressed. When the
replay facility (see below) is used to replay the loaded file, the G and Drift angle windows display
data from the file that corresponds to the cursor position as it moves through the replaying data.
SHIFT
SHIFT
Racelogic Ltd DriftBox Tools Software
- 63 -
Displaying Drifting Data from a Logged file.
Click the Load all button to load a DriftBox file into the DriftBoxTools software.
Set up sectors as described above, or load a sector (.sct) file.
Press the Drift Mode button to scan the file and display results.
Replaying DriftBox Data A DriftBox file can be replayed at real time speed, or at 2 x or 5x real time speed.
Replaying a file:
Load the file into the DriftBoxTools software using the ‘Load All’ button.
Then click the right arrow of the Replay button on the Graph screen toolbar to view and
select on of the replay speed options.
Click on the Replay button to start the replay at the chosen speed.
Replaying data with the drifting table active
When the Drift Mode facility is active and the replay facility is used, the Drift results table updates
as the cursor passes through the sectors in the file.
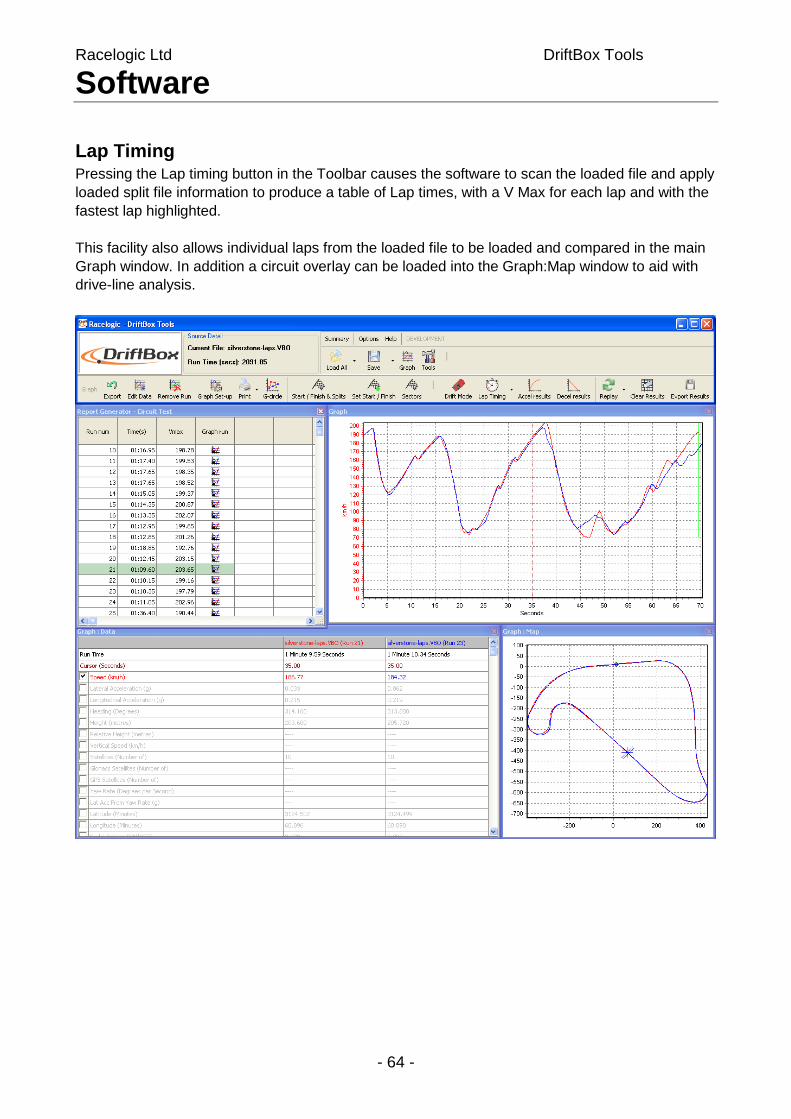
Racelogic Ltd DriftBox Tools Software
- 64 -
Lap Timing
Pressing the Lap timing button in the Toolbar causes the software to scan the loaded file and apply
loaded split file information to produce a table of Lap times, with a V Max for each lap and with the
fastest lap highlighted.
This facility also allows individual laps from the loaded file to be loaded and compared in the main
Graph window. In addition a circuit overlay can be loaded into the Graph:Map window to aid with
drive-line analysis.
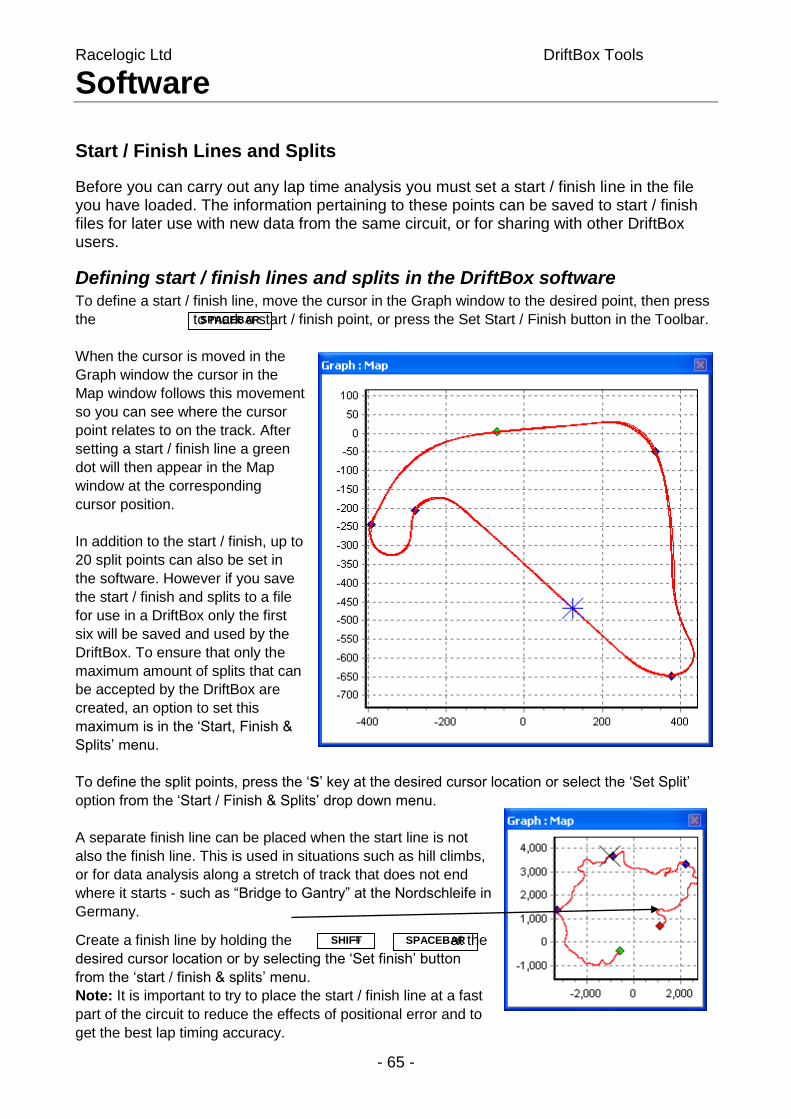
Racelogic Ltd DriftBox Tools Software
- 65 -
Start / Finish Lines and Splits
Before you can carry out any lap time analysis you must set a start / finish line in the file you have loaded. The information pertaining to these points can be saved to start / finish files for later use with new data from the same circuit, or for sharing with other DriftBox users.
Defining start / finish lines and splits in the DriftBox software To define a start / finish line, move the cursor in the Graph window to the desired point, then press
the to mark a start / finish point, or press the Set Start / Finish button in the Toolbar.
When the cursor is moved in the
Graph window the cursor in the
Map window follows this movement
so you can see where the cursor
point relates to on the track. After
setting a start / finish line a green
dot will then appear in the Map
window at the corresponding
cursor position.
In addition to the start / finish, up to
20 split points can also be set in
the software. However if you save
the start / finish and splits to a file
for use in a DriftBox only the first
six will be saved and used by the
DriftBox. To ensure that only the
maximum amount of splits that can
be accepted by the DriftBox are
created, an option to set this
maximum is in the ‘Start, Finish &
Splits’ menu.
To define the split points, press the ‘S’ key at the desired cursor location or select the ‘Set Split’
option from the ‘Start / Finish & Splits’ drop down menu.
A separate finish line can be placed when the start line is not
also the finish line. This is used in situations such as hill climbs,
or for data analysis along a stretch of track that does not end
where it starts - such as “Bridge to Gantry” at the Nordschleife in
Germany.
Create a finish line by holding the + at the
desired cursor location or by selecting the ‘Set finish’ button
from the ‘start / finish & splits’ menu.
Note: It is important to try to place the start / finish line at a fast
part of the circuit to reduce the effects of positional error and to
get the best lap timing accuracy.
SPACEBAR
SPACEBAR SHIFT
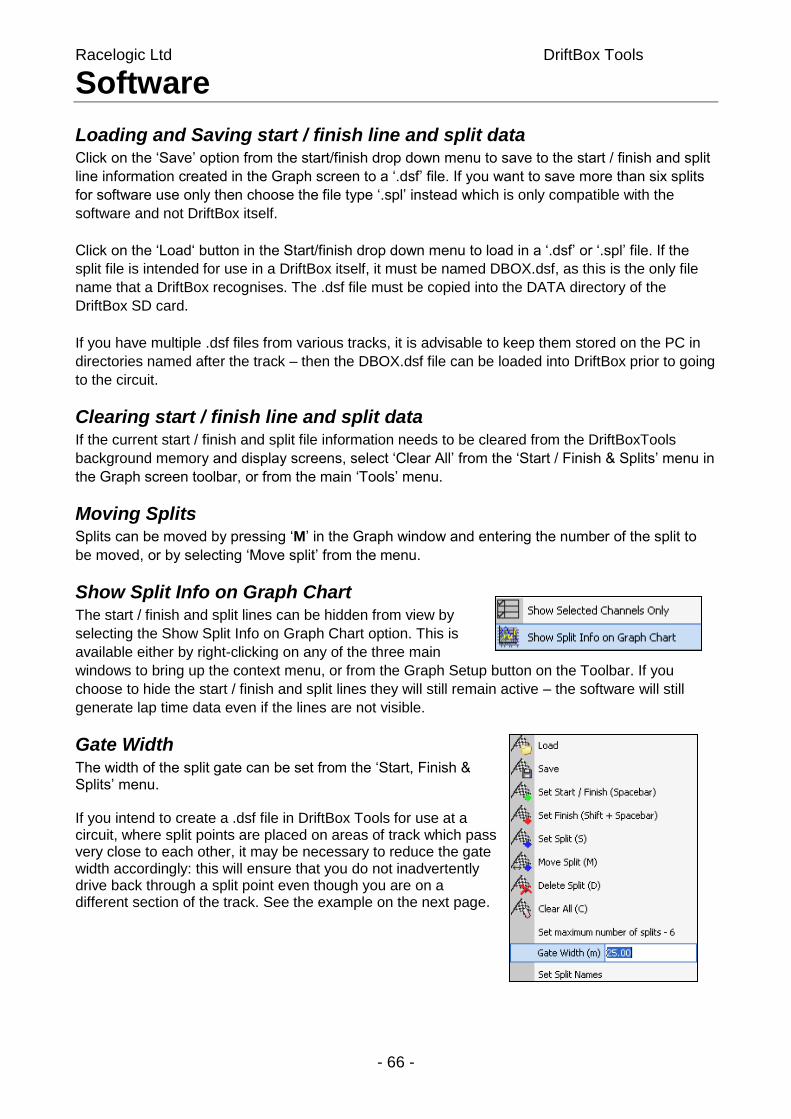
Racelogic Ltd DriftBox Tools Software
- 66 -
Loading and Saving start / finish line and split data Click on the ‘Save’ option from the start/finish drop down menu to save to the start / finish and split
line information created in the Graph screen to a ‘.dsf’ file. If you want to save more than six splits
for software use only then choose the file type ‘.spl’ instead which is only compatible with the
software and not DriftBox itself.
Click on the ‘Load‘ button in the Start/finish drop down menu to load in a ‘.dsf’ or ‘.spl’ file. If the
split file is intended for use in a DriftBox itself, it must be named DBOX.dsf, as this is the only file
name that a DriftBox recognises. The .dsf file must be copied into the DATA directory of the
DriftBox SD card.
If you have multiple .dsf files from various tracks, it is advisable to keep them stored on the PC in
directories named after the track – then the DBOX.dsf file can be loaded into DriftBox prior to going
to the circuit.
Clearing start / finish line and split data If the current start / finish and split file information needs to be cleared from the DriftBoxTools
background memory and display screens, select ‘Clear All’ from the ‘Start / Finish & Splits’ menu in
the Graph screen toolbar, or from the main ‘Tools’ menu.
Moving Splits Splits can be moved by pressing ‘M’ in the Graph window and entering the number of the split to
be moved, or by selecting ‘Move split’ from the menu.
Show Split Info on Graph Chart The start / finish and split lines can be hidden from view by
selecting the Show Split Info on Graph Chart option. This is
available either by right-clicking on any of the three main
windows to bring up the context menu, or from the Graph Setup button on the Toolbar. If you
choose to hide the start / finish and split lines they will still remain active – the software will still
generate lap time data even if the lines are not visible.
Gate Width The width of the split gate can be set from the ‘Start, Finish & Splits’ menu. If you intend to create a .dsf file in DriftBox Tools for use at a circuit, where split points are placed on areas of track which pass very close to each other, it may be necessary to reduce the gate width accordingly: this will ensure that you do not inadvertently drive back through a split point even though you are on a different section of the track. See the example on the next page.
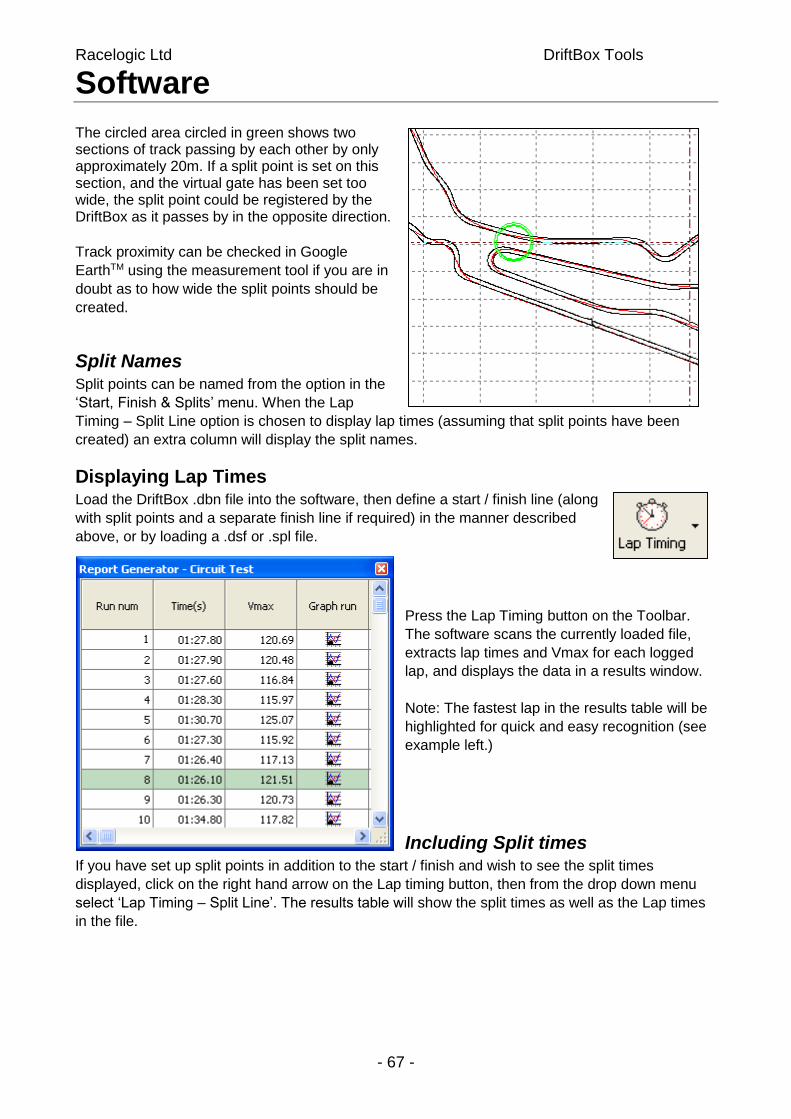
Racelogic Ltd DriftBox Tools Software
- 67 -
The circled area circled in green shows two sections of track passing by each other by only approximately 20m. If a split point is set on this section, and the virtual gate has been set too wide, the split point could be registered by the DriftBox as it passes by in the opposite direction.
Track proximity can be checked in Google
EarthTM using the measurement tool if you are in
doubt as to how wide the split points should be
created.
Split Names Split points can be named from the option in the
‘Start, Finish & Splits’ menu. When the Lap
Timing – Split Line option is chosen to display lap times (assuming that split points have been
created) an extra column will display the split names.
Displaying Lap Times Load the DriftBox .dbn file into the software, then define a start / finish line (along
with split points and a separate finish line if required) in the manner described
above, or by loading a .dsf or .spl file.
Press the Lap Timing button on the Toolbar.
The software scans the currently loaded file,
extracts lap times and Vmax for each logged
lap, and displays the data in a results window.
Note: The fastest lap in the results table will be
highlighted for quick and easy recognition (see
example left.)
Including Split times If you have set up split points in addition to the start / finish and wish to see the split times
displayed, click on the right hand arrow on the Lap timing button, then from the drop down menu
select ‘Lap Timing – Split Line’. The results table will show the split times as well as the Lap times
in the file.
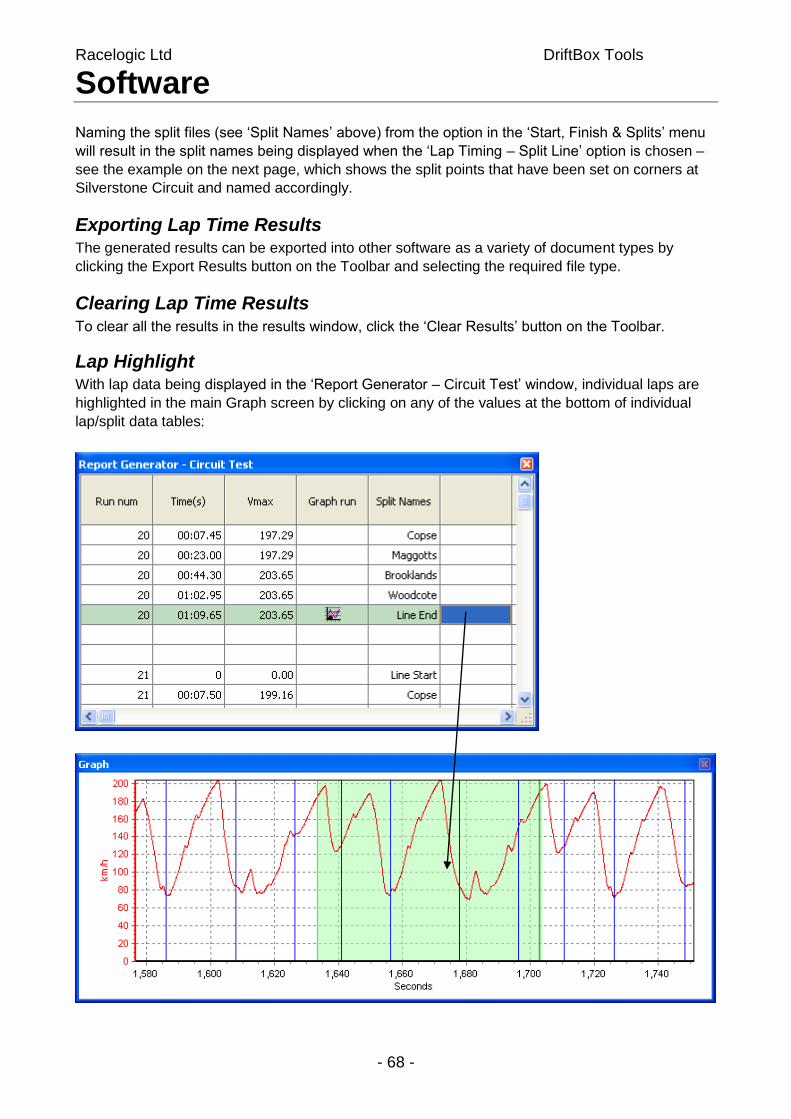
Racelogic Ltd DriftBox Tools Software
- 68 -
Naming the split files (see ‘Split Names’ above) from the option in the ‘Start, Finish & Splits’ menu
will result in the split names being displayed when the ‘Lap Timing – Split Line’ option is chosen –
see the example on the next page, which shows the split points that have been set on corners at
Silverstone Circuit and named accordingly.
Exporting Lap Time Results The generated results can be exported into other software as a variety of document types by
clicking the Export Results button on the Toolbar and selecting the required file type.
Clearing Lap Time Results
To clear all the results in the results window, click the ‘Clear Results’ button on the Toolbar.
Lap Highlight With lap data being displayed in the ‘Report Generator – Circuit Test’ window, individual laps are
highlighted in the main Graph screen by clicking on any of the values at the bottom of individual
lap/split data tables:
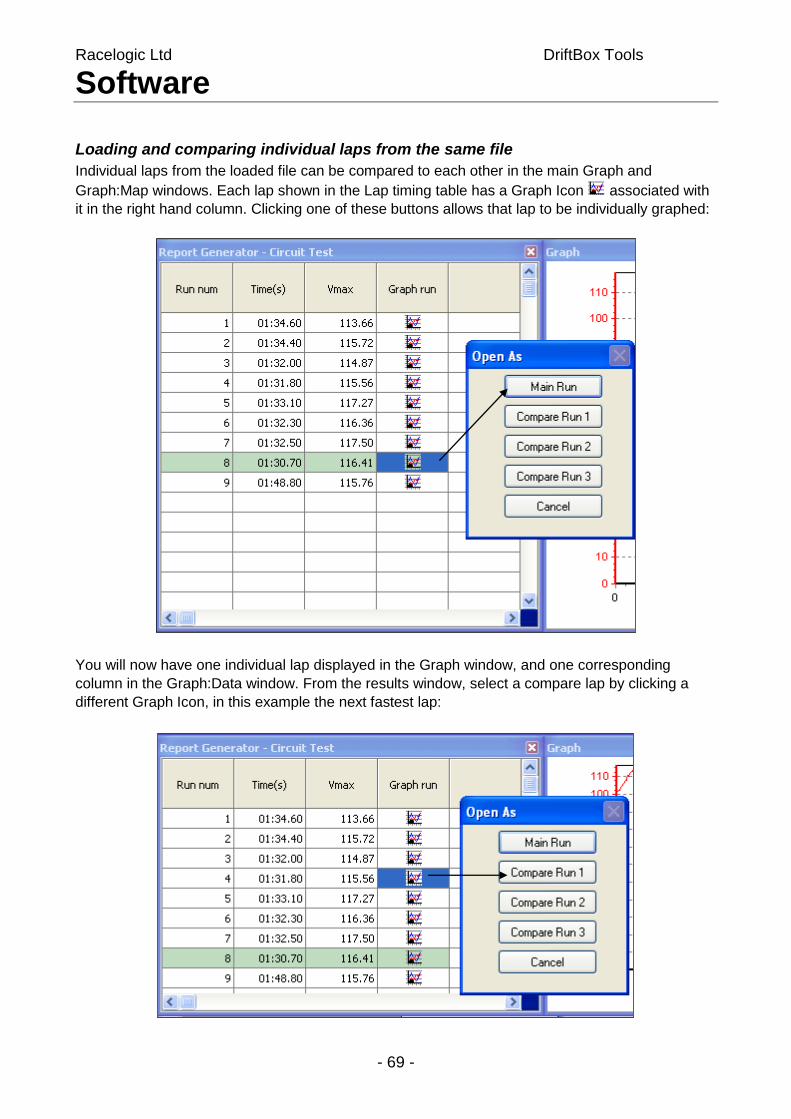
Racelogic Ltd DriftBox Tools Software
- 69 -
Loading and comparing individual laps from the same file
Individual laps from the loaded file can be compared to each other in the main Graph and
Graph:Map windows. Each lap shown in the Lap timing table has a Graph Icon associated with
it in the right hand column. Clicking one of these buttons allows that lap to be individually graphed:
You will now have one individual lap displayed in the Graph window, and one corresponding
column in the Graph:Data window. From the results window, select a compare lap by clicking a
different Graph Icon, in this example the next fastest lap:
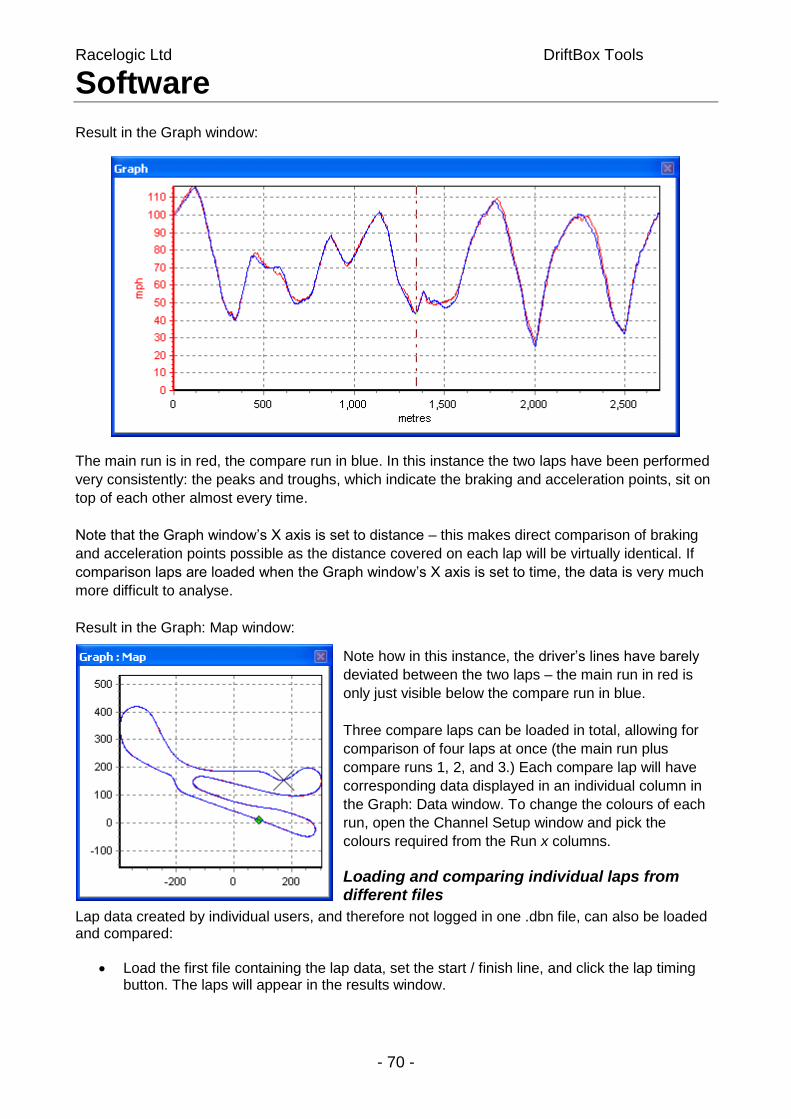
Racelogic Ltd DriftBox Tools Software
- 70 -
Result in the Graph window:
The main run is in red, the compare run in blue. In this instance the two laps have been performed
very consistently: the peaks and troughs, which indicate the braking and acceleration points, sit on
top of each other almost every time.
Note that the Graph window’s X axis is set to distance – this makes direct comparison of braking
and acceleration points possible as the distance covered on each lap will be virtually identical. If
comparison laps are loaded when the Graph window’s X axis is set to time, the data is very much
more difficult to analyse.
Result in the Graph: Map window:
Note how in this instance, the driver’s lines have barely
deviated between the two laps – the main run in red is
only just visible below the compare run in blue.
Three compare laps can be loaded in total, allowing for
comparison of four laps at once (the main run plus
compare runs 1, 2, and 3.) Each compare lap will have
corresponding data displayed in an individual column in
the Graph: Data window. To change the colours of each
run, open the Channel Setup window and pick the
colours required from the Run x columns.
Loading and comparing individual laps from different files
Lap data created by individual users, and therefore not logged in one .dbn file, can also be loaded and compared:
Load the first file containing the lap data, set the start / finish line, and click the lap timing button. The laps will appear in the results window.
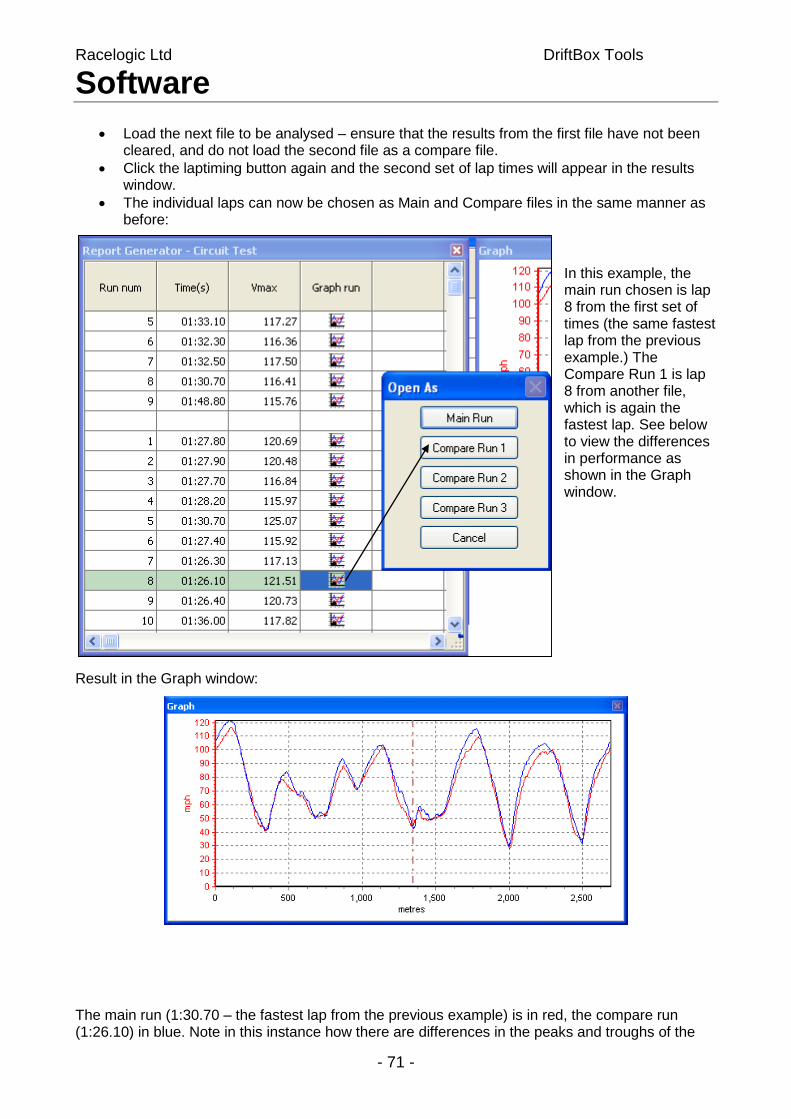
Racelogic Ltd DriftBox Tools Software
- 71 -
Load the next file to be analysed – ensure that the results from the first file have not been cleared, and do not load the second file as a compare file.
Click the laptiming button again and the second set of lap times will appear in the results window.
The individual laps can now be chosen as Main and Compare files in the same manner as before:
In this example, the main run chosen is lap 8 from the first set of times (the same fastest lap from the previous example.) The Compare Run 1 is lap 8 from another file, which is again the fastest lap. See below to view the differences in performance as shown in the Graph window.
Result in the Graph window:
The main run (1:30.70 – the fastest lap from the previous example) is in red, the compare run (1:26.10) in blue. Note in this instance how there are differences in the peaks and troughs of the

Racelogic Ltd DriftBox Tools Software
- 72 -
speed plots, indicating that the faster driver carried more speed before braking, and accelerated harder.
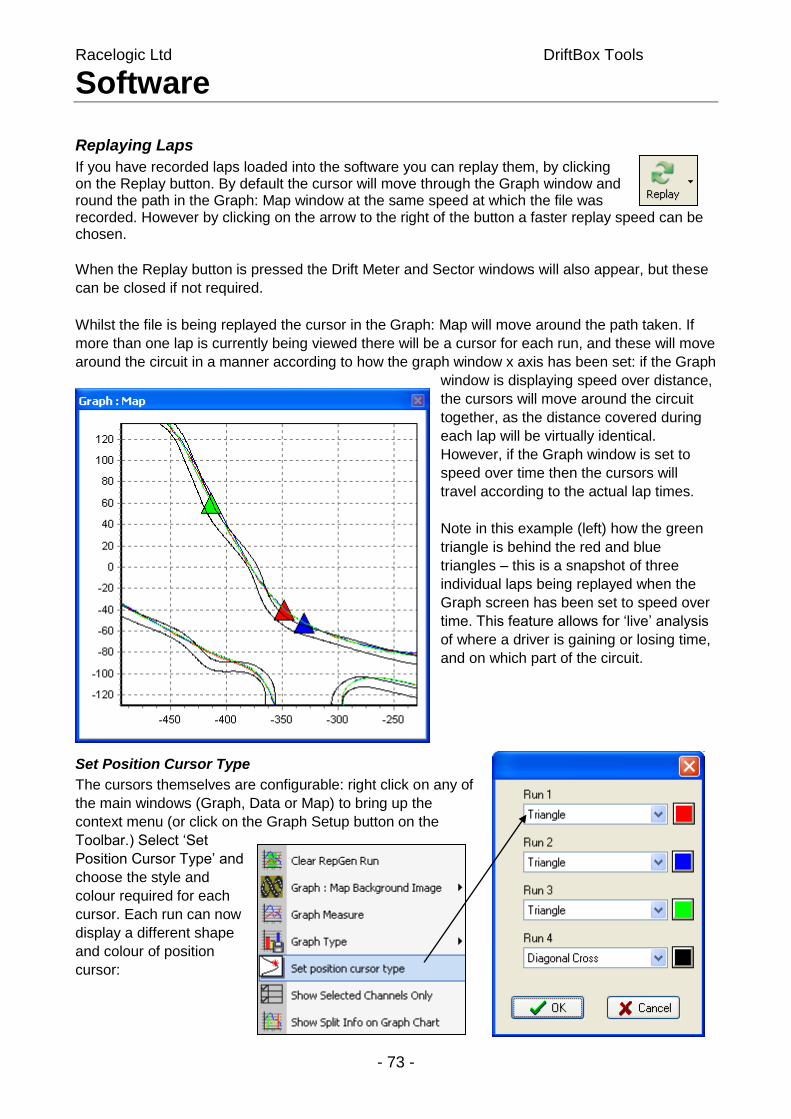
Racelogic Ltd DriftBox Tools Software
- 73 -
Replaying Laps
If you have recorded laps loaded into the software you can replay them, by clicking on the Replay button. By default the cursor will move through the Graph window and round the path in the Graph: Map window at the same speed at which the file was recorded. However by clicking on the arrow to the right of the button a faster replay speed can be chosen.
When the Replay button is pressed the Drift Meter and Sector windows will also appear, but these
can be closed if not required.
Whilst the file is being replayed the cursor in the Graph: Map will move around the path taken. If
more than one lap is currently being viewed there will be a cursor for each run, and these will move
around the circuit in a manner according to how the graph window x axis has been set: if the Graph
window is displaying speed over distance,
the cursors will move around the circuit
together, as the distance covered during
each lap will be virtually identical.
However, if the Graph window is set to
speed over time then the cursors will
travel according to the actual lap times.
Note in this example (left) how the green
triangle is behind the red and blue
triangles – this is a snapshot of three
individual laps being replayed when the
Graph screen has been set to speed over
time. This feature allows for ‘live’ analysis
of where a driver is gaining or losing time,
and on which part of the circuit.
Set Position Cursor Type
The cursors themselves are configurable: right click on any of
the main windows (Graph, Data or Map) to bring up the
context menu (or click on the Graph Setup button on the
Toolbar.) Select ‘Set
Position Cursor Type’ and
choose the style and
colour required for each
cursor. Each run can now
display a different shape
and colour of position
cursor:
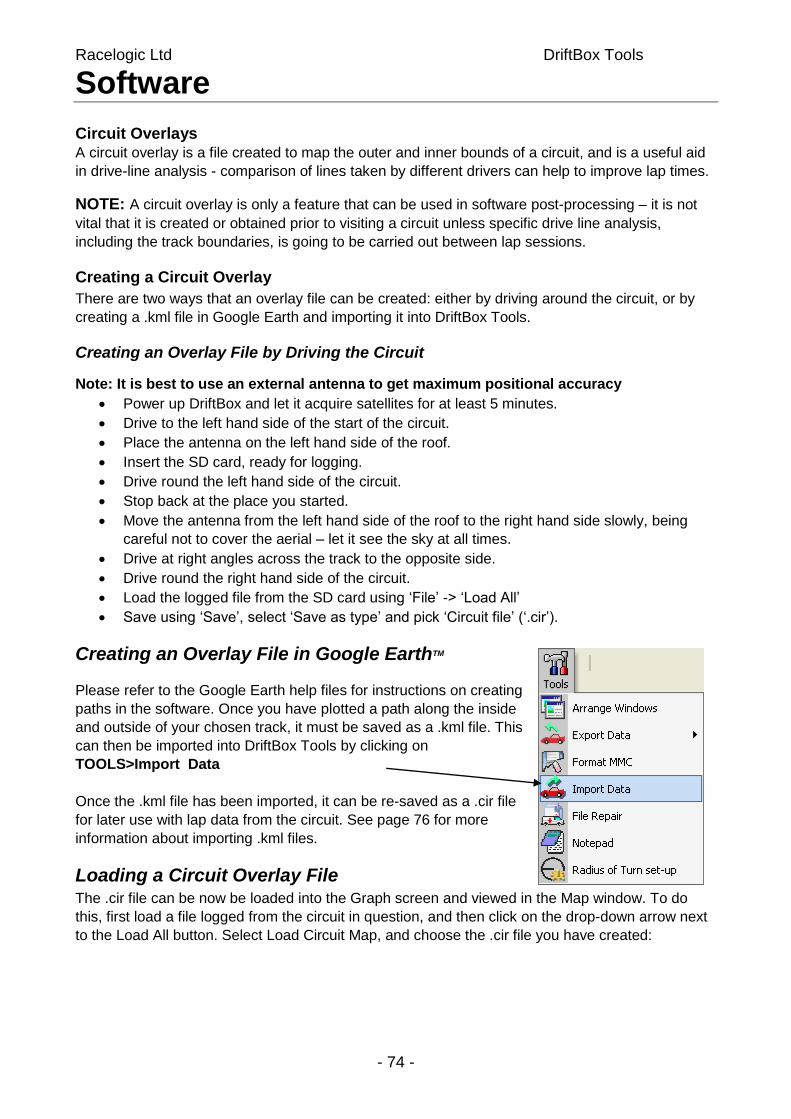
Racelogic Ltd DriftBox Tools Software
- 74 -
Circuit Overlays
A circuit overlay is a file created to map the outer and inner bounds of a circuit, and is a useful aid
in drive-line analysis - comparison of lines taken by different drivers can help to improve lap times.
NOTE: A circuit overlay is only a feature that can be used in software post-processing – it is not
vital that it is created or obtained prior to visiting a circuit unless specific drive line analysis,
including the track boundaries, is going to be carried out between lap sessions.
Creating a Circuit Overlay
There are two ways that an overlay file can be created: either by driving around the circuit, or by
creating a .kml file in Google Earth and importing it into DriftBox Tools.
Creating an Overlay File by Driving the Circuit
Note: It is best to use an external antenna to get maximum positional accuracy
Power up DriftBox and let it acquire satellites for at least 5 minutes.
Drive to the left hand side of the start of the circuit.
Place the antenna on the left hand side of the roof.
Insert the SD card, ready for logging.
Drive round the left hand side of the circuit.
Stop back at the place you started.
Move the antenna from the left hand side of the roof to the right hand side slowly, being
careful not to cover the aerial – let it see the sky at all times.
Drive at right angles across the track to the opposite side.
Drive round the right hand side of the circuit.
Load the logged file from the SD card using ‘File’ -> ‘Load All’
Save using ‘Save’, select ‘Save as type’ and pick ‘Circuit file’ (‘.cir’).
Creating an Overlay File in Google EarthTM
Please refer to the Google Earth help files for instructions on creating
paths in the software. Once you have plotted a path along the inside
and outside of your chosen track, it must be saved as a .kml file. This
can then be imported into DriftBox Tools by clicking on
TOOLS>Import Data
Once the .kml file has been imported, it can be re-saved as a .cir file
for later use with lap data from the circuit. See page 76 for more
information about importing .kml files.
Loading a Circuit Overlay File The .cir file can be now be loaded into the Graph screen and viewed in the Map window. To do
this, first load a file logged from the circuit in question, and then click on the drop-down arrow next
to the Load All button. Select Load Circuit Map, and choose the .cir file you have created:
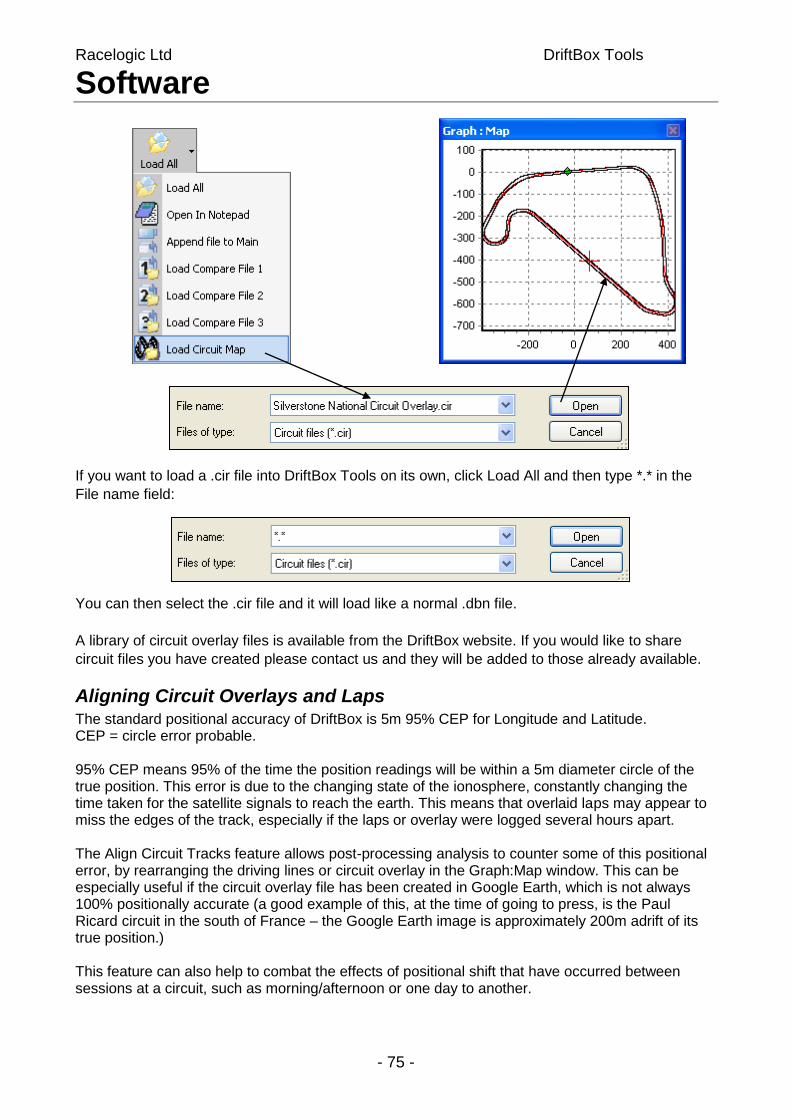
Racelogic Ltd DriftBox Tools Software
- 75 -
If you want to load a .cir file into DriftBox Tools on its own, click Load All and then type *.* in the
File name field:
You can then select the .cir file and it will load like a normal .dbn file.
A library of circuit overlay files is available from the DriftBox website. If you would like to share
circuit files you have created please contact us and they will be added to those already available.
Aligning Circuit Overlays and Laps The standard positional accuracy of DriftBox is 5m 95% CEP for Longitude and Latitude. CEP = circle error probable. 95% CEP means 95% of the time the position readings will be within a 5m diameter circle of the true position. This error is due to the changing state of the ionosphere, constantly changing the time taken for the satellite signals to reach the earth. This means that overlaid laps may appear to miss the edges of the track, especially if the laps or overlay were logged several hours apart. The Align Circuit Tracks feature allows post-processing analysis to counter some of this positional error, by rearranging the driving lines or circuit overlay in the Graph:Map window. This can be especially useful if the circuit overlay file has been created in Google Earth, which is not always 100% positionally accurate (a good example of this, at the time of going to press, is the Paul Ricard circuit in the south of France – the Google Earth image is approximately 200m adrift of its true position.) This feature can also help to combat the effects of positional shift that have occurred between sessions at a circuit, such as morning/afternoon or one day to another.
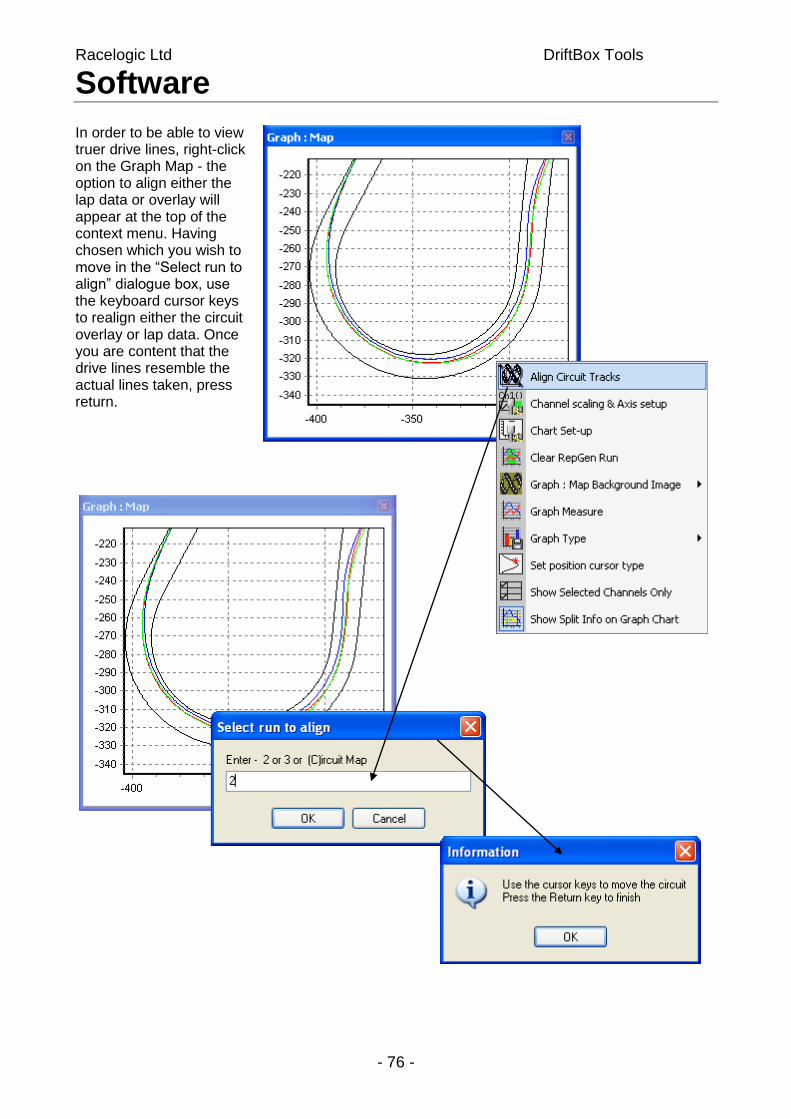
Racelogic Ltd DriftBox Tools Software
- 76 -
In order to be able to view truer drive lines, right-click on the Graph Map - the option to align either the lap data or overlay will appear at the top of the context menu. Having chosen which you wish to move in the “Select run to align” dialogue box, use the keyboard cursor keys to realign either the circuit overlay or lap data. Once you are content that the drive lines resemble the actual lines taken, press return.
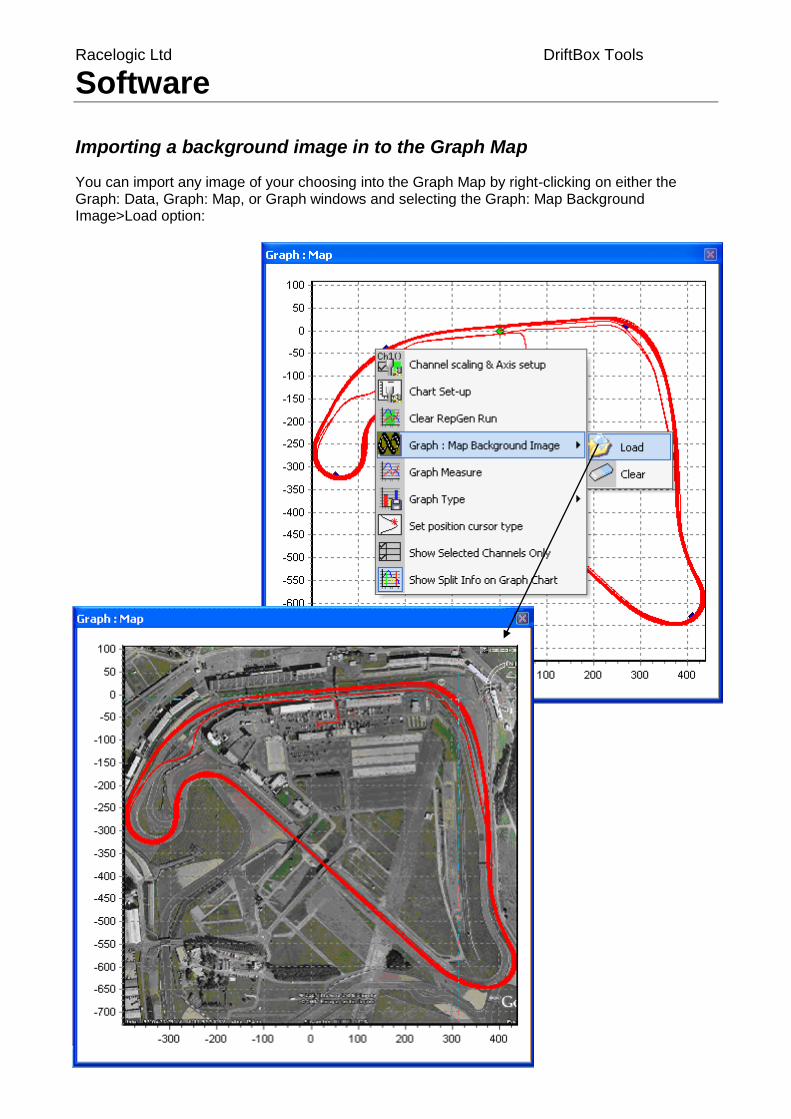
Racelogic Ltd DriftBox Tools Software
- 77 -
Importing a background image in to the Graph Map
You can import any image of your choosing into the Graph Map by right-clicking on either the Graph: Data, Graph: Map, or Graph windows and selecting the Graph: Map Background Image>Load option:
Racelogic Ltd DriftBox Tools Software
- 78 -
Performance Results Acceleration and deceleration results can be easily extracted from your logged data by using the various performance results tools. These are available by clicking on the ‘Accel results’ and ‘Decel results’ buttons on the Toolbar. You can extract speed or distance data for acceleration and deceleration runs. Most of the tests use standard parameters (such as 0-60 or 0-100) but custom results can also be produced.
Producing Acceleration Results Acceleration data can be produced and shown in a results table from the currently loaded data file by selecting one of the acceleration test options within the ‘Accel results’ drop down menu. Click on the ‘Accel results’ button to open a list of the following options:
0-VMax: This will tabulate speed, time and distance data, starting each time the velocity data has a value of zero up to the maximum speed reached during that acceleration period.
0-100 kmh (0-60 mph): This will tabulate speed, time and distance data, starting each time the velocity data goes from zero up to a speed of 100 km/h reached during that acceleration period.
0-160 kmh (0-100 mph): This will tabulate speed, time and distance data each time the velocity data goes from zero up to a speed of 160 km/h reached during that acceleration period.
0-160-0 kmh (0-100-0 mph): This will tabulate speed, time and distance data, starting each time the velocity data goes from zero up to a speed of 160 km/h then returning to 0 km/h reached during that acceleration - deceleration period.
100-200 kmh (60-130 mph): This will tabulate speed, time and distance data, starting each time the velocity data goes from 100 kmh up to a speed of 200 km/h reached during that acceleration period.
Qtr mile: This will tabulate speed, time and distance data, starting from zero to a total distance of a quarter mile (402.25m.)
60ft: This will tabulate speed, time and distance data, starting from zero to a total distance of 60 feet (18.7 m.)
30 ft: This will tabulate speed, time and distance data, starting from zero to a total distance of 30 feet (100 m when the units of measurement for distance are metric.)
Custom: This will tabulate speed, time and distance data, starting over a custom defined speed range e.g. 0-100-0 kmh.
For each of the test ranges the results table will show Speed, Time, and Distance in 10Kph or 10Mph steps.
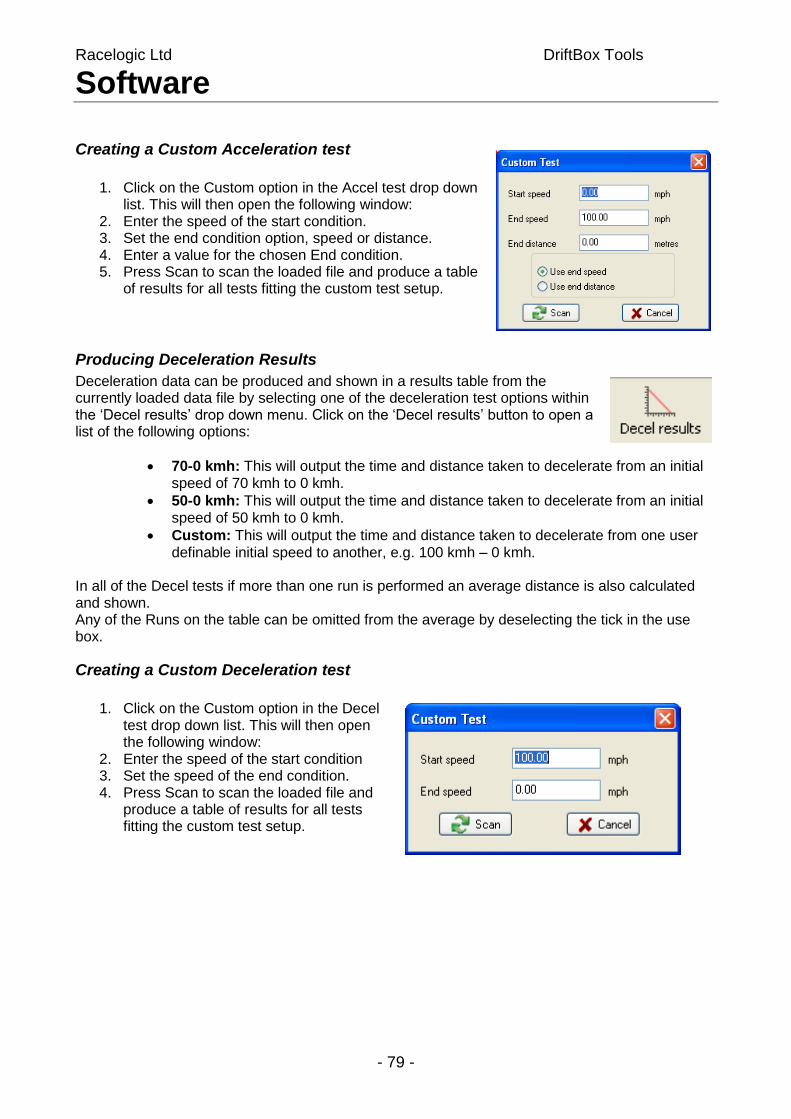
Racelogic Ltd DriftBox Tools Software
- 79 -
Creating a Custom Acceleration test
1. Click on the Custom option in the Accel test drop down
list. This will then open the following window: 2. Enter the speed of the start condition. 3. Set the end condition option, speed or distance. 4. Enter a value for the chosen End condition. 5. Press Scan to scan the loaded file and produce a table
of results for all tests fitting the custom test setup.
Producing Deceleration Results
Deceleration data can be produced and shown in a results table from the currently loaded data file by selecting one of the deceleration test options within the ‘Decel results’ drop down menu. Click on the ‘Decel results’ button to open a list of the following options:
70-0 kmh: This will output the time and distance taken to decelerate from an initial speed of 70 kmh to 0 kmh.
50-0 kmh: This will output the time and distance taken to decelerate from an initial speed of 50 kmh to 0 kmh.
Custom: This will output the time and distance taken to decelerate from one user definable initial speed to another, e.g. 100 kmh – 0 kmh.
In all of the Decel tests if more than one run is performed an average distance is also calculated and shown. Any of the Runs on the table can be omitted from the average by deselecting the tick in the use box.
Creating a Custom Deceleration test
1. Click on the Custom option in the Decel
test drop down list. This will then open the following window:
2. Enter the speed of the start condition 3. Set the speed of the end condition. 4. Press Scan to scan the loaded file and
produce a table of results for all tests fitting the custom test setup.
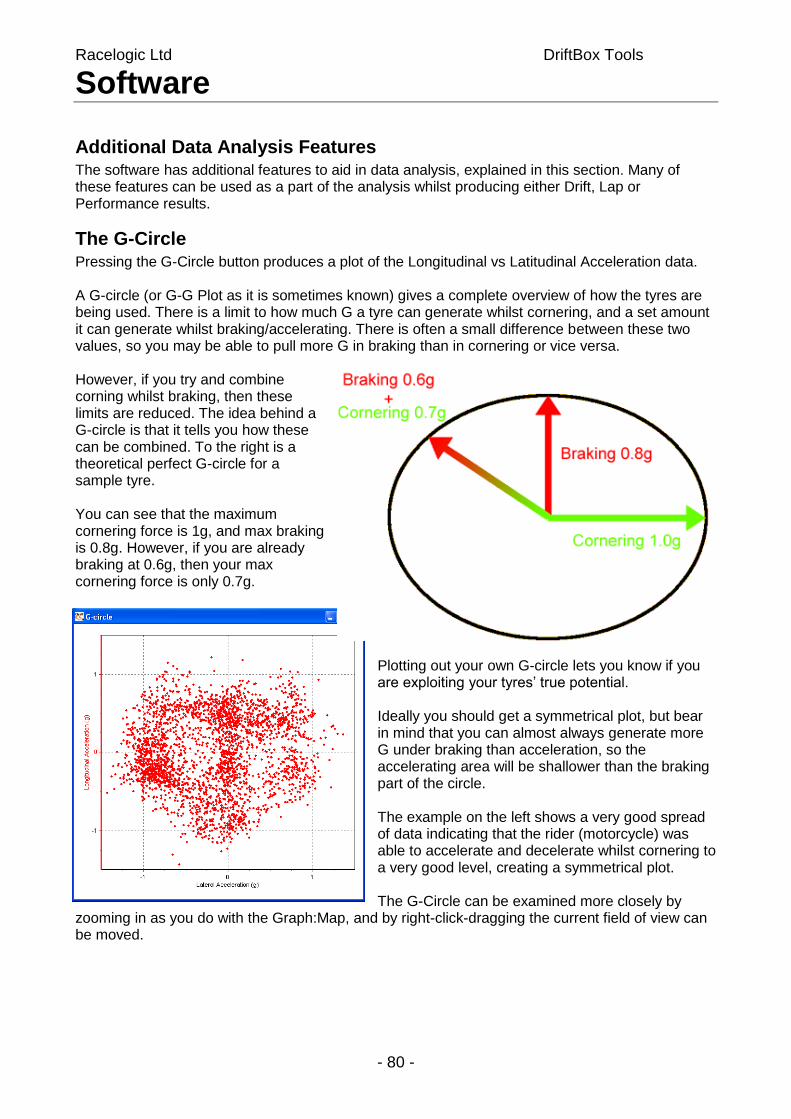
Racelogic Ltd DriftBox Tools Software
- 80 -
Additional Data Analysis Features The software has additional features to aid in data analysis, explained in this section. Many of these features can be used as a part of the analysis whilst producing either Drift, Lap or Performance results.
The G-Circle Pressing the G-Circle button produces a plot of the Longitudinal vs Latitudinal Acceleration data. A G-circle (or G-G Plot as it is sometimes known) gives a complete overview of how the tyres are being used. There is a limit to how much G a tyre can generate whilst cornering, and a set amount it can generate whilst braking/accelerating. There is often a small difference between these two values, so you may be able to pull more G in braking than in cornering or vice versa. However, if you try and combine corning whilst braking, then these limits are reduced. The idea behind a G-circle is that it tells you how these can be combined. To the right is a theoretical perfect G-circle for a sample tyre. You can see that the maximum cornering force is 1g, and max braking is 0.8g. However, if you are already braking at 0.6g, then your max cornering force is only 0.7g.
Plotting out your own G-circle lets you know if you are exploiting your tyres’ true potential. Ideally you should get a symmetrical plot, but bear in mind that you can almost always generate more G under braking than acceleration, so the accelerating area will be shallower than the braking part of the circle. The example on the left shows a very good spread of data indicating that the rider (motorcycle) was able to accelerate and decelerate whilst cornering to a very good level, creating a symmetrical plot. The G-Circle can be examined more closely by
zooming in as you do with the Graph:Map, and by right-click-dragging the current field of view can be moved.
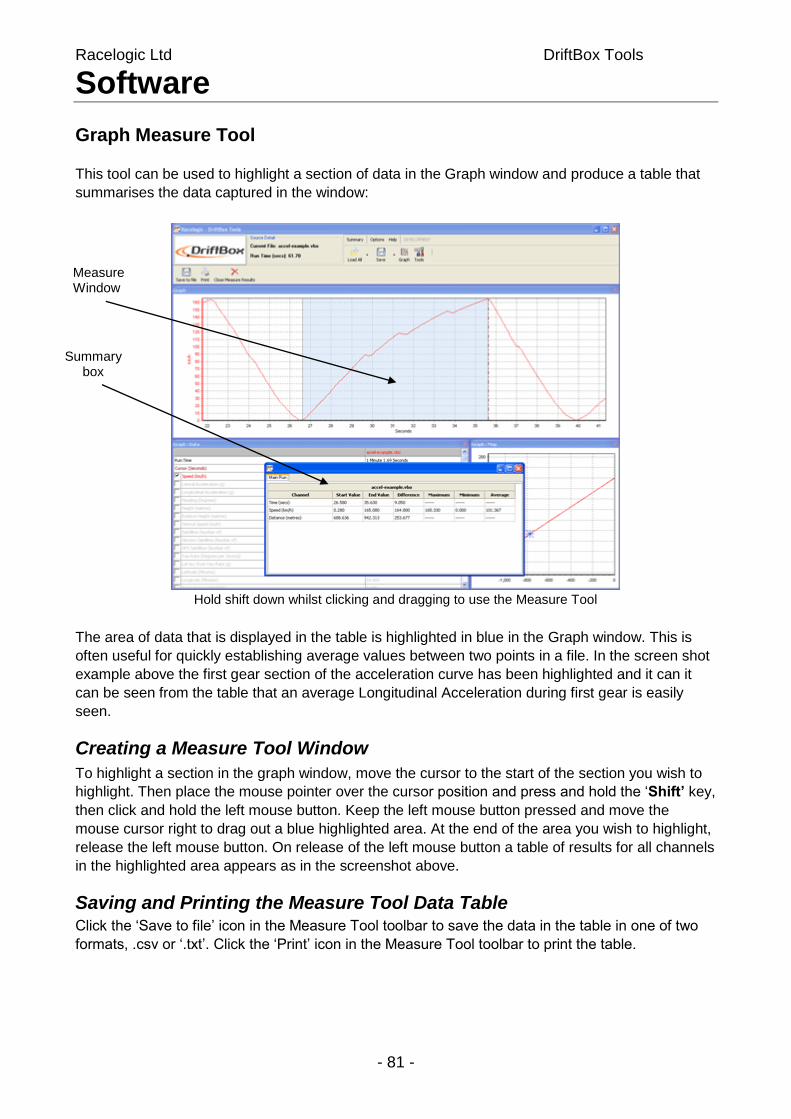
Racelogic Ltd DriftBox Tools Software
- 81 -
Graph Measure Tool This tool can be used to highlight a section of data in the Graph window and produce a table that
summarises the data captured in the window:
Hold shift down whilst clicking and dragging to use the Measure Tool
The area of data that is displayed in the table is highlighted in blue in the Graph window. This is
often useful for quickly establishing average values between two points in a file. In the screen shot
example above the first gear section of the acceleration curve has been highlighted and it can it
can be seen from the table that an average Longitudinal Acceleration during first gear is easily
seen.
Creating a Measure Tool Window
To highlight a section in the graph window, move the cursor to the start of the section you wish to
highlight. Then place the mouse pointer over the cursor position and press and hold the ‘Shift’ key,
then click and hold the left mouse button. Keep the left mouse button pressed and move the
mouse cursor right to drag out a blue highlighted area. At the end of the area you wish to highlight,
release the left mouse button. On release of the left mouse button a table of results for all channels
in the highlighted area appears as in the screenshot above.
Saving and Printing the Measure Tool Data Table Click the ‘Save to file’ icon in the Measure Tool toolbar to save the data in the table in one of two
formats, .csv or ‘.txt’. Click the ‘Print’ icon in the Measure Tool toolbar to print the table.
Measure Window
Summary box
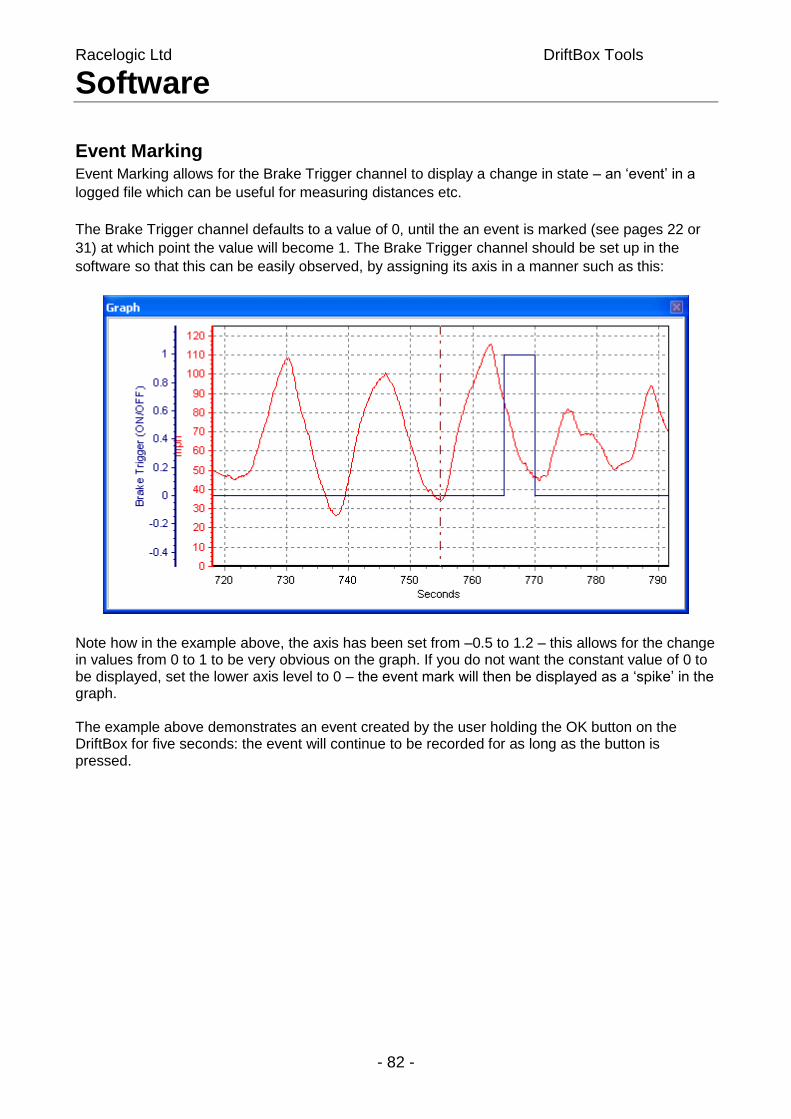
Racelogic Ltd DriftBox Tools Software
- 82 -
Event Marking Event Marking allows for the Brake Trigger channel to display a change in state – an ‘event’ in a
logged file which can be useful for measuring distances etc.
The Brake Trigger channel defaults to a value of 0, until the an event is marked (see pages 22 or
31) at which point the value will become 1. The Brake Trigger channel should be set up in the
software so that this can be easily observed, by assigning its axis in a manner such as this:
Note how in the example above, the axis has been set from –0.5 to 1.2 – this allows for the change in values from 0 to 1 to be very obvious on the graph. If you do not want the constant value of 0 to be displayed, set the lower axis level to 0 – the event mark will then be displayed as a ‘spike’ in the graph. The example above demonstrates an event created by the user holding the OK button on the DriftBox for five seconds: the event will continue to be recorded for as long as the button is pressed.
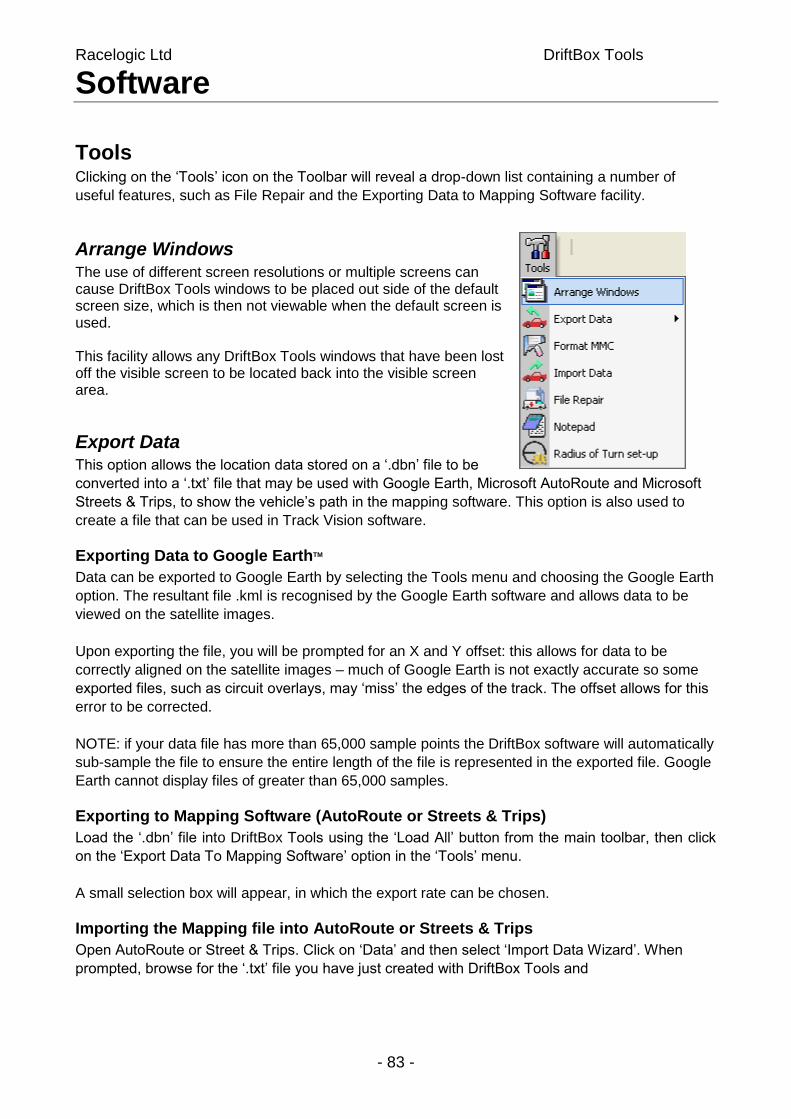
Racelogic Ltd DriftBox Tools Software
- 83 -
Tools Clicking on the ‘Tools’ icon on the Toolbar will reveal a drop-down list containing a number of
useful features, such as File Repair and the Exporting Data to Mapping Software facility.
Arrange Windows The use of different screen resolutions or multiple screens can cause DriftBox Tools windows to be placed out side of the default screen size, which is then not viewable when the default screen is used. This facility allows any DriftBox Tools windows that have been lost off the visible screen to be located back into the visible screen area.
Export Data This option allows the location data stored on a ‘.dbn’ file to be
converted into a ‘.txt’ file that may be used with Google Earth, Microsoft AutoRoute and Microsoft
Streets & Trips, to show the vehicle’s path in the mapping software. This option is also used to
create a file that can be used in Track Vision software.
Exporting Data to Google EarthTM
Data can be exported to Google Earth by selecting the Tools menu and choosing the Google Earth
option. The resultant file .kml is recognised by the Google Earth software and allows data to be
viewed on the satellite images.
Upon exporting the file, you will be prompted for an X and Y offset: this allows for data to be
correctly aligned on the satellite images – much of Google Earth is not exactly accurate so some
exported files, such as circuit overlays, may ‘miss’ the edges of the track. The offset allows for this
error to be corrected.
NOTE: if your data file has more than 65,000 sample points the DriftBox software will automatically
sub-sample the file to ensure the entire length of the file is represented in the exported file. Google
Earth cannot display files of greater than 65,000 samples.
Exporting to Mapping Software (AutoRoute or Streets & Trips)
Load the ‘.dbn’ file into DriftBox Tools using the ‘Load All’ button from the main toolbar, then click
on the ‘Export Data To Mapping Software’ option in the ‘Tools’ menu.
A small selection box will appear, in which the export rate can be chosen.
Importing the Mapping file into AutoRoute or Streets & Trips
Open AutoRoute or Street & Trips. Click on ‘Data’ and then select ‘Import Data Wizard’. When
prompted, browse for the ‘.txt’ file you have just created with DriftBox Tools and
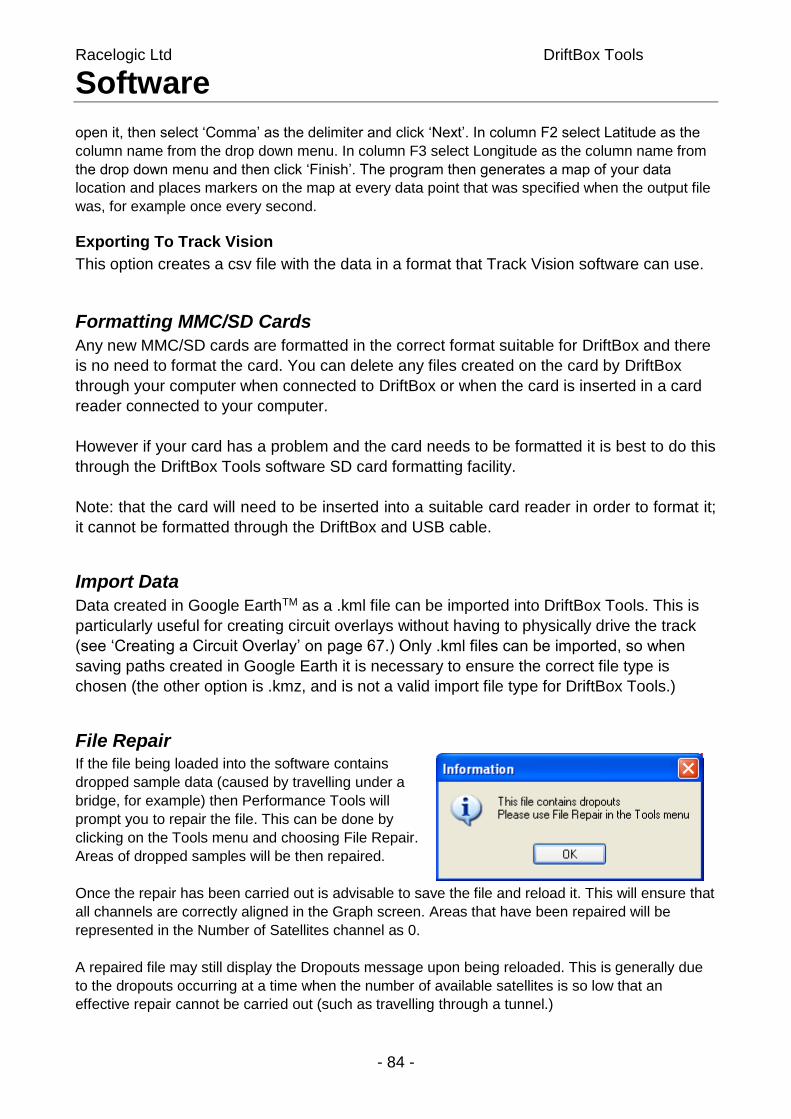
Racelogic Ltd DriftBox Tools Software
- 84 -
open it, then select ‘Comma’ as the delimiter and click ‘Next’. In column F2 select Latitude as the
column name from the drop down menu. In column F3 select Longitude as the column name from
the drop down menu and then click ‘Finish’. The program then generates a map of your data
location and places markers on the map at every data point that was specified when the output file
was, for example once every second.
Exporting To Track Vision
This option creates a csv file with the data in a format that Track Vision software can use.
Formatting MMC/SD Cards
Any new MMC/SD cards are formatted in the correct format suitable for DriftBox and there
is no need to format the card. You can delete any files created on the card by DriftBox
through your computer when connected to DriftBox or when the card is inserted in a card
reader connected to your computer.
However if your card has a problem and the card needs to be formatted it is best to do this
through the DriftBox Tools software SD card formatting facility.
Note: that the card will need to be inserted into a suitable card reader in order to format it;
it cannot be formatted through the DriftBox and USB cable.
Import Data
Data created in Google EarthTM as a .kml file can be imported into DriftBox Tools. This is
particularly useful for creating circuit overlays without having to physically drive the track
(see ‘Creating a Circuit Overlay’ on page 67.) Only .kml files can be imported, so when
saving paths created in Google Earth it is necessary to ensure the correct file type is
chosen (the other option is .kmz, and is not a valid import file type for DriftBox Tools.)
File Repair If the file being loaded into the software contains
dropped sample data (caused by travelling under a
bridge, for example) then Performance Tools will
prompt you to repair the file. This can be done by
clicking on the Tools menu and choosing File Repair.
Areas of dropped samples will be then repaired.
Once the repair has been carried out is advisable to save the file and reload it. This will ensure that
all channels are correctly aligned in the Graph screen. Areas that have been repaired will be
represented in the Number of Satellites channel as 0.
A repaired file may still display the Dropouts message upon being reloaded. This is generally due
to the dropouts occurring at a time when the number of available satellites is so low that an
effective repair cannot be carried out (such as travelling through a tunnel.)
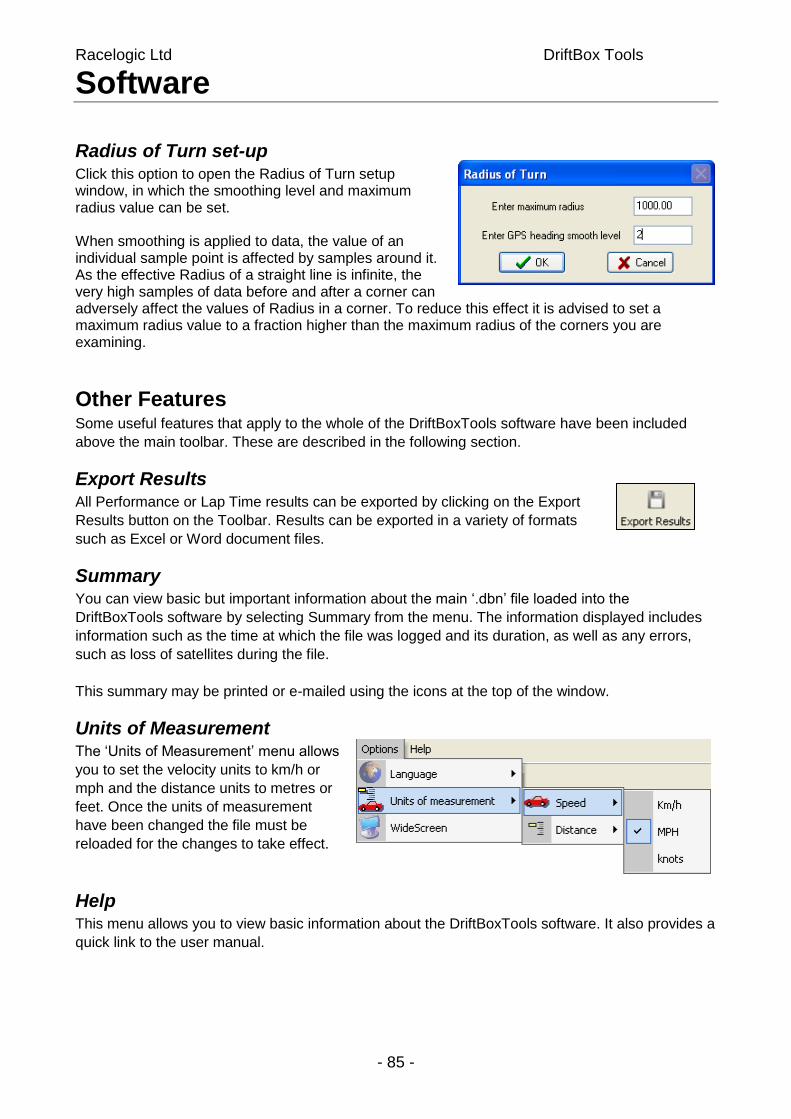
Racelogic Ltd DriftBox Tools Software
- 85 -
Radius of Turn set-up Click this option to open the Radius of Turn setup window, in which the smoothing level and maximum radius value can be set. When smoothing is applied to data, the value of an individual sample point is affected by samples around it. As the effective Radius of a straight line is infinite, the very high samples of data before and after a corner can adversely affect the values of Radius in a corner. To reduce this effect it is advised to set a maximum radius value to a fraction higher than the maximum radius of the corners you are examining.
Other Features Some useful features that apply to the whole of the DriftBoxTools software have been included
above the main toolbar. These are described in the following section.
Export Results All Performance or Lap Time results can be exported by clicking on the Export
Results button on the Toolbar. Results can be exported in a variety of formats
such as Excel or Word document files.
Summary You can view basic but important information about the main ‘.dbn’ file loaded into the
DriftBoxTools software by selecting Summary from the menu. The information displayed includes
information such as the time at which the file was logged and its duration, as well as any errors,
such as loss of satellites during the file.
This summary may be printed or e-mailed using the icons at the top of the window.
Units of Measurement The ‘Units of Measurement’ menu allows
you to set the velocity units to km/h or
mph and the distance units to metres or
feet. Once the units of measurement
have been changed the file must be
reloaded for the changes to take effect.
Help This menu allows you to view basic information about the DriftBoxTools software. It also provides a
quick link to the user manual.
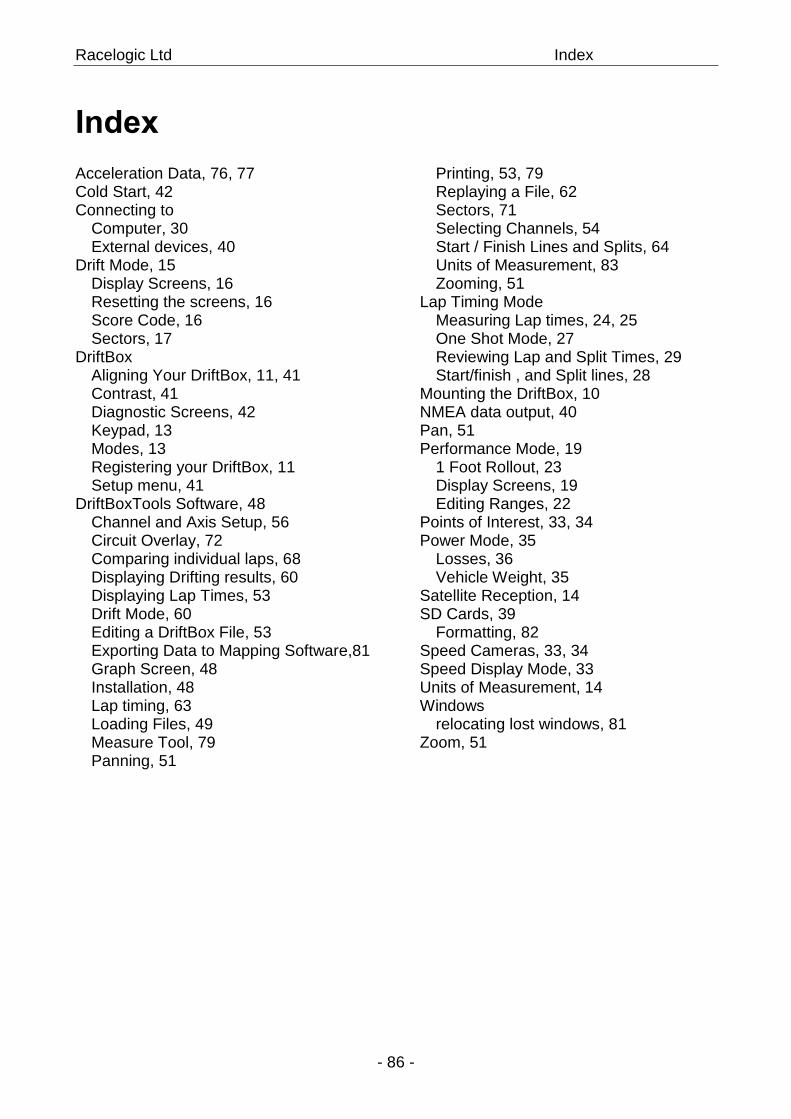
Racelogic Ltd Index
- 86 -
Index
Acceleration Data, 76, 77 Cold Start, 42 Connecting to
Computer, 30 External devices, 40
Drift Mode, 15 Display Screens, 16 Resetting the screens, 16 Score Code, 16 Sectors, 17
DriftBox Aligning Your DriftBox, 11, 41 Contrast, 41 Diagnostic Screens, 42 Keypad, 13 Modes, 13 Registering your DriftBox, 11 Setup menu, 41
DriftBoxTools Software, 48 Channel and Axis Setup, 56 Circuit Overlay, 72 Comparing individual laps, 68 Displaying Drifting results, 60 Displaying Lap Times, 53 Drift Mode, 60 Editing a DriftBox File, 53 Exporting Data to Mapping Software,81 Graph Screen, 48 Installation, 48 Lap timing, 63 Loading Files, 49 Measure Tool, 79 Panning, 51
Printing, 53, 79 Replaying a File, 62 Sectors, 71 Selecting Channels, 54 Start / Finish Lines and Splits, 64 Units of Measurement, 83 Zooming, 51
Lap Timing Mode Measuring Lap times, 24, 25 One Shot Mode, 27 Reviewing Lap and Split Times, 29 Start/finish , and Split lines, 28
Mounting the DriftBox, 10 NMEA data output, 40 Pan, 51 Performance Mode, 19
1 Foot Rollout, 23 Display Screens, 19 Editing Ranges, 22
Points of Interest, 33, 34 Power Mode, 35
Losses, 36 Vehicle Weight, 35
Satellite Reception, 14 SD Cards, 39
Formatting, 82 Speed Cameras, 33, 34 Speed Display Mode, 33 Units of Measurement, 14 Windows
relocating lost windows, 81 Zoom, 51
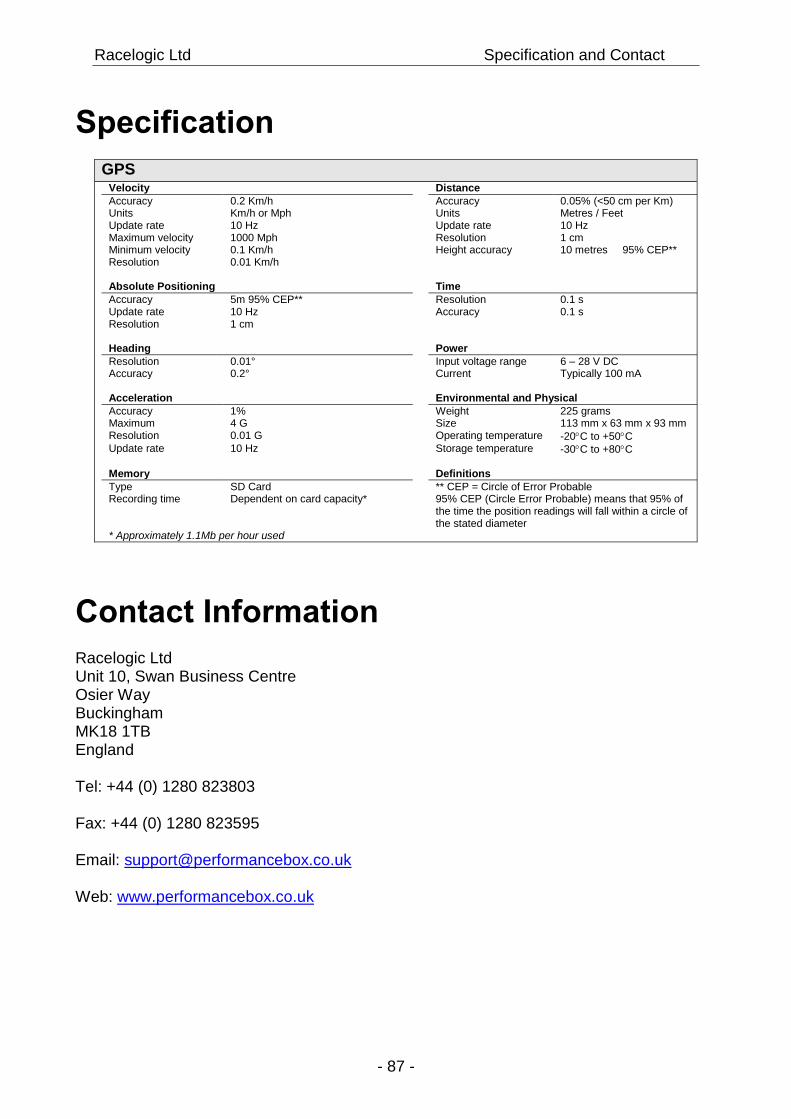
Racelogic Ltd Specification and Contact
- 87 -
Specification
GPS Velocity Distance
Accuracy 0.2 Km/h Accuracy 0.05% (<50 cm per Km) Units Km/h or Mph Units Metres / Feet Update rate 10 Hz Update rate 10 Hz Maximum velocity 1000 Mph Resolution 1 cm Minimum velocity 0.1 Km/h Height accuracy 10 metres 95% CEP** Resolution 0.01 Km/h Absolute Positioning Time
Accuracy 5m 95% CEP** Resolution 0.1 s Update rate 10 Hz Accuracy 0.1 s Resolution 1 cm Heading Power
Resolution 0.01° Input voltage range 6 – 28 V DC Accuracy 0.2° Current Typically 100 mA Acceleration Environmental and Physical
Accuracy 1% Weight 225 grams Maximum 4 G Size 113 mm x 63 mm x 93 mm Resolution 0.01 G Operating temperature -20C to +50C Update rate 10 Hz Storage temperature -30C to +80C Memory Definitions
Type Recording time
SD Card Dependent on card capacity*
** CEP = Circle of Error Probable 95% CEP (Circle Error Probable) means that 95% of the time the position readings will fall within a circle of the stated diameter
* Approximately 1.1Mb per hour used
Contact Information
Racelogic Ltd Unit 10, Swan Business Centre Osier Way Buckingham MK18 1TB England Tel: +44 (0) 1280 823803 Fax: +44 (0) 1280 823595 Email: [email protected] Web: www.performancebox.co.uk