Embed Size (px)
Citation preview

University of Montana University of Montana
ScholarWorks at University of Montana ScholarWorks at University of Montana
Graduate Student Theses, Dissertations, & Professional Papers Graduate School
2019
SOIL MOISTURE DRIVES CANOPY WATER CONTENT DYNAMICS SOIL MOISTURE DRIVES CANOPY WATER CONTENT DYNAMICS
IN THE WESTERN U.S. IN THE WESTERN U.S.
Drew S. Lyons
Follow this and additional works at: https://scholarworks.umt.edu/etd
Part of the Environmental Monitoring Commons
Let us know how access to this document benefits you.
Recommended Citation Recommended Citation Lyons, Drew S., "SOIL MOISTURE DRIVES CANOPY WATER CONTENT DYNAMICS IN THE WESTERN U.S." (2019). Graduate Student Theses, Dissertations, & Professional Papers. 11492. https://scholarworks.umt.edu/etd/11492
This Thesis is brought to you for free and open access by the Graduate School at ScholarWorks at University of Montana. It has been accepted for inclusion in Graduate Student Theses, Dissertations, & Professional Papers by an authorized administrator of ScholarWorks at University of Montana. For more information, please contact [email protected].

i
SOIL MOISTURE DRIVES CANOPY WATER CONTENT DYNAMICS IN THE WESTERN
U.S.
By
DREW STOCKWELL LYONS
B.S., University of Washington, Seattle, WA, 2014
Thesis
Presented in partial fulfillment of the requirements
for the degree of
Master of Science
In Forestry
The University of Montana
Missoula, MT
December 2019
Approved by:
Scott Whittenburg, Dean of The Graduate School
Graduate School
Solomon Dobrowski, Chair
Department of Forest Management
Andrew Larson
Department of Forest Management
Zack Holden
Department of Geography

ii
Lyons, Drew, Master of Science, December 2019 Forestry
Soil Moisture Drives Canopy Water Content Dynamics in the Western U.S.
Chairperson: Solomon Dobrowski
Drought stress is a major contributing factor to adult tree mortality and limits regeneration across
the globe. Drought effects are often studied on a site level, but recent advances in remote sensing
allow for observations of plant water status across broader geographic scales. The vegetation
optical depth (VOD) derived from satellite sensor microwave backscatter has been shown to be
sensitive to canopy water content, and can therefore provide useful information on how plant
water status changes over time. We develop an index which quantifies the normalized difference
between diurnal VOD retrievals (nVOD) across the western U.S. to determine where plant water
status is sensitive to variations in water supply (soil moisture) and atmospheric water demand
(VPD). Diurnal variability in canopy water content (as expressed through nVOD) was most
sensitive to soil moisture variation at intermediate water deficits and sites with low tree cover.
These areas occur in ecotones between forest and grasslands or shrublands, and also occur at
values of climatic water deficit (CWD) where nVOD is most sensitive to both soil moisture and
VPD variation.

iii
Table of Contents
Abstract.........................................................................................................................................ii
Introduction...................................................................................................................................1
Methods..........................................................................................................................................4
Results...........................................................................................................................................10
Discussion.....................................................................................................................................11
Conclusion....................................................................................................................................18
Tables............................................................................................................................................20
Figures...........................................................................................................................................21
References.....................................................................................................................................27
Supplemental Figures..................................................................................................................33
1
Introduction
Forest mortality rates have more than doubled in the western United States over the last 40 years
(Van Mantgem et al., 2009). Elevated temperatures and increased water stress that characterize
drought have been implicated as the largest contributing factors to the rising mortality rates
observed across the globe (Allen et al., 2010). Drought events are occurring more frequently and
with higher severity, and these trends are projected to continue as climate change progresses
(Meehl et al., 2007). While negative impacts of drought have been observed in most ecosystems,
research suggests that populations at dry range edges are less buffered from climate impacts and
are more likely to exhibit increased mortality and regeneration failure under drought stress
(Anderegg, Anderegg, Kerr, & Trugman, 2019; Davis et al., 2019; Young et al., 2017). These
dry range edges are often transitional zones between plant physiognomic types where species
live near the extent of their climatic tolerance. Moreover, these ecotones experience larger
climatic variance due to greater land surface-atmosphere coupling (Koster et al., 2004;
Seneviratne et al., 2010; Seneviratne, Lüthi, Litschi, & Schär, 2006), which potentially exposes
dry edge species to larger negative impacts under directional climate shifts towards hotter and
drier conditions.
Drought is characterized by higher than normal temperatures and reduced precipitation, which
affects plants by both increasing evaporative demand through rising vapor pressure deficit (VPD)
and decreasing available soil moisture. Although warm temperature can accelerate soil drying
through evapotranspiration, only precipitation recharges soil moisture. Precipitation dynamics
are thus a first order control on soil moisture. Research addressing plant responses to drought
often focus on temperature/VPD (Novick et al., 2016; Williams et al., 2010) or precipitation and
soil moisture dynamics (Goulden & Bales, 2019; Schwantes et al., 2018; Simeone et al., 2018),
but it is recognized that both water supply and demand play a crucial role (Stephenson, 1990).
Indeed, water supply and atmospheric demand are fundamentally linked (Trenberth & Shea,
2005). Decreasing summer precipitation across much of the western U.S. has enhanced
atmospheric aridity, challenging our ability to attribute drought induced vegetation change to
either supply or demand (Holden et al., 2018).
2
There is mixed evidence on the relative importance of water supply and demand to plant growth
and response to drought. Increasing temperatures and atmospheric demand have been identified
as the primary contributing variables to drought stress in the southwestern U.S. (Williams et al.,
2013), and as a greater limiting factor to evapotranspiration than soil moisture in mesic forests at
Ameriflux sites across the U.S. (Novick et al., 2016). However, soil moisture can impact
vegetation productivity and transpiration regardless of VPD, especially at moderate to low levels
of soil wetness (Seneviratne et al., 2010; Stocker et al., 2019). Papagiannopoulou et al. (2017)
found that global vegetation dependence upon water availability has been under reported, with
semi-arid and transitional ecosystems being primarily water-limited. Limited water availability
was also largely responsible for the extensive forest mortality during the 2012-2015 California
drought (Goulden & Bales, 2019) and the reduced vegetation productivity during the 2003
European drought (Reichstein et al., 2007). Decreased supply and increased demand are often
highly correlated over extended time periods, and land-atmosphere feedbacks between the two
can magnify drought impacts (Holden et al., 2018; Martinez-Vilalta, Anderegg, Sapes, & Sala,
2019; Seneviratne et al., 2010; Zhou et al., 2019) . However, VPD is more sensitive to
temperature, which is widely predicted to increase globally as climate changes, while the impacts
of climate change on precipitation and moisture availability are more variable (Burke & Brown,
2008; Dannenberg, Wise, & Smith, 2019; IPCC, 2013; Novick et al., 2016; Pendergrass, Knutti,
Lehner, Deser, & Sanderson, 2017). Therefore, it is important to understand how vegetation
sensitivity to VPD and soil moisture dynamics varies spatially and in time to better quantify
regional drought susceptibility as climate changes. Here, we seek to understand the relative
influence of soil moisture and VPD variation on plant water status via their effects on canopy
water content in the western U.S.
Drought affects both plant growth and mortality risk. Drought limits plant growth, which has
been shown to be a precursor to mortality (Anderegg et al., 2015; Berdanier & Clark, 2016;
Bigler, Gavin, Gunning, & Veblen, 2007; Camarero, Gazol, Sangüesa-Barreda, Oliva, &
Vicente-Serrano, 2015; Carnicer et al., 2011; Guada, Camarero, Sánchez-Salguero, & Cerrillo,
2016). Moreover, drought-induced mortality can occur through reduction in plant relative water
content and hydraulic failure (Anderegg et al., 2015; Martinez-Vilalta et al., 2019; Mcdowell et
al., 2008; Simeone et al., 2018). The influence of drought on plant water status is most often

3
studied on a site level during natural or experimental drought using measurements such as leaf
water potential (LWP) and percent loss of hydraulic conductance (PLC) (Anderegg et al., 2013;
Choat et al., 2012; Martinez-Vilalta, Anderegg, McDowell et al., 2008). More recently, studies
have emphasized the utility of relative water content (RWC) as a useful indicator of incipient
mortality given its linkage to plant water supply and osmotic regulation (Martinez-Vilalta et al.,
2019; Sapes et al., 2019). While individual measurements have been successful in
parameterizing and simulating the effect of drought on plant water status at the watershed scale
(Anderegg et al., 2015; Simeone et al., 2018), remote sensing offers the possibility to expand
monitoring to regional or larger scales.
Remotely sensed vegetation optical depth data (VOD), which is derived from satellite-based
microwave backscatter, has been identified as a means to measure broad-scale vegetation canopy
water dynamics. High frequency microwaves do not fully penetrate the canopy, and therefore
VOD retrievals using short wavelengths are minimally influenced by surface soil moisture,
primarily picking up backscatter from leaves and the upper canopy (Konings & Gentine, 2017;
Konings, Rao, & Steele-Dunne, 2019). VOD has been related to plant water status metrics
including: 1) volumetric water content (VWC) (Konings & Gentine, 2017; Konings et al., 2019),
2) LWP and above ground biomass (Momen et al., 2017), 3) RWC of plant canopies for
predicting tree mortality from the 2012-2015 California drought (Rao, Anderegg, Sala, Martínez-
Vilalta, & Konings, 2019), 4) a stomatal sensitivity index and drought coupling metric
(Anderegg et al., 2018; Konings, Williams, & Gentine, 2017; Konings & Gentine, 2017; Li et al.,
2017), 5) and seasonal canopy water content patterns in the African tropics (Konings et al.,
2017). Negative anomalies in the diurnal differences from microwave backscatter have also been
shown to correlate with drought events over croplands in the USA, suggesting that the VOD
signal is sensitive to drought stress when there is insufficient water available for plants to
rehydrate (Schroeder, McDonald, Azarderakhsh, & Zimmermann, 2016).
VOD has also been shown to be sensitive to above-ground biomass (Tian et al., 2016) which can
potentially obscure our understanding of changes in plant water status. Consequently, we utilize
long term VOD retrievals to examine the relative influence of soil moisture and VPD variation
on canopy water content while accounting for the effects of varying biomass. As in other studies,

4
we assume that negative deviations between night and day VOD retrievals (∆) during the
growing season signify that the plants are unable to replace water lost to transpiration during the
day and are therefore experiencing some degree of water stress (Frolking et al., 2011; Schroeder
et al., 2016). After accounting for the influence of seasonal changes in LAI we anticipate that
positive diurnal anomalies in VPD (drier atmosphere) will result in negative diurnal anomalies in
VOD (Fig. 1a), whereas we expect positive anomalies in soil moisture (greater soil moisture) to
result in positive anomalies in VOD (Fig. 1b). If canopy water content is insensitive to
supply/demand then we expect the relationships with VOD to be decoupled (Fig. 1).
In this analysis we seek to answer two questions. First, where is canopy water content most
sensitive to soil moisture and VPD variation and what characterizes these sites? Identifying areas
where canopy water content is particularly sensitive to variation in supply and demand of water
may provide insights into those regions in which we may expect climate impacts due to drought
induced mortality. Secondly, can we identify the relative influence of VPD and soil moisture
variation on canopy water content and does this vary spatially? Although recent work has noted
that VPD and soil moisture variation are often coupled (Novick et al., 2016; Seneviratne et al.,
2010; Zhou et al., 2019), these drivers have different rate constants with VPD varying at higher
temporal frequencies than soil moisture (Figs. 2a & S4; Koster et al., 2004). Higher variation in
VPD can kill trees through extreme events (Kolb & Robberecht, 1996), whereas slower soil
moisture variation is likely to trigger mortality over longer periods as progressive loss of
hydraulic conductance causes RWC to cross mortality thresholds (Martinez-Vilalta et al., 2019;
Mcdowell et al., 2008; Sapes et al., 2019; Simeone et al., 2018). Disentangling their relative
influence on canopy water content may provide context for interpreting the relative importance
of projected temperature and precipitation changes for the coming century.
Methods
Data
VOD data used in this study comes from the X-band (10.7 GHz) of the Advanced Microwave
Scanning Radiometer for EOS (AMSR-E) sensor that launched in May 2002 and then failed in
5
October 2011, and the Advanced Microwave Scanning Radiometer 2 (AMSR2) on the Global
Change Observation Mission-1st Water (GCOM-W1) satellite that launched in July 2012. The
data includes 25km resolution ascending (daytime at 1:30 pm local time) and descending
(nighttime at 1:30 am local time) daily overpasses for the complete years 2003 to 2018 retrieved
using the Land Parameter Retrieval Model (LPRM) algorithm (Owe, de Jeu, & Holmes, 2008),
cropped to the extent of the Western United States (latitudes from 31 - 50 N, longitudes from
102 - 125 W). Continuity between both sensors was handled using the X-band VOD from the
land parameter data record (Du et al., 2017) (LPDR) generated from intercalibrated temperature
brightness between the Advanced Microwave Scanning Radiometer for EOS (AMSR-E) and its
successor AMSR2. The intercalibration removed noted biases in AMSR2 retrievals and allowed
for a cohesive dataset spanning the duration of both products. While the VOD mean and
variation between the two sensors is consistent, potential LPDR biases in the underlying
brightness temperature used for calibration have still been identified (Du et al., 2017; Rao et al.,
2019). As we have standardized our data by mean and standard deviation, which is consistent
across sensors, we do not believe that this is a problem for our application. Data used spanned
from 2003 to 2018, with a gap between October 4, 2011 and May 18, 2012 when AMSR-E was
out of operation and AMSR-2 had not yet launched. The LPDR product flags and removes pixels
where land surface temperature < 273 K (assumed frozen soil) and where significant rainfall
occurred. We also removed daily observations where both day and night retrievals were not
present.
Daytime and nighttime VOD observations were filtered using the methods from Konings &
Gentine (2017) in order to mask out areas in the western US with problematic pixels. VOD daily
pixels where the AMSR2 LPRM derived land surface temperature < 273 K (assumed frozen soil)
were removed, as well as pixels on days where rainfall occurred in order to minimize the
influence of canopy water interception. Rainfall data was taken from the PRISM climate group
(Daly, Taylor, & Gibson, 1997), and aggregated from 4km to 25km to match the AMSR2 VOD
resolution. Pixels where the average VOD over the 2013-2018 AMSR2 record is less than 0.1 are
assumed to be unvegetated and removed from the data record so as not to pick up backscattering
from surface soil water (Konings & Gentine, 2017). After filtering out problematic VOD
retrievals, daily observations that do not have both a daytime and nighttime retrieval are removed

6
and pixels that do not have at least 150 pairs of daytime and nighttime VOD retrievals are
identified as having insufficient temporal coverage and removed (Alexandra G. Konings &
Gentine, 2017). Within the western U.S., we randomly subset 1000 points meeting the criteria
above and extracted the LPDR VOD difference between night and day (∆) for each pixel to
include the full cohesive AMSR-E and AMSR2 record.
Daily VPD data was retrieved from the gridded meteorological climatology database gridMET
(Abatzoglou, 2013) at a 4km resolution spanning the full years 2003-2018, cropped and
aggregated to the 25km resolution of the VOD data.
LAI data was retrieved across the years 2003-2018 from the 1 km resolution NASA MCD15A3H
MODIS product (Myneni, Knyazikhin, Park, 2015), which combines the best acquisitions from
the sensors on both the Terra and Aqua satellites to retrieve data over a 4-day period. The data
was filtered using the quality assurance data field to filter out LAI retrieval pixels with high
cloud cover and errors in the main retrieval algorithm. LAI data was then cropped, aggregated to
25 km resolution, and linearly interpolated to daily observations to match the VOD data.
Soil moisture data across the years 2003-2018 was extracted from daily soil moisture grids with
250-meter resolution from TOPOFIRE (Holden et al., 2019) for centroid coordinates of the 1000
pixels selected randomly from the cropped AMSR2 data with sufficient temporal coverage after
the filtering described above. Briefly, the soil moisture grids were developed using a simple
single layer daily soil water balance model, with terrain-resolved radiation, temperature and
humidity grids as inputs, and a simple snow model described by Holden et al. (2018).
Evapotranspiration was modeled using the Penman-Monteith equations recommended by the
Food and Agriculture Organization (FAO; Allen, Pereira, Raes, & Smith, 1998) and adapted
from the monthly model described by Dobrowski et al. (2013). In situ soil moisture data was also
accessed through TOPOFIRE (Holden et al., 2019) for 331 combined snow telemetry (SNOTEL)
and soil climate analysis network (SCAN) stations across the western U.S. that collected soil
volumetric water content measurements at 8 inch depth across the years 2015-2018.

7
To determine if a plant exhibited water stress in response to changes in drought status we
examined the sensitivity of the normalized difference between night and day VOD (nVOD; Eq.
1) over the growing season (defined as April-September) to changes in normalized VPD, soil
moisture, and LAI (Eqs. 2-4). To remove the inherent seasonality of the data, daily z-scores were
calculated using the formulas:
nVOD = (1)
VPD z-score = (2)
LAI z-score = (3)
SM z-score = (4)
where ∆ = the difference between night and day VOD retrievals; s = standard deviation; i
represents daily observations during the growing season (April – September) across the study
period (2003-2018); and j = +/- 5 day window centered on i across all years in the study period.
We used climate normals for climatic water deficit (CWD) over the study period to examine how
our model coefficients vary over climate gradients. Monthly derived estimates of CWD for the
western U.S. were acquired from TerraClimate (Abatzoglou, Dobrowski, Parks, & Hegewisch,
Δi− mean j (Δi)
sj(Δi)
vpdi− mean j (vpd i)
sj(vpdi)
laii− mean j(lai i)
sj(laii )
smi− mean j (smi)
sj (smi)
8
2018) covering the period 2003-2017 (2018 data was not available at time of access) at 4km
resolution and were aggregated to 25km to match the VOD data resolution. Monthly values were
summed each year to get annual CWD, and then averaged to get mean annual CWD for the
western U.S. at 25km resolution.
Forest cover was taken from the MODIS MOD44B vegetation continuous fields (VCF) data
product at 250-meter resolution for the year 2016 (Dimiceli, Carrol, Sohlberg, Kim, &
Townshend, 2015). Data was cropped and aggregated to 25km to match VOD data.
Land classification data was taken from National Lands Cover Database (NLCD) 2016 (Yang et
al., 2018). Initially resampled from 30 meters to 100 meters using nearest neighbor interpolation,
data was then aggregated to 25km by summing the total number of present pixels and dividing
by the total number of pixels within the 25km to get fractional cover for each classification type.
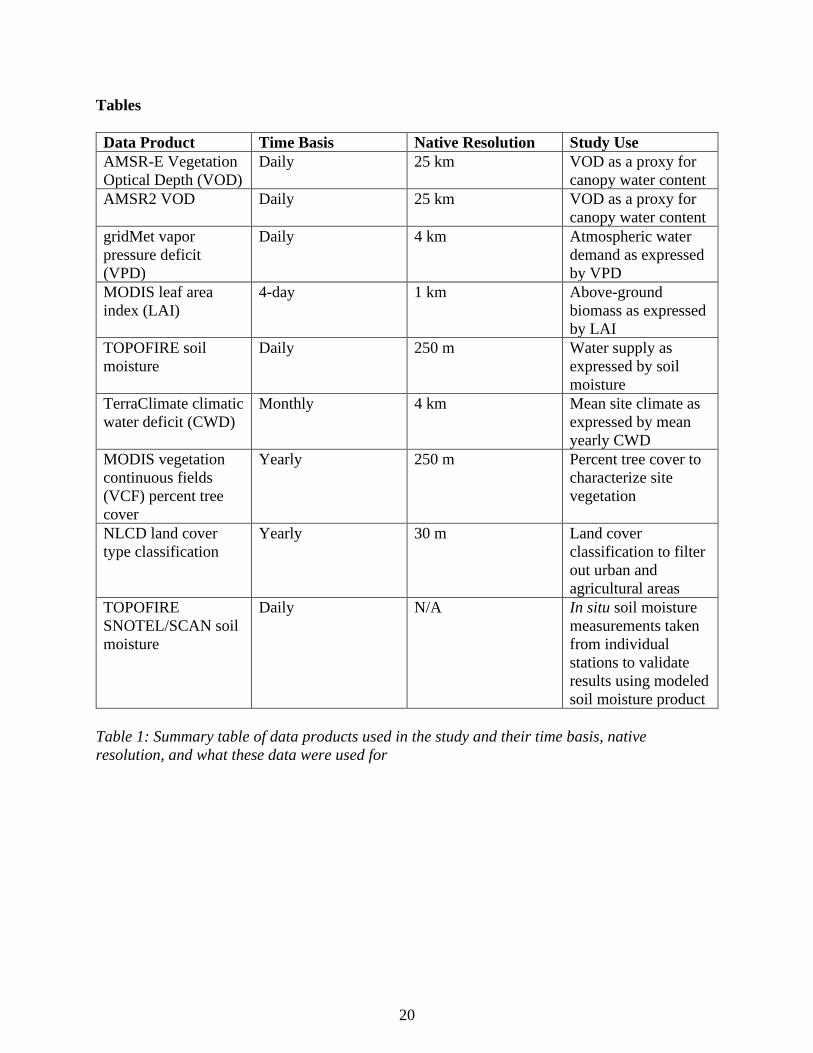
All data sources in this study are summarized in Table 1.
Analysis
All analysis was done in R (R Core Team, 2018), and all variables and climate information were
prepared using the raster package (Hijmans, 2017) before daily data extraction. We extracted the
LPDR VOD data at the subset of 1000 points to utilize the fused AMSR-E and AMSR2 record.
From those 1000 points, 100 were removed because they were just outside the US domain of the
gridMet VPD data, and a further 178 were removed because the 25km pixel contained greater
than 20% of agriculture/urban land cover. The remaining 722 25km pixels (Fig. 2b) across the
western US are treated as independent ‘sites’ over which we examine the relationship between
nVOD and drought metrics.
At each site, daily time series (Fig. 2a) were developed for nVOD and biophysical drivers (soil
moisture and VPD). To isolate effects of soil moisture and VPD, we first removed the effect of
LAI on nVOD by fitting a general additive model (GAM) relating nVOD to LAI z-scores and
then extracting the residuals of this fit from the nVOD time series. We used the GAM function
from the mgcv package (Wood, 2011) with 4 degrees of freedom to avoid model overfitting.
9
We then fitted a multiple linear regression using soil moisture and VPD z-scores as the
predictors and the GAM nVOD residuals as the response variable. We calculated correlograms
for each time series to visualize serial autocorrelation, and then adjusted standard error estimates
of the model coefficients using a Newey-West estimator (Newey & West, 1986) to account for
this autocorrelation and re-ran a coefficient test to assess updated p-values. We then extracted
standardized coefficients, model R2, and updated p-values which account for serial
autocorrelation. Since all variables are standardized, the coefficients can be interpreted as
dimensionless sensitivity indices of the response variable to the predictors.
We compared linear model coefficients to site climatic conditions as represented by the mean
annual CWD to examine how nVOD sensitivity differed across a water availability gradient. We
additionally examined how nVOD coefficients varied as a function of temporal climate
variability using the standard deviation of annual CWD values. The relationships between the
coefficients and climate conditions were curvilinear and were fitted with GAMs. Lastly, we
examined the relationships between model coefficients and tree cover.
To supplement the linear regression analysis, we constructed a separate boosted regression tree
(BRT) model for each site using the gbm.step function from the dismo R package (Hijmans,
Phillips, Leathwick, & Elith, 2017). We utilized a learning rate and bag fraction set to .005 and
0.6 respectively to model the sensitivity of nVOD to daily LAI, soil moisture, and VPD z-scores.
We extracted relative variable influences, cross validation correlation means, and partial
dependence plots for the BRTs at each site.
To further corroborate our results obtained using modeled soil moisture, we repeated both the
linear regression and BRT analysis using nVOD, LAI, and VPD data at pixels containing
SNOTEL soil moisture measurements. nVOD, LAI, and VPD z-scores were calculated over the
full timespan, while SNOTEL soil moisture z-scores were calculated over the years of available
observational data (2015-2018).

10
Results
Soil moisture and VPD linear model (LM) coefficients were significant (p-value < .05) at 642
and 458 of the 722 sites (75% and 63%) respectively in the final analysis. 655 of the 722 sample
sites (91%) exhibited greater sensitivity to soil moisture than to VPD, with larger standardized
coefficient absolute values than VPD. The difference in variable influence can be observed in the
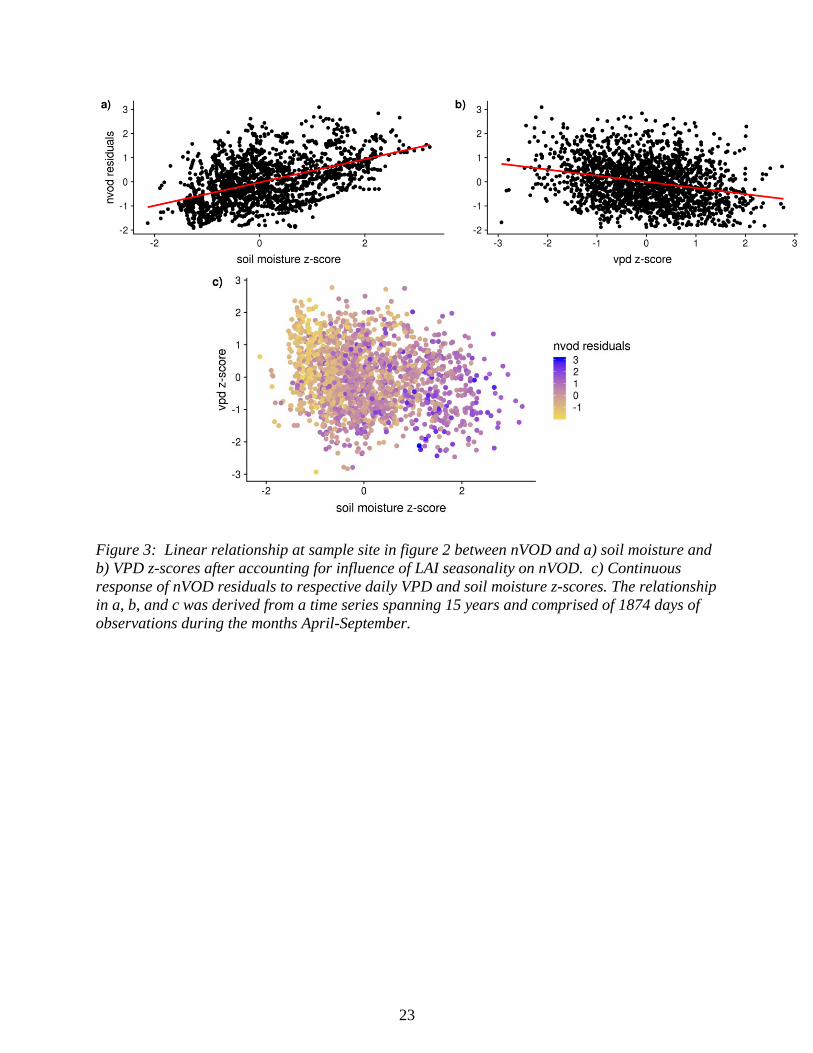
example time series (Fig. 2a) and regression results (Figs. 3a & 3b) for a single site. The time
series shows that daily nVOD dynamics more closely resemble those of normalized soil moisture
than VPD. This is further reflected in the regression results that display a tighter nVOD LM fit
with soil moisture, as well as in figure 3c where low nVOD values are primarily concentrated at
the lowest soil moistures regardless of the corresponding VPD value. These variable
contributions to the nVOD response are reinforced by the site partial dependence plots from our
BRT analysis (Fig. S1). Although the variables at some sites show a degree of nonlinearity, the
overall BRT results correspond with the results from the linear models. VPD standardized
coefficients exhibited greater absolute values in the Southwestern states of Arizona, Utah, New
Mexico, and Colorado, while the bulk of both insignificant VPD and soil moisture coefficients
occurred in the Pacific Northwest (Fig. 4).
LM VPD and soil moisture coefficients exhibited respective minimums (large negative
coefficients) and maximums (large positive coefficients) respectively at a similar mean annual
site CWD of roughly 800 mm; the absolute value of the coefficients declined as CWD increased
and leveled off for both soil moisture and VPD between 1200- and 1500-mm (Fig. 5). Soil
moisture coefficients were better explained by the curvilinear relationship to CWD than the VPD
coefficients; GAM deviance explained (D2) values were 0.31 and 0.18 respectively. The general
patterns observed in both the relative influence of coefficients and the coefficient relationship
with CWD are also present in the SNOTEL analysis using in situ soil moisture measurements
(Fig. S2). There is, however, more uncertainty in these models given that they were fit using 4
years of data. Moreover, SNOTEL stations are primarily located in more mesic, higher elevation
areas with lower deficits. Thus, we do not observe leveling off in the coefficient relationship
with CWD (Fig. S2).

11
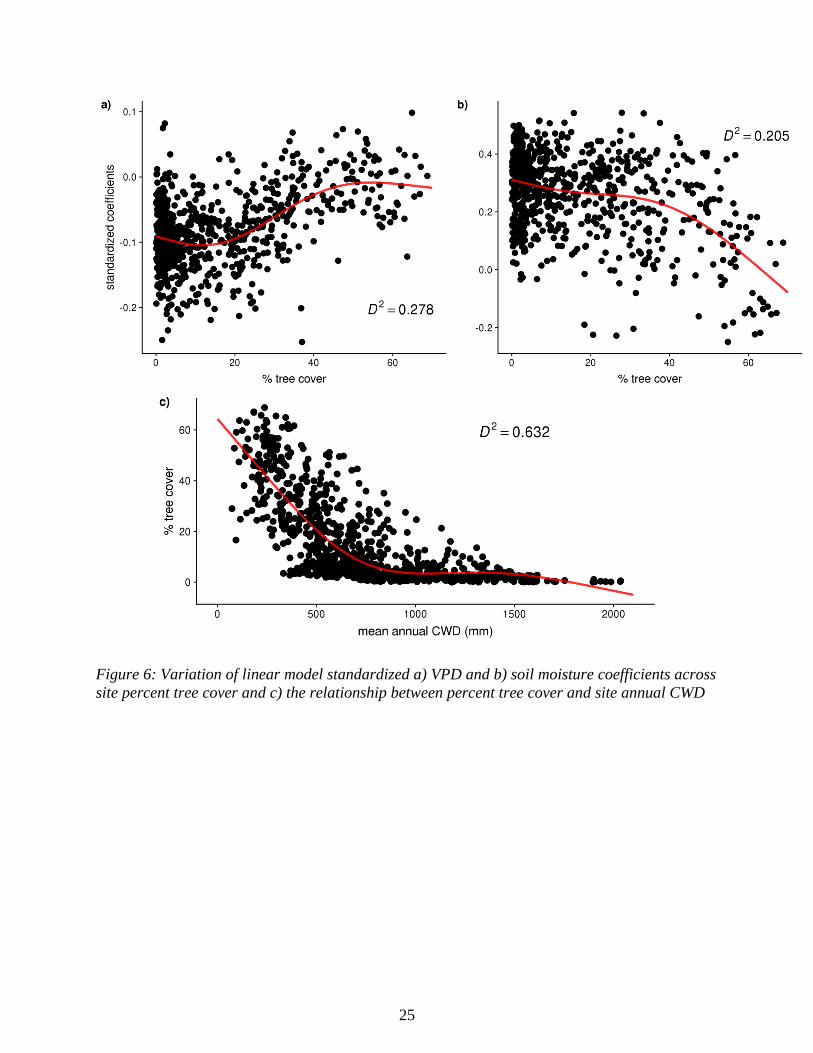
The largest absolute value of soil moisture and VPD LM coefficients occur at sites with low tree
cover (Figs. 6a & 6b). Model selection by AIC determined that there is a curvilinear relationship
between LM coefficients and tree cover (GAM D2 = 0.21 for soil moisture and 0.28 for VPD).
Both variable coefficients trended towards 0 as tree cover increased, with soil moisture
coefficients showing a steep drop in influence after ~40% cover and VPD coefficients having the
steepest slope between roughly 20% and 50% cover before leveling off. Mean site CWD is
strongly linked with percent tree cover (GAM D2 = 0.632), with tree cover declining as CWD
increases. The curve begins to level off near 0% cover and ~800 mm deficit (Fig. 6c), a value
consistent with the CWD value with the largest standardized coefficients for soil moisture and
VPD. The most ‘sensitive’ coefficients (absolute value of coefficients >85th percentile) primarily
occurred at low tree cover, which we defined as sites having anywhere between 1-20% tree
cover. Of the 109 sites that met this criterion, 77 (70.6%) of the soil moisture and 83 (76.1%) of
the VPD coefficients fell within our defined low tree cover range (Fig. 7). While soil moisture
and VPD both have a similar number of sensitive sites within this range, they occupy different
geographic regions. ‘Sensitive’ sites for soil moisture were primarily located north of 40 in
Montana and Wyoming, while sensitive sites for VPD were concentrated in New Mexico,
Colorado, and Utah.
Contrary to our expectations, we observed a positive response to VPD and negative response to
soil moisture at 65 (9%) and 36 (5%) sites respectively. These sites were primarily located in the
Pacific Northwest and were concentrated at values of CWD below 500 mm and tree cover above
30% for both soil moisture and VPD (Figs. 4 & 5; Figs. 6a & 6b). Of the sites that exhibited
these unexpected patterns, 19 and 6 sites fell below the significance threshold of P < .05 for soil
moisture and VPD respectively.
Discussion
Where is canopy water content most sensitive to soil moisture and VPD variation?
Diurnal variability in canopy water content (as expressed through nVOD) showed the most
sensitivity to soil moisture variation at intermediate water deficits and sites with low tree cover

12
(Figs. 5 & 6). These areas appear to occur in ecotones between forest and grasslands or
shrublands (Fig. 6c). These ecotones also occur at values of CWD that exhibit the highest nVOD
sensitivity to both soil moisture and VPD.
Research has identified species populations at dry range edge margins and transition zones as the
most vulnerable to drought (Allen & Breshears, 1998; Anderegg et al., 2019; Davis et al., 2019;
Young et al., 2017), and some have linked that greater vulnerability to high climate variability
(Anderegg et al., 2019). Transition zones have also been identified as hotspots for land-
atmosphere coupling where soil moisture feeds back on both evapotranspiration and subsequent
precipitation, resulting in enhanced climate variability (Koster et al., 2004; Seneviratne et al.,
2010, 2006). In these areas low soil moisture decreases evapotranspiration which leads to
increased atmospheric aridity, thus decreasing the atmospheric moisture that can recharge soil
moisture through precipitation and further exacerbating drought (Zhou et al., 2019). Our results
suggest that areas where vegetation water sensitivity is greatest are these transitional zones with
higher climatic variability, greater land atmosphere coupling, and greater negative feedbacks
associated with low soil moisture.
Our results also show that canopy water content sensitivity is tied to climate variability,
emphasizing the relationship between land-atmosphere coupling and plant water status
sensitivity. The sites that have the lowest sensitivity to soil moisture and VPD z-scores also have
the lowest interannual CWD variability (Fig. S3). While the coarse resolution of our study makes
it more challenging to pinpoint specific transition zones and identify what vegetation is primarily
controlling the nVOD response, our analysis suggests that vegetation water sensitivity is greatest
in areas of the western US that represent forest to non-forest ecotones.
The relationship between tree cover and CWD suggests that forest transition zones with low tree
cover exist at the climatic boundaries that can support trees. These areas are where the majority
of the most sensitive sites are located (Figs. 6a, 6b, 7), leading us to hypothesize that water
content in these trees is more vulnerable to increases in demand and reductions in supply that
come with directional climate change. The more dramatic fluctuations in canopy water content at
these sites could leave trees more likely to exceed their hydraulic safety margin and cross the
13
drought mortality thresholds associated with decreasing water content when exposed to drought
(Brodrick & Asner, 2017; Choat et al., 2012; Martinez-Vilalta et al., 2019; Sapes et al., 2019). It
is difficult to tell if this is driven primarily by greater sensitivity in trees or if shrub- and/or
grasslands are dominating the signal. However, nVOD sensitivity declines at higher values of
CWD (Fig. 5) where tree cover is negligible, suggesting that canopy water content sensitivity is
greatest in transition zones from forest to non-forest.
The canopy water content sensitivity to site climate and climate variability has repercussions as
climate change continues. More mesic environments that experience an increase in deficit and
climatic variance may show increasing sensitivity to anomalies in water supply and demand as
moisture reserves are depleted and average temperatures increase. This greater sensitivity to
drought could have implications for these transitional ecosystems, as mortality at dry edges can
lead to regeneration failure and range shifts (Allen & Breshears, 1998; Davis et al., 2019; Lenoir,
Gégout, Marquet, De Ruffray, & Brisse, 2008).
Our study is constrained by the coarse resolution of the nVOD data used and does not parse out
differential species-specific ranges or hydraulic traits and responses, which are known to
influence drought susceptibility (Anderegg et al., 2019; Anderegg et al., 2018; Bréda, Huc,
Granier, & Dreyer, 2006). There is a lot of variability in the linear model coefficients at low tree
cover that encompasses decoupled sites as well as the most sensitive ones. For example, low tree
cover can be found in sites with well distributed cover, small pockets of dense trees across a
25km pixel, or even an upper tree line that is exposed to low water deficits and is less susceptible
to drought. The coarse resolution and lack of accounting for species specific responses likely
accounts for the observed variability in our results. The coarse resolution of the analysis also
limits our ability to account for topoclimatic effects and the effect of enhanced supply in
hydraulic convergence zones that are known to help buffer vegetation from climate variability
(Dobrowski, 2011; McLaughlin et al., 2017). Despite the fact that these factors add noise to our
analysis, coherent spatial patterns of sensitivity still emerge.
Given that nVOD represents the ability of plants to replace water lost via transpiration to
maintain water content, it is not surprising that the metric is less sensitive at sites that have a low
14
mean annual CWD. These sites have more available water and lower atmospheric demand, and
therefore are more likely to have sufficient soil water for maintaining canopy water content even
during extended periods without precipitation when soils have below average moisture levels or
the atmosphere has above average VPD. These sites represent conditions where plant water
status is decoupled from changes in daily supply/demand in our conceptual model (Fig. 1). Low
CWD is also associated with low climatic variance, and therefore the z-score values representing
our variables’ deviation from mean seasonal conditions may not represent a sufficient imbalance
in supply or demand to be reflected by a response in plant water content. The regions where
these sites are, such as the PNW, represent the bulk of where insignificant coefficients are
located (Fig. 4).
We do, however, see sites in these locations that are not decoupled and show the opposite
response from our expectations in the conceptual model, where the difference between night and
day increases despite negative soil moisture and positive VPD z-scores. Konings et al. (2017)
observed similar unexpected responses in a study examining the response of QuickSCAT and
RapidScat Ku band pm/am microwave backscatter ratios during the dry season in tropical central
Africa (Konings et al., 2017). These authors hypothesized that it was either due to dry season
leaf flushing or VPD driven increases in evapotranspiration. While this may help explain our
results, the lack of significant positive VPD coefficients suggests that the opposite response we
observe may be more driven by moisture surplus and deeper soil water. Evapotranspiration
becomes more decoupled from soil moisture in wetter regions (Seneviratne et al., 2010), and in
forested areas deep soil water availability can drive tree drought response (Goulden & Bales,
2019). As these sites are located in mesic areas with low CWD and higher forest cover (Figs. 6 &
7) it is possible that soil moisture depletion during the growing season either does not leave the
soil dry enough to inhibit plant rehydration, or mature trees with deeper roots in these locations
are more reliant on deeper more stable water sources such as groundwater that may be less
reflected in the modeled soil moisture product used in this study. For these areas tree water
responses to drought are more likely to occur over extended time periods that lead to depletions
of longer term water sources (as observed by Asner et al., 2016; Berdanier & Clark, 2016;
Brodrick, Anderegg, & Asner, 2019; Goulden & Bales, 2019), and are not likely to show up
strongly in an analysis of responses to daily changes in water supply and demand.
15
Can we identify the relative influence of VPD and soil moisture variation on canopy water
content and does this vary spatially?
In our analysis, changes in soil moisture variability emerged as the dominant driver of canopy
water content dynamics (nVOD) at 91% of sites. These results are consistent with research that
identifies soil moisture as a primary control on vegetation growth, including crops (Littell,
Peterson, & Tjoelker, 2008; Papagiannopoulou et al., 2017; Reichstein et al., 2007; Stocker et al.,
2019; Wurster et al., 2019), and studies that suggest that the impacts of anomalies in VPD are
generally short term compared to the persistent effects of soil moisture anomalies (Koster et al.,
2004). Even after normalization it is evident from our example time series (Fig. 2a) and the
corresponding correlograms (Fig. S4) that soil moisture and nVOD have lower frequency
variation over time and retain a degree of memory, while VPD z-scores exhibit higher frequency
variation over time and retain less memory. Soil moisture deficits can impact plant water status
regardless of VPD as soil moisture and VPD become decoupled under dry conditions (Stocker et
al., 2019). Our results suggest that this is the case with canopy water content dynamics as well.
The lowest values of the nVOD residuals primarily occur at the lowest soil moisture z-scores,
regardless of corresponding VPD value (Fig. 3c). Soil moisture and VPD cannot be treated as
entirely independent due to their inherent correlation (Fig. S5; Holden et al., 2018; Seneviratne et
al., 2010; Zhou et al., 2019), and therefore their influence cannot be totally separated into
individual contributions to changing vegetation water status. However, the variable standardized
coefficients and time constants observed in the correlograms support our interpretation that
canopy water content is more sensitive to lower frequency soil moisture variation than the higher
frequency variation of VPD.
Greater nVOD sensitivity to soil moisture likely manifests itself in two possible ways. One,
when soil moisture is low plants are unable to replace water lost to transpiration during the day,
which occurs even if VPD is relatively low. While VPD values may fluctuate day to day, periods
of low soil moisture are likely to continue until a precipitation event. The difference between day
and night canopy water content will decline as the plants ability to rehydrate declines (Frolking
et al., 2011; Schroeder et al., 2016). The lack of supply could result in increased PLC and an

16
overall reduction in xylem conductivity resulting in decreased canopy water content (Martinez-
Vilalta et al., 2019; Sapes et al., 2019). Secondly, the difference between night and day plant
water content may be driven instead by stomatal response to low soil moisture availability
(Mcdowell et al., 2008; Sperry, Hacke, Oren, & Comstock, 2002; Sperry & Love, 2015). When
the soil is relatively dry, plants may close their stomata early in the day or keep them closed to
minimize water lost to transpiration regardless of the strength of evaporative demand, and
therefore exhibit reduced differences between night and day water content due to tighter stomatal
control. This tighter stomatal regulation can lead to overall reductions in canopy water content.
The reduced water content occurs either from long term lack of water supply or from decreased
carbon assimilation that leads to depleted carbon reserves and reduced osmotic regulation, which
leads to loss of cell turgor and decreased hydraulic conductance (Martinez-Vilalta et al., 2019;
Sapes et al., 2019). These different physiological responses, where transpiration is reduced by
xylem cavitation or by stomatal closure, are commonly referred to as isohydry and anisohydry
and represent a range in plant hydraulic regulation strategies. Isohydric plants more tightly
regulate stomates, and therefore buffer water loss, while anisohydric plants maintain higher
stomatal conductivity under dry soil conditions and transpiration is reduced when xylem
cavitation impairs conductance (Garcia-Forner et al., 2016; Mcdowell et al., 2008). Plants fall
along a spectrum between these two strategies, and while our study cannot identify the direct
physiological responses that led to reductions in nVOD, they both represent a response to
drought and both strategies can leave plants susceptible to drought mortality (Choat et al., 2012;
Garcia-Forner et al., 2016; Mcdowell et al., 2008; Sapes et al., 2019).
The greater relative importance of soil moisture variation on canopy water content dynamics has
implications for forecasting how plant water dynamics will be influenced under future climate
change. While VPD is primarily projected to continue increasing with temperature,
understanding how precipitation regimes and moisture availability will be impacted by climate
change is more uncertain (Pendergrass, Knutti, Lehner, Deser, & Sanderson, 2017; IPCC, 2013).
Summer precipitation in the western U.S. is predicted to decrease in frequency and amount but
increase in variability, which reduces water supply and can leave longer periods between soil
moisture recharge (Holden et al., 2018; Rupp, Abatzoglou, & Mote, 2017; USGCRP, 2017). Our
results suggest that precipitation variability is underemphasized as a primary control on plant

17
water status, via regulation of soil water supply. Therefore, predicted precipitation trends are
likely to increasingly trigger plant drought responses as climate changes, which will lead to
reduced canopy water content and possibly greater rates of drought-induced mortality.
The few sites where VPD emerged as the dominant variable were located in the southwestern
U.S., which is where trees have been identified as especially susceptible to rising temperatures
and evaporative demand (Williams et al., 2010; Williams et al., 2013). The top 15% of the sites
most ‘sensitive’ to VPD (Fig. 7) as well as the 67 sites at which VPD coefficients were larger
than soil moisture coefficients were concentrated in this region (Fig. 4). These results agree with
the findings of Williams et al. (2010) and Williams et al. (2013) that areas in the southwestern
U.S. are especially sensitive to atmospheric demand and may become more susceptible as it
increases with warming. However, there are still a larger proportion of sites in the region that
show soil moisture as the more influential variable. Additionally, the BRT partial dependence
plots for many of these sites show greater soil moisture variable influence (Fig. S6) as well as a
larger influence of LAI in the southwestern region (Figs. S6 & S7). This may be driven partially
by high LAI sensitivity to the precipitation patterns in the southwestern U.S., where vegetation
growth is more sensitive to pulses of moisture that come from summer precipitation events
during the North American monsoon and occurs later in the season (Tang, Vivoni, Muñoz-
Arriola, & Lettenmaier, 2012; Watts et al., 2007). By removing the influence of biomass from
the nVOD signal some of the influence of soil moisture pulses is also removed due to variable
correlation (Fig. S7), which may leave the canopy water content at some of the sites to appear as
more controlled by VPD variation.
Although we removed the direct influence of seasonality of biomass on nVOD dynamics, it is
possible that in doing so we have lost some of the information from vegetation drought response
and from our soil moisture and VPD variables. Defoliation can be a physiological response to
drought, and reduced growth and biomass can indicate higher susceptibility to a subsequent
drought event (Camarero et al., 2015; Carnicer et al., 2011; Guada et al., 2016). Both the soil
moisture and VPD z-scores are correlated to LAI z-scores, and by treating LAI as the first order
influence on nVOD we assume that any correlation between the variables is primarily driven by
LAI. While this is not necessarily the case due to the complex interactions along the soil plant

18
atmosphere continuum, this approach allows us to remove the influence of biomass dynamics on
nVOD and focus more specifically on canopy water content sensitivity. Nonetheless, information
lost by removing the influence of biomass is unlikely to change the overall pattern of larger soil
moisture coefficients. The correlation coefficients were generally greater between soil moisture
and LAI z-scores (Fig. S7), so the influence of soil moisture was more likely to be negatively
influenced such as in the southwest region. This is reinforced by our BRT model results that
included LAI z-scores as a predictor variable in addition to the soil moisture and VPD z-scores.
Even with LAI z-scores as a direct predictor in models describing nVOD, soil moisture still
emerged as the most influential variable at 88% of the sites, with LAI replacing VPD in relative
importance at many of the southwestern sites (Fig. S8).
Soil moisture dynamics for the entire 25km cell was characterized using a 250m cell at the
centroid of the coarser pixel. There is potential error introduced due to these types of scale
mismatches. However, in situ point validations have been previously used for 25km resolution
satellite microwave soil moisture products showing reasonable agreement (Draper, Walker,
Steinle, de Jeu, & Holmes, 2009; Njoku, Jackson, Lakshmi, Chan, & Nghiem, 2003; Reichle et
al., 2007). Additionally, our analysis using SNOTEL soil moisture was consistent with our
broader analysis, which supports our interpretation of the results. Further, individual tree LWP
and biomass measurements have been shown to correspond with 25km resolution VOD and LAI
dynamics (Momen et al., 2017). Other potential sources of error include dew and canopy
interception interfering with the microwave backscatter (Konings & Gentine, 2017; Konings et
al., 2019), which may lead to more saturated VOD retrievals in wet environments. This is
minimized in the LPDR product by removing days with significant precipitation (Du et al.,
2017). Even then only small differences were observed in the VOD relationship with LWP and
biomass between analyses using precipitation filtered vs unfiltered VOD data (Momen et al.,
2017), so it is unlikely to be a significant source of error or bias.
Conclusion
We show that diurnal plant water content has a stronger coupling to soil moisture than VPD
dynamics at a majority of sites across the western U.S. Plant water content was decoupled from

19
changes in both soil moisture and VPD at wetter environments with less climatic variance and
showed the greatest sensitivity at sites with intermediate water deficits where tree cover was low,
likely representing transitional ecosystems with greater land-atmosphere coupling. Our study
outlines large scale spatial and climatic patterns of daily plant water responses to changing
metrics of drought across the western U.S.; highlighting the importance of soil moisture to plants
in maintaining and recovering canopy water content, especially in transitional climate zones with
low tree cover.
20
Tables
Data Product Time Basis Native Resolution Study Use
AMSR-E Vegetation
Optical Depth (VOD)
Daily 25 km VOD as a proxy for
canopy water content
AMSR2 VOD Daily 25 km VOD as a proxy for
canopy water content
gridMet vapor
pressure deficit
(VPD)
Daily 4 km Atmospheric water
demand as expressed
by VPD
MODIS leaf area
index (LAI)
4-day 1 km Above-ground
biomass as expressed
by LAI
TOPOFIRE soil
moisture
Daily 250 m Water supply as
expressed by soil
moisture
TerraClimate climatic
water deficit (CWD)
Monthly 4 km Mean site climate as
expressed by mean
yearly CWD
MODIS vegetation
continuous fields
(VCF) percent tree
cover
Yearly 250 m Percent tree cover to
characterize site
vegetation
NLCD land cover
type classification
Yearly 30 m Land cover
classification to filter
out urban and
agricultural areas
TOPOFIRE
SNOTEL/SCAN soil
moisture
Daily N/A In situ soil moisture
measurements taken
from individual
stations to validate
results using modeled
soil moisture product
Table 1: Summary table of data products used in the study and their time basis, native
resolution, and what these data were used for

21
Figures
Figure 1: Predicted response of nVOD to changes in VPD/soil moisture (left column) when
plant water status is sensitive to changes in water demand/supply, (right column) when water
status is decoupled from changes in water demand/supply

22
Figure 2: a) daily time series from 2003 to 2018 of nVOD against LAI, VPD, and soil moisture z-
scores for example point from b) distribution of final 722 sites used in analysis; example point in
red box. c) distribution of nVOD at example site. The large gap in the time series represents the
period between October 4, 2011 and May 18, 2012 when AMSR-E was down and AMSR2 not yet
functional.
23
Figure 3: Linear relationship at sample site in figure 2 between nVOD and a) soil moisture and
b) VPD z-scores after accounting for influence of LAI seasonality on nVOD. c) Continuous
response of nVOD residuals to respective daily VPD and soil moisture z-scores. The relationship
in a, b, and c was derived from a time series spanning 15 years and comprised of 1874 days of
observations during the months April-September.

24
Figure 4: Geographic distribution of nVOD sensitivity (standardized regression coefficients)
from multiple linear regression models relating nVOD to a) VPD and b) soil moisture after
accounting for the influence of LAI seasonality. All coefficients are statistically significant (p <
.05) after accounting for serial autocorrelation using a Newey-West estimator to alter variable
standard errors. Coefficient color gradient is opposite for VPD and soil moisture so that relative
variable influence for the expected response can be compared using the same color scale.
Figure 5: Variation of model coefficients along site climatic water deficit normals (CWD) for a)
VPD and b) soil moisture fit with a general additive model. CWD represents the average annual
value for the years 2003-2017
25
Figure 6: Variation of linear model standardized a) VPD and b) soil moisture coefficients across
site percent tree cover and c) the relationship between percent tree cover and site annual CWD

26
Figure 7: Spatial distribution of the most sensitive linear model coefficients (absolute value of
coefficients > 85th percentile) for a) VPD, and b) soil moisture compared to the spatial
distribution of low tree cover (1-20%) in the western US at 25km resolution. 76.1% and 70.6%
of ‘sensitive’ VPD and soil moisture coefficients respectively fall within the distribution of low
tree cover, shown on the map in green.

27
References
Abatzoglou, J. T. (2013). Development of gridded surface meteorological data for ecological applications and
modelling. International Journal of Climatology, 33(1), 121–131. https://doi.org/10.1002/joc.3413
Abatzoglou, J. T., Dobrowski, S. Z., Parks, S. A., & Hegewisch, K. C. (2018). TerraClimate, a high-resolution
global dataset of monthly climate and climatic water balance from 1958-2015. Scientific Data, 5, 1–12.
https://doi.org/10.1038/sdata.2017.191
Allen, C. D., & Breshears, D. D. (1998). Drought-induced shift of a forest-woodland ecotone: Rapid landscape
response to climate variation. Proceedings of the National Academy of Sciences of the United States of
America, 95(25), 14839–14842. https://doi.org/10.1073/pnas.95.25.14839
Allen, C. D., Macalady, A. K., Chenchouni, H., Bachelet, D., McDowell, N., Vennetier, M., … Hogg, E. H. T.
(2010). A global overview of drought and heat-induced tree mortality reveals emerging climate change risks
for forests. Forest Ecology and Management, 259(4), 660–684.
Allen, R. G., Pereira, L. S., Raes, D., & Smith, M. (1998). Crop evapotranspiration-Guidelines for computing crop
water requirements-FAO Irrigation and drainage paper 56. Fao, Rome, 300(9), D05109.
Anderegg, W. R.L., Schwalm, C., Biondi, F., Camarero, J. J., Koch, G., Litvak, M., … Pacala, S. (2015). Pervasive
drought legacies in forest ecosystems and their implications for carbon cycle models. Science, 349(6247),
528–532. https://doi.org/10.1126/science.aab1833
Anderegg, William R. L., Anderegg, L. D. L., Kerr, K. L., & Trugman, A. T. (2019). Widespread drought‐induced
tree mortality at dry range edges indicates climate stress exceeds species’ compensating mechanisms. Global
Change Biology, gcb.14771. https://doi.org/10.1111/gcb.14771
Anderegg, William R.L., Flint, A., Huang, C. Y., Flint, L., Berry, J. A., Davis, F. W., … Field, C. B. (2015). Tree
mortality predicted from drought-induced vascular damage. Nature Geoscience, 8(5), 367–371.
https://doi.org/10.1038/ngeo2400
Anderegg, William R.L., Konings, A. G., Trugman, A. T., Yu, K., Bowling, D. R., Gabbitas, R., … Zenes, N.
(2018). Hydraulic diversity of forests regulates ecosystem resilience during drought. Nature, 561(7724), 538–
541. https://doi.org/10.1038/s41586-018-0539-7
Anderegg, William R.L., Plavcová, L., Anderegg, L. D. L., Hacke, U. G., Berry, J. A., & Field, C. B. (2013).
Drought’s legacy: Multiyear hydraulic deterioration underlies widespread aspen forest die-off and portends
increased future risk. Global Change Biology, 19(4), 1188–1196. https://doi.org/10.1111/gcb.12100
Asner, G. P., Brodrick, P. G., Anderson, C. B., Vaughn, N., Knapp, D. E., & Martin, R. E. (2016). Progressive forest
canopy water loss during the 2012–2015 California drought. Proceedings of the National Academy of
Sciences, 113(2), E249–E255. https://doi.org/10.1073/pnas.1523397113
Berdanier, A. B., & Clark, J. S. (2016). Multiyear drought-induced morbidity preceding tree death in southeastern
U.S. forests. Ecological Applications, 26(1), 17–23. https://doi.org/10.1890/15-0274.1/suppinfo
Bigler, C., Gavin, D. G., Gunning, C., & Veblen, T. T. (2007). Drought induces lagged tree mortality in a subalpine
forest in the Rocky Mountains. Oikos, 116(12), 1983–1994. https://doi.org/10.1111/j.2007.0030-1299.16034.x
Bréda, N., Huc, R., Granier, A., & Dreyer, E. (2006). Temperate forest trees and stands under severe drought: a

28
review of ecophysiological responses, adaptation processes and long-term consequences. Annals of Forest
Science, 63(6), 625–644. https://doi.org/10.1051/forest:2006042
Brodrick, P. G., Anderegg, L. D. L., & Asner, G. P. (2019). Forest Drought Resistance at Large Geographic Scales.
Geophysical Research Letters, 46(5), 2752–2760. https://doi.org/10.1029/2018GL081108
Brodrick, P. G., & Asner, G. P. (2017). Remotely sensed predictors of conifer tree mortality during severe drought.
Environmental Research Letters, 12(11). https://doi.org/10.1088/1748-9326/aa8f55
Burke, E. J., & Brown, S. J. (2008). Evaluating uncertainties in the projection of future drought. Journal of
Hydrometeorology, 9(2), 292–299. https://doi.org/10.1175/2007JHM929.1
Camarero, J. J., Gazol, A., Sangüesa-Barreda, G., Oliva, J., & Vicente-Serrano, S. M. (2015). To die or not to die:
Early warnings of tree dieback in response to a severe drought. Journal of Ecology, 103(1), 44–57.
https://doi.org/10.1111/1365-2745.12295
Carnicer, J., Coll, M., Ninyerola, M., Pons, X., Sánchez, G., & Peñuelas, J. (2011). Widespread crown condition
decline, food web disruption, and amplified tree mortality with increased climate change-type drought.
Proceedings of the National Academy of Sciences of the United States of America, 108(4), 1474–1478.
https://doi.org/10.1073/pnas.1010070108
Choat, B., Jansen, S., Brodribb, T. J., Cochard, H., Delzon, S., Bhaskar, R., … Zanne, A. E. (2012). Global
convergence in the vulnerability of forests to drought. Nature, 491(7426), 752–755.
https://doi.org/10.1038/nature11688
Daly, C., Taylor, G., & Gibson, W. (1997). The Prism approach to mapping precipitation and emperature. 10th AMS
Conference on Applied Climatology, (1), 1–4.
Dannenberg, M. P., Wise, E. K., & Smith, W. K. (2019). Reduced tree growth in the semiarid United States due to
asymmetric responses to intensifying precipitation extremes. Science Advances, (October), Accepted.
Davis, K. T., Dobrowski, S. Z., Higuera, P. E., Holden, Z. A., Veblen, T. T., Rother, M. T., … Maneta, M. P.
(2019). Wildfires and climate change push low-elevation forests across a critical climate threshold for tree
regeneration. Proceedings of the National Academy of Sciences of the United States of America, 116(13),
6193–6198. https://doi.org/10.1073/pnas.1815107116
Dimiceli, C., Carrol, M., Sohlberg, R., Kim, D. H., & Townshend, J. R. G. (2015). MOD44B MODIS/Terra
Vegetation Continuous Fields Yearly L3 Global 250m SIN Grid V006 [Data set]. Retrieved from NASA
EOSDIS Land Processes DAAC website: https://doi.org/10.5067/MODIS/MOD44B.006
Dobrowski, S. Z. (2011). A climatic basis for microrefugia: The influence of terrain on climate. Global Change
Biology, 17(2), 1022–1035. https://doi.org/10.1111/j.1365-2486.2010.02263.x
Dobrowski, S. Z., Abatzoglou, J., Swanson, A. K., Greenberg, J. A., Mynsberge, A. R., Holden, Z. A., & Schwartz,
M. K. (2013). The climate velocity of the contiguous U nited S tates during the 20th century. Global Change
Biology, 19(1), 241–251.
Draper, C. S., Walker, J. P., Steinle, P. J., de Jeu, R. A. M., & Holmes, T. R. H. (2009). An evaluation of AMSR-E
derived soil moisture over Australia. Remote Sensing of Environment, 113(4), 703–710.
https://doi.org/10.1016/j.rse.2008.11.011
29
Du, J., Kimball, J. S., Jones, L. A., Kim, Y., Glassy, J., & Watts, J. D. (2017). A global satellite environmental data
record derived from AMSR-E and AMSR2 microwave Earth observations. Earth System Science Data, 9(2),
791–808. https://doi.org/10.5194/essd-9-791-2017
Frolking, S., Milliman, T., Palace, M., Wisser, D., Lammers, R., & Fahnestock, M. (2011). Tropical forest
backscatter anomaly evident in SeaWinds scatterometer morning overpass data during 2005 drought in
Amazonia. Remote Sensing of Environment, 115(3), 897–907. https://doi.org/10.1016/j.rse.2010.11.017
Garcia-Forner, N., Adams, H. D., Sevanto, S., Collins, A. D., Dickman, L. T., Hudson, P. J., … Mcdowell, N. G.
(2016). Responses of two semiarid conifer tree species to reduced precipitation and warming reveal new
perspectives for stomatal regulation. Plant Cell and Environment, 39(1), 38–49.
https://doi.org/10.1111/pce.12588
Goulden, M. L., & Bales, R. C. (2019). California forest die-off linked to multi-year deep soil drying in 2012–2015
drought. Nature Geoscience. https://doi.org/10.1038/s41561-019-0388-5
Guada, G., Camarero, J. J., Sánchez-Salguero, R., & Cerrillo, R. M. N. (2016). Limited growth recovery after
drought-induced forest dieback in very defoliated trees of two pine species. Frontiers in Plant Science,
7(APR2016), 1–12. https://doi.org/10.3389/fpls.2016.00418
Hijmans, R. (2017). raster: Geographic Data Analysis and Modeling. Retrieved from https://cran.r-
project.org/package=raster
Hijmans, R., Phillips, S., Leathwick, J., & Elith, J. (2017). dismo: Species Distribution Modeling. Retrieved from
https://cran.r-project.org/package=dismo
Holden, Z. A., Jolly, W. M., Swanson, A., Warren, D. A., Jencso, K., Maneta, M., … Landguth, E. L. (2019).
TOPOFIRE: A Topographically Resolved Wildfire Danger and Drought Monitoring System for the
Conterminous United States. Bulletin of the American Meteorological Society, 100(9), 1607–1613.
https://doi.org/10.1175/bams-d-18-0178.1
Holden, Z. A., Swanson, A., Luce, C. H., Jolly, W. M., Maneta, M., Oyler, J. W., … Affleck, D. (2018). Decreasing
fire season precipitation increased recent western US forest wildfire activity. Proceedings of the National
Academy of Sciences of the United States of America, 115(36), E8349–E8357.
https://doi.org/10.1073/pnas.1802316115
Kolb, P. F., & Robberecht, R. (1996). High temperature and drought stress effects on survival of Pinus ponderosa
seedlings. Tree Physiology, 16(8), 665–672. https://doi.org/10.1093/treephys/16.8.665
Konings, A. G., Williams, A. P., & Gentine, P. (2017). Sensitivity of grassland productivity to aridity controlled by
stomatal and xylem regulation. Nature Geoscience, 10(4), 284–288. https://doi.org/10.1038/ngeo2903
Konings, Alexandra G., & Gentine, P. (2017). Global variations in ecosystem-scale isohydricity. Global Change
Biology, 23(2), 891–905. https://doi.org/10.1111/gcb.13389
Konings, Alexandra G., Rao, K., & Steele-Dunne, S. C. (2019). Macro to micro: microwave remote sensing of plant
water content for physiology and ecology. New Phytologist, 223(3), 1166–1172.
https://doi.org/10.1111/nph.15808
Konings, Alexandra G., Yu, Y., Xu, L., Yang, Y., Schimel, D. S., & Saatchi, S. S. (2017). Active microwave

30
observations of diurnal and seasonal variations of canopy water content across the humid African tropical
forests. Geophysical Research Letters, 44(5), 2290–2299. https://doi.org/10.1002/2016GL072388
Koster, R. D., Dirmeyer, P. A., Guo, Z., Bonan, G., Chan, E., Cox, P., … Yamada, T. (2004). Regions of strong
coupling between soil moisture and precipitation. Science, 305(5687), 1138–1140.
https://doi.org/10.1126/science.1100217
Lenoir, J., Gégout, J. C., Marquet, P. A., De Ruffray, P., & Brisse, H. (2008). A significant upward shift in plant
species optimum elevation during the 20th century. Science, 320(5884), 1768–1771.
https://doi.org/10.1126/science.1156831
Li, Y., Guan, K., Gentine, P., Konings, A. G., Meinzer, F. C., Kimball, J. S., … Good, S. P. (2017). Estimating
Global Ecosystem Isohydry/Anisohydry Using Active and Passive Microwave Satellite Data. Journal of
Geophysical Research: Biogeosciences, 122(12), 3306–3321. https://doi.org/10.1002/2017JG003958
Littell, J. S., Peterson, D. L., & Tjoelker, M. (2008). Douglas-fir growth in mountain ecosystems: Water limits tree
growth from stand to region. Ecological Monographs, 78(3), 349–368. https://doi.org/10.1890/07-0712.1
Martinez-Vilalta, J., Anderegg, W. R. L., Sapes, G., & Sala, A. (2019). Greater focus on water pools may improve
our ability to understand and anticipate drought-induced mortality in plants. New Phytologist, 223(1), 22–32.
https://doi.org/10.1111/nph.15644
Mcdowell, N., Mcdowell, N., Pockman, W. T., Allen, C. D., David, D., Cobb, N., … Yepez, E. A. (2008).
Mechanisms of plant survival and mortality during drought : why do some plants survive while others
succumb to drought? New Phytologist, 178, 719–739.
McLaughlin, B. C., Ackerly, D. D., Klos, P. Z., Natali, J., Dawson, T. E., & Thompson, S. E. (2017). Hydrologic
refugia, plants, and climate change. Global Change Biology, 23(8), 2941–2961.
Meehl, G. A., Stocker, T. F., Collins, W. D., Friedlingstein, P., Gaye, T., Gregory, J. M., … Noda, A. (2007).
Global climate projections.
Momen, M., Wood, J. D., Novick, K. A., Pangle, R., Pockman, W. T., McDowell, N. G., & Konings, A. G. (2017).
Interacting Effects of Leaf Water Potential and Biomass on Vegetation Optical Depth. Journal of Geophysical
Research: Biogeosciences, 122(11), 3031–3046. https://doi.org/10.1002/2017JG004145
Myneni, R., Knyazikhin, Y., Park, T. (2015). MCD15A3H MODIS/Terra+Aqua Leaf Area Index/FPAR 4-day L4
Global 500m SIN Grid V006. https://doi.org/http://doi.org/10.5067/MODIS/MCD15A3H.006
Newey, W. K., & West, K. D. (1986). A simple, positive semi-definite, heteroskedasticity and
autocorrelationconsistent covariance matrix. National Bureau of Economic Research Cambridge, Mass.,
USA.
Njoku, E. G., Jackson, T. J., Lakshmi, V., Chan, T. K., & Nghiem, S. V. (2003). Soil moisture retrieval from
AMSR-E. IEEE Transactions on Geoscience and Remote Sensing, 41(2), 215–229.
https://doi.org/10.1109/TGRS.2002.808243
Novick, K. A., Ficklin, D. L., Stoy, P. C., Williams, C. A., Bohrer, G., Oishi, A. C., … Phillips, R. P. (2016). The
increasing importance of atmospheric demand for ecosystem water and carbon fluxes. Nature Climate
Change, 6(11), 1023–1027. https://doi.org/10.1038/nclimate3114

31
Owe, M., de Jeu, R., & Holmes, T. (2008). Multisensor historical climatology of satellite-derived global land surface
moisture. Journal of Geophysical Research: Earth Surface, 113(1), 1–17.
https://doi.org/10.1029/2007JF000769
Papagiannopoulou, C., Miralles, D. G., Dorigo, W. A., Verhoest, N. E. C., Depoorter, M., & Waegeman, W. (2017).
Vegetation anomalies caused by antecedent precipitation in most of the world. Environmental Research
Letters, 12(7). https://doi.org/10.1088/1748-9326/aa7145
Pendergrass, A. G., Knutti, R., Lehner, F., Deser, C., & Sanderson, B. M. (2017). Precipitation variability increases
in a warmer climate. Scientific Reports, 7(1), 1–9. https://doi.org/10.1038/s41598-017-17966-y
Rao, K., Anderegg, W. R. L., Sala, A., Martínez-Vilalta, J., & Konings, A. G. (2019). Satellite-based vegetation
optical depth as an indicator of drought-driven tree mortality. Remote Sensing of Environment, 227(November
2018), 125–136. https://doi.org/10.1016/j.rse.2019.03.026
Reichle, R. H., Koster, R. D., Liu, P., Mahanama, S. P. P., Njoku, E. G., & Owe, M. (2007). Comparison and
assimilation of global soil moisture retrievals from the Advanced Microwave Scanning Radiometer for the
Earth Observing System (AMSR-E) and the Scanning Multichannel Microwave Radiometer (SMMR).
Journal of Geophysical Research Atmospheres, 112(9), 1–14. https://doi.org/10.1029/2006JD008033
Reichstein, M., Ciais, P., Papale, D., Valentini, R., Running, S., Viovy, N., … Zhao, M. (2007). Reduction of
ecosystem productivity and respiration during the European summer 2003 climate anomaly: A joint flux
tower, remote sensing and modelling analysis. Global Change Biology, 13(3), 634–651.
https://doi.org/10.1111/j.1365-2486.2006.01224.x
Rupp, D. E., Abatzoglou, J. T., & Mote, P. W. (2017). Projections of 21st century climate of the Columbia River
Basin. Climate Dynamics, 49(5–6), 1783–1799.
Sapes, G., Roskilly, B., Dobrowski, S., Maneta, M., Anderegg, W. R. L., Martinez-Vilalta, J., & Sala, A. (2019).
Plant water content integrates hydraulics and carbon depletion to predict drought-induced seedling mortality.
Tree Physiology, 39(8), 1300–1312. https://doi.org/10.1093/treephys/tpz062
Schroeder, R., McDonald, K. C., Azarderakhsh, M., & Zimmermann, R. (2016). ASCAT MetOp-A diurnal
backscatter observations of recent vegetation drought patterns over the contiguous U.S.: An assessment of
spatial extent and relationship with precipitation and crop yield. Remote Sensing of Environment, 177, 153–
159. https://doi.org/10.1016/j.rse.2016.01.008
Schwantes, A. M., Parolari, A. J., Swenson, J. J., Johnson, D. M., Domec, J. C., Jackson, R. B., … Porporato, A.
(2018). Accounting for landscape heterogeneity improves spatial predictions of tree vulnerability to drought.
New Phytologist, 220(1), 132–146. https://doi.org/10.1111/nph.15274
Seneviratne, S. I., Corti, T., Davin, E. L., Hirschi, M., Jaeger, E. B., Lehner, I., … Teuling, A. J. (2010).
Investigating soil moisture-climate interactions in a changing climate: A review. Earth-Science Reviews,
99(3–4), 125–161. https://doi.org/10.1016/j.earscirev.2010.02.004
Seneviratne, S. I., Lüthi, D., Litschi, M., & Schär, C. (2006). Land-atmosphere coupling and climate change in
Europe. Nature, 443(7108), 205–209. https://doi.org/10.1038/nature05095
Simeone, C., Maneta, M. P., Holden, Z. A., Sapes, G., Sala, A., & Dobrowski, S. Z. (2018). Coupled ecohydrology

32
and plant hydraulics modeling predicts ponderosa pine seedling mortality and lower treeline in the US
Northern Rocky Mountains. New Phytol, 10.
Sperry, J. S., Hacke, U. G., Oren, R., & Comstock, J. P. (2002). Water deficits and hydraulic limits to leaf water
supply. Plant, Cell and Environment, 25(2), 251–263. https://doi.org/10.1046/j.0016-8025.2001.00799.x
Sperry, John S., & Love, D. M. (2015). What plant hydraulics can tell us about responses to climate-change
droughts. New Phytologist, 207(1), 14–27. https://doi.org/10.1111/nph.13354
Stephenson, N. L. (1990). The American Society of Naturalists Climatic Control of Vegetation Distribution : The
Role of the Water Balance. American Naturalist, 135(5), 649–670.
Stocker, B. D., Zscheischler, J., Keenan, T. F., Prentice, I. C., Seneviratne, S. I., & Peñuelas, J. (2019). Drought
impacts on terrestrial primary production underestimated by satellite monitoring. Nature Geoscience,
12(April). https://doi.org/10.1038/s41561-019-0318-6
Tang, Q., Vivoni, E. R., Muñoz-Arriola, F., & Lettenmaier, D. P. (2012). Predictability of evapotranspiration
patterns using remotely sensed vegetation dynamics during the North American monsoon. Journal of
Hydrometeorology, 13(1), 103–121.
Team, R. C. (2018). R: A language and environment for statistical computing. R Foundation for Statistical
Computing, Vienna, Australia.
Tian, F., Brandt, M., Liu, Y. Y., Verger, A., Tagesson, T., Diouf, A. A., … Fensholt, R. (2016). Remote sensing of
vegetation dynamics in drylands: Evaluating vegetation optical depth (VOD) using AVHRR NDVI and in situ
green biomass data over West African Sahel. Remote Sensing of Environment, 177, 265–276.
https://doi.org/10.1016/j.rse.2016.02.056
Trenberth, K. E., & Shea, D. J. (2005). Relationships between precipitation and surface temperature. Geophysical
Research Letters, 32(14), 1–4. https://doi.org/10.1029/2005GL022760
USGCRP. (2017). Climate Science Report: Fourth National Climate Assessment [Wuebbles, D.J., D.W. Fahey, K.A.
Hibbard, D.J. Dokken, B.C. Stewart, and T.K. Maycock (eds)]. I, 470. https://doi.org/10.7930/J0J964J6
Van Mantgem, P. J., Stephenson, N. L., Byrne, J. C., Daniels, L. D., Franklin, J. F., Fulé, P. Z., … Taylor, A. H.
(2009). Widespread increase of tree mortality rates in the western United States. Science, 323(5913), 521–524.
Watts, C. J., Scott, R. L., Garatuza-Payan, J., Rodriguez, J. C., Prueger, J. H., Kustas, W. P., & Douglas, M. (2007).
Changes in vegetation condition and surface fluxes during NAME 2004. Journal of Climate, 20(9), 1810–
1820.
Williams, A. P., Allen, C. D., Millar, C. I., Swetnam, T. W., Michaelsen, J., Still, C. J., & Leavitt, S. W. (2010).
Forest responses to increasing aridity and warmth in the southwestern United States. Proceedings of the
National Academy of Sciences, 107(50), 21289–21294. https://doi.org/10.1073/pnas.0914211107
Williams, A. Park, Allen, C. D., Macalady, A. K., Griffin, D., Woodhouse, C. A., Meko, D. M., … Mcdowell, N. G.
(2013). Temperature as a potent driver of regional forest drought stress and tree mortality. Nature Climate
Change, 3(3), 292–297. https://doi.org/10.1038/nclimate1693
Wood, S. N. (2011). Fast stable restricted maximum likelihood and marginal likelihood estimation of
semiparametric generalized linear models. Journal of the Royal Statistical Society: Series B (Statistical
33
Methodology), 73(1), 3–36.
Wurster, P. M., Maneta, M., Begueria, S., Cobourn, K., Maxwell, B., Silverman, N., … Vicente-Serrano, S. M.
(2019). Characterizing the impact of climatic anomalies on agrosystems in the northwest United States.
Agricultural and Forest Meteorology (Under Review), 280(July 2019).
https://doi.org/10.1016/j.agrformet.2019.107778
Yang, L., Jin, S., Danielson, P., Homer, C., Gass, L., Bender, S. M., … Xian, G. (2018). A new generation of the
United States National Land Cover Database: Requirements, research priorities, design, and implementation
strategies. ISPRS Journal of Photogrammetry and Remote Sensing, 146(May), 108–123.
https://doi.org/10.1016/j.isprsjprs.2018.09.006
Young, D. J. N., Stevens, J. T., Earles, J. M., Moore, J., Ellis, A., Jirka, A. L., & Latimer, A. M. (2017). Long-term
climate and competition explain forest mortality patterns under extreme drought. Ecology Letters, 20(1), 78–
86. https://doi.org/10.1111/ele.12711
Zhou, S., Williams, A. P., Berg, A. M., Cook, B. I., Zhang, Y., Hagemann, S., … Gentine, P. (2019). Land–
atmosphere feedbacks exacerbate concurrent soil drought and atmospheric aridity. Proceedings of the
National Academy of Sciences, 116(38), 201904955. https://doi.org/10.1073/pnas.1904955116
Supplementary Figures
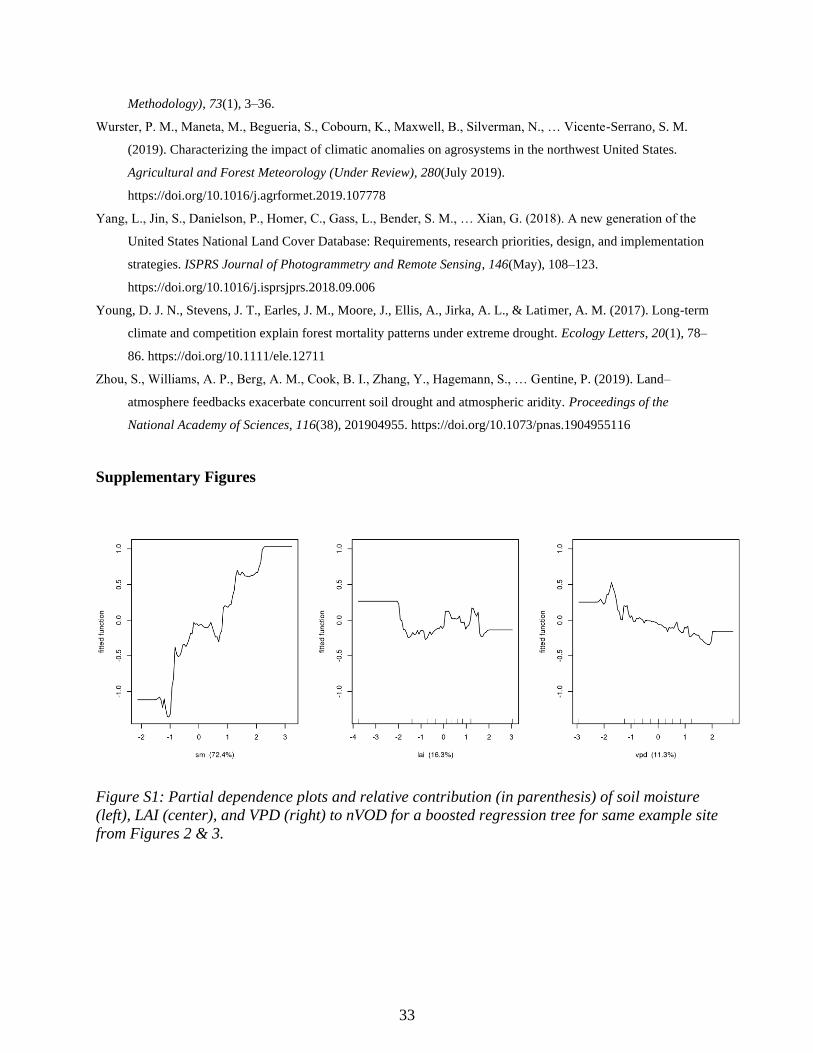
Figure S1: Partial dependence plots and relative contribution (in parenthesis) of soil moisture
(left), LAI (center), and VPD (right) to nVOD for a boosted regression tree for same example site
from Figures 2 & 3.

34
Figure S2: Variation of model coefficients for SNOTEL sites along site climatic water deficit
(CWD) for a) VPD and b) soil moisture fit with a general additive model. CWD represents the
average annual value for the years 2003-2017.
Figure S3: Standardized linear model coefficients for a) VPD and b) soil moisture plotted
against site interannual CWD variability represented by standard deviation. Interannual CWD
standard deviation calculated over the years 2003-2017.

35
Figure S4: Correlogram outputs for timeseries of nVOD (top), soil moisture (middle), and VPD
(bottom). Y-axis is the autocorrelation value and x-axis is the observation lag in days over which
the ACF is calculated. The dashed blue lines are the 95% significance bounds for variable
autocorrelation, and the timeseries is taken from the same example site as Figures 2 & 3.

36
Figure S5: Correlation coefficients for the soil moisture and VPD z-scores calculated at each
site over April-September from 2003-2018.
Figure S6: Partial dependence plots and relative contribution (in parenthesis) of soil moisture
(left), LAI (center), and VPD (right) to nVOD for a boosted regression tree at a site in the
southwest where VPD was more influential in the multiple linear model.
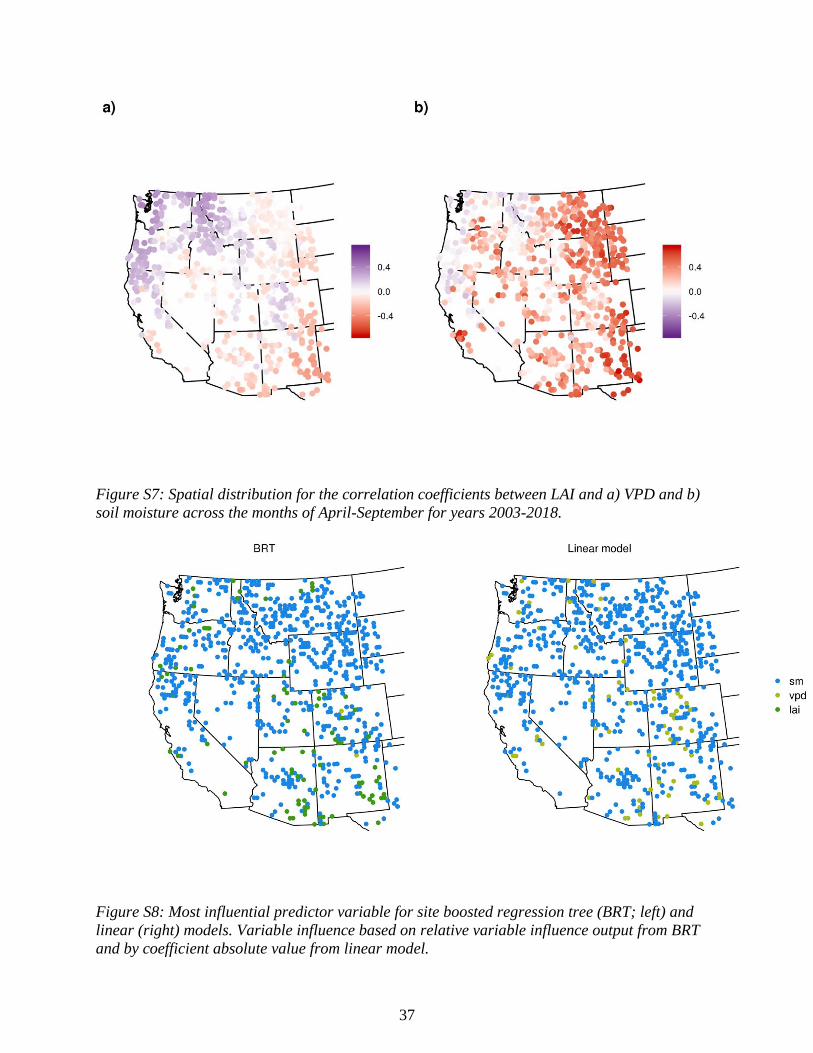
37
Figure S7: Spatial distribution for the correlation coefficients between LAI and a) VPD and b)
soil moisture across the months of April-September for years 2003-2018.
Figure S8: Most influential predictor variable for site boosted regression tree (BRT; left) and
linear (right) models. Variable influence based on relative variable influence output from BRT
and by coefficient absolute value from linear model.