Embed Size (px)
Citation preview
DRAINING THE ASSET DATA BACKLOG
THROUGH AUTOMATION
Peter O'Regan (Beca Limited) and Mark Walmsley (Waipa District Council)
ABSTRACT
Asset owners across New Zealand struggle to balance daily operations with the need to update and add new assets to their asset management information
systems (AMIS). As Councils upgrade and expand water asset networks, large volumes of new features (e.g. water meters, pipes and valves) are being
capitalized into AMIS, GIS and Financial systems. Integrating these assets into enterprise databases and systems requires precise workflows and multi-layered verification to ensure the linkages between the systems are managed accordingly.
Manual data entry mistakes can confuse daily operations, limit planning and modeling, and impact financial reporting and control.
Managing assets using operational processes and tools that are in-built within AMIS is feasible for a small number of new assets. But what happens when you need to load and integrate over 10,000 new water meter assets in a short
timeframe, and with the added pressure of an external audit?!
This paper will describe a major asset capitalization project undertaken with Waipa
District Council in which conventional (manual) data entry workflows were replaced with data automation and systematic verification processes. This resulted in substantial productivity gains and improved data quality, and allowed Waipa
District Council to reach their audit deadlines with time to spare.
KEYWORDS
GIS, data quality, automation, AM/FM, data visualization, network modeling, growth
PRESENTER PROFILES
Peter O'Regan. Senior Associate - GIS Consulting, Beca Limited
Peter is a technologist who turns data into powerful map-based insights for clients across
all sectors. Along with leading a range of GIS projects, Peter is pioneering Beca's use of drones for advanced 3D mapping and reality capture. Key areas of focus include urban growth modeling and landscape design, geotechnical and environmental assessment,
mining and construction monitoring, and industrial applications of emerging technologies.
Mark Walmsley. Asset Planning Engineer Senior, Waipa District Council
Mark Walmsley joined Waipa District Council with the Water Services team in July 2017 as a Senior Asset Planning Engineer. Mark has 30 years water industry experience starting his career in local government then going full circle via contracting, consultancy
and then back to local government. With a strong emphasis in project delivery,
previously managing major water/wastewater treatment upgrades, his focus is now in Asset Management and developing robust plans, processes and embracing technological advances to future proof and accommodate for Waipa’s growth.
Mark lives in Hamilton with his partner, his three chooks, his bees and his 35 year old Ducati.
1 INTRODUCTION
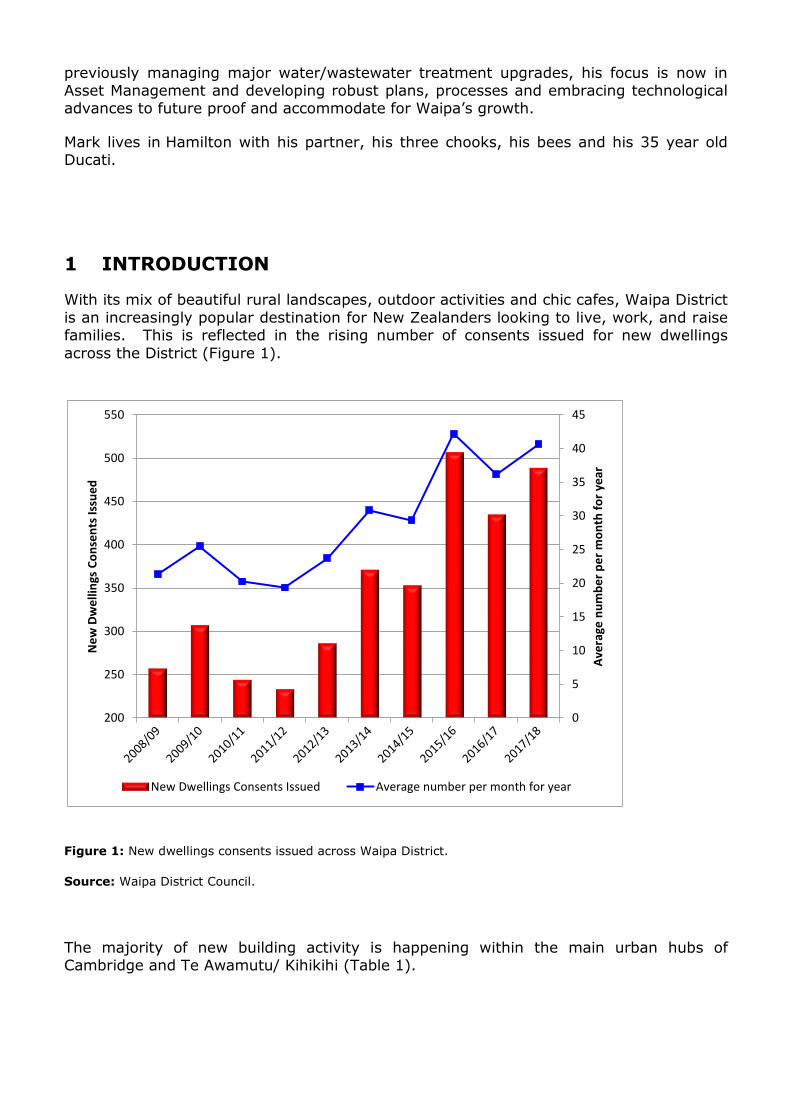
With its mix of beautiful rural landscapes, outdoor activities and chic cafes, Waipa District
is an increasingly popular destination for New Zealanders looking to live, work, and raise families. This is reflected in the rising number of consents issued for new dwellings
across the District (Figure 1).
Figure 1: New dwellings consents issued across Waipa District.
Source: Waipa District Council.
The majority of new building activity is happening within the main urban hubs of Cambridge and Te Awamutu/ Kihikihi (Table 1).
0
5
10
15
20
25
30
35
40
45
200
250
300
350
400
450
500
550
Ave
rage
nu
mb
er
pe
r m
on
th f
or
year
Ne
w D
we
llin
gs C
on
sen
ts Is
sue
d
New Dwellings Consents Issued Average number per month for year
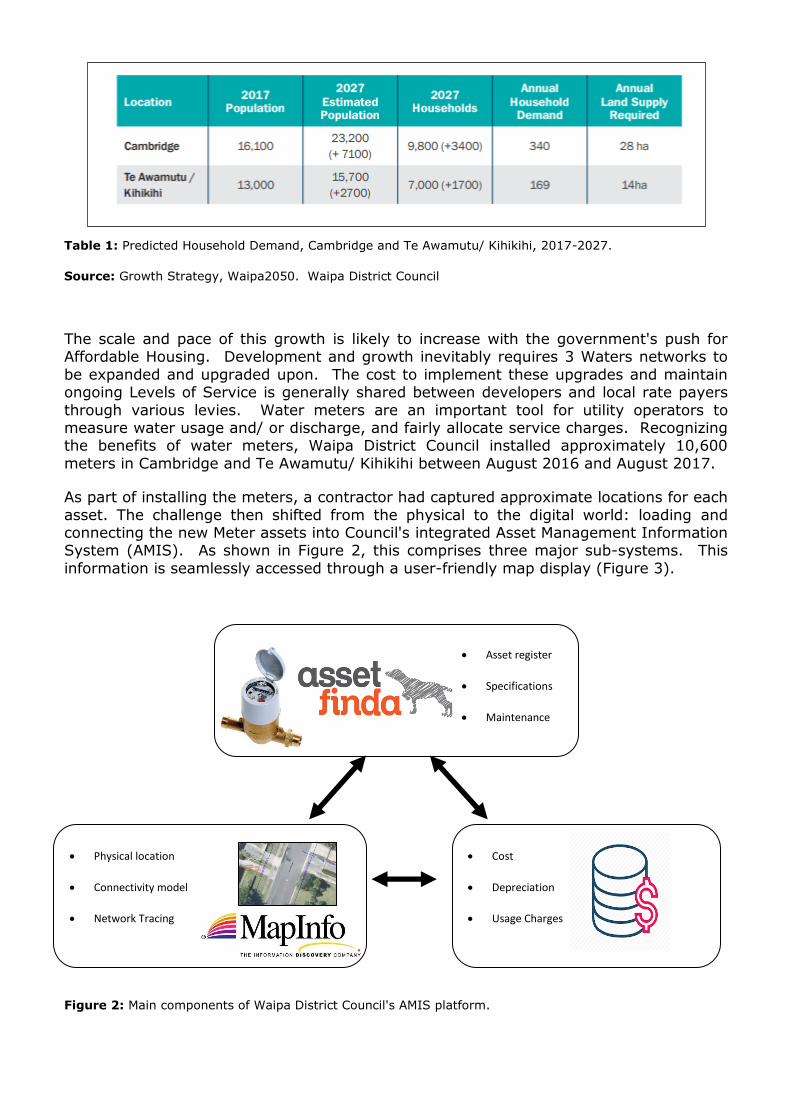
Table 1: Predicted Household Demand, Cambridge and Te Awamutu/ Kihikihi, 2017-2027.
Source: Growth Strategy, Waipa2050. Waipa District Council
The scale and pace of this growth is likely to increase with the government's push for Affordable Housing. Development and growth inevitably requires 3 Waters networks to
be expanded and upgraded upon. The cost to implement these upgrades and maintain ongoing Levels of Service is generally shared between developers and local rate payers
through various levies. Water meters are an important tool for utility operators to measure water usage and/ or discharge, and fairly allocate service charges. Recognizing the benefits of water meters, Waipa District Council installed approximately 10,600
meters in Cambridge and Te Awamutu/ Kihikihi between August 2016 and August 2017.
As part of installing the meters, a contractor had captured approximate locations for each
asset. The challenge then shifted from the physical to the digital world: loading and connecting the new Meter assets into Council's integrated Asset Management Information System (AMIS). As shown in Figure 2, this comprises three major sub-systems. This
information is seamlessly accessed through a user-friendly map display (Figure 3).
Figure 2: Main components of Waipa District Council's AMIS platform.
• Physical location
• Connectivity model
• Network Tracing
• Cost
• Depreciation
• Usage Charges
• Asset register
• Specifications
• Maintenance
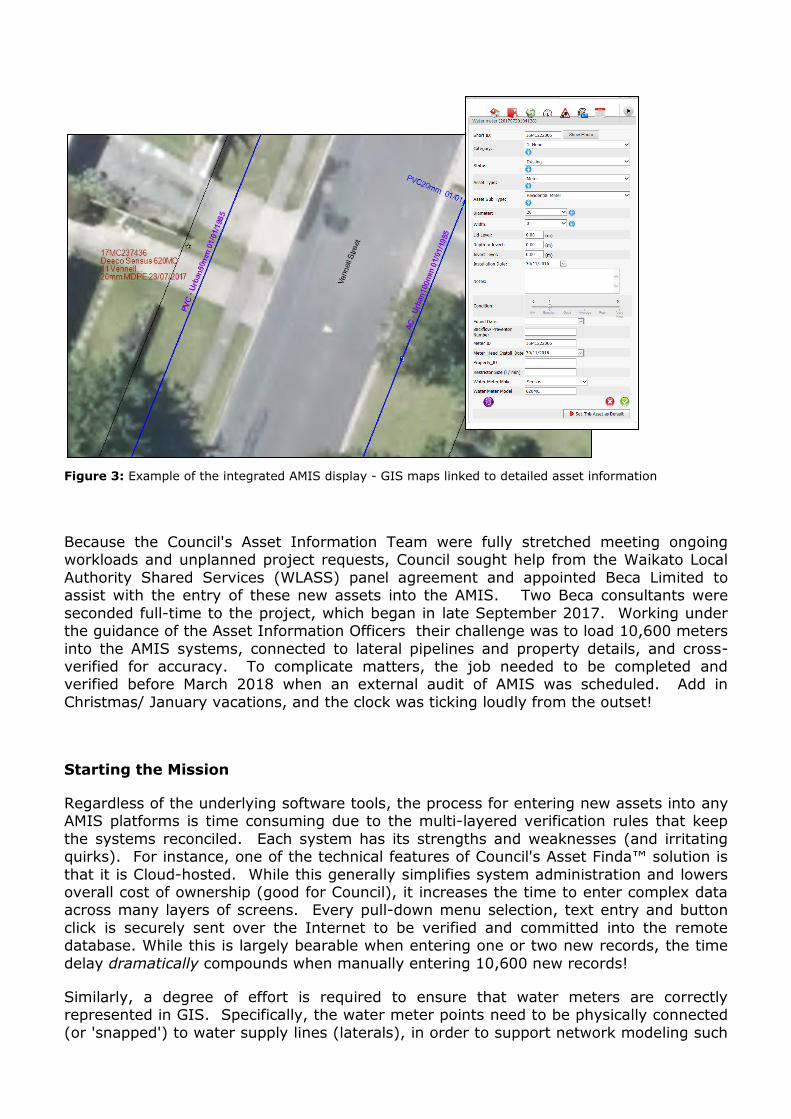
Figure 3: Example of the integrated AMIS display - GIS maps linked to detailed asset information
Because the Council's Asset Information Team were fully stretched meeting ongoing workloads and unplanned project requests, Council sought help from the Waikato Local
Authority Shared Services (WLASS) panel agreement and appointed Beca Limited to assist with the entry of these new assets into the AMIS. Two Beca consultants were
seconded full-time to the project, which began in late September 2017. Working under the guidance of the Asset Information Officers their challenge was to load 10,600 meters
into the AMIS systems, connected to lateral pipelines and property details, and cross-verified for accuracy. To complicate matters, the job needed to be completed and verified before March 2018 when an external audit of AMIS was scheduled. Add in
Christmas/ January vacations, and the clock was ticking loudly from the outset!
Starting the Mission
Regardless of the underlying software tools, the process for entering new assets into any AMIS platforms is time consuming due to the multi-layered verification rules that keep
the systems reconciled. Each system has its strengths and weaknesses (and irritating quirks). For instance, one of the technical features of Council's Asset Finda™ solution is
that it is Cloud-hosted. While this generally simplifies system administration and lowers overall cost of ownership (good for Council), it increases the time to enter complex data across many layers of screens. Every pull-down menu selection, text entry and button
click is securely sent over the Internet to be verified and committed into the remote database. While this is largely bearable when entering one or two new records, the time
delay dramatically compounds when manually entering 10,600 new records!
Similarly, a degree of effort is required to ensure that water meters are correctly represented in GIS. Specifically, the water meter points need to be physically connected
(or 'snapped') to water supply lines (laterals), in order to support network modeling such
as downstream flow traces. Whereas some GIS packages can automatically create these physical connections while drawing new features, Council's present GIS (Mapinfo™) lacks this capability. This also increased the complexity of setting up and validating the asset
linkages.
During the preliminary scoping of this project, the potential to use commercial off-the-
shelf (COTS) software tools to automatically perform many of the data cleansing tasks was considered and proposed. However this proposal was initially met with skepticism
and pushback due to perceived risks by some factions within Council. The "tried and true" process for manual data entry was to be applied, as that eliminated any perceived risk of data corruption which might happen through programmatic bulk updating of the
records.
Stage 1. Learning the process "the way we do it"
Initially, a single Beca consultant (Miriam Munster) was mobilised onsite under a direct secondment contract. Miriam's first task on arrival was to setup a Progress Chart that
showed the overall objective (10,600 meters) versus time. This is similar to the Burn-Down Chart used in Agile/ SCRUM projects, or the "required run rate worm graph" seen
in 1-day cricket matches. This graph allows all project team members and stakeholders to visualize progress on a weekly basis, and gauge whether the end goal is achievable or not, given current resources. As we will soon see, this graph was crucial.
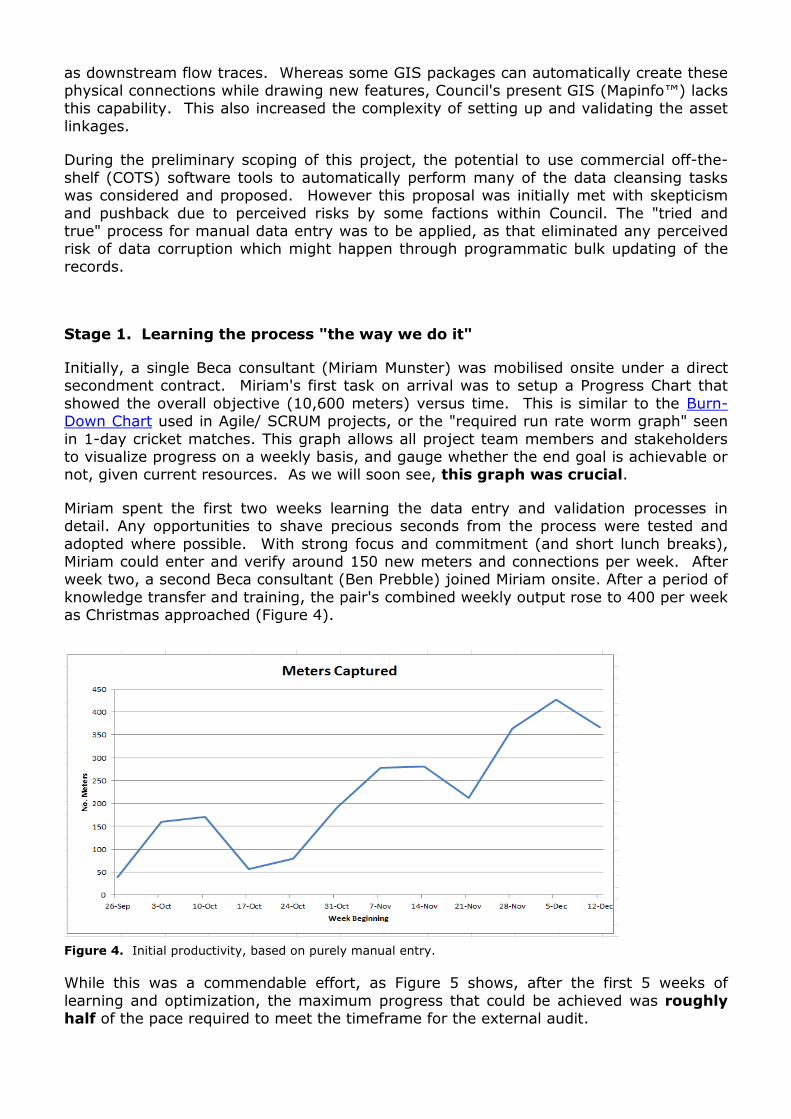
Miriam spent the first two weeks learning the data entry and validation processes in detail. Any opportunities to shave precious seconds from the process were tested and
adopted where possible. With strong focus and commitment (and short lunch breaks), Miriam could enter and verify around 150 new meters and connections per week. After week two, a second Beca consultant (Ben Prebble) joined Miriam onsite. After a period of
knowledge transfer and training, the pair's combined weekly output rose to 400 per week as Christmas approached (Figure 4).
Figure 4. Initial productivity, based on purely manual entry.
While this was a commendable effort, as Figure 5 shows, after the first 5 weeks of
learning and optimization, the maximum progress that could be achieved was roughly half of the pace required to meet the timeframe for the external audit.
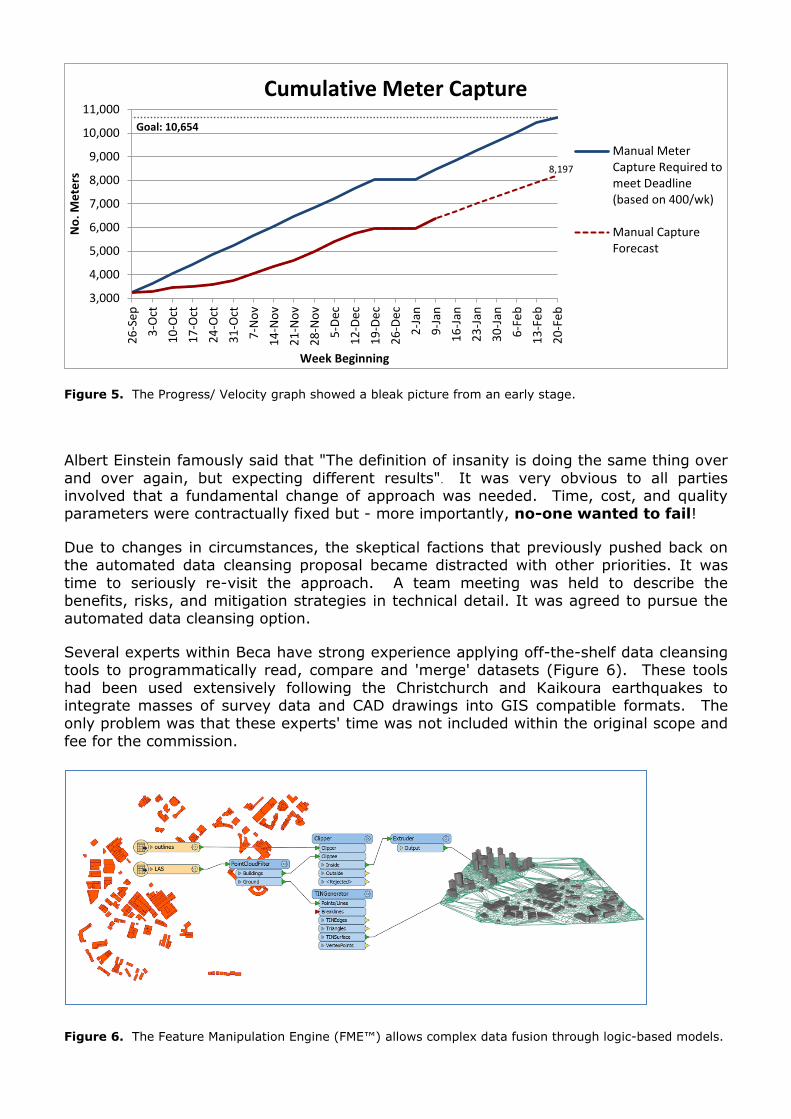
Figure 5. The Progress/ Velocity graph showed a bleak picture from an early stage.
Albert Einstein famously said that "The definition of insanity is doing the same thing over
and over again, but expecting different results". It was very obvious to all parties involved that a fundamental change of approach was needed. Time, cost, and quality parameters were contractually fixed but - more importantly, no-one wanted to fail!
Due to changes in circumstances, the skeptical factions that previously pushed back on the automated data cleansing proposal became distracted with other priorities. It was
time to seriously re-visit the approach. A team meeting was held to describe the benefits, risks, and mitigation strategies in technical detail. It was agreed to pursue the automated data cleansing option.
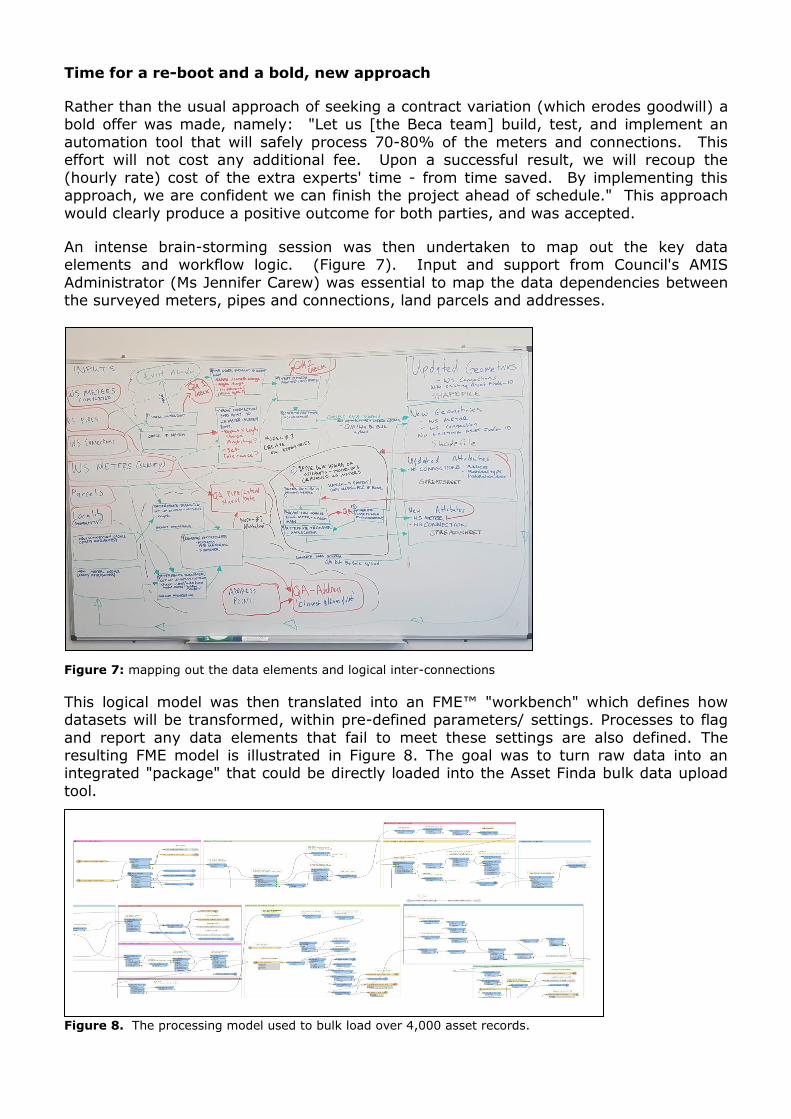
Several experts within Beca have strong experience applying off-the-shelf data cleansing tools to programmatically read, compare and 'merge' datasets (Figure 6). These tools
had been used extensively following the Christchurch and Kaikoura earthquakes to integrate masses of survey data and CAD drawings into GIS compatible formats. The only problem was that these experts' time was not included within the original scope and
fee for the commission.
Figure 6. The Feature Manipulation Engine (FME™) allows complex data fusion through logic-based models.
8,197
3,000
4,000
5,000
6,000
7,000
8,000
9,000
10,000
11,000
26
-Se
p
3-O
ct
10
-Oct
17
-Oct
24
-Oct
31
-Oct
7-N
ov
14
-No
v
21
-No
v
28
-No
v
5-D
ec
12
-De
c
19
-De
c
26
-De
c
2-J
an
9-J
an
16
-Jan
23
-Jan
30
-Jan
6-F
eb
13
-Fe
b
20
-Fe
b
No
. Me
ters
Week Beginning
Cumulative Meter Capture
Manual MeterCapture Required tomeet Deadline(based on 400/wk)
Manual CaptureForecast
Goal: 10,654
Time for a re-boot and a bold, new approach
Rather than the usual approach of seeking a contract variation (which erodes goodwill) a bold offer was made, namely: "Let us [the Beca team] build, test, and implement an
automation tool that will safely process 70-80% of the meters and connections. This effort will not cost any additional fee. Upon a successful result, we will recoup the
(hourly rate) cost of the extra experts' time - from time saved. By implementing this approach, we are confident we can finish the project ahead of schedule." This approach
would clearly produce a positive outcome for both parties, and was accepted.
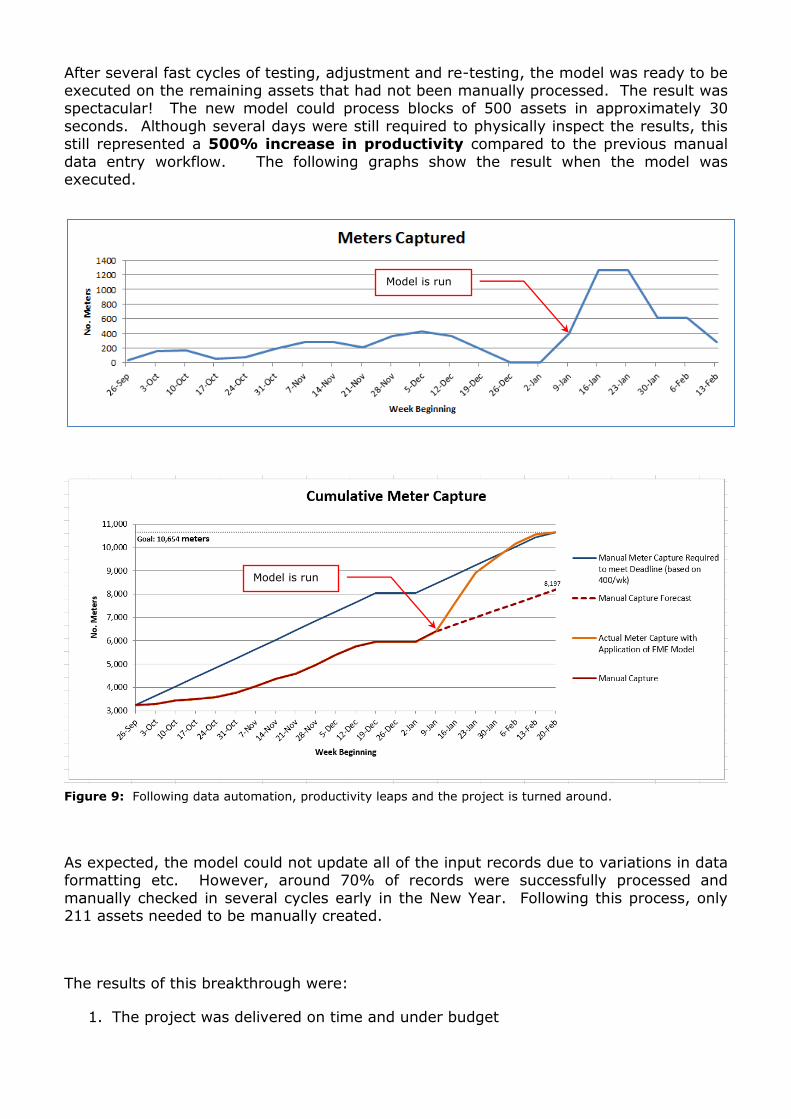
An intense brain-storming session was then undertaken to map out the key data elements and workflow logic. (Figure 7). Input and support from Council's AMIS
Administrator (Ms Jennifer Carew) was essential to map the data dependencies between the surveyed meters, pipes and connections, land parcels and addresses.
Figure 7: mapping out the data elements and logical inter-connections
This logical model was then translated into an FME™ "workbench" which defines how datasets will be transformed, within pre-defined parameters/ settings. Processes to flag
and report any data elements that fail to meet these settings are also defined. The resulting FME model is illustrated in Figure 8. The goal was to turn raw data into an integrated "package" that could be directly loaded into the Asset Finda bulk data upload
tool.
Figure 8. The processing model used to bulk load over 4,000 asset records.
After several fast cycles of testing, adjustment and re-testing, the model was ready to be executed on the remaining assets that had not been manually processed. The result was spectacular! The new model could process blocks of 500 assets in approximately 30
seconds. Although several days were still required to physically inspect the results, this still represented a 500% increase in productivity compared to the previous manual
data entry workflow. The following graphs show the result when the model was executed.
Figure 9: Following data automation, productivity leaps and the project is turned around.
As expected, the model could not update all of the input records due to variations in data formatting etc. However, around 70% of records were successfully processed and
manually checked in several cycles early in the New Year. Following this process, only 211 assets needed to be manually created.
The results of this breakthrough were:
1. The project was delivered on time and under budget
Model is run
Model is run
2. The new assets were created with less errors than through manual data processing
3. Beca and Council staff were released early to assist with other projects
4. Council met the deadline for the Financial systems audit
5. A creative solution was devised and adopted - based on mutual trust and commitment to deliver a successful outcome
6. The relationship between all parties was strengthened - despite a few new grey hairs!
CONCLUSIONS
This project highlights the inefficiency of manual data entry workflows when large backlogs of asset data need to be loaded into Asset Management Information Systems.
Automated data conversion tools such as FME™ can produce better, more accurate results in a fraction of the time. Proper planning, technical design and iterative testing
are essential to eliminate the risk of data corruption within the mission-critical AMIS.
When undertaking large data conversion projects, the most essential report is a Project
Velocity or Burn-Down chart that directly tracks progress against the total workload. Like the "Required Run Rate/ Worm graph in televised cricket matches, this graph flags when timeframes clearly cannot be met without a change in resourcing levels - or a new
technical approach.
Manually entering data into AMIS and GIS is tedious and error prone when hundreds or
thousands of features need to be updated. In this case, automation tools such as FME can save time and improve overall data quality compared to data entry. Additionally, it improves the data enterer's sanity and quality of life!
It is expected that the nationwide push for Affordable Housing will increase data entry back logs among Councils in high growth urban centers. It is essential that accurate 'as
built' asset data is obtained for these new developments at the outset, and integrated into AMIS in a timely manner. This will support proactive network maintenance planning and long-term operation. When faced with large-scale workload spikes and data entry
challenges, all options should be investigated early on, tested, and proven before being dismissed. Expert advice from both client and consultant should be equally valued and
the best path mapped out - independent of any personal bias or contractual terms.
Time saved through automated data cleansing should be utilised to perform advanced analysis of Council asset networks, such as capacity modeling. This is more interesting
and strategically valuable than repetitive data entry. We all need to work smarter - not harder.
Staff secondment contracts carry an element of risk when project objectives are not well defined or understood at the outset. As this project demonstrated, when project challenges arise, creative solutions can be devised and implemented based on mutual
goodwill and trust in ones' peers and proven technology solutions.

ACKNOWLEDGEMENTS
We wish to thank staff and colleagues within Council and Beca who supported this project. Special thanks to Miriam and Ben for their tenacity and good humor; to Henry
Carthew for sharing his FME™ wizardry; and Jennifer Carew for her guidance and full support of the automation effort. Justin Fail's coordination and agile project management
was also instrumental and highly appreciated.
REFERENCES
Growth Strategy, Waipa2050. Waipa District Council. Version 1.0, October 2017. https://www.waipadc.govt.nz/our-council/Waipa2050/DistrictGrowthStrategy/Documents/Growth%20Strategy%202050.pdf
https://en.wikipedia.org/wiki/Burn_down_chart