Embed Size (px)
Citation preview
Drag reduction with riblets in nature and engineering
D.W. Bechert & W. HageDepartment of Turbulence Research, German Aerospace Center (DLR),Berlin, Germany.
Abstract
Reduction of wall friction of turbulent boundary layer flows can be achieved by using surfaces withproperties that are related to skin structures occurring in nature. The scales of several species offast-swimming sharks show a tiny ribbed structure. This ribbed structure hampers the momentumexchange at the surface that is the origin of the turbulent shear stress.The drag-reducing mechanismof ribbed surfaces (or riblets) is explained by using an analytical model that defines the viscousregion of the flow, where the riblets are completely immersed in the viscous sublayer of theturbulent boundary layer. Wall shear stress reduction has been investigated experimentally forvarious riblet surfaces including a replica of sharkskin consisting of 800 plastic model scales withcompliant anchoring. The application of these types of structure to long-range commercial aircraftis discussed, including the effect of the drag reductions on the operational costs of the aircraft.
1 Introduction
Drag reduction of a moving animal or vehicle can be achieved by a reduction of wall shearstress and, in some situations, by separation control. Here we focus on turbulent wall shear stressreduction. Obviously laminar flow, which has been successfully used on glider wings, offers thelowest attainable wall shear stress. On commercial aircraft, however, the problems associated withthe implementation of laminar flow on swept transonic wings are at present not yet completelysolved. Even when laminar flow is maintained over a major percentage of the wing, most of theaircraft surface will still have a turbulent boundary layer. Turbulent wall shear stress reduction,therefore, remains important in all scenarios of future aircraft design.
1.1 The mechanism of sharkskin or ‘riblets’
American scientists invented ribbed surfaces on the basis of fluid-dynamical reasoning, parallelwork in Germany was motivated by observations of the structure of sharkskins [1–3]. Sharks, such
www.witpress.com, ISSN 1755-8336 (on-line)
© 2006 WIT PressWIT Transactions on State of the Art in Science and Engineering, Vol 4,
doi:10.2495/1-84564-095-0/5g
458 Flow Phenomena in Nature
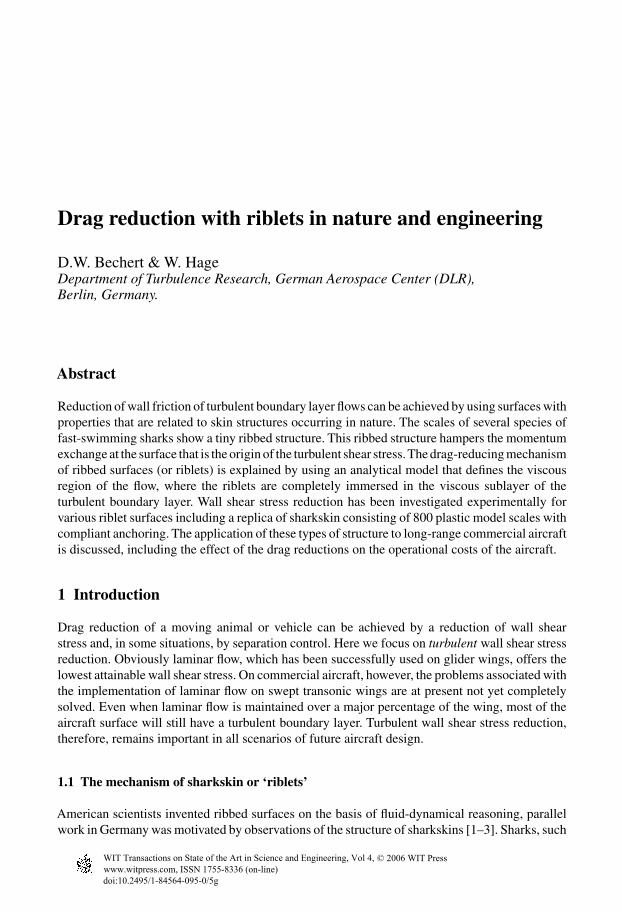
Figure 1: Microstructure of the skin of the Galapagos shark (Carcharhinus galapagensis). Photo-graph by W.E. Reif [4].
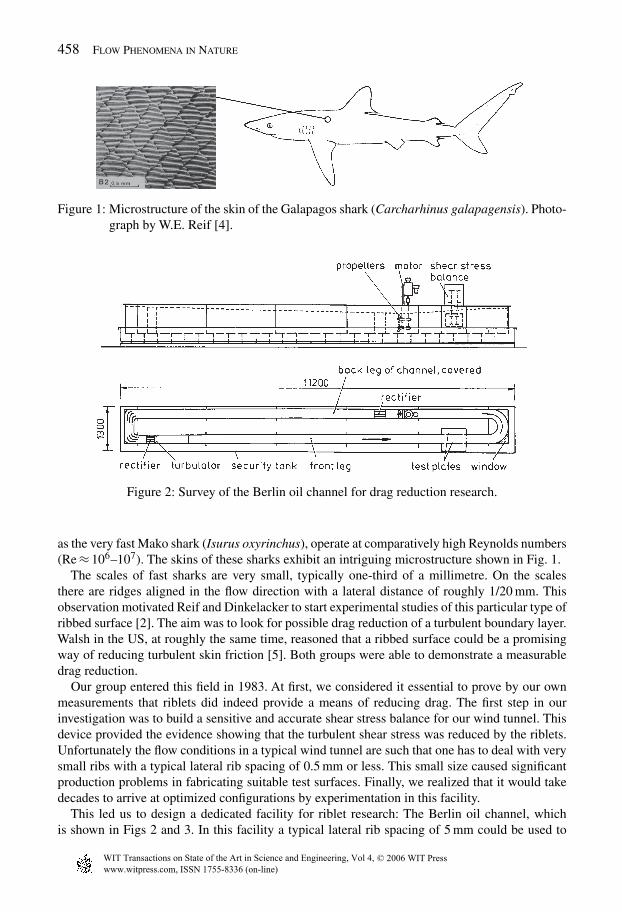
Figure 2: Survey of the Berlin oil channel for drag reduction research.
as the very fast Mako shark (Isurus oxyrinchus), operate at comparatively high Reynolds numbers(Re ≈ 106–107). The skins of these sharks exhibit an intriguing microstructure shown in Fig. 1.
The scales of fast sharks are very small, typically one-third of a millimetre. On the scalesthere are ridges aligned in the flow direction with a lateral distance of roughly 1/20 mm. Thisobservation motivated Reif and Dinkelacker to start experimental studies of this particular type ofribbed surface [2]. The aim was to look for possible drag reduction of a turbulent boundary layer.Walsh in the US, at roughly the same time, reasoned that a ribbed surface could be a promisingway of reducing turbulent skin friction [5]. Both groups were able to demonstrate a measurabledrag reduction.
Our group entered this field in 1983. At first, we considered it essential to prove by our ownmeasurements that riblets did indeed provide a means of reducing drag. The first step in ourinvestigation was to build a sensitive and accurate shear stress balance for our wind tunnel. Thisdevice provided the evidence showing that the turbulent shear stress was reduced by the riblets.Unfortunately the flow conditions in a typical wind tunnel are such that one has to deal with verysmall ribs with a typical lateral rib spacing of 0.5 mm or less. This small size caused significantproduction problems in fabricating suitable test surfaces. Finally, we realized that it would takedecades to arrive at optimized configurations by experimentation in this facility.
This led us to design a dedicated facility for riblet research: The Berlin oil channel, whichis shown in Figs 2 and 3. In this facility a typical lateral rib spacing of 5 mm could be used to
www.witpress.com, ISSN 1755-8336 (on-line)
© 2006 WIT PressWIT Transactions on State of the Art in Science and Engineering, Vol 4,
Drag Reduction with Riblets in Nature and Engineering 459
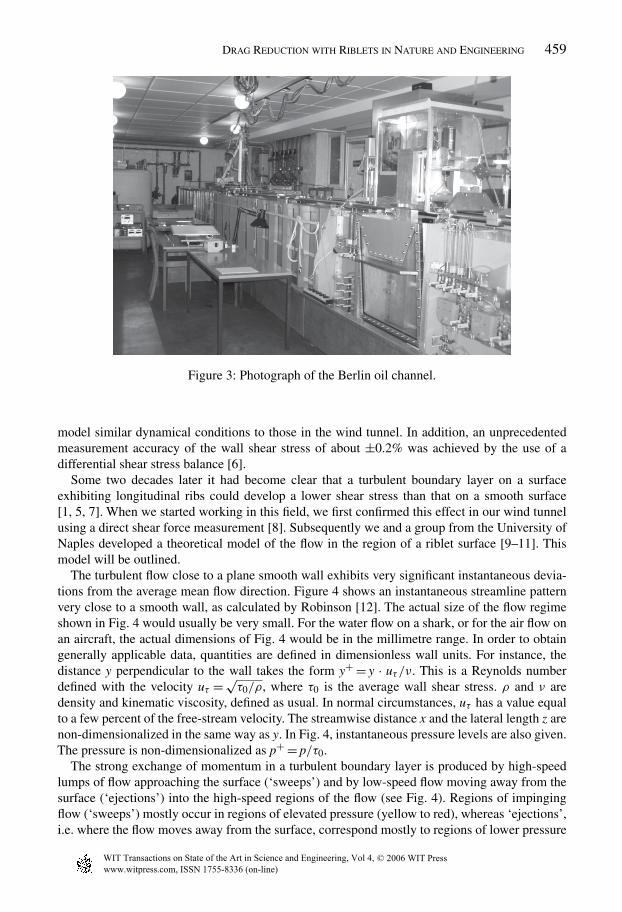
Figure 3: Photograph of the Berlin oil channel.
model similar dynamical conditions to those in the wind tunnel. In addition, an unprecedentedmeasurement accuracy of the wall shear stress of about ±0.2% was achieved by the use of adifferential shear stress balance [6].
Some two decades later it had become clear that a turbulent boundary layer on a surfaceexhibiting longitudinal ribs could develop a lower shear stress than that on a smooth surface[1, 5, 7]. When we started working in this field, we first confirmed this effect in our wind tunnelusing a direct shear force measurement [8]. Subsequently we and a group from the University ofNaples developed a theoretical model of the flow in the region of a riblet surface [9–11]. Thismodel will be outlined.
The turbulent flow close to a plane smooth wall exhibits very significant instantaneous devia-tions from the average mean flow direction. Figure 4 shows an instantaneous streamline patternvery close to a smooth wall, as calculated by Robinson [12]. The actual size of the flow regimeshown in Fig. 4 would usually be very small. For the water flow on a shark, or for the air flow onan aircraft, the actual dimensions of Fig. 4 would be in the millimetre range. In order to obtaingenerally applicable data, quantities are defined in dimensionless wall units. For instance, thedistance y perpendicular to the wall takes the form y+ = y · uτ /ν. This is a Reynolds numberdefined with the velocity uτ = √
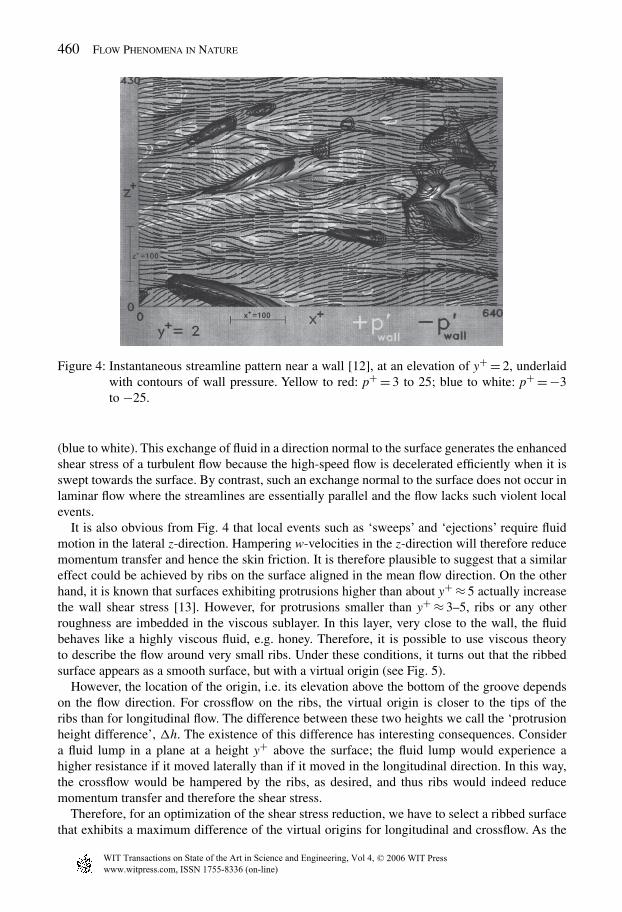
τ0/ρ, where τ0 is the average wall shear stress. ρ and ν aredensity and kinematic viscosity, defined as usual. In normal circumstances, uτ has a value equalto a few percent of the free-stream velocity. The streamwise distance x and the lateral length z arenon-dimensionalized in the same way as y. In Fig. 4, instantaneous pressure levels are also given.The pressure is non-dimensionalized as p+ = p/τ0.
The strong exchange of momentum in a turbulent boundary layer is produced by high-speedlumps of flow approaching the surface (‘sweeps’) and by low-speed flow moving away from thesurface (‘ejections’) into the high-speed regions of the flow (see Fig. 4). Regions of impingingflow (‘sweeps’) mostly occur in regions of elevated pressure (yellow to red), whereas ‘ejections’,i.e. where the flow moves away from the surface, correspond mostly to regions of lower pressure
www.witpress.com, ISSN 1755-8336 (on-line)
© 2006 WIT PressWIT Transactions on State of the Art in Science and Engineering, Vol 4,
460 Flow Phenomena in Nature
Figure 4: Instantaneous streamline pattern near a wall [12], at an elevation of y+ = 2, underlaidwith contours of wall pressure. Yellow to red: p+ = 3 to 25; blue to white: p+ = −3to −25.
(blue to white). This exchange of fluid in a direction normal to the surface generates the enhancedshear stress of a turbulent flow because the high-speed flow is decelerated efficiently when it isswept towards the surface. By contrast, such an exchange normal to the surface does not occur inlaminar flow where the streamlines are essentially parallel and the flow lacks such violent localevents.
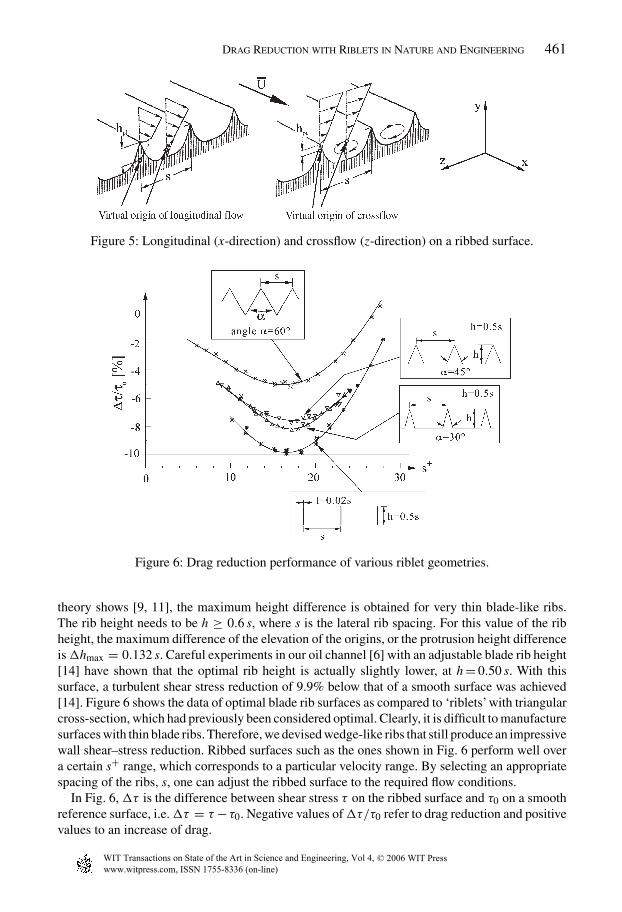
It is also obvious from Fig. 4 that local events such as ‘sweeps’ and ‘ejections’ require fluidmotion in the lateral z-direction. Hampering w-velocities in the z-direction will therefore reducemomentum transfer and hence the skin friction. It is therefore plausible to suggest that a similareffect could be achieved by ribs on the surface aligned in the mean flow direction. On the otherhand, it is known that surfaces exhibiting protrusions higher than about y+ ≈ 5 actually increasethe wall shear stress [13]. However, for protrusions smaller than y+ ≈ 3–5, ribs or any otherroughness are imbedded in the viscous sublayer. In this layer, very close to the wall, the fluidbehaves like a highly viscous fluid, e.g. honey. Therefore, it is possible to use viscous theoryto describe the flow around very small ribs. Under these conditions, it turns out that the ribbedsurface appears as a smooth surface, but with a virtual origin (see Fig. 5).
However, the location of the origin, i.e. its elevation above the bottom of the groove dependson the flow direction. For crossflow on the ribs, the virtual origin is closer to the tips of theribs than for longitudinal flow. The difference between these two heights we call the ‘protrusionheight difference’, �h. The existence of this difference has interesting consequences. Considera fluid lump in a plane at a height y+ above the surface; the fluid lump would experience ahigher resistance if it moved laterally than if it moved in the longitudinal direction. In this way,the crossflow would be hampered by the ribs, as desired, and thus ribs would indeed reducemomentum transfer and therefore the shear stress.
Therefore, for an optimization of the shear stress reduction, we have to select a ribbed surfacethat exhibits a maximum difference of the virtual origins for longitudinal and crossflow. As the
www.witpress.com, ISSN 1755-8336 (on-line)
© 2006 WIT PressWIT Transactions on State of the Art in Science and Engineering, Vol 4,
Drag Reduction with Riblets in Nature and Engineering 461
Figure 5: Longitudinal (x-direction) and crossflow (z-direction) on a ribbed surface.
Figure 6: Drag reduction performance of various riblet geometries.
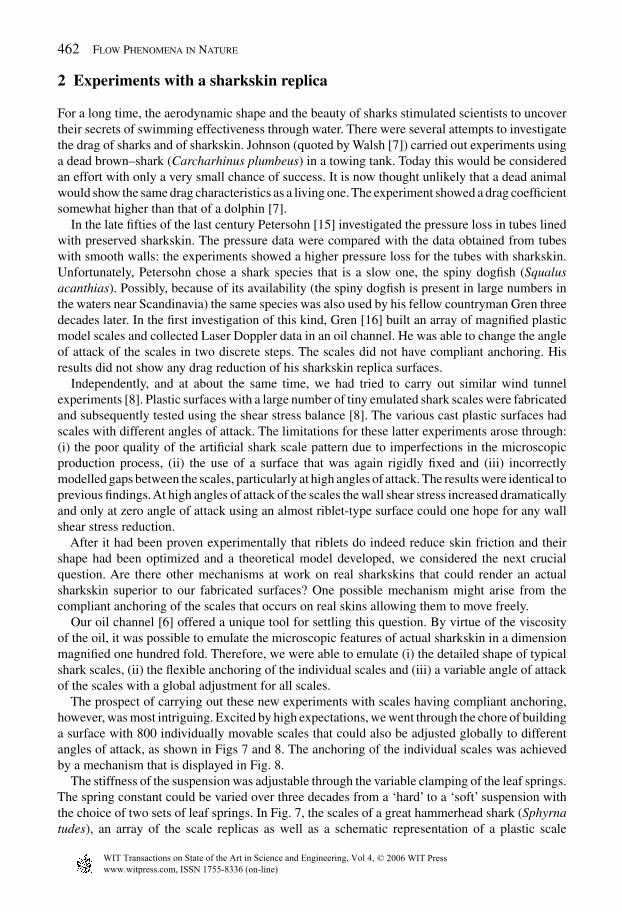
theory shows [9, 11], the maximum height difference is obtained for very thin blade-like ribs.The rib height needs to be h ≥ 0.6 s, where s is the lateral rib spacing. For this value of the ribheight, the maximum difference of the elevation of the origins, or the protrusion height differenceis�hmax = 0.132 s. Careful experiments in our oil channel [6] with an adjustable blade rib height[14] have shown that the optimal rib height is actually slightly lower, at h = 0.50 s. With thissurface, a turbulent shear stress reduction of 9.9% below that of a smooth surface was achieved[14]. Figure 6 shows the data of optimal blade rib surfaces as compared to ‘riblets’ with triangularcross-section, which had previously been considered optimal. Clearly, it is difficult to manufacturesurfaces with thin blade ribs. Therefore, we devised wedge-like ribs that still produce an impressivewall shear–stress reduction. Ribbed surfaces such as the ones shown in Fig. 6 perform well overa certain s+ range, which corresponds to a particular velocity range. By selecting an appropriatespacing of the ribs, s, one can adjust the ribbed surface to the required flow conditions.
In Fig. 6,�τ is the difference between shear stress τ on the ribbed surface and τ0 on a smoothreference surface, i.e.�τ = τ −τ0. Negative values of�τ/τ0 refer to drag reduction and positivevalues to an increase of drag.
www.witpress.com, ISSN 1755-8336 (on-line)
© 2006 WIT PressWIT Transactions on State of the Art in Science and Engineering, Vol 4,
462 Flow Phenomena in Nature
2 Experiments with a sharkskin replica
For a long time, the aerodynamic shape and the beauty of sharks stimulated scientists to uncovertheir secrets of swimming effectiveness through water. There were several attempts to investigatethe drag of sharks and of sharkskin. Johnson (quoted by Walsh [7]) carried out experiments usinga dead brown–shark (Carcharhinus plumbeus) in a towing tank. Today this would be consideredan effort with only a very small chance of success. It is now thought unlikely that a dead animalwould show the same drag characteristics as a living one. The experiment showed a drag coefficientsomewhat higher than that of a dolphin [7].
In the late fifties of the last century Petersohn [15] investigated the pressure loss in tubes linedwith preserved sharkskin. The pressure data were compared with the data obtained from tubeswith smooth walls: the experiments showed a higher pressure loss for the tubes with sharkskin.Unfortunately, Petersohn chose a shark species that is a slow one, the spiny dogfish (Squalusacanthias). Possibly, because of its availability (the spiny dogfish is present in large numbers inthe waters near Scandinavia) the same species was also used by his fellow countryman Gren threedecades later. In the first investigation of this kind, Gren [16] built an array of magnified plasticmodel scales and collected Laser Doppler data in an oil channel. He was able to change the angleof attack of the scales in two discrete steps. The scales did not have compliant anchoring. Hisresults did not show any drag reduction of his sharkskin replica surfaces.
Independently, and at about the same time, we had tried to carry out similar wind tunnelexperiments [8]. Plastic surfaces with a large number of tiny emulated shark scales were fabricatedand subsequently tested using the shear stress balance [8]. The various cast plastic surfaces hadscales with different angles of attack. The limitations for these latter experiments arose through:(i) the poor quality of the artificial shark scale pattern due to imperfections in the microscopicproduction process, (ii) the use of a surface that was again rigidly fixed and (iii) incorrectlymodelled gaps between the scales, particularly at high angles of attack. The results were identical toprevious findings.At high angles of attack of the scales the wall shear stress increased dramaticallyand only at zero angle of attack using an almost riblet-type surface could one hope for any wallshear stress reduction.
After it had been proven experimentally that riblets do indeed reduce skin friction and theirshape had been optimized and a theoretical model developed, we considered the next crucialquestion. Are there other mechanisms at work on real sharkskins that could render an actualsharkskin superior to our fabricated surfaces? One possible mechanism might arise from thecompliant anchoring of the scales that occurs on real skins allowing them to move freely.
Our oil channel [6] offered a unique tool for settling this question. By virtue of the viscosityof the oil, it was possible to emulate the microscopic features of actual sharkskin in a dimensionmagnified one hundred fold. Therefore, we were able to emulate (i) the detailed shape of typicalshark scales, (ii) the flexible anchoring of the individual scales and (iii) a variable angle of attackof the scales with a global adjustment for all scales.
The prospect of carrying out these new experiments with scales having compliant anchoring,however, was most intriguing. Excited by high expectations, we went through the chore of buildinga surface with 800 individually movable scales that could also be adjusted globally to differentangles of attack, as shown in Figs 7 and 8. The anchoring of the individual scales was achievedby a mechanism that is displayed in Fig. 8.
The stiffness of the suspension was adjustable through the variable clamping of the leaf springs.The spring constant could be varied over three decades from a ‘hard’ to a ‘soft’ suspension withthe choice of two sets of leaf springs. In Fig. 7, the scales of a great hammerhead shark (Sphyrnatudes), an array of the scale replicas as well as a schematic representation of a plastic scale
www.witpress.com, ISSN 1755-8336 (on-line)
© 2006 WIT PressWIT Transactions on State of the Art in Science and Engineering, Vol 4,

Drag Reduction with Riblets in Nature and Engineering 463
Figure 7: Hammerhead shark scales in nature and experiment, all numbers in millimetres.
Figure 8: Schematic representation of the artificial shark scale arrangement and the suspensionmechanism, all numbers in millimetres.
with five ribs can be seen. The plastic scales were designed according to our own microscopeobservations of hammerhead shark scales. The manufacturing process consisted first of a 600:1hand-sculptured clay model. From that model, a negative mould was cast. With a pantograph-copymilling machine, the mould was reduced in size to a 100:1 scale. This mould was inserted intoa plastic casting machine and 800 polystyrene scales were subsequently produced. In addition,tiny brass wire legs and the other parts of the suspension mechanism were manufactured usingsuitable tools, then soldered together and glued onto the scales. The scale array can be seen partlyassembled and completely assembled in Fig. 9. Note that suspension stiffness as well as scaleangle can be varied during the measurement by a remote toothed belt-drive mechanism.
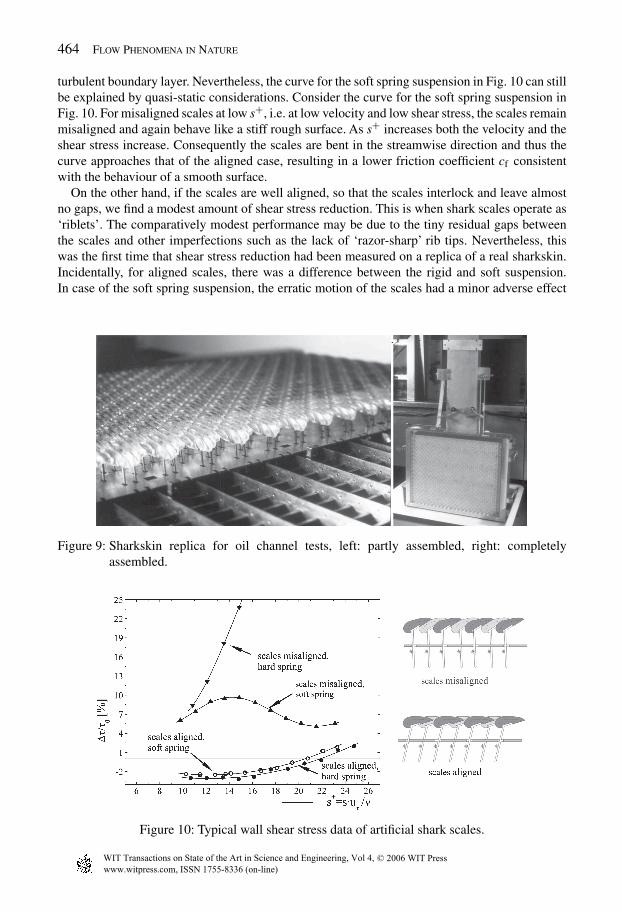
Drag measurements were made with different spring stiffness with the scale both aligned andmisaligned. Typical wall shear stress data measured on the artificial shark scale surface are shownin Fig. 10. For a high spring stiffness with misaligned scales the data are consistent with previousresults, the misaligned scales appear to act like a rough surface and produce a large drag increase[8, 16]. An interesting situation arises when the aligned scales are anchored to the base by a softmounting. In this case, observations in the oil-channel showed that the scales moved in a collectiveerratic motion, presumably driven by the locally varying instantaneous shear stresses within the
www.witpress.com, ISSN 1755-8336 (on-line)
© 2006 WIT PressWIT Transactions on State of the Art in Science and Engineering, Vol 4,
464 Flow Phenomena in Nature
turbulent boundary layer. Nevertheless, the curve for the soft spring suspension in Fig. 10 can stillbe explained by quasi-static considerations. Consider the curve for the soft spring suspension inFig. 10. For misaligned scales at low s+, i.e. at low velocity and low shear stress, the scales remainmisaligned and again behave like a stiff rough surface. As s+ increases both the velocity and theshear stress increase. Consequently the scales are bent in the streamwise direction and thus thecurve approaches that of the aligned case, resulting in a lower friction coefficient cf consistentwith the behaviour of a smooth surface.
On the other hand, if the scales are well aligned, so that the scales interlock and leave almostno gaps, we find a modest amount of shear stress reduction. This is when shark scales operate as‘riblets’. The comparatively modest performance may be due to the tiny residual gaps betweenthe scales and other imperfections such as the lack of ‘razor-sharp’ rib tips. Nevertheless, thiswas the first time that shear stress reduction had been measured on a replica of a real sharkskin.Incidentally, for aligned scales, there was a difference between the rigid and soft suspension.In case of the soft spring suspension, the erratic motion of the scales had a minor adverse effect
Figure 9: Sharkskin replica for oil channel tests, left: partly assembled, right: completelyassembled.
Figure 10: Typical wall shear stress data of artificial shark scales.
www.witpress.com, ISSN 1755-8336 (on-line)
© 2006 WIT PressWIT Transactions on State of the Art in Science and Engineering, Vol 4,
Drag Reduction with Riblets in Nature and Engineering 465
on drag reduction. With a rigid spring suspension the aligned scales appear stiff and the best dragreduction was obtained with �τ/τ0 = −3.1% [17]. This implies that the flexible mounting ofthe scales, allowing interaction with the turbulent flow, showed no advantage in terms of dragreduction. On the other hand, it is clear, that the shark cannot have a rigid skin structure. Otherwise,it would not be able to perform the bodily contortions required for its propulsion.
We summarize these results with the statement that, even with a detailed and compliant sharkskinreplica, we did not find any striking effect, at least as far as shear stress reduction is concerned.Actually, our synthetic two-dimensional blade rib surfaces perform significantly better than ourambitious sharkskin replica. There remains, however, the possibility that actual sharkskin, say,of a shark like that shown in Fig. 1 with its very regular ribs and sharp rib tips [4], may performbetter and indeed closer to our optimized synthetic two-dimensional riblets.
3 Riblets on aircrafts
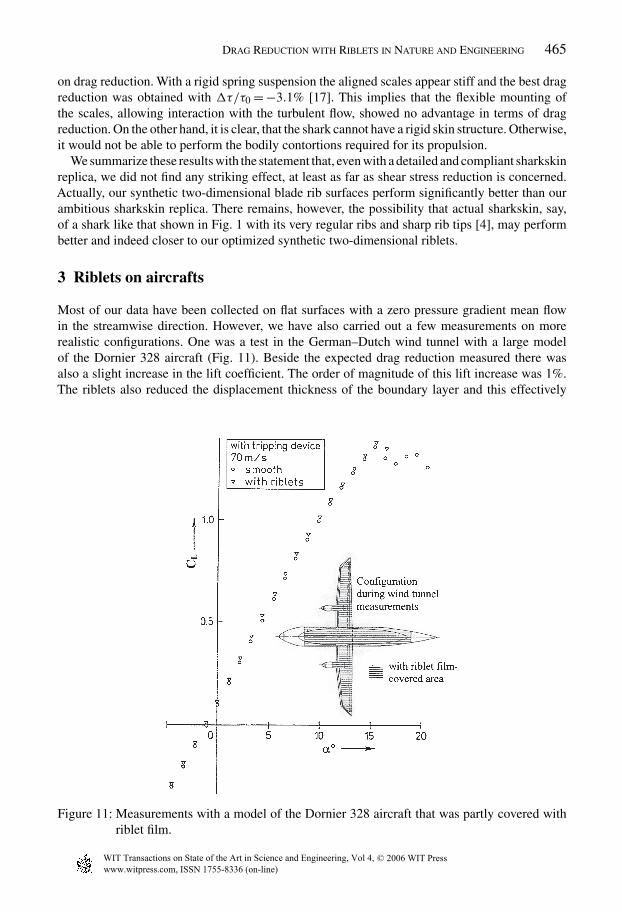
Most of our data have been collected on flat surfaces with a zero pressure gradient mean flowin the streamwise direction. However, we have also carried out a few measurements on morerealistic configurations. One was a test in the German–Dutch wind tunnel with a large modelof the Dornier 328 aircraft (Fig. 11). Beside the expected drag reduction measured there wasalso a slight increase in the lift coefficient. The order of magnitude of this lift increase was 1%.The riblets also reduced the displacement thickness of the boundary layer and this effectively
Figure 11: Measurements with a model of the Dornier 328 aircraft that was partly covered withriblet film.
www.witpress.com, ISSN 1755-8336 (on-line)
© 2006 WIT PressWIT Transactions on State of the Art in Science and Engineering, Vol 4,
466 Flow Phenomena in Nature
increased the airfoil camber and so produced an aerofoil with higher lift properties [18]. Therehave been also a few tests on full-size aircraft by both Boeing and Airbus. Airbus started ribletfilm tests on an A320 aircraft that provided the expected results. Later, a long-range A340 airliner,partly covered (30%) with 3M riblet film was flown for several years in commercial service byCathay Pacific Airways.
At present, artificial sharkskin, i.e. riblet film, has not been widely used on long-range com-mercial aircraft. The reasons why riblet surfaces are not seen on aircraft involve both rationaland irrational arguments. The rational reasoning argued with technical worries, for instance, thequality of the adhesive, possible damage from UV radiation as well as a degradation in dragreduction because of fouling of the riblets from dirt. Today these arguments are no longer valid.Improved recipes for both adhesive and plastic riblet film make these arguments obsolete. Theadhesive is nowadays reliable and the plastic material used for the films contains fluorine, whichresults in protection against UV radiation as well as acting as a dirt repellent. The perspective ofhaving an aircraft coated with a dirt repellent film surface may offer an additional attraction asfar as maintenance costs are concerned.
Besides these arguments, there is the question of application costs. At present it takes oneweek to coat an aircraft with riblet film, according to a certain aircraft manufacturer, and duringthat time the aircraft earns no money. Plausible as this sounds, it is indeed a spoof argument.Clearly, it must be possible to coat the aircraft in small regions in parallel with other mechanicalor maintenance work. This is possible, because the application of the riblet film does not involveany fumes, hazardous to health, as in paint spraying.
The irrational reason consists of the prejudice of some airlines’ marketing departments andaircraft manufacturers that the shimmering plastic riblet film may look unusual and thereforeunappealing to customers. This could, of course, easily be changed by a clever marketingcampaign.
The advantage of using riblets on aircrafts lies in both the lower fuel consumption and theresulting weight reduction. On long-range aircraft (i) the fuel costs contribute significantly to thedirect operating costs and (ii) the fuel weight exceeds by far the payload.
Consider an application on an Airbus A340-300. What are the implications of riblet film to theincrease of its economic performance? The contribution of the skin friction to the total drag of thisaircraft is about 50%. This skin friction contribution can be reduced with our optimized ribletsusing trapezoidal grooves by 8.2%. Because of possible imperfection in aligning the riblets to theflow direction on the surfaces and a possible lack of extreme sharpness of the tips of the ribs itis wise to estimate the achievable drag reduction at a somewhat lower level, say with 6%. If thewhole aircraft were to be covered with riblet film a total drag reduction of about 3% could beobtained. However, not the whole surface of the aircraft can be coated with riblet film for variousreasons. At the leading edges of the wings and in the vicinity of the landing gear dust erosionover a long period causes damage rather like sand blasting. In addition, at the leading edges of thewings, the riblet film would interfere with the de-icing system and would also be incompatiblewith the laminar flow there. Locations where fuel and/or hydraulic fluid may come in contact withthe plastic riblet film need also to be avoided. Obviously, neither can the windows be covered.Thus, only about 70% of the aircraft can be coated with riblet film. In addition, in some places,riblet spacing and alignment will be suboptimal.
On the other hand, some of the roughness on the aircraft surface will be covered by plastic filmand will be smoothed by the film. Moreover, a reduction of the wall friction ensures a slightlythinner boundary layer that, in turn, causes a reduction of the form drag over the rear part of thefuselage. This suggests that a 2% reduction in total drag of the aircraft is probably achievable.
www.witpress.com, ISSN 1755-8336 (on-line)
© 2006 WIT PressWIT Transactions on State of the Art in Science and Engineering, Vol 4,
Drag Reduction with Riblets in Nature and Engineering 467
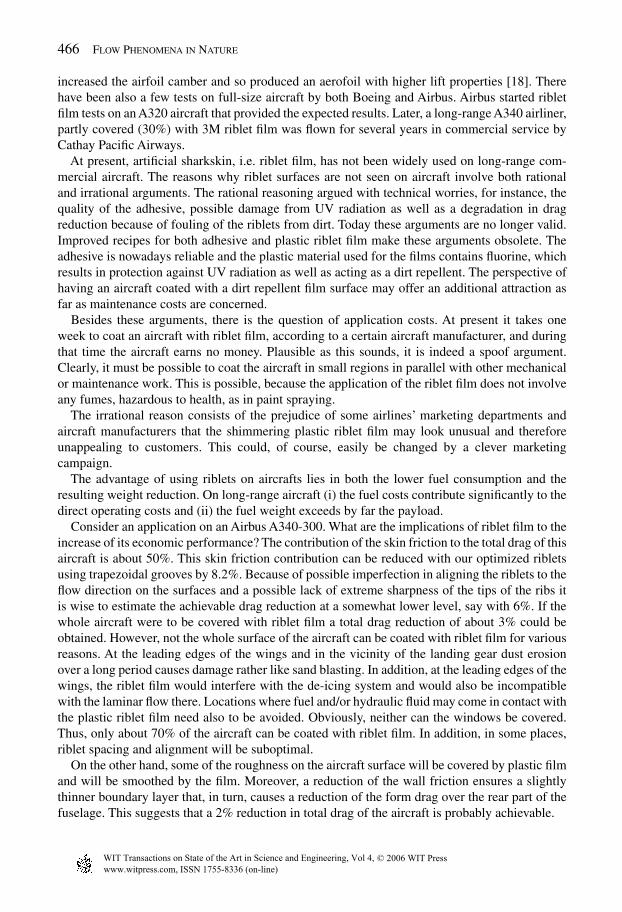
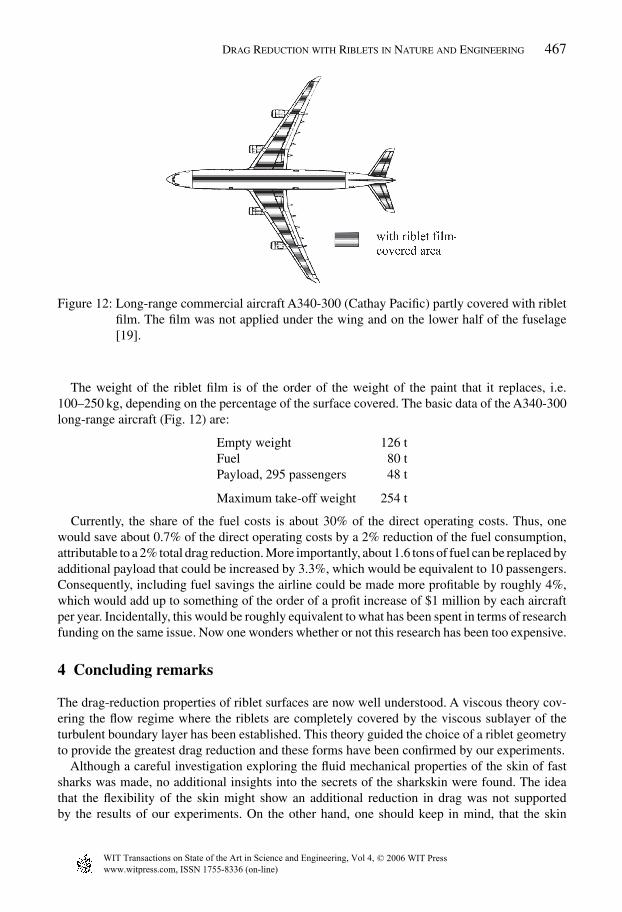
Figure 12: Long-range commercial aircraft A340-300 (Cathay Pacific) partly covered with ribletfilm. The film was not applied under the wing and on the lower half of the fuselage[19].
The weight of the riblet film is of the order of the weight of the paint that it replaces, i.e.100–250 kg, depending on the percentage of the surface covered. The basic data of the A340-300long-range aircraft (Fig. 12) are:
Empty weight 126 tFuel 80 tPayload, 295 passengers 48 t
Maximum take-off weight 254 t
Currently, the share of the fuel costs is about 30% of the direct operating costs. Thus, onewould save about 0.7% of the direct operating costs by a 2% reduction of the fuel consumption,attributable to a 2% total drag reduction. More importantly, about 1.6 tons of fuel can be replaced byadditional payload that could be increased by 3.3%, which would be equivalent to 10 passengers.Consequently, including fuel savings the airline could be made more profitable by roughly 4%,which would add up to something of the order of a profit increase of $1 million by each aircraftper year. Incidentally, this would be roughly equivalent to what has been spent in terms of researchfunding on the same issue. Now one wonders whether or not this research has been too expensive.
4 Concluding remarks
The drag-reduction properties of riblet surfaces are now well understood. A viscous theory cov-ering the flow regime where the riblets are completely covered by the viscous sublayer of theturbulent boundary layer has been established. This theory guided the choice of a riblet geometryto provide the greatest drag reduction and these forms have been confirmed by our experiments.
Although a careful investigation exploring the fluid mechanical properties of the skin of fastsharks was made, no additional insights into the secrets of the sharkskin were found. The ideathat the flexibility of the skin might show an additional reduction in drag was not supportedby the results of our experiments. On the other hand, one should keep in mind, that the skin
www.witpress.com, ISSN 1755-8336 (on-line)
© 2006 WIT PressWIT Transactions on State of the Art in Science and Engineering, Vol 4,
468 Flow Phenomena in Nature
must necessarily be flexible. Otherwise, the sharks would probably have developed a more rigidstructure, which would be closer to the ‘technical’ riblet structure.
It has been shown repeatedly that riblets can be used to reduce the fuel consumption of aircraft.Nevertheless, a standard application of this type of surface is not in sight, although all arguments(from our point of view) are in favour of using this passive drag-reducing device. When the viewthat the supply of fossil fuel is limited [20] coupled with the inevitable fuel price increase becomesaccepted, maybe the concept of applying an artificial sharkskin to an aircraft will be reconsidered.
Acknowledgements
This paper was completed after Dr D.W. Bechert passed away in December 2004. I would liketo thank Prof. M. Gaster and his wife for a careful review and valuable comments on the presentpaper.
References
[1] Nitschke, P., Experimentelle Untersuchung der turbulenten Strömung in glatten und längs-gerillten Rohren. Max-Planck-Institut für Strömungsforschung, Göttingen, Bericht 3/1983,1983. Trans.: Experimental investigation of the turbulent flow in smooth and longitudinallygrooved tubes, NASA TM 77480, 1984.
[2] Reif, W.-E. & Dinkelacker, A., Hydrodynamics of the squamation in fast swimming sharks.Neues Jahrbuch für Geologie und Palaeontologie, Abhandlungen, 164, pp. 184–187, 1982.
[3] Dinkelacker, A., Nitschke-Kowsky, P. & Reif, W.-E., On the possibility of drag reductionwith the help of longitudinal ridges in the walls. IUTAM-Symp. on Turbulence Manage-ment and Relaminarization, Bangalore, India, 1987, eds. H.W. Liepmann & R. Narasimha,Springer-Verlag: Berlin, 1988.
[4] Reif, W.-E., Squamation and ecology of sharks, Courier Forsch.-Inst. Senckenberg, Nr. 78,Frankfurt/M., 1985.
[5] Walsh, M.J., Drag reduction of V-groove and transverse curvature riblets. Viscous FlowDrag Reduction, ed. G.R. Hough, Progress inAstronautics andAeronautics,Vol. 72,AIAA:New York, pp. 168–184, 1980.
[6] Bechert, D.W., Hoppe, G., van der Hoeven, J.G.T. & Makris, R., The Berlin oil channelfor drag reduction research. Experiments in Fluids, 12, pp. 251–260, 1992.
[7] Walsh, M.J., Riblets. Viscous Drag Reduction in Boundary Layers, eds. D.M. Bushnell &J.N. Hefner, Progress in Astronautics and Aeronautics, Vol. 123, AIAA: Washington,pp. 203–262, 1990.
[8] Bechert, D.W., Hoppe, G. & Reif, W.-E., On the drag reduction of the shark skin, AIAA-Paper 85-0546, 1985.
[9] Bechert, D.W. & Bartenwerfer, M., The viscous flow on surfaces with longitudinal ribs.Journal of Fluid Mechanics, 206, pp. 105–129, 1989.
[10] Bechert, D.W., Bartenwerfer, M. & Hoppe, G., Turbulent drag reduction by nonplanarsurfaces—a survey on the research at TU/DLR Berlin. IUTAM-Symp. on ‘Structure ofTurbulence and Drag Reduction’, Zürich, 1989, Springer–Verlag: Berlin, 1990.
[11] Luchini, P., Manzo, F. & Pozzi, A., Resistance of a grooved surface to parallel flow andcross-flow. Journal of Fluid Mechanics, 228, pp. 87–109, 1991.
[12] Robinson, S.K., The kinematics of turbulent boundary layer structure, NASA TM 103859,April 1991.
www.witpress.com, ISSN 1755-8336 (on-line)
© 2006 WIT PressWIT Transactions on State of the Art in Science and Engineering, Vol 4,
Drag Reduction with Riblets in Nature and Engineering 469
[13] Schlichting, H., Boundary Layer Theory, transl. J. Kestin, 7th edn, McGraw-Hill: NewYork,1979.
[14] Bechert, D.W., Bruse, M., Hage, W., van der Hoeven, J.G.T. & Hoppe, G., Experimentson drag-reducing surfaces and their optimization with an adjustable geometry. Journal ofFluid Mechanics, 338, pp. 59–87, 1997.
[15] Petersohn, E., Concerning an investigation of the flow in pipes, internally covered withshark skin, AE-I-444, FFA, The Aeronautical Research Institute of Sweden, 1959.
[16] Gren, P., Structured surfaces and turbulence, Licentiate Thesis, Division of Fluid Mechan-ics, Lulea University, Sweden, 1987.
[17] Hage, W., Zur Widerstandsverminderung von dreidimensionalen Riblet-Strukturen undanderen Oberflächen, PhD Thesis, Mensch & Buch Verlag: Berlin, 2005.
[18] Hoeven, J.G.Th. van der & Bechert, D.W., Experiments with a 1:4.2 model of a com-muter aircraft with Riblets in a large wind tunnel. Recent Developments in TurbulenceManagement, ed. K.-S. Choi, Kluwer: Dordrecht, Netherlands, pp. 3–24, 1991.
[19] Jackson, P. (ed.), Jane’s: All the World’s Aircraft 1997–1998, Jane’s Information Group:Coulsdon, Surrey, England, 1997.
[20] Weisz, P., Basic choices and constraints on long-term energy supplies. Physics Today, July2004, American Institute of Physics, 2004.
www.witpress.com, ISSN 1755-8336 (on-line)
© 2006 WIT PressWIT Transactions on State of the Art in Science and Engineering, Vol 4,
Heat transfer enhancement techniques and theirapplication in turbomachinery
J. von Wolfersdorf1, B. Weigand1 & M. Schnieder2
1Institut für Thermodynamik der Luft- und Raumfahrt (ITLR), Universität Stuttgart,Stuttgart, Germany.2ALSTOM Power Ltd., Baden, Switzerland.
Abstract
Heat transfer enhancement techniques have found widespread applications in nature as well as in alot of engineering applications. The methods can be categorized into passive and active techniques.This note focuses nearly exclusively on passive techniques, especially on heat or mass transferenhancement using geometrical surface modifications like artificial roughness, protrusions ordepressions mostly in single-phase forced convection applications. With these passive methodsthe flow field around the heat or mass transferring surface is modified by introducing differentkinds of vortical motions, which lead to increased mixing, flow separation and reattachment.These effects drastically change the overall and local heat transfer distribution. The present paperprovides an overview on the different methods used for heat transfer enhancement and showssome possible applications of the individual methods in turbomachinery design and nature. Byshowing examples from turbomachinery applications also the interaction of individual methodsis highlighted. Here it is of particular interest that combined enhancement involving simultaneousapplication of several techniques might lead to an enhancement that is larger than the individualtechniques operating separately.
1 Introduction
Heat or mass transfer enhancement is present in nature and in numerous engineering applications.If we look for example on the water flow through a river bed, the heat or mass transfer between theflow and the ground is intensified by the structure of the river bed, providing an artificial roughness.Therefore, one might see the ‘natural’ rough surface as a perfect example for a natural techniquefor heat and mass transfer enhancement. Heat and mass transfer enhancement is caused by flowmixing of any kind and is associated with increased turbulence in the flow. If the surface structure
www.witpress.com, ISSN 1755-8336 (on-line)
© 2006 WIT PressWIT Transactions on State of the Art in Science and Engineering, Vol 4,
Heat Transfer Enhancement Techniques 471
is large enough and is repeated periodically, strong secondary motion might be introduced intothe main flow. This leads, of course, to flow modifications and results in heat and mass transferenhancement.
All heat transfer enhancement techniques can be subdivided into active and passive methods.Active methods are, for example, fluid vibration, injection or suction of fluid through the walland also jet impingement to the wall. Passive methods are related to surface coatings, extendedsurfaces, displaced inserts, swirl flows and so on [1]. The present review paper aims to givean overview of only a small part of the different methods present to enhance heat transfer. Wewill mainly focus on passive methods for heat transfer enhancement using geometrical surfacemodifications like artificial roughness, protrusions or depressions mostly in single-phase forcedconvection applications. For a detailed review on other techniques, the reader is referred to theexcellent book by Webb [1].
We will limit our interest in this paper mostly to the above given passive methods in single-phaseflows and only on the topic of geometrical surface modifications. However, this paper cannot aimto give a complete review of all work that has been done during the last thirty to forty years onthis topic. Several review papers have addressed heat transfer enhancement techniques in flowsfor the above specified topic and some of them are listed in [2–6]. The given review papers arenot complete, but they may serve as an appropriate introduction into the interesting topic of heattransfer enhancement, especially in flows with applications to turbomachinery.
Before we go on to explain some techniques of heat transfer enhancement, it may be importantfirst to obtain a more general view of the topic.
If one deals with the topic of heat or mass transfer enhancement, one of the questions whichneed to be answered first for a technical system, is the one on how “expensive” this enhancementmight be; in other words, how much the friction loss of a system might increase if the heat transferis enhanced.A first, very rough answer to this question can be given by using the Reynolds analogybetween heat and momentum transfer (see for a detailed explanation Kays et al. [7]):
St = Nu
Re Pr= f
2, (1)
where St is the Stanton number, Nu is the Nusselt number, Re is the Reynolds number, Pr is thePrandtl number and f is the Moody friction factor defined by
Nu = hL
k= − (∂T/∂n)|w L
Tw − T∞, Re = u∞L
ν, Pr = ν
α, (2)
f = |τw|(ρ/2)u2∞
= |−µ(∂u/∂n)|w(ρ/2)u2∞
.
Here L is a reference length, k is the fluid thermal conductivity, h is the heat transfer coefficient,n indicates the normal to the surface and the indices ∞ and w denote reference states (e.g.free-stream and wall).
The Reynolds analogy given by eqn (1) is normally derived for turbulent boundary layer flowsfor Pr = 1. This means that we can expect to get an appropriate answer for turbulent boundary layertype flows of gases. Equation (1) shows that there must be a strong relation in any system betweenheat or mass transfer and the wall friction. If we are interested in the heat transfer enhancement ona surface by the above described geometrical surface modifications, we can use eqn (1) first for a
www.witpress.com, ISSN 1755-8336 (on-line)
© 2006 WIT PressWIT Transactions on State of the Art in Science and Engineering, Vol 4,
472 Flow Phenomena in Nature
technically smooth surface (as reference) and then for the actual surface under consideration. Bydoing so, one obtains for the same Reynolds number and the same working fluid
Nu
Nu0= f
f0. (3)
In eqn (3), the index 0 indicates that the quantities are related to a perfectly smooth surface.Equation (3), which is a result of the Reynolds analogy, shows clearly that the ratio of a heattransfer enhancement is proportional to the ratio of the increase in friction factor. The short analysisgiven above also elucidates that the factor
E1 =(
Nu
Nu0
)/(f
f0
)(4)
might be a good choice for comparing different enhancement methods [8]. There are also othermethods in order to evaluate the performance of systems with heat and mass transfer enhancementfeatures. Some of these methods have been described by Webb [9]. For example, if one is interestedin the enhancement of heat transfer in an internal passage, it might be a good choice to compareseveral devices for the same mass flow through the passage and for the same pumping power. Bydoing so, one obtains a thermal performance parameter defined by
E2 =(
Nu
Nu0
)/(f
f0
)1/3
. (5)
This parameter has been very popular for evaluating different heat transfer enhancement schemesfor compact heat exchanger. In the following sections, we will actually use both criteria in orderto evaluate different enhancement techniques.
2 Heat transfer enhancement techniques
This section is devoted to different heat and mass transfer enhancement methods based on surfacegeometrical modifications. Each technique will be explained and their potential for heat and masstransfer enhancement will be discussed.
Section 2.1 deals with surface roughness. This is a typical (mostly) stochastic roughness asappears in many natural and technical processes. Section 2.3 of this chapter is devoted to ribs andturbulators. These are features which are normally larger than the thickness of the boundary layerand which produce strong secondary motions within the flow field. Section 2.2 deals with smallscale features of this kind, which have a height of the order of the boundary layer thickness orsmaller, but consist of regular manufactured rib type structures. In addition, the features discussedin Section 2.2 do not produce strong secondary motion because of their placement and design.
There is of course no clear separation between the features discussed in Sections 2.1 and 2.2,but we decided to introduce this distinct separation between the (normally) stochastic roughnessin Section 2.1 and the small features in Section 2.2 in order to make things clearer.
2.1 Surface roughness
Rough surfaces are found in many configurations in nature and design. Turbulent flows over roughsurfaces occur in a multitude of situations in engineering applications and in natural environment.Examples range from the flow over plant canopies [10], ship surfaces under the influence of
www.witpress.com, ISSN 1755-8336 (on-line)
© 2006 WIT PressWIT Transactions on State of the Art in Science and Engineering, Vol 4,
Heat Transfer Enhancement Techniques 473
biofouling [11], boundary layers over desert sand dunes or sediments [12, 13] or water flow overmussel beds and coral reefs [14, 15]. In engineering, rough surfaces are used to enhance heattransfer using, for example, randomly arranged sand grains or regular two- or three-dimensionalroughness elements. The importance in heat and mass transfer enhancement as well as surfacefriction has led to numerous investigations. Early work by Nikuradse [16], Schlichting [17] andMoody [18] provided fundamental data for the analysis of turbulent flows and a framework forthe interpretation of roughness effects on flow and heat transfer.
Nikuradse [16] measured pressure loss and velocity profiles in pipes roughened with nearlyuniform sand grains of different sizes with the characteristic dimension denoted as ks. Basedon these measurements, Schlichting [17] determined for other roughness structures with rough-ness height k an equivalent sand-grain roughness parameter, defined as the sand grain size inNikuradse’s experiments that gives the same friction loss at the same Reynolds number. The ratioks/k depends on the geometry and surface density of the roughness. Schlichting [19] correlatedthis ratio in dependence of the solidity �, which is the total projected frontal roughness area perunit wall-projected area. With this, the effect of roughness on the flow field can be related to thevelocity profile over the surface and compared with the smooth wall situation. The mean velocityprofile in the inner region of a turbulent boundary layer at a smooth wall is described by theclassical log law [17]:
U+ = 1
κln y+ + C, (6)
with the quantities
y+ = yuτν
, U+ = u
uτ, uτ = √|τw|/ρ. (7)
Here, y+ is a dimensionless wall distance, measured from the wall into the boundary layer, uτ isthe shear–stress velocity, κ is the von Karman constant and C is an additional constant.
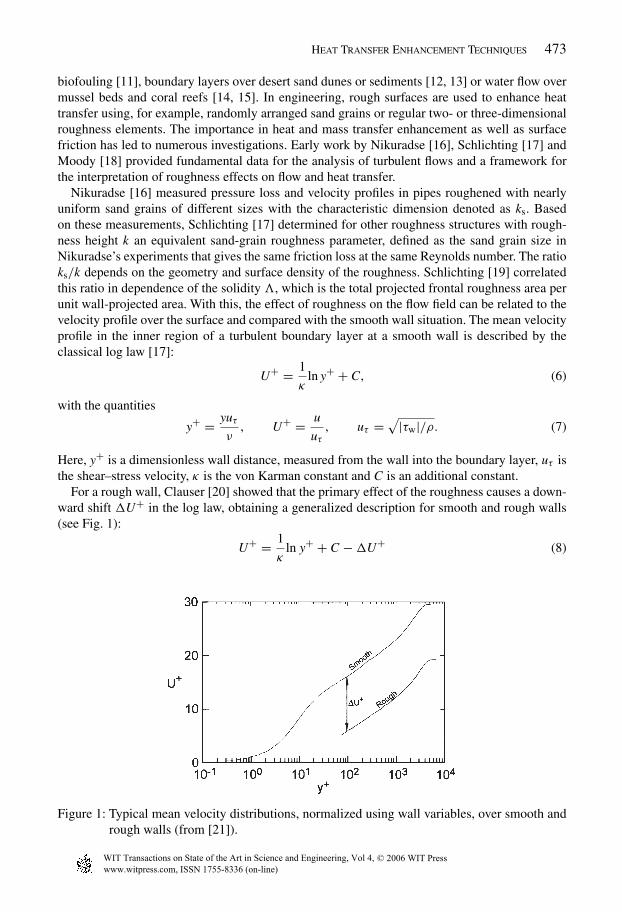
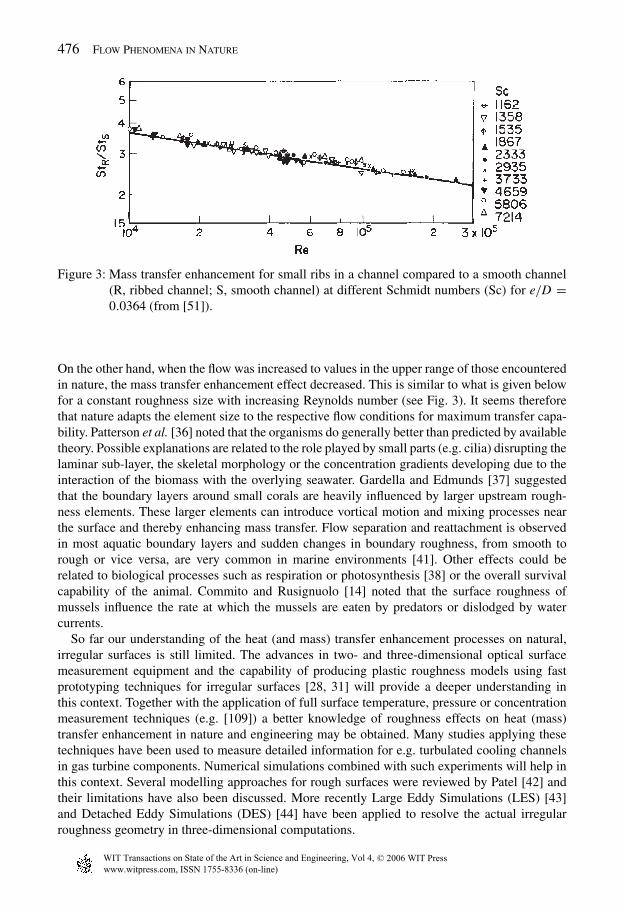
For a rough wall, Clauser [20] showed that the primary effect of the roughness causes a down-ward shift �U+ in the log law, obtaining a generalized description for smooth and rough walls(see Fig. 1):
U+ = 1
κln y+ + C −�U+ (8)
Figure 1: Typical mean velocity distributions, normalized using wall variables, over smooth andrough walls (from [21]).
www.witpress.com, ISSN 1755-8336 (on-line)
© 2006 WIT PressWIT Transactions on State of the Art in Science and Engineering, Vol 4,
474 Flow Phenomena in Nature
The roughness function �U+ depends on the roughness Reynolds number k+s defined by:
k+s = ksuτ
ν(9)
Schlichting [17] characterized the surface roughness using this parameter. For k+s < 5 the sur-
face is considered to be hydraulically smooth and frictional losses depend only on the Reynoldsnumber. In this case the roughness elements are embedded in the so-called laminar sub-layer andmomentum is transferred solely by shear stresses. For k+
s > 70 the flow is considered fully roughand frictional losses depend only on the dimensionless roughness height. Momentum is in thiscase is transferred to the wall by pressure forces. For 5< k+
s < 70 the transitional region is presentwhere both, roughness height and Reynolds number, influence the frictional behaviour.
For so-called ‘k-type’ roughness (e.g. regular transverse ribs, see Section 2.2), often the rough-ness height k is chosen as the characteristic length scale. A Reynolds number based on theroughness height is then given as:
Rek = k+ = kuτν. (10)
Both eqns (9) and (10) are related using the ratio ks/k. The logarithmic behaviour of the velocityprofile is similar for flows over rough surfaces in nature.An excellent review was given by Raupachet al. [10]. They compared data from artificial rough surfaces from laboratory experiments withatmospheric data from several vegetation surfaces. Although the k+ values for the vegetatedsurfaces were up to two orders of magnitude higher than the laboratory data, the logarithmicbehaviour was almost the same in the fully rough regime.
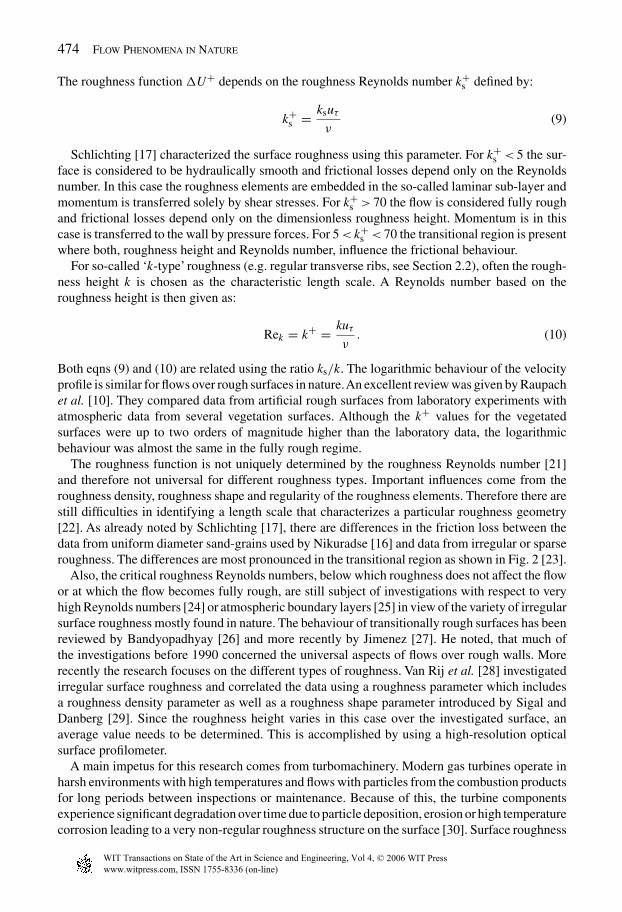
The roughness function is not uniquely determined by the roughness Reynolds number [21]and therefore not universal for different roughness types. Important influences come from theroughness density, roughness shape and regularity of the roughness elements. Therefore there arestill difficulties in identifying a length scale that characterizes a particular roughness geometry[22]. As already noted by Schlichting [17], there are differences in the friction loss between thedata from uniform diameter sand-grains used by Nikuradse [16] and data from irregular or sparseroughness. The differences are most pronounced in the transitional region as shown in Fig. 2 [23].
Also, the critical roughness Reynolds numbers, below which roughness does not affect the flowor at which the flow becomes fully rough, are still subject of investigations with respect to veryhigh Reynolds numbers [24] or atmospheric boundary layers [25] in view of the variety of irregularsurface roughness mostly found in nature. The behaviour of transitionally rough surfaces has beenreviewed by Bandyopadhyay [26] and more recently by Jimenez [27]. He noted, that much ofthe investigations before 1990 concerned the universal aspects of flows over rough walls. Morerecently the research focuses on the different types of roughness. Van Rij et al. [28] investigatedirregular surface roughness and correlated the data using a roughness parameter which includesa roughness density parameter as well as a roughness shape parameter introduced by Sigal andDanberg [29]. Since the roughness height varies in this case over the investigated surface, anaverage value needs to be determined. This is accomplished by using a high-resolution opticalsurface profilometer.
A main impetus for this research comes from turbomachinery. Modern gas turbines operate inharsh environments with high temperatures and flows with particles from the combustion productsfor long periods between inspections or maintenance. Because of this, the turbine componentsexperience significant degradation over time due to particle deposition, erosion or high temperaturecorrosion leading to a very non-regular roughness structure on the surface [30]. Surface roughness
www.witpress.com, ISSN 1755-8336 (on-line)
© 2006 WIT PressWIT Transactions on State of the Art in Science and Engineering, Vol 4,
Heat Transfer Enhancement Techniques 475
Figure 2: Influence of different roughness types on the friction factor behaviour (from [23]).
on blades and vanes influence gas turbine performance due to the elevated levels of surface frictionand the higher heat loads due to the heat transfer enhancement. Hence, modelling approaches arestill limited due to the irregularity of the roughness structure. A good understanding regardingprofile losses and heat transfer enhancement for these ‘natural’ surfaces is therefore required[31, 32].
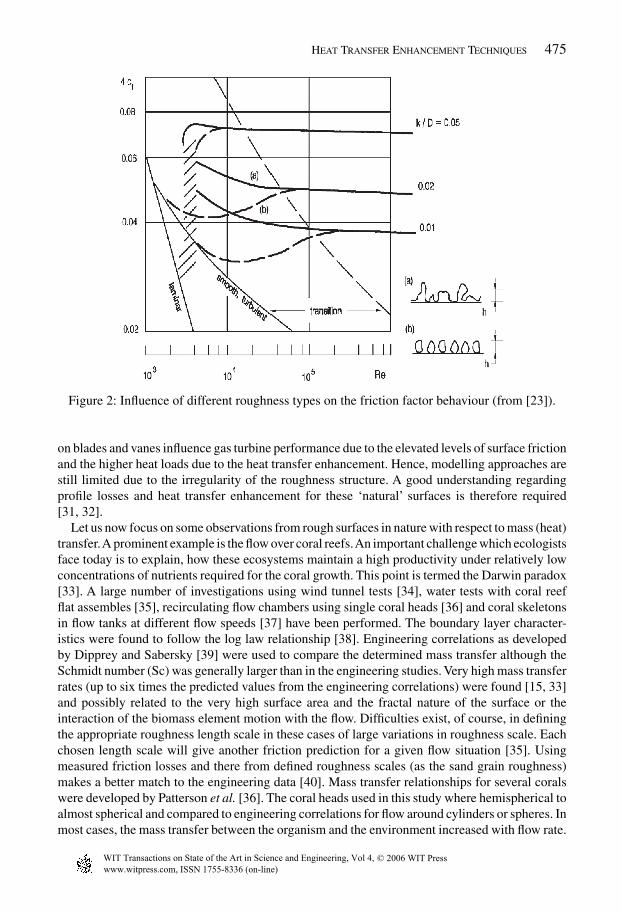
Let us now focus on some observations from rough surfaces in nature with respect to mass (heat)transfer.A prominent example is the flow over coral reefs.An important challenge which ecologistsface today is to explain, how these ecosystems maintain a high productivity under relatively lowconcentrations of nutrients required for the coral growth. This point is termed the Darwin paradox[33]. A large number of investigations using wind tunnel tests [34], water tests with coral reefflat assembles [35], recirculating flow chambers using single coral heads [36] and coral skeletonsin flow tanks at different flow speeds [37] have been performed. The boundary layer character-istics were found to follow the log law relationship [38]. Engineering correlations as developedby Dipprey and Sabersky [39] were used to compare the determined mass transfer although theSchmidt number (Sc) was generally larger than in the engineering studies. Very high mass transferrates (up to six times the predicted values from the engineering correlations) were found [15, 33]and possibly related to the very high surface area and the fractal nature of the surface or theinteraction of the biomass element motion with the flow. Difficulties exist, of course, in definingthe appropriate roughness length scale in these cases of large variations in roughness scale. Eachchosen length scale will give another friction prediction for a given flow situation [35]. Usingmeasured friction losses and there from defined roughness scales (as the sand grain roughness)makes a better match to the engineering data [40]. Mass transfer relationships for several coralswere developed by Patterson et al. [36]. The coral heads used in this study where hemispherical toalmost spherical and compared to engineering correlations for flow around cylinders or spheres. Inmost cases, the mass transfer between the organism and the environment increased with flow rate.
www.witpress.com, ISSN 1755-8336 (on-line)
© 2006 WIT PressWIT Transactions on State of the Art in Science and Engineering, Vol 4,
476 Flow Phenomena in Nature
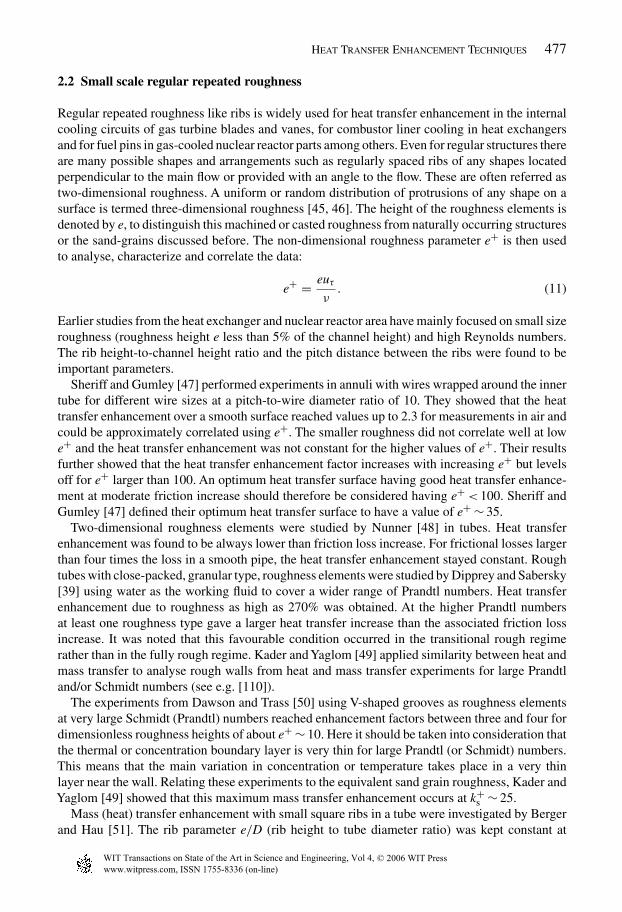
Figure 3: Mass transfer enhancement for small ribs in a channel compared to a smooth channel(R, ribbed channel; S, smooth channel) at different Schmidt numbers (Sc) for e/D =0.0364 (from [51]).
On the other hand, when the flow was increased to values in the upper range of those encounteredin nature, the mass transfer enhancement effect decreased. This is similar to what is given belowfor a constant roughness size with increasing Reynolds number (see Fig. 3). It seems thereforethat nature adapts the element size to the respective flow conditions for maximum transfer capa-bility. Patterson et al. [36] noted that the organisms do generally better than predicted by availabletheory. Possible explanations are related to the role played by small parts (e.g. cilia) disrupting thelaminar sub-layer, the skeletal morphology or the concentration gradients developing due to theinteraction of the biomass with the overlying seawater. Gardella and Edmunds [37] suggestedthat the boundary layers around small corals are heavily influenced by larger upstream rough-ness elements. These larger elements can introduce vortical motion and mixing processes nearthe surface and thereby enhancing mass transfer. Flow separation and reattachment is observedin most aquatic boundary layers and sudden changes in boundary roughness, from smooth torough or vice versa, are very common in marine environments [41]. Other effects could berelated to biological processes such as respiration or photosynthesis [38] or the overall survivalcapability of the animal. Commito and Rusignuolo [14] noted that the surface roughness ofmussels influence the rate at which the mussels are eaten by predators or dislodged by watercurrents.
So far our understanding of the heat (and mass) transfer enhancement processes on natural,irregular surfaces is still limited. The advances in two- and three-dimensional optical surfacemeasurement equipment and the capability of producing plastic roughness models using fastprototyping techniques for irregular surfaces [28, 31] will provide a deeper understanding inthis context. Together with the application of full surface temperature, pressure or concentrationmeasurement techniques (e.g. [109]) a better knowledge of roughness effects on heat (mass)transfer enhancement in nature and engineering may be obtained. Many studies applying thesetechniques have been used to measure detailed information for e.g. turbulated cooling channelsin gas turbine components. Numerical simulations combined with such experiments will help inthis context. Several modelling approaches for rough surfaces were reviewed by Patel [42] andtheir limitations have also been discussed. More recently Large Eddy Simulations (LES) [43]and Detached Eddy Simulations (DES) [44] have been applied to resolve the actual irregularroughness geometry in three-dimensional computations.
www.witpress.com, ISSN 1755-8336 (on-line)
© 2006 WIT PressWIT Transactions on State of the Art in Science and Engineering, Vol 4,
Heat Transfer Enhancement Techniques 477
2.2 Small scale regular repeated roughness
Regular repeated roughness like ribs is widely used for heat transfer enhancement in the internalcooling circuits of gas turbine blades and vanes, for combustor liner cooling in heat exchangersand for fuel pins in gas-cooled nuclear reactor parts among others. Even for regular structures thereare many possible shapes and arrangements such as regularly spaced ribs of any shapes locatedperpendicular to the main flow or provided with an angle to the flow. These are often referred astwo-dimensional roughness. A uniform or random distribution of protrusions of any shape on asurface is termed three-dimensional roughness [45, 46]. The height of the roughness elements isdenoted by e, to distinguish this machined or casted roughness from naturally occurring structuresor the sand-grains discussed before. The non-dimensional roughness parameter e+ is then usedto analyse, characterize and correlate the data:
e+ = euτν. (11)
Earlier studies from the heat exchanger and nuclear reactor area have mainly focused on small sizeroughness (roughness height e less than 5% of the channel height) and high Reynolds numbers.The rib height-to-channel height ratio and the pitch distance between the ribs were found to beimportant parameters.
Sheriff and Gumley [47] performed experiments in annuli with wires wrapped around the innertube for different wire sizes at a pitch-to-wire diameter ratio of 10. They showed that the heattransfer enhancement over a smooth surface reached values up to 2.3 for measurements in air andcould be approximately correlated using e+. The smaller roughness did not correlate well at lowe+ and the heat transfer enhancement was not constant for the higher values of e+. Their resultsfurther showed that the heat transfer enhancement factor increases with increasing e+ but levelsoff for e+ larger than 100. An optimum heat transfer surface having good heat transfer enhance-ment at moderate friction increase should therefore be considered having e+< 100. Sheriff andGumley [47] defined their optimum heat transfer surface to have a value of e+ ∼ 35.
Two-dimensional roughness elements were studied by Nunner [48] in tubes. Heat transferenhancement was found to be always lower than friction loss increase. For frictional losses largerthan four times the loss in a smooth pipe, the heat transfer enhancement stayed constant. Roughtubes with close-packed, granular type, roughness elements were studied by Dipprey and Sabersky[39] using water as the working fluid to cover a wider range of Prandtl numbers. Heat transferenhancement due to roughness as high as 270% was obtained. At the higher Prandtl numbersat least one roughness type gave a larger heat transfer increase than the associated friction lossincrease. It was noted that this favourable condition occurred in the transitional rough regimerather than in the fully rough regime. Kader and Yaglom [49] applied similarity between heat andmass transfer to analyse rough walls from heat and mass transfer experiments for large Prandtland/or Schmidt numbers (see e.g. [110]).
The experiments from Dawson and Trass [50] using V-shaped grooves as roughness elementsat very large Schmidt (Prandtl) numbers reached enhancement factors between three and four fordimensionless roughness heights of about e+ ∼ 10. Here it should be taken into consideration thatthe thermal or concentration boundary layer is very thin for large Prandtl (or Schmidt) numbers.This means that the main variation in concentration or temperature takes place in a very thinlayer near the wall. Relating these experiments to the equivalent sand grain roughness, Kader andYaglom [49] showed that this maximum mass transfer enhancement occurs at k+
s ∼ 25.Mass (heat) transfer enhancement with small square ribs in a tube were investigated by Berger
and Hau [51]. The rib parameter e/D (rib height to tube diameter ratio) was kept constant at
www.witpress.com, ISSN 1755-8336 (on-line)
© 2006 WIT PressWIT Transactions on State of the Art in Science and Engineering, Vol 4,

478 Flow Phenomena in Nature
0.0364 and the Reynolds and Schmidt numbers were varied over a large range. It was shown, thatthe heat transfer enhancement (given as Stanton number ratio between rough and smooth tube)decreases with increasing Reynolds number for the constant roughness height considered (Fig. 3)for a large range of Schmidt numbers. Therefore the roughness height should be adapted to theactual Reynolds number (flow velocity) for efficient heat transfer enhancement.
Stochastic roughness structures are not very often used in engineering for heat transfer enhance-ment. More often, machined ribs of regular patterns are used. If the rib heights are small, theroughness Reynolds numbers are in the range of the transitional and fully rough regimes andcan be well related to roughness structures as the sand grain roughness. One of the most generalcorrelations for such transverse rib-repeated roughness were presented by Webb et al. [52] fore/D between 1% and 4%, p/e between 10 and 40 and Prandtl numbers between 0.71 and 37.6.The pitch to rib height ratio p/e was related to different flow patterns as given in Fig. 4.
For small spacings (p/e< 5) a closed recirculation region was found between the ribs. Forlarger spacings the separated flow reattaches between the ribs and a new boundary layer develops.In front of the next rib another recirculation region appears. The reattachment point is approxi-mately 6–8 rib heights downstream from the separation point.
Figure 4: Flow pattern as a function of pitch to rib height ratio p/e (from [52]).
www.witpress.com, ISSN 1755-8336 (on-line)
© 2006 WIT PressWIT Transactions on State of the Art in Science and Engineering, Vol 4,
Heat Transfer Enhancement Techniques 479
2.3 Ribs and turbulators
The above given work of Webb et al. [52] was extended by Han et al. [53] for larger rib heights inview of gas turbine internal cooling. The cooling channels in gas turbines used in aircraft enginesusually have small dimensions, leading to relatively low Reynolds numbers in the turbulent flowregime (Reynolds numbers below 50,000). Achieving large heat transfer enhancement for theseconditions requires larger rib heights. Moreover, for manufacturing reasons the physical size ofthe rib elements has to have a minimum value which leads to large relative rib heights (up to 25%).With the importance in gas turbine component cooling, numerous investigations have beenperformed in this context.
The ribs are usually placed in a repeated manner to disturb the boundary layer periodicallyleading to high turbulence levels and good mixing in the coolant core flow. It has been foundthat the flow achieves a periodic ‘fully developed’ state after about five ribs. Because of theirimportance, a large body of work has been done, and is still continuing to be done, to understandthe effects of different rib turbulators on pressure drop and on heat transfer in, for example, squareor rectangular channels.
This work was summarized and reviewed by Han and Dutta [54], Taslim [55], Ligrani et al.[8] and in a book by Han et al. [56]. In the process, the influence of rib spacing, rib angle and ribheight has also been investigated. Angled ribs introduce swirling motion in the flow and thereforeincrease mixing as well as local heat transfer. The ribs can be continuous or broken or haveV-shaped form [57, 58]. By this, the number of vortices introduced in the core flow can be varied.The resulting secondary flows can be adopted using different rib arrangements on opposite wallsof the cooling channel.
Figure 5 shows some experimental results for the local heat transfer in a rectangular duct withV-shaped ribs. On the left, the secondary flow field and the associated effect on the heat transferis depicted for ribs pointing downstream in flow direction, whereas the figure on the right showsthe situation for a V-shaped ribs pointing upstream. From the two figures it can be seen that theheat transfer can be locally adapted by selecting appropriate turbulators. For example, for thearrangement shown on the left side in Fig. 5, the secondary motion takes fluid from the centreregion in the passage upwards and transports this fluid towards the sidewalls. Near the sidewallsa downwash of the fluid can be observed, resulting in high heat transfer at this location.
The effective generation of strong secondary flows with these ribs has led to a variety ofinvestigations in view of optional arrangements. V-shaped ribs combined with V-shaped groovesin between were investigated by Zhang et al. [60]. Wright et al. [61] measured average heat trans-fer and friction losses for V- and W-shaped ribs. The latter are a combination of smaller scaleV-shaped ribs. The effect of separating the ribs and staggering them on one wall (so-called discretearrangements) was shown to increase heat transfer further by reducing the frictional losses slightlycompared to full ribs [62].
Compared to the heat transfer requirements for aero-engine blades, the cooling schemes ofblades for large industrial gas turbines differ in some aspects [5]. An important difference isthat blades for heavy-duty gas turbines are subjected to higher Reynolds numbers in the internalcooling passages mainly due to their much larger dimensions. The larger size of the internalcooling passages gives much more freedom in designing the shape of cooling and heat transferenhancement features like ribs inside the blades. Thus, rib geometries can be adapted to the actualcooling channel form, which is usually not square or rectangular. Typical examples are the coolingchannels near the leading and trailing edge of the blade or channels of aerodynamically optimizedblades for later stages (see Fig. 6, [63]). All these ducts might be approximated by triangularchannels.
www.witpress.com, ISSN 1755-8336 (on-line)
© 2006 WIT PressWIT Transactions on State of the Art in Science and Engineering, Vol 4,

480 Flow Phenomena in Nature
Figure 5: Heat transfer distribution in a rectangular channel with varying orientation of V-shapedribs (adapted from [59]).
Figure 6: Cooling scheme for a rotating blade at later stages using size-adapted V-shaped ribs(from [63]).
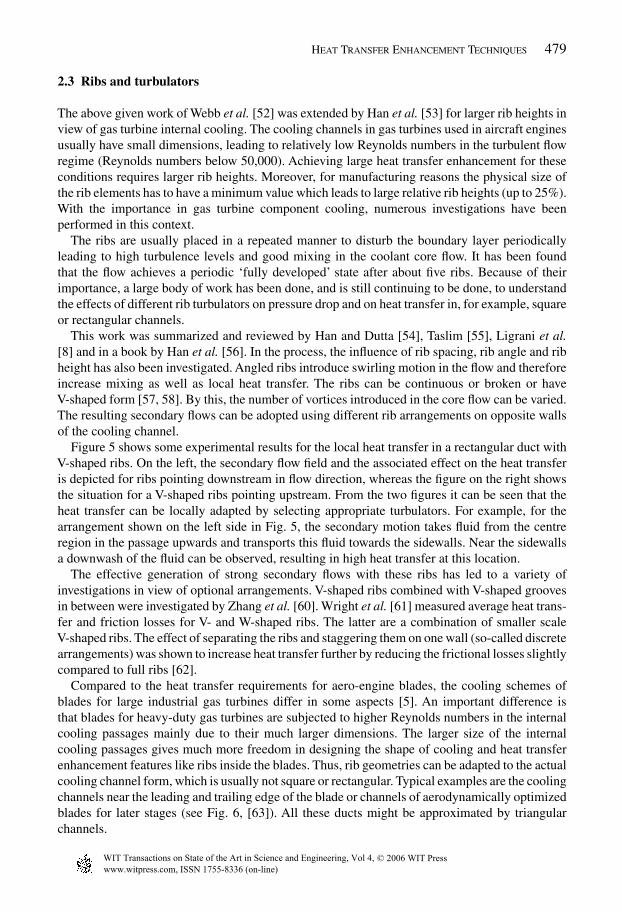
Within these channels three-dimensional shaped turbulators can be manufactured for industrialgas turbine blades. By this, the local heat transfer can be influenced drastically. Figure 6 showssuch an arrangement. The rib height is gradually decreased with decreasing channel height. Hallet al. [63] used the criterion, that the local height of the rib h divided by the local channel heightH is constant. Applying this criterion, the local friction in the channel between the core regionand the apex area is equalized. This promotes the secondary flow to exchange air between thecore area and the apex area, leading to higher heat transfer coefficients in the edges where the heatload from the hot gas side is highest. Three-dimensional shaped turbulators can also be used foreffectively cooling the leading edge of a gas turbine blade. Figure 7 shows an example of such anapplication [64]. The three-dimensional ribs are additionally angled with respect to the main flowdirection (see the picture on the left in Fig. 7) and can have different overlapping arrangementsin the corner area. In addition, the rib spacing can vary, to adapt the heat transfer enhancement
www.witpress.com, ISSN 1755-8336 (on-line)
© 2006 WIT PressWIT Transactions on State of the Art in Science and Engineering, Vol 4,
Heat Transfer Enhancement Techniques 481
Figure 7: Three-dimensional turbulators for a leading edge cooling channel of an industrial gasturbine blade (from [64]).
to the local cooling requirements. With this, local heat transfer distributions can be tailored alongthe channel circumference to achieve small temperature differences and, hence, small thermalstresses within the blade. Some examples for a triangular channel, typically for the leading edgecooling channel of a blade, are shown in Fig. 8.
From Fig. 8 it is obvious that the local extension of the rib in the leading edge area will affectthe heat transfer in this area substantially. The upper picture in Fig. 8 shows overlapping ribs inthe leading edge region at an angle of 45◦ to the main flow direction whereas the lower picturein Fig. 8 is for a configuration with every second rib removed and arranged at an angle of 90◦ tothe main flow direction.
Recent applications of V-shaped ribs are also found in microfluidic systems, which are widelyused in biology and biotechnology [65, 66]. Due to the small channel sizes, the flow in these sys-tems is usually laminar with Reynolds numbers well below 100. Therefore, mixing of differentstreams, e.g. for chemical analysis, is limited. V-shaped ribs with offset apex angles can provideefficient mixing in these cases. The apex location changes in flow direction after several rib mod-ules leading to a so-called staggered herringbone mixer. Thereby the size of the counter-rotatingvortices as given in Fig. 5 is unequal and changes in streamwise direction, which is the basis for thegood mixing behaviour. Other geometries, which introduce such longitudinal vortices are knownin the context of boundary layer control and heat transfer enhancement and will be discussed next.
2.4 Longitudinal vortex generators
Several kinds of vortex generators introducing longitudinal vortices in the near-wall region havebeen considered for boundary layer separation control [67] and associated lift enhancement ornoise reduction [68]. The size and shape of the vortex generators can be very varied. In nature,smaller size vortex generating fins are known on the back of several types of fish and act pos-sibly as boundary layer control devices [69]. Larger finlike structures were recently related tothermoregulation of animals. Meagher et al. [70] measured the temperature field on a bottlenosedolphin dorsal fin. These fins contain many blood vessels to either conserve or dissipate bodyheat. With high surface heat transfer due to separating vortices, these fins might be effectivelyused for fast control of the body temperature, since longitudinal vortices are more efficient than
www.witpress.com, ISSN 1755-8336 (on-line)
© 2006 WIT PressWIT Transactions on State of the Art in Science and Engineering, Vol 4,

482 Flow Phenomena in Nature
Figure 8: Local adaptation of heat transfer distribution using different rib configurations in theleading edge region (from [107]).
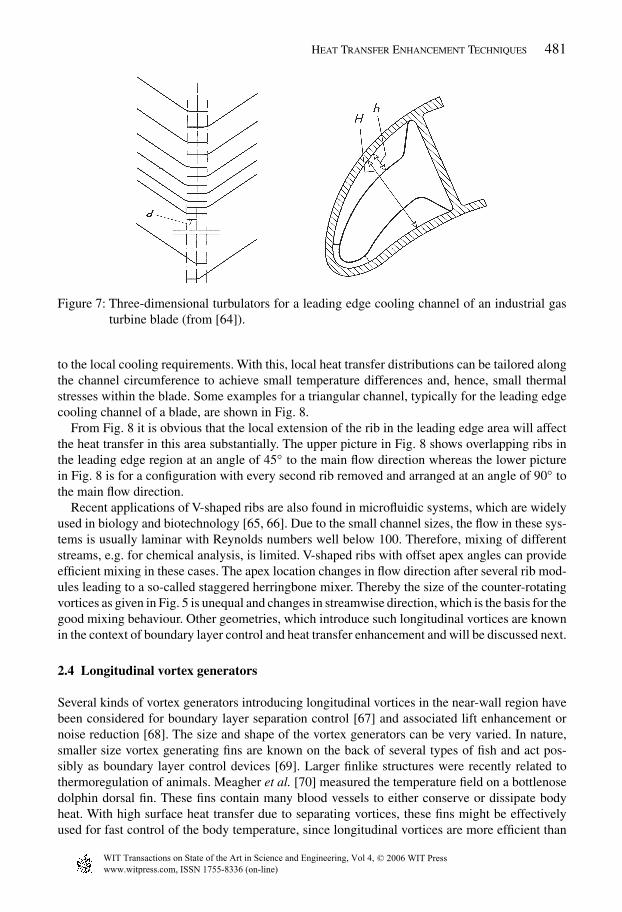
transverse vortices for heat transfer enhancement. The use of longitudinal vortex generators forheat transfer enhancement is mainly considered in the area of heat exchangers. Good reviews onthese developments can be found in [71–73]. Several geometries, which can easily been manu-factured for plate heat exchanger applications were considered and are shown in Fig. 9. They arecalled wing or winglet vortex generators.
In a pairwise arrangement, the winglets introduce neighbouring streamwise vortices, enhancingthe near-wall momentum exchange and heat transfer. Similar to the above-described V-shapedribs, the vortex pair can be arranged to form a downwash motion or an upwash motion. This isshown in Fig. 10 using a pair of delta-winglet vortex generators. A common inflow vortex pair isgenerated using the configuration as given in the picture on the left in Fig. 10. The induced inflowthins the thermal boundary layer and strongly enhances heat transfer.
The arrangement given in the picture on the right in Fig. 10 generates a common outflow vortexpair with associated lower heat transfer. Since the projected area perpendicular to the flow forthese devices are generally smaller than for ribs, cylinders, or cubes, heat transfer enhancementcan be found at relatively moderate pressure loss increase. The induced vortices are very per-sistent and can survive more than 100 vortex generator heights downstream depending on theindividual geometrical and flow parameters and can introduce transverse velocities in the orderof the streamwise velocity [71].
Arrangements of several winglet pairs have been used in rectangular channels [73] or have beencombined with circular or oval tubes in plate and tube heat exchangers [74, 75], which themselves
www.witpress.com, ISSN 1755-8336 (on-line)
© 2006 WIT PressWIT Transactions on State of the Art in Science and Engineering, Vol 4,
Heat Transfer Enhancement Techniques 483
Figure 9: Vortex generators and associated definitions (from [71]).
downwash vortex motion upwash vortex motion
Figure 10: Schematic representation of induced vortex pairs; left: common inflow; right: commonoutflow (from [71]).
generate longitudinal vortices around the tubes, the so-called horseshoe vortex. It was noted byFiebig [72] that the vortex generator form, height, length, angle of attack and spacing have notyet varied appreciably, which points towards optimum values for heat transfer enhancement atsmall pressure losses. Furthermore, the efficiency of these devices at high Reynolds numbers is notknown well. The Reynolds numbers in plate heat exchangers are usually between 3,000 and 30,000.
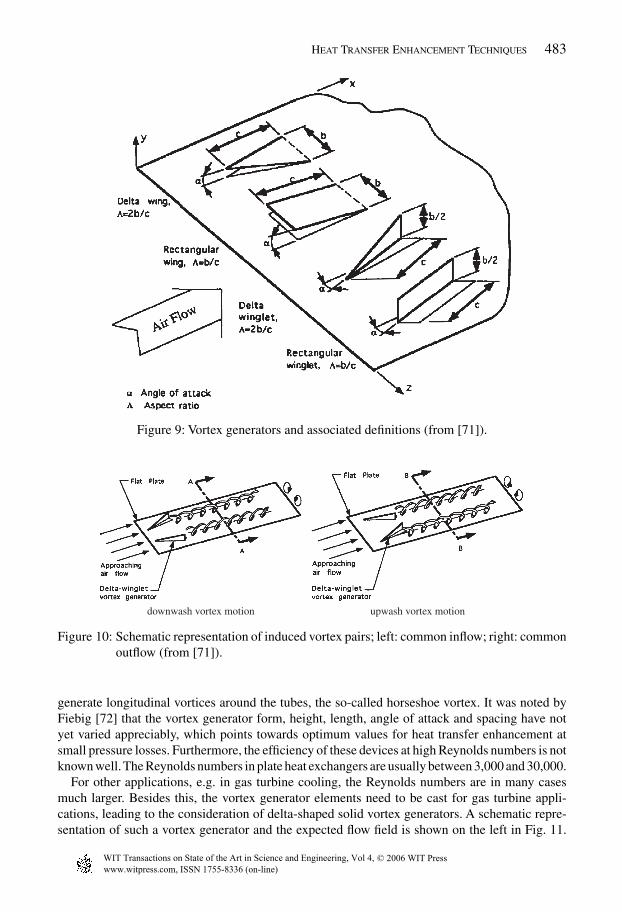
For other applications, e.g. in gas turbine cooling, the Reynolds numbers are in many casesmuch larger. Besides this, the vortex generator elements need to be cast for gas turbine appli-cations, leading to the consideration of delta-shaped solid vortex generators. A schematic repre-sentation of such a vortex generator and the expected flow field is shown on the left in Fig. 11.
www.witpress.com, ISSN 1755-8336 (on-line)
© 2006 WIT PressWIT Transactions on State of the Art in Science and Engineering, Vol 4,
484 Flow Phenomena in Nature
Figure 11: Schematic representation of flow field around a delta-shaped solid vortex generator(left) and near-wall streamlines from an oil visualization study (right).
Figure 12: Heat transfer distribution behind a single delta-shaped solid vortex generator.
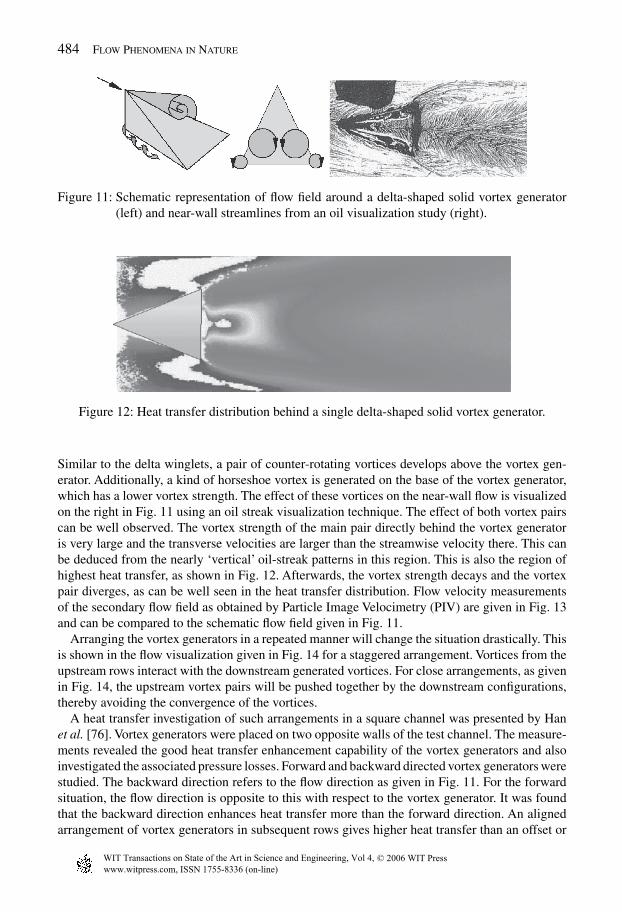
Similar to the delta winglets, a pair of counter-rotating vortices develops above the vortex gen-erator. Additionally, a kind of horseshoe vortex is generated on the base of the vortex generator,which has a lower vortex strength. The effect of these vortices on the near-wall flow is visualizedon the right in Fig. 11 using an oil streak visualization technique. The effect of both vortex pairscan be well observed. The vortex strength of the main pair directly behind the vortex generatoris very large and the transverse velocities are larger than the streamwise velocity there. This canbe deduced from the nearly ‘vertical’ oil-streak patterns in this region. This is also the region ofhighest heat transfer, as shown in Fig. 12. Afterwards, the vortex strength decays and the vortexpair diverges, as can be well seen in the heat transfer distribution. Flow velocity measurementsof the secondary flow field as obtained by Particle Image Velocimetry (PIV) are given in Fig. 13and can be compared to the schematic flow field given in Fig. 11.
Arranging the vortex generators in a repeated manner will change the situation drastically. Thisis shown in the flow visualization given in Fig. 14 for a staggered arrangement. Vortices from theupstream rows interact with the downstream generated vortices. For close arrangements, as givenin Fig. 14, the upstream vortex pairs will be pushed together by the downstream configurations,thereby avoiding the convergence of the vortices.
A heat transfer investigation of such arrangements in a square channel was presented by Hanet al. [76]. Vortex generators were placed on two opposite walls of the test channel. The measure-ments revealed the good heat transfer enhancement capability of the vortex generators and alsoinvestigated the associated pressure losses. Forward and backward directed vortex generators werestudied. The backward direction refers to the flow direction as given in Fig. 11. For the forwardsituation, the flow direction is opposite to this with respect to the vortex generator. It was foundthat the backward direction enhances heat transfer more than the forward direction. An alignedarrangement of vortex generators in subsequent rows gives higher heat transfer than an offset or
www.witpress.com, ISSN 1755-8336 (on-line)
© 2006 WIT PressWIT Transactions on State of the Art in Science and Engineering, Vol 4,

Heat Transfer Enhancement Techniques 485
Figure 13: Secondary flow behind a delta-shaped vortex generator as measured by PIV.
Figure 14: Oil flow visualization for a staggered array of delta-shaped solid vortex generators.
staggered arrangement. This suggests that, due to the alignment of the elements, vortex pairs fromupstream rows are intensified in the downstream rows, whereas for staggered arrangements theupstream vortices are weakened.
A very interesting study in this context was provided by Liou et al. [77], comparing twelvedifferent vortex generator geometries including ribs to each other. The delta-shaped vortex gen-erator and the V-shaped ribs provided the highest heat transfer based on a constant pumpingpower consideration, which takes increased pressure losses into account. The delta-shaped vortexgenerator in this case produced only 40% of pressure loss compared to the V-shaped ribs. In analigned arrangement the pitch between the elements was varied by Liou et al. [78] for pitch tovortex generator height ratios between 8 and 12. The lower pitches provided higher heat transferat moderately increased pressure loss.
In these studies, the height of the vortex generators was smaller than the boundary layer thick-ness. Such vortex generators were called ‘low-profile vortex generators’ in the review by Lin [68],when the height is between 10% and 50% of the boundary layer thickness. These geometrieswere found to be efficient for boundary layer control. Also, the finlike vortex generators foundon sharks or mackerels are embedded within the boundary layer with the possible function ofkeeping the flow attached [69].
www.witpress.com, ISSN 1755-8336 (on-line)
© 2006 WIT PressWIT Transactions on State of the Art in Science and Engineering, Vol 4,
486 Flow Phenomena in Nature
Another interesting point arises from a study for combustor liner cooling presented by Baileyet al. [79]. In this study, heat transfer measurements in a rectangular cooling channel at highReynolds numbers of 840,000 are given for a ribbed wall configuration using small height (e/H =0.022) transverse ribs. The ribs enhanced heat transfer relative to the smooth channel by a factorof two. Adding an impingement arrangement upstream of the ribs enhanced heat transfer furtherby 40–50%.
The impinging jets introduce longitudinal vortices travelling downstream and interacting withthe ribbed surface. The additionally found heat transfer enhancement can be possibly explainedwith this interaction of large vortex-generating structures (jets) and small scale roughness (ribs)as suggested by Garimella and Edmunds [37] for the high mass transfer capability of coral reefs.
Our current understanding on how vortices interact, how this interaction influences vortexstrength and the effect of these complex situations on heat transfer is still limited. This should, andwill, be a field for a lot of interesting subsequent research and will possibly combine investigationsfor engineering design with ecological and biological studies of natural environments.
2.5 Dimples
Systems of spherical cavities depressed in the surface (called dimples) have received increasingattention as vortex-generating elements over the last few years. The consideration of these geome-tries as heat transfer enhancement devices started in the mid-1980s in the former USSR [80–82]and later in the United States [83–85] and the UK [86], including detailed flow and heat trans-fer measurements. A good review of these developments has recently been provided by Ligraniet al. [8].
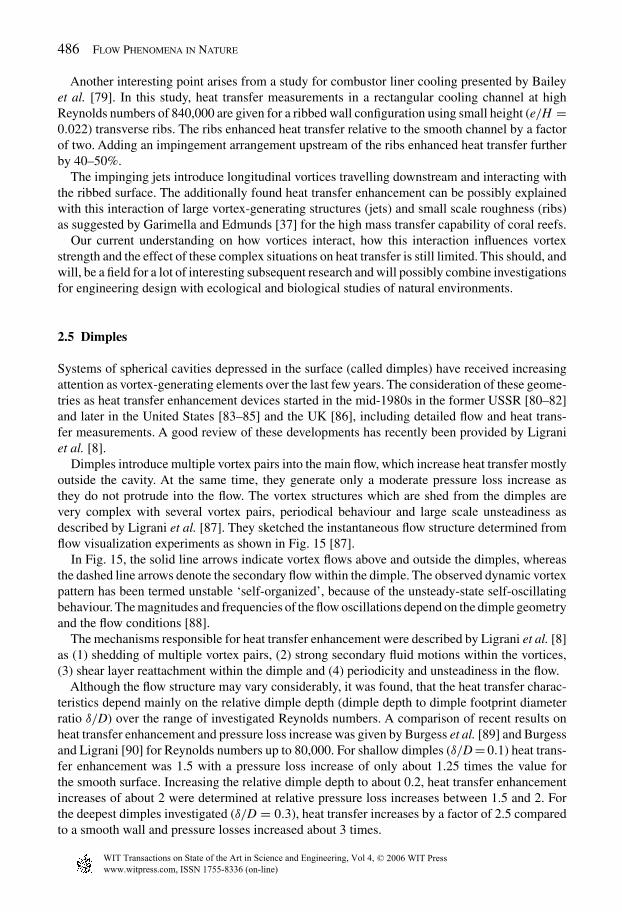
Dimples introduce multiple vortex pairs into the main flow, which increase heat transfer mostlyoutside the cavity. At the same time, they generate only a moderate pressure loss increase asthey do not protrude into the flow. The vortex structures which are shed from the dimples arevery complex with several vortex pairs, periodical behaviour and large scale unsteadiness asdescribed by Ligrani et al. [87]. They sketched the instantaneous flow structure determined fromflow visualization experiments as shown in Fig. 15 [87].
In Fig. 15, the solid line arrows indicate vortex flows above and outside the dimples, whereasthe dashed line arrows denote the secondary flow within the dimple. The observed dynamic vortexpattern has been termed unstable ‘self-organized’, because of the unsteady-state self-oscillatingbehaviour. The magnitudes and frequencies of the flow oscillations depend on the dimple geometryand the flow conditions [88].
The mechanisms responsible for heat transfer enhancement were described by Ligrani et al. [8]as (1) shedding of multiple vortex pairs, (2) strong secondary fluid motions within the vortices,(3) shear layer reattachment within the dimple and (4) periodicity and unsteadiness in the flow.
Although the flow structure may vary considerably, it was found, that the heat transfer charac-teristics depend mainly on the relative dimple depth (dimple depth to dimple footprint diameterratio δ/D) over the range of investigated Reynolds numbers. A comparison of recent results onheat transfer enhancement and pressure loss increase was given by Burgess et al. [89] and Burgessand Ligrani [90] for Reynolds numbers up to 80,000. For shallow dimples (δ/D = 0.1) heat trans-fer enhancement was 1.5 with a pressure loss increase of only about 1.25 times the value forthe smooth surface. Increasing the relative dimple depth to about 0.2, heat transfer enhancementincreases of about 2 were determined at relative pressure loss increases between 1.5 and 2. Forthe deepest dimples investigated (δ/D = 0.3), heat transfer increases by a factor of 2.5 comparedto a smooth wall and pressure losses increased about 3 times.
www.witpress.com, ISSN 1755-8336 (on-line)
© 2006 WIT PressWIT Transactions on State of the Art in Science and Engineering, Vol 4,
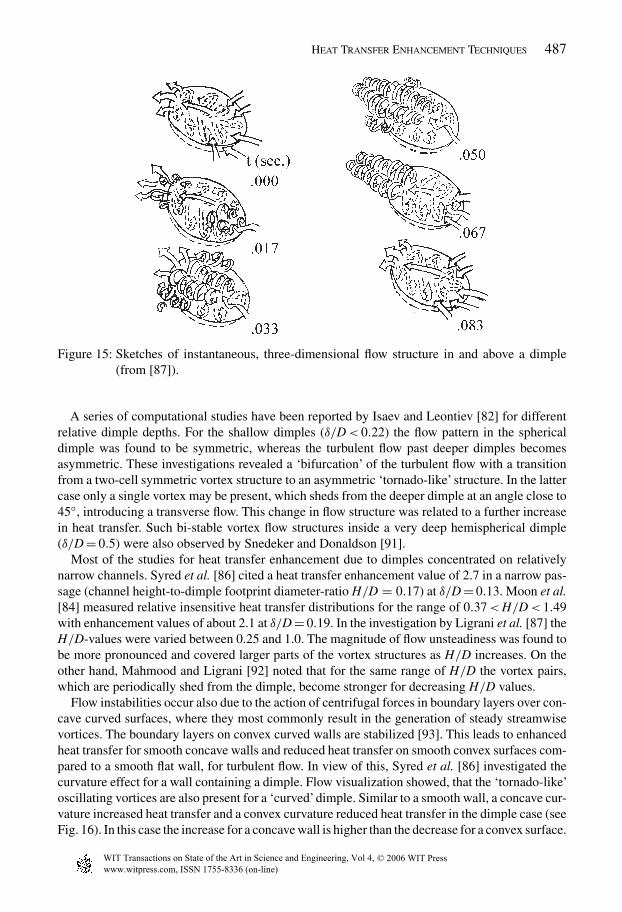
Heat Transfer Enhancement Techniques 487
Figure 15: Sketches of instantaneous, three-dimensional flow structure in and above a dimple(from [87]).
A series of computational studies have been reported by Isaev and Leontiev [82] for differentrelative dimple depths. For the shallow dimples (δ/D< 0.22) the flow pattern in the sphericaldimple was found to be symmetric, whereas the turbulent flow past deeper dimples becomesasymmetric. These investigations revealed a ‘bifurcation’ of the turbulent flow with a transitionfrom a two-cell symmetric vortex structure to an asymmetric ‘tornado-like’ structure. In the lattercase only a single vortex may be present, which sheds from the deeper dimple at an angle close to45◦, introducing a transverse flow. This change in flow structure was related to a further increasein heat transfer. Such bi-stable vortex flow structures inside a very deep hemispherical dimple(δ/D = 0.5) were also observed by Snedeker and Donaldson [91].
Most of the studies for heat transfer enhancement due to dimples concentrated on relativelynarrow channels. Syred et al. [86] cited a heat transfer enhancement value of 2.7 in a narrow pas-sage (channel height-to-dimple footprint diameter-ratio H/D = 0.17) at δ/D = 0.13. Moon et al.[84] measured relative insensitive heat transfer distributions for the range of 0.37<H/D< 1.49with enhancement values of about 2.1 at δ/D = 0.19. In the investigation by Ligrani et al. [87] theH/D-values were varied between 0.25 and 1.0. The magnitude of flow unsteadiness was found tobe more pronounced and covered larger parts of the vortex structures as H/D increases. On theother hand, Mahmood and Ligrani [92] noted that for the same range of H/D the vortex pairs,which are periodically shed from the dimple, become stronger for decreasing H/D values.
Flow instabilities occur also due to the action of centrifugal forces in boundary layers over con-cave curved surfaces, where they most commonly result in the generation of steady streamwisevortices. The boundary layers on convex curved walls are stabilized [93]. This leads to enhancedheat transfer for smooth concave walls and reduced heat transfer on smooth convex surfaces com-pared to a smooth flat wall, for turbulent flow. In view of this, Syred et al. [86] investigated thecurvature effect for a wall containing a dimple. Flow visualization showed, that the ‘tornado-like’oscillating vortices are also present for a ‘curved’dimple. Similar to a smooth wall, a concave cur-vature increased heat transfer and a convex curvature reduced heat transfer in the dimple case (seeFig. 16). In this case the increase for a concave wall is higher than the decrease for a convex surface.
www.witpress.com, ISSN 1755-8336 (on-line)
© 2006 WIT PressWIT Transactions on State of the Art in Science and Engineering, Vol 4,
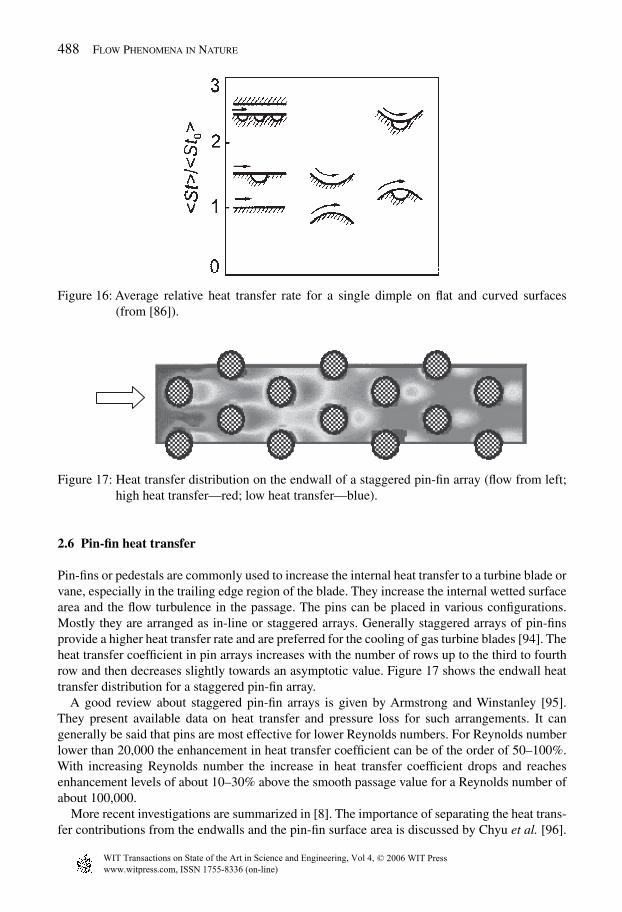
488 Flow Phenomena in Nature
Figure 16: Average relative heat transfer rate for a single dimple on flat and curved surfaces(from [86]).
Figure 17: Heat transfer distribution on the endwall of a staggered pin-fin array (flow from left;high heat transfer—red; low heat transfer—blue).
2.6 Pin-fin heat transfer
Pin-fins or pedestals are commonly used to increase the internal heat transfer to a turbine blade orvane, especially in the trailing edge region of the blade. They increase the internal wetted surfacearea and the flow turbulence in the passage. The pins can be placed in various configurations.Mostly they are arranged as in-line or staggered arrays. Generally staggered arrays of pin-finsprovide a higher heat transfer rate and are preferred for the cooling of gas turbine blades [94]. Theheat transfer coefficient in pin arrays increases with the number of rows up to the third to fourthrow and then decreases slightly towards an asymptotic value. Figure 17 shows the endwall heattransfer distribution for a staggered pin-fin array.
A good review about staggered pin-fin arrays is given by Armstrong and Winstanley [95].They present available data on heat transfer and pressure loss for such arrangements. It cangenerally be said that pins are most effective for lower Reynolds numbers. For Reynolds numberlower than 20,000 the enhancement in heat transfer coefficient can be of the order of 50–100%.With increasing Reynolds number the increase in heat transfer coefficient drops and reachesenhancement levels of about 10–30% above the smooth passage value for a Reynolds number ofabout 100,000.
More recent investigations are summarized in [8]. The importance of separating the heat trans-fer contributions from the endwalls and the pin-fin surface area is discussed by Chyu et al. [96].
www.witpress.com, ISSN 1755-8336 (on-line)
© 2006 WIT PressWIT Transactions on State of the Art in Science and Engineering, Vol 4,
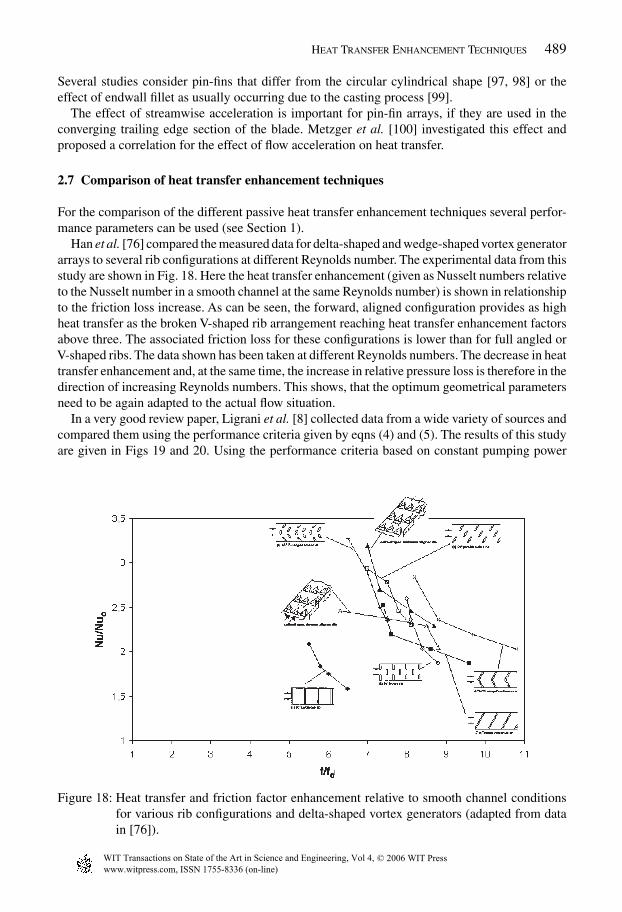
Heat Transfer Enhancement Techniques 489
Several studies consider pin-fins that differ from the circular cylindrical shape [97, 98] or theeffect of endwall fillet as usually occurring due to the casting process [99].
The effect of streamwise acceleration is important for pin-fin arrays, if they are used in theconverging trailing edge section of the blade. Metzger et al. [100] investigated this effect andproposed a correlation for the effect of flow acceleration on heat transfer.
2.7 Comparison of heat transfer enhancement techniques
For the comparison of the different passive heat transfer enhancement techniques several perfor-mance parameters can be used (see Section 1).
Han et al. [76] compared the measured data for delta-shaped and wedge-shaped vortex generatorarrays to several rib configurations at different Reynolds number. The experimental data from thisstudy are shown in Fig. 18. Here the heat transfer enhancement (given as Nusselt numbers relativeto the Nusselt number in a smooth channel at the same Reynolds number) is shown in relationshipto the friction loss increase. As can be seen, the forward, aligned configuration provides as highheat transfer as the broken V-shaped rib arrangement reaching heat transfer enhancement factorsabove three. The associated friction loss for these configurations is lower than for full angled orV-shaped ribs. The data shown has been taken at different Reynolds numbers. The decrease in heattransfer enhancement and, at the same time, the increase in relative pressure loss is therefore in thedirection of increasing Reynolds numbers. This shows, that the optimum geometrical parametersneed to be again adapted to the actual flow situation.
In a very good review paper, Ligrani et al. [8] collected data from a wide variety of sources andcompared them using the performance criteria given by eqns (4) and (5). The results of this studyare given in Figs 19 and 20. Using the performance criteria based on constant pumping power
Figure 18: Heat transfer and friction factor enhancement relative to smooth channel conditionsfor various rib configurations and delta-shaped vortex generators (adapted from datain [76]).
www.witpress.com, ISSN 1755-8336 (on-line)
© 2006 WIT PressWIT Transactions on State of the Art in Science and Engineering, Vol 4,
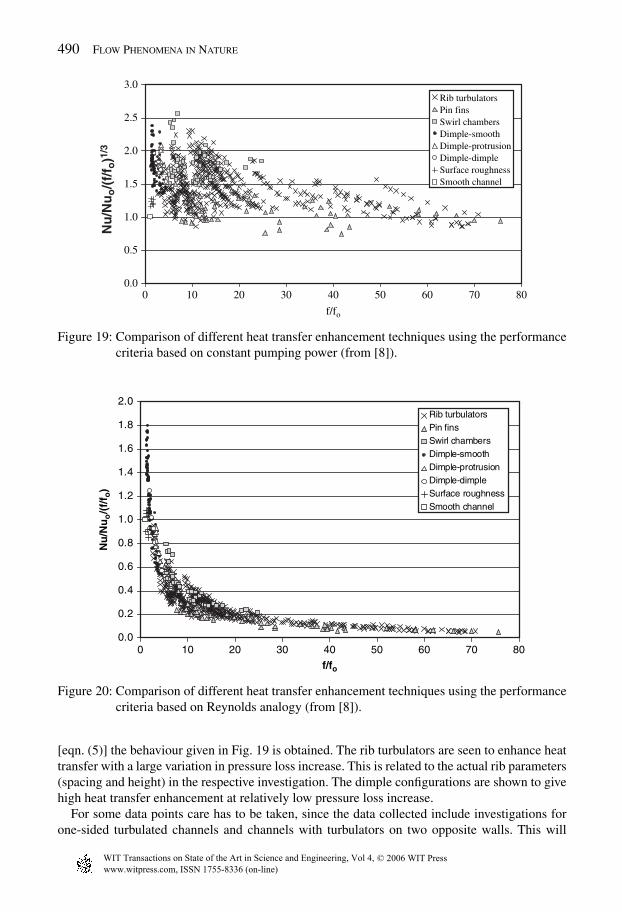
490 Flow Phenomena in Nature
0.0
0.5
1.0
1.5
2.0
2.5
3.0
0 10 20 30 40 50 60 70 80
f/fo
Rib turbulatorsPin finsSwirl chambersDimple-smoothDimple-protrusionDimple-dimpleSurface roughnessSmooth channel
Nu
/Nu
o/(
f/f o
)1/3
Figure 19: Comparison of different heat transfer enhancement techniques using the performancecriteria based on constant pumping power (from [8]).
0.0
0.2
0.4
0.6
0.8
1.0
1.2
1.4
1.6
1.8
2.0
0 10 20 30 40 50 60 70 80
f/fo
Rib turbulatorsPin finsSwirl chambersDimple-smoothDimple-protrusionDimple-dimpleSurface roughnessSmooth channel
Nu
/Nu
o/(
f/f o
)
Figure 20: Comparison of different heat transfer enhancement techniques using the performancecriteria based on Reynolds analogy (from [8]).
[eqn. (5)] the behaviour given in Fig. 19 is obtained. The rib turbulators are seen to enhance heattransfer with a large variation in pressure loss increase. This is related to the actual rib parameters(spacing and height) in the respective investigation. The dimple configurations are shown to givehigh heat transfer enhancement at relatively low pressure loss increase.
For some data points care has to be taken, since the data collected include investigations forone-sided turbulated channels and channels with turbulators on two opposite walls. This will
www.witpress.com, ISSN 1755-8336 (on-line)
© 2006 WIT PressWIT Transactions on State of the Art in Science and Engineering, Vol 4,
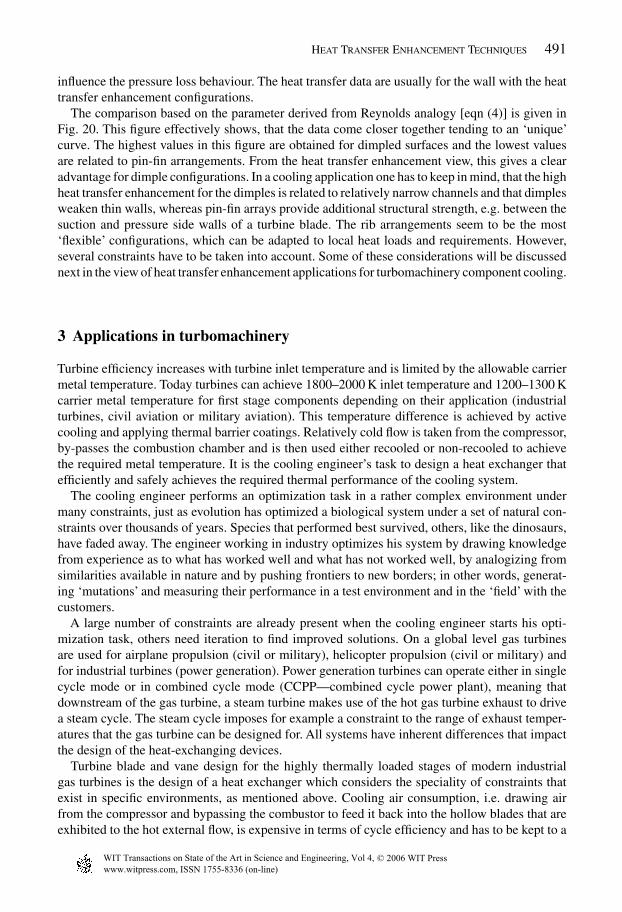
Heat Transfer Enhancement Techniques 491
influence the pressure loss behaviour. The heat transfer data are usually for the wall with the heattransfer enhancement configurations.
The comparison based on the parameter derived from Reynolds analogy [eqn (4)] is given inFig. 20. This figure effectively shows, that the data come closer together tending to an ‘unique’curve. The highest values in this figure are obtained for dimpled surfaces and the lowest valuesare related to pin-fin arrangements. From the heat transfer enhancement view, this gives a clearadvantage for dimple configurations. In a cooling application one has to keep in mind, that the highheat transfer enhancement for the dimples is related to relatively narrow channels and that dimplesweaken thin walls, whereas pin-fin arrays provide additional structural strength, e.g. between thesuction and pressure side walls of a turbine blade. The rib arrangements seem to be the most‘flexible’ configurations, which can be adapted to local heat loads and requirements. However,several constraints have to be taken into account. Some of these considerations will be discussednext in the view of heat transfer enhancement applications for turbomachinery component cooling.
3 Applications in turbomachinery
Turbine efficiency increases with turbine inlet temperature and is limited by the allowable carriermetal temperature. Today turbines can achieve 1800–2000 K inlet temperature and 1200–1300 Kcarrier metal temperature for first stage components depending on their application (industrialturbines, civil aviation or military aviation). This temperature difference is achieved by activecooling and applying thermal barrier coatings. Relatively cold flow is taken from the compressor,by-passes the combustion chamber and is then used either recooled or non-recooled to achievethe required metal temperature. It is the cooling engineer’s task to design a heat exchanger thatefficiently and safely achieves the required thermal performance of the cooling system.
The cooling engineer performs an optimization task in a rather complex environment undermany constraints, just as evolution has optimized a biological system under a set of natural con-straints over thousands of years. Species that performed best survived, others, like the dinosaurs,have faded away. The engineer working in industry optimizes his system by drawing knowledgefrom experience as to what has worked well and what has not worked well, by analogizing fromsimilarities available in nature and by pushing frontiers to new borders; in other words, generat-ing ‘mutations’ and measuring their performance in a test environment and in the ‘field’ with thecustomers.
A large number of constraints are already present when the cooling engineer starts his opti-mization task, others need iteration to find improved solutions. On a global level gas turbinesare used for airplane propulsion (civil or military), helicopter propulsion (civil or military) andfor industrial turbines (power generation). Power generation turbines can operate either in singlecycle mode or in combined cycle mode (CCPP—combined cycle power plant), meaning thatdownstream of the gas turbine, a steam turbine makes use of the hot gas turbine exhaust to drivea steam cycle. The steam cycle imposes for example a constraint to the range of exhaust temper-atures that the gas turbine can be designed for. All systems have inherent differences that impactthe design of the heat-exchanging devices.
Turbine blade and vane design for the highly thermally loaded stages of modern industrialgas turbines is the design of a heat exchanger which considers the speciality of constraints thatexist in specific environments, as mentioned above. Cooling air consumption, i.e. drawing airfrom the compressor and bypassing the combustor to feed it back into the hollow blades that areexhibited to the hot external flow, is expensive in terms of cycle efficiency and has to be kept to a
www.witpress.com, ISSN 1755-8336 (on-line)
© 2006 WIT PressWIT Transactions on State of the Art in Science and Engineering, Vol 4,
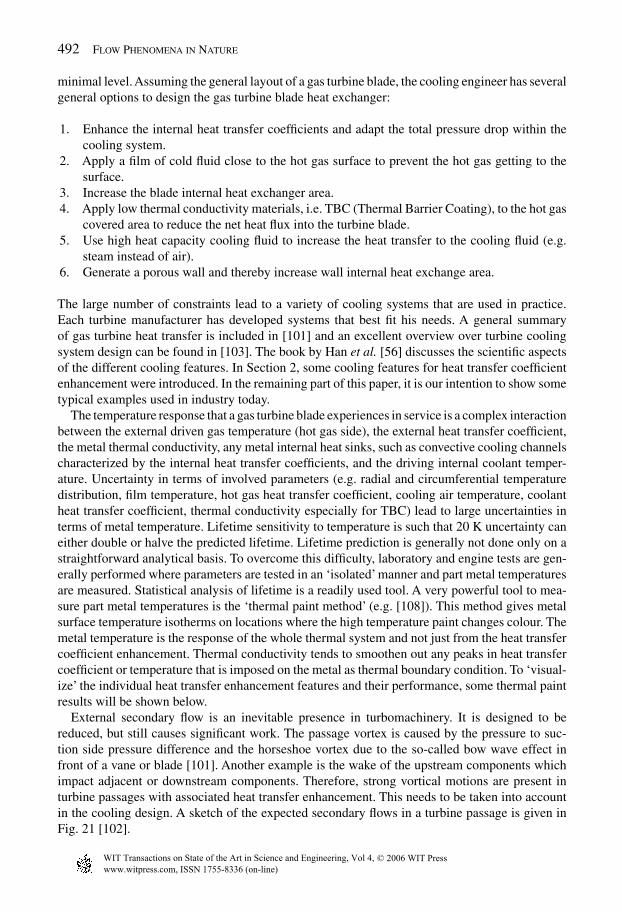
492 Flow Phenomena in Nature
minimal level.Assuming the general layout of a gas turbine blade, the cooling engineer has severalgeneral options to design the gas turbine blade heat exchanger:
1. Enhance the internal heat transfer coefficients and adapt the total pressure drop within thecooling system.
2. Apply a film of cold fluid close to the hot gas surface to prevent the hot gas getting to thesurface.
3. Increase the blade internal heat exchanger area.4. Apply low thermal conductivity materials, i.e. TBC (Thermal Barrier Coating), to the hot gas
covered area to reduce the net heat flux into the turbine blade.5. Use high heat capacity cooling fluid to increase the heat transfer to the cooling fluid (e.g.
steam instead of air).6. Generate a porous wall and thereby increase wall internal heat exchange area.
The large number of constraints lead to a variety of cooling systems that are used in practice.Each turbine manufacturer has developed systems that best fit his needs. A general summaryof gas turbine heat transfer is included in [101] and an excellent overview over turbine coolingsystem design can be found in [103]. The book by Han et al. [56] discusses the scientific aspectsof the different cooling features. In Section 2, some cooling features for heat transfer coefficientenhancement were introduced. In the remaining part of this paper, it is our intention to show sometypical examples used in industry today.
The temperature response that a gas turbine blade experiences in service is a complex interactionbetween the external driven gas temperature (hot gas side), the external heat transfer coefficient,the metal thermal conductivity, any metal internal heat sinks, such as convective cooling channelscharacterized by the internal heat transfer coefficients, and the driving internal coolant temper-ature. Uncertainty in terms of involved parameters (e.g. radial and circumferential temperaturedistribution, film temperature, hot gas heat transfer coefficient, cooling air temperature, coolantheat transfer coefficient, thermal conductivity especially for TBC) lead to large uncertainties interms of metal temperature. Lifetime sensitivity to temperature is such that 20 K uncertainty caneither double or halve the predicted lifetime. Lifetime prediction is generally not done only on astraightforward analytical basis. To overcome this difficulty, laboratory and engine tests are gen-erally performed where parameters are tested in an ‘isolated’ manner and part metal temperaturesare measured. Statistical analysis of lifetime is a readily used tool. A very powerful tool to mea-sure part metal temperatures is the ‘thermal paint method’ (e.g. [108]). This method gives metalsurface temperature isotherms on locations where the high temperature paint changes colour. Themetal temperature is the response of the whole thermal system and not just from the heat transfercoefficient enhancement. Thermal conductivity tends to smoothen out any peaks in heat transfercoefficient or temperature that is imposed on the metal as thermal boundary condition. To ‘visual-ize’ the individual heat transfer enhancement features and their performance, some thermal paintresults will be shown below.
External secondary flow is an inevitable presence in turbomachinery. It is designed to bereduced, but still causes significant work. The passage vortex is caused by the pressure to suc-tion side pressure difference and the horseshoe vortex due to the so-called bow wave effect infront of a vane or blade [101]. Another example is the wake of the upstream components whichimpact adjacent or downstream components. Therefore, strong vortical motions are present inturbine passages with associated heat transfer enhancement. This needs to be taken into accountin the cooling design. A sketch of the expected secondary flows in a turbine passage is given inFig. 21 [102].
www.witpress.com, ISSN 1755-8336 (on-line)
© 2006 WIT PressWIT Transactions on State of the Art in Science and Engineering, Vol 4,

Heat Transfer Enhancement Techniques 493
Figure 21: Secondary flow model in turbine passage (from [102]).
Due to this secondary flow field development the heat load distribution to a turbine blade willvary locally. Therefore, the cooling efficiency needs to be locally adapted. As mentioned above,heat conduction within the blade will smoothen the temperature distribution, as shown in Fig. 22from the results of a thermal paint test. The indicated lines show the locations of isotherms on theblade surface.
Internal cooling of rotor blades is often accomplished using multipass-serpentine configura-tions. A discussion of the advantage of multipass systems for internal cooling is given in [103].Multipass systems have radially aligned cooling channels and at the outer or inner boundariesthe channels are connected via the so-called blade turns or bends. The heated cooling air in opensystems is dumped via film cooling or trailing edge cooling into the hot gas path. Figure 23 showsan example of one such multipass cooling design [104].
The turn or bend region itself introduces secondary flow motion due to the streamline curvature.This effect is already present in the smooth channels connected by bends. A flow visualizationstudy for such a configuration is given in Fig. 24, indicating the flow direction (2), regions oflow velocity (1), areas of flow separation (3), a separation line between the introduced secondaryvortices (4) and the flow attachment point (5). The special shape of the bend with the divergingouter wall is due to the adaption of the blade to the turbine annulus.
For ribbed channels, the secondary motion introduced by the turbulators will interact withthe bend-induced vortices leading to the very complex flow and, therefore, heat transfer patterns.Additionally, the bends generally have a much higher pressure loss than the channels. Guide vanescan help to reduce the bend pressure loss. Thus, the heat transfer distributions will be change asshown, for example, in Fig. 25 [105].
www.witpress.com, ISSN 1755-8336 (on-line)
© 2006 WIT PressWIT Transactions on State of the Art in Science and Engineering, Vol 4,
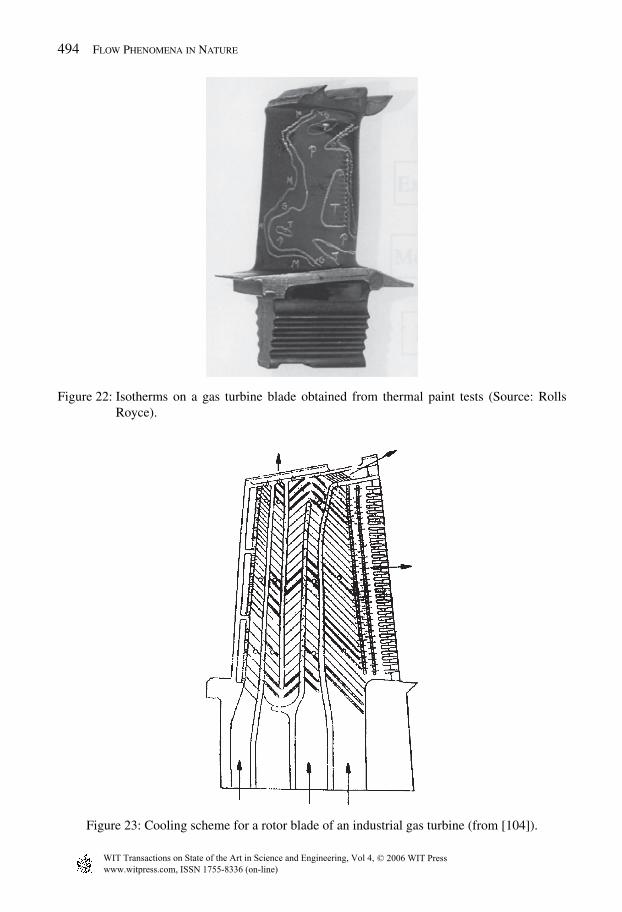
494 Flow Phenomena in Nature
Figure 22: Isotherms on a gas turbine blade obtained from thermal paint tests (Source: RollsRoyce).
Figure 23: Cooling scheme for a rotor blade of an industrial gas turbine (from [104]).
www.witpress.com, ISSN 1755-8336 (on-line)
© 2006 WIT PressWIT Transactions on State of the Art in Science and Engineering, Vol 4,
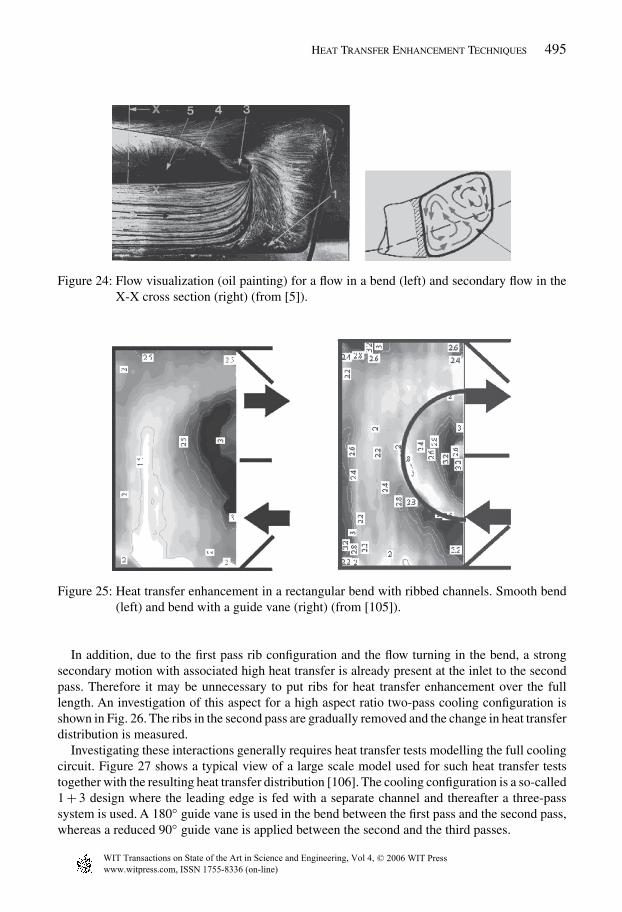
Heat Transfer Enhancement Techniques 495
Figure 24: Flow visualization (oil painting) for a flow in a bend (left) and secondary flow in theX-X cross section (right) (from [5]).
Figure 25: Heat transfer enhancement in a rectangular bend with ribbed channels. Smooth bend(left) and bend with a guide vane (right) (from [105]).
In addition, due to the first pass rib configuration and the flow turning in the bend, a strongsecondary motion with associated high heat transfer is already present at the inlet to the secondpass. Therefore it may be unnecessary to put ribs for heat transfer enhancement over the fulllength. An investigation of this aspect for a high aspect ratio two-pass cooling configuration isshown in Fig. 26. The ribs in the second pass are gradually removed and the change in heat transferdistribution is measured.
Investigating these interactions generally requires heat transfer tests modelling the full coolingcircuit. Figure 27 shows a typical view of a large scale model used for such heat transfer teststogether with the resulting heat transfer distribution [106]. The cooling configuration is a so-called1 + 3 design where the leading edge is fed with a separate channel and thereafter a three-passsystem is used. A 180◦ guide vane is used in the bend between the first pass and the second pass,whereas a reduced 90◦ guide vane is applied between the second and the third passes.
www.witpress.com, ISSN 1755-8336 (on-line)
© 2006 WIT PressWIT Transactions on State of the Art in Science and Engineering, Vol 4,
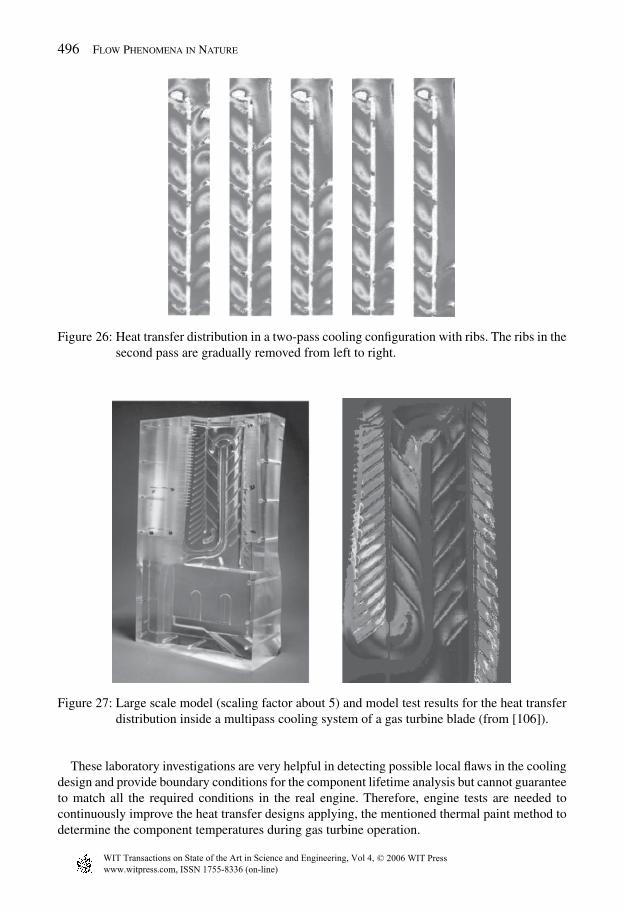
496 Flow Phenomena in Nature
Figure 26: Heat transfer distribution in a two-pass cooling configuration with ribs. The ribs in thesecond pass are gradually removed from left to right.
Figure 27: Large scale model (scaling factor about 5) and model test results for the heat transferdistribution inside a multipass cooling system of a gas turbine blade (from [106]).
These laboratory investigations are very helpful in detecting possible local flaws in the coolingdesign and provide boundary conditions for the component lifetime analysis but cannot guaranteeto match all the required conditions in the real engine. Therefore, engine tests are needed tocontinuously improve the heat transfer designs applying, the mentioned thermal paint method todetermine the component temperatures during gas turbine operation.
www.witpress.com, ISSN 1755-8336 (on-line)
© 2006 WIT PressWIT Transactions on State of the Art in Science and Engineering, Vol 4,
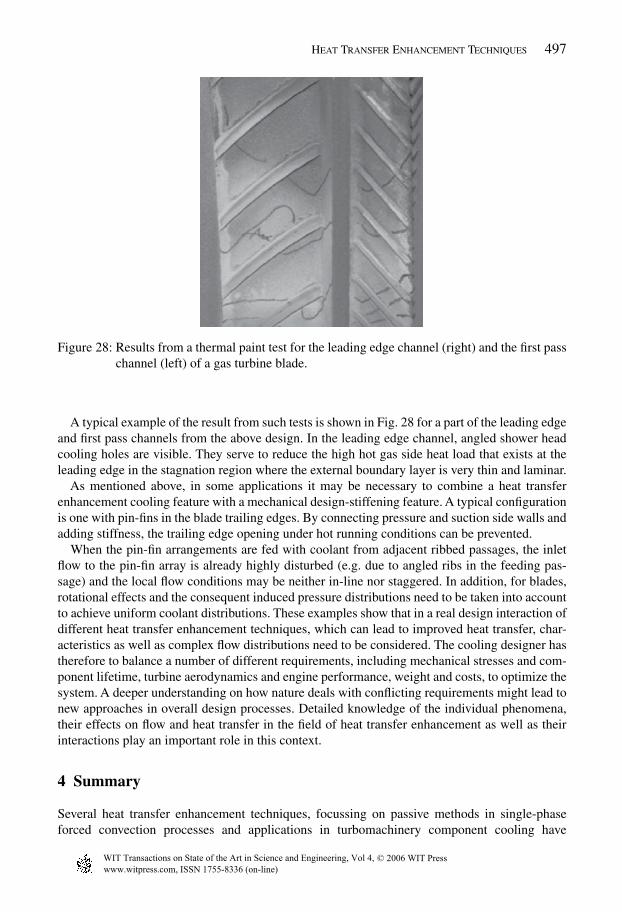
Heat Transfer Enhancement Techniques 497
Figure 28: Results from a thermal paint test for the leading edge channel (right) and the first passchannel (left) of a gas turbine blade.
A typical example of the result from such tests is shown in Fig. 28 for a part of the leading edgeand first pass channels from the above design. In the leading edge channel, angled shower headcooling holes are visible. They serve to reduce the high hot gas side heat load that exists at theleading edge in the stagnation region where the external boundary layer is very thin and laminar.
As mentioned above, in some applications it may be necessary to combine a heat transferenhancement cooling feature with a mechanical design-stiffening feature. A typical configurationis one with pin-fins in the blade trailing edges. By connecting pressure and suction side walls andadding stiffness, the trailing edge opening under hot running conditions can be prevented.
When the pin-fin arrangements are fed with coolant from adjacent ribbed passages, the inletflow to the pin-fin array is already highly disturbed (e.g. due to angled ribs in the feeding pas-sage) and the local flow conditions may be neither in-line nor staggered. In addition, for blades,rotational effects and the consequent induced pressure distributions need to be taken into accountto achieve uniform coolant distributions. These examples show that in a real design interaction ofdifferent heat transfer enhancement techniques, which can lead to improved heat transfer, char-acteristics as well as complex flow distributions need to be considered. The cooling designer hastherefore to balance a number of different requirements, including mechanical stresses and com-ponent lifetime, turbine aerodynamics and engine performance, weight and costs, to optimize thesystem. A deeper understanding on how nature deals with conflicting requirements might lead tonew approaches in overall design processes. Detailed knowledge of the individual phenomena,their effects on flow and heat transfer in the field of heat transfer enhancement as well as theirinteractions play an important role in this context.
4 Summary
Several heat transfer enhancement techniques, focussing on passive methods in single-phaseforced convection processes and applications in turbomachinery component cooling have
www.witpress.com, ISSN 1755-8336 (on-line)
© 2006 WIT PressWIT Transactions on State of the Art in Science and Engineering, Vol 4,
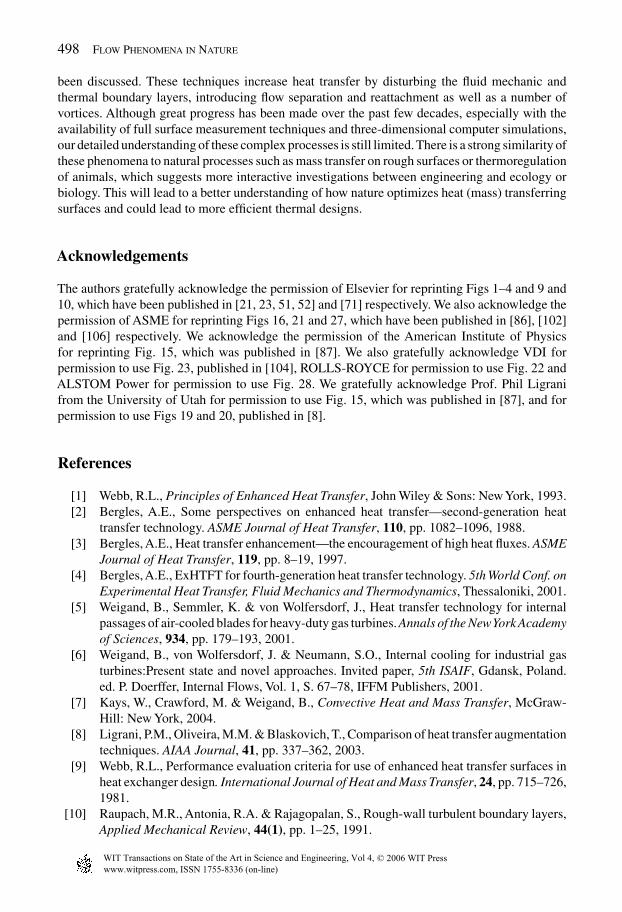
498 Flow Phenomena in Nature
been discussed. These techniques increase heat transfer by disturbing the fluid mechanic andthermal boundary layers, introducing flow separation and reattachment as well as a number ofvortices. Although great progress has been made over the past few decades, especially with theavailability of full surface measurement techniques and three-dimensional computer simulations,our detailed understanding of these complex processes is still limited. There is a strong similarity ofthese phenomena to natural processes such as mass transfer on rough surfaces or thermoregulationof animals, which suggests more interactive investigations between engineering and ecology orbiology. This will lead to a better understanding of how nature optimizes heat (mass) transferringsurfaces and could lead to more efficient thermal designs.
Acknowledgements
The authors gratefully acknowledge the permission of Elsevier for reprinting Figs 1–4 and 9 and10, which have been published in [21, 23, 51, 52] and [71] respectively. We also acknowledge thepermission of ASME for reprinting Figs 16, 21 and 27, which have been published in [86], [102]and [106] respectively. We acknowledge the permission of the American Institute of Physicsfor reprinting Fig. 15, which was published in [87]. We also gratefully acknowledge VDI forpermission to use Fig. 23, published in [104], ROLLS-ROYCE for permission to use Fig. 22 andALSTOM Power for permission to use Fig. 28. We gratefully acknowledge Prof. Phil Ligranifrom the University of Utah for permission to use Fig. 15, which was published in [87], and forpermission to use Figs 19 and 20, published in [8].
References
[1] Webb, R.L., Principles of Enhanced Heat Transfer, John Wiley & Sons: NewYork, 1993.[2] Bergles, A.E., Some perspectives on enhanced heat transfer—second-generation heat
transfer technology. ASME Journal of Heat Transfer, 110, pp. 1082–1096, 1988.[3] Bergles, A.E., Heat transfer enhancement—the encouragement of high heat fluxes. ASME
Journal of Heat Transfer, 119, pp. 8–19, 1997.[4] Bergles, A.E., ExHTFT for fourth-generation heat transfer technology. 5th World Conf. on
Experimental Heat Transfer, Fluid Mechanics and Thermodynamics, Thessaloniki, 2001.[5] Weigand, B., Semmler, K. & von Wolfersdorf, J., Heat transfer technology for internal
passages of air-cooled blades for heavy-duty gas turbines. Annals of the NewYork Academyof Sciences, 934, pp. 179–193, 2001.
[6] Weigand, B., von Wolfersdorf, J. & Neumann, S.O., Internal cooling for industrial gasturbines:Present state and novel approaches. Invited paper, 5th ISAIF, Gdansk, Poland.ed. P. Doerffer, Internal Flows, Vol. 1, S. 67–78, IFFM Publishers, 2001.
[7] Kays, W., Crawford, M. & Weigand, B., Convective Heat and Mass Transfer, McGraw-Hill: New York, 2004.
[8] Ligrani, P.M., Oliveira, M.M. & Blaskovich, T., Comparison of heat transfer augmentationtechniques. AIAA Journal, 41, pp. 337–362, 2003.
[9] Webb, R.L., Performance evaluation criteria for use of enhanced heat transfer surfaces inheat exchanger design. International Journal of Heat and Mass Transfer, 24, pp. 715–726,1981.
[10] Raupach, M.R., Antonia, R.A. & Rajagopalan, S., Rough-wall turbulent boundary layers,Applied Mechanical Review, 44(1), pp. 1–25, 1991.
www.witpress.com, ISSN 1755-8336 (on-line)
© 2006 WIT PressWIT Transactions on State of the Art in Science and Engineering, Vol 4,
Heat Transfer Enhancement Techniques 499
[11] Schultz, M.P., Turbulent boundary layers on surfaces covered with filamentous algae.ASME Journal of Fluids Engineering, 122, pp. 357–363, 2000.
[12] Castro, I.P. &Wiggs, G.F.S., Pulsed-wire anemometry on rough surfaces, with applicationsto desert sand dunes. Journal of Wind Engineering and Industrial Aerodynamics, 52,pp. 53–71, 1994.
[13] Dong, Z., Liu, X. & Wang, X., Aerodynamic roughness of gravel surfaces. Geomorphol-ogy, 43, pp. 17–31, 2002.
[14] Commito, J.A. & Rusignuolo, B.R., Structural complexity in mussel beds: the fractalgeometry of surface topography. Journal of Experimental Marine Biology and Ecology,255, pp. 133–152, 2000.
[15] Atkinson, M.J. & Bilger, R.W., Effects of water velocity on phosphate uptake in coralreef-flat communities. Limnology and Oceanography, 37(2), pp. 273–279, 1992.
[16] Nikuradse, J., Laws of flow in rough pipes. VDI Forschungsheft, 361, 1933.[17] Schlichting, H., Grenzschichttheorie, Verlag G. Braun: Karlsruhe, 1965.[18] Moody, L.F., Friction factors for pipe flow, Transactions of the ASME, 66, p. 671,
1944.[19] Schlichting, H., Experimentelle Untersuchungen zum Rauhigkeitsproblem. Ingenieurs-
Archiv, 7(1), pp. 1–34, 1936.[20] Clauser, F.H., Turbulent boundary layers in adverse pressure gradient. Journal of
Aeronautical Sciences, 21, pp. 91–108, 1954.[21] Antonia, R.A. & Krogstad, P.A., Turbulence structure in boundary layers over different
types of surface roughness. Fluid Dynamics Research, 28, pp. 139–157, 2001.[22] Krogstad, P.A. & Antonia, R.A., Surface roughness effects in turbulent boundary layers.
Experiments in Fluids, 27, pp. 450–460, 1999.[23] Slanciauskas, A., Two friendly rules for the turbulent heat transfer enhancement. Inter-
national Journal of Heat and Mass Transfer, 44, pp. 2155–2161, 2001.[24] Bradshaw, P., A note on ‘critical roughness height’ and “transitional roughness”. Physics
of Fluids, 12(6), pp. 1611–1614, 2000.[25] Snyder, W.H. & Castro, I.P., The critical Reynolds number for rough-wall boundary layers.
Journal of Wind Engineering and Industrial Aerodynamics, 90, pp. 41–54, 2002.[26] Bandyopadhyay, P.R., Rough-wall turbulent boundary layers in the transition regime.
Journal of Fluid Mechanics, 180, pp. 231–266, 1987.[27] Jimenez, J., Turbulent flows over rough walls. Annual Review of Fluid Mechanics, 36,
pp. 173–196, 2004.[28] van Rij, J.A., Belnap, B.J. & Ligrani, P.M., Analysis and experiments on three-
dimensional, irregular surface roughness. ASME Journal of Fluids Engineering, 124,pp. 671–677, 2002.
[29] Sigal, A. & Danberg, J.E., New correlation of roughness density effect on the turbulentboundary layer. AIAA Journal, 28(3), pp. 554–556, 1990.
[30] Bons, J.P., Taylor, R.P., McClain, S.T. & Rivir, R.B., The many faces of turbine surfaceroughness. ASME Journal of Turbomachinery, 123, pp. 739–748, 2001.
[31] Bons, J.P., St and cf augmentation for real turbine roughness with elevated freestreamturbulence. ASME Journal of Turbomachinery, 124, pp. 632–644, 2002.
[32] Belnap, B.J., van Rij, J.A. & Ligrani, P.M., A Reynolds analogy for real componentsurface roughness. International Journal of Heat and Mass Transfer, 45, pp. 3089–3099,2002.
[33] Bilger, R.W. & Atkinson, M.J., Anomalous mass transfer of phosphate on coral reef flats.Limnology and Oceanography, 37(2), pp. 261–272, 1992.
www.witpress.com, ISSN 1755-8336 (on-line)
© 2006 WIT PressWIT Transactions on State of the Art in Science and Engineering, Vol 4,

500 Flow Phenomena in Nature
[34] Helmuth, B.S.T., Sebens, K.P. & Daniel, T.L., Morphological variation in coralaggregations: branch spacing and mass flux to coral tissues. Journal of ExperimentalMarine Biology and Ecology, 209, pp. 233–259, 1997.
[35] Thomas, F.I.M. & Atkinson, M.J., Ammonia uptake by coral reefs: Effects of watervelocity and surface roughness on mass transfer. Limnology and Oceanography, 42(1),pp. 81–88, 1997.
[36] Patterson, M.R., Sebens, K.P. & Olson, R.R., In situ measurements of flow effects onprimary production and dark respirations in reef corals. Limnology and Oceanography,36(5), pp. 936–948, 1991.
[37] Gardella, D.J. & Edmunds, P.J., The effect of flow and morphology on boundary layers inthe scleractinians Dichocoenia stokesii (Milne-Edwards and Haime) and Stephanocoeniamichilini (Milne-Edwards and Haime). Journal of Experimental Marine Biology andEcology, 256, pp. 279–289, 2001.
[38] Shashar, N., Kinane, S., Jokiel, P.L. & Patterson, M.R., Hydromechanical boundary layersover a coral reef. Journal of Experimental Marine Biology and Ecology, 199, pp. 17–28,1996.
[39] Dipprey, D.F. & Sabersky, R.H., Heat and momentum transfer in smooth and roughtubes at various Prandtl numbers. International Journal of Heat and Mass Transfer, 6,pp. 329–353, 1963.
[40] Baird, M.E. & Atkinson, M.J., Measurement and prediction of mass transfer to experi-mental coral reef communities. Limnology and Oceanography, 42(8), pp. 1685–1693,1997.
[41] Nowell, A.R.M. & Jumars, P.A., Flow environments of aquatic benthos. Annual ReviewsEcological Systems, 15, pp. 303–328, 1984.
[42] Patel, V.C., Perspective: flow at high reynolds number and over rough surfaces—achillesheel of CFD. ASME Journal of Fluids Engineering, 120, pp. 434–444, 1998.
[43] Cui, J., Patel, V.C. & Lin, C.L., Predictions of turbulent flow over rough surfaces using aforce field in large eddy simulation. ASME Journal of Fluids Engineering, 125, pp. 2–9,2003.
[44] Wang, Z.J., Chi, X.K., Shih, T. & Bons, J., Direct simulation of surface roughness effectswith RANS and DES approaches on viscous adaptive Cartesian grids, AIAA-2004-2420,2004.
[45] Dalle Donne, M. & Meyer, L., Turbulent convective heat transfer from rough surfaceswith two-dimensional rectangular ribs. International Journal of Heat and Mass Transfer,20, pp. 583–620, 1977.
[46] Meyer, L., Thermohydraulic characteristics of single rods with three-dimensional rough-ness. International Journal of Heat and Mass Transfer, 17, pp. 1043–1058, 1982.
[47] Sheriff, N. & Gumley, P., Heat-transfer and friction properties of surfaces with discreteroughness. International Journal of Heat and Mass Transfer, 9, pp. 1297–1320, 1966.
[48] Nunner, W., VDI Forschungsheft 455, B22:5, 1956.[49] Kader, B.A. & Yaglom, A.M., Turbulent heat and mass transfer from a wall with
parallel roughness ridges. International Journal of Heat and Mass Transfer, 20,pp. 345–357, 1977.
[50] Dawson, D.A. & Trass, O., Mass transfer at rough surfaces. International Journal of Heatand Mass Transfer, 15, pp. 1317–1336, 1972.
[51] Berger, F.P. & Hau, F.L., Local mass/heat transfer distributions on surfaces roughened withsmall square ribs. International Journal of Heat and Mass Transfer, 22, pp. 1645–1656,1979.
www.witpress.com, ISSN 1755-8336 (on-line)
© 2006 WIT PressWIT Transactions on State of the Art in Science and Engineering, Vol 4,
Heat Transfer Enhancement Techniques 501
[52] Webb, R.L., Eckert, E.R.G. & Goldstein, R.J., Heat transfer and friction in tubeswith repeated-rib roughness. International Journal of Heat and Mass Transfer, 14,pp. 601–617, 1971.
[53] Han, J.C., Glicksman, L.R. & Rohsenow, W.M., An investigation of heat transfer andfriction for rib-roughened surfaces. International Journal of Heat and Mass Transfer, 21,pp. 1143–1156, 1978.
[54] Han, J.C. & Dutta, S., Internal Convection Heat Transfer and Cooling: An ExperimentalApproach, VKI-LS 1995-05, Heat Transfer and Cooling in Gas Turbines, 1995.
[55] Taslim, M.E., Convective cooling in non-rotating and rotating channels—experimentalaspects, Aero-thermal Performance of Internal Cooling Systems in Turbomachines,VKI-LS 2000-03, 2000.
[56] Han, J.C., Dutta, S. & Ekkad, S.V., Gas Turbine Heat Transfer and Cooling Technology,Taylor & Francis Publishers, 2001.
[57] Han, J.C., Zhang, Y.M. & Lee, C.P., Augmented heat transfer in square channelswith parallel, crossed and V-shaped angled ribs. ASME Journal of Heat Transfer, 113,pp. 590–596, 1991.
[58] Han, J.C. & Zhang, Y.M., High performance heat transfer ducts with parallel broken andV-shaped broken ribs. International Journal of Heat and Mass Transfer, 35, pp. 513–523,1992.
[59] Weigand, B., What should we measure? The industrial—engine heat transfer perspective.Proc. of the XIV Bi-annual Symp. On Measuring Techniques in Transonic and SupersonicFlow in Cascades and Turbomachines. Invited Lecture. Limerick: Ireland, 1998.
[60] Zhang,Y.M., Gu, W.Z. & Han, J.C., Heat transfer and friction in rectangular channels withribbed or ribbed-grooved walls. ASME Journal of Heat Transfer, 116, pp. 58–65, 1994.
[61] Wright, L.M., Fu, W.L. & Han, J.C., Thermal performance of angled, v-shaped andw-shaped rib turbulators in rotating rectangular cooling channels. Proc. of the Int. GasTurbine Conference, Vienna, Austria, ASME GT2004-54073, 2004.
[62] Rhee, D.H., Lee, D.H. & Cho, H.H., Effects of duct aspect ratio on heat/mass transfer withdiscrete V-shaped ribs. Proc. of the Int. Gas Turbine Conference, Atlanta, USA, ASMEGT2003-38622, 2003.
[63] Hall, K., Johnson, B., Weigand, B. & Wu, P.S., Coolable Blade. United States Patent,Patent No. 5919031, 1999.
[64] Beeck, A., Johnson, B., Weigand, B. & Wu, P.S., Cooling system for the leading edge ofa hollow blade for a gas turbine, European Patent, EP0892149, 1997.
[65] Stroock, A.D., Dertinger, S.K.W., Ajdari, A., Mezic, I., Stome, H.A. & Whitesides, G.M.,Chaotic mixer for microchannels. Science, 295, pp. 647–651, 2002.
[66] Hong, S., Thiffeault, J.-L., Frechette, L. & Modi, V., Numerical study of mixing inmicrochannels with patterned zeta potential surfaces. Proc. of IMECE’03, WashingtonD.C., November 16–21, IMECE2003-41912, 2003.
[67] Schubauer, G.B. & Spangenberg, W.G., Forced mixing in boundary layers. Journal ofFluid Mechanics, 8, pp. 10–32, 1960.
[68] Lin, J.C., Review of research on low-profile vortex generators to control boundary layerseparation. Progress in Aerospace Sciences, 38, pp. 389–420, 2002.
[69] Bechert, D.W., Bruse, M., Hage, W. & Meyer, R., Fluid mechanics of biological surfacesand their technological application. Naturwissenschaften, 87, pp. 157–171, 2000.
[70] Meagher, E.M., McLellan, W.A., Westgate, A.J., Wells, R.S., Frierson, Jr., D. &Pabst, D.A., The relationship between heat flow and vasculature in the dorsal fin of
www.witpress.com, ISSN 1755-8336 (on-line)
© 2006 WIT PressWIT Transactions on State of the Art in Science and Engineering, Vol 4,

502 Flow Phenomena in Nature
wild bottlenose dolphins Tursiops truncates. Journal of Experimental Biology, 205,pp. 3475–3486, 2002.
[71] Jacobi, A.M. & Shah, R.K., Heat transfer surface enhancement trough the use of longi-tudinal vortices: a review of recent progress. Experimental Thermal and Fluid Science,11, pp. 295–309, 1995.
[72] Fiebig, M., Vortices, generators and heat transfer. Trans. IChemE Part A, 76, pp. 108–122,1998.
[73] Fiebig, M., Embedded vortices in internal flow: heat transfer and pressure loss enhance-ment. International Journal of Heat and Fluid Flow, 16, pp. 376–388, 1995.
[74] Torii, K., Kwak, K.M. & Nishino, K., Heat transfer enhancement accompanying pressureloss reduction with winglet-type vortex generators for fin-tube heat exchangers, Inter-national Journal of Heat and Mass Transfer, 45, pp. 3795–3801, 2002.
[75] Chen, Y., Fiebig, M. & Mitra, N.K., Conjugate heat transfer of a finned oval tube with apunched longitudinal vortex generator in form of a delta winglet—parametric investiga-tions of the winglet. International Journal of Heat and Mass Transfer, 41, pp. 3961–3978,1998.
[76] Han, J.C., Huang, J.J. & Pang Lee, C., Augmented heat transfer in square channels withwedge-shaped and delta-shaped turbulence promoters. Journal of Enhanced Heat Trans-fer, 1(1), pp. 37–52, 1993.
[77] Liou, T.M., Chen, C.C. & Tsai, T.W., Heat transfer and fluid flow in a square duct with 12different shaped vortex generators. ASME Journal of Heat Transfer, 122, pp. 327–335,2000.
[78] Liou, T.M., Tsai, T.W. & Chen, C.C., Liquid crystal visualizations and measurements ofheat transfer in a square duct with different pitches of vortex generator arrays. Journal ofFlow Visualization & Image Processing, 5, pp. 295–308, 1998.
[79] Bailey, J.C., Nirmalan, N.V., Bunker, R.S., Intile, J., Fric, T.F. & Tolpadi, A.K., Exper-imental and numerical study of heat transfer in a gas turbine combustor liner. ASMEGT-2002-30183, 2002.
[80] Afanasyev, V.N., Chudnovsky, Ya.P., Leontiev, A.I. & Roganov, P.S., Turbulent flow fric-tion and heat transfer characteristics for spherical cavities on a flat plate. ExperimentalThermal and Fluid Science, 7, pp. 1–8, 1993.
[81] Shchukin, A.V., Kozlov, A.P. & Agachev, R.S., Study and application of hemisphericcavities for heat transfer augmentation. ASME 95-GT-59, 1995.
[82] Isayev, S.A. & Leontiev,A.I., Numerical simulation of vortex enhancement of heat transferunder conditions of turbulent flow past a spherical dimple on the wall of a narrow channel.High Temperature, 41(5), pp. 755–770, 2003.
[83] Chyu, M.K., Yu, Y., Ding, H., Downs, J.P. & Soechting, F.O., Concavity enhanced heattransfer in an internal cooling passage. ASME 97-GT-43, 1997.
[84] Moon, H.K., O’Connell, T. & Glezer, B., Channel height effect on heat transfer andfriction in a dimpled passage. ASME Journal of Engineering Gas Turbine and Power,122, pp. 307–313, 2000.
[85] Mahmood, G.I., Hill, M.L., Nelson, D.L., Ligrani, P.M., Moon, H.K. & Glezer, B., Localheat transfer and flow structure on and above a dimpled surface in a channel. ASMEJournal of Turbomachinery, 123, pp. 115–123, 2003.
[86] Syred, N., Khalatov, A., Kozlov, A., Shchukin, A. & Agachev, R., Effect of surface cur-vature on heat transfer and hydrodynamics within a single hemispherical dimple. ASMEJournal of Turbomachinery, 123, pp. 609–613, 2001.
www.witpress.com, ISSN 1755-8336 (on-line)
© 2006 WIT PressWIT Transactions on State of the Art in Science and Engineering, Vol 4,
Heat Transfer Enhancement Techniques 503
[87] Ligrani, P.M., Harrison, J.L., Mahmood, G.I. & Hill, M.L., Flow structure due to dimpledepressions on a channel surface. Physics of Fluids, 13(11), pp. 3442–3451, 2001.
[88] Terekhov, V.I., Kalinina, S.V. & Mshvidobadze,Yu.M., Heat transfer coefficient and aero-dynamic resistance on a surface with a single dimple. Journal of Enhanced Heat Transfer,4, pp. 131–145, 1997.
[89] Burgess, N.K., Oliveira, M.M. & Ligrani, P.M., Nusselt number behavior on deep dimplesurfaces within a channel. ASME Journal of Heat Transfer, 125, pp. 11–18, 2003.
[90] Burgess, N.K. & Ligrani, P.M., Effects of dimple depth on Nusselt numbers and frictionfactors for internal cooling in a channel. Proc. of the Int. Gas Turbine Conference, Vienna,Austria, ASME GT2004-54232, 2004.
[91] Snedeker, R.S. & Donaldson, C.P., Observation of a bistable flow in a hemisphericalcavity. AIAA Journal, 4(4), pp. 735–736, 1966.
[92] Mahmood, G.I. & Ligrani, P.M., Heat transfer in a dimpled channel: combined influencesof aspect ratio, temperature ratio, Reynolds number, and flow structure. InternationalJournal Heat and Mass Transfer, 45, pp. 2011–2020, 2002.
[93] Saric, W.S., Görtler vortices. Annual Review of Fluid Mechanics, 26, pp. 379–409, 1994.[94] Sparrow, E.M., Ramsey, J.W. & Altemani, C.A.C., Experiments on in-line pin fin arrays
and performance comparisons with staggered array. ASME Journal of Heat Transfer, 102,pp. 44–50, 1980.
[95] Armstrong, J. & Winstanley, D., A review of staggered array pin fin heat transfer forturbine cooling applications. ASME Journal of Turbomachinery, 110, pp. 94–103, 1988.
[96] Chyu, M.K., Hsing, Y.C., Shih, T.I.-P. & Natarajan, V., Heat transfer contributions ofpins and endwall in pin–fin arrays. ASME Journal of Turbomachinery, 121, pp. 257–263, 1999.
[97] Chyu, M.K., Hsing, Y.C. & Natarajan, V., Convective heat transfer of cubic fin arrays ina narrow channel. ASME Journal of Turbomachinery, 120, pp. 362–367, 1998.
[98] Uzol, O. & Camci, C., Elliptical pin fins as an alternative to circular pin fins for gasturbine blade cooling applications. Part 1: Endwall heat transfer and total pressure losscharacteristics. ASME 2001-GT-232, 2001.
[99] Chyu, M.K., Heat transfer and pressure drop for short pin-fin arrays with pin-endwallfillet. ASME Journal of Heat Transfer, 112, pp. 926–932, 1990.
[100] Metzger, D.E., Shepard, W.B. & Haley, S.W., Row resolved heat transfer variation inpin fin arrays including the effects of non-uniform arrays and flow convergence. ASME86-GT-132, 1986.
[101] Lakshminarayana, B., Fluid Dynamics and Heat Transfer of Turbomachinery, JohnWiley & Sons: New York, 1996.
[102] Wang, H.P., Olson, S.J., Goldstein, R.J. & Eckert, E.R.G., Flow visualisation in a linearturbine cascade of high performance turbine blades. ASME 95-GT-7, 1995.
[103] Daily, D., Design and calculation issues. Aero-thermal Performance of Internal CoolingSystems in Turbomachines, VKI-LS 2000-03, 2000.
[104] Schulenberg, T., Kopper, F. & Richardson, J., An advanced blade design for V84.3 gasturbines. VDI Berichte, 1185, pp. 257–275, 1995,
[105] Schnieder, M., Höcker, R. & von Wolfersdorf, J., Heat transfer and pressure loss in a 180◦-turn of a rectangular, rib-roughened two passage channel. 5thWorld Conf. on ExperimentalHeat Transfer, Fluid Mechanics and Thermodynamics, ExHFT5, Thessaloniki, 2001.
[106] Jennions, I.K., Sommer, T., Weigand, B. &Aigner, M., The GT24/26 low pressure turbine,ASME 98-GT-29, 1998.
www.witpress.com, ISSN 1755-8336 (on-line)
© 2006 WIT PressWIT Transactions on State of the Art in Science and Engineering, Vol 4,

504 Flow Phenomena in Nature
[107] Amro, M., PhD Thesis, Institute of Aerospace Thermodynamics (ITLR), University ofStuttgart, 2004.
[108] Gregg, S.G., Heidegger, N.J. & Mikkelson, R.A., Computational modeling and thermalpaint verification of film-cooling designs for an unshrouded high-pressure turbine blade.ASME 99-GT-330, 1999.
[109] von Wolfersdorf, J., Ott, P. & Weigand, B., Temperature and pressure sensitive coatings.Flow Phenomena in Nature, Vol. 1, pp. 747–766, 2006.
[110] Weigand, B. & Simon, V., Laws of similarity in fluid mechanics. Flow Phenomena inNature, Vol. 1, pp. 20–35, 2006.
www.witpress.com, ISSN 1755-8336 (on-line)
© 2006 WIT PressWIT Transactions on State of the Art in Science and Engineering, Vol 4,


![HIGH SPEED DRAG REDUCTION OPTIMIZATION …...the drag reduction via the aerospike could reach as high as 78% [7]. Most recently, current authors investigated the optimal drag reduction](https://img.dokumen.tips/doc/110x75/5ee35f66ad6a402d666d4885/high-speed-drag-reduction-optimization-the-drag-reduction-via-the-aerospike.jpg)

![Drag reduction by riblets - Fluid Dynamics Lab Home Page · over rough walls, Jiménez [5] viewed drag reduction by riblets as a transitional roughness effect. ... aerodynamics: progress](https://img.dokumen.tips/doc/110x75/5b5a6c2c7f8b9a01748be324/drag-reduction-by-riblets-fluid-dynamics-lab-home-page-over-rough-walls-jimenez.jpg)