Embed Size (px)
Citation preview

DRAFT
1
Privileged and Confidential
3D: FACTS AND FIGURES FOR THEATRICAL
RELEASES

2
3D Theatrical Distribution in the U.S.
• Average MPAA U.S. ticket price: $7.50 (2009)
• Average ticket price premium for non-IMAX 3D
• Today: $3.50
• Projected: $2.50
• Average ticket price for IMAX 3D: $14.58 (roughly a $7 premium) (2009)*
• Studio share of ticket price premium is 45-55%; however, studio pays $0.40 - $0.55 per ticket for glasses
• Theaters pay partial cost of glasses, actual manufacturing costs are $0.50-$0.75 (although recycling programs bringing costs down)
• Theaters also pay RealD $0.50 per admission
Asian Market Data Points
• There are currently about 1,600 Digital 3D screen in Asia, about 350 in Japan
• Until recently, the Asian 3D market was controlled by XpanD (90% share); they require special glasses - Active Polarized - that cost $50.00 to $75.00 each, are battery operated, and reused regularly
• This past year, prior to the release of AVATAR, RealD expanded rapidly through Asia (mostly China), and by the release of AVATAR, they had a 40% share of the market
Motion Picture Group3D Facts & Figures
* Per IMAX
3
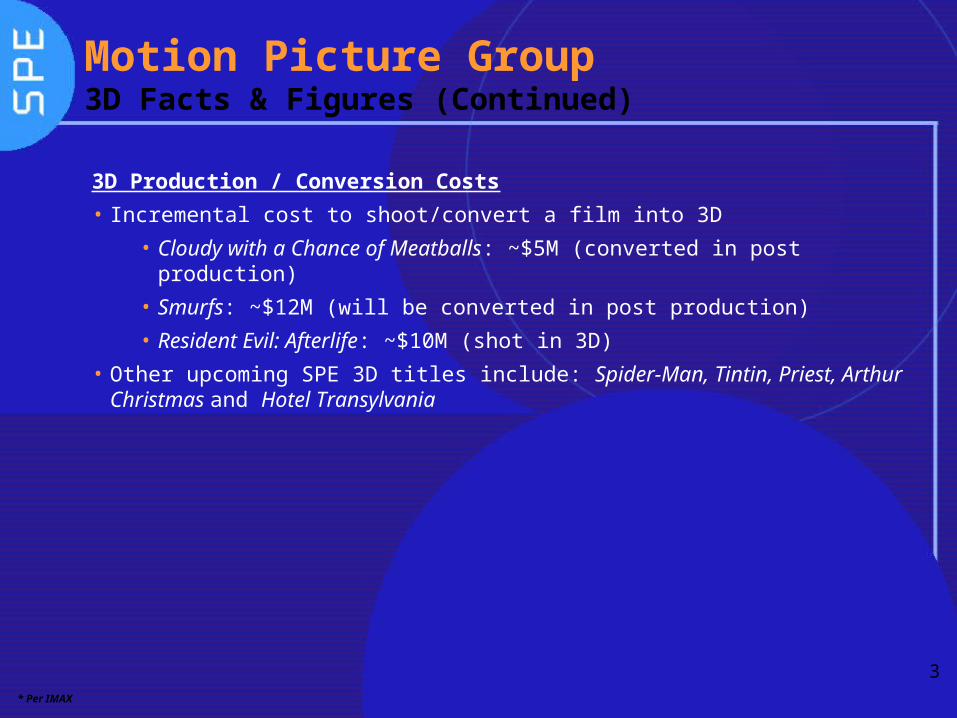
3D Production / Conversion Costs
• Incremental cost to shoot/convert a film into 3D
• Cloudy with a Chance of Meatballs: ~$5M (converted in post production)
• Smurfs: ~$12M (will be converted in post production)
• Resident Evil: Afterlife: ~$10M (shot in 3D)
• Other upcoming SPE 3D titles include: Spider-Man, Tintin, Priest, Arthur Christmas and Hotel Transylvania
Motion Picture Group3D Facts & Figures (Continued)
* Per IMAX
4
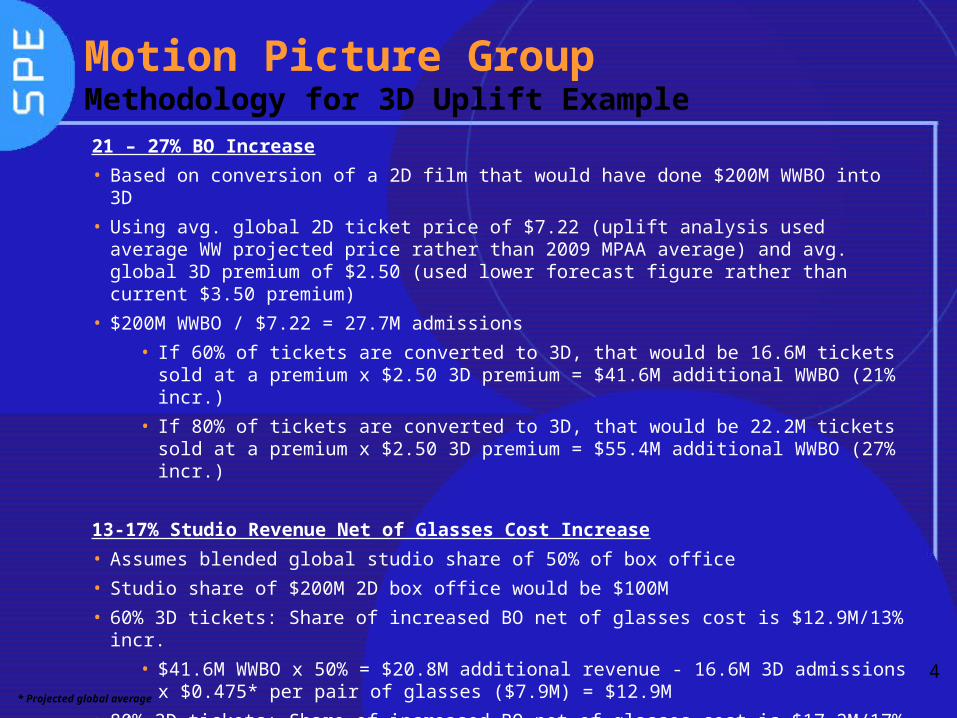
21 – 27% BO Increase
• Based on conversion of a 2D film that would have done $200M WWBO into 3D
• Using avg. global 2D ticket price of $7.22 (uplift analysis used average WW projected price rather than 2009 MPAA average) and avg. global 3D premium of $2.50 (used lower forecast figure rather than current $3.50 premium)
• $200M WWBO / $7.22 = 27.7M admissions
• If 60% of tickets are converted to 3D, that would be 16.6M tickets sold at a premium x $2.50 3D premium = $41.6M additional WWBO (21% incr.)
• If 80% of tickets are converted to 3D, that would be 22.2M tickets sold at a premium x $2.50 3D premium = $55.4M additional WWBO (27% incr.)
13-17% Studio Revenue Net of Glasses Cost Increase
• Assumes blended global studio share of 50% of box office
• Studio share of $200M 2D box office would be $100M
• 60% 3D tickets: Share of increased BO net of glasses cost is $12.9M/13% incr.
• $41.6M WWBO x 50% = $20.8M additional revenue - 16.6M 3D admissions x $0.475* per pair of glasses ($7.9M) = $12.9M
• 80% 3D tickets: Share of increased BO net of glasses cost is $17.2M/17% incr.
• $55.4M WWBO x 50% = $27.7M additional revenue – 22.2M 3D admissions x $0.475* per pair of glasses ($10.5M) = $17.2M
Motion Picture GroupMethodology for 3D Uplift Example
* Projected global average
5
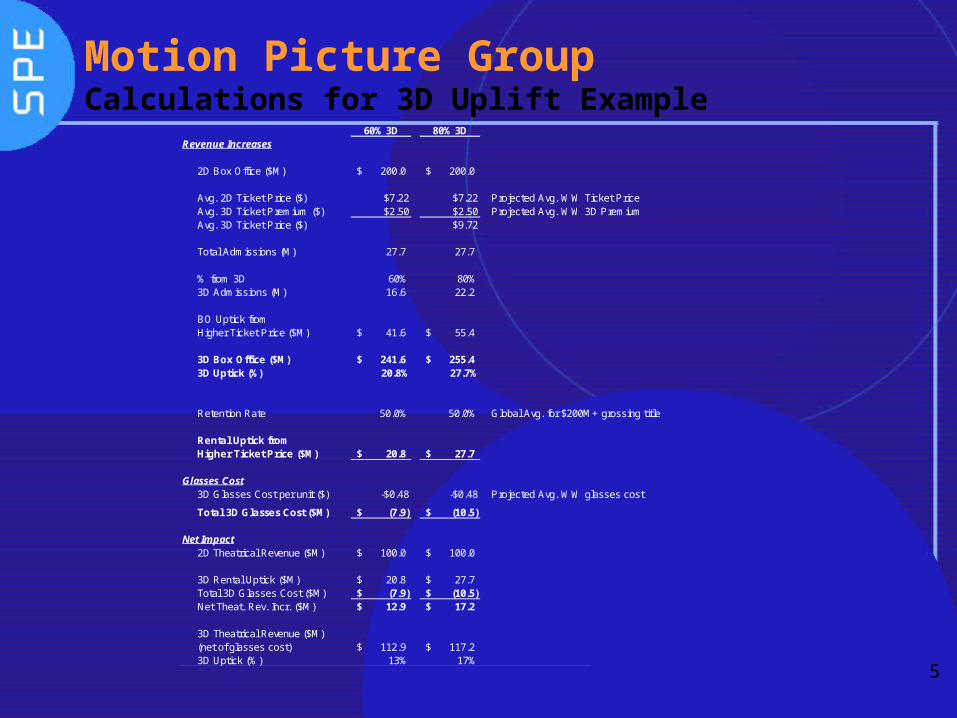
Motion Picture GroupCalculations for 3D Uplift Example
60% 3D 80% 3DRevenue Increases
2D Box Office ($M) 200.0$ 200.0$
Avg. 2D Ticket Price ($) $7.22 $7.22 Projected Avg. WW Ticket PriceAvg. 3D Ticket Premium ($) $2.50 $2.50 Projected Avg. WW 3D PremiumAvg. 3D Ticket Price ($) $9.72
Total Admissions (M) 27.7 27.7
% from 3D 60% 80%3D Admissions (M) 16.6 22.2
BO Uptick from Higher Ticket Price ($M) 41.6$ 55.4$
3D Box Office ($M) 241.6$ 255.4$ 3D Uptick (%) 20.8% 27.7%
Retention Rate 50.0% 50.0% Global Avg. for $200M+ grossing title
Rental Uptick fromHigher Ticket Price ($M) 20.8$ 27.7$
Glasses Cost3D Glasses Cost per unit ($) -$0.48 -$0.48 Projected Avg. WW glasses cost
Total 3D Glasses Cost ($M) (7.9)$ (10.5)$
Net Impact2D Theatrical Revenue ($M) 100.0$ 100.0$
3D Rental Uptick ($M) 20.8$ 27.7$ Total 3D Glasses Cost ($M) (7.9)$ (10.5)$ Net Theat. Rev. Incr. ($M) 12.9$ 17.2$
3D Theatrical Revenue ($M)(net of glasses cost) 112.9$ 117.2$ 3D Uptick (%) 13% 17%
66
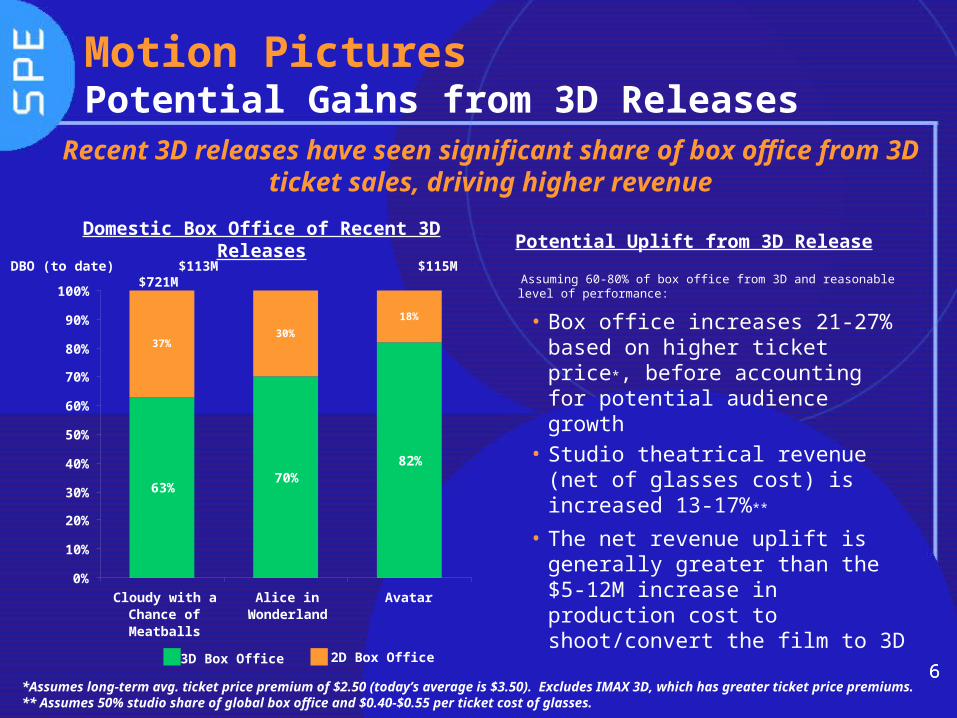
Assuming 60-80% of box office from 3D and reasonable level of performance:
• Box office increases 21-27% based on higher ticket price*, before accounting for potential audience growth
• Studio theatrical revenue (net of glasses cost) is increased 13-17%**
• The net revenue uplift is generally greater than the $5-12M increase in production cost to shoot/convert the film to 3D
Motion PicturesPotential Gains from 3D Releases
Domestic Box Office of Recent 3D Releases
*Assumes long-term avg. ticket price premium of $2.50 (today’s average is $3.50). Excludes IMAX 3D, which has greater ticket price premiums.** Assumes 50% studio share of global box office and $0.40-$0.55 per ticket cost of glasses.
Recent 3D releases have seen significant share of box office from 3D ticket sales, driving higher revenue
DBO (to date) $113M $115M $721M
Potential Uplift from 3D Release
63%70%
82%
37%30%
18%
0%
10%
20%
30%
40%
50%
60%
70%
80%
90%
100%
Cloudy with aChance ofMeatballs
Alice inWonderland
Avatar
3D Box Office 2D Box Office

DRAFT
7
Privileged and Confidential
DIGITAL CINEMA ROLL-OUT

8
Motion Pictures Digital Cinema
Rollout Update
• 23,100 digital screens estimated to be installed worldwide by the end of 2010 with 32,900 projected by 2011o Today, there are over 8,000 digital screens in North America and
17,000 screens worldwide
• Easier access to capital has allowed deployment entities to gain financing for the installation of the digital screens o In North America, DCIP has received financing and will begin
rollout with AMC, Regal and Cinemark (comprises > 50% of the market)
• Digital 3D is now the standard with 16 3D feature releases from Hollywood slated for next year (SPE will be releasing Kenny Chesney Summer in 3D in April 2010, Resident Evil: Afterlife in September 2010 and Priest in January 2011)o Today, there are approx. 3,500 digital 3D screens in North
America and 8,300 digital 3D screens worldwide
9
Motion Pictures Digital Cinema
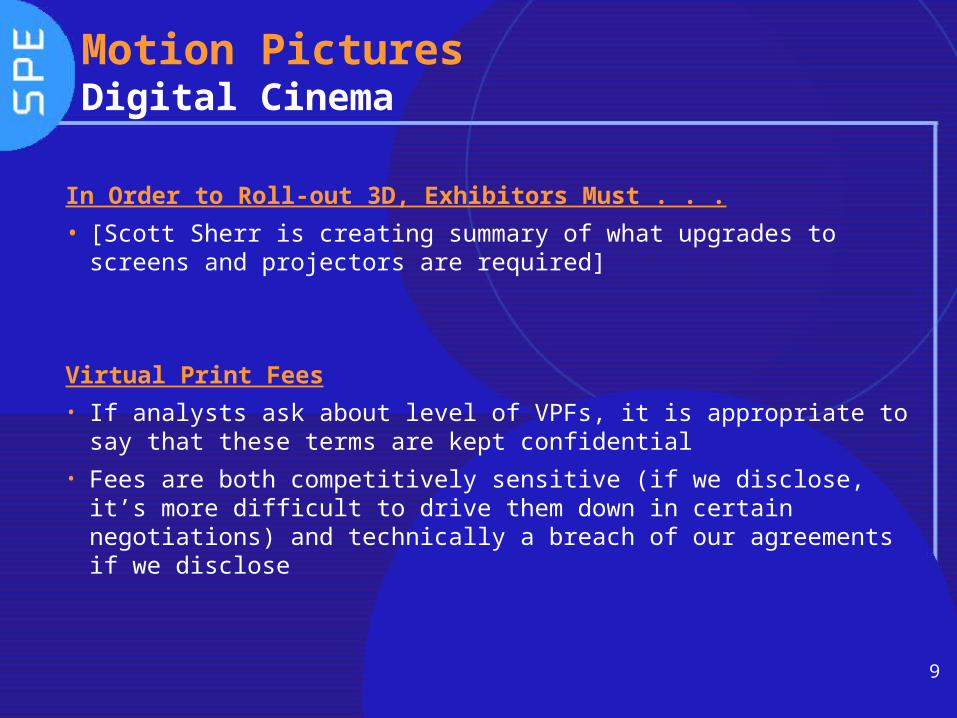
In Order to Roll-out 3D, Exhibitors Must . . .
• [Scott Sherr is creating summary of what upgrades to screens and projectors are required]
Virtual Print Fees• If analysts ask about level of VPFs, it is appropriate to say that these
terms are kept confidential• Fees are both competitively sensitive (if we disclose, it’s more
difficult to drive them down in certain negotiations) and technically a breach of our agreements if we disclose

DRAFT
page 10
3D exhibition of feature films has successfully driven recent box office performance worldwide
“[3D has]…moved out of its adolescence to just be now a part of the cinematic art, used by serious filmmakers…I’m going to make all my movies in 3D, no matter the subject” – James Cameron, December 21. 2009
Studios have already had various successful titles and are aggressively planning for 3D releases of future titles
“[Alice in Wonderland’s]…3D component boosted the overall performance in a big way. [Alice]… begins an onslaught of 3D product entering the market in the coming months, with Paramount’s toon How to Train Your Dragon set to launch March 26, followed by Warner Bros.’ Clash of the Titans on April 2.” – Daily Variety, March 8, 2010
With the continued rollout of digital screens and growth in 3D screens, domestic exhibitors have embraced this new product and are actively looking to be able to carry at least two simultaneous 3D releases by 2011
As Sony considers various 3D release opportunities, several financial considerations must be examined
% of gross box office from 3D
3D ticket upcharge
Cost of 3D eyewear
Digital production and/or conversion costs
Reduced distribution expenses
Executive Summary
Current Digital 3D LandscapeComplexes
3+ Screens at a Complex
30%
17%
620
344
2 Screens Only at a Complex
54%1,1141 Screen Only at a Complex
%Locations
42%1,004
42%1,004
16%383
%Locations
100%2,079TOTAL 100%2,391
3,522TOTAL 3D Screens 5,905
Digital 3D Projection
As of Janaury 2010 December 2010# of Digital 3D Screens at a Complex
North America Digital 3D Overview
DRAFT
page 11
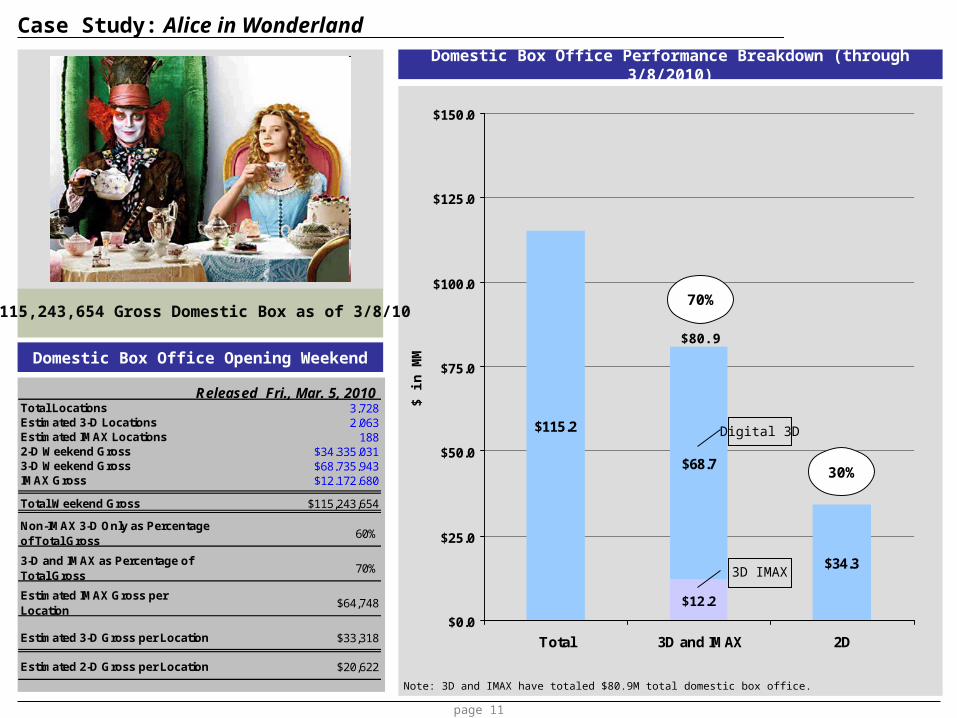
Case Study: Alice in Wonderland
Domestic Box Office Performance Breakdown (through 3/8/2010)
Domestic Box Office Opening Weekend
$115,243,654 Gross Domestic Box as of 3/8/10
$12.2
$115.2
$68.7
$34.3
$0.0
$25.0
$50.0
$75.0
$100.0
$125.0
$150.0
Total 3D and IMAX 2D
$ in
MM
70%
30%
3D IMAX
Digital 3D
Note: 3D and IMAX have totaled $80.9M total domestic box office.
$80.9
Released Fri., Mar. 5, 2010Total Locations 3,728Estimated 3-D Locations 2,063Estimated IMAX Locations 1882-D Weekend Gross $34,335,0313-D Weekend Gross $68,735,943IMAX Gross $12,172,680
Total Weekend Gross $115,243,654
Non-IMAX 3-D Only as Percentage of Total Gross
60%
3-D and IMAX as Percentage of Total Gross
70%
Estimated IMAX Gross per Location
$64,748
Estimated 3-D Gross per Location $33,318
Estimated 2-D Gross per Location $20,622

DRAFT
page 12
Case Study: Avatar
Domestic Box Office Performance Breakdown (through 3/8/2010)
Domestic Box Office Opening Weekend
$720,607,444 Gross Domestic Box as of 3/8/10
$127.1
$720.6 $462.9
$130.6
$0.0
$100.0
$200.0
$300.0
$400.0
$500.0
$600.0
$700.0
$800.0
Total 3D and IMAX 2D
$ in
MM
82%
18%
3D IMAX
Digital 3D
Note: 3D and IMAX have totaled $590.0M total domestic box office.
$590.0
Released Fri., Dec.18, 2009Total Locations 3,452Estimated 3-D Locations 2,023Estimated IMAX Locations 1782-D Weekend Gross $21,362,4363-D Weekend Gross $44,357,253IMAX Gross $9,495,072
Total Weekend Gross $75,214,761
Non-IMAX 3-D Only as Percentage of Total Gross
59%
3-D and IMAX as Percentage of Total Gross
72%
Estimated IMAX Gross per Location
$53,343
Estimated 3-D Gross per Location $21,926
Estimated 2-D Gross per Location $14,949

DRAFT
page 13
Case Study: Cloudy with a Chance of Meatballs
Domestic Box Office Performance Breakdown (through 12/11/2009)
Domestic Box Office Opening Weekend
$113,076,648 Gross Domestic Box as of 12/11/09
$8.9
$113.1
$62.0
$42.2
$0.0
$25.0
$50.0
$75.0
$100.0
$125.0
Total 3D and IMAX 2D
$ in
MM
63%
37%
3D IMAX
Digital 3D
Note: 3D and IMAX have totaled $70.9M total domestic box office.
$70.9
Released Fri., Sep. 18, 2009Total Locations 3,119Estimated 3-D Locations 1,675Estimated IMAX Locations 982-D Weekend Gross $9,474,2393-D Weekend Gross $17,860,323IMAX Gross $2,348,850
Total Weekend Gross $29,683,412
Non-IMAX 3-D Only as Percentage of Total Gross
60%
3-D and IMAX as Percentage of Total Gross
68%
Estimated IMAX Gross per Location
$23,968
Estimated 3-D Gross per Location $10,663
Estimated 2-D Gross per Location $6,561
DRAFT
page 14
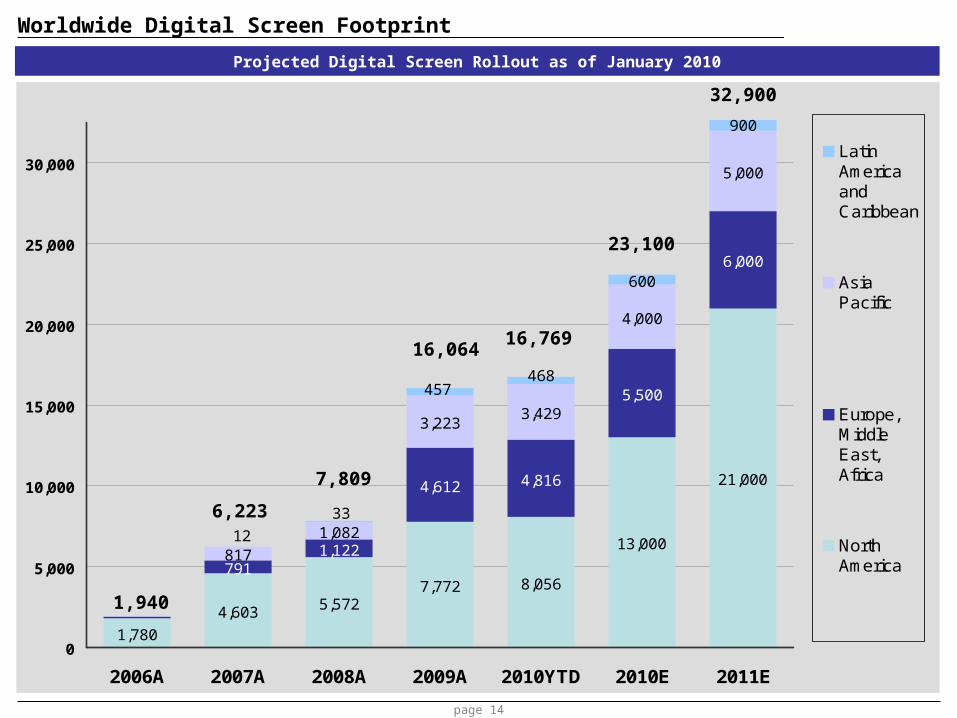
Worldwide Digital Screen Footprint
5,5727,772 8,056
13,000
21,000
7911,122
4,612 4,816
5,500
6,000
817
1,082
3,2233,429
4,000
5,000
600
900
1,780
4,603
468
12
33
457
0
5,000
10,000
15,000
20,000
25,000
30,000
2006A 2007A 2008A 2009A 2010YTD 2010E 2011E
LatinAmericaandCaribbean
AsiaPacific
Europe,MiddleEast,Africa
NorthAmerica
32,900
23,100
16,76916,064
7,809
6,223
1,940
Projected Digital Screen Rollout as of January 2010

DRAFT
page 15
3342
6000
93002511
5100
7900
994
2500
3700
337
500
700
-
5,000
10,000
15,000
20,000
25,000
2009 2010 E 2011 E
USA/Canada EMEA Asia/Pacific Latin America
Worldwide 3D Screen Projections as of January 2010
7,184
21,600
14,100
Source: Vendor-based footprint data; SPR/SPRI projections.
Worldwide 3-D screens will continue to grow over the next few years
DRAFT
page 16
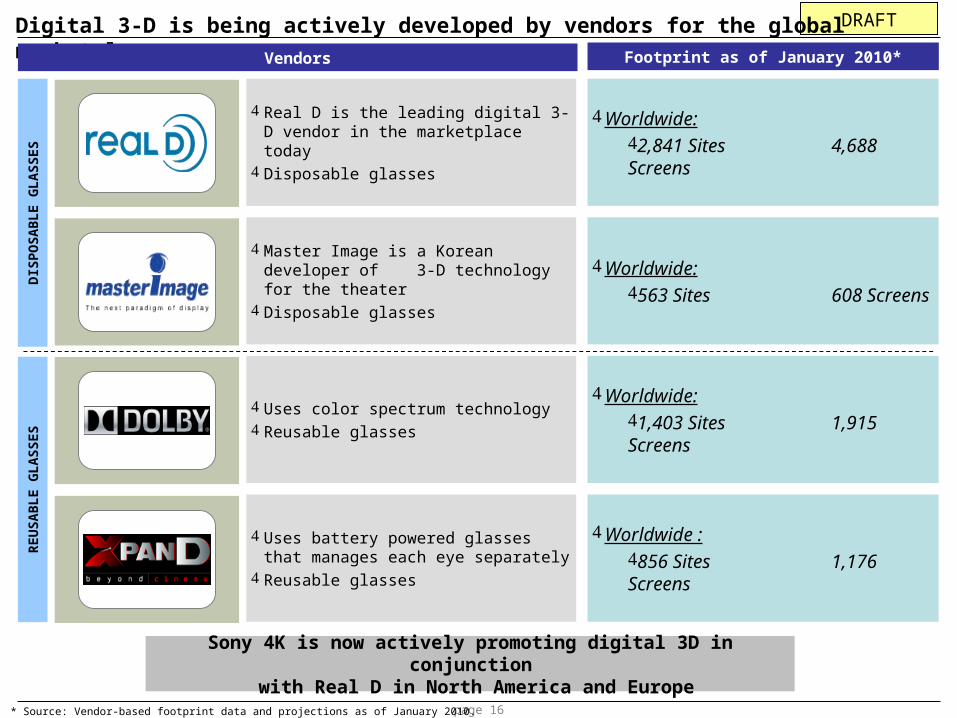
Digital 3-D is being actively developed by vendors for the global marketplace
Real D is the leading digital 3-D vendor in the marketplace today
Disposable glasses
Footprint as of January 2010*Vendors
Worldwide:2,841 Sites 4,688 Screens
DIS
PO
SA
BL
E G
LA
SS
ES
RE
US
AB
LE
GL
AS
SE
S
Master Image is a Korean developer of 3-D technology for the theater
Disposable glasses
Worldwide:563 Sites 608 Screens
Uses color spectrum technology Reusable glasses
Worldwide:1,403 Sites 1,915 Screens
Uses battery powered glasses that manages each eye separately
Reusable glasses
Worldwide :856 Sites 1,176 Screens
Sony 4K is now actively promoting digital 3D in conjunction with Real D in North America and Europe
* Source: Vendor-based footprint data and projections as of January 2010.

DRAFT
17
Privileged and Confidential
NETWORK GROWTH AREAS
18
Networks – Growth Opportunities(Per MRP with Addition of 3D Network)
• 3D Network in US with Discovery and IMAX
• Animax/AXN – full penetration in Korea
• India sports channel
• TV1-Hallmark – Australia swap
• SET HD – US
• SET Max – Italy channel
• GXT – Italy channel
• Tamil channel
• MGM channels
• Cine Latino – US/Latin Spanish language movie channel


![Hsieh, Cheng-Kang arXiv:1810.08189v2 [cs.CV] 22 Oct 2018 · and marketing and distribution. MERLIN, the recommendation system for theatrical releases built at 20th Century Fox, is](https://img.dokumen.tips/doc/110x75/5e21b830849d586d166caccb/hsieh-cheng-kang-arxiv181008189v2-cscv-22-oct-2018-and-marketing-and-distribution.jpg)