Embed Size (px)
Citation preview

AMSAMeat Color MeasurementGuidelinesRevised December 2012
American Meat Science Associationhttp://www.m eatscience.org


AMSAMeat Color
MeasurementGuidelines
Revised December 2012
American Meat Science Association201 West Springfi eld Avenue, Suite 1202
Champaign, Illinois USA 61820800-517-2672
[email protected]://www.m eatscience.org

iii

iii
Technical Writing Committee .................................................................................................................... v
Preface .............................................................................................................................................................. vi
Section I: Introduction ................................................................................................................................. 1
Section II: Myoglobin Chemistry ............................................................................................................... 3A. Fundamental Myoglobin Chemistry ................................................................................................................ 3B. Dynamics of Myoglobin Redox Form Interconversions ........................................................................... 3C. Visual, Practical Meat Color Versus Actual Pigment Chemistry ........................................................... 5D. Factors Affecting Meat Color ............................................................................................................................... 6E. Muscle Metabolism and Meat Color ................................................................................................................. 7F. Cooked Meat Color ................................................................................................................................................... 8G. Cured Meat Color ..................................................................................................................................................... 8H. Iridescence ...............................................................................................................................................................10
Section III: Physics of Color and Light ...................................................................................................11A. Introduction .............................................................................................................................................................11B. Color Perception of Meat ....................................................................................................................................15C. The Physics of Light and Instrumental Color Measurements .............................................................17
Section IV: Visual Appraisal Principles ................................................................................................19A. Introduction .............................................................................................................................................................19B. Types of Visual Panels ..........................................................................................................................................19C. Conducting Research Using Human Panelists ...........................................................................................19D. Summary ...................................................................................................................................................................23
Section V: Display Guidelines for Meat Color Research ..................................................................25A. Purpose of Display Studies ................................................................................................................................25B. Packaging Materials Affect Meat Appearance ............................................................................................25C. Product Handling and Storage Should Mimic Real World Parameters ...........................................26D. Lighting Types and Intensity Affect Meat Appearance ..........................................................................26E. Display Temperature Affects Color Life ........................................................................................................28F. Meat Color Evaluated Against Time to Determine Meat Color Stability .........................................29G. Configuring a Meat Display Case .....................................................................................................................29
Section VI: Guidelines, Visual Meat Color Measurement ................................................................31A. Selecting Panel Type .............................................................................................................................................31B. Screening and Training of Panelists ...............................................................................................................31C. Standardization of Significant Factors ..........................................................................................................31D. Conducting a Pretrial ...........................................................................................................................................31
contents

iv v
E. Selecting Appropriate Scoring Scales ............................................................................................................31F. Using Reference Aids and Pictures ..................................................................................................................31G. Sample Thickness ..................................................................................................................................................33H. Packaging Format ..................................................................................................................................................33I. Panelist Viewing Angle..........................................................................................................................................33J. Rotating of Packages During Display ..............................................................................................................33K. Objective Measures of Surface and Subsurface Pigments ....................................................................33L. Display Case Temperatures and Defrost Cycles ........................................................................................33M. Lighting Type and Intensity ..............................................................................................................................34N. Visual Parameters to Report .............................................................................................................................34
Section VII: Visual-Color Scoring Scales ...............................................................................................35A. Hedonic Scales for Consumer Panels ............................................................................................................36B. Descriptive (Psychometric) Scales for Trained Panels ..........................................................................36C. Meat Display Color Stability (Whole Muscle, Not Ground) ..................................................................38D. Ground Meat Color ................................................................................................................................................41E. Cooked Meat Color .................................................................................................................................................42F. Cured Meat Color ....................................................................................................................................................43G. Other Scales Associated with Meat Color Evaluation .............................................................................44
Section VIII: Guidelines, Instrumental Meat Color Measurement ...............................................45A. Instrument Selection ............................................................................................................................................45B. Illuminant Selection ..............................................................................................................................................45C. Degree of Observer Selection ............................................................................................................................46D. Aperture Size Selection .......................................................................................................................................46E. Instrument Standardization ..............................................................................................................................46F. Sample Thickness and Uniformity ..................................................................................................................47G. Protecting the Aperture Port ............................................................................................................................47H. Two-Toned Versus Discoloration Pattern ....................................................................................................47I. Avoiding Pillowing ..................................................................................................................................................48J. Calculating Myoglobin Redox Forms ...............................................................................................................48K. Downloading Data .................................................................................................................................................48L. Ratios for Characterizing Color ........................................................................................................................48M. Objective Measures of Surface and Subsurface Pigments ...................................................................48N. Pitfalls of Instrumental Color Measurement..............................................................................................50O. Reporting of Instrumental Details ..................................................................................................................52
Section IX: Equations for Quantifying Myoglobin Redox Forms on Fresh Meat ......................53A. The K/S Method of Isobestic Wavelengths .................................................................................................53B. Creating “100%” Myoglobin Redox Forms for Reference Standards ...............................................54C. Calculating Myoglobin Forms via K/S Ratios .............................................................................................56D. Calculating Myoglobin Forms via Selected Wavelengths ......................................................................57
Section X: Laboratory Procedures for Studying Myoglobin and Meat Color ............................59A. Fresh Meat Studies ................................................................................................................................................59B. Cooked Meat Studies ............................................................................................................................................65

v
C. Cured Meat Studies ................................................................................................................................................66D. Packaging Measurements ...................................................................................................................................68E. Effect of Lipid Oxidation on Meat Color (Fresh, Cooked, Cured) .......................................................70F. Fundamental Research Methods ......................................................................................................................70
Section XI: Details of Analytical Analyses Related to Meat Color .................................................73A. pH of Prerigor Meat ..............................................................................................................................................74B. pH of Postrigor Meat or Cooked Products ...................................................................................................75C. Total Myoglobin (as DMb) of Fresh or Cooked Meat ...............................................................................76D. Total Myoglobin (Isobestic Point Assay) in Fresh or Cooked Meat ..................................................78E. Nitrosoheme and Total Heme Content of Cured Meats .........................................................................80F. Nitrosoheme and Total Heme Content of Small Samples ......................................................................83G. Isolating Myoglobin for In Vitro Studies ......................................................................................................84H. Isolating Mitochondria from Beef Skeletal Muscle .................................................................................86I. Oxygen Consumption of Intact Muscle or Ground Meat .........................................................................89J. Metmyoglobin Reducing Capacity of Intact or Ground Meat ................................................................91K. Reduction of Metmyoglobin by Skeletal Muscle Extracts .....................................................................93L. Detecting Reflectance of Denatured Globin Hemochromes .................................................................95M. Nitrite Analysis of Cured Meat ........................................................................................................................96N. Nitrate Analysis of Cured Meat and Ingredients ......................................................................................98O. TBARS for Oxidative Rancidity—Rapid, Wet Method .........................................................................100P. TBARS for Oxidative Rancidity—Distillation Method ..........................................................................101
Section XII: Pictorial Color Guides ...................................................................................................... 103A. Beef ...........................................................................................................................................................................103B. Pork ...........................................................................................................................................................................104C. Lamb .........................................................................................................................................................................104D. Processed Meats ..................................................................................................................................................104E. Guides and Figures Related to Meat Color ...............................................................................................105
Section XIII: Photography of Meat ....................................................................................................... 107A. Introduction ..........................................................................................................................................................107B. Packaging ................................................................................................................................................................107C. Lighting and Background Conditions .........................................................................................................107D. Camera and Lens Selection .............................................................................................................................108E. Other Considerations.........................................................................................................................................108
Section XIV: Glossary ............................................................................................................................... 109
Section XV: Cited References ................................................................................................................. 117

vi vii
technical Writing committee
Co-chairs: Melvin Hunt, Kansas State University Andy King, USDA Meat Animal Research Center
Committee Members: Shai Barbut, University of Guelph Jim Claus, University of Wisconsin Daren Cornforth, Utah State University Dana Hanson, North Carolina State University Gunilla Lindahl, Swedish Agricultural University Richard Mancini, University of Connecticut Andy Milkowski, University of Wisconsin Anand Mohan, University of Georgia Fred Pohlman, University of Arkansas Chris Raines, Pennsylvania State University Mark Seyfert, Cargill Meat Solutions Oddvin Sørheim, Nofima, Ås, Norway Surendranath Suman, University of Kentucky Melissa Weber, Cargill Meat Solutions
Technical Assistance: Kjell J. Merok, Nofima, Ås, Norway Poulson Joseph, University of Kentucky Ranjith Ramanathan, University of Connecticut
American Meat Science Association201 East Springfield Avenue, Suite 1202
Champaign, Illinois USA 61820800-517-2672
[email protected]://www.meatscience.org
acknowledgments
The committee respectfully acknowledges the permission to use digital photographs and graphics from HunterLab and Konica-Minolta and the excellent editing by Nora Ransom.

vii
Preface
The American Meat Science Association published the original Guidelines for Meat Color Measurement in 1991 as a rather obscure document in the 44th Proceedings of the Recipro-cal Meat Conference. Despite humble beginnings, the Guide eventually found its way into the national and international meat science literature and has become a frequently used and cited Guide for color measurements of muscle foods.
The need for such a document has not diminished, though knowledge of what influences meat color and meat color measurements has advanced greatly in the intervening years. Color researchers with considerable expertise have graciously offered their advice on the essential information and techniques needed for meat color research. Moreover, contribu-tors have identified details of data collection that must be reported so that scientists can ac-curately interpret reported meat color data. Thus, the revised Guide has been developed to assist new and experienced researchers design protocols for collecting sound color data. We trust that this updated and expanded version will continue to be a useful reference for those studying skeletal muscle pigment chemistry and meat color.
Finally, we encourage all involved with meat science research to consider using the techniques suggested in this Guide and to report the details characterizing their data collection in all research communications and journal submissions.
M. C. Hunt and D. A. King
Readers are encouraged to send any errors, omissions or suggestions to AMSA at [email protected].


1
SECTION I
Introduction
Consumers routinely use product color and appearance to select or reject products, and sup-pliers of muscle food products must also create and maintain the desired color attributes. The color of muscle foods revolves around myoglobin, the primary red pigment in meat. However, ultimate perceived color is affected by many factors such as species, animal genet-ics and nutritional background, postmortem changes in muscle (especially the dynamics of pH and meat temperature decline), inter- and intramuscular effects, postmortem storage temperatures and time, and a whole host of processing (including antimicrobial interven-tions), packaging, and display and lighting variables.
Color evaluation is an essential part of meat research, product development, and trouble-shooting of processing problems. When done properly, both visual and instrumental ap-praisals of color are powerful and useful research tools for meat scientists. However, these evaluations must be conducted using carefully designed procedures to avoid artifacts or biased data. Although not everyone needs expert knowledge of myoglobin chemistry, color evaluators should have a general understanding of the biochemical and physical parameters regulating color and color perception. Thus, this Guide is intended for use in planning and executing investigations involving meat color.
Each section of this expanded and updated Guide can be viewed as a “stand alone” de-scription of various important factors affecting meat color and color measurement, although a thorough review of the entire set of guidelines is strongly suggested to those new to meat color research. Users should be able to pick and choose the background information needed to ensure their efforts result in reliable and accurate appraisals of color. Many practical “dos” and “don’ts” for instrumental and visual color measurement should help researchers work through the in�inite number of combinations of factors that affect color. Simply put, complete color evaluations usually cannot be done with only one scale, sampling technique, or instru-mental measurement.
The interaction of myoglobin pigment chemistry with the physics of light absorbance and re�lectance becomes rather complicated as it determines a product’s color. Reliable measure-ments of color and color stability are also complex and often misused in routine work. Thus, these guidelines provide suggestions for researchers needing to measure color of muscle foods. In some instances, these guidelines can be used as a step-by-step process to appraise color measurement; but for most projects, investigators must integrate the principles de-tailed in these guidelines into their experimental design to address the speci�ic question of interest.
We hope that this Guide will bring some consistency to how research papers report color data. Tapp et al. (2011) reported many inconsistencies and even total omission of protocol

2 Color Guidelines Handbook
that the AMSA Guidelines Committee considers “essential” data in studies using instrumental evaluation of color. Tapp et al.’s survey of 1068 published (1998 to 2007) manuscripts found that 73.6% of researchers failed to report aperture size, 52.4% number of scans per sample, 48.9% Illuminant used, 65.7% angle of observation, and nearly 3% failed to report the type of instrument used. Up to 8.4% did not indicate what method they used to calculate their tris-timulus values (such as CIE L*a*b* versus Hunter Lab) by mentioning the universally accepted revisions of the 1976 Commission Internationale de l’Eclairage for the calculation of CIE L*a*b*. Interestingly, only 24.8% of the manuscripts took advantage of the calculated color parameter known as hue angle and 25.5% of saturation index.
Similar inconsistencies likely also exist for the reporting of visual color evaluations. This Guide should encourage more uniform reporting of pertinent experimental details and sample properties for studies involving visual and/or instrumental color evaluation.

3
SECTION II
Myoglobin Chemistry
A. Fundamental Myoglobin ChemistryMyoglobin is the water-soluble protein responsible for meat color. Within the 8 α-helices (of-ten labeled A–H) of myoglobin, a prosthetic heme group containing a centrally located iron atom is positioned in the protein’s hydrophobic core. Of the six bonds associated with this iron atom, four connect iron to the heme ring, the 5th attaches to the proximal histidine-93, and the 6th site is available to reversibly bind ligands including diatomic oxygen, carbon monoxide, water, and nitric oxide. The ligand present at the 6th coordination site and the valence state of iron determine meat color via four chemical forms of myoglobin, deoxymyo-globin (DMb), oxymyoglobin (OMb), carboxymyoglobin (COMb), and metmyoglobin (MMb); see Figure 2.1.
Deoxymyoglobin results in a dark purplish-red or purplish-pink color typical of the interior color of fresh meat and that in vacuum packages. Deoxymyoglobin contains ferrous (Fe2+) iron with a vacant (no ligand attached) 6th coordination site. To maintain DMb, very low oxygen tension (<1.4 mm Hg) within vacuum packages or the interior of muscle is necessary. Oxygenation of DMb forms a bright-red color via the formation of OMb, which has diatomic oxygen attached to the 6th coordination site of ferrous iron (Fe2+). The oxygen ligand also interacts with the distal histidine-64, producing a more compact protein structure than DMb, which has no ligand present to link iron to the distal histidine. Carboxymyoglobin formation occurs when carbon monoxide attaches to the vacant 6th position of DMb, producing a stable bright-red color when the environment is devoid of oxygen. Atmospheres containing oxygen (albeit concentration dependent) will result in the conversion of carboxymyoglobin to either OMb or MMb. Metmyoglobin is the oxidized tan to brown colored form of myoglobin and it contains ferric iron (Fe3+). Typically, MMb forms easily at low concentrations of oxygen (<7 mm Hg or about 1 to 2% oxygen). Water is the ligand at the 6th position of the iron in MMb. Digital photos of DMb, OMb, COMb, and MMb are available on the AMSA website.
B. Dynamics of Myoglobin Redox Form InterconversionsMyoglobin oxygenation or blooming (reaction 1 in Figure 2.1) depends on time, tempera-ture, pH, and competition for oxygen by mitochondria. More specifically, the competition for oxygen between myoglobin and mitochondria determines oxygen penetration beneath the meat’s surface, which significantly affects the intensity of surface color. Partial pressures of oxygen greater than that in the atmosphere will facilitate a thicker OMb layer on and just

4 Color Guidelines Handbook
below the meat’s surface. Under anaerobic conditions, DMb will also turn red (reaction 5) when exposed to CO; this reaction is reversible, but the forward reaction is favored.
Deoxygenation of OMb to DMb (reaction 3 of Figure 2.1) is favored under low-oxygen partial pressures that occur when dissolved oxygen in muscle tissue is consumed by various reactions, including mitochondrial respiration. Re-blooming may occur immediately if oxygen re-unites with the DMb. However, DMb is susceptible to oxidation by oxygen radicals and reactive oxygen species (mainly hydrogen peroxide), forming MMb (the upper, right branch of reaction 3). This reaction occurs most rapidly at oxygen partial pressures of <7 mm Hg, because at these very low oxygen concentrations, there is not enough oxygen to bind to all the available DMb. Thus, there is plenty of DMb to react with hydrogen peroxide. At oxygen partial pressures >7 mm Hg, there is more oxygen to bind to DMb; thus, there is less DMb available to react with hydrogen peroxide. In effect, high OMb levels inhibit MMb formation.
Thermodynamically, OMb is resistant to oxidation to MMb; thus, reaction 2 is unlikely. The rapid browning that often occurs in meat seems to contradict this chemistry, but the origin of MMb is through the deoxygenation reaction of OMb to DMb, which can be rapidly oxidized to MMb. Under aerobic conditions, metal ions (iron, copper) stimulate formation of oxygen radicals from diatomic oxygen leading to MMb formation. Metal chelators (such as citrate, phosphates, etc.) inhibit or delay MMb formation. Radical scavenging antioxidants (TBHQ, BHT, BHA, vitamin E, spice extracts, and plant polyphenols) also slow MMb formation.
Oxidation of ferrous DMb to ferric MMb causes brown discoloration. MMb formation tends to initiate beneath the surface between the superficial OMb and interior DMb where oxygen partial pressure is not high enough to oxygenate all available DMb. Thus, some DMb is available to react with oxygen radicals, forming MMb. Hydrogen peroxide and oxygen radicals
Figure 2.1. Schematic of the interconversions of myoglobin redox forms in fresh meat. Courtesy of Drs. M. C. Hunt, Kansas State University and D. P. Cornforth, Utah State University.

Section II: Myoglobin Chemistry 5
are continually present in aerobic conditions because they are by-products of mitochondrial metabolism. The thin subsurface layer of MMb thickens as MMb concentration increases. Gradually, the surface OMb layer becomes thinner as the underlying MMb band thickens, encroaches, and replaces the OMb layer to the point that visually, the surface color changes from bright red to dull red to brown. Conditions that delay the appearance of subsurface MMb include low temperature, high pH, antioxidant capacity, and greater reducing activity. MMb reduction influences meat color stability by regenerating ferrous myoglobin. However, this reaction depends on oxygen scavenging, reducing enzymes, and the NADH pool, all of which are limited and continually depleted in postmortem muscle. MMb reduction by endogenous reducing systems in meat may offer a critical strategic approach to decrease MMb formation and increase fresh meat color shelf life.
Enzymatic and non-enzymatic processes can reduce MMb to DMb (reaction 4); this reaction is critical to meat color stability. Numerous extrinsic and intrinsic factors affect this reaction, but oxygen consumption, MMb reducing activity (MRA), and the postmortem pool of NADH are significant variables in the extension of color-life of meat. Research indicates that the addition of various glycolytic and Krebs cycle intermediates like succinate, lactate, and malate can regenerate reducing equivalents and extend color stability.
C. Visual, Practical Meat Color Versus Actual Pigment Chemistry
In the meat industry, meat color chemistry can be confusing because visual observations of color change differ somewhat from the chemical pathways described in Section IIB. Industry practi-tioners and meat scientists conducting research with meat and meat products usually see brown MMb forming directly from bright red OMb. Thus, it is sometimes difficult to put the principles shown in Figure 2.1 into practice, especially when trouble shooting meat color problems. In par-ticular, Figure 2.1 shows that purple DMb is an intermediate in the conversion of OMb to MMb, but this is seldom observed in practice. Rather, Figure 2.2, reaction 2a shows that bright red OMb changes directly to brown MMb, without any visual development of purple DMb.
1. How may this apparent contradiction between the chemical and visual pathways be reconciled? The answer lies in careful observation of the changes occurring at and beneath the meat’s surface. Fresh-cut meat surfaces are purple (DMb) because of the absence of oxygen. After several minutes in air, the meat surface is bright red (OMb, reaction 1 of Figure 2.2). A cross-section of the meat would reveal that the red surface layer is <1 mm thick, and the deeper muscle tissue is purple. After several hours the red surface layer is typically 2 to 3 mm thick (thicker in muscles with low oxygen consumption and thinner in muscles with high oxygen consumption). After 1 to 3 days at 2 to 4°C, a thin brown band of brown MMb becomes apparent, just below the OMb band. As previously explained, the brown band develops due to reaction of DMb with oxygen radicals forming MMb. Because MMb is usually formed more rapidly (reaction 3 of Figure 2.1) than the reverse reaction 2b (MMb conversion to DMb), MMb concentration increases with time. By several days of storage or display, the thickness of the surface OMb layer decreases as the MMb layer progressively moves toward the surface, which makes the OMb layer to appear more dull and dim. Eventually the MRA of the OMb layer is depleted and the MMb layer reaches the surface with total discoloration.

6 Color Guidelines Handbook
2. How is it known that DMb was formed as an intermediate in the browning reaction? Metmyoglobin formation is much slower in 70 to 80% oxygen compared with air (21% oxygen). Thus, the OMb cannot react with oxygen radicals to form MMb. Also there is dynamic disassociation equilibrium where OMb is continually converted to DMb + oxygen and vice versa. In the brown MMb band where oxygen levels are low, some DMb has re-associated with oxygen radicals instead of oxygen, causing fairly rapid oxidation of DMb to MMb.
3. If DMb is formed, why does the surface color change directly from red to brown, with no purple intermediate? The answer lies in the fact that purple DMb formation is obscured by the overlying red OMb layer during the first 1 to 3 days of storage or display and later by the increasing thickness of the MMb layer. Furthermore, in the surface OMb layer, the small amounts of DMb formed by equilibrium dissociation are rapidly converted back to OMb, due to the excess of oxygen near the surface.
4.HowdoesMMbchangetopurpleDMbaftersufficientvacuum(anaerobic)storage?First, the thin brown MMb band develops because of vacuum removal of some, but not all oxygen. The low oxygen level at the meat surface favors browning, as previously explained. The purple DMb becomes apparent only after the overlying red OMb and brown MMb levels disappear. Oxymyoglobin levels go to zero mainly due to muscle mitochondrial oxygen consumption. MMb levels go to zero due to somewhat slow enzymatic or non-enzymatic MMb reduction to DMb. It is well known that color stable muscles do this more easily than color unstable muscles that may only partially convert MMb to DMb.
The temperature optima for OMb preservation or DMb formation lead to different recommendations for storage temperature. For instance, OMb is most stable at low temperature (−1 to 2°C). However, DMb will develop more quickly in the OMb-MMb interface area of vacuum packaged meats if held at warmer temperatures (3 to 4°C or higher) for several hours, to stimulate mitochondrial oxygen consumption and MMb reduction reactions 2a and 2b of Figure 2.2.
Meat aerobically packaged in modified atmospheres will also turn brown but at a variable rate depending on muscle, postmortem age, especially warmer temperatures, and other retail display conditions. Bacterial growth can also affect reactions 2b and 3. Reactions 3 and 4 proceed as described in the previous section.
5. Why confuse the issue with two fresh color triangles? In practice, separating the visual conversion of OMb to DMb as shown in Figure 2.2 with an intermediate formation of MMb allows industry to more easily manage color problems because it separates the required chemistry into two critical, practical reactions where MMb formation (2a) always seems to occur, but MMb reduction (2b) is often problematic and requires special attention to processing practices.
D. Factors Affecting Meat ColorThe literature clearly documents that many factors affect meat color. Extrinsic factors such as animal genetics, gender, age, diet energy density, time-on-feed, seasonality, ante mortem stress, carcass weight, many postmortem conditions (method of immobilization, several cooler pa-rameters affecting rate of chilling, carcass spacing and alignment, scalding and singing, criteria for carcass electrical stimulation, and application of antimicrobial interventions), postmortem

Section II: Myoglobin Chemistry 7
processing and packaging methods, time and temperature of storage, extent of exposure to oxygen and the number of cycles meat goes through the color cycle, and especially postmortem age of the product usually influence meat color by influencing the intrinsic factors of meat color. For example, many extrinsic factors can affect the rate and extent of postmortem pH decline, amount of protein denaturation when muscle is converted to meat, concentration of antioxi-dants in meat, biochemical intermediates available to modulate meat color, and the quantity of unsaturated fatty acids. Intrinsic factors such as pH, muscle type, areas within a muscle, muscle fiber composition, myoglobin concentration, disruption of various subcellular components re-lated to meat color chemistry, water holding capacity, microbial load, and temperature history affect two critical factors tremendously, meat’s use of oxygen and meat’s ability to reduce MMb. As many of these factors as possible should be considered in designing and reporting meat color research.
E. Muscle Metabolism and Meat ColorCellular biochemistry of carcass muscles differs, influencing postmortem metabolism of skeletal muscles. The influence of beef muscle source not only on fresh color but also cooked color has been widely investigated. McKenna et al. (2005) examined various biochemical mechanisms influencing color stability in 19 beef muscles, whereas other researchers (Mancini et al., 2009; Suman et al., 2009) reported that color-stable and color-labile beef muscles respond differently to MAP systems and to browning induced by cooking.
The role of mitochondria in meat color has received significant attention, and the mechanisms through which mitochondria influence myoglobin redox stability have been investigated. The influences of vitamin E (Tang et al., 2005a), lipid oxidation (Tang et al.,
Figure 2.2. Schematic of the visual, practical interconversions of myoglobin redox forms in fresh meat. Courtesy of M. C. Hunt, Kansas State University.

8 Color Guidelines Handbook
2005a), oxygen consumption rate (Tang et al., 2005b; Mohan et al., 2010c), and metabolites (Tang et al., 2005c; Ramanathan et al., 2009; Mohan et al., 2010b) on the interactions between mitochondria and myoglobin suggest that both the electron transport chain and reductase enzymes in the outer membrane can reduce MMb and, therefore, are involved in color stability. Isolating intact and functional mitochondria from muscles is then critical to the success of such experiments.
F. Cooked Meat ColorThe process of cooking denatures myoglobin, which is responsible for the characteristic dull brown color of cooked meat products. However, the denaturation temperature for difference redox forms of myoglobin is not constant; therefore, the relative brown color of cooked product interiors is not necessarily a reliable indicator that beef has been cooked sufficiently to ensure safety (160°F or 71°C for one second or other proven time-temperature combinations). Myo-globin’s denaturation temperature depends on the protein’s redox status. More specifically, the relative resistance of myoglobin to heat-induced denaturation is as follows: COMb > DMb > OMb > MMb (Ballard, 2004).
Premature browning is a phenomenon in cooked beef in which myoglobin denaturation, and as a result, a cooked appearance, occurs at a temperature too low to inactivate pathogens. Killinger et al. (2000) reported that the incidence of premature browning in ground beef purchased from local retail stores was about 47%. Both intrinsic (myoglobin redox state, muscle source, and antioxidants) and extrinsic (packaging, storage, and cooking from a frozen state) factors influence the susceptibility of beef to premature browning.
Myoglobin also can result in persistent pinking (the opposite of premature browning), a condition where the pigment remains relatively stable and difficult to denature using heat. Both persistent pink colors and a change in endpoint temperatures required to achieve typical levels of doneness (i.e. increased cooking necessary to attain medium rare) have been attributed to the thermal stability of carboxymyoglobin (≈pH 5.6).
G. Cured Meat ColorNitrite addition (Figure 2.3) causes the characteristic pink color associated with cured prod-ucts. Added nitrite binds with the heme moiety of DMb, with rapid reduction of the bound nitrite to NO, and simultaneous heme oxidation to the ferric form (Figure 2.3). Visual indica-tion for this reaction is given by the rapid browning that occurs when nitrite-containing brines are added to fresh meats. Under anaerobic conditions, brown NO-MMb is then reduced to red NO-Mb by added reductants such as erythorbate, or more slowly by endogenous reductants, in combination with MMb-reductase enzymes. Some studies indicate that in brines containing nitrite and reductants, the nitrite also rapidly reacts with reductants to generate NO, which in turn binds MMb, forming NO-MMb.
One precaution in the handling of brines containing nitrite and erythorbate is to keep temperature below 10°C. At higher temperatures, erythorbate will rapidly reduce nitrite to NO gas, which escapes before brine injection, resulting in poor or no cured color development in the cooked product.
Denaturation of NO-myoglobin and NO-hemoglobin during cooking or fermentation exposes the centrally located porphyrin ring, resulting in cured meat color (NO-hemochrome), due to the interaction between ferrous iron and NO. Pink color will fade to gray when exposed to light and oxygen.

Section II: Myoglobin Chemistry 9
Figure 2.3. Reactions leading to formation of nitric oxide hemochrome. Note: The solid arrows indicate reac-tions and the dotted arrows indicate conditions that favor the reaction. The “+” indicates a reaction between the two connected “reactants” and the product is shown by the next arrow.
For example:• Myoglobin+NaNO
2 can form MMb (this is a step in some MRA assays).
• Metmyoglobin+NOcanformNO-MMb.• Myoglobin+nitricoxidecanformNO-Mb,orwithanaerobicconditionsNO-MMbisreducedtoNO-Mb.• Heatoracidconditionsfavorglobinproteindenaturation,andNO-Mbisconvertedtonitricoxidehemo-
chrome.Courtesy of Drs. M. C. Hunt, Kansas State University and D. P. Cornforth, Utah State University
1.Whatistheactualcuring(nitrosating)agent,nitriteorNO?There is some disagreement on this point among various literature sources. Recent evidence points to nitrite (NO2
−) as the compound that first reacts with heme iron. This makes sense, because nitrite is water-soluble, with small enough molecular diameter to penetrate into the heme cleft, and its negative charge would provide electrostatic attraction to the positively charged heme iron. NO gas, on the other hand, is not very water soluble, and tends to leave the brine. Some studies with pure myoglobin solutions, or with meat batters, have shown cured color development after exposure to NO gas. But, NO may not have directly reacted with heme iron in these experiments. It is known that under aerobic conditions, NO reacts with oxygen to form nitrogen dioxide (NO2) gas, which in turn reacts rapidly with water to form the nitrite ion. Thus, even in the presence of NO gas, nitrite is likely the active meat curing agent. Historically, nitrate salts were used for meat curing, but nitrate was reduced to nitrite by bacterial action, in order for curing to occur. Cured color development may also occur on grilled or smoked meat, due to presence of nitrogen dioxide, forming nitrite ions when moist surfaces come in contact with combustion gases.
2. Is cured meat pigment mono-nitrosylhemochrome, or dinitrosylhemo-chrome? Stoichiometric studies found that a ratio of 2 mol of nitrite was needed for formation of 1 mol of cured meat pigment, indicating that the pigment was di-nitrosylhemochrome. However, the only study of cured pigment structure using mass spectroscopy found that the molecular ion fragment had an atomic mass of 646 units, rather than 676 atomic mass units predicted for di-nitrosylhemochrome. This result strongly indicated that

10 Color Guidelines Handbook
cured meat pigment is mono-nitrosylhemochrome. Further work indicated that another NO was bound to the globin portion of the pigment. Thus, 2 mol of NO bind to myoglobin, but only one NO binds to the color-inducing heme group.
H. IridescenceIridescence results in a shiny, rainbow-like appearance on the surface of cooked meat products. This kaleidoscope-like appearance is often associated with green, red, orange, and yellow colors caused by product surface microstructure and light diffraction, not the myoglobin redox state. More specifically, structural uniformity on the surface of meat products results in light diffrac-tion conducive to iridescence, whereas disruption of surface microstructure reflects light in a relatively irregular pattern that limits iridescence (Lawrence et al., 2002a,b).

11
SECTION III
Physics of Color and Light
A. IntroductionPerceiving an object and identifying the color of that object involves a complex set of circum-stances consisting of the object, its surroundings, and the detector that perceives the object and translates the stimuli into a perception of color. To perceive color, a detector capable of this perception is necessary. That detector can be the human eye or instrumentation such as a colorimeter or spectrophotometer.
For human sensory response and detection of color, the eye and brain work synergistically to detect and process stimuli to discern color. The eye is composed of the cornea, pupil, iris, and lens, which together form the anterior chamber of the eye. The lens separates the an-terior chamber from the posterior chamber (vitreous), which contains the retina and optic nerve. The eye operates much like a camera. Light passes through the pupil where the lens focuses the light onto the retina. The iris works much like a shutter in a camera, opening to allow more light to come into the eye in low light conditions and constricting to restrict light in bright light conditions.
The retina is the organelle that senses light. The light detectors of the retina are the rods and cones. Rods are not color sensitive but respond to the visual sensation of light from black through gray to white. The cones are color sensitive to visual sensations of the visible light (Figure 3.1). The cones can be divided into three types based on the portion of the light spectrum to which they have peak responses, blue, green, or red. Therefore, when light pen-etrates the eye, the rods detect lightness/darkness stimuli, and the cones detect light spectra in the blue, green, and red spectra. The detection of blue, green and red spectra is referred to as the trichromatic function of the eye. The detection of these stimuli is then transmitted from the optic nerve to the brain where the information is processed and a visual perception of the object is developed.
Therefore, the complex interaction of eye and brain is what develops color perception. This is subject to a number of factors that can skew the perception of color, particularly the detec-tion of color and how it is processed. To determine color, a detector capable of capturing this
Figure 3.1. White light split into its components by a prism. Positioning another prism at the point where the light is split will reproduce white light. Courtesy of Dr. Shai Barbut, University of Guelph.

12 Color Guidelines Handbook
information is necessary. However, not all eyes have the same ability to detect light sensations and process them into color perceptions. As a notable example, some humans suffer from red-green color blindness. Although the light spectrum is there to permit the sensation of color, the detec-tor (eye) cannot detect and the brain cannot process these stimuli appropriately. Therefore, any color measurement must make sure that the detector is functioning, as in the case of human color perception, to test for red-green color blindness or other color detection defects. Charts for detection of color blindness are available on the web.
Note that the eye, or some other mechanical device, does not “see” color, it simply captures wavelengths of light reflected from an object such as meat (Figure 3.2) and in the case of the eye, relays this sensory input to the brain for interpretation. The color of meat or other objects is the interaction between light, vision, (the detector) and the object being viewed. Light is of great importance to color perception. Without light, there is no color and no vision. Visible light is a part of the electromagnetic spectrum, which is defined by the wave lengths of energy and includes broadcast, radar, infrared, ultraviolet, x-rays, gamma rays, and cosmic rays. However, humans can only detect light in the visual spectrum, which ranges from 390 to 750 nm. In this narrow range of the electromagnetic spectrum, the eye has the ability and the brain the capac-ity to separate wavelengths into color groups. For instance, red color is associated with light of approximately 650 to 700-nm wavelengths. Green color is associated with approximately 490 to 575 nm, and blue is associated with wavelengths between 455 and 490 nm (Figure 3.1). Interestingly, other animals like bees can see in the ultra-violet range, and bats sense electro-magnetic radiation in the ultrasound range of the spectrum.
For color to be detected, light must reflect off the object being viewed and return to the eye. To have color development, the light illuminating the object must have the spectral range to
Figure 3.2. Spectra reflectance of a slice of beef meat (top). Relative reflectance of the different wave-lengths (bottom). Please note that the observer sees only the wavelengths/colors reflected from the surface and not the wavelengths absorbed by the surface/meat. Courtesy of Dr. Shai Barbut, University of Guelph.

Section III: Physics of Color and Light 13
allow reflectance of corresponding wavelengths that the eye can detect and the brain interpret as color. Therefore, with full visual spectral light comes the possibility for an infinite number of colors to be developed. When light strikes meat, it will be absorbed, reflected, or scattered. The wavelengths of light that are absorbed are not perceptible to the eye because they are retained by the object (for example, meat; Figure 3.2). However, the reflected light is perceived by the eye, captured and transmitted to the brain. Because the eye is trichromatic, the brain interprets the intensity of the blue, green, and red stimuli that the eye captures and interprets it as a color. So, to discern meat color, the source of light must contain the wavelengths capable of reflect-ing off meat surfaces, or color will not be perceptible to the eye or instrumental detector. For sensory and instrumental evaluation of meat, the light source must be standardized. Overall, for humans to see the true color of an object, a balanced light source should be used. In summary, using a light source, such as the incandescent lamp (Figures 3.2 and 3.3), will make fresh meat appear more bright red than a 5000-K fluorescent lamp with a lower red output (Figure 3.3).
In addition to the physics involved with light detection and color generation and perception, a number of physical conditions impact the color of meat. The following discussion does not focus on the pigment condition or chemistry of meat but how color can be perceived differently for the same cut under different conditions. Conditions that can influence color are the light source (illuminant), observer differences, size differences in cut or object, smoothness of the surface (for example, using sharp or dull knife to cut meat), background differences, and direc-tional differences.
Wavelengths of light reflected from meat develop the perception of color, so the light source becomes an issue in the development and perception of color. Light sources or illuminants come in many different types, sunlight, fluorescent light, tungsten light, among many others, and even within types of illuminants, lighting sources can differ greatly. Each light source con-tains a different spectral light composition. Figure 3.3 illustrates the output of two light sources. A so-called balanced light source will have an equal/balanced output of different wavelengths (for example, sunlight). For this reason, meat may look one way in a retail display case but lose its favorable appearance under store lighting (such as, many stores use fluorescent light in their display coolers because the light bulb produces very little heat and is more efficient than an in-candescent light bulb which loses >70% of its energy as heat). Therefore, when choosing a light
Figure 3.3. Examples of spectral power distribution from an incandescent light bulb (left) and fluorescent bulb (right). (http://en.wikipedia.org/wiki/File:Spectral_Power_Distributions.png; http://creativecommons.org/licenses/by-sa/3.0/deed.en)

14 Color Guidelines Handbook
source for research, the type of lighting and the light source must remain constant to properly compare color. One common light source for viewing meat is deluxe warm white fluorescent lighting. Along with light source, intensity of light is also important in perceiving color; neither too bright nor too dim is good when viewing meat. Approximately 1630 lux is commonly used to compare meat samples for color. Figure 3.4 shows the actual wavelengths reflected from three fresh meat cuts illuminated with a cool white fluorescent bulb. These spectra would be what are detected and evaluated by consumers’ eyes. This light bulb has major peaks in the indigo, green, and orange areas (rather similar to the 5000-K lamp in Figure 3.3), but very low output in the red area; thus, a consumer panel perceived the beef, pork, and chicken cuts as brown. In contrast, when the panel was presented the same meat under incandescent lighting (reflectance spectra similar to that shown in Figure 3.2 and the 2800-K lamp in Figure 3.3), the consumer panel scores were much more pink/red.
Observer differences are another condition that can affect color perception. Each individual’s eyes are slightly different in sensitivity to color vision. This is perhaps the most difficult to control of all the conditions that affect color perception. Screening for color vision perception can aid in selecting panelists capable of discerning meat color differences (see color blindness charts; Wiegand and Waloszek, 2003); note that a computer screen presentation of these charts might not be correct if the screen is not fully adjusted).
Size differences in meat cuts can also affect how color is perceived because of the amount of light reflected to the eye. For larger cuts, more light is reflected to the eye, and color is often perceived as being brighter and more vivid.
Background differences will also affect color perception. Cuts viewed against a bright back-ground often appear to have duller color, whereas cuts viewed against a dark background often appear brighter. Care should be taken to standardize the background so that comparative color determinations can be made. Also, background color becomes important in meat photography, where light backgrounds can give a false impression of dull or pale color whereas dark back-grounds tend to capture meat color vividness best.
In addition, the angle from which the cut is viewed and the incident angle of light from the illuminant source will both affect color perception. This is particularly important when gloss occurs, which may impede the ability to view the sample. Furthermore, for conditions like iri-descence, the incident angle of light to the observer can render this condition either visible or invisible. Backlighting should be avoided; overhead light is preferred. When setting lights, light intensity should be standardized with a light meter.
Figure 3.4. Relative luminance of fresh meat cuts positioned under cool white fluorescent light bulb. Note that this specific light bulb has major peaks in the indigo, green, and orange colors. The minimal light output towards the end of the visible spectrum results in poor appreciation of the red color of the beef and pork meat cuts. Reprinted from Meat Science, vol. 59, no. 2, S. Barbut, “Effect of illumination source on the appearance of fresh meat cuts,” pp. 187–191, 2001, with permission from Elsevier.

Section III: Physics of Color and Light 15
B. Color Perception of MeatOnce light strikes the surface of meat and is reflected back to the detector (eye or instrument), the processor (brain or microprocessor) interprets color. Communicating color can be quite challenging. To facilitate color communication, tools have been developed to aid in speaking the language of color. The Munsell system was invented by the American artist A. H. Munsell; it uses color chips to mix then match to that of a specimen. In 1931, the Commission Internationale de l’Eclairage (CIE) developed the tristimulus values XYZ (Figure 3.5) and the CIE L*a*b* color space in 1976 (Figure 3.6). The reason the CIE L*a*b* system was developed was that the XYZ colorimetric distances between the individual colors do not correspond to perceived color differ-ences. For example, the difference between green and greenish-yellow is relatively large, whereas the distance distinguishing blue and red is quite small. The CIE solved this problem in 1976 with the development of the three-dimensional Lab color space (or CIELAB color space). In this sys-tem, the color differences one perceives correspond to distances when measured colorimetrically. The a axis extends from green (−a) to red (+a) and the b axis from blue (−b) to yellow (+b). The brightness (L) increases from the bottom to the top of the three-dimensional model (Figure 3.6). In reporting colorimeter values for research, authors must note whether CIE L*a*b* values or CIE Lab values were used. (The presence or absence of the asterisks is reflective of slight mathematical differences in how each of these values is calculated.)
Perceptible color has hue, lightness, and saturation properties. Hue is the color description as we communicate it in language (red, yellow, green, blue, etc.). Hue is developed by the specific wavelengths reflected from a meat surface back to the detector. Lightness describes the bright-ness or darkness of the color. Saturation refers to how vivid or dull the color is. To measure or describe color, a number of methods have been established.
The XYZ tristimulus values and the associated Yxy color space established a methodology for describing color (Figure 3.5). From this, the CIE x, y chromaticity diagram was developed. This representation allowed achromatic colors (pale or dull colors, lower saturation) to populate the center of the diagram, while the chromaticity increases toward the periphery of the diagram
Figure 3.5. CIE (1931) color space. (Illustration of the CIE 1931 color space. http://commons.wikimedia.org/wiki/File:CIExy1931.svg; http://creativecommons.org/licenses/by-sa/3.0/deed.en)

16 Color Guidelines Handbook
(more vivid colors, more saturation). Around the periphery are red, green, and blue primary colors and the corresponding wavelengths of visible light associated with those colors. The chromaticity diagram allowed coordinate plotting of x and y color values to determine color (hue) and saturation (vividness) of color.
The later development of the CIE L*a*b* color space allowed color to be expressed in a three dimensional space (Figure 3.6). Because of the optic response of the human eye to blue, green, and red, calculations converted these responses to L*, a*, and b* values. When combined, these estab-lish a three dimensional color space. For the color space, a* values are represented on the X axis, the b* values on the Y axis and the L* values on the Z axis (Figure 3.6). In the center of the color space is neutral gray. Along the a* axis, a positive a* represents red, and a negative a* represents green (scale from +60 for red to −60 for green). Along the Y axis, a positive b* represents yellow, and a negative b* represents blue (scale from +60 for yellow to −60 for blue). The third dimen-sion L* is represented numerically where 100 is white, and 0 is black (Figure 3.6). For this color space, a* and b* values can be plotted to establish the color or hue of a meat sample (Figure 3.7). Using the L* value, lightness or darkness of the sample can be determined. Therefore,
Figure 3.6. Representation of color solid for CIE L*a*b* color space. Image courtesy of Konica Minolta Sensing Americas.
Figure 3.7. An illustration of hue angle and chroma C* (saturation index) within part of a chromaticity diagram. Point A is the plot of CIE a* (47.63) and CIE b* (14.12 ). Image courtesy of Konica Minolta Sensing Americas.

Section III: Physics of Color and Light 17
using trigonometric functions, the incident angle a sample deviates from the X axis can be calculated to determine the hue angle (color) of the sample, and the distance of the sample from the origin of the XYZ lines can be calculated to determine the saturation or vividness of the sample. Hue angle is calculated as hab = arctangent (b*/a*). For example, with a CIE b* value of 14.12 and a CIE a* value of 47.63, the hue angle would be 16.51. Therefore, the plot of a* and b* points and the corresponding angle will establish the color of the sample. Likewise, since colors become more vivid around the periphery of the color space, the farther the a* and b* plot points are from the origin, the more vivid the color. Chroma (saturation index) can also be calculated from the a* and b* values as (a*2 + b*2)½. For example, with an a* value of 47.63 and b* value of 14.12, the chroma (saturation index) would be 49.68. With this data, color differences can be calculated and compared objectively. These calculations will be discussed further in the follow-ing sections.
C. The Physics of Light and Instrumental Color Measurements
Instrument packages come in two major classes capable of measuring color, the colorimeter and the spectrophotometer. Both use their own light sources and certain illumination condi-tions (for example, illuminants A, C, or D65). Various light sources can be used (for example, tungsten, and deuterium). The part of the spectrum and the cost of the light bulb, among other things, influence the decision to use one light source over another.
Instruments differ in the way they measure reflected light. The tristimulus method uses a light source that illuminates the sample and is then reflected through red, green, and blue filters onto photo-detectors (Figure 3.8). The microprocessor can convert the reflected values to XYZ or CIE L*a*b* values. The spectrophotometer illuminates the sample, and the reflected waves are either scanned (via a monochromator) or read simultaneously by a photo diode array (Fig-ure 3.9). These values are sent to a microprocessor and can be presented as the reflected spec-tra, converted to XYZ values as shown in Figure 3.9 or CIE L*a*b* values.
Some reflectance spectrophotometers are designed to scan wavelengths (colors) reflected from the surface using a diffraction grating, whereas others detect ranges of reflected light
Figure 3.8. Illustration of a tristimulus colorimeter. Image courtesy of HunterLab.
18 Color Guidelines Handbook
through the use of photo diode arrays (such as, a type of photo-detector capable of convert-ing light into either current or voltage, depending upon the mode of operation). A diffraction grating is basically a solid plate with a large number of parallel, closely spaced slits or a plate with many parallel reflecting grooves. Interestingly a meat surface can also act as a diffraction grating itself. Iridescence seen on intact meat is related to the highly organized structure of the myofibrils within the fibers, so when the surface is cut, it can create a structure resembling re-flecting grooves. In that case, the incident light is diffracted (as it would be using a prism) into a variety of hues. However, a spectrophotometer grating can separate the different colors of light much more than a prism with its the dispersion effect. Even a single wavelength of light can be diffracted further. Photo diode arrays are designed to simultaneously measure a range of wave-lengths. Some photo diode arrays may have a resolution of only 2 to 10 nm; therefore, with a very sharp reflectance peak or valley of interest, a scanning reflectance spectrophotometer may be a better choice. As photo diode arrays are improved, this advantage may be lost. Such high resolution is more pertinent to pigment analysis than tristimulus measurements. Also keep in mind, the scanning reflectance spectrophotometers collect the reflectance over the intended visible wavelength range much slower than diode arrays.
In addition, remember that meat contains multiple hues. For instance, fresh red meat appears red. While the red hue dominates the spectral reflectance, however, other hues are also present. A spectral reflection profile is useful to determine the presence of other hues and their inten-sity. Furthermore, for pigment form, spectral reflectance can estimate pigment form quantities. Both colorimeters and spectrophotometers are useful to track color changes in meat over time since they are non-destructive tests. Important also is that instruments used to measure color vary widely in design features which impact the accuracy and precision of color measurements. A full discussion of these is outside the scope of this Guide.
Figure 3.9. Illustration of measuring color with a spectrophotometer equipped with a photo diode array. Image courtesy of HunterLab.

19
SECTION IV
Visual Appraisal Principles
A. IntroductionVisual appraisals of color are the “fundamental standard” of color measurements because they closely relate to consumer evaluations and set the benchmark for instrumental mea-surement comparisons. Like all sensory evaluations using human panelists, visual color panels are not easy to conduct because human evaluation may not be replicable from day to day and is influenced by personal preference, lighting, visual deficiencies of the eye, and environmental appearance factors other than color. Moreover, meat color cannot be stored, maintained, or reliably reproduced over time. Yet, through proper panel management, sam-ple presentation, and data collection procedures, visual appraisals of color can provide accu-rate and repeatable objective data. This section will provide a brief overview of key concepts that must be understood when preparing to conduct sensory studies, including visual color panels.
B. Types of Visual PanelsColor panels can be broadly classified as trained visual color panels or consumer panels. Trained, descriptive visual color panels are most commonly used in meat color research and can be regarded as objective instruments. Trained descriptive panelists undergo rigorous screening and training to obtain quantitative ratings of samples on anchored scales. These panelists should not be asked to rate personal preferences or acceptability of the samples they evaluate. Consumer panelists, on the other hand, are useful for providing information using hedonic scales of their preferences and the acceptability of the product’s attributes. The particular research question determines which type of panel can provide data that addresses that research question. To fully address all pertinent questions, using both types of panels may be appropriate.
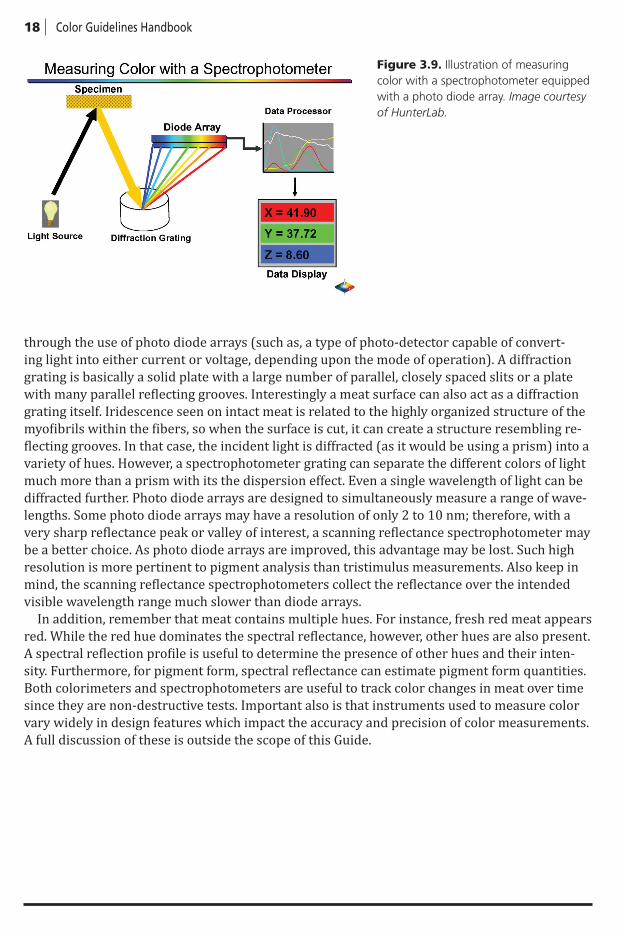
C. Conducting Research Using Human PanelistsKey concepts for conducting color research using human panelists are presented in Table 4.1. These guidelines provide only a brief overview of sensory techniques as they apply to evaluat-ing meat color. More detail on sensory methods are in the AMSA Research Guidelines for Cook-ery, Sensory Evaluation, and Instrumental Tenderness Measurements of Fresh Meat, in ASTM (ASTM, 1968a,b, 1978, 1979, 1981) and IFT publications (IFT, 1995a,b), as well as Meilgaard et al. (1991) and Miller (1994). These documents focus primarily on sensory methods for flavor and tenderness evaluation but provide extensive guidance on training and conducting sensory panels, many of which apply to visual panels as well. Thus, these documents should
20 Color Guidelines Handbook
be thoroughly reviewed before initiating visual color evaluation studies. Additionally, these documents highlight what information should be provided when publishing sensory research. A list of such information is presented in Table 4.2.
1. Selecting Panelists
a. Consumer panelists. Panelists are generally recruited from predefined demographic groups based on the population of interest. For example, a consumer panel made up of 18- to 21-year-old college students may not provide responses representative of older, more affluent professionals being targeted by branded programs. Consumer panelists generally are given only basic information required by informed consent regulations and receive no training other than instructions in completing the ballot or questionnaire. Consumer panels may be conducted by allowing panelists to rate products on their own in a home environment, which provides consumer perceptions in the environment in which a product is to be used. However, this approach is prone to data recording errors and incomplete results. Alternatively, panelists may be brought to a central location and presented products under controlled conditions with researchers available to help record data. Such “capture panels” allow more correct and complete data, but consumer
Table 4.1. Key steps to conducting trained descriptive visual color research panels
Item Description
1. Select panel type and The panel type and scale should appropriately address the appropriate scales objectives of the experiment
2. Identify panelists Panelists should have normal color vision and acuity assessed with Farnsworth Munsell Hue test. Select a panel leader.
3. Conduct preliminary trial A small preliminary trial should be conducted on samples treated in accordance with the experimental protocol
a. Scale refinement During the preliminary trial, scoring scales can be adjusted to reflect changes observed in samples during the preliminary trial
b. Panel orientation/training During the preliminary trial, panelists should be oriented to the scales and trained to score samples equally
4. Conduct the experiment Panel viewing conditions should be standardized
5. Monitor panel performance. Panelists’ scores should be monitored in reference to panel leader scores
Preliminary analyses including panelist × treatment interactions may indicate shortcomings in panel performance.
Panelists identified as not performing adequately should be excluded and/or retrained
6. Statistical analysis Average panelist scores and apply appropriate statistical models

Section IV: Visual Appraisal Principles 21
perceptions fall outside “typical use” conditions. Regardless of location, a sufficient number of panelists must be recruited to avoid bias. The number required will depend on the products and criteria to be evaluated, but a rule of thumb is that a consumer study should involve at least 100 consumers.
b. Trained descriptive visual color panels. ASTM-434 (1968) suggests a minimum of 5 panelists, because using fewer than 5 depends too much upon any one individual’s response. Typically, a minimum of 8 panelists are used to evaluate each sample, though otherwise unsuitable panelists should not be used simply to meet an arbitrary number of panelists. Because color panels are generally conducted over many days, a larger panel may be beneficial, so panelists’ other obligations do not prevent the required number of observations being obtained.
2. Training Panelists
At a minimum, trained descriptive panelists should be recruited and initially screened based on availability, interest, and normal acuity (such as, not color blind), and they should be able to discriminate color differences using a Farnsworth-Munsell 100-Hue test; (see glossary for more information). The Farnsworth-Munsell 100-Hue test can be taken online at http://www.xrite.com/custom_page.aspx?PageID=77andLang=en. Successful panelists should have a score of 50 or less if possible (prospective panelists with scores of more than 100 should not be used). Kinnear and Sahraie (2002) reported that panelist between ages 14 and 59 scored better on the 100-Hue test than those outside this age range.
Table 4.2. Information* that should be reported in scientific reports with trained descriptive visual color panel data
Item Description
Type Consumer or trained
Panel selection criteria Normal vision, acuity, prior experience, etc.
Number of panelists Minimum number of panelists each day (if different from total)
Training Number of sessions, standards used, pictorial standards (if used), etc.
Display and viewing Lighting, packaging, and other pertinent factors; see Section Vconditions Display Guidelines
Session descriptions Days of display evaluated, number of samples per session, time of day if varied, etc.
Scales With anchors and descriptors in allowed increments (if applicable)
Statistical methods Experimental design and statistical analysis
*This information should be reported if different from the display/storage conditions.

22 Color Guidelines Handbook
Further training should confirm panelists’ ability to provide accurate and repeatable data using an anchored scale. During this time, the lead investigator or other highly experienced per-son should serve as the panel leader and provide guidance to panelists on the scale and ensure panelists score samples equally. A preliminary trial also provides an excellent opportunity for panel orientation and training, as well as any necessary adjustment to the scales being used. Panelists generally should not be aware of the treatments being studied unless that informa-tion would help them adequately assess samples. However, panelists should not be aware of the treatments to which individual samples belong.
3. Scoring Scales
The relevance of the results of color research conducted with trained descriptive visual panel-ists relies heavily on the suitability of the color scale. The scoring scale must be properly con-structed to obtain data that characterizes differences (or lack thereof) between experimental treatments. Thus, the color scale itself must address the correct research questions to be useful. An ideal scale for characterizing discoloration of fresh beef steaks will be of little value in char-acterizing the fading of cured, frozen pork chops. Furthermore, some scales ask the panelists to provide an “average” color value for an entire sample, while others specify the “worst-point” color (see Sections VI and VII). Both of these approaches are informative but yield different results, and investigators must decide which approach is will give results most relevant to a particular experiment and the question that experiment attempts to answer. Example scoring scales are presented in Section VII, and some pictorial guides can be found in Section XII. These scales and pictures are provided because they have been used successfully in research trials and can serve as a template for designing scales in future research. However, please note that conditions unique to each experiment (such as, for example, display temperature, postmortem age, frequency and duration of defrost cycles, lighting intensity); furthermore, experimental treatments will alter changes observed during any given display study. Therefore, conducting preliminary trials is best, with meat treated as prescribed by the experimental protocol. In this way, the selected scale can be compared to observed changes in color and adjusted as neces-sary. Furthermore, note that hedonic scales appropriate for consumer panels differ from the quantitative scales appropriate for trained laboratory panels.
4. Sample Presentation
Regardless of the type of panel, the results depend highly on sample presentation and the con-ditions under which samples are presented. As is the case with any analytical technique, color evaluation must overcome the fundamental problems of obtaining a representative sample. Sample preparation for color measurement requires standardized procedures that are both re-peatable (by the same person in the same laboratory) and reproducible (by different people in different laboratories at different times). All samples must be handled in exactly the same man-ner to prevent artifacts. This is particularly important when live animal treatments are evalu-ated for their effects on meat color. Factors for which standardization is especially important include (unless the factor is an experimental variable) animal nutritional regimen, carcass chill rate, muscle, sample location within a muscle, fiber orientation, muscle pH, time and tempera-ture of postmortem storage, muscle exposure time to oxygen, marbling content and distribu-tion, surface wetness and gloss, myoglobin concentration, packaging, and display conditions (see Sections V and VI for more details).

Section IV: Visual Appraisal Principles 23
5. Color Viewing Conditions
Presentation conditions (see Section V) are critical to sensory evaluation. The environment should be free of distractions. Panelist fatigue can affect the accuracy and repeatability of evalu-ations, so the number of samples must be reasonably limited. The number of samples panelists can score in a single session will be greatly influenced by the number and complexity of attri-butes to be evaluated. Because perceived color depends on light source and viewing angle (see Section III for a review of the physics affecting meat color), these factors must be standardized. Meat color evaluation panels are often conducted with products in simulated retail display. Thus, the display environment must be conducive to panel data collection. For studies evaluat-ing color stability during display, all panelists should be asked to score samples within a small time window (for example, between 0900 and 1100) on each evaluation day. Section V details considerations for setting up simulated retail display, and Section VI provides instructions for visual evaluation of meat products.
6. Sample Identification
Sample identification numbers should be a randomly assigned, three digit number that does not indicate treatment group or subconsciously introduce other bias. For example, a panelist may subconsciously give higher scores to a sample identified as number 1 than to a sample identi-fied as number 2.
7. Monitoring Panelist Performance
Once, a laboratory panel has been trained and an experiment has commenced, the performance of the panel as a whole, as well as individual panelists, must be monitored over time. Individual panelists’ scores should be plotted daily in reference to the panel leader’s scores. Panelists whose scores systematically differ from the panel leader should be retrained. Between rep-licates (or at least prior to the final statistical analysis), conducting a statistical analysis with panelists in the model can be useful in evaluating the performance of the panel. A significant panelist × treatment interaction indicates that 1 or more panelist is not performing adequately. Excluding these panelists until they receive additional training could be considered.
8. Statistical Analysis
Generally, individual panelist’s scores should be averaged for statistical analysis, because other methods depend too much on individual panelist’s observations. Traditionally, visual panel data have been evaluated using standard analysis of variance techniques. Such analyses must account for the covariance relationships between observations taken from a single animal/sub-primal over time. Depending on the experimental design, this often entails repeated measures or split-plot models. Though less commonly used, non-parametric approaches like principal component analysis may provide insight into relationships among color attributes and treat-ment factors difficult to obtain from analysis of variance.
D. SummaryUsing human panelists to evaluate meat color attributes is a powerful tool in meat color re-search. However, effective data collection poses significant challenges to researchers that can compromise the quality of the resulting data whether using trained panelists or consumer pan-els. Understanding the principles of sensory analysis and following the suggestions in Sections
24 Color Guidelines Handbook
V, VI, VII, and XII will allow researchers to maintain the integrity of their color panel data. Fur-thermore, complying with the suggestions in these sections will make the peer-review process go more smoothly in publishing meat color research using color panels.

25
SECTION V
Display Guidelines for Meat Color Research
A. Purpose of Display StudiesAssessing meat appearance is a critical step in projecting the retail acceptance of meat prod-ucts. Beyond meat’s intrinsic properties, many extrinsic factors can affect meat color, and research involving either type of variable often merits a simulated retail display study. The researcher must control all non-experimental factors to accurately discern actual differences in treatment. The six parameters discussed in this section should be considered, evaluated, and reported for any meat display study: packaging, handling and storage, lighting param-eters, display temperature, display duration, and display case configuration. Color evaluation during display studies typically involves two measurement methods, visual (panelists) and instrumental (colorimeter or spectrophotometer). Display studies may only conduct a single type of color assessment; however, conducting both visual and instrumental measurements concurrently whenever possible is highly recommended. For details see Sections IV and VI for visual color evaluations and Sections III, VIII, and IX for instrumental color evaluations.
B. Packaging Materials Affect Meat AppearanceA study’s objective might be to evaluate the effects of a given packaging component, atmo-sphere, or material on meat color. Packaging materials and atmospheres should always be reported in detail within the materials and methods section of research findings.
1. Packaging materials. The type of tray (for example, rigid plastic or Styrofoam) and/or film with the respective oxygen and water vapor transmission rates, supplier, and identifying product number (if available) should be reported. Packaging material porosity and ability to harbor gases within the package microstructure should be considered particularly in instances where low oxygen atmospheres are desired.
2. Atmosphere. The package atmospheric environment (gases or vacuum) must be considered, particularly if modified atmospheres are used. Gas concentrations (molar or percentage concentration) should be monitored throughout display because minor variations can heavily affect meat color and color stability. To measure concentrations, a headspace gas analyzer should be used. If evaluating vacuum-packaged product, researchers should verify the vacuum level in the packages with a Kennedy Gauge (see Glossary for contact information) or an equivalent device to

26 Color Guidelines Handbook
determine actual in-package vacuum levels. Vacuum levels from gauges near the vacuum pump often overestimate the in-package vacuum level. On occasion, a package may fail (package atmosphere becomes compromised or exposed) during the course of a study. Failure may be the result of product mishandling or lack of seal integrity. When visible package failure occurs or lack of desired atmosphere composition is maintained, that sample should be terminated from the study immediately, and all data associated with it removed from data analysis. Because it is impossible to know when such failures occur or what effect the failure may have had on previous observations, an uncontrolled variable is introduced to the study, often invalidating conclusions.
3. Other considerations. The use of soaker pads, oxygen scavengers, or other unusual components should be detailed. Specifications (brand, model, composition, etc.) of additional components should be reported.
4. Cutting conditions. When preparing meat cuts or products for packaging, take care to standardize the time and conditions of exposure to atmospheric conditions before packaging. After the packaging process is complete, samples should be stored for sufficient time to allow equilibration with their atmosphere to occur (unless changes in the equilibration process are the subject of evaluation). For optimal and rapid blooming in oxygen-containing atmospheres, meat should be held at cold refrigeration temperatures, 0 to 2°C, for at least 30 minutes. For adequate deoxygenation or pigment reduction in non- or low-oxygen atmospheres, samples may need to be held for longer periods at slightly warmer (though non-abusive) temperatures to facilitate enzymatic oxygen usage and MMb reduction.
5. Microbial considerations. Care must be taken during sample preparation to reduce microbial contamination of product. Researchers should always start sample preparation with clean cutting surfaces and preparation tools. If knives are used, they must be regularly cleaned throughout preparation and rinsed thoroughly before reusing. The researcher and assistants should use clean gloves and change them frequently, taking care to avoid touching the product more than necessary particularly on surfaces that will be evaluated for color and color stability.
6. Labeling. Each package should be labeled with a random 3- or 4-digit numeric identifier to facilitate panelists’ evaluations and to keep treatments unidentifiable, thus eliminating panelist and researcher bias.
C. Product Handling and Storage Should Mimic Real World Parameters
Current commercial meat production and processing systems are changing to centrally packaged and distributed case-ready products. These products are seldom packaged and placed immediately into display. The complete handling system, especially postmortem age of the product and the time and temperature of storage (dark or lighted) should be described and reported.
D. Lighting Types and Intensity Affect Meat AppearanceLight type and intensity will affect how product appears and its discoloration pattern. For most display studies, samples will be continuously subjected to a light source for 24 hours per day for the study’s duration. In addition, these studies should occur in a room where non-display

Section V: Display Guidelines for Meat Color Research 27
lighting is not a factor, and outside light sources are eliminated. However, if the display mimics retail store conditions, room lighting similar to that in retail stores would be appropriate. In this instance, case lighting and room lighting should be clearly detailed and reported. Fluores-cent, halogen, high-intensity discharge, incandescent, and light-emitting diode (LED) lights are all possible light sources for meat-display cases. In the United States, the most commonly used type is fluorescent although LED lights are becoming more popular and likely will become more prevalent. Given the popularity and wide availability of fluorescent light bulbs, meat research-ers must understand that all fluorescent bulbs are not identical or interchangeable. Each type has its own individual properties, which thus affect meat color and color stability (Figures 5.1 and 5.2). Correctly selecting bulbs for meat research, and reporting light source is critical. Gen-erally, lighting used in meat display studies should have the following characteristics,
1. Ideal meat-display lighting should use only one bulb-type per research study; the bulb type should fit the following specifications (unless the effects of various lighting types are being evaluated):
a. Color temperature of 2800 to 3500 K b. Color rendering index (CRI) of 80 to 90
Figure 5.1. This image depicts the various colors of light produced by different fluorescent bulbs. Note the yellow, red, white, and blue colors, all indicating the need to remember that all fluorescent bulbs do not have the same properties. Courtesy of C. R. Raines, The Pennsylvania State University, and M. C. Hunt, Kansas State University.
Figure 5.2. This picture depicts the exact same unpackaged cuts of beef, pork, chicken, and hard salami under various fluorescent lighting types with different color temperatures and color render-ing indices. Courtesy of C. R. Raines, The Pennsylvania State University, and M. C. Hunt, Kansas State University.

28 Color Guidelines Handbook
c. Light intensity of 1612.5 to 2,152 lux (150 to 200 foot-candles; 1 foot-candle = 10.76 lux) as measured by a light meter at the meat level and surface orientation to the light in the display case. Lights should be adjusted above the displayed meat to pro-duce a meat level light intensity within this range.
2. The following lighting with these attributes should be avoided unless they are being studied:
a. Cool white fluorescent bulbs are too blue and green. b. Color temperatures of 4000 to 6500 K are too blue. c. High-intensity discharge bulbs may make product appear yellow. d. Lamps with high UV output will accelerate discoloration and/or fading. e. Incandescent bulbs have an acceptable color temperature but may provide uneven il-
lumination and excessive heating of the product, thereby accelerating discoloration.
E. Display Temperature Affects Color LifeThough processing, packaging, handling, and lighting can all influence meat color appearance, display temperature significantly influences meat color stability. Typically, the reported display temperature for meat color studies has been <4.5°C. However, in many countries, retail case temperatures run higher under normal operation. In addition, case temperature will fluctuate and may include case defrost cycles sometimes exceeding, albeit temporarily, 10°C. If the dis-play is in a cooler with no defrost cycle, this should be stated clearly as that is not a standard procedure in many retail stores. Regardless, continuous temperature monitoring is necessary to ensure the target temperature is achieved and maintained. Researchers should consider the fol-lowing when setting up experimental procedures:
1. Select a display temperature appropriate to the goals of the research, which could be either ideal or abusive. Temperature control is essential if detecting true treatment differences in color or color stability is the goal.
2. The recommended average display case temperature is 0 to 2°C for non-abusive display temperature research.
3. Distribute temperature loggers in various locations of the case to continuously monitor air temperatures at the meat level.
4. If multiple cases are involved, standardize the cases for discharge temperature and the temperature profiles at identical locations among the cases prior to display.
5. If the researcher does not have sufficient product to fill the cases, consider filling the cases with bags of salt water (just enough salt to keep the water from freezing) to simulate a full case of meat.
6. Select an appropriate number of defrost cycles for the display temperatures and report the frequency, duration, and extent of the defrost cycles.
7. Do not schedule color evaluations (visual or instrumental) during defrost cycles because some packages may “sweat” or form excess condensate inside the package during defrost. Packages displayed at a slight angle on the shelving allow condensate to flow

Section V: Display Guidelines for Meat Color Research 29
to the edge of the package, without dripping on the product, thus preventing artificial discoloration.
8. Researchers must supervise their samples carefully during display studies. Cases and product should be checked at least twice a day, if not more, to ensure temperatures are maintained within the specified range. A study where case temperatures are too high or too low results in erroneous data, lost research product, and unrecoverable time. Display studies are never a maintenance-free endeavor.
F. Meat Color Evaluated Against Time to Determine Meat Color Stability
A primary objective of display studies is to evaluate color deterioration (or maintenance) over a given time. When scheduling a study, include extra days should product “last” longer than antic-ipated. Conversely, differences in color stability may be apparent short of the originally planned timeframe. The probability of either scenario can be limited by conducting a research pre-trial (see Section VI). During the display period, package location must be randomized within the case by repositioning packages throughout the case once or twice daily. This will help reduce variability due to temperature and/or lighting intensity differences within the display case. Panelists should be instructed to not handle packages or move them during display so differ-ences in viewing angle or distance among panelists are not introduced.
1. A display study can last a few hours, several days, weeks, or even months. Determine an expected “end point” either before the trial begins or as it proceeds based on the color stability of the product(s) being evaluated.
2. If single-level (coffin) display cases are used, rotate packages daily to minimize within-case location effects from front-to-back and side-to-side within the case(s) during the display. Product rotation in multi-tiered cases is not recommended because of lighting and temperature variation between shelves. Rather, product needs to evaluated side-to-side, front-to-back, and shelf-to-shelf for differences in color stability.
G. Configuring a Meat Display CaseMeat display studies can be conducted in single-level or multi-level display cases. The require-ments discussed previously remain the same. Single-level cases make it easier to manage light intensity, keep visual distance from the product consistent during evaluation, and avoid tier-to-tier temperature variation. However, if multi-level cases are used, temperatures and light inten-sity at the meat level on each tier within the cases should be monitored and reported.
Occasionally, display cases of either configuration type may not be available for panelists. If this occurs, large refrigerated rooms (for example, walk in coolers) may be used. However, researchers must construct lighting structures and display surfaces that maintain consistency for light, temperature, and product. Light sources within the cooler other than the display light-ing must be eliminated. People coming in and out of the cooler must be minimized to reduce temperature fluctuations and outside light. Under such conditions, researcher vigilance is even more important for monitoring the meat display conditions.


31
SECTION VI
Guidelines, Visual Meat Color Measurement
Visual-color appraisals are difficult to conduct because human judgments may not be repeat-able from day to day and are often influenced by personal preference, lighting, visual deficien-cies of the eye, and appearance factors other than color. Presented in this section are general guidelines to use when conducting a visual-color panel to help reduce bias and effectively evaluate project objectives.
A. Selecting Panel TypeDetermine the appropriate panel type needed to meet the project’s objectives. Screen the applicants to meet the objectives of the project (typical grocery shopper, main cook of the household, etc.) and check for color blindness (see Section IV, Visual Appraisal Principles). A general comparison of consumer and trained descriptive panels is in Table 6.1.
B. Screening and Training of PanelistsFor a trained descriptive panel, screen the panelists, at least 6, for their ability to discrimi-nate color differences using the Farnsworth-Munsell 100-Hue Test (see online test at http://www.xrite.com/custom_page.aspx?PageID=77andLang=en or the Glossary for other contact information). Successful panelists should have a score of 50 or less, and prospective panelists with scores higher than 100 should not be selected. In addition, age of panelist is a significant effect for detecting small differences in hue using the Farnsworth-Munsell 100-Hue Test (Kinnear and Sahraie, 2002). In general, panelists from 14 to 59 years of age out-performed panelists <14 and >59; thus, select panelists within this age range.
Table 6.1. Characteristics of consumer and trained descriptive panels
Consumer Panel Trained Descriptive Panel
Evaluates consumer preference Describes color differences
Requires 50 or more panelists Requires 6 to 8 trained panelists
Does NOT “describe color differences” Does NOT “evaluate acceptability”
More subjective More objective due to training

32 Color Guidelines Handbook
Provide pre-trial orientation for the panelists to discuss time requirements; projected dates of evaluation; explanation and discussion of criteria for product evaluation; orientation to pack-aging, format, display conditions, scoring sheets and scales; and discussion of color descriptors including colored pictures of product similar to that being evaluated. Provide 1 to 3 sessions for training and “calibration” of panelists (Sections IV and V).
Often colleagues who may have insight into the experimental objectives and procedures will have to be used as panelists. This makes it essential that they know as little as possible about the treatments they are evaluating and that the meat samples are coded appropriately to elimi-nate knowledge bias. Three-digit codes of random numbers listed in numerical order are rec-ommended to identify samples.
C. Standardization of Significant FactorsStandardize as many sample and environmental variables as possible (see Sections IV and V). Examples include sample thickness, tray color, lighting, display case temperature, defrost cycles, packaging, and sample labeling, among many others. These traits are equally important for both consumer and trained panels. Furthermore, researchers should control as much as possible the inherent variation of the meat caused by genetics, nutritional history, age, gender, muscle pH, postmortem meat age, and other processing variables. (See Sections II and III).
D. Conducting a Pre-trialConduct pre-trials to determine the spectrum of color and discoloration patterns unique to the study; this is often overlooked but is extremely useful in preparing the investigator and panel-ists for the study. Unexpected color patterns and other issues can be eliminated or minimized. If possible, use these trials to refine the scale, develop clear definitions of scale terminology, and train panelists.
E. Selecting Appropriate Scoring ScalesSelect appropriate scoring scales. Use hedonic scales for consumer acceptance panels and de-scriptive scales for trained panels (see Section VII). Remember that existing scales may need to be adjusted; new scales should be developed to suit the needs of individual projects. This can be done during the pre-trial. We cannot overemphasize the need to consider all study details, including experimental design, equipment set up, and scales, or data may not be reliable.
F. Using Reference Aids and PicturesWhenever possible, use colored pictures/tiles or three-dimensional aids for creating reference color standards for the study and for panelist training. Photographs taken during pre-trials are useful for training. Pictorial color standards should be stored in the dark because most are sub-ject to light-induced color changes (see Section XII). Finding pictorial scales that fit specific ob-jectives of color research is nearly impossible; however, some portions of pictorial guides may be useful for training and as points of reference.
Panelists need to know if they will be evaluating initial color and/or color changes during dis-play. These require different scoring scales. They also need to know if they give an average color score for the entire sample and/or if they give a “worst point” color score (generally defined as an undesirable single or combined area of at least 2 cm2 area of color) or a percentage discolor-

Section VI: Guidelines, Visual Meat Color Measurement 33
ation score. If percentage discoloration (due to any “deteriorative color” or to MMb, specifically) is evaluated, be sure that the percentage breaks in the scale are realistic and reflective of con-sumer discrimination. Research literature generally shows that consumers start to detect and discriminate against 15 to 30% surface MMb, but the area covered by the discoloration needs to be carefully categorized by percentages (see Section VII).
G. Sample ThicknessUse samples that are at least 12 to 15 mm thick; stack wafer-type samples and evaluate against a white background or stacking product. Most baking boards or plastic foam trays meet this requirement. Because background color is often hard to standardize between research stations, using anything other than white background colors (trays and absorbing pads) is not recom-mended.
H. Packaging FormatSelect appropriate packaging formats to meet objectives of the research. Often meat is over-wrapped with film that is highly permeable to oxygen, but other formats are available, each with unique film/tray requirements. These should be carefully selected and clearly described in the experimental procedures (see Section V).
I. Panelist Viewing AngleKeep panelists viewing angle constant to the light source. A viewing angle of approximately 45° will diffuse reflectance and reduce glare from package film. Maintain the same viewing angle throughout the study.
J. Rotating of Packages During DisplayRotate packages daily (or at some other appropriate frequency) from front to back and side to side of coffin-type cases to help minimize variations in temperature, air movement, and light-ing during display. Rotation in multi-tier is not recommended because of shelf and within shelf temperature differences. It is better to analyze for position differences within a shelf if enough product is available (see Section V).
K. Objective Measures of Surface and Subsurface PigmentsFor some experiments, objective visual methods may be useful; using a grid or planimeter to measure the proportion of the surface area that is discolored are two possible methods. Other studies might need to measure the depth of myoglobin pigments from the surface using a digital caliper (Section XI) that can discern 0.01 mm.
L. Display Case Temperatures and Defrost CyclesStandardize case display temperatures (see Section V). If cases have defrost cycles, these also must be controlled. Display case temperatures should be evaluated at the meat level within the display case. Be aware that case temperature usually is not the same as product temperature. The latter can be determined by placing a thermocouple 1 mm below the light-exposed surface

34 Color Guidelines Handbook
of the meat. Infrared hand held units are very useful for monitoring and reporting temperatures in various locations within cases.
M. Lighting Type and IntensityStandardize the type of lighting and lighting intensity used for color evaluations and display studies (see Section V). Recommended lighting intensity to simulate retail display is 1612.5 to 2152 lux (150 to 200 foot-candles) continuously, 24 hours/day. Good lighting is necessary for appearance and illumination, but avoid excessive heating and light-induced discoloration. Light meters for tracking intensity are available from scientific and photographic companies.
N. Visual Parameters to ReportAt the end of any retail study, document the following parameters and include them in your the-sis or manuscript:
1. A thorough description, including product thickness, of the meat or meat products 2. Type of panel (descriptive versus consumer) 3. Number of panelists and type of screening/training used 4. Scales used for visual appraisal 5. Frequency of panelists’ evaluation 6. Duration of the display study 7. Lighting source and intensity 8. Display case temperatures, product temperatures, and defrost cycles 9. Chemical and physical properties of packaging materials, especially film and tray
permeability for O2 and water vapor (if appropriate CO2 and CO), film thickness, and tray type, thickness, and color
10. Package rotation schedule within display cases

35
SECTION VII
Visual-Color Scoring Scales
Visual-color scoring scales can be used for consumer-preference panels or for trained descriptive visual-color panels, but each panel type should use different scales (see Section IV). Hedonic scales are commonly used for consumer-preference panels and evaluate how much a consumer prefers the color and appearance of products on display. Trained descriptive-color panels often use more complex scales and characterize meat color, evaluate color throughout shelf life, and/or assess the amount of discoloration.
In this section are several examples of scales that can be used for various products and packaging environments, but most scales, including those listed below and those selected fromtheliterature,likelywillneedthecolordescriptivetermsmodifiedtomeetindividualstudy objectives. Scoring scales for all visual-color panels must be selected and adapted to fittheuniquenessoftheproductandobjectivebeingevaluated.Consequently,investigatorsmustconductpreliminaryexperimentstoseewhetherselectedscalesadequatelycharacterizethespecificchangesobservedintheexperiment.Duringthesesessionswithpanelists, scales must be anchored to actual, preliminary samples or pictorial references, so all panelists use the scale similarly. See Sections IV, V, and VI for details on the training of panelists.

36 Color Guidelines Handbook
Color of the Meat in this Package
7 = Like very much 6 = Like moderately 5 = Like slightly 4 = Neutral 3=Dislikeslightly 2=Dislikemoderately 1=Dislikeverymuch
Based on Meat Color
7=Verydefinitelywouldpurchase 6=Definitelywouldpurchase 5 = Probably would purchase 4 = May or may not purchase 3 = Probably would not purchase 2=Definitelywouldnotpurchase 1=Verydefinitelywouldnotpurchase
This Meat Has Desirable Color
7 = Very strongly agree 6 = Strongly agree 5 = Slightly agree 4 = No opinion 3 = Slightly disagree 2 = Strongly disagree 1 = Very strongly disagree
A. Hedonic Scales for Consumer PanelsUsed by consumer-preference panelists to characterize opinions, preferences, desirability, will-ingnesstopurchase,etc.Often,open-endedquestionstoaccompanyhedonicscalescanhelpex-plainwhatexactlyconsumersdoordonotlikeaboutsamplesfromaspecifictreatment.Whenusing these types of panels and scales, the term of “neutrality” must be included, so panelists do not have to indicate a preference if they do not feel strongly one way or another.
Overall Meat Color Is
9 = Extremely desirable or acceptable color 8 = Very desirable or acceptable color 7 = Moderately desirable or acceptable
color 6 = Slightly desirable or acceptable color 5 = Neither acceptable or unacceptable
color 4 = Slightly undesirable or unacceptable
color 3 = Moderately undesirable or
unacceptable color 2 = Very undesirable or unacceptable color 1 = Extremely undesirable or unacceptable
color

Section VII: Visual-Color Scoring Scales 37
B. Descriptive (Psychometric) Scales for Trained PanelsUsed by descriptive-visual panelists to characterize meat color at the beginning of or during display(suchasPSE,DFD,etc.),tofollowdiscolorationduringdisplay,andtoidentifyvariationsin color.
Oxygenated or Carbon Monoxide Modified Atmosphere Packages
(Red = beef or lamb, Grayish-pink = pork or turkey)
1 = Pale red or pale grayish-pink 2 = Slightly pale red or pale grayish-pink 3 = Moderately light red or light grayish pink 4 = Bright red or grayish pink 5 = Slightly dark red or grayish-pink 6 = Moderately dark red or grayish-pink 7=Darkredorgrayish-pink 8 = Very dark red or grayish-pink
*Panelists can record scores to the nearest 0.5 point.
Low-Oxygen Packages
(Purple-red = beef or lamb, Purplish-pink = pork or turkey)
1 = Pale purple-red or purplish-pink 2 = Slightly pale purple-red or pale purplish-pink 3 = Moderately light purple-red or purplish-pink 4 = Purple-red or purplish-pink 5 = Slightly dark purple-red or purplish-pink 6 = Moderately dark purple-red or purplish-pink 7=Darkpurple-redorpurplish-pink 8 = Extremely dark purple-red or purplish-pink
*Panelists can record scores to the nearest 0.5 point.

38 Color Guidelines Handbook
Beef or Lamb in Oxygenated Packages
(Cherry-red=beef,Brick-red=lamb)
1 = Extremely bright cherry-red or bright brick-red 2 = Bright cherry-red or bright brick-red 3 = Moderately bright cherry-red or bright brick-red 4 = Slightly bright cherry-red or bright brick-red 5 = Slightly dark cherry-red or bright brick-red 6 = Moderately dark red 7=Darkred 8 = Extremely dark red
*Panelists can record scores to the nearest 0.5 point.
Pork or Turkey in Oxygenated Packages
1 = Very bright reddish pink 2 = Bright reddish pink 3=Dullreddishpink 4 = Slightly grayish pink 5 = Grayish pink 6 = Slightly tannish gray 7 = Moderately tannish gray 8 = Tan to brown
*Panelists can record scores to the nearest 0.5 point.
Beef or Lamb in High-Oxygen MAP or Carbon Monoxide Modified Atmosphere Packages
1 = Very bright red 2 = Bright red 3=Dullred 4 = Slightly dark red 5 = Moderately dark red 6=Darkredtodarkreddishtan 7 = Tannish red 8 = Tan to brown
*Panelists can record scores to the nearest 0.5 point.
C. Meat Display Color Stability (Whole Muscle, Not Ground)Used to evaluate how meat color changes throughout shelf life.

Section VII: Visual-Color Scoring Scales 39
Low-Oxygen Packages
(Purple-red = beef or lamb, Purplish-pink = pork or turkey)
1 = Extremely bright purple-red or purplish-pink 2 = Bright purple-red or purplish-pink 3 = Moderately bright purple-red or purplish-pink 4 = Slightly purple-red or purplish-pink 5 = Slightly dark purple or purplish-pink 6 = Moderately dark purple or purplish-pink 7=Darkpurpleorpurplish-pink 8 = Extremely dark purple or purplish-pink
*Panelists can record scores to the nearest 0.5 point.
Product Worst-Point Color
The worst-point color is a single or combined area of at least 2 cm2 (or some other pre-determinedarea).Scoreusingthesamescaleusedtoevaluate“average”color.Forexample,if using the scale below and if the worst-point colored area was “slightly dark cherry red,” the worst-point color score would be a 5.0. The overall average score for the cut could still be a 2.5 excluding the worst-point colored area.
1 = Extremely bright cherry-red or bright red 2 = Bright cherry-red or bright red 3 = Moderately bright cherry-red or bright red 4 = Slightly bright cherry-red or bright red 5 = Slightly dark cherry-red or bright red 6 = Moderately dark red 7=Darkred 8 = Extremely dark red
Amount of Browning
1 = No evidence of browning 2=Dull 3 = Grayish 4 = Brownish-gray 5 = Brown 6=Darkbrown
*Panelists can record scores to the nearest 0.5 point.

40 Color Guidelines Handbook
Discoloration
1 = None 2 = Slight 3 = Small 4 = Moderate 5 = Extreme
*Panelists can record scores to the nearest 0.5 point.
Surface Discoloration (% Metmyoglobin Formation)
1 = No discoloration, 0% 2 = Slight discoloration, 1 to 20% 3 = Small discoloration, 21 to 40% 4 = Modest discoloration, 41 to 60% 5 = Moderate discoloration, 61 to 80% 6 = Extensive discoloration, 81 to 100%*UsethisscaleformoredefinitivetreatmentdifferencesforMMb.
Surface Discoloration (% Metmyoglobin Formation)
1 = No observable MMb, 0% 2 = Slight amount of MMb, 1 to 15% 3 = Small amount of MMb, 16 to 30% 4 = Moderate amount of MMb, 31 to 45% 5 = Extensive MMb, >45%
*Use this scale to determine how consumers often detect and discriminate against MMb.

Section VII: Visual-Color Scoring Scales 41
D. Ground Meat ColorScales for descriptive panelists to evaluate meat color changes throughout shelf life.
Ground Meat Initial Color for Differing Fat Levels
(Red = beef or lamb, Pink = pork)
1 = Very light red or grayish-pink 2 = Moderately light red or grayish-pink 3 = Light red or grayish-pink 4 = Slightly bright red or grayish-pink 5 = Bright red or grayish-pink 6 = Slightly dark red or grayish-pink 7 = Moderately dark red or grayish-pink 8=Darkredorgrayish-pink
*Panelists can record scores to the nearest 0.5 point.
Ground Product Display Discoloration
(Bright red = beef, reddish-pink and tannish-gray = pork and turkey)
1 = Very bright red or reddish-pink 2 = Bright red or reddish-pink 3=Dullredorreddish-pink 4 = Slightly dark red or reddish-pink 5 = Moderately dark red or reddish-pink 6=Darkredtotannish-redortannish-gray 7=Darkreddish-tanortannish-gray 8 = Tan to brown
*Panelists can record scores to the nearest 0.5 point.

42 Color Guidelines Handbook
E. Cooked Meat ColorUsed by descriptive panelists to evaluate heating effects on meat color.
Internal Cooked Color
1 = Very red 2 = Slightly red 3 = Pink 4 = Slightly pink 5 = Pinkish-gray 6 = Grayish tan/brown 7 = Tan/brown
Internal Doneness (AMSA Pictorial Guide for Beef Steak Color)
1 = Very rare 2 = Rare 3 = Medium rare 4 = Medium 5=Welldone 6 = Very well done
Differences in Cooked Surface Color
−3=Moderatelydarker −2= Slightlydarker −1=Veryslightlydarker 0 = Not different from control 1 = Very slightly lighter 2 = Slightly lighter 3 = Moderately lighter
Uniformity of Cooked Surface Color
1 = No variation 2 = Slight variation 3 = Small variation 4 = Moderate variation 5 = Extreme variation

Section VII: Visual-Color Scoring Scales 43
F. Cured Meat ColorDescriptivepanelistscalesforfollowingdifferencesinthecuredmeatpigment.
Initial Cured Color Intensity
1 = Very intense cured color 2 = Intense cured color 3 = Moderate cured color 4 = Medium cured color 5 = Modest cured color 6 = Slight cured color 7 = No cured color
Cured Color Characterization
1 = Very dark red cured color 2 = Moderately dark red cured color 3 = Slightly dark red cured color 4 = Reddish-pink cured color 5 = Pinkish-red cured color 6 = Slight pinkish-red cured color 7 = Pinkish cured color 8 = Light pinkish cured color
Cured Color Fading
1 = No fading 2 = Slight fading 3 = Small fading 4 = Moderate fading 5 = Extreme fading

44 Color Guidelines Handbook
Bone Marrow Color
1 = Bright reddish-pink to red 2=Dullpinkish-red 3 = Slightly grayish-pink or grayish-red 4 = Grayish-pink or grayish-red 5 = Moderately gray 6 = All gray or grayish-black 7 = Black discoloration
Muscle Darkening in Enhanced Steaks
1 = No darkening 2 = 3 = Slightly dark 4 = 5 = Moderately dark 6 = 7 = Very dark
Heat Ring
1 = None 2 = Slight 3 = Small 4 = Moderate 5 = Severe
Iridescence Intensity and Extent
1 = No iridescence, 0% 2 = Very slight iridescence, 1 to 20% 3 = Slight iridescence, 21 to 40% 4 = Moderate iridescence, 41 to 60% 5 = Strong iridescence, 61 to 80% 6 = Very strong iridescence, 81 to 100%
Surface Color Uniformity
1 = Uniform, no two-toning 2 = Slight two-toning 3 = Small amount two-toning 4 = Moderate two-toning 5 = Extreme two-toning*Panelists can record scores to the nearest 0.5 point.
Fat Color
1=White 2= Creamywhite 3 = Slightly yellow 4 = Moderately yellow 5 = Yellow
Fat Discoloration
1 = No discoloration 2 = Slightly discolored 3 = Moderately discolored 4 = Extremely discolored
Purge Characterization
1 = Other (list on scoring sheet) 2 = Milky white 3=Opaque 4= Clear 5 = Light red 6=Darkredorpurple
Off-odor, Immediate and 30 Minutes After Opening Package
1 = No off-odor 2 = Slight off-odor 3 = Small off-odor 4 = Moderate off-odor 5 = Extreme off-odor
Unstructured
A 15-cm line anchored with appropriate descriptive terms.
G. Other Scales Associated with Meat Color Evaluation

45
SECTION VIII
Guidelines, Instrumental Meat Color Measurement
Instrumental color measurement is an objective color characterization method that works well alone or in combination with visual color data. The guidelines in this section can be used as a quick reference for collecting instrumental color data. However, for more informa-tion regarding instrumental color, see Sections III and IX).
A. Instrument Selection
1. Colorimeters only measure tristimulus values (CIE L*a*b*) and often have a set combination of illuminant and observer.
2. Spectrophotometers are more complex instruments that supply spectral analysis in intervals of 1 to 10 nm and offer several illuminant/observer combinations for the calculation of tristimulus values.
3. Both of these instruments are excellent for meat color measurements, but for estimating percentage of surface myoglobin forms, a spectrophotometer must be used.
B. Illuminant SelectionDecide on the best illuminant based on the type of sample being evaluated. The most com-monly used illuminants are A, C, and D65.
1. IlluminantA(averageincandescent,tungsten-filamentlighting,2857K)placesmoreemphasis on the proportion of red wavelengths and is recommended for samples where detection of redness differences between treatments is the priority. Values of a* measured for Illuminant A will be larger than those for Illuminant C (average northskydaylight,6774K)andIlluminantD65 (noondaylight,6500K).IlluminantAisrecommended for measuring meat color.
2. Illuminants C and D65 place less emphasis on the red wavelengths and are frequently used to evaluate many food products. Small differences in redness may not be as easily detected with these illuminants, yet the relative differences detected should be in the same order as those obtained from Illuminant A. Values for a* from Illuminants C and D65 should be similar in magnitude but considerably smaller than for Illuminant A.

46 Color Guidelines Handbook
3.Otherilluminants,F(severalinafluorescentseries)andD(severalinadaylightseries),are available and may be appropriate for some meat investigations.
4. Conductaliteraturesearch,useinformationfrominstrumentsuppliers,andconsiderthe sample properties when selecting the illuminant to use for instrumental color evaluations. Highly consider using Illuminant A as the illuminant of choice unless the product you are studying already has an illuminant requirement. Some instrument companies provide software to interconvert between illuminants, but it may be necessarytocollectreflectancedatafrom400to700nmfortheseinterconversions(seeKandNinthisSection).
5. Values for a* can vary by 5 to 25 units for the same sample depending upon the illuminant used. For beef with a bright-red, “bloomed” color, typical a* values for IlluminantAare30to40+,whereasa*valuesforIlluminantsCandD65are20to30+.However, this also depends on the aperture size; smaller apertures will further reduce these values.
C. Degree of Observer SelectionSome instruments provide multiple degrees of observers (see Glossary for details). Most common are 2° and 10° observers. The 10° observer is most commonly used for meat color measurement and is recommended because it captures a larger portion of the sample scanned, anditalignswiththeCIE196410°StandardObserver.
D. Aperture Size SelectionSelecting and reporting aperture size for examining meat color is often overlooked but is vital in interpreting data and comparing data among studies. Researchers often attempt to compare their color data with those of other researchers without due consideration for differences relat-ed to aperture size. This frequently results in erroneous comparisons. As aperture size decreas-es,thepercentagereflectancedecreasesparticularlyatredwavelengthsbetween600and700nm(YanceyandKropf,2008).Thiscanalsoaffectreflectanceratioslikethe630/580nmratio,whichdescribesmeatdiscoloration,andthe650/570nmratio,whichdescribescuredmeatfading. Additionally, tristimulus CIE L*a*b* values decrease as aperture size decreases with the most difference noted in a* values.
Selecting an appropriate aperture size is inherently associated with the size of the sample beingevaluated.Aperturesizescanrangefrom8mmtomorethan3.18cm.Selectthelargestaperture size that allows multiple measurements (at least 3 are recommended) of the same sample. If samples have a non-uniform appearance (for example, samples with high quantities of intramuscular fat or connective tissue), select the aperture size that covers only the meat area and use >3 scans per sample, then average the values. Do not change aperture sizes during an experiment because the values for CIE L*a*b* will differ between aperture sizes.
E. Instrument StandardizationInstrument standardization and re-standardization are critical for reliable data collection. Standardization of instruments may vary by model and brand. Thus, following the directions supplied with the unit is essential. Generally, standardization is based on scans of black and white standardized tiles. Investigators should follow this at start up and when re-checking

Section VIII: Guidelines, Instrumental Meat Color Measurement 47
standardization periodically, especially if the environmental temperature varies where measurements are taken.
Before standardizing the instrument, determine the type of packaging materials that will be used and retain some unused samples for use in standardization. For example, if the meat sam-plesarepackagedusingpolyvinylchloridefilm,thestandardizationtilesshouldbewrappedinthatfilm.Ensurethisfilmispulledsmoothlyaboutthetile,isnotwrinkled,uneven,orsmearedwithfatorprotein,andthefilmchangedfrequentlytoeliminateinaccuratestandardization.Standardization procedures should be reported in manuscripts.
F. Sample Thickness and UniformityUsually,samplesatleast12to15mmthickaresufficienttoabsorbnon-reflectedlight.Trans-lucency of samples should be checked by holding the instrument on the sample in a dark room and watching for light to pass through the sample. If light passes through, then a standardized white background must be placed behind the sample (black backgrounds are harder to stan-dardize than white). Wafered product or other thin samples should be stacked to a uniform thickness and then put on a white or black tile or other background such as Styrofoam or other packaging trays.
Areas within a sample can vary in size, color, and structural uniformity, so sample surface uniformitymustbeconsidered.Specificareascanbeseverelydiscoloredandcontainintra-muscular fat or seams of connective tissue, whereas other areas have normal color. With larger aperture sizes, a minimum of 3 scans are recommended, but more scans are appropriate if the samplehassufficientsizetoallowmultiplescansorvariesconsiderablyincoloracrossthesurface. Multiple scans may then be averaged for statistical analysis if all scans used the same aperture size.
G. Protecting the Aperture PortMeat surfaces with considerable moisture (as in PSE meat or enhanced treatments) may cre-ateproblemswithlightreflectanceandaccuratereadings.Effectsofexcessivesurfacemoisturecan be minimized by uniformly blotting the moisture from the surface. Some instruments have a glass port covering the aperture opening. Take care to check for condensation or haze on the inside of the glass cover and keep fat smears off the outer surface. If the aperture is uncovered, moisturecanbepreventedfromenteringtheinstrument’sreflectanceportbytapingapieceofthinfilmlikepolyvinylchlorideorapieceofspectrallypureglassovertheinstrument’sport.Standardization procedures should include such a covering if it is to be employed in the scan-ning of samples. Take care to remove moisture and fat smears from this surface after every scan.Filmsshouldbechangedfrequently,especiallyifbottomsofsamplesarescanned(reflec-tance unit beneath the sample). Cleaning the interior of the port is best done by a specialist.
H. Two-Toned Versus Discoloration PatternMost large muscles of the bovine hind leg and some quadriceps muscles have two-toned muscle colorduetodifferentialchillingrates,pHdeclines,and/ormusclefibertype.Thesemusclesroutinelyexhibitatwo-tonedappearanceinthesuperficialversusthedeepportionsandshouldbe analyzed as “separate” muscles (see Sammel et al., 2002a). Instrumental color scans should be taken of each muscle area and averaged independently.

48 Color Guidelines Handbook
When samples do not exhibit a “two-toned color,” but discolor in a particular pattern, scans should be taken that represent the entire surface area of the samples and the values averaged.
I. Avoiding PillowingWhen collecting data, gently place the port on the sample applying just enough pressure to make sure no light enters or exits the aperture. With too much pressure, the meat will form a curvedsurface(pillowing)thataltersthereflectancecomparedtothedesiredflatmeatsurface.Generallytheweightoftheinstrumentissufficienttoblocklightlosswithoutpillowingthesample surface. When using small, hand-held instruments or hoods, let these rest on the meat surface, allowing their own weight to create uniform pressure. Any pressure applied by the operator(s) can be variable, thus affecting color readings.
J. Calculating Myoglobin Redox FormsIn calculating the percentages of one or more of the myoglobin redox states, pay meticulous attention to details in Section IX. Additionally, this type of data should be collected using an appropriate narrow spectral bandwidth spectrophotometer that provides the necessary wave-length precision to enable these measurements.
K. Downloading DataAfter collecting instrumental color data, download the data from the instrument to a computer and be sure to save both tristimulus values and spectral data. With spectral data, other calcula-tions can be made in addition to those originally intended. Furthermore, spectral data can be converted from one illuminant to another. If using algorithms to calculate chroma (saturation index), hue angle, or K/S values (see glossary for details), verify that the values and decimal pointsarecorrect(seeN-3ofthisSection).
L. Ratios for Characterizing ColorRatiosordifferencesofreflectanceatselectedwavelengths(seeFigures8.1and8.2andSec-tion IX, Figure 9.1 for isobestic wavelengths) and calculated color traits like chroma (saturation index) = (a*2+b*2)1/2 and hue angle = [arctangent (b*/a*)] are commonly used to evaluate meat color(MacDougall,1982).AdescriptionofvariouscalculatedparametersisavailableinTable8.1.
M. Objective Measures of Surface and Subsurface Pigments
For some experiments, objective visual methods, such as measuring the proportion of the surface area that is discolored with a grid, planimeter, or image analysis software may be use-ful.Otherstudiesmightbenefitfrommeasuringthedepthofmyoglobinpigmentsfromthesurface using a digital caliper capable of discerning at minimum 0.1 mm. Still another method to consider is using near infrared tissue oximetry to calculate absolute amounts of surface and subsurface DMb, OMb, and MMb in samples using the methodology described by Mohan et al. (2010a).

Section VIII: Guidelines, Instrumental Meat Color Measurement 49
Table 8.1. Details on the calculation of various color parameters
Color parameter Purpose of calculation
630nm ÷ 580 nm Larger ratios and differences indicate more redness due to either OMb oror 630nm – 580 nm DMb; a ratio of 1.0 would indicate essentially 100% MMb (Strange et al.,
1974) and a more brown, well-done color in cooked meat (Tappel, 1957; Ledward, 1971; Howe et al., 1982; Flores et al., 1985; Lyon et al., 1986; Trout, 1989; Marksberry, 1992). This parameter has been used to follow color change during display, but it is not specific for OMb because DMb is also more red than MMb at 630 (Figure 8.2).
650 nm ÷ 570 nm Ratio values of ≈1.1 = no cured color; ≈1.6 = moderate fade; ≈1.7 to 2.0= noticeable cured color; ≈2.2 to 2.6 = excellent cured color (Hunt and Kropf, 1988; see Figure 8.1)
570 nm ÷ 650 nm Ratios for cured meat successfully used by Barton (1967a,b) where small values indicate less fade.
537 nm ÷ 553 nm Ratio to establish nicotinamide hemochrome as a pink color defect in uncured cooked light poultry meat. Higher ratios equal more nicotinamide hemochrome (Schwarz et al., 1998). (See Figure 8.2.)
474 nm ÷ 525 nm Isobestic wavelengths of OMb and MMb (Section IX, Figure 9.1) for calculating DMb
572 nm ÷ 525 nm Isobestic wavelengths of DMb and OMb for calculating MMb
610 nm ÷ 525 nm Isobestic wavelengths of DMb and MMb for calculating OMb
a* ÷ b* or b* ÷ a* Larger ratios of a*/b* (or decreases in b*/a*) indicate more redness and less discoloration (Setser, 1984)
Chroma C = (a*2 + b*2)1/2 with larger values indicating more saturation of the (saturation index) principle hue of the sample. Very useful to indicate intensity of whatever the
hue is on the product.
Hue angle HA = [arctangent (b*/a*)]. Take care in calculating HA (See below.) Larger values indicate less red, more MMb and a more well-done cooked color (Bernofsky et al., 1959; Howe et al., 1982). Very useful to indicate shifts in color over time toward discoloration.
Delta E Total color change over a selected period of time. Generally calculated as ∆E = [(∆L*)2 + (∆a*)2 + (∆b*)2]1/2. Useful parameter to show total color differences over time. Various periods of time can be selected and compared.
These parameters do not all have to be measured; select the ones most pertinent for the objectives of the study. Ideally, L* a*b* data will correlate nicely with each other, other instrumental indicators of color, and visual obser-vations, but basing treatment effects on just one parameter (such as a* alone) may not tell the complete color history. Likely b* also reflects important color changes. Always collect a variety of data (especially both a* and b* and their calculated parameters) and then make informed decisions about what best depicts color changes for treatments. All data need not be reported, but missing data cannot be reported at all, thus affecting reliability of results.

50 Color Guidelines Handbook
N. Pitfalls of Instrumental Color Measurement 1. Collectionofbothtristimulusandreflectancedata.When collecting tristimulus
data, understand fully the instrumentation and data software. Many software packages allow the tristimulus data to be converted to different illuminants. For example, the instrument may be set to record data using Illuminant A, but the software will allow this data to be converted to C and D65 laterifspectradatafrom400to700nmarerecordedand downloaded with the original tristimulus data. This function should be used when data from other illuminants might be of interest. To complete this data conversion, the instrumentshouldbesettorecordspectralreflectancedatainadditiontotristimulusdata.Thisiscriticalbecausespectralreflectancedataisusedtocalculateilluminantinter-conversions. Thus, failure to collect spectral data means this conversion cannot be done.Furthermore,spectralreflectanceinthevisiblespectrumisnecessarytoestimatethe percentage of myoglobin forms present on the meat surface or to use ratios that track freshmeatcolorchangelike630nm÷580nm(rednessindicator)or650nm÷570nmfor track cured meat color fade.
2. Scanningmodified-atmospherepackages.Recent developments in fresh-meat packagingtechnologyhavecreateduniqueproblemswithinstrumental-reflectancemeasurements of meat samples. The proliferation of MAP with a gaseous headspace betweenthemeatsurfaceandthefilmhasincreasedthedifficultyofobtainingmeasurements during display. With traditional polyvinyl chloride-covered samples on foam trays, scanning a sample was easy, even repeatedly throughout a simulated retail
Figure 8.1. Cured color intensity and fading using reflectance ratio 650 nm ÷ 570 nm. Courtesy of D. H. Kropf and M. C. Hunt, Kansas State University.

Section VIII: Guidelines, Instrumental Meat Color Measurement 51
Figure 8.2. Reflectance wavelength ratios useful for following redness (raw meat), cured pigment fading (cured, heatprocessed), and the pinking defect in poultry (uncured, cooked). Courtesy of M. C. Hunt and D. H. Kropf, Kansas State University.
display. With MAP packaging, this becomes more cumbersome. The package must be invertedtoallowthemeatsurfacetocontactthefilmsurfaceinordertoscanthemeat.The package is then returned to its normal position with the meat no longer in contact withthefilm.Often,thismaneuverresultsintheaccumulationofmoistureand/orfatsmearonthefilmsurface.However,openingthepackagewouldcompromisethemodifiedatmospherewithinthepackageandterminatethesamplefromthestudy.
Two techniques help minimize this potential problem. Some researchers prepare multiple sub-samples from the same original sample and package each sub-sample individually. All packages are displayed, and a single package is opened at predetermined intervals during the study to scan the meat surface. While not a true repeated measurement, this prevents any interference that may occur from inverting packages duringdisplay.Deficienciesofthisapproachincludepackageatmospherevariabilityand inherent differences among samples. The latter should be minimized when samples come from the same original sample. If researchers choose this option, they must test the gaseous atmosphere of each package prior to opening to ensure that the target atmosphere has been maintained throughout display. The second option is to scan the same sample repeatedly during display by inverting the package, but to do scans less often (not daily) to minimize package inversion. This offers the researcher a true repeated measure of the sample during display with minimal package variability and smearonthefilmsurface.However,scanninglessfrequently(atthesepredeterminedtimes during display) could result in not capturing the exact timing of color changes.
In many experiments it would be nice to follow the changes of pigment redox forms belowthesurfaceofmeat.Mohanetal.(2010a)usedNRItissueoximetrytomeasureboth surface and subsurface quantities of myoglobin redox forms.

52 Color Guidelines Handbook
3. Nuisances for calculating hue angle and K/S values. When calculating hue angle, unless the calculation is done properly, the researcher will have the incorrect angle values. With only positive values for a* and b*, then the sample falls in the upper right quadrant of the Hunter Color Space for hue angle. With any negative values of a* or b*, comments in McLellan et al. (1995) become applicable.
Calculatingtheabsorptionandscatteringcoefficients(K and S) for determining the percentageofsurfacemyoglobinredoxformsrequirescare.WhenR(%reflectance)is put into the formula, K/Sforaspecificwavelength=(1−R)2 ÷ (2R), the R must be expressed as a decimal, not as a percentage. When interpolation is needed of the reflectanceatwavelengthsnotgivenbytheinstrument(suchas474nm,572nm),firstcalculatethereflectanceatthesewavelengths,andthenconverttoK/S values. Incorrectly entering information would mean that K/S values are calculated incorrectly by software and statistical programs and thus are valueless (see A and C of Section IX).
O. Reporting of Instrumental DetailsIn a manuscript or report including instrumental color data, include the following information:
1. Instrumentation brand and model number 2. Illuminant 3. Aperture size 4.Degreeofobserver 5. Standardization methods 6.Datacollected,tristimulusvalues,specifiedwavelengths,rangeofnanometersscanned,
and any special parameters or calculations 7.Numberofscanspersampleandifthescanswereaveragedforstatisticalanalysis 8. Scanningfrequencyandwhetherasinglesamplewasscannedrepeatedlyduringdisplay
or whether different samples represented the same experimental unit 9. Type of packaging used 10. If packages were opened or unopened at the time of scanning

53
SECTION IX
Equations for Quantifying Myoglobin Redox Forms
on Fresh Meat
Reflectance measurement closely relates to what the eye and brain perceive. With this non-destructive sampling method, repeated measurements over time can be performed on the same sample. Moreover, the procedure is rapid and easy to perform. However, considerable attention to detail is needed because reflectance measurements are affected by among other things, muscle structure, surface moisture, fat content, pigment concentrations, pH, and other inherent muscle properties. Quantitative analyses of specific myoglobin forms are out-lined in this Section.
There are two reflectance methodologies for quantifying myoglobin redox forms. One involves using surface reflectance to calculate K/S ratios at isobestic wavelengths for each myoglobin redox form (Francis and Clydesdale, 1975). The other method uses selected wavelengths with a correction factor (Krzywicki, 1979) to calculate percentages of DMb and MMb and determines OMb by difference from 100%.
Estimating DMb, OMb, and MMb (and the equivalent hemoglobin forms) is essential for basic studies of meat pigment stability. However, Ledward (1970) warns that reflectance estimates of the pigment chemical forms were accurate only to ± 6 or 7%. Digital photos of DMb, OMb, COMb, and MMb are available on the AMSA website.
A. The K /S Method of Isobestic WavelengthsReflectance at wavelengths that are isobestic (equal reflectance for two or more of the three myoglobin forms; see Figure 9.1) is measured on the meat sample surface and converted to K/S values (see Section C for calculation, Judd and Wyszecki, 1963). Converting reflectance to K/S values makes data more linear and helps account for the scattering (S = scattering coefficient) and absorptive (K = absorbance coefficient) properties of meat (Francis and Clydesdale, 1975). The sample K/S values are put into equations requiring reference values for 100% of the three primary meat pigment forms. Please note that K/S reference values for each of the 100% myoglobin forms vary with conditions, packaging, samples, and instru-ments unique to each experiment. Hence, researchers need to determine their own 100% reference values with prepared samples from their experiment rather than use previously published values.

54 Color Guidelines Handbook
B. Creating “100%” Myoglobin Redox Forms for Reference Standards
To quantitatively determine the amounts of myoglobin redox forms on meat surfaces, you must have spectrophotometric reflectance values for each pigment form at the isobestic wavelengths (Figure 9.1). Creating reference standards composed of “100%” of DMb, OMb, MMb, or COMb on the meat surface is not easy and requires special consideration because each redox state can interconvert rapidly. The forms can be induced chemically or by adjusting the partial pressure of oxygen. When scanning 100% standards, all samples should be scanned through the same packaging film to remove a potential source of reflectance variation. If sufficient samples are available, it is highly recommended to dedicate an entire sample, such as a chop or steak, to pigment form measurements.
1. Metmyoglobin. Select one of the methods below. a. Chemical induction: Immerse samples in 1.0% potassium ferricyanide for 1 minute,
drain, blot surface, package in oxygen-permeable film to oxidize at 2 to 4°C in 1% oxygen for 48 hours or longer to maximum formation of MMb before scanning. If the meat is “fresh,” the MMb may get reduced on the surface and a very short distance below the surface and, therefore, will not yield the most complete MMb reflectance scan. It is best to start with meat that is older postmortem because of its inherent lower reducing activity.
b. Regulation of the oxygen partial pressure: Preferably start with meat in the DMb state. Metmyoglobin formation is usually faster in ground than intact meat (likely due to higher oxygen consumption and/or less MMb reduction. Store meat in an oxygen-impermeable bag with an atmosphere of 1% oxygen and 99% nitrogen at room temperature (about 20°C) for 6 hours; then measure the oxygen in the bag (goal is to deplete tissue oxygen to 1%, which occurs faster at warmer temperatures). If the
Figure 9.1. Reflectance and isobestic wavelengths use for quantitative determina-tion of myoglobin redox forms. Courtesy of M. C. Hunt and D. H. Kropf, Kansas State University.
Section IX: Equations for Quantifying Myoglobin Redox Forms on Fresh Meat 55
residual oxygen is <1%, increase the residual oxygen by injecting a known volume of atmospheric air (which should be about 20.6% oxygen) into the oxygen-imperme-able bag using a self-sealing septum, syringe, and a thin needle. With the approximate volume of the bag and the known oxygen concentration, use the following formula to adjust oxygen concentration (volume of the bag × concentration of residual oxygen in the bag) to equal the [desired volume being adjusted × concentration of desired oxygen (1%)]. If the oxygen is >1%, the bag may need additional flushing. Use a gas to meat ratio of 3 to 1 or more to avoid myoglobin reduction during storage. The less oxygen absorbed by the meat at the beginning, the easier the conversion; residual oxygen should be checked and adjusted periodically. Maintain 1% oxygen for at least 48 hours or longer at 4°C to ensure formation of 100% MMb. When pigment is fully converted, re-package in oxygen-permeable film and scan for MMb. Using stored or aged meat with low metmyoglobin reductase activity will mean a more rapid conver-sion to MMb. Fresh meat can take up to a week to turn brown. Carefully monitor the concentration of oxygen and the development of browning during storage.
c. To convert pigment in ground product to MMb, put meat in a bag, flatten it with a roller (thin enough for the atmosphere to penetrate more than 50% of the thickness of the meat), evacuate the air within the bag, flush with 100% nitrogen, determine and adjust residual oxygen to 1% as described above. Store for pigment conversion on one side. Halfway through the conversion, turn the modified atmosphere pack-age over and loosen the meat from the bag exposing the other side of the meat to the atmosphere. After 48 hours at 4°C, re-package in oxygen-permeable film and scan several surfaces for MMb.
2. Deoxymyoglobin. Select one of the methods below. a. Chemical Induction: Immerse samples of uniform dimensions in 0.15% dithionite at
room temperature (about 20°C) for 1 to 2 minutes, drain, blot surface, vacuum pack-age, and allow to reduce for 1 to 2 hours at 20°C to maximize conversion to DMb. Re-package in oxygen-permeable film to keep film type the same as that used to measure myoglobin forms in Sections 1 and 3 and scan immediately. Ground product can be supported using a screen in a beaker.
b. Regulation of the oxygen partial pressure: Make a fresh-cut surface on the sample’s interior surface, which should be essentially 100% DMb, and scan IMMEDIATELY and likely only once. Deoxymyoglobin is difficult to retain at 100%.
c. Alternatively or in combination to 2b: Vacuum package samples (use a very high level of vacuum to minimize residual oxygen) in a highly oxygen-impermeable vacuum bag and store for 24 to 48 hours at 4°C. The conversion of OMb to DMb can be slow, es-pecially at temperatures of −1 to 4°C. Holding the samples at 20°C for at least 50% of the time will help a more completely convert OMb to DMb. Usually, MMb forms first from OMb due to the low partial pressure of oxygen and with time MMb converts to DMb. Scan through the vacuum packaging film if the instrument was standardized with the vacuum film over the tile standards. This will minimize any formation of OMb. However, if the researcher desires to keep film consistent for all three myoglo-bin forms, then the instrument should be standardized with oxygen permeable film over the standard. Then, the sample should rapidly be removed from vacuum pack-age, covered with oxygen permeable film, and SCANNED IMMEDIATELY.

56 Color Guidelines Handbook
3. Oxymyoglobin. a. Regulation of the oxygen partial pressure: Place samples previously held at 0 to 2°C
in a high-oxygen atmosphere, such as a bomb calorimeter or a modified atmosphere package, and flush with 70 to 100% oxygen, then store for 24 to 48 hours at 0 to 2°C. Remove the product; scan immediately. If samples are packaged in a high-oxygen modified atmosphere, use a gas-to-meat volume of at least 3 to 1. For ground prod-uct, package in a thin layer to facilitate oxygen absorption in the modified atmo-sphere package.
b. The higher the pH, the more difficult it is to obtain maximum bloom (oxygenation). c. The colder the storage temperature, the more oxygen will bind to myoglobin because
there is less enzyme competition for the oxygen.
4. Carboxymyoglobin. a. EXERCISE CAUTION when using CO. b. Preferably start with the meat in the state of DMb because CO is unlikely to bind to
OMb and MMb. For example, meat in a high vacuum or meat packaged with oxygen scavengers is better because very small quantities of oxygen can delay COMb forma-tion.
c. Use either a preblend with the designated concentration of CO or inject a calculated volume of pure CO to the head space of packages immediately after filling with gas of a known concentration. Store the meat in a modified atmosphere with 0.4 to 1.0% CO and the balance of either nitrogen or a mixture of carbon dioxide and nitrogen.
d. Before measuring the COMb formed on the surface, the packages should be stored for 2 to 3 days at 4°C to facilitate oxygen removal (and OMb) and the complete reduction of MMb to DMb, thus ensuring that essentially 100% of the surface pigment is con-verted to COMb.
C. Calculating Myoglobin Forms via K /S RatiosOnce myoglobin is converted to 100% of each pigment form, record the reflectance at 474, 525, 572, and 610 nm. It is ideal to use the same packing film for all the scans, but this is not always possible, depending on how the myoglobin forms are prepared. Then convert reflectance percent-ages to K/S values using the following equation, K/S = (1 − R)2 ÷ (2R), where R = % reflectance, which should be expressed as a decimal. For example, for a reflectance of 30%, use 0.30 and the K/S calculation should be 0.8167. Many reflectance instruments only record reflectance values at 10-nm intervals. Thus, it will be necessary to integrate the reflectance at 474 using 470 and 480 nm, at 525 using 520 and 530 nm, and at 572 using 570 and 580 nm. First calculate the reflectance values at these wavelengths by integrations, and then convert them to K/S values.
These 100% reference K/S values can then be substituted into the appropriate equation along with sample K/S values to calculate the percentage of DMb, OMb or MMb on the sample surface. Equations for myoglobin form estimation were summarized in Hunt (1980). Deoxy-myoglobin and MMb determinations have appeared frequently in the literature, and the per-centage of OMb is usually determined by difference from 100%. However, determining the percentage of OMb directly using 610 nm (Mancini et al., 2003), which is isobestic for both DMb and MMb, is preferred because OMb content is strongly related to consumer preference (Hunt

Section IX: Equations for Quantifying Myoglobin Redox Forms on Fresh Meat 57
and Kropf, 1988). When determining the percentages of DMb, OMb, and MMb, the percentages may not total 100%. If the percentages do not total 100%, see Mancini et al. (2003) for ways to handle these data.
Product in many case-ready packages can be enhanced with various ingredients, including lactate. Creating reference standards for 100% of each myoglobin form as well as equation-dependent calculations rely on the reflectance properties of meat, which can be influenced by salt and other ingredients (Lamkey et al., 1986; Swatland and Barbut, 1999). To maximize accuracy in estimating myoglobin redox forms on the surface of enhanced product, reference standards for 100% DMb, OMb, and MMb should be derived specifically from enhanced product (Ramanathan et al., 2010).
Reflectance methodology for estimating COMb on the surface of meat is not currently available. Nevertheless, spectral characteristics of beef steaks exposed to carbon monoxide suggest a reflectance peak at 500 nm and an absorbance Soret wavelength at 420 nm for COMb (Wolfe et al., 1978; Ramanathan et al., 2010). Similar results for tuna muscle have been noted (Smulevich et al., 2007). Suman et al. (2006) published absorbance spectra for purified bovine COMb solutions and concluded that the ratio of absorbance at 543 nm ÷ absorbance at 581 nm could be used to differentiate between COMb and OMb. Additionally, a distinct absorbance valley at 503 nm was reported for 100% COMb samples.
D. Calculating Myoglobin Forms via Selected WavelengthsAn alternative to using K/S ratios for determining myoglobin forms was presented by Krzywicki (1979). Because 100% conversion of the pigments is not necessary with this method, it does have an advantage. Deoxymyoglobin and MMb are determined and OMb is calculated indirectly by subtracting their combined percentages from 100%. The method is based on the concept of
1 Equations for section IX Part C
%𝑂𝑂𝑂𝑂𝑂𝑂 =
𝐾𝐾 𝑆𝑆 610𝐾𝐾 𝑆𝑆 525 𝑓𝑓𝑓𝑓𝑓𝑓 100% 𝑀𝑀𝑀𝑀𝑀𝑀 −
𝐾𝐾 𝑆𝑆 610𝐾𝐾 𝑆𝑆 525 𝑓𝑓𝑓𝑓𝑓𝑓 𝑠𝑠𝑠𝑠𝑠𝑠𝑠𝑠𝑠𝑠𝑠𝑠
𝐾𝐾 𝑆𝑆 610𝐾𝐾 𝑆𝑆 525 𝑓𝑓𝑓𝑓𝑓𝑓 100% 𝑀𝑀𝑀𝑀𝑀𝑀 −
𝐾𝐾 𝑆𝑆 610𝐾𝐾 𝑆𝑆 525 𝑓𝑓𝑓𝑓𝑓𝑓 100% 𝑂𝑂𝑂𝑂𝑂𝑂
×100
%𝑀𝑀𝑀𝑀𝑀𝑀 =
𝐾𝐾 𝑆𝑆 572𝐾𝐾 𝑆𝑆 525 𝑓𝑓𝑓𝑓𝑓𝑓 100% 𝐷𝐷𝐷𝐷𝐷𝐷 −
𝐾𝐾 𝑆𝑆 572𝐾𝐾 𝑆𝑆 525 𝑓𝑓𝑓𝑓𝑓𝑓 𝑠𝑠𝑠𝑠𝑠𝑠𝑠𝑠𝑠𝑠𝑠𝑠
𝐾𝐾 𝑆𝑆 572𝐾𝐾 𝑆𝑆 525 𝑓𝑓𝑓𝑓𝑓𝑓 100% 𝐷𝐷𝐷𝐷𝐷𝐷 −
𝐾𝐾 𝑆𝑆 572𝐾𝐾 𝑆𝑆 525 𝑓𝑓𝑓𝑓𝑓𝑓 100% 𝑀𝑀𝑀𝑀𝑀𝑀
×100
%𝐷𝐷𝐷𝐷𝐷𝐷 =
𝐾𝐾 𝑆𝑆 474𝐾𝐾 𝑆𝑆 525 𝑓𝑓𝑓𝑓𝑓𝑓 100% 𝑂𝑂𝑂𝑂𝑂𝑂 −
𝐾𝐾 𝑆𝑆 474𝐾𝐾 𝑆𝑆 525 𝑓𝑓𝑓𝑓𝑓𝑓 𝑠𝑠𝑠𝑠𝑠𝑠𝑠𝑠𝑠𝑠𝑠𝑠
𝐾𝐾 𝑆𝑆 474𝐾𝐾 𝑆𝑆 525 𝑓𝑓𝑓𝑓𝑓𝑓 100% 𝑂𝑂𝑂𝑂𝑂𝑂 −
𝐾𝐾 𝑆𝑆 474𝐾𝐾 𝑆𝑆 525 𝑓𝑓𝑓𝑓𝑓𝑓 100% 𝐷𝐷𝐷𝐷𝐷𝐷
×100

58 Color Guidelines Handbook
reflex attenuance (A) which is the logarithm of the reciprocal of reflectance. The reflectance is measured at the isobestic wavelengths 474, 525, and 572 nm and at 730 nm, which is referred to as the reflectance of pigment-free meat. Some instruments do not measure reflectance at 730 nm, in which case a reading at 700 nm or any wavelength closer to 730 nm, can be used.
Convert the reflectance (R) to reflex attenuance (A) using Equation 1 and insert the A-values in Equation 2 to calculate MMb and in Equation 3 to calculate DMb. Oxymyoglobin is calculated using Equation 4:
where R = reflectance at a specific wavelength expressed as a decimal (0.30 rather than 30%), and
Equation 2: %MMb = �1.395 –� �� � 100
Equation 3: %DMb = �2.375 � �1 – �� � 100
Equation 4: %OMb = 100 – (%MMb + %DMb)
1R
Equation 1: A = log
(A572 – A730)(A525 – A730)
(A473 – A730)(A525 – A730)

59
SECTION X
Laboratory Procedures for Studying Myoglobin
and Meat Color
Most sections in this Guide deal with visual or spectrophotometric analyses. This section will focus on laboratory analyses, such as muscle pH and myoglobin concentration, that help characterize color chemistry in skeletal muscle. Some additional reading of the literature may be necessary to properly apply and interpret data from these procedures. Myoglobin chemistry is summarized in Section II, but many other meat color and myoglobin chemistry reviews and book chapters are useful to enhance understanding these procedures. This sec-tion describes procedures for various laboratory assays and measurements followed by one or more recommended analytical protocols.
A. Fresh Meat Studies
1. pH. Meat pH is possibly the single most important factor affecting fresh and cooked meat color. Thus, pH should be reported in meat color studies. Myoglobin oxidation (and browning) is significantly inhibited as pH increases from 5.6 to 8.5 (Shikama and Sugawara, 1978; Yin and Faustman, 1993). Meat pigment solubility is also greatly affected by meat pH. Thus, extraction solutions are buffered to pH 6.8 for maximum yield of myoglobin and hemoglobin from meat samples (Warriss, 1979). Moreover, in preparing purified myoglobin, buffer solutions at pH 8.0 to 8.5 are used during centrifugation and dialysis steps, to minimize myoglobin oxidation (Faustman and Phillips, 2001). Myoglobin denaturation during cooking is also significantly lower at pH >6.0 (Trout, 1989), accounting for the persistent pinking (hard-to-cook phenomenon) of ground beef patties made from high pH, dark-cutting beef (Moiseev and Cornforth, 1999). Conversely, as pH decreases to 5.5–5.7, premature browning of beef patties during cooking will increase, because lower pH favors formation of MMb (Hunt et al., 1999).
Section XI-A is recommended for measuring pH of pre-rigor meat, using iodoacetate to inhibit glycolysis and prevent further production of lactic acid. Section XI-B is recommended for post-rigor muscle or cooked meat products. Increasingly, investigators also measure pH of individual muscles with a portable instrument equipped with a penetrating pH probe. As with all pH measurements, the device must be calibrated according to manufacturer’s instructions, using standard solutions for

60 Color Guidelines Handbook
the pH range of interest (usually 4.0 to 7.0). Calibration solutions should be at or near the actual sample temperature.
2. Total fresh meat pigments. Meat pigment content is of interest because of its relationship to color intensity, and also from a nutrition standpoint, as an indicator of heme iron content. Meat is an important dietary source of iron, but different forms of iron differ in bioavailability and the potential to initiate oxidative changes. Therefore, quantifying heme versus nonheme iron content in meat may be necessary (Carpenter and Clark, 1995).
Pigment extraction and spectrophotometry (transmission or absorption) are the methods of choice for total myoglobin and hemoglobin concentration. Section XI-C describes a method for meat pigment extraction in cold phosphate buffer at pH 6.8 (Warriss, 1979). All pigments are converted to the reduced, deoxygenated form by adding sodium dithionite (Hunt et al., 1999). Pigment concentration is determined by absorbance of the deoxygenated pigments at 433 nm (the Soret peak). Section XI-D describes a similar method for extracting meat pigments in cold phosphate buffer, but total pigment concentration is determined by absorbance at 525 nm, the isobestic point for the 3 forms of myoglobin. Section XI-D is based on the method of Krzywicki (1979) as modified by Trout (1989), and further modified by Tang, Faustman, and Hoagland (2004). To measure the relative proportion of myoglobin forms on meat surfaces, Tang et al.’s (2004) newer method is recommended. To measure total pigment concentration in solutions, however, the methods provide equivalent results. The Trout (1989) and Tang et al. (2004) equations for total Mb differ only in using slightly different values for Mb molecular weight.
Total soluble meat pigments may also be measured using the classic method of Drabkin (1950). Pigments are extracted as previously described (Warriss, 1979), using 0.04 M phosphate buffer at pH 6.8 to maximize the amount of pigment extracted from meat of normal pH, or using a buffer lower than 6.8 pH to prevent turbid pigment extracts from high pH meat (de Duve, 1948; Hunt and Hedrick, 1977). Potassium ferricyanide and potassium cyanide are then added to a portion of the extract to convert pigments to the cyanmetmyoglobin form. The concentration of myoglobin can then be determined spectrophotometrically, using the cyano-MMb absorption coefficient of 11.3 mM−1 cm−1 at 540 nm and myoglobin molecular weight of 17,000 (Drabkin, 1950).
Total heme pigment content of all meats (fresh, cooked, or cured) may alternatively be determined by extracting the heme group into acidified acetone, forming hemin (ferriprotoporphyrin chloride; Hornsey, 1956), as described in Sections XI-E and XI-F. Karlsson and Lundstrom (1991) used more benign reagents (sodium hydroxide and Triton X-100) to extract heme as alkaline haematin (ferriprotoporphyrin hydroxide). Concentration of myoglobin was determined based on sample absorbance at 575 nm, in comparison to an alkaline haematin standard curve.
3. Separating myoglobin and hemoglobin. Crude extracts from skeletal muscles are sometimes used for myoglobin studies. However, to minimize the influence of other soluble sarcoplasmic proteins and enzymes, often using 100% pure myoglobin is necessary. In Section XI-G, Faustman and Phillips (2001) detail a method for extracting heme pigments from muscle tissue through ammonium sulfate precipitation, followed by separation of myoglobin from hemoglobin using gel-filtration chromatography. This method can be used to purify myoglobin from various animal species, with only minor

Section X: Laboratory Procedures for Studying Myoglobin and Meat Color 61
modifications in the initial level of ammonium sulfate precipitation. Myoglobin and hemoglobin concentrations can be determined by measuring the protein content of the purified fractions and considering initial sample weight and dilution factors.
High-pressure liquid chromatography (HPLC) methods may also be used to quantify total heme pigment and the partitioning of myoglobin and hemoglobin (Oellingrath et al., 1990). Trout and Gutzke (1996) described an HPLC method to isolate myoglobin and determine its purity by calculating the area under the curves at 280 nm to determine myoglobin as a percentage of total protein and at 525 nm to determine myoglobin as a percentage of heme protein.
4. Relative proportion of myoglobin forms. The relative proportion of myoglobin forms (DMb, OMb, MMb, and COMb) at meat surfaces greatly affects color and retail acceptability. For example, when the proportion of MMb at the surface of retail beef products exceeds 40%, consumer acceptability drops significantly (Greene et al., 1971). The relative proportion of myoglobin forms at meat surfaces is measured by reflectance methods, as described in Section IX. The proportion of myoglobin forms of muscle samples in solution after homogenization is measured by absorbance of their respective peaks (Trout, 1989; Tang et al., 2004).
Extraction techniques seldom prevent the conversion of one myoglobin form to another and provide no reliable information on redox stability in solutions. Krzywicki (1982) used special precautions and conditions for extraction to minimize changes in MMb; he conducted extractions at low temperature and controlled pH with buffers. Even so, some change occurred in the ratio of OMb and DMb. Krzywicki’s equations (Krzywicki, 1982) are widely used to estimate the relative proportion of different redox forms of myoglobin in solutions. Occasionally, these equations generate negative values for some redox forms, and sometimes the total estimates obtained by summation of the three redox forms exceed 100%. This was mainly attributed to selecting inappropriate wavelengths (545, 565, and 572 nm) in these equations. To solve this, Tang et al. (2004) used wavelength maxima at 503 nm for MMb, 557 for DMb, and 582 for OMb, (Figure 10.1). The revised equations performed better relative to negative values and summation to 100 (Section IX).
5. Differentiating COMb and OMb in solution. The absorbance spectra of the two cherry-red colored redox forms, COMb and OMb, are very similar, as illustrated in Figure 10.2. Traditional equations used to estimate myoglobin redox forms (Krzywicki, 1982; Tang et al., 2004) do not account for existence of COMb. Using these equations to determine brown pigment (MMb) formation in pure solution of COMb provides erroneous results like negative values and sums exceeding 100%. This has been solved using the ratio A503/A581 as a browning index, which represents an indirect estimate of MMb formation (Suman et al., 2006). The usefulness of the browning index was verified using combinations of COMb, OMb, and MMb in split cuvettes.
Nam and Ahn (2002) reported β and α peaks of OMb at 541 and 576 nm in the drip from aerobically packaged turkey breast, with a shift to shorter wavelengths (536 and 566, respectively) after irradiation. Reflectance spectra were also used to differentiate OMb and COMb. Gas chromatography verified production of CO in irradiated samples. Thus, COMb was source of the pink pigment of irradiated turkey breast muscle (Nam and Ahn, 2002).
The β and α peaks of horse OMb are at 544 and 582 nm, respectively (Bowen, 1949), with a slight shift to shorter wavelengths (540 or 541 and 577 nm) for COMb (Bowen,

62 Color Guidelines Handbook
1949; Sørheim et al., 2006). While it is theoretically possible to differentiate COMB and OMb based on their characteristic spectra from 400 to 700 nm, it is not currently possible to determine their relative proportions in meat samples exposed to both CO and O2.
6. Mitochondrial oxygen consumption. Mitochondrial activity plays a major role in postmortem muscle oxygen consumption, affecting rate of myoglobin oxygenation and color stability. As postmortem age of muscles increases, mitochondrial activity tends to decrease. High storage temperature and high pH greatly influence postmortem mitochondrial activity (Cheah and Cheah, 1971; Ashmore et al., 1972; Bendall and Taylor, 1972; Cornforth and Egbert, 1985). Oxygen consumed by meat affects myoglobin oxygenation because of competition for available oxygen between mitochondrial enzymes and myoglobin. With a decrease in mitochondrial activity postmortem, myoglobin oxygenation occurs at a higher rate. In meat, many cellular processes and organelles compete for available oxygen, affecting myoglobin redox stability and MMb reduction postmortem (Ramanathan et al., 2009). Section XI-H describes methods for isolating mitochondria and Section XI-I describes methods for measuring mitochondrial oxygen consumption rate.
In addition, mitochondrial content of skeletal muscles differs by physiological origin, causing differences in relative oxygen consumption rate (OCR), myoglobin redox forms on surface and at sub-surface levels, and meat color stability. The ability of fresh meat to retain a bright cherry-red of “bloomed” meat during storage and display differs among
Figure 10.1. Absorption spectra of MMb, DMb, and OMb solutions containing equiv-alent myoglobin concentrations. The arrows indicate the isobestic point at 525 nm, MMb absorption peak at 503 nm, DMb absorption peak at 557 nm, and OMb absorp-tion peak at 582 nm. Reprinted from Tang et al. (2004) with permission from John Wiley and Sons.

Section X: Laboratory Procedures for Studying Myoglobin and Meat Color 63
muscles (Atkinson and Follett, 1973; Hood, 1980; O’Keeffe and Hood, 1982; Renerre and Labas, 1987; Mancini and Hunt, 2005). Muscles with higher mitochondrial content tend to have a higher OCR and form more MMb. Likewise, muscles with high discoloration rate tend to have low color stability and high OCR (O’Keeffe and Hood, 1982; Renerre and Labas, 1987). Atkinson and Follett (1973) also noted that OCR in skeletal muscles was directly related with rate of discoloration, such as the higher the OCR, the higher the rate of discoloration. Measurement of OCR can help determine mitochondrial activity of postmortem skeletal muscles of different physiological origin and their relative color stability.
Meat scientists have developed objective procedures to determine muscle oxygen uptake and OCR, among them the Warburg flask (Urbin and Wilson, 1961), differential respirometry (DeVore and Solberg, 1975), Clark oxygen electrodes (Lanari and Cassens, 1991; Ramanathan et al., 2009), reflectance spectroscopy (Madhavi and Carpenter, 1993), and headspace oxygen analyzers (Sammel et al., 2002). Interactions between light and meat pigments offer an opportunity to develop methodology for detecting the redox dynamics of Mb using near-infrared (NIR; 700 to 1000 nm) technology. Recently, Mohan et al. (2010a) used a frequency-domain multi-distance (FDMD) NIR tissue oximetry that provides a real-time, noninvasive, and direct measure Mb oxygen saturation and OCR in skeletal muscle.
7. Metmyoglobin reducing activity (MRA). Methodology used to determining MMb reducing activity (MRA) of meat differs widely among investigators (see the review by
Figure 10.2. Absorption spectra of MMb, COMb, and OMb solutions containing equiva-lent myoglobin concentrations. The arrows indicate the isobestic point at 525 nm, MMb absorption peak at 503 nm, COMb absorption peak at 543 nm, and OMb absorption peak at 582 nm. Courtesy of Dr. S. P. Suman, University of Kentucky, and Dr. C. Faustman and Dr. R. A. Mancini, University of Connecticut.

64 Color Guidelines Handbook
Bekhit and Faustman, 2005). The most common procedure for determining MRA starts by inducing high initial levels of MMb (usually by packaging in 1% O2 atmospheres or nitrite-induced oxidation) followed by an assay step that promotes MMb reduction. Changes in total MMb content during this reduction step are used to estimate the muscle’s reducing ability. However, meat color researchers often question the validity of the most appropriate means of presenting and interpreting this change in MMb levels.
Mancini et al. (2008) assessed location effects (surface and subsurface) on MRA following display and compared the influence of package oxygen concentration on location effects and MRA. They also examined the relationship between MMb reduction measurements [initial MMb formation (IMF) versus post-reduction MMb (PRM) versus absolute amount reduced versus relative amount reduced] and color stability. Their study demonstrated a positive correlation among the four MMb/MRA measurements and visible surface color stability data. These investigators reported that, regardless of muscle, subsurface reducing activity measurements did not correlate with surface color stability. They found that for all muscles used in their study, traditional absolute and relative MRA calculations measured on the steak surface correlated least with surface color.
Faustman and Cassens (1990) reported both absolute and relative aerobic reducing activity (ARA). O’Keeffe and Hood (1982) proposed that relative MRA was less accurate in predicting muscle color than absolute MRA due to differences among muscles to form MMb. McKenna et al. (2005) reported that some muscles resisted development of surface MMb when samples were placed in a 1% O2 environment. They used resistance to induced MMb formation (RIMF) to relate muscle-reducing capacity to color stability. Sammel et al. (2002) reported that nitric oxide MMb reducing ability was useful for measuring reducing activity. These researchers suggested that because their method initially used a mild oxidant (sodium nitrite), it may offer a more practical approach for determining MRA than assays that use ferricyanide. King et al. (2011) used the method of Sammel et al. (2002) to monitor animal to animal-to-animal variation in color stability of beef longissimus steaks. They reported that initial steak oxygen consumption rate, initial MRA after nitrite treatment, and post-reduction MMb levels were important in determining the color stability of individual steaks.
Section XI-J describes an assay for MMb reducing ability of intact muscle slices, adapted from the method of Watts et al. (1966). Muscle pigments at the sample surface are initially oxidized to MMb by soaking the sample in a sodium nitrite solution for 20 minutes. The slice (1.27 cm thick) is vacuum packaged, and surface % MMb is monitored for 2 hours at 30°C by measuring reflectance K/S ratios (572/525 nm). The sample reducing ability is defined as the percentage decrease in surface MMb concentration during the incubation period. Section XI-K describes modifications to Section XI-J for measuring MRA of minced meat samples (Sammel et al., 2002).
Section XI-L describes a rapid (2 minutes) assay for MRA measurement in muscle homogenates (Hagler et al., 1979; as modified by Madhavi and Carpenter, 1993). The reaction is initiated by adding muscle filtrate + NADH to a solution of MMb + ferrocyanide in a spectrophotometer cuvette. MMb reductase activity is monitored by the increase in absorbance of OMb at 580 nm during the initial linear phase of the reaction (1 to 2 minutes).
8. Effects of added substrates on MRA (lactate, malate). Several researchers have become interested in the potential for generating nicotinamide adenine dinucleotide (NADH) through endogenous enzymatic systems that facilitate MMb reduction, including

Section X: Laboratory Procedures for Studying Myoglobin and Meat Color 65
biochemical processes that could potentially contribute to meat color stability. Watts et al. (1966) demonstrated that adding NAD+ increased MRA in meat. Electron transfer can also generate NADH from added substrates, such as succinate or cytochrome c, to NAD+. With appropriate substrates, several dehydrogenases in the cytoplasm can generate NADH (Bodwell et al., 1965). Giddings (1974, 1977) suggested that mitochondria or sub-mitochondrial particles could help reduce MMb and hypothesized that mitochondria are involved in MMb reduction by supplying the meat tissue with key reducing cofactor reduced-NADH, generated by endogenous enzymes or by reversing electron transport. Recently, Kim et al. (2006) and Mohan et al. (2010b) demonstrated the effects of added substrates from glycolysis (lactate) or mitochondrial tricarboxylic acid pathways (malate). Both studies reported improved MRA in meats after substrates were added to intact muscles or to skeletal muscle homogenates.
B. Cooked Meat StudiesColor and color uniformity are important criteria for retail acceptance of cooked meats. Cooked meats are generally gray-brown because of the formation of globin hemichromes via fresh meat pigment denaturation, coagulation, and oxidation during aerobic heating. However, cooked meats may also be red, pink, or prematurely brown, depending on a variety of factors, including cooking temperature/time, meat pH, anaerobic (reducing) conditions; the presence of various pinking compounds, including CO or NO2 gases; and unintentional contamination with nitrite (NO2
−) or nitrate (NO3−) salts.
Meat pigments (myoglobin, hemoglobin) denature during cooking, causing unfolding of glo-bin. Under aerobic conditions, the heme iron is readily oxidized, and the exposed heme may form complexes with denatured proteins, including dimers or aggregates of apomyoglobin (Tappel, 1957; Ledward, 1971). The resulting gray-brown complexes are termed denatured globin hemichromes, with “hemi” denoting the oxidized state of the heme iron. Although visible spectrum absorption has been used on myoglobin (Mb) solutions during heating, reflectance spectroscopy is typically used to study cooked meat pigments (Ledward, 1971). Section XI-M describes a reflectance method for detecting the pink denatured globin hemochromes of an-aerobic-cooked meats (>76°C). Care must be taken to conduct any analysis in a timely manner because these pigments fade rapidly in air (Ghorpade and Cornforth, 1992; Cornforth, 2001). 1. Persistent pinking and premature browning—Diagnostic methods. Consumers are
sometimes sensitive to pink color of cooked meats, suspecting that the product may be undercooked. Thus, processors occasionally need to test their products to identify the cause of, and eliminate or minimize, unwanted pinking. Nitrite or nitrate contamination of ingredients is one possible source of unwanted pinking (Heaton et al., 2000). This possibility may be examined using the Hornsey (1956) test for cured meat pigment (Sections XI-E and XI-F). Surface pinking of grilled meats also results in a positive test for cured meat pigment due to exposure to nitrogen dioxide in combustion gases (Cornforth, et al., 1998). Combustion gas may contain carbon monoxide, but the Hornsey (1956) method is specific for NO-heme and does not detect CO-heme groups.
If the meat is indeed undercooked, undenatured myoglobin will be present at higher than normal levels. Myoglobin is resistant to heat denaturation at pH >6.0, resulting in higher than normal myoglobin concentration in cooked meats, and red or pink interior color at internal temperatures of 80°C or higher (Trout, 1989; Moiseev and Cornforth, 1999). At the other extreme, Hague et al. (1994), Lavelle et al. (1995), and Hunt et al.

66 Color Guidelines Handbook
(1999) described premature browning in oxidized ground beef, where MMb denatured at a lower temperature than OMb or DMb during cooking. Premature browning of hamburger has food safety implications because patties may be seen as fully cooked at a cooking temperature insufficient to kill food pathogens.
Soluble myoglobin can be extracted in phosphate buffer and measured as described in Section XI-D, using a spectrophotometer to measure absorbance at 525 nm, the myoglobin isobestic point. Some soluble myoglobin may remain in cooked samples, depending upon species and internal cook temperature. Meat with pH >6.0 will have higher than normal levels of soluble myoglobin. On the other hand, prematurely browned meats have lower than normal levels of soluble myoglobin, possibly associated with low pH. Determine product pH (Section XI-B).
If pinking due to un-denatured Mb or cured meat pigment is not confirmed, the presence of denatured globin hemochromes should be suspected. These pink pigments are formed under anaerobic, high-heat conditions, such as canning or crock-pot cooking while submerged under water. Presence of these pigments may be confirmed by Section XI-M.
C. Cured Meat StudiesThis section describes laboratory methods for detecting and quantifying cooked and cured meat pigments and precursor compounds. Cured meats are typically formulated with sodium or potassium nitrite or nitrate, forming the pink cured meat pigment (mononitrosohemochrome) during cooking. In naturally cured meats, the curing agent is usually nitrate as a component of celery seed powder or sea salt. A fermentation step uses microbial conversion of nitrate to nitrite before cooking. In traditional fire-dried jerky or BBQ meats, NO2 gas formed during com-bustion is a potent pinking agent, due to its ability to react with water to form nitrite ions on moist meat surfaces, causing surface pinking (curing) during cooking. 1. Cured meat pigment. Erdman and Watts (1957) developed an effective method for
following changes in cured meat color by monitoring the surface reflectance ratio of wavelengths 570/650. This measure is useful to indicate leaky vacuum packages or other conditions that promote color fading.
The cured meat pigment was identified as mononitrosylhemochrome by Killday et al. (1988). They used mass spectroscopy to demonstrate a mass increase of 30 for the nitrosylated heme, corresponding to binding of one NO group (not two, as previously reported). Cured meat pigment content, as a percentage of total heme pigments, is a useful measure of the effectiveness of the curing process (Hornsey, 1956). The hemochrome itself is not soluble because it is a complex with heat-denatured proteins. However, the NO-heme group may be extracted in 80% acetone (adjusted for the water content of the sample) and quantified by spectroscopy at 540 nm (Sections XI-E and XI-F).
2. Total heme and heme iron content. Total heme content can be determined by extracting all heme groups into acidified 80% acetone, including cured and uncured pigments as well as heme-containing enzymes and cofactors (Sections XI-E and XI-F). Total heme content (as hematin) is measured by A640 (Hornsey, 1956). Less than 80% of heme pigments converted to the nitrosylheme form is generally considered acceptable pigment conversion during curing (Pearson and Tauber, 1984). In the Hornsey (1956) procedure, 10-g samples were mixed in tall beakers to prevent undue evaporation. Pearson and Tauber (1984) used 2-g samples and capped test tubes to prevent

Section X: Laboratory Procedures for Studying Myoglobin and Meat Color 67
evaporation and allow analysis of more samples at a time. Carpenter and Clark (1995) used 5-g samples.
Total heme measurement using the Hornsey (1956) method can assess the nutritional values of heme-iron content of meats (Carpenter and Clark, 1995). Total iron content of meat samples after wet ashing can be determined by the ferrozine assay (Carter, 1971), where binding of Fe2+ to ferrozine forms a red pigment measured by spectroscopy at 562 nm. Nonheme iron content can be determined using ferrozine to detect iron in HCl-trichloroacetic acid extracts (Schricker et al., 1982). Stainless steel probe-type homogenizers should not be used to homogenize samples in HCl-TCA, because iron will be extracted from the probe itself, particularly older, worn probes (Jayasingh, 2004).
3. Red pigment of Parma ham. Parma ham is a traditional fermented meat product of Parma, Italy, prepared by lengthy seasoning of pork legs, without adding nitrate or nitrite curing salts. Morita et al. (1996) used electron spin resonance spectroscopy to show the red pigment of Parma ham differed from nitrite-cured meat pigment. They further demonstrated that staphylococci isolated from Parma ham generated a red myoglobin derivative from MMb. Wakamatsu et al. (2004) characterized the bright red pigment of Parma ham spectroscopically and fluoroscopically, as well as using HPLC and electro-spray ionization high resolution mass spectroscopy (ESI-HRMS). They found that the red color was caused by Zn-protoporphyrin IX, not iron-based heme pigments.
4. Nitrite in ingredients and residual nitrite in meat. Section XI-N describes a method for determining nitrite content of ingredients or residual nitrite level of cured meats after cooking and during storage based on reactivity of nitrite with N-1-naphthyl-ethylenediamine-2-HCl and sulfanilamide; this forms a red complex with maximum absorbance at A540 (AOAC, 1990). Ingredient or product nitrate levels can be measured after sample extracts are treated with cadmium (Sen and Donaldson, 1978; Sen and Lee, 1979), which reduces nitrate to nitrite. Nitrite analysis, as described in Heaton et al. (2000) can then be done. Nitrate = total nitrite − initial nitrite (AOAC, 1990). More recently, vanadium has replaced cadmium as a nitrate reducing agent because of environmental safety concerns (Miranda et al., 2001; Doane and Horwath, 2003). The nitrate assay using vanadium is described in Section XI-O.
5. Gaseous components from gas combustion ovens. Concentration of gaseous precursors to pink pigments (NO2, CO, NO) in combustion ovens, for example, can be determined using a chemiluminescent gas analyzer (Cornforth et al., 1998). To measure NO, the gas sample was blended with ozone (O3) in a flow reactor, where NO + O3 → NO2 + O2 + hv. Light emission occurs when the excited NO2 molecules decay to lower energy levels, measured by spectroscopy. To measure NOx (NO + NO2), the sample gas is first diverted through an NO2-to-NO catalytic converter. Nitric oxide is then measured as previously described. Oxygen can be measured with a paramagnetic oxygen measurement system. Paramagnetic oxygen can become a temporary magnet when placed in a magnetic field. Most other gases are diamagnetic and, therefore, unaffected. The instrument measures the volume magnetic susceptibility of oxygen in the gas sample.
Carbon monoxide can be measured with a non-dispersive infrared analyzer. The instrument produces infrared radiation from two separate energy sources. Radiation is modulated by a chopper into 5-Hz pulses, which pass through optical filters to reduce background interference from other infrared-absorbing components. Each infrared beam passes through a separate cell, one of which is sealed and contains the reference

68 Color Guidelines Handbook
gas (CO). The other cell contains the continuously flowing sample gas. The quantity of infrared radiation absorbed is proportional to the CO concentration.
D. Packaging MeasurementsBecause the color of fresh and processed meat is so profoundly influenced by ligands bound to the heme moiety, and since packaging is used commercially to minimize fresh and processed meat color deterioration, packaging requires special consideration in laboratory analysis. The following are important considerations for packaging of samples during analysis. 1. Film thickness. Digital micrometers capable of measuring thicknesses in mils (1/100
inch; see Glossary) are useful for measuring film and package tray thickness. Many vacuum pack bags are 2 to 3 mils thick, whereas oxygen-permeable polyvinyl chloride (PVC) film overwrap of fresh retail meats are often <1 mil thick. Generally, as film thickness increases gas permeability decreases. Thicker films are also more expensive.
2. Film permeability. For fresh meat, high oxygen permeability films maintain oxy-heme pigments (Landrock and Wallace, 1955; Cornforth and Allen, 2009). Extremely low oxygen permeability films (also known as high barrier films) will encourage deoxy-heme pigments to form because of the reducing capacity of the meat (Siegel, 2007). Conditions resulting in a low partial pressure of oxygen (1 to 25 mm Hg) will encourage rapid oxidation and pigment browning (Kropf, 2004) and should be avoided. Table 10.1 illustrates the change in atmospheric pressure and oxygen partial pressure at various levels of vacuum, from zero (vacuum) to 1 atmosphere (760 mm Hg). The danger zone for most rapid browning is highlighted. Using a typical vacuum packaging machine makes it very difficult to reduce oxygen levels below this range; thus, MMb will likely form until the meat has consumed (scavenged) the residual oxygen in the package. MAP packaging may reduce the residual oxygen levels more than vacuum packaging due to 1 or multiple flushes of the desired atmosphere into the packaging chamber. With any packaging system, care must be taken to obtain sufficiently low partial pressure of
Table 10.1. Oxygen concentration and partial pressure at various degrees of vacuum packaging of fresh meat
Vacuum gauge reading 29.92 29.73 28.24 22.44 14.96 7.48 0 (inches Hg)
Total gas pressure in the 0 4.8 119 190 380 570 760 package (mm Hg or torr)
Oxygen concentration (%) 0 0.13 3.3 5.23 10.45 15.67 20.9
Oxygen concentration (ppm) 0 1,300 33,000 52,225 104,500 156,700 209,000
Partial pressure of oxygen in 0 1.0 25.0 39.8 79.6 119.4 159.2 (air) the package (mm Hg or torr)
The shaded area is the range of low-oxygen partial pressure (1 to 25 torr) that favors rapid formation of MMb. MAP packaging may reduce the residual oxygen levels more than vacuum packaging because of single or multiple flushes of the desired atmosphere into the packaging chamber. However, these flushes seldom result in <1 to 3% residual oxygen.

Section X: Laboratory Procedures for Studying Myoglobin and Meat Color 69
oxygen, so that the ability of the meat to consume the residual oxygen is not exceeded. Regardless of degree of vacuum pulled in the package, the residual atmosphere contains the same relative gas proportion as air, 78.1% nitrogen, 20.9% oxygen, 0.9% argon, and 0.03% carbon dioxide). However, the gas concentration detected by a sensor like an oxygen electrode is proportional to the atmospheric pressure around the product. For example, at a partial vacuum of 1/2 of atmospheric pressure, the measurable oxygen concentration oxygen is 10.45% (104,500 ppm), for an oxygen partial pressure of 79.6 mm Hg (380/760 × 159.2 mm Hg; Table 10.1). The permeability of the packaging film is also critical in keeping ingress of oxygen low, especially in products with a long shelf life, such as those commonly used for export.
Gas permeability properties of packaging films, bags, and trays usually include transmission rates for water vapor and oxygen transmission rate. Transmission values for carbon dioxide, carbon monoxide, and nitrogen are less frequently available. Film permeability may be expressed per 100 in2 or 1 m2. The equation to convert gas permeability values per unit area (British or metric) is as follows: Gas permeability expressed in cc/100 in2 × 15.5 = Gas permeability of the film expressed in cc/meter2. Permeability values also vary not just with film thickness but also other factors. Research reports should include information about film permeability.
For cured processed meats, the nitroso heme moieties are very sensitive to combinations of light and oxygen, resulting in oxidation of cured pigments. Thus, residual oxygen of less than 0.15% initial O2 (Larsen et al., 2006) and films with extremely low oxygen permeability (<0.1 cc O2/100 in2/24 hours, equivalent to <15.5 cc O2/m2/24 hours) are generally used (Siegel, 2007).
Additionally, samples must be held under dark storage conditions for 24 to 96 hours after packaging to permit self-scavenging of residual oxygen before they are exposed to light (Moeller et al., 2003). This is particularly important when evaluating product color stability under display lighting conditions.
3.Modifiedatmospherepackaging.High-oxygen barrier packaging films can be used in combination with a variety of headspace gases to manipulate and preserve pigment forms in meat. Carbon dioxide is well known for its antimicrobial effect in MAP. However, nitrogen and carbon dioxide are essentially neutral in their effects on pigment forms and hence their presence in a MAP headspace will not affect color (Moeller et al., 2004). High oxygen can help maintain oxy-heme pigment forms (Georgala and Davidson, 1970; O’Sullivan and Kerry, 2010), but respiratory capacity of the meat must be considered to avoid depleting oxygen to a level that promotes formation of MMb (Bekhit and Faustman, 2005). Carbon monoxide or nitric oxide gases in the package headspace or use of packaging films impregnated with sodium nitrite crystals will result in pigment forms that reflect the binding of those compounds (Siegel, 2007, 2009).
4. Measurement of package gas composition. To show that MAP systems achieve desired gas composition and that the desired gas composition was maintained throughout storage, report the gas composition in packages. The relative gas compositions in MAP change dynamically during package shelf life because of meat respiration and because meat absorbs gases; thus, with gases permeating through the package film, accurately describing the time of measurement is important. Samples drawn from the packages with a syringe through self-sealing septa allow using headspace gas analyzers to measure oxygen, carbon monoxide, and carbon dioxide concentrations (Knock et al., 2005; Mancini et al., 2009; Raines and Hunt, 2010).

70 Color Guidelines Handbook
E. Effect of Lipid Oxidation on Meat Color (Fresh, Cooked, Cured)
Many meat color studies include measures of lipid oxidation, because myoglobin oxidation is often closely linked with lipid oxidation. Aldehyde products of lipid oxidation initiate confor-mational changes in myoglobin, causing increased heme oxidation and browning (Alderton et al., 2003). Hemin released from fish hemoglobin during storage also stimulates lipid oxidation (Grunwald and Richards, 2006). Similarly, ionic iron released from heme during heating may stimulate lipid oxidation, as measured by the assay for thiobarbituric acid reactive substances (TBARS; Igene et al., 1985). The extent of lipid oxidation can be measured using many tech-niques, including headspace analysis of volatile oxidation products (Watanabe et al., 2008), and sensory evaluation, but the TBARS test is most often used in meat products.
The TBARS test is based on the development of a pink chromagen with maximum absorbance at 530 to 535 nm upon reaction of thiobarbituric acid with aldehyde products of lipid oxidation, particularly 2,4-alka-dienals (Marcuse and Johansson, 1973). Malonaldehyde (MDA) is the com-pound used for TBARS standard curves. TBARS test results may be obtained in 1 day or less for multiple samples, and TBARS values correlate well with sensory testing. TBARS values >1.0 are usually associated with detectable oxidized odor and flavor of cooked meat samples (Greene and Cumuze, 1981). Tarladgis et al. (1960) developed the widely used distillation method (Sec-tion XI-P), where 2-thiobarbituric acid (TBA) solution was added to the sample condensate. To avoid the distillation step, TBA solution may be added directly to the meat sample, allowing sev-eral hours for chromogen formation in unheated samples (Witte et al., 1970) or by boiling for 10 minutes, as described in Section XI-O (Buege and Aust, 1978).
A yellow chromogen with maximum absorbance at 453 nm also develops in the TBARS test in the presence of many lipid-derived aldehydes (Marcuse and Johansson, 1973) and sugars, including sucrose (Du and Bramlage, 1992). To correct for the yellow interference caused by sugars, Du and Bramlage (1992) developed a modified procedure using standard curves for both MDA and sucrose. Alternatively, yellow color development has been avoided in meat samples containing raisins (70% sugar) by using the original distillation method of Tarladgis et al. (1960) because sugar aldehydes are not volatile and not collected in the sample condensate (Vasavada and Cornforth, 2006).
In cured meats, TBARS values are affected by the presence of residual nitrite. Accordingly, the modified TBARS method of Zipser and Watts (1962) adds sulfanilamide to cured meat samples before distillation to prevent erroneous results caused by the nitrosation of malonaldehyde by the residual nitrite. However, adding sulfanilamide also affects the TBARS value. TBARS values of meats cured with 100 to 200 ppm nitrite were always larger when sulfanilamide was present than in its absence. However, at low levels of 0 to 50 ppm sodium nitrite, the TBARS values were always lower in the presence of sulfanilamide (Shahidi et al., 1985).
F. Fundamental Research Methods
1. Mass spectrometric characterization of myoglobin. Meat color stability depends on many intrinsic and extrinsic factors, among them, species-specific variations, distribution of red and white muscle fibers, and myoglobin chemistry. Mass spectrometry is a key analytical tool particularly useful in the structural characterization of proteins. In meat science, this technique has shown great promise in the functional characterization of myoglobins. In an attempt to characterize the specifies-specific variations in meat color, Joseph et al. (2010a) used matrix-assisted laser desorption-ionization time-of-flight

Section X: Laboratory Procedures for Studying Myoglobin and Meat Color 71
mass spectrometry to characterize myoglobins of bison; Joseph et al. (2010a) for turkey; and Suman et al. (2010) for emu.
Proteins and peptides are major constituents of muscle foods, vital to determining process-induced modifications in food proteins. Food proteomics has started to influence many aspects of the food chain, including food production, food safety, and quality assurance. The use of mass spectrometry in recent years has revolutionized protein characterization, amino acid sequencing, and fingerprinting of bacterial proteins. Recent advances in applying proteomics offer opportunities for meat scientists to explore the molecular basis of ingredient interactions for both meat color and color stability.
Mancini et al. (2010) used matrix assisted laser desorption ionization-time of flight mass spectrometry for determining the mechanisms by which lactate influences beef color stability. Using mass spectrometry allows systematic analysis of ingredient interactions, process-induced modifications, and identification of areas of the food chain that are the most vulnerable to quality defects, microbial contamination, and nutrient deterioration. Despite being relatively new to meat science, research in food proteomics has already helped improve human health.
2. Oxymetrics to measure relative concentration of myoglobin forms in packaged meats. Biochemical factors that contribute to meat color has been an important area of research for decades, but little research has focused on the development of non-invasive methods and/or techniques for estimating the overall quality of meat rapidly, in real-time. Although this area has seen significant progress, existing techniques to characterize meat color parameters and predict meat color stability are limited because they are invasive, time consuming, labor intensive, and provide only an indirect estimate of Mb redox status. Similar techniques to characterize tissue structure related to biochemical processes like oxygen consumption and mitochondrial activity suffer from the same limitations. Interactions between light and muscle pigment in meat offer an opportunity to develop methods for detecting the redox dynamics of Mb using near-infrared (NIR; 700 to 1000 nm) technology.
Near-infrared spectroscopy (NIRS) has been used extensively to determine oxygen absorption by myoglobin and hemoglobin in medical diagnostics and exercise physiology (Ferreira et al., 2005). NIRS is non-invasive, continuous, and rapid (25 to 35 seconds) for estimating the absolute concentration of oxygenated and deoxygenated myoglobin at surface and sub-surface levels in meat (Mohan et al., 2010a).
A fundamental approach based on light-tissue interaction of NIRS could provide valuable information about optical properties and absorbance patterns of the meat in real-time with quantitative information of myoglobin redox forms on meat surfaces and at subsurface levels. Since NIR light penetrates deeply into biological tissues like meat, NIRS could be a potentially effective technique for non-invasive, macroscopic imaging of postmortem muscle. Because myoglobin and hemoglobin absorb at the same wavelength in the NIR region, the same approach can be used to determine the redox stability of myoglobin and other structural features of meat that would eventually allow us to understand the effects of post-processing on myoglobin chemistry.


73
SECTION XI
Details of Analytical Analyses Related to Meat Color
How to Use This SectionThis section details the procedures of commonly used methods for studying myoglobin. In many cases, researchers can select a procedure and use it as given. In other cases, research-ers may need to modify these methods to accommodate special circumstance; in that case, a careful review of the research literature would be prudent.
As in all quantitative analytical chemistry, researchers must give exacting attention to the final calculations, especially using appropriate extinction coefficients, determining the cor-rect dilution factor, and verifying that all units in the equations cancel to the units of mea-surement desired.
Index of Protocols A. pH of Prerigor Meat B. pH of Postrigor Meat or Cooked Products C. Total Myoglobin (as DMb) of Fresh or Cooked Meat D. Total Myoglobin (Isobestic Point Assay) of Fresh or Cooked Meat E. Nitrosoheme and Total Heme Content of Cured Meats F. Nitrosoheme and Total Heme Content of Small Samples G. Isolating Myoglobin for In Vitro Studies H. Isolating Mitochondria from Beef Skeletal Muscle I. Oxygen Consumption of Intact Muscle or Ground Meat J. Metmyoglobin Reducing Capacity of Intact or Ground Meat K. Reduction of Metmyoglobin by Skeletal Muscle Extracts L. Detecting Reflectance of Denatured Globin Hemochromes M. Nitrite Analysis of Cured Meat N. Nitrate Analysis of Cured Meat and Ingredients O. TBARS for Oxidative Rancidity—Rapid, Wet Method P. TBARS for Oxidative Rancidity—Distillation Method
74 Color Guidelines Handbook
A. pH of Prerigor Meat
Principle:
In prerigor muscle, pH slowly decreases because lactic acid produced by glycolysis accumulates. To determine the pH at a given time postmortem, iodoacetate is added to inhibit glycolysis (specifically glyceraldehyde 3-phosphate dehydrogenase), preventing any further production of lactate.
Reagents:
1. 150 mM KCl = 11.184 g/L 2. 5 mM sodium iodoacetate (NAIAc) C2H2INaO2): Prepare by dissolving 1.04 g NaIAc in a
final volume of 1000 mL of 150 mM KCl. Adjust pH of the solution as needed to 7.0 with a few drops of 0.1 N HCl or 0.1 N NaOH.
The solution should be reasonably fresh (<3 days old at 3°C). Before analysis, the solution should be allowed to warm to room temperature. Check the pH before use. During analysis, the solution should be stirred on a stir plate to ensure that accurate pH values are obtained. Because it is easy for prerigor blended samples to clog electrodes, the pH meter should be veri-fied for accuracy with the two standard buffers after every 4 to 5 samples, and re-calibrated if necessary.
Procedure:
1. Standardize pH meter with 4.0 and 7.0 buffers before use. 2. Weigh 10 g of sample muscle tissue into a blender beaker. 3. Add 100 mL of 5 mM NaIAc in 150 mM KCl to the beaker. 4. Blend sample 30 seconds, or until well mixed but not emulsified. 5. Measure pH.
Notes:
Be sure the electrode is clean and responds reasonably quickly. Obtaining accurate pH measure-ments of meat requires proper care and cleaning of electrodes, representative sample collec-tion: and sample preparation.
ReferenceBendall, J. R. 1973. Postmortem changes in muscle. Pages 243–309 in Structure and Function of Muscle. Vol. 2. G. H.
Bourne, ed. Acad. Press, New York, NY.

Section XI: Details of Analytical Analyses Related to Meat Color 75
B. pH of Postrigor Meat or Cooked Products
Procedure:
1. Standardize pH meter with 4.0 and 7.0 buffers prior to use. 2. Weigh 10 g of finely chopped sample into a blender beaker. 3. Add 100 mL of de-ionized or distilled water. 4. Blend sample 30 seconds, or until well mixed but not emulsified. 5. Measure pH.
ReferenceKoniecko, E. S. 1979. Handbook for Meat Chemists. Pages 53, 54, and 62. Avery Publ. Group Inc., Wayne, NJ.

76 Color Guidelines Handbook
C. Total Myoglobin (as DMb) of Fresh or Cooked Meat
Principle
Myoglobin in all forms (DMb, OMb, and MMb) is extracted using cold 0.04 M phosphate buffer at pH 6.8 (Warriss, 1979); it is then converted entirely to the deoxy- form by adding an excess of a reducing agent, sodium hydrosulfite (dithionite; see note below). The DMb concentration is determined by absorbance of the Soret peak at A433. Note that residual blood hemoglobin will also be extracted and contribute to the total meat pigment content.
Reagents
1. 40 mM potassium phosphate buffer, pH 6.8 • KH2PO4 = 4.87 g • K2HPO4 = 2.48 g • 1000 mL distilled/deionized water 2. Sodium hydrosulfite (dithionite)
Sample pulverization
1. Cut sample into small cubes (or use the sample preparation in Protocol D). 2. Submerge cubes in liquid nitrogen until rapid boiling of liquid nitrogen is complete. 3. Pour small amount of liquid nitrogen into Waring blender. 4. Turn blender on for 2 to 4 seconds to chill the blender. Blender should be dry to avoid
freezing the rotor. 5. Pour pulverized sample onto a clean sheet of paper, and then use the paper to pour
sample into a Whirl-Pak bag, removing as much air as possible. 6. Store sample in ultra low freezer (−60°C) until used.
Procedure for myoglobin determination
1. Weigh two (2) 10-g samples of pulverized sample into a Waring blender bowl and record the exact weight of each.
2. Add 90 mL of cold potassium phosphate buffer (0.04 M, pH 6.8). Dilution factor is, 90 mL + 10 g = 100/10 = 10× dilution.
3. Blend the sample for 1 minute. 4. Pour a portion of the uniformly blended sample into a 50-mL centrifuge tube and store at
0 to 4°C for 1 hour for pigment extraction. Note that although there is 100 mL of blended sample, only a small volume (3 mL) of supernatant is needed after centrifugation (step 6 below).
5. Centrifuge the samples at 15,000 × g for 30 minutes at 4°C. 6. Collect the supernatant in a small beaker. Clarify 3 mL of supernatant through a syringe
filter (0.4-micron pore diameter) into a spectrophotometer cuvette (1 cm width). 7. Add sodium hydrosulfite in a stock solution (see note below) to convert all myoglobin in
the sample to the DMb form. 8. Scan the sample with a scanning spectrophotometer from 700 to 400 nm. The DMb
absorption peaks should be within 2 nm of 433 and 556 nm.

Section XI: Details of Analytical Analyses Related to Meat Color 77
NotesAll myoglobin in the sample must be in the DMb form. The Soret peak at 433 nm is a good indi-cator of DMb. Analyze the sample only if the peak following scanning is within 2 nm of 433 nm. If the peak is within 2 nm of 433 nm, read the absorbance of the peak at 433 nm. Calculate total myoglobin concentration using the equation below.
CalculationsMolar absorptivity (extinction coefficient) of 1 M DMb solution in a 1-cm path-length cell at 433 nm is 114,000/M (Antonini and Brunori, 1971).
The molecular weight of bovine Mb was 16.949 kDa and was 17.3 kDa for poultry Mb (Joseph et al., 2010a). Therefore, an average of 17 kDa can be taken as Mb molecular mass.
Mb concentration (mg/g meat) = A433 × (1 M Mb/114,000) × [(1 mol/L)/M] × (17,000 g Mb/mol Mb) × (1000 mg/g) × dilution factor of 0.10 L/10 g meat.
% Mb denatured by cooking = [1 – (Mb conc. after heating/Mb conc. before heating)] × 100.
NotesIn myoglobin redox studies, sodium dithionite is used to reduce MMb to DMb before conversion to OMb. Generally, a ratio of 1:10 dithionite to myoglobin is used. Nevertheless, a higher amount may be required at times. Adding dithionite powder to a myoglobin solution directly may some-times result in protein denaturation. To minimize this, a 10% stock solution of dithionite can be used to reduce MMb. For every 1 mL myoglobin solution at 2.5 mg/mL concentration, 5 microli-ter of 10% dithionite can be added and mixed. If necessary, add another 5 microliter until DMb is formed. This will enhance mixing of dithionite in a myoglobin solution and will not result in appreciable dilution of the myoglobin. The dithionite stock solution must be stored in a brown bottle at 4°C and must be prepared fresh every 2 to 3 days.
For samples that have smaller concentrations of myoglobin due to low pigment content or in cooked, denatured samples, the extracted pigment could be converted to MMb by adding a small quantity of potassium ferricyanide. Care should be taken to minimize the quantity added as excess amounts of the oxidant can impart a yellow color to the myoglobin solution and may interfere with the absorbance. Metmyoglobin has a very strong Soret band at 409 nm (Bowen, 1949), which makes it possible to detect smaller concentrations of pigment. Soret peaks often have the greatest absorbance in the myoglobin absorbance spectra. Hence, the selection of a dilution factor is specific for each peak, the amount of extracted pigment in the test sample, and the maximum absorbance limit of the spectrophotometer
The dilution factor of 0.11 L/10 g meat was used for cooked steaks in low oxygen MAP. For raw samples, which have more Mb present, 1 mL of supernatant after centrifugation was fur-ther diluted with 2 mL cold 0.04 M phosphate buffer, pH 6.8 in a cuvette (dilution factor 3:1). For cooked steak samples packaged in high-oxygen MAP, 10 g pulverized sample was diluted with 50 mL phosphate buffer, for a dilution factor of 0.06 L/10 g meat (Hunt et al., 1999).
ReferencesAntonini, E., and M. Brunori. 1971. Hemoglobin and Myoglobin in Their Reactions with Ligands. North-Holland,
Amsterdam, the Netherlands.Bowen, W. J. 1949. The absorption spectra and extinction coefficients of myoglobin. J. Biol. Chem. 179:235–245.Hunt, M. C., O. Sørheim, and E. Slinde. 1999. Color and heat denaturation of myoglobin forms in ground beef. J.
Food Sci. 64:847–851.Joseph, P., S. P. Suman, S. Li, C. M. Beach, and J. R. Claus. 2010a. Mass spectrometric characterization and thermo-
stability of turkey myoglobin. LWT-Food Sci. Technol. 43:273–278.Warriss, P. D. 1979. The extraction of haem pigments from fresh meat. J. Food Technol. 14:75–80.

78 Color Guidelines Handbook
D. Total Myoglobin (Isobestic Point Assay) in Fresh or Cooked Meat
Principle
This procedure (Faustman and Phillips, 2001) is very similar to protocol C. Myoglobin in all forms (DMb, OMb, and MMb) is extracted into cold 0.04 M phosphate buffer, pH 6.8 (Warriss, 1979). However, instead of converting the pigment to a particular redox form, the total Mb con-centration is determined by absorbance at 525 nm, the isobestic point for all 3 forms of myoglo-bin. Note that residual blood hemoglobin will also be extracted and contribute to the total meat pigment content.
Reagents
1. 40 mM potassium phosphate buffer, pH 6.8 • KH2PO4 = 4.87 g • K2HPO4 = 2.48 g • 1000 mL distilled/deionized water
Procedures
1. Grind meat through a 1/8-inch plate or mince into 3-mm cubes or use the liquid nitrogen method in Protocol C.
2. Weigh duplicate 5-g meat samples and place samples in 50-mL polypropylene tubes. 3. Add 25 mL ice cold phosphate buffer (pH 6.8, 0.04 M) per 5-g sample (Warriss, 1979;
Trout, 1989). Dilution factor is 25 mL + 5 g = 30 mL/5 = 6. 4. Homogenize sample for 40 to 45 seconds at low speed, using the small diameter head of
a polytron or similar probe-type homogenizer. 5. Hold the sample in ice (0 to 4°C) for 1 hour. 6. Centrifuge sample at 50,000 × g for 30 minutes at 5°C. Filter supernatant through
Whatman #1 filter paper. A lower g-force may be used, but if the supernatant is turbid (A700 >0.05), clarify the supernatant through a syringe filter, as described in Appendix C; then measure A525 nm.
7. Measure absorbance at 525 nm (the isobestic point for the 3 forms of myoglobin) to calculate total myoglobin concentration.
Mb concentration (mg/g meat) = (A525 − A700) × (1 mM Mb/7.6) × [(1 mmol/L)/mM] × (17 g Mb/mmol Mb) × (0.03 L/5 g meat; the dilution factor) × 1000 mg/g), simplified to,
Mb concentration (mg/g meat) = (A525/7.6) × 17 × 6, where 7.6 = millimolar extinction co-efficient for Mb at 525 nm, and 6 = dilution factor. The molecular masses of Mb vary from 16.9 kDa (livestock Mb) to 17.3 kDa (poultry Mb; Joseph et al., 2010a). Therefore, an average of 17 kDa can be used as Mb molecular mass. Absorbance at 700 nm is used to compensate for tur-bidity (if any) and is therefore subtracted from the absorbance at 525 nm.
Percentage Mb denatured by cooking = [1 − (Mb conc. after heating ÷ Mb conc. before heating)] × 100 (Trout, 1989).

Section XI: Details of Analytical Analyses Related to Meat Color 79
ReferencesBowen, W. J. 1949. The absorption spectra and extinction coefficients of myoglobin. J. Biol. Chem. 179:235–245.Faustman, C., and A. Phillips. 2001. Measurement of discoloration in fresh meat. Unit F3.3 in Current Protocols in
Food Analytical Chemistry. S. J. Schwartz, ed. John Wiley and Sons Inc., New York, NY.Joseph, P., S. P. Suman, S. Li, C. M. Beach, and J. R. Claus. 2010a. Mass spectrometric characterization and thermo-
stability of turkey myoglobin. LWT-Food Sci. Technol. 43:273–278.Trout, G. R. 1989. Variation in myoglobin denaturation and color of cooked beef, pork, and turkey meat as influ-
enced by pH, sodium chloride, sodium tripolyphosphate, and cooking temperature. J. Food Sci. 54:536.Warriss, P. D. 1979. The extraction of haem pigments from fresh meat. J. Food Technol. 14:75–80.
80 Color Guidelines Handbook
E. Nitrosoheme and Total Heme Content of Cured Meats
Principle
Cured meat pigment is extracted in a solution of 80% acetone and 20% water, including the water content of the sample (Hornsey, 1956). Pigment content (ppm NO-hematin) is calculated based on sample absorbance at 540 nm. Curing efficiency is calculated as the percentage con-version of N0-heme to total heme. Well-cured meats typically have >80% of total pigment in the nitrosoheme form (Pearson and Tauber, 1984). Total heme pigments can also be determined us-ing an acidified acetone solution that extracts heme from all heme proteins, in the form of acid hematin, now commonly referred to as hemin. Total heme concentration is calculated based on sample absorbance at 640 nm.
Notes
The nitrosoheme pigment extracted in this assay is very susceptible to fading; thus, consider-able care needs to be taken to minimize photochemical oxidation by using reduced lighting and vessels covered with foil.
Procedure for nitrosoheme (cured meat pigment) content:
1. Trim off fatty tissue, and mince the lean in reduced light just before weighing. Conduct all subsequent steps in reduced light.
2. Weigh 10 g of minced lean into a tall 100-mL beaker (to minimize evaporation). Thoroughly mix the lean meat mince with 43 mL of a solution containing 40 mL of acetone and 3 mL of water. Considering a typical 10-g meat sample contains 7 mL water, the extraction solution is 80% acetone, giving maximum nitrosoheme pigment extraction without extracting DMB, OMb, or MMb (Hornsey, 1956).
3. Continue intermittent mixing of the sample for 5 minutes in reduced light. 4. After 5 minutes, filter the solution through medium-fast filter paper (Whatman #1 or
equivalent) into a 250 mL Erlenmeyer flask. 5. Measure absorption (optical density) of the filtrate in a spectrophotometer at a
wavelength of 540 nm using a 1-cm cell. Use 80% acetone/20% water solution for a blank.
Calculating NO-heme pigment concentration
NO-heme concentration (as ppm acid hematin) = sample A540 × 290.
Notes
1. Why express concentration units as acid hematin? Hornsey (1956) showed that under acid conditions, NO-heme was oxidized to acid hematin. Thus, acid hematin was used as the standard for determining millimolar absorptivity values at the A540 and A640 peaks. Acid hematin is now more commonly referred to as “hemin.”
2. How was the factor “290” determined? This factor was derived from the equation A540 = abC, where A540 is sample absorbance, a is absorptivity, b is length of light path (1 cm), and C is concentration of absorbing material (in mM). Absorptivity is a constant dependent

Section XI: Details of Analytical Analyses Related to Meat Color 81
on the wavelength of radiation and the nature and molecular weight of the absorbing material. Millimolar absorptivity at a given wavelength, denoted by the symbol EmM, is determined experimentally as the absorbance of a 1 mM solution of the substance in a 1-cm cell. The millimolar absorptivity of NO-heme (oxidized to hemin) at the 540 peak in 80% aqueous acetone is 11.3 (Hornsey, 1956). Hemin molecular weight is 652 Da.
The conversion factors needed to express the concentration in ppm hemin (1 ppm = 1 µg/g) and the dilution factors must also be considered. The dilution factor is the total extraction fluid volume (mL) divided by the sample weight (g). The total extraction fluid volume includes the water content of the sample and the amount of aqueous acetone solution. Most fresh and cooked meats are ~ 70% water. Thus, for a 10-g sample containing 7 mL water, the total extrac-tion volume = 7 + 43 mL acetone solution, and the dilution factor = 50/10 = 5.0. If the sample water content differs significantly from 70%, the water content of the acetone solution should be adjusted to yield 80% aqueous acetone during sample extraction (Cornforth, 2001).
Thus, NO-heme concentration C (as ppm hemin) = A540/ab × dilution and conversion factors.C = A540 × (1 mM NO-hemin/11.3) × (1 mol NO-heme/mol hemin) × [(1 mmol/L)/mM] × (652
mg hemin/mmol hemin) × (50 mL/10 g meat) × (1 g/1000 mg) × (1 L/1000 mL) × (106 µg/g).Simplifying, NO-heme concentration (ppm hemin) = A540 × (1/11.3) × 652 × 5 = A540 × 288.5.
Hornsey rounded the conversion factor to 290.
Procedure for total pigment content
1. Mix 10 g minced meat sample (70% water) with a solution of 40 mL of acetone, 2 mL of water, and 1 mL of concentrated HCl. This results in an 80, 20 acetone, water solution for optimal extraction of heme pigments. For samples with less than 70% water content, add sufficient water to bring the extraction mixture to an 80, 20 acetone to water ratio.
2. Store and periodically stir solution for one hour at room temperature before filtering. Acidification of the extraction solution results in extraction heme groups as acid hematin from both fresh and cured meat pigments The acidified acetone solution extracts heme groups in the form of acid hematin from uncured and cured meat pigments (DMb, OMb, MMb, NO-Mb) (Hornsey, 1956).
3. Measure the optical density (1-cm cell) of the filtrate at 640 nm to determine the total heme pigments. Use the solution in step 1 (acidified 80% acetone solution) as a blank.
4. In the estimation of total pigments, absorbance readings may be made for peaks at 512 and 640 nm. The ratio should be <1.9 if oxidation of NO-heme to acid hematin in acidified 80% acetone is complete. Calculate absorbance at 521/640 nm to verify a ratio of <1.9.
5. To express the concentration of total pigments in ppm, multiply the optical density at 640 nm by 680.
Calculating total pigment concentration and cure efficiency
Total heme concentration (ppm acid hematin) = sample A640 × 680.Cure efficiency (%) = (ppm of nitrosoheme ÷ ppm of total pigment) × 100.Cure efficiency: The percentage of total pigment converted to nitroso pigment and also indi-
cates the degree of cured color fading.
82 Color Guidelines Handbook
Notes
1. Why express concentration units as acid hematin? Hornsey, (1956) showed that under acid conditions, heme groups of all heme proteins, including DMb, OMb, MMb, and NO-Mb) were oxidized to acid hematin. Thus, acid hematin is the standard for determining millimolar absorptivity values at the A640 peak. Acid hematin is now more commonly referred to as “hemin.”
2. How was the factor “680” determined? This factor was derived from the equation A640 = abC, as described previously. The millimolar absorptivity of hemin at the 640 peak in 80% aqueous acetone is 4.8 (Hornsey, 1956). Hemin molecular weight is 652 Da.
Total heme concentration is calculated as shown previously for NO-heme pigment.Total heme concentration C (as ppm hemin) = A640/ab × dilution and conversion factors.C = A640 × (1 mM NO-hemin/4.8) × [(1 mmol/L)/mM] × (652 mg hemin/mmol hemin) × (50
mL/10 g meat) × (1 g/1000 mg) × (1 L/1000 mL) × (106 µg/g).Simplifying, NO-heme concentration (ppm hemin) = A640 × (1/4.8) × 652 × 5 = A540 × 679.2.
Hornsey rounded the conversion factor to 680.
ReferencesHornsey, H. C. 1956. Color of cooked cured pork. I. Estimation of the nitric oxide-haem pigments. J. Sci. Food Agric.
23:534–540.Pearson, A. M., and F. W. Tauber. 1984. Analytical methods. Pages 360–361 in Processed Meats. 2nd ed. A. M. Pear-
son and F. W. Tauber, ed. AVI Publishing, Westport, CT.

Section XI: Details of Analytical Analyses Related to Meat Color 83
F. Nitrosoheme and Total Heme Content of Small Samples
Principle
Pearson and Tauber (1985) modified Hornsey’s (1956) procedure for analyzing small (2-g) samples, reducing the amount of reagents needed, and increasing the number of samples ana-lyzed per day. Samples are placed in capped tubes to prevent evaporation.
Reagents
1. Acetone-a (aqueous acetone): Place 90 mL distilled water in a 1 L volumetric flask; add spectrophotometric grade acetone, mix and bring to volume.
2. Acetone-b (acidic acetone): Slowly add 20 mL of concentrated HCl to 80 mL of water. Transfer the dilute HCl solution to a 1 L volumetric flask, mix, and bring to volume with additional spectrophotometric grade acetone.
Procedures
1. Do all procedures in subdued light to reduce fading of pigment. 2. Weigh out 2.0 g minced lean meat sample in a 50-mL polypropylene centrifuge tube. 3. Pipet 9.0 mL acetone-a into 50-mL tube, to obtain acetone concentration of 80%. 4. Mix thoroughly with a probe-type homogenizer or a glass rod. 5. Cap the tube to minimize evaporation of acetone, and mix by gentle swirling. 6. Let stand 10 minutes in the dark, then filter through medium-fast filter paper into a glass
test tube. 7. Transfer filtrate into a 1-cm quartz cuvette and read absorbance at 540 nm. (Avoid use of
disposable plastic cuvettes. They become opaque upon exposure to acetone). Calculate nitroso pigment concentration as previously described.
8. Prepare another 2.0-g sample, using acetone-b. 9. Macerate and hold 1 hour in the dark before filtering. 10. Filter the extract as before, and read absorbance at 640 nm. Calculate total pigment and
cure efficiency as previously described.
ReferencesCornforth, D. P. 2001. Spectrophotometric and reflectance measurements of pigments of cooked and cured meats. Unit
F3.2 in Current Protocols in Food Analytical Chemistry. S. J. Schwartz, ed. John Wiley and Sons Inc., New York, NY.
Hornsey, H. C. 1956. Color of cooked cured pork. I. Estimation of the nitric oxide-haem pigments. J. Sci. Food Agric. 23:534–540.
Pearson, A. M., and F. W. Tauber. 1984. Analytical methods. Page 360–361 in Processed Meats. 2nd ed. A. M. Pearson and F. W. Tauber, ed. AVI Publishing, Westport, CT.
84 Color Guidelines Handbook
G. Isolating Myoglobin for In Vitro Studies
Principle:
Pure myoglobin is sometimes needed, for example, to compare autoxidation rate of Mb among different species. Myoglobin (mw ~16,949) can be readily purified from skeletal or cardiac muscle. Its red color permits easy visualization during chromatography. This method provides substantial yields of myoglobin, using relatively inexpensive equipment (Faustman and Phillips, 2001; as adapted from earlier procedures of Wittenberg and Wittenberg, 1981, and Trout and Gutzke, 1996).
Sample, reagents, and solutions
1. Diced beef muscle trimmed of visible fat and connective tissue 2. Homogenization buffer (10 mM Tris-Cl/1 mM EDTA, pH 8.0) at 4°C 3. Sodium hydroxide 4. Ammonium sulfate 5. Dialysis buffer (10 mM Tris-Cl/1 mM EDTA, pH 8.0) at 4°C 6. Chromatography elution buffer (5 mM Tris-Cl/1 mM EDTA, pH 8.5) at 4°C
Notes
To minimize formation of metmyoglobin, homogenization and all subsequent steps should be performed at 0 to 5°C and high pH (8.0 to 8.5).
Equipment
Blender, cheese cloth, centrifuge capable of 20,000 × g at 4°C, dialysis tubing (molecular wt cut-off 12,000 to 14,000), Sephracryl S-200 HR chromatography column (30 × 2.5 to cm), peristal-tic pump. Additional reagents and equipment are needed to assay protein concentration, or to calculate myoglobin concentration based on its extinction coefficient.
Prepare homogenate
1. Homogenize 150 g diced muscle in a blender with 450 mL of homogenization buffer for 1 to 2 minutes at high speed.
2. Divide homogenate equally between tubes and centrifuge for 10 minutes at 3000 × g at 4°C. 3. Pool supernatants, discard precipitate, and adjust pH of resulting supernatant to 8.0
using sodium hydroxide. 4. Filter supernatant through 2 layers of cheese cloth to remove lipid and connective tissue
particles.
Precipitate myoglobin
1. Bring filtrate to 70% ammonium sulfate saturation (472 g ammonium sulfate/L filtrate), adjust pH to 8.0 using sodium hydroxide, and stir for 1 hour.
2. Divide homogenate equally between tubes and centrifuge 20 minutes at 18,000 × g at 4°C to remove precipitated proteins.
Section XI: Details of Analytical Analyses Related to Meat Color 85
3. Pool the supernatants, and discard precipitate. 4. Bring supernatant from 70% to 100% ammonium sulfate saturation (by adding an
additional 228 g ammonium sulfate/L supernatant), adjust pH to 8.0 using sodium hydroxide, and stir for 1 hour.
5. Divide homogenate equally between tubes and centrifuge the solution for 1 hour at 20,000 × g at 4°C. Discard the supernatant and add 1 or 2 mL of ice-cold buffer to aid in recovery of the precipitate.
Dialyze and purify myoglobin
1. Transfer precipitated myoglobin to dialysis tubing and dialyze against dialysis buffer (1 vol protein, 10 vol buffer) for 24 hours at 4°C, changing buffer every 8 hours.
2. Equilibrate a Sephacryl S-200 HR chromatography column with chromatography elution buffer (3 column volumes) using a peristaltic pump.
3. Apply dialysate to column and resolve myoglobin extract with chromatography elution buffer at a flow rate of 60 mL/hour. This step separates hemoglobin from myoglobin. Hemoglobin will elute first as a pale red/brown band. Myoglobin will follow as a readily visible dark red band.
4. Collect myoglobin-containing fractions using a fraction collector.
Concentrate myoglobin
1. Pool all myoglobin-containing fractions. Native polyacrylamide gel electrophoresis can be used to assess the purity of the myoglobin extracts, which should produce a single protein band with a molecular weight of 17 kDa.
2. Concentrate myoglobin solution using centrifugal concentrators. 3. Alternatively (to step 2), bring myoglobin solution to 100% ammonium sulfate
saturation (761 g ammonium sulfate/L solution), adjust pH to 8.0, and stir solution for 1 hour. Divide solution equally among tubes and centrifuge for 1 hour at 20,000 × g at 4°C. Discard supernatants and dialyze myoglobin as described earlier.
4. Alternatively (to steps 2 and 3), the myoglobin may be concentrated by ultrafiltration as described by Trout and Gutzke (1996).
5. Measure protein concentration of myoglobin solution and freeze in aliquots at −80°C.
Notes
This myoglobin isolation procedure has relatively low yields and requires 2 to 3 months of col-lection to get much volume.
ReferencesFaustman, C., and A. Phillips. 2001. Measurement of discoloration in fresh meat. Unit F3.3 in Current Protocols in
Food Analytical Chemistry. S. J. Schwartz, ed. John Wiley and Sons Inc., New York, NY.Trout, G. R., and D. A. Gutzke. 1996. A simple, rapid preparative method for isolating and purifying oxymyoglobin.
Meat Sci. 43:1–13.Wittenberg, J. B., and B. A. Wittenberg. 1981. Preparation of myoglobins. Methods Enzymol. 76:29–42.

86 Color Guidelines Handbook
H. Isolating Mitochondria from Beef Skeletal Muscle
Principle
Mitochondrial isolation consists of three steps, cell rupture, homogenization, and centrifuga-tion. The use of proteases with skeletal muscle greatly facilitates the release of the mitochon-dria and improves yield.
Reagents
1. 1 M sucrose: Dissolve 342.3 g of sucrose in 1 L of distilled water; mix well and prepare 20 mL aliquots; store them at −20°C.
2. 0.1 M Tris/MOPS: Dissolve 12.1 g of Tris [tris(hydroxymethy)aminomethane] in 500 mL of distilled water, adjust pH to 7.4 using MOPS [3-(N-morpholino)propanesulfonic acid] powder, bring the solution to 1 L and store at 4°C.
3. 1 M Tris/HCl: Dissolve 121.14 g of Tris in 500 mL of distilled water, adjust pH to 7.4 using HCl, bring the solution to 1 L and store at room temperature.
4. 1 M EDTA: Dissolve 372.2 g of EDTA (ethylenediaminetetraacetic acid) in 500 mL of distilled water and store at 4°C.
5. 10% BSA: Dissolve 10 g of BSA (bovine serum albumin) in 100 mL of distilled water and store at −20°C.
6. 1 M Pi: Dissolve 136.1 g of KH2PO4 in 500 mL of distilled water, adjust pH to 7.4 using Tris powder, bring the solution to 1 L and store at 4°C.
7. 10 mM EDTA: Dissolve 2.92 g of EDTA in 1 L of distilled water and store at 4o C. 8. 0.5% BSA: Dissolve 5 g of BSA in 1 L of distilled water and store at −20°C. 9. Nagarse protease: Prepare a 20 mg % Nagarse (20 mg per 100 mL of the isolation medium). CRITICAL NOTE: Choice of other proteases (trypsin) depends on investigator
preference and protocol as well as the type of muscle used for the isolating mitochondria. 10. Preparation of phosphate buffered saline (PBS) stock solution (Ca2+, Mg2+ free), pH 7.4
(4°C): Prepare 10× PBS using deionized water, filter through a Millipore filter. Dilute 1:10 just before use with 4°C cold water.
11. For 10×, 1 L PBS, (A) Add 500 mL water containing 90 g NaCl; (B) Make 500 mL of 0.2 M phosphate buffer (20×) by dissolving, 13.8 g/500 mL monobasic (add 13.8 g to ~400 mL deionized H2O; and bring volume up to 500 mL in graduated cylinder), and 14.2 g/500 mL dibasic anhydrous or 26.81 g/500 mL dibasic heptahydrate; (C) To 500 mL dibasic, add enough monobasic (approximately 100 mL or less) to reach pH 7.4; (D) For a 10×, 1 L PBS, add 500 mL water containing 90 g NaCl to 500 mL dibasic/monobasic mixture (pH 7.4).
12. Isolation buffer 1 for muscle mitochondria (IBm1): Prepare 1 L of IBm1 by mixing 100 mM sucrose, 46 mM KCl, 10 mM EDTA, and 100 mM Tris/HCl. Adjust the pH to 7.4. Bring the volume to 1 L with distilled water.
CRITICAL NOTE: Do not add Nagarse and BSA to this medium.

Section XI: Details of Analytical Analyses Related to Meat Color 87
13. Isolation buffer 2 for muscle mitochondria (IBm2): Prepare 1 L of IBm2 by mixing 100 mM sucrose, 46 mM KCl, 10 mM EDTA, 100 mM Tris/HCl and 0.5% BSA. Adjust the pH to 7.4. Bring the volume to 1 L with distilled water.
CRITICAL NOTE: The Nagarse in medium should be limited to 20 mg in 100 mL of solvent.
14. Experimental Buffer (for incubating or suspending isolated mitochondria) for muscle mitochondria (EBm): Prepare 1 L of EBm by mixing 230 mM Mannitol, 70 mM sucrose, 0.02 mM EDTA, 20 mM Tris/HCl and 5 mM Pi. Adjust the pH to 7.4. Bring the volume to 1 L with distilled water.
CRITICAL NOTE: Use this buffer ONLY for suspension or incubation of isolated mitochondria for further storage, spectrophotometric measurements and/or enzymatic analytical assays.
CRITICAL STEP 1: Use EDTA instead of EGTA chelates also Mg2+, which is extremely abundant in muscle tissue (given the high content in ATP). Mg2+ can influence mitochondrial function as well as the kinetics of cytochrome c release.
CRITICAL STEP 2: Wash all glassware three times with double distilled water to avoid Ca2+ contamination. Ca2+ overload is the most common cause for the dysfunction of isolated mitochondria.
CRITICAL STEP 3: Prepare all the buffers the same day of the experiment, to avoid bacterial/yeast growth in stored buffers.
CRITICAL STEP 4: Because pH depends on temperature, measure the pH of all solutions at 25°C.
Procedure
1. Remove a 5-g (weigh to 0.1 g) sample of muscle tissue of interest that does not contain any visible fat or connective tissue and cut into small pieces.
2. Using a small beaker, immerse the muscle tissue in 20 mL of ice-cold PBS (Phosphate Buffered Saline) supplemented with 10 mM EDTA.
3. Use scissors to mince the muscle into small pieces. 4. Wash the minced muscle two or three times with ice-cold PBS supplemented with 10
mM EDTA. 5. Re-suspend the minced muscle in 5 mL of ice-cold PBS supplemented with 10 mM EDTA. 6. Centrifuge at 200 × g for 5 minutes, and discard the supernatant. 7. Re-suspend the pellet in 10 mL of IBm2. CRITICAL NOTE: The optimal ratio between tissue and isolation buffer ranges from 1:5
to 1:10 (w/v). 8. Homogenize the muscle tissue using a Potter-Elvehjem grinder with Teflon pestle
operated at 1,600 rpm; stroke the minced muscle 10 to 20 times. CRITICAL NOTE: Pre-cool the glassware in an ice-bath 5 minutes before starting
the procedure. Homogenization and the following steps must be performed at 4°C to minimize the activation of phospholipases and proteases that might damage the muscle.

88 Color Guidelines Handbook
9. Transfer the homogenate to a 50-mL polypropylene Falcon tube and centrifuge at 700 × g for 10 minutes at 4°C.
10. Transfer the supernatant to glass centrifuge tubes and centrifuge at 8,000 × g for 10 minutes at 4°C.
11. Discard the supernatant and re-suspend the pellet containing mitochondria in 10 mL of IBm2. Use a glass rod to loosen the pellet paste.
12. Centrifuge at 8,000 × g for 10 minutes at 4°C. 13. Discard supernatant and re-suspend the mitochondria (pellet) in 0.3 to 0.5 mL of EBm
buffer. Use a 200-µL pipette and avoid forming any bubbles during the re-suspension. CAUTION: Avoid using IBm1 and IBm2 buffers at this stage for suspension. 14. Measure the mitochondrial concentration using one of the Biuret/Bradford/
Bicinchoninic Acid assay (BCA) methods.
ReferencesBhattacharya, S. K., J. H. Thakar, P. L. Johnson, and D. R. Shanklin. 1991. Isolation of skeletal muscle mitochondria
from hamsters using an ionic medium containing EDTA and Nagarse. Anal. Biochem. 192:344–349.Frezza, C., S. Cipolat, and L. Scorrano. 2007. Organelle isolation, functional mitochondria from mouse liver, mus-
cle and cultured fibroblasts. Nat. Protoc. 2:287–295.Mohan, A., M. C. Hunt, S. Muthukrishnan, T. A. Houser, and T. E. Barstow. 2010c. Myoglobin redox form stabiliza-
tion by compartmentalized lactate and malate dehydrogenases. J. Agric. Food Chem. 58:7021–7029.

Section XI: Details of Analytical Analyses Related to Meat Color 89
I. Oxygen Consumption of Intact Muscle or Ground Meat
Principle
Freshly cut meat slices are oxygenated (allowed to bloom) for a standardized time and temper-ature and then vacuum packaged. The decline in OMb due to enzyme respiration is measured as an indicator of the tissue’s ability to consume oxygen. Reflectance spectra over the range 400 to 700 nm are recorded immediately and a second time after 20 minutes in a water bath or incu-bator kept at 25°C. Oxymyoglobin levels are calculated using the ratio of the reflectance at 610 and 525 nm after K/S transformation as described in Section IX. Higher K/S610/K/S525 ratios indicate higher OMb levels. Oxygen consumption (OC) is reported as the difference in percent-age from the first and last measurements.
Equipment and Supplies
1. Vacuum packaging machine 2. PVC film 3. Highly oxygen-impermeable vacuum bags (O2 permeability ≤0.6 g O2/625 cm2/24 hours
at 0°C) 4. Spectrometer that can scan and record surface reflectance from 400 to 700 nm (see
Section IX)
Procedure
1. All samples to be assayed must be the same temperature, 4°C, for instance. Otherwise oxygen consumption will be faster for samples at warmer temperatures and bloom development (oxygenation) will be less; it will be slower for those at colder temperatures and bloom development will be more.
2. Keep all samples at 2 to 4°C to help ensure uniform oxygenation. For intact, whole muscle, use a sharp knife to remove a 3 cm × 3 cm × 2 cm sample with minimal visible fat or connective tissue. For ground samples, prepare a comparable sized cube that has been uniformly packed. Again, the visible fat level should be typical of the lean portion of the sample. Avoid dull knives that disrupt surface structure. Also avoid excessive handling and pressing of the blooming surface of ground product (see Madhavi and Carpenter, 1993).
3. If the surface is not a fresh cut, then just before starting the bloom step, remove a thin surface layer to expose fresh tissue.
4. Cover the freshly cut surface with a small piece of oxygen-permeable film to avoid drying. Keep the film (polyvinyl chloride film is commonly used) in one, smooth layer to ensure uniform exposure of the surface to air. Make note of the film’s oxygen permeability.
5. Bloom for 2 hours at 2 to 4°C (or some other standardized time). Take care to keep all samples at the same temperature during this step because blooming is very temperature dependent.
6. After bloom, remove the PVC film and place the sample in a pouch with very low oxygen permeability. Quickly vacuum package with high vacuum; keep the vacuum uniform from sample to sample.

90 Color Guidelines Handbook
7. IMMEDIATELY scan the surface of the sample for reflectance from 400 to 700 nm to determine the initial % OMb. The spectrophotometer must be calibrated through the vacuum bag film.
8. To speed up oxygen consumption, use an incubator or water bath at 25°C. Re-scan the same surface after 20 minutes (or some standardized time appropriate to the meat being used).
Calculations
%OMb = [K/S610 ÷ K/S525 (for 100% DMb)] − [K/S610 ÷ K/S525 (sample)] ÷ [K/S610 ÷ K/S525 (for 100% DMb)] − [K/S610 ÷ K/S525 (for 100% OMb)][× 100].
Oxygen consumption = [(Initial % OMb − Ending % OMb) ÷ Initial % OMb] × 100.
Notes
Madhavi and Carpenter (1993) described a reflectance procedure for measuring oxygen con-sumption (OC), using a spectrophotometer with reflectance attachment to measure surface OMb levels of vacuum packed samples initially, and at 5-minute intervals (20 minutes total) at 4°C. Samples were smaller (2.5 × 2.5 × 0.5 cm) to fit in the sample port of the reflectance unit. Relative concentration of OMb was calculated using the method of Krzywicki (1979). However, that method was modified by Tang et al. (2004) and their revised wavelengths are recommend-ed (see Section IX). OC was expressed as percentage of time-zero surface OMb consumed during 10 minutes in vacuum.
Mancini, Hunt and Kropf (2003) reported a method using reflectance at 610 nm to directly determine OMb. This is possible because OMb has its unique reflectance at 610 while 610 is isobestic for both DMb and MMb (see Section IX for further discussion of meat surface reflec-tance measurements and calculation of K/S ratios). This method has been used successfully (see King et al., 2011).
Some research has reported an actual “rate of oxygen consumption” using percentage chang-es of OMb per unit of time. This is more laborious and time consuming. With a large number of samples, “oxygen consumption” is often calculated as the “average percentage reduction of OMb” relative to the initial level of OMb formed on the sample. The time for deoxygenation of the sample must to be standardized. Usually, 20 minutes is sufficient to detect sample differ-ences.
ReferencesKing, D. A., S. D. Shackelford, A. B. Rodriguez, and T. L. Wheeler. 2011. Effect of time of measurement on the re-
lationship between metmyoglobin reducing activity and oxygen consumption to instrumental measures of beef longissimus color stability. Meat Sci. 87:26–32.
Madhavi, D. L., and C. E. Carpenter. 1993. Aging and processing affect color, metmyoglobin reductase and oxygen consumption of beef muscles. J. Food Sci. 58:939–942.
Mancini, R. A., M. C. Hunt, and D. H. Kropf. 2003. Reflectance at 610 nanometers estimates oxymyoglobin content on the surface of ground beef. Meat Sci. 64:157–162.
Mohan, A., M. C. Hunt, T. J. Barstow, T. A. Houser, and D. M. Hueber. 2010a. Near-infrared oximetry of three post-rigor skeletal muscles for following myoglobin redox forms. Food Chem. 123:456–464.
Tang, J., C. Faustman, and T. A. Hoagland. 2004. Krzywicki revisited, equations for spectrophotometric determi-nation of myoglobin redox forms in aqueous meat extracts. J. Food Sci. 69:C717–C720.

Section XI: Details of Analytical Analyses Related to Meat Color 91
J. Metmyoglobin Reducing Capacity of Intact or Ground Meat
Principle
Surface pigments are initially oxidized to MMb by soaking the sample slice in a dilute sodium nitrite solution for 20 minutes. The slice (1.27 cm thick) is vacuum packaged, and surface % MMb is monitored for 2 hours at 30°C by measuring reflectance K/S ratios (572/525 nm). Sam-ple reducing ability is defined as the percentage decrease in surface MMb concentration during the incubation period. The decline in MMb is assumed to reflect the tissue’s ability to reduce ferric heme iron.
Reagent
1. 0.3% (w/w) sodium nitrite solution: Tare a large beaker, and weigh 3.0 g NaNO2 into the beaker and add distilled water to 1000 g. Make fresh daily. Incubate at room temperature.
Procedure
1. Remove a 3 cm × 3 cm × 2 cm sample of muscle tissue with no visible fat or connective tissue. For ground meat, use a similar sized sample that has been uniformly packed together to help avoid crumbling when the sample is immersed.
2. Be sure to orient sample to identify which surface will be evaluated later. This surface may be fresh cut or the surface that was displayed.
3. Submerge sample in 0.3% NaNO2 solution for 20 minutes at room temperature to induce MMb formation. Ground samples can be placed on a small screen to help lower and raise the cube with minimal crumbling.
4. Remove sample from beaker, and blot to remove excess solution. Retain the 3-dimensional shape as much as possible and place the surface for evaluation up in an impermeable bag and vacuum package (a good, uniform vacuum). The vacuum may slightly flatten or round the samples.
5. Scan immediately for reflectance from 400 to 700 nm to determine the initial amount of MMb formed on the surface. Maintain surface integrity.
6. Place sample in an incubator at 30°C, and rescan after 2 hours to determine the remaining amount of MMb.
Calculations
%MMb = [K/S572 ÷ K/S525 (for 100% DMb)] − [K/S572 ÷ K/S525 (sample)] ÷ [K/S572 ÷ K/S525 (for 100% DMb)] − [K/S572 ÷ K/S525 (for 100% MMb)][× 100].
MRA (% of MMb reduced) = [(Initial %MMb − Final %MMb) ÷ Initial %MMb] × 100orUse the initial MMb formed as an indicator of MRA (see note below).

92 Color Guidelines Handbook
Notes
Some authors (McKenna et al., 2005; Mancini et al., 2008) indicate that the initial amount of MMb formed by oxidation in sodium nitrite solution is a good indicator of sample MRA. How-ever King et al. (2011) found that percentage reduction was better than the initial amount of MMb formed. Thus, it is best to collect and statistically analyze both the initial amount of MMb formed, and the percentage of MMb reduced over the incubation time.
ReferencesKing, D. A., S. D. Shackelford, A. B. Rodriguez, and T. L. Wheeler. 2011. Effect of time of measurement on the re-
lationship between metmyoglobin reducing activity and oxygen consumption to instrumental measures of beef longissimus color stability. Meat Sci. 87:26–32.
Mancini, R. A., M. Seyfert, and M. C. Hunt. 2008. Effects of data expression, sample location, and oxygen partial pressure on initial nitric oxide metmyoglobin formation and metmyoglobin-reducing-activity measurement in beef muscle. Meat Sci. 79:244–251.
McKenna, D. R., P. D. Mies, B. E. Baird, K. D. Pfeiffer, J. W. Ellebracht, and J. W. Savell. 2005. Biochemical and physi-cal factors affecting discoloration characteristics of 19 bovine muscles. Meat Sci. 70:665–682.
Mohan, A., S. Muthukrishnan, M. C. Hunt, T. J. Barstow, and T. A. Houser. 2010d. Kinetics of metmyoglobin reduc-tion by malate dehydrogenase. J. Agric. Food Chem. 58:6994–7000.
Raines, C. R., M. C. Hunt, and J. A. Unruh. 2010. Contributions of muscles of various color stabilities to the overall color stability of ground beef. J. Food Sci. 75:C85–C89.
Sammel, L. M., M. C. Hunt, D. H. Kropf, K. A. Hachmeister, C. L. Kastner, and D. E. Johnson. 2002b. Influence of chemical characteristics of beef inside and outside semimembranosus on color traits. J. Food Sci. 67:1323–1330.
Watts, B. M., J. Kendrick, M. W. Zipser, B. Hutchins, and B. Saleh. 1966. Enzymatic reducing pathways in meat. J. Food Sci. 32:855–862.

Section XI: Details of Analytical Analyses Related to Meat Color 93
K. Reduction of Metmyoglobin by Skeletal Muscle Extracts
Principle
Metmyoglobin reductase activity is monitored as the reduction of MMb to DMb, followed by rapid formation of OMb in an aerobic system. Enzyme activity is calculated based on the increase in ab-sorbance of OMb at 580 nm during the initial linear phase of the reaction (1 to 2 minutes).
Procedure
1. Remove a 5-g (weigh to 0.1 g) sample of muscle tissue that does not contain any visible fat or connective tissue; cut sample into small pieces.
2. Homogenize the sample in 20 mL of a 0.2 mM sodium phosphate buffer pH 5.6 (or the pH of the muscle) for 90 seconds or until the muscle tissue had been completely disrupted.
3. Centrifuge the homogenate at 35,000 × g in a Beckman ultracentrifuge for 30 minutes at 4°C.
4. Decant the supernatant into a small beaker and filter 2 to 3 mL with a 0.4-micron syringe filter into a small test tube.
5. Prepare assay solutions: 5 mM disodium EDTA 50 mM sodium citrate buffer pH 5.65 (adjust this pH to the desired pH) 3.0 mM potassium ferrocyanide 0.75 mM metmyoglobin [horse skeletal muscle, Sigma M-0630 or purified from pig or
bovine (see purification protocol)] in 30 mM sodium phosphate buffer 1.0 mM NADH (Sigma N-8129) 6. Turn on the Hitachi UV-2010 spectrophotometer and warm up for 10 minutes. 7. If possible load a spectrophotometric software program that measures the absorbance
increase at 580 nm for 180 to 240 seconds; otherwise load software manually. 8. Place an empty cuvette in the spectrophotometer cell, and zero the instrument. 9. Add the following reagent amounts to plastic microcuvettes: 100 µL 5 mM EDTA 100 µL 50 mM citrate buffer 100 µL 3.0 mM potassium ferrocyanide 200 µL of 0.75 mM metmyoglobin 200 µL deionized water 10. Place each microcuvette in the spectrophotometer cell and simultaneously add 100 µL of 1 mM NADH 200 µL of filtered muscle extract 11. Mix well by pipetting and releasing the solution at least two times.
Note: Add the reagents and mix as quickly as possible because the reaction will begin immediately.

94 Color Guidelines Handbook
12. Begin measuring the absorbance increase at 580 nm as soon as possible and continue for 180 to 240 seconds. As metmyoglobin is reduced by the muscle extract the absorbance at 580 nm will increase.
13. The reducing activity can then be calculated using Beer’s law with the extinction coefficient of 12 × 103 for oxymyoglobin at 580 nm.
14. Metmyoglobin reductase activity is expressed as nanomoles of metmyoglobin reduced/minute/gram of muscle during the initial linear phase of the time course (usually the first minute or two).
Example
If the absorbance at 580 nm at 0 seconds is 0 and the absorbance at 60 seconds is 0.132, then ΔAbs580nm = 0.132/minute. Use Beer’s law to calculate the change in the concentration of metmyoglobin to oxymyoglobin.
A = Ebc, whereA = absorbance (or change in absorbance)b = Path length (1 cm for the plastic microcuvettes)E = Extinction coefficient (12,000)C = Concentration in moles/liter0.132 = 12000 × 1 × cc = 0.132/12000c = 11.0 × e-6 M/minute/5 g of muscle or 11 µM/minute/5 g of muscle
Notes
Remember this is the change in concentration, not the concentration.Multiply the change in concentration by the volume in the cuvette to change the concentra-
tion to moles.11 e-6 mol/L/minute/5 g × 0.0015 liters =16.5 e-9 mol reduced/minute/5 g of muscle =16.5 nmol reduced/minute/5 g of muscle =3.3 nmol reduced/minute/g of muscle3.3 nmol of metmyoglobin reduced/minute/g = number to report
Notes
If you take the change in absorbance over 120 seconds (2 minutes) then divide the final number by 2.
ReferencesHagler, L., R. I. Coppes Jr., and R. H. Herman. 1979. Metmyoglobin reductase. J. Biol. Chem. 254:6505–6514.Madhavi, D. L., and C. E. Carpenter. 1993. Aging and processing affect color, metmyoglobin reductase and oxygen
consumption of beef muscles. J. Food Sci. 58:939–942.Mohan, A., M. C. Hunt, T. J. Barstow, T. A. Houser, and D. M. Hueber. 2010a. Near-infrared oximetry of three post-
rigor skeletal muscles for following myoglobin redox forms. Food Chem. 123:456–464.
Section XI: Details of Analytical Analyses Related to Meat Color 95
L. Detecting Reflectance of Denatured Globin Hemochromes
Principle
The presence of denatured globin hemochrome pigments is indicated by the presence of reflec-tance maxima near 528 and 558 nm (Ghorpade and Cornforth, 1993).
Materials and Equipment
1. White standard (powdered barium sulfate.) 2. Recording spectrophotometer and integrating sphere attachment, with ports for sample
and standard. 3. Clear polyethylene vacuum bags (1.5-mil thickness).
Procedure
1. Standardize the recording spectrophotometer to 100% reflectance from 420 to 700 nm, using the white standard (powdered barium sulfate) in both the sample and standard ports of the reflectance attachment.
2. Obtain a uniform meat slice 3 cm × 3 cm (sufficient to completely cover the sample port on the reflectance attachment) and >3 mm thick.
3. To exclude air and minimize fading, rapidly place the fresh slice in a clear polyethylene vacuum bag (1.5 mil thickness). Press the bag against the sample from bottom to top to remove air bubbles. The sample remains in the clear polyethylene bag during reflectance measurement to prevent fading.
4. Place the bagged sample snugly into the sample port of the reflectance sphere, with the freshly sliced surface facing inward (toward the detector). Record surface reflectance (% of standard) from 420 to 700 nm. The presence of denatured globin hemochrome pigments is indicated by the presence of reflectance maxima near 528 and 558 nm (Ghorpade and Cornforth, 1986; Cornforth, 2001).
5. Optional: To obtain a difference spectrum between fresh and faded samples, allow a control meat slice to fade in air for 15 to 30 minutes.
6. Bag the sample and record the reflectance spectra as described for fresh samples. 7. Subtract the baseline spectrum (faded slice) from the fresh sample spectrum.
ReferencesCornforth, D. P. 2001. Spectrophotometric and reflectance measurements of pigments of cooked and cured meats. Unit
F3.2 in Current Protocols in Food Analytical Chemistry. S. J. Schwartz, ed. John Wiley and Sons Inc., New York, NY.
Ghorpade, V. M., and D. P. Cornforth. 1993. Spectra of pigments responsible for pink color in pork roasts cooked to 65 or 82°C. J. Food Sci. 58:51–52, 59.

96 Color Guidelines Handbook
M. Nitrite Analysis of Cured Meat
Principle
Nitrite ion is extracted into hot water. A portion of the extract is mixed with Greiss reagent (sul-fanilamide + N-(1-naphthyl)-ethylenediamine), forming a pink azo dye with maximum absor-bance at 540 nm. The pink color intensity is linearly proportional to the initial nitrite concen-tration (Beer’s law). Sample nitrite concentration is calculated from the nitrite standard curve, with sample dilution factors considered.
Reagents and Apparatus
1. NED reagent: Dissolve 0.2 g N-(1-naphthyl)-ethylenediamine-2-HCl in 150 mL 15% (v/v) acetic acid. Filter if necessary, and store in a brown glass bottle.
2. Sulfanilamide reagent: Dissolve 0.5 g sulfanilamide in 150 mL 15% (v/v) acetic acid. Filter if necessary, and store in a brown glass bottle.
3. Nitrite standard: a. Stock solution; 1,000 ppm sodium nitrite. Dissolve 1.0 g sodium nitrite in water, and
dilute to 1 L. b. Intermediate solution; 100 ppm sodium nitrite. Dilute 100 mL stock solution to 1 L
with water. c. Working solution; 1 ppm sodium nitrite. Dilute 10 mL intermediate solution to 1 L
with water. 4. Test filter paper for nitrite contamination by analyzing 3 to 4 sheets from box. Filter
about 40 mL water through each sheet. Add 4 mL sulfanilamide reagent, mix, let stand 5 minutes, add 4 mL NED reagent, mix, and wait 15 minutes. If any sheets test positive, discard the entire box.
Procedure
1. Weigh 5 g finely minced tissue and thoroughly mixed sample into 50-mL beaker. 2. Add about 40 mL of 80°C water. Mix thoroughly with glass rod, breaking up all lumps,
and transfer to 500-mL volumetric flasks. 3. Wash beaker and rod with successive portions of the hot water, adding all washings to
the flask. 4. Add enough hot water to bring volume to about 300 mL, transfer flask to 80°C water
bath, and let stand for 2 hours, shaking occasionally. 5. Cool to room temperature, dilute to volume with water, and mix again. 6. Filter, add 2.5 mL sulfanilamide reagent to aliquot containing 5 to 50 µg sodium nitrite in
50-mL volumetric flask, and mix. 7. After 5 minutes, add 2.5 mL NED reagent, mix, dilute to volume, mix again, and let color
develop 15 minutes. 8. Transfer portion of solution to photometer cell, and read A540 against a blank of 45 mL
water, 2.5 mL sulfanilamide reagent, and 2.5 mL NED reagent.

Section XI: Details of Analytical Analyses Related to Meat Color 97
9. Prepare standard curve by adding 10, 20, 30, and 40 mL of working sodium nitrite solution to 50-mL volumetric flasks, add 2.5 mL sulfanilamide reagent, mix, and proceed as above, beginning with step 7. Standard curve is a straight line to 1 ppm sodium nitrite in final solution.
Calculations
Sample ppm NaNO2 (µg NaNO2/g sample) = ppm NaNO2 (from the standard curve) × 50/ali-quot size (mL) × 500/sample weight (g)
ReferenceAOAC. 1990. Nitrites in cured meats. Method 973.31. Page 938 in Official Methods of Analysis. 15th ed. K. Helrich,
ed. AOAC, Arlington, VA.

98 Color Guidelines Handbook
N. Nitrate Analysis of Cured Meat and Ingredients
Principle
Nitrite and nitrate ions are extracted into hot water. Initial nitrite concentration is determined by the intensity of pink color (A540) upon reaction with Greiss reagents, as described previ-ously. For nitrate + nitrite determination, sample extracts are incubated with a solution of vanadium(III) + Greiss reagents. The vanadium in acid solution reduces all nitrate ions to nitrite. As nitrite forms, it is captured by Griess reagents, along with pre-existing nitrite. Ni-trate concentration = Total nitrite (nitrate + nitrite in the vanadium assay) – initial nitrite. The method has been adapted by combining the vanadium + Greiss reagents into one solution and conducting the assay in spectrophotometer cuvettes.
Procedure (NEMI, 2011)
1. Pour about 200 mL 0.5 M HCl into a small bottle. 2. Place the bottle on a balance in a hood and directly weigh about 0.5 g vanadium(III)
chloride into the bottle (to avoid it sticking to spatulas, weigh dishes, etc.). If un-dissolved particles remain, filter through a >2 micron syringe filter.
3. Add about 0.2 g sulfanilamide and 0.01 g N-(1-naphthyl)-ethylenediamine dihydrochloride (NED) and dissolve.
Notes
Store the opened bottle of VCl3 over a desiccant such as anhydrous calcium sulfate. VCl3 gives off corrosive fumes when exposed to moist air, but fumes will no longer be released after it is dis-solved in the reagent. Vanadium chloride is not classified as toxic or harmful to the environment (MSDS data), unlike cadmium used in older methods.
The VCl3 + Greiss reagent solution will keep about a week if refrigerated, but it is sensitive to air and light and is easily oxidized if left at room temperature and uncapped for several days.
Mix the following volumes of sample and reagent directly in semimicro cuvettes, or to scale to suit the cells of the instrument being used.
For 1 to 20 ppm (µg/mL) nitrate nitrogen, mix 20 µL sample with 1000 µL reagent.For 1 to 10 ppm nitrate nitrogen, use 45 µL sample and 1000 µL reagent.For less than 1 ppm nitrate nitrogen, use 500 µL sample and 500 µL reagent. (Note: 1,000 µL
= 1 mL).(If sample concentrations in a new batch are entirely unknown, their concentration range can
be quickly estimated by screening several representative samples. Mix equal parts sample and reagent. Do the same for several standards. Heat the samples briefly in an oven or under hot water. Compare the colors to decide on an optimal concentration range.)
Pipet the samples into semimicro cuvettes, and then pipet reagent into all cuvettes. Cap the cuvettes with cover caps, and invert them gently to mix.
Hold samples at room temperature (20 to 25°C). Color development slows down after 4 to 5 hours and is maximum after 6 to 10 hours. Color measurements are taken at A540 against a reagent blank (water). Analyze standards together with the samples to provide a calibration for calculating sample concentrations. Measurements can be taken after 4 to 5 hours, but it may be convenient to prepare samples one day and read absorbance the following day. Color may

Section XI: Details of Analytical Analyses Related to Meat Color 99
be developed in about 2 hours at 60°C, or samples may be mixed in small test tubes and heated at about 100°C for 10 to 15 minutes to fully develop color.
Meat sample preparation consists of hot water extraction as for nitrite determination. Con-sider sample dilution factors in calculating nitrate/nitrite concentrations.
This method is modified slightly and described on the NEMI website (NEMI, 2011).
ReferencesDoane, T. A., and W. R. Horwáth. 2003. Spectrophotometric determination of nitrate with a single reagent. Anal.
Lett. 36:2713–2722.NEMI (National Environmental Methods Index). 2011. National Environmental Methods Index. 2011. https://
www.nemi.gov/.

100 Color Guidelines Handbook
O. TBARS for Oxidative Rancidity—Rapid, Wet Method
Principle
In the presence of thiobarbituric acid (TBA), malonaldehyde and other aldehyde products of lipid oxidation (TBA reactive substances; TBARS) form pink chromogens with maximum ab-sorbance at 532 to 535 nm. However, in the presence of interfering sugars, a yellow chromagen forms, which can be avoided using Tarladgis’ (1960) distillation method.
Reagents
1. TBA stock solution: 0.375% thiobarbituric acid, 15% trichloroacetic acid, and 0.25 N HCl.
2. Stock solutions (100 mL) are sufficient for 20 individual tests. Stock solution may be stored at room temperature in the dark (foil-wrapped container).
Procedure
1. Finely chop or mince a portion of the product of interest. Weigh out duplicate 0.5-g samples.
2. Add 2.5 mL TBA stock solution to each sample, giving a dilution factor of 6. Mix well. 3. Heat samples 10 minutes in boiling water in loosely capped tubes (round bottom Pyrex
or polypropylene centrifuge tubes). Caution: Tightly capped tubes may burst during heating. Positive samples turn pink during heating.
4. Cool tubes in tap water. 5. Centrifuge at 5,000 × g for 10 minutes at 4°C to obtain a clear supernatant. 6. Carefully pipette a portion of the supernatant to a spectrophotometer cuvette. Take care
that the solution remains clear. 7. Measure supernatant absorbance at 532 nm against a blank that contains all the
reagents, but not the meat. 8. Calculate the TBA value expressed as ppm malonaldehyde, using 1.56 × 10⁵/M/cm as the
extinction coefficient of the pink TBA chromagen (Sinnhuber and Yu, 1958), as follows:TBARS number (mg MDA/kg) = sample A532 × (1 M TBA chromagen/156,000) × [(1 mol/
L/M] × (0.003 L/0.5 g meat) × (72.07 g MDA/mol MDA) × 1000 mg/g) × 1000 g/kg), orTBARS value (ppm) = sample A532 × 2.77.
ReferencesBuege, J. A., and S. D. Aust. 1978. Microsomal lipid peroxidation. Methods Enzymol. 52:302–304.Sinnhuber, R. O., and T. C. Yu. 1958. 2-Thiobarbituric acid method for the measurement of rancidity in fishery
products. II. The quantitative determination of malonaldehyde. Food Technol. 12:9–12.

Section XI: Details of Analytical Analyses Related to Meat Color 101
P. TBARS for Oxidative Rancidity—Distillation Method
Principle
In this method, the sample is heated in water. Volatile malonaldehyde and other TBA reactive substances (TBARS) are collected by steam distillation. TBA solution is added to an aliquot of the distillate to form the pink TBA chromogen, which is quantified by spectrophotometry (Tar-ladgis et al., 1960; Koniecko, 1979).
Solutions
1. TBA reagent: Dissolve 1.44 g of 2-thiobarbituric acid (formula wt 144.1) in 450 mL glacial acetic acid. Bring to volume in 50-mL volumetric flask. Mix and store in the dark (in foil-wrapped container).
2. Sulfanilamide reagent: Dissolve 1 g sulfanilamide in a solution containing 40 mL concentrated HCl and 160 mL distilled water.
3. Tetra-ethoxy propane (TEP) standard solution in distilled water at a concentration of 2 × 10⁻⁸ M of 1,1,3,3-TEP. The solution may be kept refrigerated for 1 week.
Procedure
1. Blend 10 g minced or finely chopped meat sample with 50 mL distilled water, in a Waring blender. Transfer quantitatively to a round-bottomed heating flask (Kjeldahl flask), using 47.5 mL additional water. Add 2.5 mL of 6 N HCl solution (1, 2 concentrated HCl with water).
2. Add several glass beads to prevent bumping. If foaming is a problem during heating, add an antifoam agent (Dow anti-foam H-10 or equivalent).
3. Heat the flask sufficiently to generate steam. Using a water-cooled distillation apparatus, collect 50 mL distillate into a graduated cylinder. Time required is about 10 minutes per sample.
4. Mix distillate well and pipette 5 mL into a 50-mL glass stoppered flask. Add 5 mL of TBA reagent.
5. Mix and immerse in a boiling water bath for exactly 35 minutes, along with a blank consisting of 5 mL distilled water and 5 mL TBA reagent.
6. Cool flasks for 10 minutes in tap water. Read absorbance at 538 nm in a spectrophotometer set to zero absorbance for the TBA-water blank.
7. Multiply A538 by a factor of 7.8 to obtain mg malonaldehyde equivalents per 1000 g meat (ppm MDA). The factor of 7.8 was derived from use of a 10-g sample and 68% recovery of standard from meat (Tarladgis et al., 1960).
Standard Curve
8. For validation of the TBA calculations, also determine sample TBA value (ppm MDA) from a MDA standard curve.
9. To prepare the MDA standard curve, pipette 1, 2, 3, 4, and 5 mL of the 2 × 10⁻⁸ mol/mL TEP working solution into 50-mL Erlenmeyer flasks. Add sufficient distilled water to

102 Color Guidelines Handbook
bring the total volume to 5 mL. Mix well. No water is needed for the flask containing 5 mL MDA solution. The TEP concentration is 0.4, 0.8, 1.2, 1.6, and 2.0 × 10⁻⁸ mol/5 mL, respectively. TEP is converted to MDA during heating (1:1 basis).
10. Alternatively, to prepare a MDA standard curve with a wider range, add 1, 2, 4, 5, 10, 20, 30, and 40 mL of working stock solution to 50-mL volumetric flasks. Bring to 50 mL volume, mix, and transfer to 50-mL screw-top culture tubes for ease of handling. Transfer a 5-mL portion of each tube to another flask or test tube for the TBA colorimetric reaction, described below. The TEP concentration is 0.2, 0.4, 0.8, 1.0, 2, 4, 6, and 8 × 10⁻⁸ mol/5 mL, respectively. This wide-range standard curve is useful for old or rancid samples that may have higher TBA values. See reference by Seyfert et al. (2006).
11. Add 5 mL TBA reagent to each of the 5 mL standard curve solutions, including a blank (5 mL water). Heat all flasks in a hot water bath at 70 to 80°C for 35 minutes. No distillation is needed. Cool flasks in tap water, and determine A538 as described previously for meat samples.
12. Plot A538 values on the y-axis versus corresponding x-axis values for TEP × 10−8 mol/5 mL. 13. Obtain the linear regression equation for the line of best fit of the standard curve, where
the x-axis of the standard curve is TEP concentration (× 10−8 mol/5 mL), and the y-axis is absorbance at 538 nm. Use the sample A538 as the y-value in the regression equation, and solve for x, which is the sample MDA concentration.
ReferencesKoniecko, E. S. 1979. Handbook for Meat Chemists. Pages 53, 54, and 62. Avery Publ. Group Inc., Wayne, NJ.Seyfert, M., M. C. Hunt, J. P. Grobbel, S. M. Ryan, D. E. Johnson, and R. A. Monderen. 2006. Potassium lactate and
fresh-pork-sausage formulation effects on shelf life in lighted and unlighted display. J. Food Sci. 71:C390–C394.
Tarladgis, B. G., B. M. Watts, and M. T. Younathan. 1960. A distillation method for the quantitative determination of malonaldehyde in rancid foods. J. Am. Oil Chem. Soc. 37:44–48.

103
A. BeefBeef Color Guide Rpt. AS-515, Iowa Cooperative Extension Service, Meat Laboratory, Iowa State University, Ames, IA 50011 (Originally Rpt. 336 from New Mexico State University).
Japanese Beef Lean and Fat Color StandardsThe Japan Ham & Sausage Cooperative Association, 1-5-6 Ebisu, Shibuya-ku, Tokyo 150-0013, Japan. E-mail, [email protected]
Beef Steak Color Guide—Degrees of Doneness 1995. The Of�icial Guide published by the American Meat Science Association in cooperation with the National Livestock and Meat Board and the U.S. Department of Agriculture/ARS. Available from, American Meat Science Association, 1800 South Oak St., Suite 100, Champaign, IL 61820.
Ground Beef Patty Cooked Color Guide Dept. of Animal Sciences and Industry, Kansas State University, Manhattan, KS. Available from E. Boyle, Dept. of Animal Sciences and Industry, Weber Hall, Kansas State University, Manhattan, KS 66505.
SECTION XII
Pictorial Color Guides

104 Color Guidelines Handbook
B. PorkProcedures to Evaluate Market Hogs (3rd edition, 1991). National Pork Producers Council, Box 10383, Des Moines, IA 50306.
Japanese Pork and Fat Color Standards The Japan Ham & Sausage Cooperative Association, 1-5-6 Ebisu, Shibuya-ku, Tokyo 150-0013, Japan. E-mail, [email protected]
Pork Chop Cooked Color Guide K-State Research and Extension in cooperation with the National Pork Producers Council and National Pork Board, P.O. Box 10383, Des Moines, IA 50306. Available from E. Boyle, Dept. of Animal Sciences and Industry, Weber Hall, Kansas State University, Manhattan, KS 66505.
Ground Pork Cooked Color Guide K-State Research and Extension in cooperation with the National Pork Producers Council and National Pork Board, P.O. Box 10383, Des Moines, IA 50306. Available from E. Boyle, Dept. of Animal Sciences and Industry, Weber Hall, Kansas State University, Manhattan, KS 66505.
C. LambLamb Color National Live Stock and Meat Board, Available from Dept. of Animal Sciences and Industry, Weber Hall, Kansas State University, Manhattan, KS 66506. Available from E. Boyle, Dept. of Animal Sciences and Industry, Weber Hall, Kansas State University, Manhattan, KS 66505.
D. Processed MeatsCured Meat Color GuideKansas Agricultural Experiment Station. Available from E. Boyle, Dept. of Animal Sciences and Industry, Weber Hall Kansas State University, Manhattan, KS 66505.

Section XII: Pictorial Color Guides 105
E. Guides and Figures Related to Meat Color
Thermometer Calibration Guide2000. Flores, N. C., and E. A. E. Boyle. Kansas Agricultural Experimentation Station and Cooperative Extension Service. Available from E. Boyle, Dept. of Animal Sciences and Industry, Weber Hall, Kansas State University, Manhattan, KS 66505.
Meat Lighting Facts2008. Raines, C. R., M. C. Hunt, M. Seyfert, and D. H. Kropf. Kansas State University and Pennsylvania State University. Available from C.R. Raines, Dept of Animal Science, Pennsylvania State University, [email protected]
Digital Micrometer and Meat in a Kropf Cube (2.54 cm3 Plexiglas cube covered with oxygen-permeable or impermeable �ilm) for measuring dynamics changes of myoglobin forms.
Gas Measurement in Modifi ed Atmosphere Packages using a gas detector (usually O2, CO2 or CO), with a small needle and some “sticky” patches to help close the hole in the �ilm. Sticky patches are available from most gas instrument and scienti�ic companies.
Kennedy Gauge properly placed close to the seal bar for accurately measuring vacuum level in meat packages. Available from Kennedy Enterprises, Inc., 4910 Rent-Worth Drive Lincoln, NE 68516. Phone, 800-228-0072.


107
SECTION XIII
Photography of Meat
A. IntroductionDocumenting color in photographs is an important component of meat color research. Red, the primary color of meat, is difficult to reproduce accurately in photographs. Therefore, capturing realistic images of red meats and their varying degrees of discoloration is chal-lenging. Special equipment is needed for packaging, lighting, cameras, image processing, and transfer of images to print. Printing high quality color photographs of meat is best done by professional photo printing companies and will not be addressed in these guidelines. How-ever, to create images fit to print, color standard patches should be used.
B. PackagingAlthough the best color reproductions are obtained with unpackaged meat, with care, meat packaged in glossy films can be photographed. For meat packaged in modified atmosphere packages, the effects of headspace and moisture under the top film must be considered. The use of anti-fog films for meat photography is recommended. Consider slightly tilting the package before the photo shoot to collect any condensate. If packaged meat is to be photo-graphed, white or black trays are recommended.
C. Lighting and Background ConditionsPhotography of meat is best done in rooms completely shielded from daylight. Proper light-ing is essential to successful food photography. Light sources can either be camera flashes, permanent lighting, or both, and may be of tungsten, incandescent, high-intensity discharge (for example, metal halide), halogen, and light-emitting diode (LED). Most fluorescent light-ing should be avoided because of unfavorable light spectra and varying light intensity over time. The position of the light should be 45° to the meat from two opposite sides to minimize reflection on the surface.
Semi-translucent light diffusing fabric between the light source and the meat can be useful to evenly distribute light and reduce shading or shadowing. Small, simple tents are available for this purpose.
For flash photography, a professional lighting system for even lighting is recommended. Although not always ideal, it is possible to adequately photograph meat with flashes directly attached to the camera. In this scenario, experiment with various flash positions to minimize gloss or glare on the fresh meat surface or packaging material.

108 Color Guidelines Handbook
When selecting the background for the meat or package, use a material with a different color than the subject. This will ease the photo editing process if the subject of the photo must be isolated. A 20%-black background (light gray) is often a good solution for meat (isolated or packaged). White background can cause blurring of the object and blend with some packaging materials.
D. Camera and Lens SelectionThe digital camera should have a resolution of at least 10 megapixels and should have a direct image output for data transfer. On the camera, selecting the white balance or the light source must be possible. Moreover, the camera should have optional software for presenting images on a computer monitor for checking details of images before and after they are captured. If a direct connection is not possible, a camera with a large memory card/stick capable of holding large, high-resolution files is recommended.
Cameras must be able to capture images as raw file formats, which can then be used for fur-ther image processing. Images can be in the formats RAW, JPEG, or TIFF. RAW files can capture up to 12 bits per color (red, blue, green, for 36 bits per location), whereas JPEG files can capture exactly 8 bits per color.
Given access to a height-adjustable tripod, lenses should be 50/55 mm. Lenses with a macro function can be useful for small objects, but are not always necessary. Zoom lenses can be used but may have insufficient image sharpness. In addition to auto-focus, manual focus may be needed to capture sharp images of selected areas. Attaching polarized or UV filters to lenses for reducing gloss is an option, but these filters tend to change the surface structure of the objects.
E. Other ConsiderationsA tripod to support the camera and adjust the distance to the objects is important for securing high quality, clear images. A remote control for the camera is valuable to avoid vibrations and unclear images.
Meat should be photographed together with color and graytone patches, preferably the first image of a series. One example of such standardized patches is the X-Rite ColorChecker Pass-port from Adobe and its corresponding software. Color patch systems must be compatible with color adjustment software, like Adobe Digital Negative Specification (DNG), and image process-ing software. Be aware that the lightness of the image must be right at the time of exposure, since later adjustment of lightness with image processing is difficult.
Many photo processing, rasterizing, and editing software packages are available. Usually, it is best to use whatever software is best suited to the camera. Recommended software for cameras can be found at the time the camera is purchased. With so much variation within camera brands as among camera types, the same is true for software. Adobe Photoshop, Elements, Lightroom, and Picasa are popular photo management programs.
109
SECTION XIV
Glossary
Absolute Black: A color of the lowest value possessing neither hue nor chroma, closely approximated by looking through a small aperture into a velvet-lined box.
Absolute White: A color of the highest value possessing neither hue nor chroma, closely approximated by viewing a piece of freshly cleaned magnesia.
Achromatic Colors: See Neutral ColorsBlooming: A term used to describe the meat exposed to oxygen to form oxymyoglobin,
also known as oxygenation of myoglobin. Blooming time is important to specify and is influenced by meat temperature (colder blooms faster).
Carboxymyoglobin: The redox form of myoglobin with carbon monoxide ligated to the sixth position of the heme iron, which is in the ferrous state (Fe2+). Color is cherry red. Carboxymyoglobin is often denoted as COMb.
Chroma: The strength or weakness of a chromatic color, expressed as weak, moderate, or strong; also known as “saturation index.” Calculated as (a*2 + b*2)1/2.
Chromatic Colors: All colors possessing both hue and chroma.CIE Coordinate System: A three-dimensional color description system developed by the
Commission Internationale de l’Eclairage.CIE Tristimulus Values: The standard color coordinates of the color measuring system
developed by the Commission Internationale de l’Eclairage.Color: A phenomenon of light and visual perception that enables differentiation of otherwise
identical objects.Color Assessment: The process, following color examination, of deciding if the difference
between the sample and standard, based on either instrumental readings or thoughts, expresses the difference in terms that have a common meaning to all people involved, and then evaluating the expressed difference to decide on the acceptability of the samples.
Color Attributes: See Color DimensionsColor Balance: An aesthetic term referring to the feeling of balance, continuity, and fitness
found in beautiful color schemes; the physical balance of a color scheme in gray, detected solely by the eye, using disk colorimetry.
Color Blindness: The inability to distinguish colors properly, associated with an abnormal perception of hue and chroma because of congenital defects or injury to the eye.

110 Color Guidelines Handbook
Color Coordinates: See Color DimensionsColor Description: The delineation of color by using hue, chroma, and value.Color Dimensions: The attributes of hue, value, and chroma used to describe color.Color Dominance: The predominance of one hue in a color scheme.Color Examination: Use of a source of light to illuminate a sample to be evaluated against a
standard and some means of detecting the light coming from the material being examined.Colorimeter: An instrument in which a sample is viewed in three kinds of light, selected so the
readings come in the form of three numbers, which, with suitable standards, are either directly equal to the three CIE tristimulus values, or are converted to them by simple calculations.
Color Intensity: See ChromaColor Notation: An exact description of color using symbols and numerals. For example, a
typical maroon is notated as SR 314.Color Rendering Index (CRI): A quantitative measure of the ability of a light source to
reproduce the colors of various objects faithfully compared with an ideal or natural light source. Lighting with a higher CRI should aid visual color panelists to score objects closer to the actual color under a reference illuminant. Technically, CRIs can only be compared for sources that have the same Color Temperatures. However, as a general rule, the higher the CRIs are the better; light sources with high (85 to 100) CRIs tend to make meat look better than light sources with lower CRIs. However the CRI is not a particularly good indicator for visual assessments when using lights at <5000 K. For example, incandescence light (2700 to 3000 K has a CRI near 100) makes red meat look good but has too few blue wavelengths, which makes other colors less correct. Conversely, lighting at >5500 K will have too few red wavelengths to make meat look naturally red.
Color Saturation: See ChromaColor Scale: A series of colors exhibiting a regular gradation in one dimension, while the other
two dimensions remain constant.Color Standard: An object bearing a specific color against which samples are compared. Such
standards may be color photographs or the three-dimensional lower third of the value scale.Color Temperature: A trait indicating the warmth or coolness of the lighting measured in de-
grees Kelvin (K) and indicating the light source’s temperature of an ideal black-body radiator that radiates light of comparable hue to that of the light source. Lighting is often character-ized by its color temperature. In photographic terms, white balance adjustments to cameras change the color temperature being used by the camera.
Commission Internationale de l’Eclairage (CIE): An international commission devoted to worldwide cooperation and the exchange of information on all matters relating to the science and art of light and lighting, color and vision, photobiology and image technology. See http://www.cie.co.at/.
Dark Color: A color of low value and is found in or adjacent to the lower third of the value scale.
Delta Color Change: Also known as the total color change or Δ over some specific time period. Generally calculated as Δ* = [(ΔL*)2 + (Δa*)2 + (Δb*)2]1/2. Useful parameter to show total color differences over time. Theoretically, ΔEs of less than 1.0 are not detectable unless the sam-ples are side by side. This parameter is also useful for establishing tolerances for variation in color between samples.

Section XIV: Glossary 111
Deoxymyoglobin: Redox form of myoglobin that has reduced heme iron (Fe2+). This form has no ligand at the sixth position of the heme iron. Color is purple-red. Essentially no oxygen can be present. In the older literature, this form was called “myoglobin” or “reduced myoglobin,” neither of which is accurate because oxymyoglobin is also reduced myoglobin. Deoxymyoglobin is often denoted as DMb.
Diffuse Reflectance: Light reflected at various angles from the incident light; primarily responsible for the object’s color.
Disk Colorimetry: A system for matching specific colors using rapidly spinning disks comprising different colors.
Farnsworth-Munsell 100-Hue Test: A subjective test used to screen display study panelists based on the ability to discriminate small differences in hue and to detect color blindness. De-tails available at http://www.munsell.eu/html/colour_vision_tests.html. An electronic version of the test is available online at http://www.xrite.com/custom_page.aspx?PageID=77&Lang=en.
Foot-candles: English system unit of illumination; 1 foot-candle is 10.76 lux.Gray: A neutral color that possesses neither hue nor chroma.Hedonic Scales: A type of scale used in sensory analysis with consumer panels where subjects
evaluate products using scales of preference, likeness, willingness to purchase, etc. These scales are not appropriate for use with trained visual panels.
Hue: The distinctive characteristic of any chromatic color distinguishing it from other hues found between the ends of the spectrum; for example, red, yellow, green, blue, or purple.
Hue Angle: The angle, θ, created by the slope of line b/a in a Hunter color space. H = tan−1 b/a. See Little (1975) and Section IX (Instrumental Color Measurement) for precautions in calcu-lating hue angle.
Hue Circle: A color circle that exhibits a progressively graded series of hues.Illuminant: A source of light used to illuminate samples or standards. Tristimulus values are
calculated from spectral data for specific color temperatures of illuminants, such as Illumi-nant A, C, or D65.
Instrumental Metamerism: A phenomenon that occurs when similar instruments give dif-ferent readings for exactly the same color because of differences in their spectral response curves.
Isobestic Wavelength: A wavelength where the absorbances or reflectances are equal for two or more of the myoglobin forms (see Figure 9.1, Section IX). By selecting the appropriate isobestic wavelengths (Section IX), the quantitative amount of a myoglobin form can be determined by absorbance or reflectance data, which may need to be converted to / values.
Kennedy Gauge: A vacuum gauge set in the center of a steel protective ring (about 9 cm diameter by 2 cm high) to keep the packaging film from entering the air port when vacuum is drawn. Very useful for checking or documenting actual vacuum level being drawn by the vacuum packager and the pressure within sealed packages. Supplied by Kennedy Enterprises, Inc.; 4910 Rent-Worth Drive, Lincoln, NE 68518; phone, 800-228-0072.
K/S Values: is the absorption coefficient and is the scattering coefficient. / values are useful for quantifying the proportion of the three chemical states of myoglobin present and are calculated from the reflectance (R, expressed as a decimal, not as a percentage) at selected wavelengths using the following equation, / =(1 − R)2 ÷ (2R). A reflectance of 40% would have a / value of 0.45.

112 Color Guidelines Handbook
Light: The luminous energy that gives rise to color through stimulation of the retina, which pro-duces nerve currents in the optic nerve and brain.
Light Color: A color of high value found in or adjacent to the upper third of the value scale.Light Primaries: Three spectrally pure beams of light, which, when blended, allow a large
number of colors to be seen.Lux: Metric system unit of illumination equal to 1 lumen/square meter; 10.76 lux/foot-candle.Lumen: Unit of measure for the flow of light through a unit solid angle from a point source of
one international candle.Medium Color: A color of medium value located in or adjacent to the middle of the value scale.Metameric Objects: Objects that have the same color coordinates and match under a given illu-
minant but have different spectral reflectance curves and do not match under other illuminants.Metamerism: The phenomenon of two colors matching under a given illuminant but not
matching under other illuminants, due to differences in their spectral reflectance curve or matching for one observer but not another, due to differences in their spectral response curves.
Metmyoglobin: The redox form of myoglobin has oxidized (Fe3+) heme iron, which is ligated to water. Color is tan, brown, or tannish-gray and forms readily with very low partial pressures of oxygen. Metmyoglobin is often denoted as MMb.
Metmyoglobin Reducing Ability (MRA): An inherent property of meat where a series of reactions help reduce metmyoglobin. This property seems to be a major factor related to color stability (higher MRA is more stable).
Mil: A unit of length commonly used for measuring the thickness of packaging films. Also know as a “thou.” One mil equals 0.001 inch or 0.0254 mm; 1 mm = 0.03937 mil or 39.37 thou. Practical measurements often made with a digital caliper with appropriate units and accuracy.
Monochromatic Light: Light of only one color.Myoglobin: A water soluble, sarcoplasmic protein of muscle; the basic pigment in muscle.Neutral Colors: Colors characterized by a complete absence of hue and chroma, such as pure
black, pure white, and pure grays.Observer: A human or instrument used to detect color differences.Optical Properties: Properties involved in the relationship between light and vision, such as
visual properties.Oxygen Consumption (OC): An inherent property of meat where a series of reactions, prin-
cipally involving the Krebs cycle enzymes that consume (scavenge) oxygen in meat. OC is responsible for the deoxygenation of OMb and the further decrease of oxygen level to zero, allowing the reduction of MMb to DMb. This term is very similar to oxygen consumption rate (OCR) where similar measurements are made, but a rate of oxygen consumption per unit time is calculated.
Oxygen Consumption Rate (OCR): See oxygen consumption.Oxymyoglobin: The redox form of myoglobin that is oxygenated (bloomed) and has oxygen
ligated to the sixth position of the heme iron which is Fe2+. Color is bright red. Oxymyoglobin is often denoted as OMb.
Partial Pressure: In a mixture of ideal gases, each gas has a partial pressure, which is the pressure that the gas would have if it alone occupied the volume. The total pressure of a gas mixture is the sum of the partial pressures of each individual gas in the mixture.

Section XIV: Glossary 113
Partial Pressure of Gases in Meat Packages: Modified atmosphere packaging often involves a mixture of gases. Each gas’s partial pressure plays a functional role in that package. The table below has some useful data about meat packaging where gases are often referred to as a per-centage.
Pigment: Colored matter in an object.Pigment Concentration: The quantity of pigment in muscle, usually in milligrams/gram of wet
tissue.Premature Browning: A condition in which the inner parts of cooked meat turn brown or gray
at lower temperatures than expected (55 to 60°C).Persistent Pink or Redness: A condition in which the interior of cooked, uncured meat
retains a red hue at temperatures higher than normally expected for denaturing (loss of red) the raw meat pigments (75 to 80°C). Frequently occurs with high pH raw meat. The pinkness sometimes fades in intensity but usually will persist and even intensify in color due to additional oxygenation of the undenatured myoglobin. In some cases, this persistent redness is associated with the formation of a reduced denatured globin hemochrome or NO-hemochrome (cured meat pigment).
Typical concentrations, partial pressures, and other gas traits in atmospheric, vacuum, and modified atmosphere packages of meat.
Gas
Trait Nitrogen Oxygen Argon Carbon dioxide Water vapor
Gases in air at STP1 (standard 78.084 20.946 0.934 0.033 1 - 4 % temperature and pressure), %
Partial pressure of gases in air 593.4 159.2 7.1 0.2 ---- under STP, mm Hg
Gases in residual air immediately 78.1 20.9 0.9 0.03 ---- after vacuum packaging, regardless of level of vacuum. Post vacuum changes2.
Oxygen (%, ppm, pressure) values
Oxygen concentration3 0 5 10 15 Air, 20.9 in meat’s atmosphere, %
Oxygen concentration, ppm 0 50,000 100,000 150,000 209,000
Approximate partial pressure 0 38.0 76.1 114.1 159.2 of oxygen, mm Hg
1STP- % oxygen decreases about 10% with every km (3,280 ft) above sea level.2Post vacuum packaging; these % of gases will go up or down depending on the oxygen consumption of the meat.3MMb forms by oxidation between 1 to 3% oxygen (1,000 and 3,000 ppm).

114 Color Guidelines Handbook
Primary Colors: Three colors from which all other colors can be derived, such as red, yellow, and blue.
Principal Hues: Five hues that are visually equivalent to each other, such as red, yellow, green, blue, and purple.
Psychometric Scales: Visual scales for measuring color developed through the mental acuity of trained descriptive panels.
Reflection Factor: The percentage of incident light reflected from a sample.Saturation Index: Length of a radial vector from point of origin to the sample point in a Hunter
color space; also known as Chroma. For meat, the higher the value, the greater the saturation of red. SI = (a*2 + b*2)1/2; see Little (1975).
Shade: The color evoked by the mixture of a chromatic pigment with a black pigment or the appearance of that portion of a surface located in a shadow.
Special Characteristics: Characteristics of an object related to its light reflectance properties within the visual spectrum.
Spectral Energy Distribution Curve: The curve created by plotting the energy emitted from a given light source against wavelength.
Spectrally Pure Color: The sensation evoked by spectrally pure light.Spectral Reflectance Curve: The curve created by plotting the light reflected by an object
against wavelength.Spectral Response Curve: The curve created by plotting the response given by an observer
against wavelength.Spectrophotometer: An instrument used to determine light reflectance or transmission at
different wavelengths across the spectrum.Specular Reflectance: Light reflected at an angle (about 90° from the incident light) that gives
a mirror-like appearance, mainly responsible for the gloss of an object.Standard Observer: The Standard Observer is related to color matching functions that
quantify the sensitivity of red, green, and blue light in the cones of the human eye. The CIE 1931 2° Standard Observer was experimentally developed by color matching when the observer looked through an aperture having 2° field of view. At the time the 1931 2° Standard Observer experiments were conducted, it was thought that cones were concentrated in the foveal region in the eye. Later, it was determined that the cones were spread beyond the fovea. The experiments were re-done in 1964 with a 10° field of view, resulting in the 1964 10° Standard Observer. The 10° Standard Observer is recommended for better correlation with average visual assessments made with large field of view typical of most commercial applications.
TBA: 2-Thiobarbituric acid, a compound use in testing for lipid oxidation.TBARS: Thiobarbituric acid reactive substances, a commonly used name for a lipid oxidation
test where malonaldehyde and other reactive substances are quantified. See Section X and XI O and P).
Thou: A measurement of thickness, 0.001 inch. See mil.Tint: The color evoked when a chromatic pigment is mixed with a white pigment or when a
small amount of chromatic pigment overlies a white background.Value: The lightness or darkness of any color, such as dark, medium, or light.

Section XIV: Glossary 115
Value Scale: A series of visually equivalent neutral colors lying between absolute black and absolute white.
Visible Spectrum: The result of a passing beam of light through a glass prism. By this means, the beam of light is broken into an invariable sequence of increasing wavelengths, evident to the eye as a sequence of colors of subtly varying hues of strong chroma.
Visual Assessment: Assessment of color using the visual acuity of sensory panels.White Balance: A common adjustment for cameras to help record an object’s true appearance
by setting the camera’s sensitivity to the color temperature of the object’s environment. White balance settings are usually described as shade, bright sunlight, cloudy, flash, incan-descent, fluorescent, etc. and are adjustments of the camera’s color temperature in degrees Kelvin.
Worst-Point Color Score: A color score derived from the area most severely discolored on a meat surface (single or cumulative area at least 2 cm in diameter).


117
SECTION XV
Cited References
Alderton, A. L., C. Faustman, D. C. Liebler, and D. W. Hill. 2003. Induction of redox instability of bovine myoglo-bin by adduction with 4-hydroxy-2-nonenal. Biochemistry 42:4398–4405.
AMSA. 1978. Guidelines for Cookery and Sensory Evaluation of Meat. Am. Meat Sci. Assoc. Natl. Live Stock and Meat Board, Chicago, IL.
AMSA. 1991. Guidelines for Meat Color Evaluation. Reciprocal Meat Conference Proceedings. 44:1–17.Anon. 1988. Munsell Color. Product information brochure of Macbeth division of Kollmorgen, Baltimore, MD.Antonini, E., and M. Brunori. 1971. Hemoglobin and Myoglobin in Their Reactions with Ligands. North-Hol-
land, Amsterdam, the Netherlands.AOAC. 1990. Nitrites in cured meats. Method 973.31. Page 938 in Official Methods of Analysis. 15th ed. K.
Helrich, ed. AOAC, Arlington, VA.Ashmore, C. R., W. Parker, and L. Doerr. 1972. Respiration of mitochondria isolated from dark cutting beef:
Postmortem changes. J. Anim. Sci. 34:46–48.ASTM Committee E-18. 1968a. Basic Principles of Sensory Evaluation. STP 433. Am. Soc. Testing Materials,
Philadelphia, PA.ASTM Committee E-18. 1968b. Manual on Sensory Testing Methods. STP 434. Am. Soc. Testing Materials,
Philadelphia, PA.ASTM Committee E-18. 1978. Definition of Terms Relating to Sensory Evaluation of Materials and Products. E
253 Am. Soc. Testing Materials, Philadelphia, PA. ASTM Committee E-18. 1979. ASTM Manual on Consumer Sensory Evaluation. STP 682. Am. Soc. Testing Ma-
terials, Philadelphia, PA.ASTM Committee E-18. 1981. Guidelines for the Selection and Training of Sensory Panel Members. STP 758.
Am. Soc. Testing Materials, Philadelphia, PA.Atkinson, J. L., and M. J. Follett. 1973. Biochemical studies on the discoloration of fresh meat. J. Food Technol.
8:51–58.Baardseth, P., G. Skrede, T. Naes, M. S. Thomassen, A. Iversen, and L. Kaaber. 1988. A comparison of CIE
(1976) L*a*b* values obtained from two different instruments on several food commodities. J. Food Sci. 53:1737–1742.
Ballard, C. M. 2004. Thermal denaturation of carboxymyoglobin and the effect of carbon monoxide, pH, and injection enhancement on display and cooked color of beef. MS Thesis. Kansas State University.
Barbut, S. 2001. Effect of illumination source on the appearance of fresh meat cuts. Meat Sci. 59:187–191.Barbut, S. 2002. Meat color and flavor. Pages 429–434 in Poultry Products Processing. CRC Press, New York,
NY.Barton, P. A. 1967a. Measurement of colour stability of cooked cured meats to light and air. I. Development of
method. J. Sci. Food Agric. 18:298–304.

118 Color Guidelines Handbook
Barton, P. A. 1967b. Measurement of colour stability of cooked cured meats to light and air. II. Testing the proce-dure. J. Sci. Food Agric. 18:305–307.
Bekhit, A. E. D., and C. Faustman. 2005. Metmyoglobin reducing activity. Meat Sci. 71:407–439.Bendall, J. R. 1973. Postmortem changes in muscle. Pages 243–309 in Structure and Function of Muscle. Vol. 2. G.
H. Bourne, ed. Acad. Press, New York, NY.Bendall, J. R., and A. A. Taylor. 1972. Consumption of oxygen by the muscles of beef animals and related species.
II. Consumption of oxygen by post-rigor muscles. J. Sci. Food Agric. 23:707–719.Bernofsky, C., J. B. Fox, and B. S. Schweigert. 1959. Biochemistry of myoglobin. VII. The effect of cooking on myo-
globin in beef muscle. Adv. Food Res. 24:339.Bhattacharya, S. K., J. H. Thakar, P. L. Johnson, and D. R. Shanklin. 1991. Isolation of skeletal muscle mitochondria
from hamsters using an ionic medium containing EDTA and Nagarse. Anal. Biochem. 192:344–349.Bodwell, C. E., A. M. Pearson, and R. A. Fennell. 1965. Post-mortem changes in muscle III. Histochemical observa-
tions in beef and pork. J. Food Sci. 30:944–954.Bowen, W. J. 1949. The absorption spectra and extinction coefficients of myoglobin. J. Biol. Chem. 179:235–245.Buege, J. A., and S. D. Aust. 1978. Microsomal lipid peroxidation. Methods Enzymol. 52:302–304.Carpenter, C. E., and E. M. Clark. 1995. Evaluation of methods used in meat iron analysis and iron content of raw
and cooked meats. J. Agric. Food Chem. 43:1824–1827.Carter, P. 1971. Spectrophotometric determination of serum iron at the submicrogram level with a new reagent
(ferrozine). Anal. Biochem. 40:450–458.Cheah, K. S., and A. M. Cheah. 1971. Post-mortem changes in structure and function of ox muscle mitochondria. I.
Electron microscopic and polarographic investigations. J. Bioenerg. Biomembr. 85–92.CIE (Commission Internationale de l’Eclairage). 1976. Recommendations on uniform color spaces-color differ-
ence equations, Psychometric Color Terms. Supplement No. 2 to CIE Publication No. 15 (E-1.3.1.) 1978, 1971/(TC-1-3). Commission Internationale de l’Eclairage, Paris, France.
Cornforth, D., and K. Allen. 2009. Myoglobin oxidation reaction mechanism: Implications for fresh meat packag-ing. Reciprocal Meats Conference, Rogers, AR.
Cornforth, D. P. 2001. Spectrophotometric and reflectance measurements of pigments of cooked and cured meats. Unit F3.2 in Current Protocols in Food Analytical Chemistry. S. J. Schwartz, ed. John Wiley and Sons Inc., New York, NY.
Cornforth, D. P., and W. R. Egbert. 1985. Effect of rotenone and pH on the color of pre-rigor muscle. J. Food Sci. 50:34–35.
Cornforth, D. P., J. K. Rabovitser, S. Ahuja, J. C. Wagner, R. Hanson, B. Cummings, and Y. Chudnovsky. 1998. Carbon monoxide, nitric oxide, and nitrogen dioxide levels in gas ovens related to surface pinking of cooked beef and turkey. J. Agric. Food Chem. 46:255–261.
deDuve, C. 1948. A spectrophotometric method for the simultaneous determination of myoglobin and hemoglo-bin in extracts of human muscles. Acta Chem. Scand. 2:264.
DeVore, D. P., and M. Solberg. 1975. A study of the rate-limiting factors in the respiratory oxygen consumption of intact post-rigor bovine muscle. J. Food Sci. 40:651–652.
Doane, T. A., and W. R. Horwáth. 2003. Spectrophotometric determination of nitrate with a single reagent. Anal. Lett. 36:2713–2722.
Drabkin, D. L. 1950. The distribution of the chromoproteins, hemoglobin, myoglobin, and cytochrome c in the tissue of different species, and the relationship of the total content of each to body mass. J. Biol. Chem. 182:317–333.
Du, Z., and W. J. Bramlage. 1992. Modified thiobarbituric acid assay for measuring lipid oxidation in sugar-rich plat tissue extracts. J. Agric. Food Chem. 40:1566–1570.
Erdman, A. M., and B. M. Watts. 1957. Spectrophotometric determination of color change in cured meat. J. Agric. Food Chem. 5:453–455.
Faustman, C., and R. G. Cassens. 1990. The biochemical basis for discoloration in fresh meat: A review. J. Muscle Foods 1:217–243.
Section XV: Cited References 119
Faustman, C., and A. Phillips. 2001. Measurement of discoloration in fresh meat. Unit F3.3 in Current Protocols in Food Analytical Chemistry. S. J. Schwartz, ed. John Wiley and Sons Inc., New York, NY.
Ferreira, L. F., D. K. Townsend, B. J. Lutjemeier, and T. J. Barstow. 2005. Muscle capillary blood flow kinetics esti-mated from pulmonary O2 uptake and near-infrared spectroscopy. J. Appl. Physiol. 98:1820–1828.
Flores, H. A., D. H. Kropf, and D. G. Gray. 1985. Color evaluation of restructured, precooked beef roast. Unpublished data.
Francis, F. J., and F. M. Clydesdale. 1975. Food Colorimetry: Theory and Applications. AVI Publ. Co. Inc., Westport, CT.
Frezza, C., S. Cipolat, and L. Scorrano. 2007. Organelle isolation: Functional mitochondria from mouse liver, mus-cle and cultured fibroblasts. Nat. Protoc. 2:287–295.
Georgala, D. L., and C. M. Davidson. 1970. Food Package. British patent I:199,998.Ghorpade, V. M., and D. P. Cornforth. 1993. Spectra of pigments responsible for pink color in pork roasts cooked
to 65 or 82°C. J. Food Sci. 58:51–52., 59.Giddings, G. G. 1974. Reduction of ferrimyoglobin in meat. CRC Crit. Rev. Food Technol. 2:143–173.Giddings, G. G. 1977. The basis of color in muscle foods. CRC Crit. Rev. Food Sci. Nutr. 9:81–114.Greene, B. E., and T. H. Cumuze. 1981. Relationship between TBA numbers and inexperienced panelists’ assess-
ment of oxidized flavor in cooked beef. J. Food Sci. 47:52–54, 58.Greene, B. E., I. Hsin, and M. W. Zipser. 1971. Retardation of oxidative color changes in raw ground beef. J. Food
Sci. 36:940–942.Grunwald, E. W., and M. P. Richards. 2006. Studies with myoglobin variants indicate that released hemin is the
primary promoter of lipid oxidation in washed fish muscle. J. Agric. Food Chem. 54:4452–4460.Hagler, L., R. I. Coppes Jr., and R. H. Herman. 1979. Metmyoglobin reductase. J. Biol. Chem. 254:6505–6514.Hague, M. A., K. E. Warren, M. C. Hunt, D. H. Kropf, C. L. Kastner, S. L. Stroda, and D. E. Johnson. 1994. Endpoint
temperature, internal cooked color, and expressible juice color relationships in ground beef patties. J. Food Sci. 59:465–470.
Harrison, A. R., D. H. Kropf, D. M. Allen, M. C. Hunt, and C. L. Kastner. 1980. Relationships of spectrophotometric reflectance measurements to beef muscle visual color. J. Food Sci. 45:1052–1053.
Heaton, K. M., D. P. Cornforth, I. V. Moiseev, W. R. Egbert, and C. E. Carpenter. 2000. Minimum sodium nitrite levels for pinking of various cooked meats as related to use of direct or indirect-dried soy isolates in poultry rolls. Meat Sci. 55:321–329.
Hood, D. E. 1980. Factors affecting the rate of metmyoglobin accumulation in pre-packaged beef. Meat Sci. 4:247–265.
Hornsey, H. C. 1956. Color of cooked cured pork. I. Estimation of the nitric oxide-haem pigments. J. Sci. Food Agric. 23:534–540.
Howe, J. L., E. A. Gullett, and W. R. Usborne. 1982. Development of pink color in cooked pork. Can. Inst. Food Sci. Technol. 15:19.
Hunt, M. C. 1980. Meat color measurements. Proceedings of the Reciprocal Meat Conference 33:41–46.Hunt, M. C., and H. B. Hedrick. 1977. Chemical, physical, and sensory characteristics of bovine muscle from four
quality groups. J. Food Sci. 42(3):716–720. Hunt, M. C., and D. H. Kropf. 1985. Color and appearance. In Advances Meat Research. Vol. 3. Restructured Meat
and Poultry Products. AVI Publishing Co. Inc., Westport, CT.Hunt, M. C., and D. H. Kropf. 1988. Unpublished data.Hunt, M. C., O. Sørheim, and E. Slinde. 1999. Color and heat denaturation of myoglobin forms in ground beef. J.
Food Sci. 64:847–851.HunterLab. 2011. http://www.hunterlab.com/ColorEducation/ColorTheory.IFT—Sensory Evaluation Division. 1995a. Policies for the preparation and review of papers reporting sensory
evaluation data. J. Food Sci. 60:210. Igene, J. O., K. Yamauchi, A. M. Pearson, J. I. Gray, and S. D. Aust. 1985. Mechanisms by which nitrite inhibits the
development of warmed-over flavour (WOF) in cured meat. Food Chem. 18:1–18.

120 Color Guidelines Handbook
Jayasingh, P. 2004. Prevention of pigment deterioration and lipid oxidation in ground beef and pork. PhD Disser-tation. Utah State University, Logan.
Jeremiah, L. E., Z. L. Carpenter, and G. C. Smith. 1972. Beef color related to consumer acceptance and palatability. J. Food Sci. 37:476–479.
Joseph, P., S. P. Suman, S. Li, C. M. Beach, and J. R. Claus. 2010a. Mass spectrometric characterization and thermo-stability of turkey myoglobin. LWT-Food Sci. Technol. 43:273–278.
Joseph, P., S. P. Suman, S. Li, C. M. Beach, L. Steinke, and M. Fontaine. 2010b. Characterization of bison (Bison bison) myoglobin. Meat Sci. 84:71–78.
Judd, D. W., and G. Wyszecki. 1963. Color in Business, Science and Industry. John Wiley and Sons, New York, NY.Karlsson, A., and K. Lundstrom. 1991. Meat pigment determination by a simple and non-toxic alkaline haematin
method (an alternative to the Hornsey and the cyanometmyoglobin methods). Meat Sci. 29:17–24.Killday, B. K., M. S. Tempesta, M. E. Bailey, and C. J. Metral. 1988. Structural characterization of nitrosylhemochro-
mogen of cooked cured meat: Implications in the meat curing reaction. J. Agric. Food Chem. 36:909–914.Killinger, K. M., M. C. Hunt, and R. E. Campbell. 2000. Factors affecting premature browning during cooking of
ground beef purchased at retail. J. Food Sci. 65:585–587.Kim, Y. H., M. C. Hunt, R. A. Mancini, M. Seyfert, T. M. Loughin, D. H. Kropf, and J. S. Smith. 2006. Mechanism for
lactate-color stabilization in injection-enhanced beef. J. Agric. Food Chem. 54:7856–7862.King, D. A., S. D. Shackelford, A. B. Rodriguez, and T. L. Wheeler. 2011. Effect of time of measurement on the re-
lationship between metmyoglobin reducing activity and oxygen consumption to instrumental measures of beef longissimus color stability. Meat Sci. 87:26–32.
Kinnear, P. R., and A. Sahraie. 2002. New Farnsworth-Munsell 100-Hue test norms of normal observers for each year of age 5–22 and for age decades 30–70. Br. J. Ophthalmol. 8:1408–1411.
Knock, R. C., M. Seyfert, M. C. Hunt, M. E. Dikeman, R. A. Mancini, J. A. Unruh, J. J. Higgins, and R. A. Monderen. 2006. Effects of potassium lactate, sodium chloride, sodium tripolyphosphate, and sodium acetate on colour, colour stability, and oxidative properties of injection-enhanced beef rib steaks. Meat Sci. 74:312–318.
Knock, R. C., M. Seyfert, M. C. Hunt, M. E. Dikeman, J. A. Unruh, J. J. Higgins, and R. A. Monderen. 2006. Effects of potassium lactate, sodium chloride, and sodium acetate on surface shininess/gloss and sensory properties of injection-enhanced beef strip-loin steaks. Meat Sci. 74:319–326.
Koniecko, E. S. 1979. Handbook for Meat Chemists. Pages 53, 54, and 62. Avery Publishing Group Inc., Wayne, NJ.Kropf, D. H. 2004. Packaging: Vacuum. Page 956 in Encyclopedia of Meat Sciences. W. K. Jensen, C. Devine, and M.
Dikeman, ed. Elsevier Acad. Press, Oxford.Kropf, D. H., D. G. Olson, and R. L. West. 1984. Objective measures of meat color. Proceedings of the Reciprocal
Meat Conference 37:24.Kropf, D. H., H. J. Tuma, C. C. Allen, M. C. Hunt, M. L. Sandberg, and D. E. Schafer. 1976. Evaluation of color and other
properties of frozen beef. In Objective Methods of Food Evaluation. Natl. Acad. Sci., Washington, DC.Krzywicki, K. 1979. Assessment of relative content of myoglobin, oxymyoglobin and metmyoglobin at the surface
of beef. Meat Sci. 3:1–10.Krzywicki, K. 1982. The determination of haem pigments in meat. Meat Sci. 7:29–36.Lamkey, J. W., R. W. Mandigo, and C. R. Calkins. 1986. Effect of salt and phosphate on the texture and color stability
of restructured beef steaks. J. Food Sci. 51:873–875.Lanari, M. C., and R. G. Cassens. 1991. Mitochondrial activity and beef muscle color stability. J. Food Sci. 56:1476–
1479.Landrock, A. H., and G. A. Wallace. 1955. Discoloration of fresh red meat and its relationship to film oxygen per-
meability. Food Technol. 9:194.Larsen, H., F. Westad, O. Sørheim, and L. H. Nilsen. 2006. Determination of critical oxygen level in packages for
cooked sliced ham to prevent color fading during illuminated retail display. J. Food Sci. 71:S407–S413.Lavelle, C., M. C. Hunt, and D. H. Kropf. 1995. Display life and internal cooked color of ground beef from vitamin
E-supplemented steers. J. Food Sci. 60:1–4, 6.

Section XV: Cited References 121
Lawrence, T. E., M. C. Hunt, E. Obuz, D. Kropf, and H. Wang. 2002a. Muscle iridescence: Potential causes—Possible solutions. Pages 25–30 in Proceedings of the 48th International Congress of Meat Science and Technology, August 2002. Rome, Italy.
Lawrence, T. M. C. H., and D. H. Kropf. 2002b. Surface roughening of pre-cooked, cured beef round muscles re-duces iridescence. J. Muscle Foods 13:69–73.
Ledward, D. A. 1970. Metmyoglobin formation in beef stored in carbon dioxide enriched and oxygen depleted atmospheres. J. Food Sci. 35:33–37.
Ledward, D. A. 1971. On the nature of cooked meat hemoprotein. J. Food Sci. 36:883–888.Little, A. 1976. Physical measurements as predictors of visual appearance. Food Technol. 30:74.Little, A. C. 1975. Off on a tangent. J. Food Sci. 40:410–411.Lyon, B. G., B. E. Greene, and C. E. Davis. 1986. Color, doneness and soluble protein characteristics of dry roasted
beef semitendinosus. J. Food Sci. 51:24–27.MacDougall, D. B. 1982. Changes in the color and opacity of meat. Food Chem. 9:75–88.Madhavi, D. L., and C. E. Carpenter. 1993. Aging and processing affect color, metmyoglobin reductase and oxygen
consumption of beef muscles. J. Food Sci. 58:939–942.Mancini, R. A., and M. C. Hunt. 2005. Current research in meat color. Meat Sci. 71:100–121.Mancini, R. A., M. C. Hunt, and D. H. Kropf. 2003. Reflectance at 610 nanometers estimates oxymyoglobin content
on the surface of ground beef. Meat Sci. 64:157–162.Mancini, R. A., M. Seyfert, and M. C. Hunt. 2008. Effects of data expression, sample location, and oxygen partial
pressure on initial nitric oxide metmyoglobin formation and metmyoglobin-reducing-activity measurement in beef muscle. Meat Sci. 79:244–251.
Mancini, R. A., S. P. Suman, M. K. R. Konda, and R. Ramanathan. 2009. Effect of carbon monoxide packaging and lactate enhancement on the color stability of beef steaks stored at 1°C for 9 days. Meat Sci. 81:71–76.
Mancini, R. A., S. P. Suman, M. K. R. Konda, R. Ramanathan, P. Joseph, and C. M. Beach. 2010. Mass spectrometric investigations on lactate adduction to equine myoglobin. Meat Sci. 85:363–367.
Marcuse, R., and L. Johansson. 1973. Studies on the TBA test for rancidity grading: II. TBA reactivity of different aldehyde classes. J. Am. Oil Chem. Soc. 50:387–391.
Marksberry, C. L. 1992. Effect on fat level, pH, carcass maturity, and compaction on cooked internal color of ground beef patties at five endpoint temperatures. MS Thesis. Kansas State University.
McKenna, D. R., P. D. Mies, B. E. Baird, K. D. Pfeiffer, J. W. Ellebracht, and J. W. Savell. 2005. Biochemical and physical factors affecting discoloration characteristics of 19 bovine muscles. Meat Sci. 70:665–682.
McLellan, M. R., L. R. Lind, and R. W. Kime. 1995. Hue angle determinations and statistical analysis for multiquad-rant Hunter L,a,b, data. J. Food Qual. 18:235–240.
Meilgaard, M. C., G. V. Civille, and B. T. Carr. 1991. Sensory Evaluation Techniques. CRC Press Inc., Boca Raton, FL.Miller, R. K. 1994. Sensory methods to evaluate muscle foods. In Muscle Foods. D. M. Kinsman and A. W. Kotula, ed.
Chapman and Hall Publ., New York, NY.Minolta, K. 2011. http://www2.konicaminolta.eu/eu/Measur ing/pcc/en/.Minolta. 1988. Precise Color Measurement. Minolta Corp., Ramsey, NJ. Miranda, K. M., M. G. Espey, and D. A. Wink. 2001. A rapid simple spectrophotometric method for simultaneous
detection of nitrate and nitrite. Nitric Oxide 5:62–71.Moeller, J. K. S., M. Jakobsen, C. J. Weber, T. Martinussen, L. H. Skibstead, and G. Bertelsen. 2003. Optimisation
of colour stability of cured ham during packaging and retail display by a multifactorial design. Meat Sci. 63:169–175.
Moeller, J. K. S., L. Nannerup, and L. H. Skibstead. 2004. Effect of carbon dioxide on autoxidation and photooxida-tion of nitrosylmyoglobin. Meat Sci. 69:71–78.
Moeller, S. J., T. J. Baas, T. E. Leeds, R. S. Emnett, and K. M. Irvin. 2003. Rendement Napole gene effects and a comparison of glycolytic potential and DNA genotyping for classification of Rendement Napole status in Hampshire-sired pigs. J. Anim. Sci. 81:402–410.

122 Color Guidelines Handbook
Mohan, A., M. C. Hunt, T. J. Barstow, T. A. Houser, and D. M. Hueber. 2010a. Near-infrared oximetry of three post-rigor skeletal muscles for following myoglobin redox forms. Food Chem. 123:456–464.
Mohan, A., M. C. Hunt, T. J. Barstow, T. A. Houser, and S. Muthukrishnan. 2010b. Effects of lactate, malate, and py-ruvate on myoglobin redox stability of three bovine muscles. Meat Sci. 86:304–310.
Mohan, A., M. C. Hunt, S. Muthukrishnan, T. A. Houser, and T. E. Barstow. 2010c. Myoglobin redox form stabiliza-tion by compartmentalized lactate and malate dehydrogenases. J. Agric. Food Chem. 58:7021–7029.
Mohan, A., S. Muthukrishnan, M. C. Hunt, T. J. Barstow, and T. A. Houser. 2010d. Kinetics of metmyoglobin reduc-tion by malate dehydrogenase. J. Agric. Food Chem. 58:6994–7000.
Moiseev, I. V., and D. P. Cornforth. 1999. Treatments for prevention of persistent pinking in dark-cutting beef pat-ties. J. Food Sci. 64:738–743.
Morita, H., J. Niu, R. Sakata, and Y. Nagata. 1996. Red pigment of Parma ham and bacterial influence on its forma-tion. J. Food Sci. 61:1021–1023.
Nam, K. C., and D. U. Ahn. 2002. Carbon monoxide-heme pigment is responsible for the pink color in irradiated raw turkey breast meat. Meat Sci. 60:25–33.
NEMI. 2011. National Environmental Methods Index. 2011. https://www.nemi.gov/.O’Keeffe, M., and D. E. Hood. 1982. Biochemical factors influencing metmyoglobin formation on beef from mus-
cles of differing colour stability. Meat Sci. 7:209–228.O’Sullivan, M. G., and J. P. Kerry. 2010. Meat packaging. Ch. 13, page 249, in Handbook of Meat Processing. F.
Toldra, ed. Wiley-Blackwell, London.Oellingrath, I. M., A. Iversen, and G. Skrede. 1990. Quantitative determination of myoglobin and haemoglobin in
beef by high-performance liquid chromatography. Meat Sci. 28:313–320.Pearson, A. M., and F. W. Tauber. 1984. Analytical methods. Pages 360–361 in Processed Meats. 2nd ed. A. M. Pear-
son and F. W. Tauber, ed. AVI Publ., Westport, CT.Raines, C. R., and M. C. Hunt. 2010. Effects of headspace volume and molecular availability of carbon monoxide
on carboxymyoglobin development of modified atmosphere packaged beef steaks. J. Food Sci. 75:C62–C65.Raines, C. R., M. C. Hunt, and J. A. Unruh. 2010. Contributions of muscles of various color stabilities to the overall
color stability of ground beef. J. Food Sci. 75:C85–C89.Ramanathan, R., R. A. Mancini, and M. K. Konda. 2009. Effects of lactate on beef heart mitochondrial oxygen con-
sumption and muscle darkening. J. Agric. Food Chem. 57:1550–1555.Ramanathan, R., R. A. Mancini, B. M. Naveena, and M. K. R. Konda. 2010. Effects of lactate-enhancement on surface
reflectance and absorbance properties of beef longissimus steaks. Meat Sci. 84:219–226.Renerre, M., and R. Labas. 1987. Biochemical factors influencing metmyoglobin formation in beef muscles. Meat
Sci. 19:151–165.Sammel, L. M., M. C. Hunt, D. H. Kropf, K. A. Hachmeister, C. L. Kastner, and D. E. Johnson. 2002a. Comparison of
assays for metmyoglobin reducing ability in beef inside and outside semimembranosus. J. Food Sci. 67:978–984.
Sammel, L. M., M. C. Hunt, D. H. Kropf, K. A. Hachmeister, C. L. Kastner, and D. E. Johnson. 2002b. Influence of chem-ical characteristics of beef inside and outside semimembranosus on color traits. J. Food Sci. 67:1323–1330.
Schricker, B. R., D. D. Miller, and J. R. Stouffer. 1982. Measurement and content of nonheme and total iron in muscle. J. Food Sci. 47:740–743.
Schwarz, S. J., J. R. Claus, H. Wang, N. B. Marriott, and P. P. Graham. 1998. Quantification of nicotinamide hemo-chrome in cooked, uncured turkey by reflectance spectrophotometry. J. Muscle Foods 9:101–110.
Sen, N. P., and B. Donaldson. 1978. Improved colorimetric method for determining nitrate and nitrite levels in foods. J. Assoc. Off. Anal. Chem. 61:1389–1394.
Sen, N. P., and Y. C. Lee. 1979. Determination of nitrate and nitrite in whey powder. J. Agric. Food Chem. 27:1277–1279.
Setser, C. S. 1984. Color: Reflections and transmissions. J. Food Qual. 6:183–197.Seyfert, M., M. C. Hunt, J. P. Grobbel, S. M. Ryan, D. E. Johnson, and R. A. Monderen. 2006. Potassium lactate and
fresh-pork-sausage formulation effects on shelf life in lighted and unlighted display. J. Food Sci. 71:C390–C394.

Section XV: Cited References 123
Shahidi, F., L. J. Rubin, L. L. Diosady, and D. F. Wood. 1985. Effect of sulfanilamide on the TBA values of cured meats. J. Food Sci. 50:274–275.
Shikama, K., and Y. Sugawara. 1978. Autoxidation of native oxymyoglobin. Kinetic analysis of the pH profiles. Eur. J. Biochem. 91:407–413.
Siegel, D. 2009. Vacuum packaging fresh meat with nitrite containing film. In Proceedings of the Reciprocal Meats Conference, Rogers, AR, June 22, 2009.
Siegel, D. G. 2007. Packaging for processed meats. Pages 31–34. Meat Processing Technology Series. W. N. Osburn, J. G. Sebranek, C. M. Schultz Kaster, ed. Am. Meat Sci. Assoc., Champaign, IL.
Sinnhuber, R. O., and T. C. Yu. 1958. 2-Thiobarbituric acid method for the measurement of rancidity in fishery products. II. The quantitative determination of malonaldehyde. Food Technol. 12:9–12.
Smulevich, G., E. Droghetti, C. Focardi, M. Coletta, C. H. Ciaccio, and N. Nocentini. 2007. A rapid spectroscopic method to detect the fraudulent treatment of tuna fish with carbon monoxide. Food Chem. 101:1071–1077.
Snyder, H. E. 1965. Analysis of pigments at the surface of fresh beef with reflectance spectrophotometry. J. Food Sci. 30:457–463.
Sørheim, O., Ø. Langsrud, D. P. Cornforth, T. C. Johannessen, E. Slinde, P. Berg, and T. Nesbakken. 2006. Carbon monoxide as a colorant in cooked or fermented sausages. J. Food Sci. 71:C549–C555.
Starrenberg, P. 1989. Influence of sample illumination and viewing on the colour measurement of translucent materials like meat. Proceedings of the 35th International Congress of Meat Science and Technology. 3:21.11
Strange, E. D., R. C. Benedict, R. E. Gugger, V. G. Metzger, and C. E. Swift. 1974. Simplified methodology for measur-ing meat color. J. Food Sci. 39:988–992.
Suman, S. P., C. Faustman, S. L. Stamer, and D. C. Liebler. 2006. Redox instability induced by 4-hydroxy-2-nonenal in porcine and bovine myoglobins at pH 5.6 and 4°C. J. Agric. Food Chem. 54:3402–3408.
Suman, S. P., P. Joseph, S. Li, C. M. Beach, L. Steinke, and M. Fontaine. 2010. Amino acid sequence of myoglobin from emu (Dromaius novaehollandiae) skeletal muscle. Meat Sci. 86:623–628.
Suman, S. P., R. A. Mancini, and C. Faustman. 2006. Lipid-oxidation-induced carboxymyoglobin oxidation. J. Agric. Food Chem. 54:9248–9253.
Suman, S. P., R. A. Mancini, R. Ramanathan, and M. R. Konda. 2009. Effect of lactate-enhancement, modified at-mosphere packaging, and muscle source on the internal cooked color of beef steaks. Meat Sci. 81:664–670.
Swatland, H. J. 1989. A review of meat spectrophotometry (300 to 800). Can. Inst. Food Sci. Technol. J. 22:390–402.
Swatland, H. J., and S. Barbut. 1999. Sodium chloride levels in comminuted chicken muscle in relation to process-ing characteristics and Fresnel reflectance detected with a polarimetric probe. Meat Sci. 51:377–381.
Tang, J., C. Faustman, and T. A. Hoagland. 2004. Krzywicki revisited: Equations for spectrophotometric determina-tion of myoglobin redox forms in aqueous meat extracts. J. Food Sci. 69:C717–C720.
Tang, J., C. Faustman, T. A. Hoagland, R. A. Mancini, M. Seyfert, and M. C. Hunt. 2005a. Interactions between mi-tochondrial lipid oxidation and oxymyoglobin oxidation and the effects of vitamin E. J. Agric. Food Chem. 53:6073–6079.
Tang, J., C. Faustman, T. A. Hoagland, R. A. Mancini, M. Seyfert, and M. C. Hunt. 2005b. Postmortem oxygen con-sumption by mitochondria and its effects on myoglobin form and stability. J. Agric. Food Chem. 53:1223–1230.
Tang, J., C. Faustman, R. A. Mancini, M. Seyfert, and M. C. Hunt. 2005c. Mitochondrial reduction of metmyoglobin: Dependence on the electron transport chain. J. Agric. Food Chem. 53:5449–5455.
Tapp, W. H., III, Y. W. S. Yancey, and J. K. Apple. 2011. How is the instrumental color of meat measured? Meat Sci. 89:1–5.
Tappel, A. L. 1957. Reflectance spectral studies of the hematin pigments of cooked beef. Adv. Food Res. 22:404.Tarladgis, B. G., B. M. Watts, and M. T. Younathan. 1960. A distillation method for the quantitative determination
of malonaldehyde in rancid foods. J. Am. Oil Chem. Soc. 37:44–48.Trout, G. R. 1989. Variation in myoglobin denaturation and color of cooked beef, pork, and turkey meat as influ-
enced by pH, sodium chloride, sodium tripolyphosphate, and cooking temperature. J. Food Sci. 54:536.

124 Color Guidelines Handbook
Trout, G. R., and D. A. Gutzke. 1996. A simple, rapid preparative method for isolating and purifying oxymyoglobin. Meat Sci. 43:1–13.
Urbin, M. C., and G. D. Wilson. 1961. The post-mortem oxygen requirements of bovine tissue. J. Food Sci. 26:313–317.
Vasavada, M. N., and D. P. Cornforth. 2006. Evaluation of antioxidant effects of raisin paste in cooked ground beef, pork, and chicken. J. Food Sci. 71:C247–C254.
Wakamatsu, J., T. Nishimura, and A. Hattori. 2004. A Zn-porphyrin complex contributes to bright red color in Parma ham. Meat Sci. 67:95–100.
Warriss, P. D. 1979. The extraction of haem pigments from fresh meat. J. Food Technol. 14:75–80.Watanabe, A., Y. Ueda, M. Higuchi, and N. Shiba. 2008. Analysis of volatile compounds in beef fat by dynamic-
headspace solid-phase microextraction combined with gas chromatography-mass spectrometry. J. Food Sci. 73:C420–C425.
Watts, B. M., J. Kendrick, M. W. Zipser, B. Hutchins, and B. Saleh. 1966. Enzymatic reducing pathways in meat. J. Food Sci. 32:855–862.
Wiegand, C., and G. Waloszek. 2003. Color Glossary A-C. Accessed Jan. 30, 2011. http://www.sapdesignguild.org/re sources/glossary_color/index1.html#norm_cs.
Wikipedia. 2011a. Illustration of the CIE 1931 color space. Accessed May 24, 2011. http://commons.wikimedia.org/wiki/File:CIExy1931.svg.
Wikipedia. 2011b. Spectral power distribution. Accessed May 20, 2011. http://en.wikipedia.org/wiki/Spectral_power_distribution.
Witte, V. C., G. F. Krause, and M. E. Bailey. 1970. A new extraction method for determining 2-thiobarbituric acid values of pork and beef during storage. J. Food Sci. 35:582–585.
Wittenberg, J. B., and B. A. Wittenberg. 1981. Preparation of myoglobins. Methods Enzymol. 76:29–42.Yancey, J. W. S., and D. H. Kropf. 2008. Instrumental reflectance values of fresh pork are dependent on aperture
size. Meat Sci. 79:734–739.Yin, M. C., and C. Faustman. 1993. Influence of temperature, pH, and phospholipid composition upon the stability
of myoglobin and phospholipid: A liposome model. J. Agric. Food Chem. 41:853–857.Zipser, M. W., and B. M. Watts. 1962. A modified 2-thiobarbituric acid (TBA) method for the determination of
malonaldehyde in cured meats. Food Technol. 16:102–105.


American Meat Science Association201 West Springfi eld Avenue, Suite 1202Champaign, Illinois USA 61820