Embed Size (px)
Citation preview
Double Value Coupon Program Diet and Shopping Behavior Study
Published: September 2012
Foreword When we officially launched Wholesome Wave’s Double Value Coupon Program in 2008, we firmly believed that our simple idea of “doubling” the value of federal nutrition benefits at farmers markets would encourage people living in historically underserved communities to buy local healthy fresh fruits and vegetables that are often inaccessible. We certainly knew we were on to something when the popularity of our modest program, which started at just a handful of farmers markets in 3 states, quickly spread to 25 states and more than 300 farmers markets in less than 5 years. It is truly gratifying to see validation in this report that our “little program that could” is making a big difference in the lives of so many people.
The Double Value Coupon Program Diet and Shopping Behavior Study, conducted during the 2011 market season, found that fruit and vegetable consumption during the 16-weeks of Double Value Coupon usage on the part of participants increased significantly. Even more exciting is that vegetable consumption continued to stay higher after the study period had ended. Other interesting findings include that the program leads to significant change in shopping behavior among participants, most markedly from buying fresh fruits and vegetables at supermarkets to buying them at farmers markets during the Double Value Coupon incentive period. In fact, over two-thirds of all participants were buying all or most of their fresh fruits and vegetables at the farmers market midway through the study, with those participants who reported limited access to quality produce purchasing at even higher levels.
I encourage you to read the results of this exciting study, which clearly outline the benefits of the Double Value Coupon Program for consumers. Along with other studies, Wholesome Wave and its collaborators are showing that federal nutrition benefit incentive programs at farmers markets and other farm-to-retail venues are innovative and effective ways to impact fruit and vegetable purchasing and consumption behaviors, and provide positive economic impact for communities and farmers. Michel Nischan
EXECUTIVE SUMMARY
This report examines the results from a study of the impact of Wholesome Wave’s Double Value Coupon Program (DVCP) on participating federal nutrition benefit consumers. Wholesome Wave began implementing the DVCP to benefit underserved consumers, local communities, farmers markets, and farmers in 2008. When shopping at participating farmers markets and other farm-to-retail venues, DVCP participants receive an incentive that matches the amount they spend in federal nutrition benefits (such as the Supplemental Nutrition Assistance Program, or SNAP, and the Special Supplemental Nutrition Program for Women, Infants, and Children, or WIC) towards the purchase of healthful, locally grown food.
By the end of 2012, Wholesome Wave estimates that the DVCP will be operational at more than 300 farm-to-retail venues (including farmers markets, farm stands, mobile markets and Community Supported Agriculture or CSA programs) in 25 states and the District of Columbia, implemented through a network of approximately 60 program partners. The primary objectives of the DVCP are:
• Increasing access to affordable fresh, locally grown fruits and vegetables for participating consumers, thereby facilitating increased consumption of healthful foods;
• Increasing the revenue and viability of small and mid-size farms participating in farm-to-retail markets (including farmers markets, farm stands, mobile markets, and CSA programs);
• Increasing the viability of farm-to-retail venues in historically excluded communities; and
• Improving the local economy through food commerce driven by networks of farm-based small businesses.
The number of farmers markets in the United States has increased rapidly over the last 20 years. Additionally, federal nutrition benefit recipients, in search of more healthful food choices, are increasingly bringing their business to farmers markets. Nutrition incentive programs, such as Wholesome Wave’s DVCP, are seeing expansive growth as well. Not surprisingly, farmers markets have attracted a great deal of attention for their potential to provide consumers in low-income rural and urban “food deserts” with access to high quality fresh fruits and vegetables. However, few studies to date have examined the impacts of federal nutrition benefit redemption at farmers markets on the markets, their vendors and participating consumers. Data from earlier Wholesome Wave evaluation efforts demonstrated that implementation of the DVCP increases SNAP purchases at markets. In surveys of DVCP consumers from 2010 and 2011, participants reported increasing their fruit and vegetable consumption and changing their shopping habits.
Summary Results: Double Value Coupon Program Diet and Shopping Behavior Study
1
To delve deeper into the multiple impacts of the DVCP, researchers, in collaboration with Wholesome Wave, undertook a longitudinal study in 2011 and 2012 to ascertain how the DVCP affects fruit and vegetable consumption of program participants, and whether the DVCP drives change in participants’ shopping habits related to the purchase of fresh fruits and vegetables. The research protocol was designed to track the consumption and purchasing patterns of 300 women and children dyads participating in DVCP programming in three cities (New York City, the Boston area, and San Diego) over a six-month period. Participants were recruited from DVCP consumers at each of the five farmers market sites, and both a food frequency questionnaire and a shoppers survey were implemented 3–4 times in each location throughout the study period.
KEY FINDINGS INCLUDE: • Almost half of enrolled participants (48 percent) came regularly to the markets and completed the study. Of those who participated throughout the entire study, over 60 percent purchased fruits and vegetables at the participating farmers market almost every week.
• Analysis of the data indicates that the number of times participants consumed fresh fruits and vegetables increased during the DVCP period, and that vegetable consumption remained higher two months after DVCP ended. However, fruit consumption decreased to pre-DVCP levels once the study period ended, suggesting challenges with access to and/or affordability of fresh fruits once the markets closed.
• Results show a significant change in shopping behavior among participants, most markedly from a shift in buying fresh fruits and vegetables at supermarkets to buying them at farmers markets during the DVCP period. In addition, over two-thirds of all participants were buying all or most of their fresh fruits and vegetables at the farmers market midway through the DVCP study period.
• Participants who reported limited access to quality fresh fruits and vegetables in their neighborhood procured all or most of their fresh produce from farmers markets at higher levels than participants who did not report access problems. These results suggest that in areas where shoppers have limited access to quality fresh fruits and vegetables, farmers markets can be an important and valued component in ameliorating issues of affordable access.
• At the beginning of the study, price and poor produce quality were the two barriers to purchasing fruits and vegetables reported most often. Participants generally felt that the prices of fresh fruits and veg-etables at the market were similar or slightly higher than at other venues (e.g., supermarkets or corner stores). Further research regarding actual pricing and perceptions on the part of consumers will help add clarity to the issue of affordability.
• Results from the shoppers survey indicate that the vast majority of study participants felt that they either increased or greatly increased the variety of fresh fruits and vegetables purchased. Data obtained with other study instruments are not consistent with these findings however, which may indicate a lack of validity or reliability in the study instruments to test the impact of the program on increasing variety. While limitations with study tools may be the cause of inconsistent results, additional research could help verify or refute these self-reported survey findings.
2
INTRODUCTION
This report examines the results from a study of the impact of Wholesome Wave’s Double Value Coupon Program (DVCP) on participating federal nutrition benefit consumers. Wholesome Wave’s mission is to empower historically excluded urban and rural communities by increasing access to and affordability of fresh, locally grown food, resulting in significant local economic impact while increasing consumption of more healthful foods. Wholesome Wave’s three programs—the Double Value Coupon Program, the Fruit and Vegetable Prescription Program™, and Healthy Food Commerce Investments—address a variety of issues surrounding food insecurity; dietary-related diseases, including obesity and type-2 diabetes; lack of affordable access to healthier food choices for people struggling with poverty; and the economic viability of small and midsize farm businesses. They also seek to strengthen regional agricultural production by catalyzing the development of regional food systems infrastructure in ways that help consumers of all backgrounds and food businesses of all sizes take advantage of the exploding demand for locally and regionally grown foods.
Wholesome Wave launched the DVCP in 2008 at farmers markets in Connecticut, California, and Massachusetts. When shopping at participating farmers markets or other farm-to-retail venues, DVCP participants receive an incentive that matches the amount they spend in federal nutrition benefits (such as the Supplemental Nutrition Assistance Program, or SNAP) towards the purchase of locally grown, healthy fruits and vegetables. Since 2008, the program has experienced tremendous growth; by the end of 2012, it is estimated that DVCP will be running at more than 300 farm-to-retail locations (including farmers markets, farm stands, mobile markets and CSA programs) in 25 states and the District of Columbia, implemented through a network of approximately 60 Wholesome Wave program partners.
The primary objectives of the DVCP include:
• Increasing access to and affordability of fresh fruits and vegetables for participating consumers, thereby facilitating increased consumption of those healthy foods among program participants;
• Increasing the revenue and viability of small and mid-size farms participating in farm-to-retail venues (including farmers markets, farm stands, mobile markets, and CSA programs);
• Increasing the viability of farm-to-retail venues in historically excluded communities; and
• Improving the local economy through food commerce with farm-based small businesses.
3
RELEVANT LITERATURE
The number of farmers markets in the United States has increased rapidly over the last 20 years. The U.S. Department of Agriculture (USDA) listed almost 7,900 markets in mid 2012 (USDA AMS, 2012). Federal nutrition benefit recipients are also increasingly shopping at farmers markets. In 2010, approximately 12 percent of all markets redeemed SNAP benefits nationwide (Love, 2011; USDA, 2010), a 50 percent increase over those authorized to redeem such benefits in 2008. This translated into $7.5 million in purchases made by SNAP recipients at farmers markets, up from $1 million in 2007 (Love, 2011; USDA, 2010; USDA, FNS, 2010). Additionally, redemption of Women, Infants, and Children (WIC) and Senior Farmers Market Nutrition Program (FMNP) checks reached almost $39 million in 2010. Redemption of the newer WIC Cash Value Vouchers (CVV) at farmers markets is still unknown, but the number of markets that can redeem these vouchers is increasing. Not surprisingly, farmers markets have attracted a great deal of attention for their potential to provide access to high-quality fresh fruits and vegetables for low-income consumers living in rural and urban “food deserts.”
One of the primary goals of Wholesome Wave’s DVCP is to increase affordable access to fresh fruits and vegetables in an effort to increase consumption of these healthy foods among program participants. Numerous nutrition studies document the health benefits of increased fruit and vegetable consumption (for instance, Epstein et al., 2001; Ford & Mokdad, 2001; Ness and Powles, 1997; Rolls et al., 2008).
Still, studies show that low-income households in the U.S. often do not meet the recommended daily servings of fruits and vegetables, with these households spending significantly less per week on fruits and vegetables than higher-income households (Blisard et al., 2004). A number of studies have examined the barriers to consuming fresh fruits and vegetables in lower income communities, and most find that cost/affordability and availability are key factors (Bodor et al., 2010; Guthrie et al., 2007; Laska et al., 2010; Lucan et al., 2010; Powell & Chaloupka, 2009).
Limited research has shown that monetary incentives, coupons, or lowering prices to subsidize the purchase of fresh fruits and vegetables for low-income households may help increase consumption of those products (Diansheng & Leibtag, 2010; Dong & Lin, 2009; Guthrie et al., 2007; Stewart & Blisard, 2008).
Few studies to date have examined farmers markets and the redemption of federal nutrition benefits. Racine and colleagues (2010) found that pregnant women who previously redeemed WIC FMNP vouchers at farmers markets had higher farmers market use rates. They also found that the use of farmers markets is associated with higher fruit and vegetable consumption. Another study (Herman et al., 2008) found that California WIC participants receiving subsidies increased consumption of fruits and vegetables in comparison to control subjects, with greater increases in subjects shopping at farmers markets over supermarkets. Related, although not specifically tracking federal nutrition benefit customers, Evans and colleagues (2012) found that the introduction of farm stands in low-income communities has a positive impact on the consumption of some fruits and vegetables.
4
In 2011, Wholesome Wave gathered data from over 225 market sites in 21 states and the District of Columbia. The data (http://wholesomewave.org/wp-content/uploads/2012/06/Double-Value-Coupon-Program-2011-Outcomes.pdf) reveals that the vast majority of markets at least double their SNAP redemption following implementation of the DVCP, with many seeing even larger increases. This has been the experience with other farmers market incentive programs as well. For instance, the New York City Department of Health and Hygiene (2010), implementing a program similar to the DVCP called Health Bucks, found that SNAP transactions at farmers markets in New York City increased between 200-400 percent with the advent of the program.
In surveys of over 1,220 DVCP consumers collected by Wholesome Wave in 2011, participants reported increasing their fruit and vegetable consumption and changing their shopping habits (Wholesome Wave, 2012). Almost three-quarters (69 percent) of the consumers said they would not have come to spend their federal nutrition benefits at the market without the DVCP. Another 23 percent noted that the program was moderately important in the decision to spend their federal nutrition benefits at the market. The vast majority of DVCP consumers felt that as a result of shopping at the market, their intake of fresh fruits and vegetables had either greatly increased (47 percent) or increased (40 percent). These shoppers also value other aspects of the markets, with 93 percent reporting the quality of produce as very important in their decision to come to the market, followed by supporting local businesses/farmers (87 percent) and selection of produce (84 percent).
5
STUDY CONTEXT AND METHODS
Recognizing the value in delving more deeply into the impacts of the DVCP, researchers, in collaboration with Wholesome Wave, undertook a longitudinal study in 2011 and 2012 to explore how the program affects fruit and vegetable consumption by program participants. In addition, the study examined if the DVCP had an impact on participants’ shopping habits related to the purchase of fresh fruits and vegetables. The research study was designed to track the consumption and purchasing patterns of 300 women and children dyads participating in the DVCP in three metropolitan areas (New York City, the Boston area, and San Diego) over a six-month period. The protocol was developed in collaboration with Dr. Shikha Anand (Wholesome Wave’s Fruit and Vegetable Prescription Program lead evaluator), researchers from New York University and the University of California San Diego, and Wholesome Wave’s program partners in New York City (Just Food), Boston (The Food Project), and San Diego (International Rescue Committee).
The study sites included five farmers markets. In the Boston area, market sites included the Copley Square Farmers Market (open two days per week, May through November) and the Lynn Street Farmers Market (open one day per week, July through October). In New York City, the markets included the East New York Farmers Market (open one day per week, June through November) and La Familia Verde Farmers Market (open one day per week, July through November). In San Diego, one farmers market, Linda Vista (open one day per week, new market, opened June 2011, year round), participated. Each study site assigned trained research assistants to track each participant and administer study surveys at various times. University IRB approval was obtained by NYU and UC San Diego, with approved IRB protocols utilized during the study period in all three cities.
Participants included women and their children (ages 2 through 12) receiving federal nutrition benefits and enrolled in the DVCP at participating farmers markets in the three cities (100 dyads in each city). Over the first month of the study, women were recruited at designated areas where DVCP benefits are distributed at each farmers market. Potential participants were first asked whether they had children between the ages of 2 and 12, were provided with written information about the study (in the appropriate language), and asked whether they wanted to participate. Once enrolled, each dyad received up to $10 in DVCP benefits weekly for 16 weeks (doubling their federal nutrition benefits or cash in the case of many participants enrolled in WIC, since the value of WIC benefits redeemable at farmers markets is limited). Cash incentives were given to the participants at the completion of each survey; incentives generally increased (ranging from $5 to $20) through the study period so that those who finished the study received the largest incentives. All surveys completed during the study were available in English, Spanish, and Russian.
The study period for each metropolitan area varied slightly. Boston area markets started enrollment in mid-June, 2011, with enrollment finishing in late July, 2011. New York markets started enrollment in late June, 2011 and closed enrollment in early August, 2011. Final surveys for Boston and New York markets were completed in December, 2011 and early January, 2012. The San Diego market began enrollment in early August, 2011, completed enrollment by mid-September, 2011, and administered final surveys in February, 2012. The Boston and New York City markets are seasonal markets, which are open during the growing seasons in their geographic areas. The San Diego farmers market, which is a new market, opened just
6
before recruitment for this study began. The San Diego market is year round, so study participants had access to the market following completion of the study, whereas Boston and New York City participants generally did not.
Surveys administered during the 24-week period are listed in Table 1. During the initial enrollment (week 1), a demographic questionnaire was administered to gather information about race/ethnicity, age and gender of study participants, household size, education of the adult participant, annual household income, and years in the United States.
At four points in the study—week 1 (enrollment), week 8 (midway during the DVCP period), week 16 (end of the DVCP period), and week 24 (2 months following the end of the DVCP period)—participants completed a short “Shoppers Survey” (approximately 10 questions, and 5 minutes in length) that was self-administered for weeks 1, 8 and 16 and administered by interviewers over the phone at week 24. The survey was designed to assess changes in shopping habits (where fresh fruits and vegetables were sourced); participation in the farmers market; daily fruit and vegetable consumption; access to fruits and vegetables in the participant’s neighborhood; perceptions of price for fresh fruits and vegetables at the farmers markets; importance of the DVCP in their participation in the market; and the extent of purchasing fresh fruits and vegetables at the farmers market. In addition to the Shoppers Survey, a modified National Health and Nutrition Examination Survey (NHANES) food frequency questionnaire was used,1 including 22 questions to track the consumption of fresh fruits and vegetables over the study period. Trained interviewers administered the food frequency questionnaire (FFQ) at each site at three points during the study—during enrollment (week 1), at the end of the DVCP period (week 16), and 2 months (week 24) following the end of the DVCP period. In order to most effectively capture answers for both the parent and the child over the study period, the parent answered the survey for herself and for her child. The FFQ collected data on the number of times a participant had eaten 23 categories of fruits or vegetables over the last month, with nine response categories ranging from never to two or more times a day. The eight fruit categories included fresh apples or pears; melons, such as cantaloupe, honeydew, or watermelon; peaches, nectarines, or plums; strawberries, blueberries, raspberries or other berries; citrus fruit such as lemon, lime, oranges, or grapefruit; grapes; bananas; and other fruit specified. The 15 vegetable categories included fresh lettuce salads, with or without other vegetables; dark greens, such as spinach, turnip, collard, mustard, chard, or kale; carrots; string beans, peas, snow peas, or other beans; corn; broccoli, cabbage, cauliflower, or Brussels sprouts; sweet or hot peppers green, red, or yellow; eggplants; cucumbers and squash, including yellow and green; tomatoes, including those in salads; onions and garlic; sweet potatoes or yams; potatoes, baked, boiled, or mashed, or potato salad; herbs; and other vegetables specified.
1U.S. Center for Disease Control, NHANES. See www.cdc.gov/nchs/nhanes.htm. 7
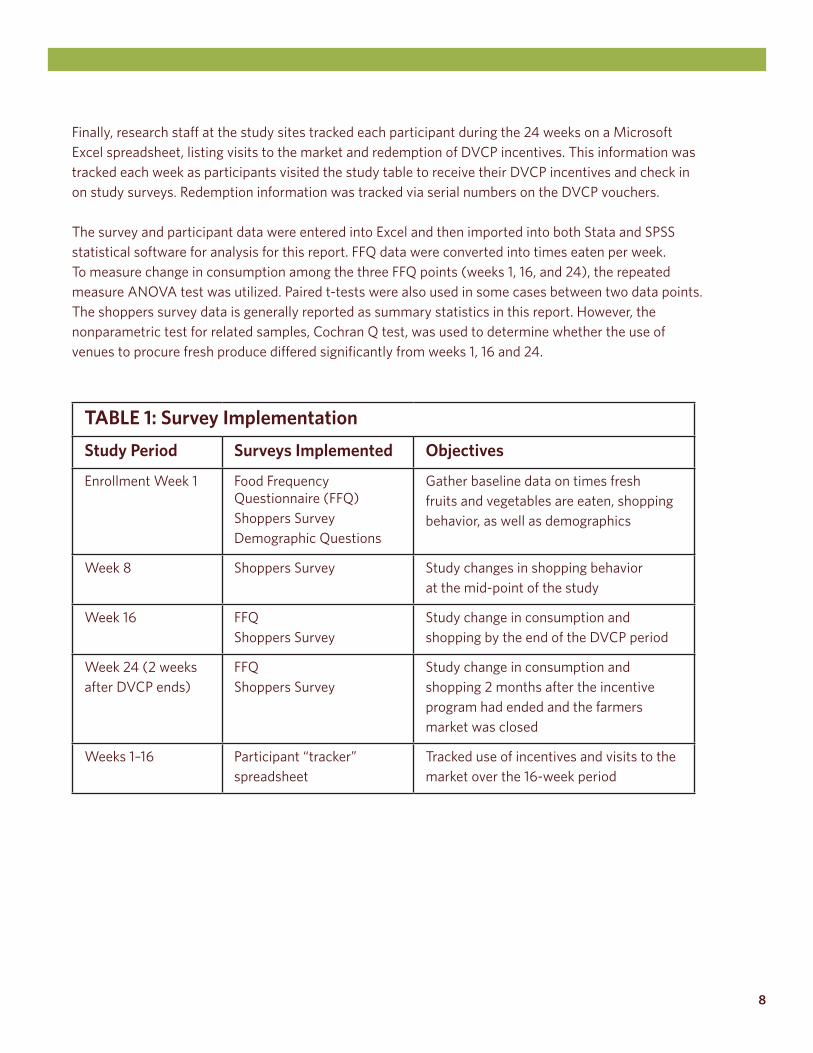
Finally, research staff at the study sites tracked each participant during the 24 weeks on a Microsoft Excel spreadsheet, listing visits to the market and redemption of DVCP incentives. This information was tracked each week as participants visited the study table to receive their DVCP incentives and check in on study surveys. Redemption information was tracked via serial numbers on the DVCP vouchers.
The survey and participant data were entered into Excel and then imported into both Stata and SPSS statistical software for analysis for this report. FFQ data were converted into times eaten per week. To measure change in consumption among the three FFQ points (weeks 1, 16, and 24), the repeated measure ANOVA test was utilized. Paired t-tests were also used in some cases between two data points. The shoppers survey data is generally reported as summary statistics in this report. However, the nonparametric test for related samples, Cochran Q test, was used to determine whether the use of venues to procure fresh produce differed significantly from weeks 1, 16 and 24.
TABLE 1: Survey Implementation
Study Period Surveys Implemented Objectives
Enrollment Week 1 Food Frequency Questionnaire (FFQ) Shoppers Survey Demographic Questions
Gather baseline data on times fresh fruits and vegetables are eaten, shopping behavior, as well as demographics
Week 8 Shoppers Survey Study changes in shopping behavior at the mid-point of the study
Week 16 FFQ Shoppers Survey
Study change in consumption and shopping by the end of the DVCP period
Week 24 (2 weeks after DVCP ends)
FFQ Shoppers Survey
Study change in consumption and shopping 2 months after the incentive program had ended and the farmers market was closed
Weeks 1–16 Participant “tracker” spreadsheet
Tracked use of incentives and visits to the market over the 16-week period
8
DEMOGRAPHIC CHARACTERISTICS AND SHOPPER BEHAVIOR AT ENROLLMENT
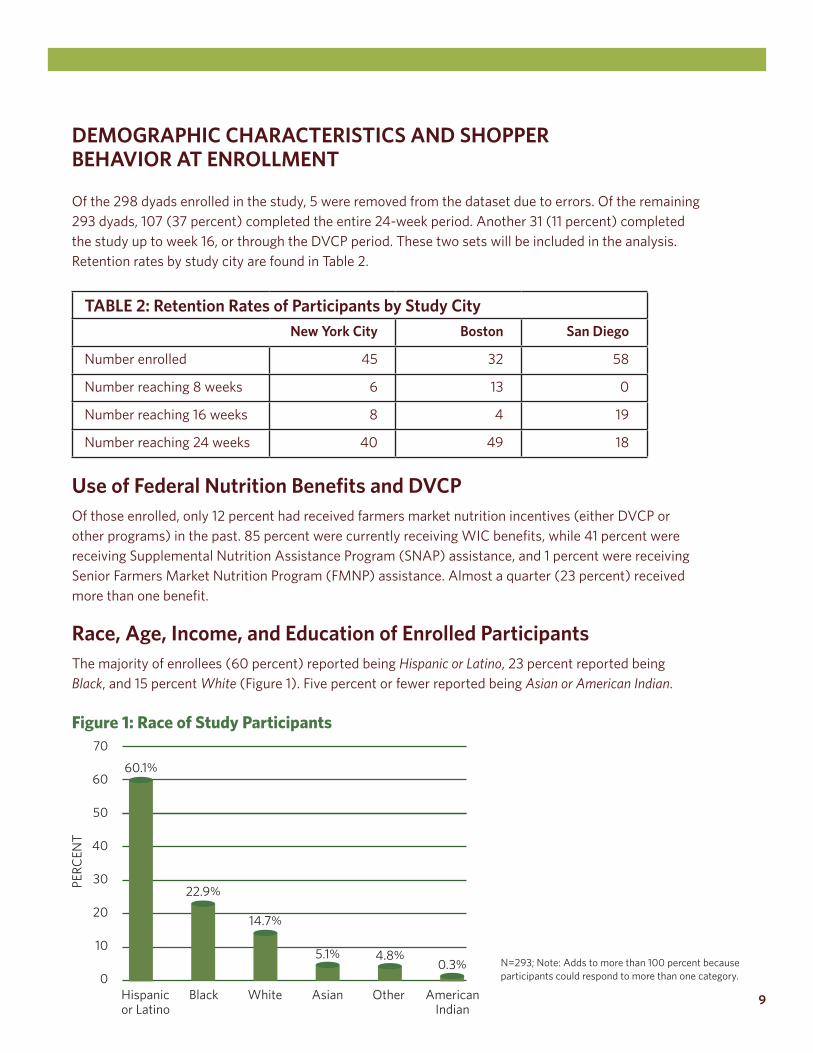
Of the 298 dyads enrolled in the study, 5 were removed from the dataset due to errors. Of the remaining 293 dyads, 107 (37 percent) completed the entire 24-week period. Another 31 (11 percent) completed the study up to week 16, or through the DVCP period. These two sets will be included in the analysis. Retention rates by study city are found in Table 2.
TABLE 2: Retention Rates of Participants by Study CityNew York City Boston San Diego
Number enrolled 45 32 58
Number reaching 8 weeks 6 13 0
Number reaching 16 weeks 8 4 19
Number reaching 24 weeks 40 49 18
Use of Federal Nutrition Benefits and DVCPOf those enrolled, only 12 percent had received farmers market nutrition incentives (either DVCP or other programs) in the past. 85 percent were currently receiving WIC benefits, while 41 percent were receiving Supplemental Nutrition Assistance Program (SNAP) assistance, and 1 percent were receiving Senior Farmers Market Nutrition Program (FMNP) assistance. Almost a quarter (23 percent) received more than one benefit.
Race, Age, Income, and Education of Enrolled ParticipantsThe majority of enrollees (60 percent) reported being Hispanic or Latino, 23 percent reported being Black, and 15 percent White (Figure 1). Five percent or fewer reported being Asian or American Indian. Figure 1: Race of Study Participants
9 Hispanic Black White Asian Other American or Latino Indian
60.1%
22.9%
14.7%
5.1% 4.8%0.3%
70
60
50
40
30
20
10
0N=293; Note: Adds to more than 100 percent because participants could respond to more than one category.
PERC
ENT
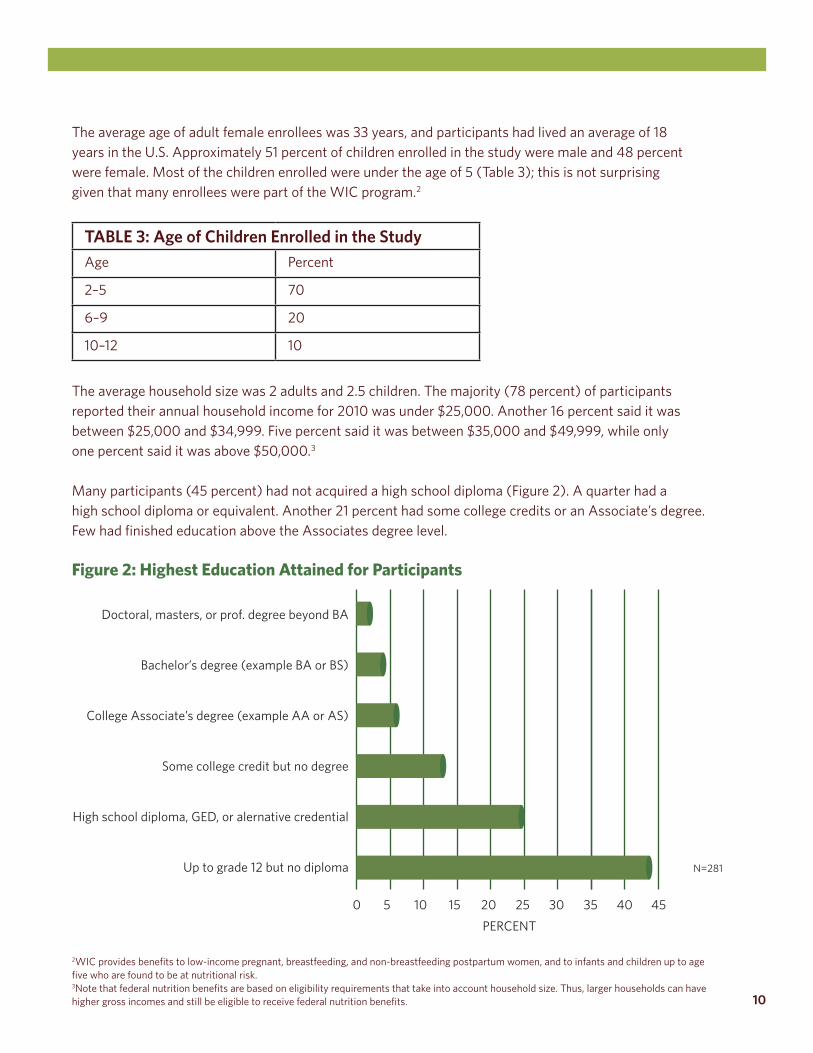
The average age of adult female enrollees was 33 years, and participants had lived an average of 18 years in the U.S. Approximately 51 percent of children enrolled in the study were male and 48 percent were female. Most of the children enrolled were under the age of 5 (Table 3); this is not surprising given that many enrollees were part of the WIC program.2
TABLE 3: Age of Children Enrolled in the StudyAge Percent
2–5 70
6–9 20
10–12 10
The average household size was 2 adults and 2.5 children. The majority (78 percent) of participants reported their annual household income for 2010 was under $25,000. Another 16 percent said it was between $25,000 and $34,999. Five percent said it was between $35,000 and $49,999, while only one percent said it was above $50,000.3
Many participants (45 percent) had not acquired a high school diploma (Figure 2). A quarter had a high school diploma or equivalent. Another 21 percent had some college credits or an Associate’s degree. Few had finished education above the Associates degree level.
Figure 2: Highest Education Attained for Participants
2WIC provides benefits to low-income pregnant, breastfeeding, and non-breastfeeding postpartum women, and to infants and children up to age five who are found to be at nutritional risk.3Note that federal nutrition benefits are based on eligibility requirements that take into account household size. Thus, larger households can have higher gross incomes and still be eligible to receive federal nutrition benefits.
N=281
10
0 5 10 15 20 25 30 35 40 45
PERCENT
Doctoral, masters, or prof. degree beyond BA
Bachelor’s degree (example BA or BS)
College Associate’s degree (example AA or AS)
Some college credit but no degree
High school diploma, GED, or alernative credential
Up to grade 12 but no diploma
SHOPPING BEHAVIOR AT ENROLLMENT
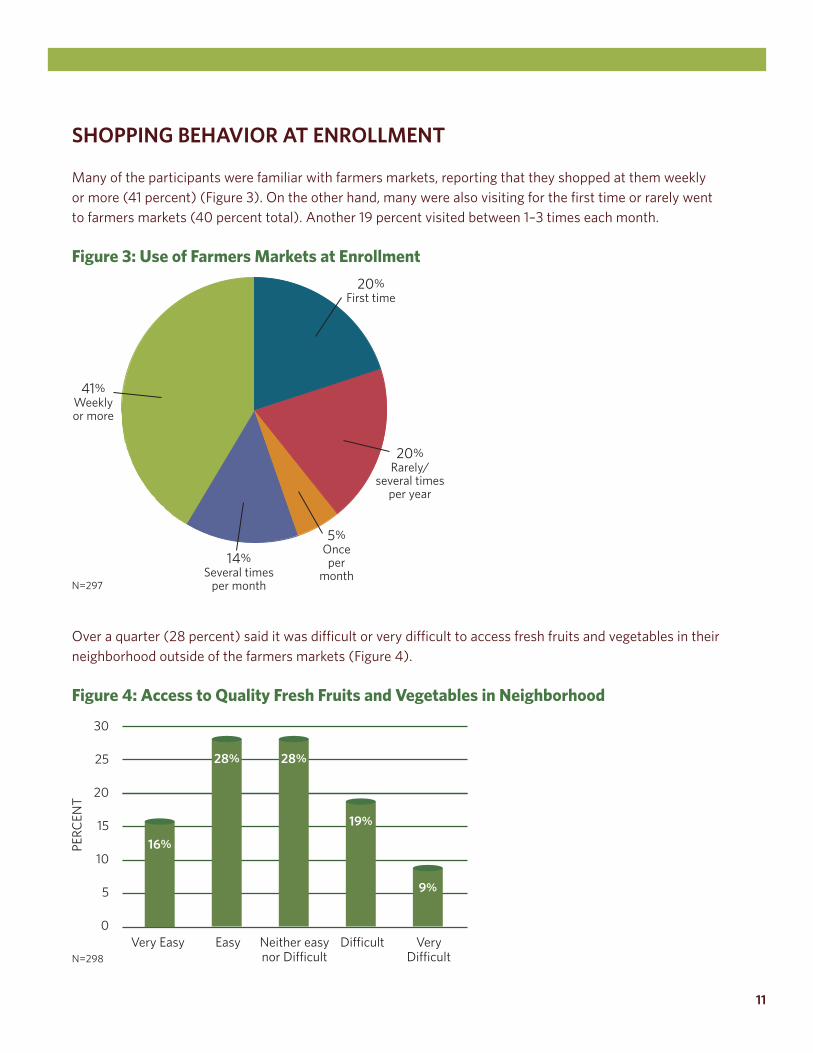
Many of the participants were familiar with farmers markets, reporting that they shopped at them weekly or more (41 percent) (Figure 3). On the other hand, many were also visiting for the first time or rarely went to farmers markets (40 percent total). Another 19 percent visited between 1–3 times each month. Figure 3: Use of Farmers Markets at Enrollment Over a quarter (28 percent) said it was difficult or very difficult to access fresh fruits and vegetables in their neighborhood outside of the farmers markets (Figure 4). Figure 4: Access to Quality Fresh Fruits and Vegetables in Neighborhood
N=297
N=298
11
41% Weekly or more
20% Rarely/
several times per year
20% First time
14% Several times
per month
5% Once per
month
30
25
20
15
10
5
0
16%
28% 28%
19%
9%
Very Easy Easy Neither easy Difficult Very nor Difficult Difficult
PERC
ENT
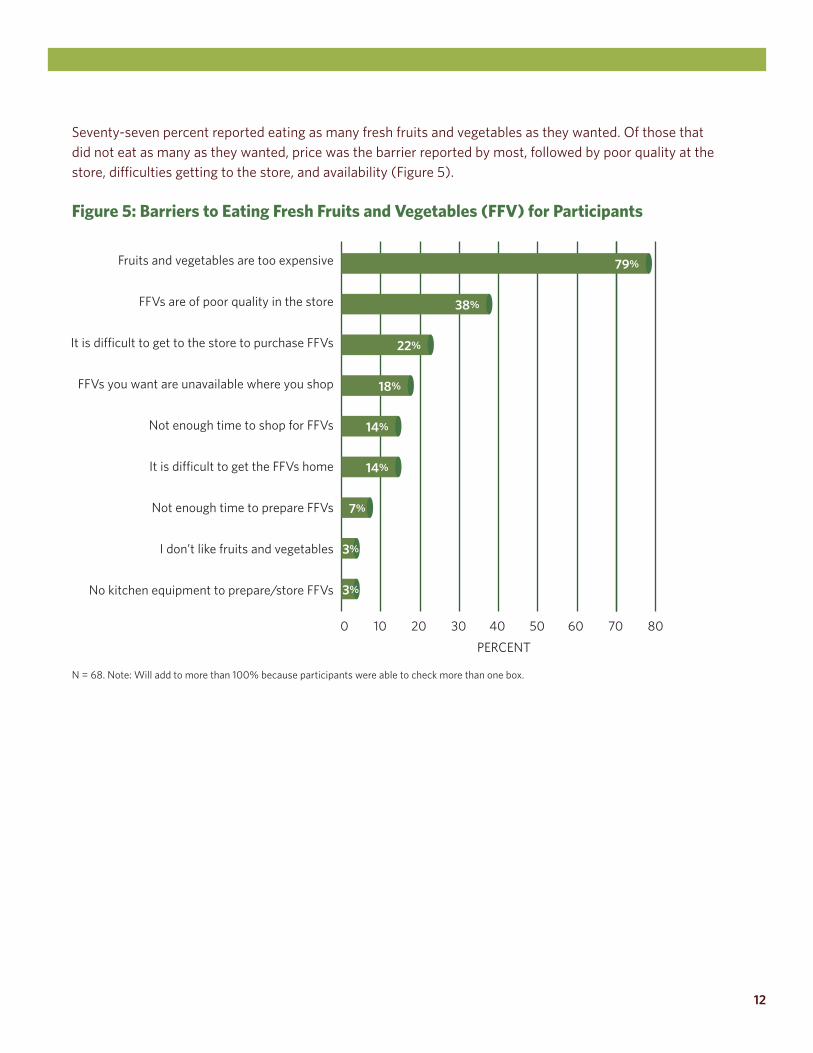
Seventy-seven percent reported eating as many fresh fruits and vegetables as they wanted. Of those that did not eat as many as they wanted, price was the barrier reported by most, followed by poor quality at the store, difficulties getting to the store, and availability (Figure 5). Figure 5: Barriers to Eating Fresh Fruits and Vegetables (FFV) for Participants
N = 68. Note: Will add to more than 100% because participants were able to check more than one box.
12
0 10 20 30 40 50 60 70 80
PERCENT
Fruits and vegetables are too expensive
FFVs are of poor quality in the store
It is difficult to get to the store to purchase FFVs
FFVs you want are unavailable where you shop
Not enough time to shop for FFVs
It is difficult to get the FFVs home
Not enough time to prepare FFVs
I don’t like fruits and vegetables
No kitchen equipment to prepare/store FFVs
79%
38%
22%
18%
14%
14%
7%
3%
3%
IMPACTS OF DVCP ON STUDY PARTICIPANTS
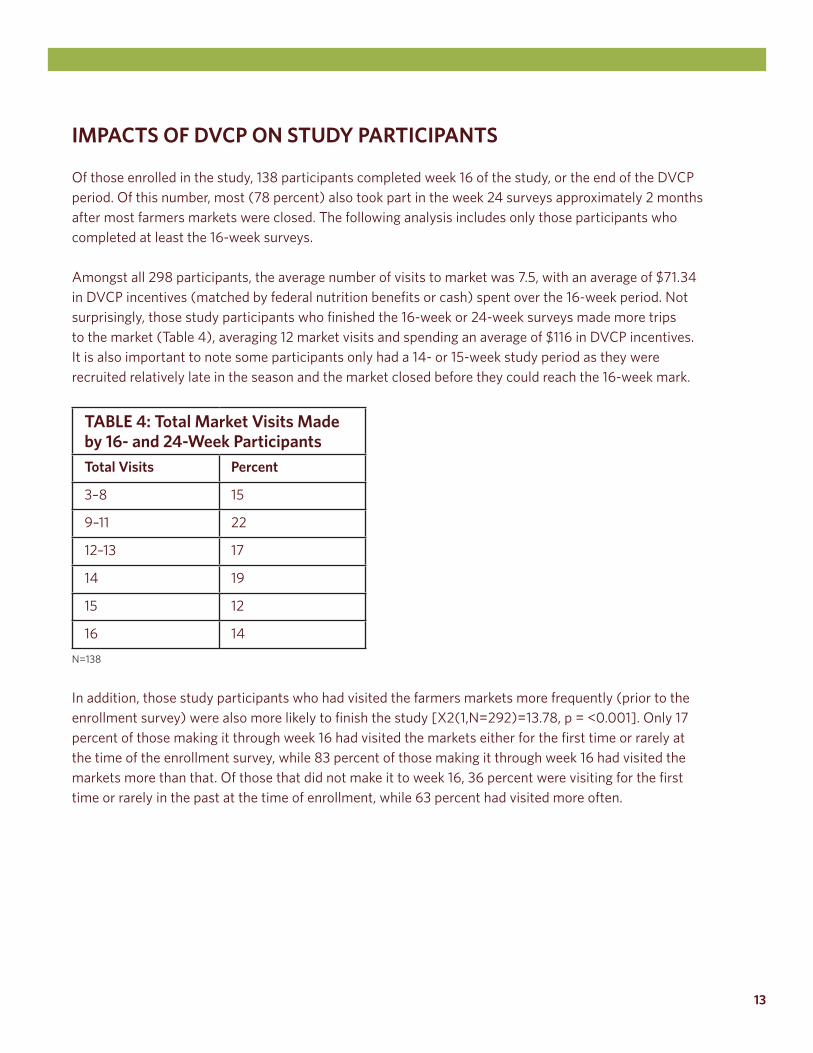
Of those enrolled in the study, 138 participants completed week 16 of the study, or the end of the DVCP period. Of this number, most (78 percent) also took part in the week 24 surveys approximately 2 months after most farmers markets were closed. The following analysis includes only those participants who completed at least the 16-week surveys.
Amongst all 298 participants, the average number of visits to market was 7.5, with an average of $71.34 in DVCP incentives (matched by federal nutrition benefits or cash) spent over the 16-week period. Not surprisingly, those study participants who finished the 16-week or 24-week surveys made more trips to the market (Table 4), averaging 12 market visits and spending an average of $116 in DVCP incentives. It is also important to note some participants only had a 14- or 15-week study period as they were recruited relatively late in the season and the market closed before they could reach the 16-week mark.
TABLE 4: Total Market Visits Made by 16- and 24-Week ParticipantsTotal Visits Percent
3–8 15
9–11 22
12–13 17
14 19
15 12
16 14
N=138
In addition, those study participants who had visited the farmers markets more frequently (prior to the enrollment survey) were also more likely to finish the study [X2(1,N=292)=13.78, p = <0.001]. Only 17 percent of those making it through week 16 had visited the markets either for the first time or rarely at the time of the enrollment survey, while 83 percent of those making it through week 16 had visited the markets more than that. Of those that did not make it to week 16, 36 percent were visiting for the first time or rarely in the past at the time of enrollment, while 63 percent had visited more often.
13
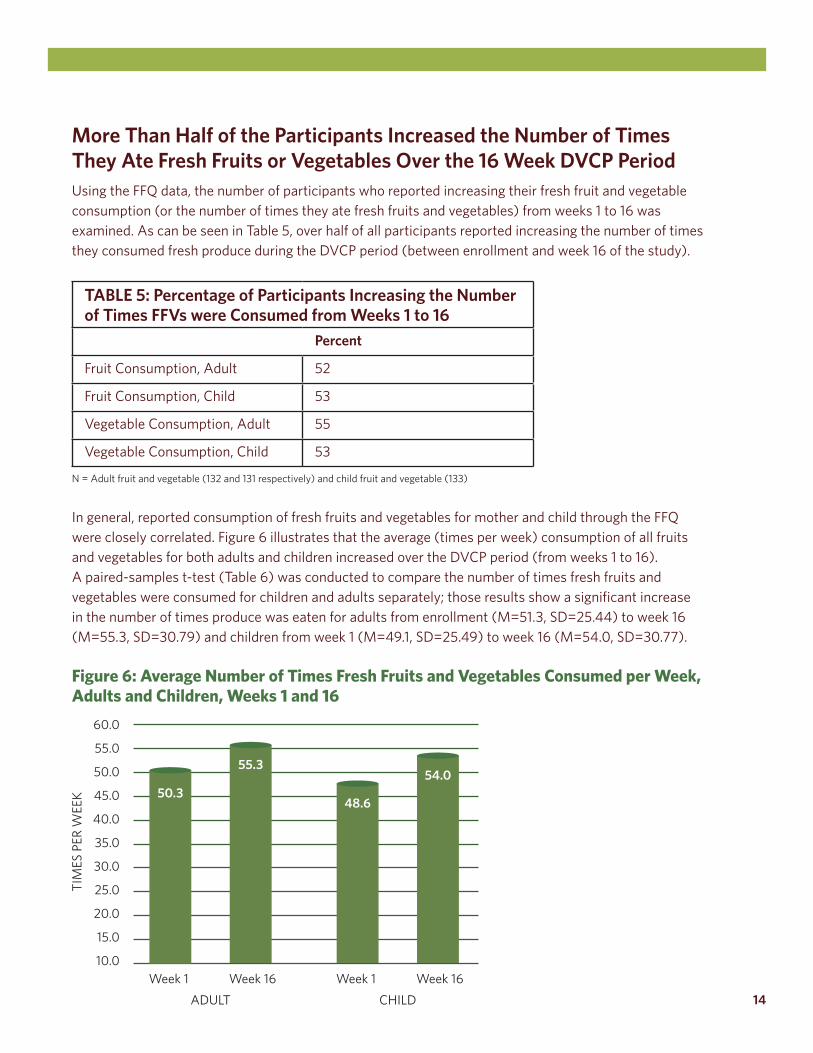
More Than Half of the Participants Increased the Number of Times They Ate Fresh Fruits or Vegetables Over the 16 Week DVCP PeriodUsing the FFQ data, the number of participants who reported increasing their fresh fruit and vegetable consumption (or the number of times they ate fresh fruits and vegetables) from weeks 1 to 16 was examined. As can be seen in Table 5, over half of all participants reported increasing the number of times they consumed fresh produce during the DVCP period (between enrollment and week 16 of the study).
TABLE 5: Percentage of Participants Increasing the Number of Times FFVs were Consumed from Weeks 1 to 16
Percent
Fruit Consumption, Adult 52
Fruit Consumption, Child 53
Vegetable Consumption, Adult 55
Vegetable Consumption, Child 53
N = Adult fruit and vegetable (132 and 131 respectively) and child fruit and vegetable (133) In general, reported consumption of fresh fruits and vegetables for mother and child through the FFQ were closely correlated. Figure 6 illustrates that the average (times per week) consumption of all fruits and vegetables for both adults and children increased over the DVCP period (from weeks 1 to 16). A paired-samples t-test (Table 6) was conducted to compare the number of times fresh fruits and vegetables were consumed for children and adults separately; those results show a significant increase in the number of times produce was eaten for adults from enrollment (M=51.3, SD=25.44) to week 16 (M=55.3, SD=30.79) and children from week 1 (M=49.1, SD=25.49) to week 16 (M=54.0, SD=30.77). Figure 6: Average Number of Times Fresh Fruits and Vegetables Consumed per Week, Adults and Children, Weeks 1 and 16
14
60.0
55.0
50.0
45.0
40.0
35.0
30.0
25.0
20.0
15.0
10.0
TIM
ES P
ER W
EEK 50.3
55.3
48.6
54.0
Week 1 Week 16
ADULT
Week 1 Week 16
CHILD
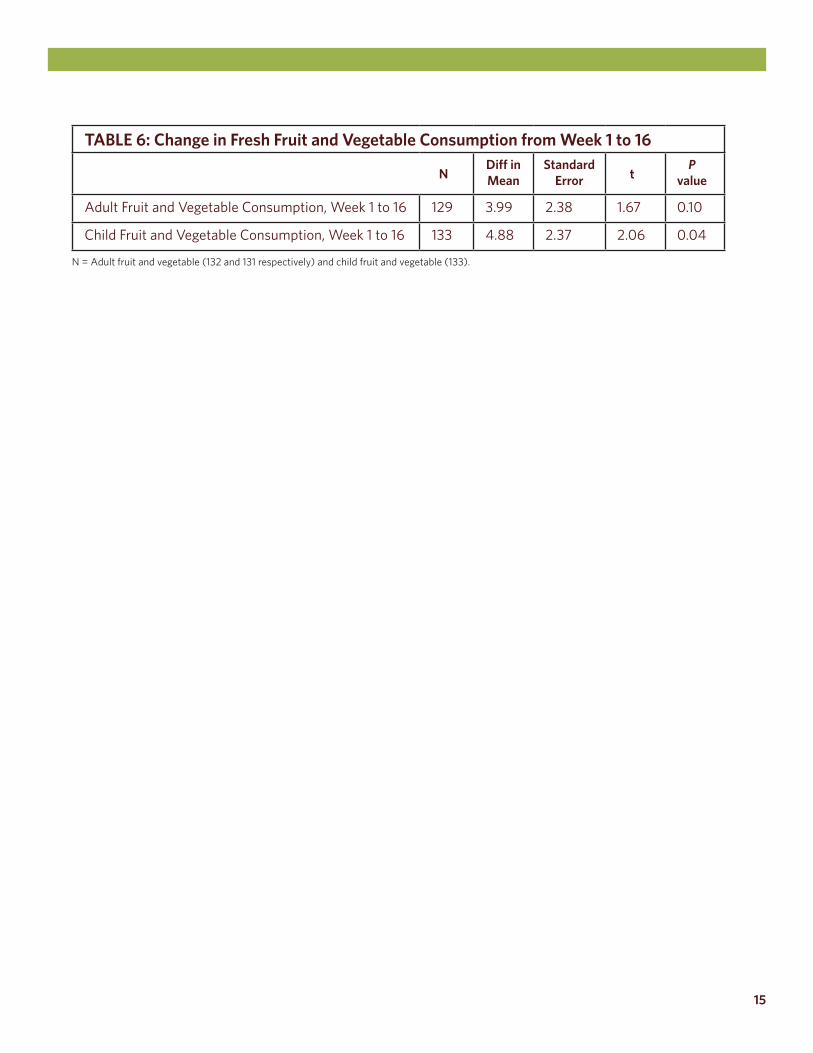
TABLE 6: Change in Fresh Fruit and Vegetable Consumption from Week 1 to 16
NDiff in Mean
Standard Error t
P value
Adult Fruit and Vegetable Consumption, Week 1 to 16 129 3.99 2.38 1.67 0.10
Child Fruit and Vegetable Consumption, Week 1 to 16 133 4.88 2.37 2.06 0.04
N = Adult fruit and vegetable (132 and 131 respectively) and child fruit and vegetable (133).
15
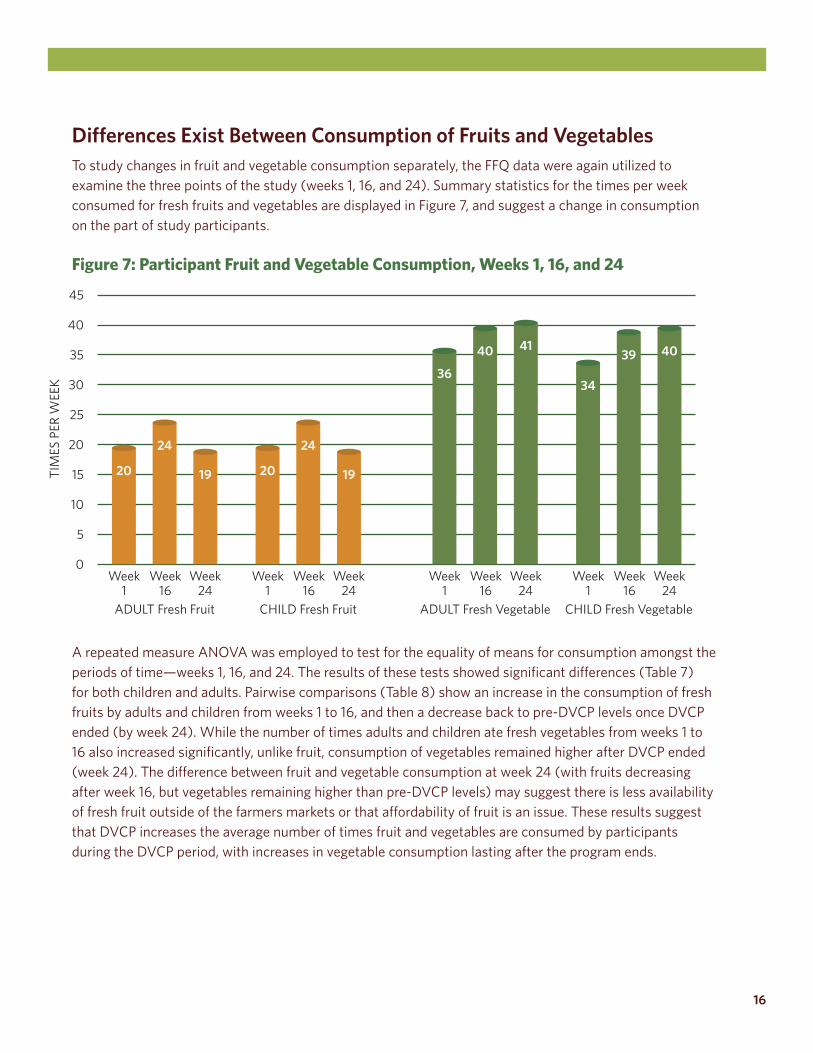
Differences Exist Between Consumption of Fruits and VegetablesTo study changes in fruit and vegetable consumption separately, the FFQ data were again utilized to examine the three points of the study (weeks 1, 16, and 24). Summary statistics for the times per week consumed for fresh fruits and vegetables are displayed in Figure 7, and suggest a change in consumption on the part of study participants. Figure 7: Participant Fruit and Vegetable Consumption, Weeks 1, 16, and 24
A repeated measure ANOVA was employed to test for the equality of means for consumption amongst the periods of time—weeks 1, 16, and 24. The results of these tests showed significant differences (Table 7) for both children and adults. Pairwise comparisons (Table 8) show an increase in the consumption of fresh fruits by adults and children from weeks 1 to 16, and then a decrease back to pre-DVCP levels once DVCP ended (by week 24). While the number of times adults and children ate fresh vegetables from weeks 1 to 16 also increased significantly, unlike fruit, consumption of vegetables remained higher after DVCP ended (week 24). The difference between fruit and vegetable consumption at week 24 (with fruits decreasing after week 16, but vegetables remaining higher than pre-DVCP levels) may suggest there is less availability of fresh fruit outside of the farmers markets or that affordability of fruit is an issue. These results suggest that DVCP increases the average number of times fruit and vegetables are consumed by participants during the DVCP period, with increases in vegetable consumption lasting after the program ends.
16
45
40
35
30
25
20
15
10
5
0
TIM
ES P
ER W
EEK
20
36
20
34
24
40 40
24
39
19
41
19
Week Week Week 1 16 24
ADULT Fresh Fruit
Week Week Week 1 16 24ADULT Fresh Vegetable
Week Week Week 1 16 24CHILD Fresh Vegetable
Week Week Week 1 16 24
CHILD Fresh Fruit
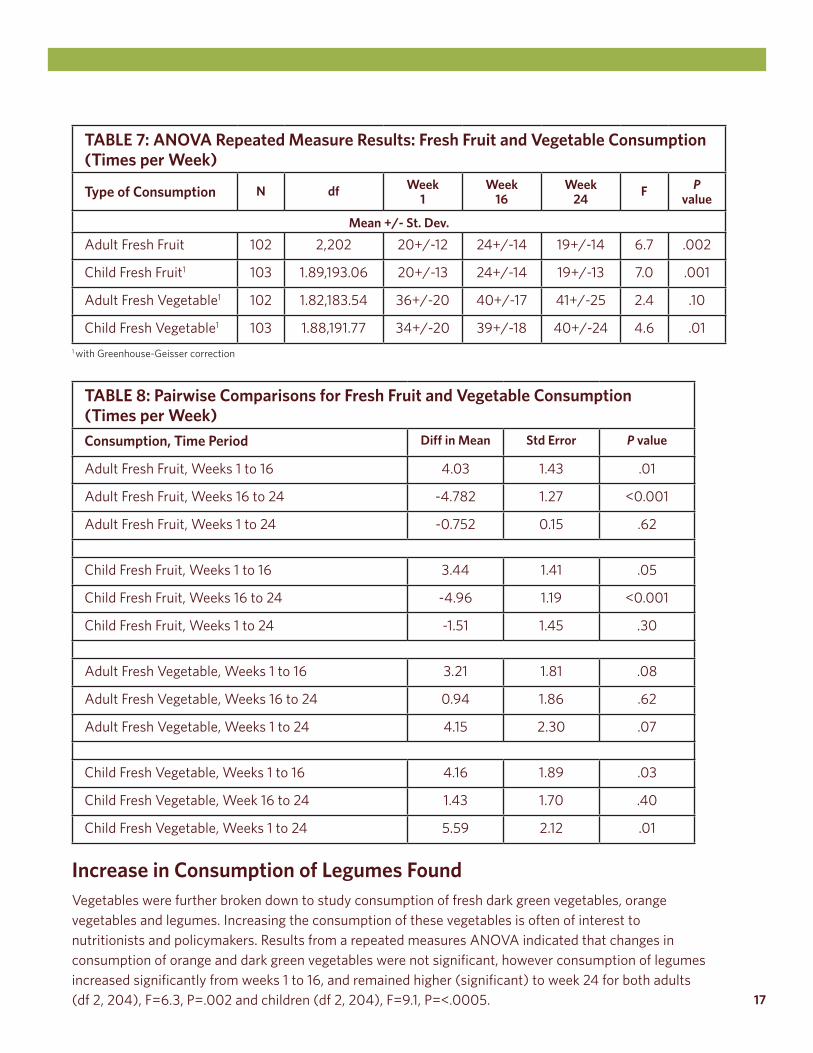
TABLE 7: ANOVA Repeated Measure Results: Fresh Fruit and Vegetable Consumption (Times per Week)
Type of Consumption N df Week 1
Week 16
Week 24
F P value
Mean +/- St. Dev.
Adult Fresh Fruit 102 2,202 20+/-12 24+/-14 19+/-14 6.7 .002
Child Fresh Fruit1 103 1.89,193.06 20+/-13 24+/-14 19+/-13 7.0 .001
Adult Fresh Vegetable1 102 1.82,183.54 36+/-20 40+/-17 41+/-25 2.4 .10
Child Fresh Vegetable1 103 1.88,191.77 34+/-20 39+/-18 40+/-24 4.6 .011 with Greenhouse-Geisser correction
TABLE 8: Pairwise Comparisons for Fresh Fruit and Vegetable Consumption (Times per Week)Consumption, Time Period Diff in Mean Std Error P value
Adult Fresh Fruit, Weeks 1 to 16 4.03 1.43 .01
Adult Fresh Fruit, Weeks 16 to 24 -4.782 1.27 <0.001
Adult Fresh Fruit, Weeks 1 to 24 -0.752 0.15 .62
Child Fresh Fruit, Weeks 1 to 16 3.44 1.41 .05
Child Fresh Fruit, Weeks 16 to 24 -4.96 1.19 <0.001
Child Fresh Fruit, Weeks 1 to 24 -1.51 1.45 .30
Adult Fresh Vegetable, Weeks 1 to 16 3.21 1.81 .08
Adult Fresh Vegetable, Weeks 16 to 24 0.94 1.86 .62
Adult Fresh Vegetable, Weeks 1 to 24 4.15 2.30 .07
Child Fresh Vegetable, Weeks 1 to 16 4.16 1.89 .03
Child Fresh Vegetable, Week 16 to 24 1.43 1.70 .40
Child Fresh Vegetable, Weeks 1 to 24 5.59 2.12 .01
Increase in Consumption of Legumes FoundVegetables were further broken down to study consumption of fresh dark green vegetables, orange vegetables and legumes. Increasing the consumption of these vegetables is often of interest to nutritionists and policymakers. Results from a repeated measures ANOVA indicated that changes in consumption of orange and dark green vegetables were not significant, however consumption of legumes increased significantly from weeks 1 to 16, and remained higher (significant) to week 24 for both adults (df 2, 204), F=6.3, P=.002 and children (df 2, 204), F=9.1, P=<.0005. 17
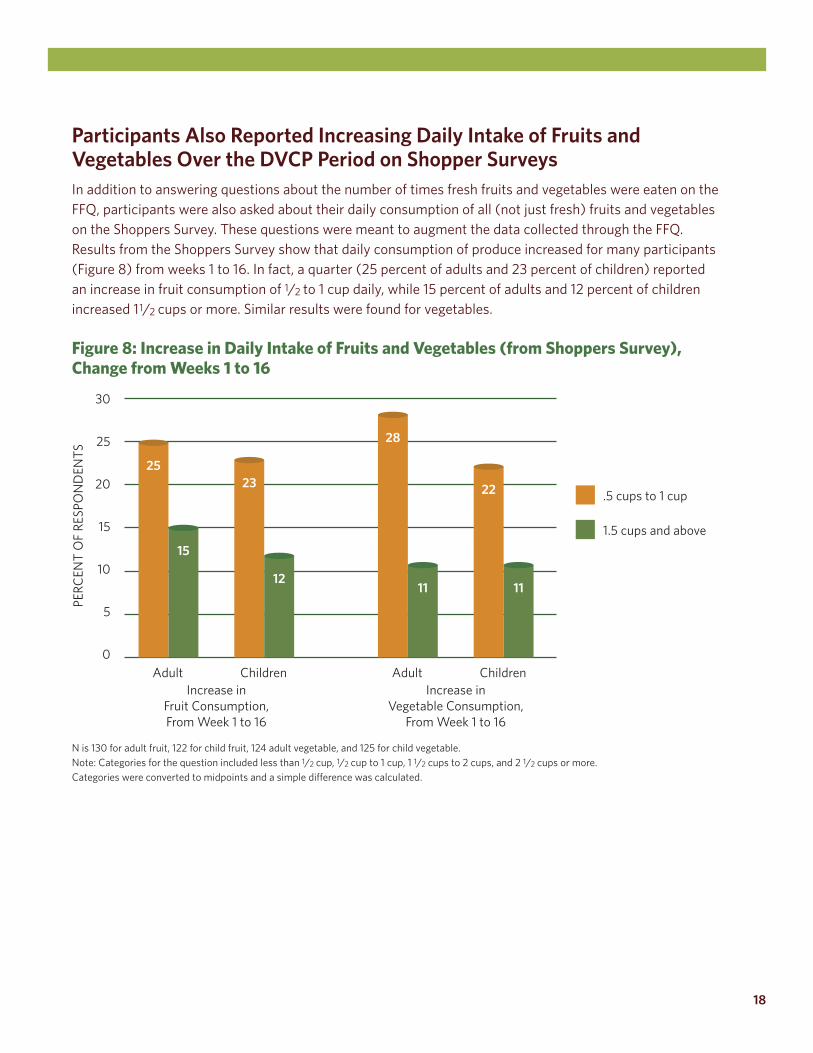
Participants Also Reported Increasing Daily Intake of Fruits and Vegetables Over the DVCP Period on Shopper SurveysIn addition to answering questions about the number of times fresh fruits and vegetables were eaten on the FFQ, participants were also asked about their daily consumption of all (not just fresh) fruits and vegetables on the Shoppers Survey. These questions were meant to augment the data collected through the FFQ. Results from the Shoppers Survey show that daily consumption of produce increased for many participants (Figure 8) from weeks 1 to 16. In fact, a quarter (25 percent of adults and 23 percent of children) reported an increase in fruit consumption of 1/2 to 1 cup daily, while 15 percent of adults and 12 percent of children increased 11/2 cups or more. Similar results were found for vegetables. Figure 8: Increase in Daily Intake of Fruits and Vegetables (from Shoppers Survey), Change from Weeks 1 to 16 N is 130 for adult fruit, 122 for child fruit, 124 adult vegetable, and 125 for child vegetable.Note: Categories for the question included less than 1/2 cup, 1/2 cup to 1 cup, 1 1/2 cups to 2 cups, and 2 1/2 cups or more. Categories were converted to midpoints and a simple difference was calculated.
18
30
25
20
15
10
5
0
PERC
ENT
OF
RESP
ON
DEN
TS
25
28
23 22
15
11 1112
Adult ChildrenIncrease in
Fruit Consumption, From Week 1 to 16
Adult ChildrenIncrease in
Vegetable Consumption, From Week 1 to 16
.5 cups to 1 cup
1.5 cups and above
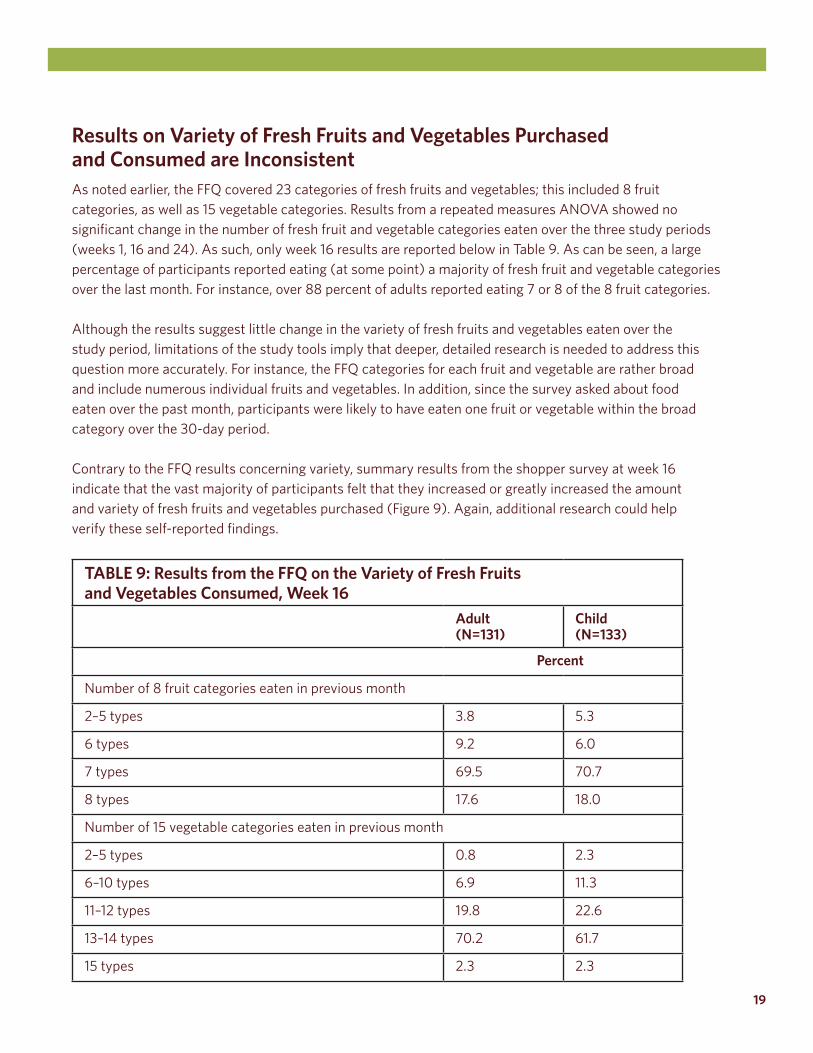
Results on Variety of Fresh Fruits and Vegetables Purchased and Consumed are InconsistentAs noted earlier, the FFQ covered 23 categories of fresh fruits and vegetables; this included 8 fruit categories, as well as 15 vegetable categories. Results from a repeated measures ANOVA showed no significant change in the number of fresh fruit and vegetable categories eaten over the three study periods (weeks 1, 16 and 24). As such, only week 16 results are reported below in Table 9. As can be seen, a large percentage of participants reported eating (at some point) a majority of fresh fruit and vegetable categories over the last month. For instance, over 88 percent of adults reported eating 7 or 8 of the 8 fruit categories.
Although the results suggest little change in the variety of fresh fruits and vegetables eaten over the study period, limitations of the study tools imply that deeper, detailed research is needed to address this question more accurately. For instance, the FFQ categories for each fruit and vegetable are rather broad and include numerous individual fruits and vegetables. In addition, since the survey asked about food eaten over the past month, participants were likely to have eaten one fruit or vegetable within the broad category over the 30-day period.
Contrary to the FFQ results concerning variety, summary results from the shopper survey at week 16 indicate that the vast majority of participants felt that they increased or greatly increased the amount and variety of fresh fruits and vegetables purchased (Figure 9). Again, additional research could help verify these self-reported findings.
TABLE 9: Results from the FFQ on the Variety of Fresh Fruits and Vegetables Consumed, Week 16
Adult (N=131)
Child (N=133)
Percent
Number of 8 fruit categories eaten in previous month
2–5 types 3.8 5.3
6 types 9.2 6.0
7 types 69.5 70.7
8 types 17.6 18.0
Number of 15 vegetable categories eaten in previous month
2–5 types 0.8 2.3
6–10 types 6.9 11.3
11–12 types 19.8 22.6
13–14 types 70.2 61.7
15 types 2.3 2.3
19
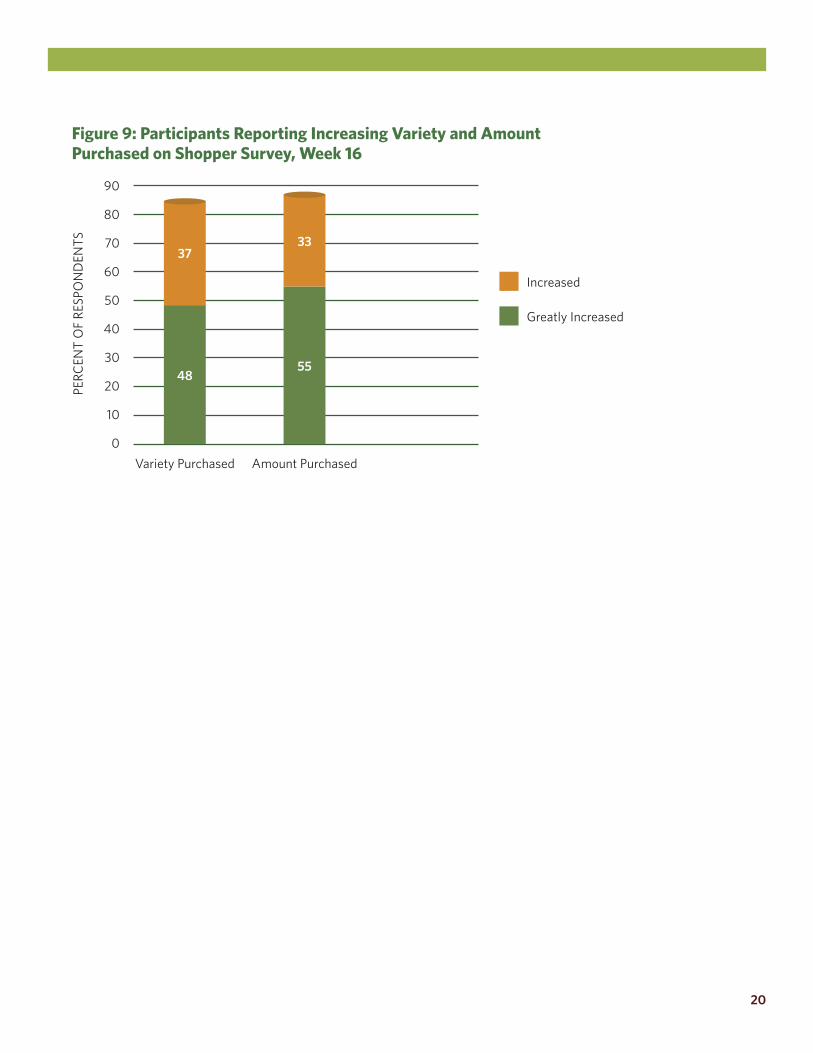
Figure 9: Participants Reporting Increasing Variety and Amount Purchased on Shopper Survey, Week 16
20
90
80
70
60
50
40
30
20
10
0
4855
3733
Variety Purchased Amount Purchased
PERC
ENT
OF
RESP
ON
DEN
TS
Increased
Greatly Increased
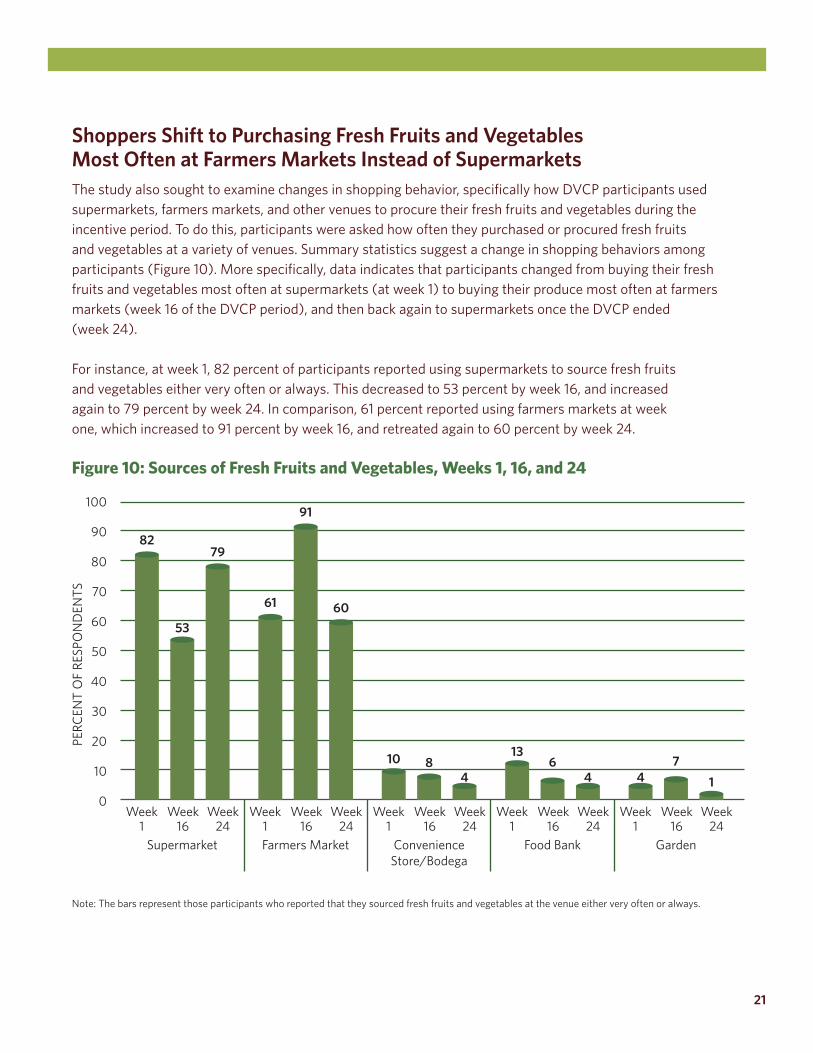
Shoppers Shift to Purchasing Fresh Fruits and Vegetables Most Often at Farmers Markets Instead of SupermarketsThe study also sought to examine changes in shopping behavior, specifically how DVCP participants used supermarkets, farmers markets, and other venues to procure their fresh fruits and vegetables during the incentive period. To do this, participants were asked how often they purchased or procured fresh fruits and vegetables at a variety of venues. Summary statistics suggest a change in shopping behaviors among participants (Figure 10). More specifically, data indicates that participants changed from buying their fresh fruits and vegetables most often at supermarkets (at week 1) to buying their produce most often at farmers markets (week 16 of the DVCP period), and then back again to supermarkets once the DVCP ended (week 24).
For instance, at week 1, 82 percent of participants reported using supermarkets to source fresh fruits and vegetables either very often or always. This decreased to 53 percent by week 16, and increased again to 79 percent by week 24. In comparison, 61 percent reported using farmers markets at week one, which increased to 91 percent by week 16, and retreated again to 60 percent by week 24. Figure 10: Sources of Fresh Fruits and Vegetables, Weeks 1, 16, and 24 Note: The bars represent those participants who reported that they sourced fresh fruits and vegetables at the venue either very often or always.
21
100
90
80
70
60
50
40
30
20
10
0
82
10
61
13
53
8 7
1
91
6
79
4 4 4
60
Week Week Week 1 16 24
Supermarket
Week Week Week 1 16 24
Convenience Store/Bodega
Week Week Week 1 16 24
Food Bank
Week Week Week 1 16 24
Garden
Week Week Week 1 16 24
Farmers Market
PERC
ENT
OF
RESP
ON
DEN
TS
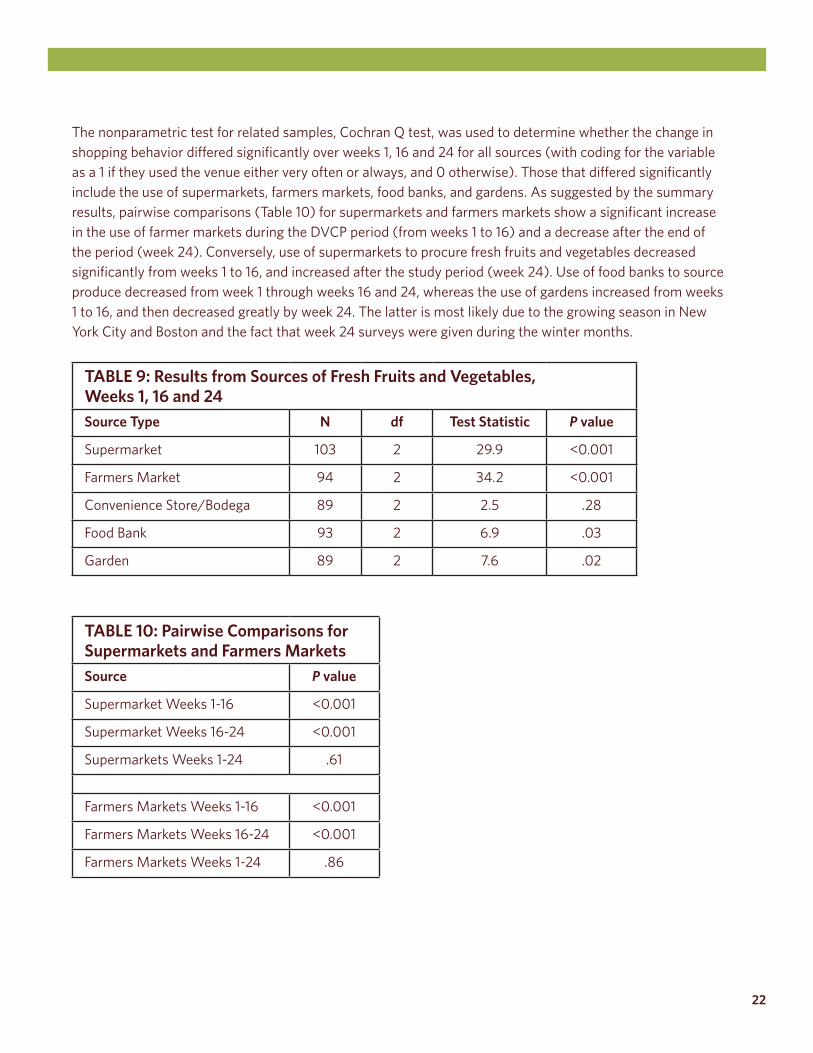
The nonparametric test for related samples, Cochran Q test, was used to determine whether the change in shopping behavior differed significantly over weeks 1, 16 and 24 for all sources (with coding for the variable as a 1 if they used the venue either very often or always, and 0 otherwise). Those that differed significantly include the use of supermarkets, farmers markets, food banks, and gardens. As suggested by the summary results, pairwise comparisons (Table 10) for supermarkets and farmers markets show a significant increase in the use of farmer markets during the DVCP period (from weeks 1 to 16) and a decrease after the end of the period (week 24). Conversely, use of supermarkets to procure fresh fruits and vegetables decreased significantly from weeks 1 to 16, and increased after the study period (week 24). Use of food banks to source produce decreased from week 1 through weeks 16 and 24, whereas the use of gardens increased from weeks 1 to 16, and then decreased greatly by week 24. The latter is most likely due to the growing season in New York City and Boston and the fact that week 24 surveys were given during the winter months.
TABLE 9: Results from Sources of Fresh Fruits and Vegetables, Weeks 1, 16 and 24 Source Type N df Test Statistic P value
Supermarket 103 2 29.9 <0.001
Farmers Market 94 2 34.2 <0.001
Convenience Store/Bodega 89 2 2.5 .28
Food Bank 93 2 6.9 .03
Garden 89 2 7.6 .02
TABLE 10: Pairwise Comparisons for Supermarkets and Farmers MarketsSource P value
Supermarket Weeks 1-16 <0.001
Supermarket Weeks 16-24 <0.001
Supermarkets Weeks 1-24 .61
Farmers Markets Weeks 1-16 <0.001
Farmers Markets Weeks 16-24 <0.001
Farmers Markets Weeks 1-24 .86
22
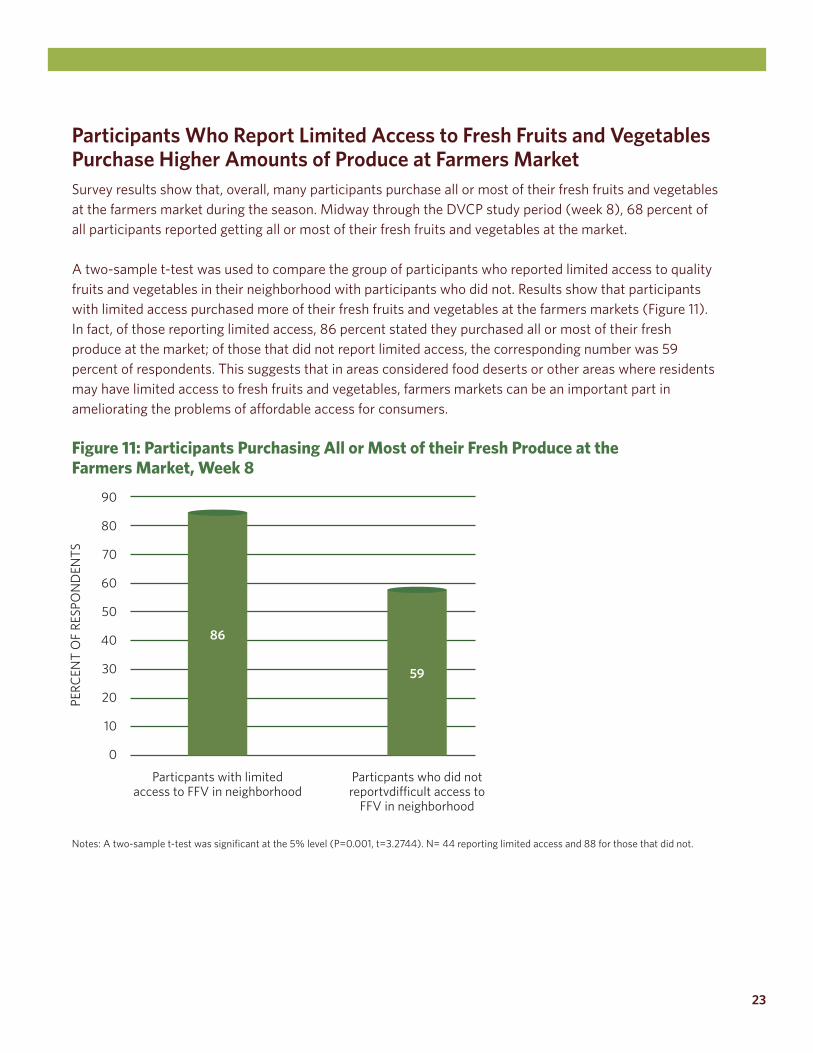
Participants Who Report Limited Access to Fresh Fruits and Vegetables Purchase Higher Amounts of Produce at Farmers MarketSurvey results show that, overall, many participants purchase all or most of their fresh fruits and vegetables at the farmers market during the season. Midway through the DVCP study period (week 8), 68 percent of all participants reported getting all or most of their fresh fruits and vegetables at the market.
A two-sample t-test was used to compare the group of participants who reported limited access to quality fruits and vegetables in their neighborhood with participants who did not. Results show that participants with limited access purchased more of their fresh fruits and vegetables at the farmers markets (Figure 11). In fact, of those reporting limited access, 86 percent stated they purchased all or most of their fresh produce at the market; of those that did not report limited access, the corresponding number was 59 percent of respondents. This suggests that in areas considered food deserts or other areas where residents may have limited access to fresh fruits and vegetables, farmers markets can be an important part in ameliorating the problems of affordable access for consumers. Figure 11: Participants Purchasing All or Most of their Fresh Produce at the Farmers Market, Week 8
Notes: A two-sample t-test was significant at the 5% level (P=0.001, t=3.2744). N= 44 reporting limited access and 88 for those that did not.
23
90
80
70
60
50
40
30
20
10
0
86
59
Particpants with limited access to FFV in neighborhood
Particpants who did not reportvdifficult access to
FFV in neighborhood
PERC
ENT
OF
RESP
ON
DEN
TS
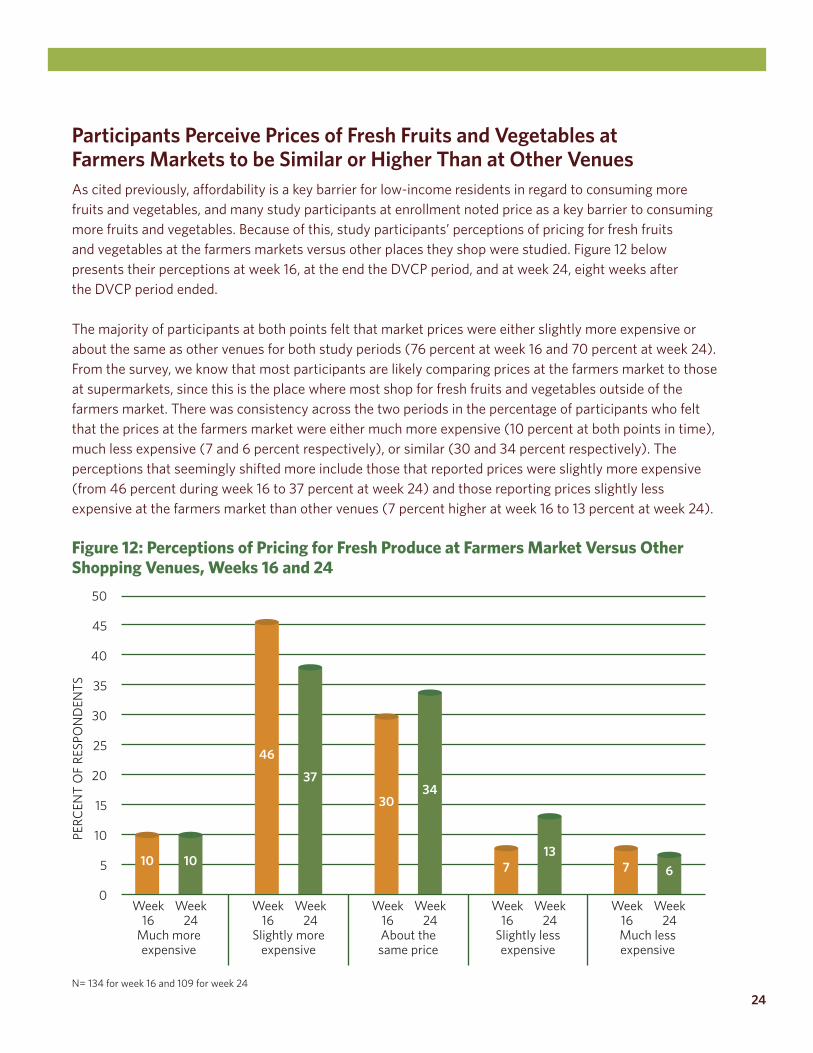
Participants Perceive Prices of Fresh Fruits and Vegetables at Farmers Markets to be Similar or Higher Than at Other VenuesAs cited previously, affordability is a key barrier for low-income residents in regard to consuming more fruits and vegetables, and many study participants at enrollment noted price as a key barrier to consuming more fruits and vegetables. Because of this, study participants’ perceptions of pricing for fresh fruits and vegetables at the farmers markets versus other places they shop were studied. Figure 12 below presents their perceptions at week 16, at the end the DVCP period, and at week 24, eight weeks after the DVCP period ended.
The majority of participants at both points felt that market prices were either slightly more expensive or about the same as other venues for both study periods (76 percent at week 16 and 70 percent at week 24). From the survey, we know that most participants are likely comparing prices at the farmers market to those at supermarkets, since this is the place where most shop for fresh fruits and vegetables outside of the farmers market. There was consistency across the two periods in the percentage of participants who felt that the prices at the farmers market were either much more expensive (10 percent at both points in time), much less expensive (7 and 6 percent respectively), or similar (30 and 34 percent respectively). The perceptions that seemingly shifted more include those that reported prices were slightly more expensive (from 46 percent during week 16 to 37 percent at week 24) and those reporting prices slightly less expensive at the farmers market than other venues (7 percent higher at week 16 to 13 percent at week 24). Figure 12: Perceptions of Pricing for Fresh Produce at Farmers Market Versus Other Shopping Venues, Weeks 16 and 24 N= 134 for week 16 and 109 for week 24
24
50
45
40
35
30
25
20
15
10
5
0
10
46
30
7 710
3734
13
6
Week Week 16 24
Much more expensive
Week Week 16 24
Slightly more expensive
Week Week 16 24
About the same price
Week Week 16 24
Slightly less expensive
Week Week 16 24
Much less expensive
PERC
ENT
OF
RESP
ON
DEN
TS
NEXT STEPS AND ACKNOWLEDGMENTS
Farmers markets and nutrition incentive programs, having quickly expanded in number over the last five years, are clearly playing a much needed role in linking fresh, healthful and affordable local food to people with low-incomes in many communities. Various studies are underway to look at the impact of these incentives on farmers, communities, local economies and participating consumers. In general, however, these studies are based on limited cross-sectional survey data. Many of the results suggest that the DVCP increases the use of federal nutrition benefits at participating markets substantially, and increases participants’ consumption of fruits and vegetables.
This summary report provides results of the Double Value Coupon Program Diet and Shopping Behavior Study, a longitudinal study designed to delve deeper into impacts of Wholesome Wave’s DVCP on participants’ fresh fruit and vegetable consumption and shopping behaviors. The study tracked 300 women and child dyads over 24 weeks at five farmers markets in three cities. The results suggest that the DVCP can positively increase fruit and vegetable consumption, as well as drive changes in shopping behavior. As suggested by the report, more examination of the data is needed to tease out a number of relationships that likely exist and can add further clarity and value to the study results.
This report was authored by Lydia Oberholtzer, Community & Food Systems Resources; Carolyn Dimitri, Department of Nutrition, Food Studies, and Public Health at New York University; and Michelle Zive, Child Development and Community Health, Department of Pediatrics, UC San Diego School of Medicine. All served as co-principal investigators on the study.
The authors would like to thank Rick Welsh (Syracuse University Department of Public Health, Food Studies and Nutrition) and Alexandra Evans (Health Promotion & Behavioral Sciences, UTHealth, The University of Texas Health Science Center at Houston, School of Public Health, Austin Regional Campus) for their review of the draft report.
We would also like to thank Wholesome Wave staff who helped make this research possible, especially Cristina Sandolo who oversaw implementation coordination for all the sites and Maggie Reynolds, the DVCP Program Manager. Thanks go to Samantha Bertini for layout and design, and to Ashley Gaudiano for copy editing. A special thanks to Michel Nischan for having the vision that this type of study was needed. At each study site, we would like to thank the coordinators, assessors, and partner contacts for their work on the study. For the Boston area site, this includes Cammy Watts (formerly of the Food Project in Massachusetts, and research associate with the project), and site coordinators Patricia Valderrama (also Spanish translator for both Boston and NYC sites), and Sergiy Barchuk (also Russian translator). For the New York City sites, site coordinators included Stephanie Rogus and Jeanne Koenig (both of NYU). For the San Diego site, UC San Diego’s Chelsea Fiss was the site coordinator, Keith Gaviola and Ninosthka Vasquez were assessors, and Jennifer Chandler oversaw administration. Wholesome Wave funded this study.
25
REFERENCES CITED
Blisard, N., Stewart, H. & Jolliffe, D. (2004). Low-income households’ expenditures on fruits and vegetables. (Agriculture Economic Report No. 833), U.S. Department of Agriculture, Economic Research Service: Washington, DC.
Bodor, J., Ulmer, V., Dunaway, L, Farley, T., & Rose, D. (2010). The rationale behind small food store interventions in low-income urban neighborhoods: Insights from New Orleans. Journal of Nutrition, 140(6): 1185-1188. doi:10.3945/jn.109.113
Diansheng, D., & Leibtag, E. (2010). Promoting fruit and vegetable consumption: Are coupons more effective than pure price discounts? (Economic Research Report No. (ERR-96), U.S. Department of Agriculture, Economic Research Service: Washington, D.C.
Dong, D., & Lin, B. (2009). Fruit and vegetable consumption by low‐income Americans: Would a price reduction make a difference? (ERS Report No. 70). U.S. Department of Agriculture, Economic Research Service: Washington, D.C.
Epstein, L., Gordy, C., Raynor, H., Beddome, M., Kilanowski, C., & Paluch, R. (2001). Increasing fruit and vegetable intake and decreasing fat and sugar intake in families at risk for childhood obesity. Obesity Research, 9(3): 171–178. doi: 10.1038/oby.2001.18
Evans, A., Jennings, R., Smiley, A., Medina, J., Sharma, S., Rutledge, R., Stigler, M., & Hoelscher, D. (2012). Introduction of farm stands in low-income communities increases fruit and vegetable consumption among community residents. Health & Place, 18:1137-1143.
Ford, E. & Mokdad, A. (2001). Fruit and vegetable consumption and diabetes mellitus incidence among U.S. adults. Preventative Medicine, 32(1): 33-9.
Guthrie, J., Lin, B., Ver Ploeg, M., & Frazao, E. (2007). Can food stamps do more to improve food choices? (EIB No. 29-1). U.S. Department of Agriculture, Economic Research Service: Washington, DC.
Herman. D., Harrison, G., Afifi, A., & Jenks, E. (2008). Effect of a targeted subsidy on intake of fruits and vegetables among low-income women in the Special Supplemental Nutrition Program for Women, Infants, and Children. American Journal of Public Health, 98(1): 98-105.
Laska, M., Borradaile, K., Tester, J., Foster, G., & Gittelsohn, J. (2010). Healthy food availability in small urban food stores: a comparison of four US cities. Public Health Nutrition, 13(7): 1031-1035. doi:10.1017/S1368980009992771.
Love, D. (2011). Farmers markets SNAP sales soar in 2010. Charlottesville, VA: Farmers Market Coalition. Retrieved from http://farmersmarketcoalition.org/snap-sales-soar-2010.
26
Lucan, S., Barg, F., & Long, J. (2010). Promoters and barriers to fruit, vegetable, and fast-food consumption among urban, low-income African Americans—A qualitative approach. American Journal of Public Health, 100(4): 631-635.
New York City Department of Health and Hygiene. (2010). Farmers’ markets initiatives: Promoting fresh fruits and vegetables in underserved communities 2010 report. On line at http://www.nyc.gov/html/doh/downloads/pdf/cdp/cdp-farmers-market-report.pdf (accessed 3/23/2011).
Ness, A & Powles, J. (1997). Fruit and vegetables, and cardiovascular disease: a review. International Journal of Epidemiology, 26(1): 1–13.
Powell, L., & Chaloupka, F. (2009). Food prices and obesity: Evidence and policy implications for taxes and subsidies, The Milbank Quarterly, 87(1): 229-257.
Racine, E., Vaughn, A., & Laditka, S. (2010). Farmers’ market use among African-American women participating in the Special Supplemental Nutrition Program for Women, Infants, and Children. Journal of the American Dietetic Association, 110(3): 441-446. doi:10.1016/j.jada.2009.11.019.
Rolls B, Ello-Martin, J. & Tohill, B. (2008). What can intervention studies tell us about the relationship between fruit and vegetable consumption and weight management? Nutrition Reviews 62(1): 1-17.
Stewart, H. & Blisard, N. (2008). Are lower income households willing and able to budget for fruits and vegetables? U.S. Department of Agriculture, Economic Research Service: Washington, D.C.
U.S. Department of Agriculture, (USDA). (2010). USDA releases guide to expand SNAP benefit electronic benefit technology at farmers markets. Press Release No. 0346.10. Washington D.C.: U.S. Department of Agriculture. June 26.
U.S. Department of Agriculture, Agricultural Marketing Service (USDA, AMS). (2012). Farmers market growth: 1994-2012. Retrieved from http://www.ams.usda.gov/AMSv1.0/ams.fetchTemplateData.do?template=TemplateS&navID=WholesaleandFarmersMarkets&leftNav=WholesaleandFarmersMarkets&page=WFMFarmersMarketGrowth&description=Farmers%20Market%20Growth&acct=frmrdirmkt
U.S. Department of Agriculture, Food and Nutrition Service (USDA, FNS). (2010). Supplemental Nutrition Service: Farmers’ market SNAP participants. Retrieved from http://www.fns.usda.gov/snap/ebt/ebt_ farmers_markstatus.htm
Wholesome Wave. (2012). Double Value Coupon Program: 2011 outcomes. Available at http://wholesomewave.org/wp-content/uploads/2012/06/Double-Value-Coupon- Program-2011-Outcomes.pdf.
27