Embed Size (px)
Citation preview

International Journal of Medical Physics, Clinical Engineering and Radiation Oncology, 2013, 2, 30-38 Published Online February 2013 (http://www.scirp.org/journal/ijmpcero) http://dx.doi.org/10.4236/ijmpcero.2013.21005
Copyright © 2013 SciRes. IJMPCERO
Dosimetric Comparison of Craniospinal Axis Irradiation (CSI) Treatments Using Helical Tomotherapy, SmartarcTM,
and 3D Conventional Radiation Therapy*
Pamela Myers, Sotirios Stathakis, Alonso N. Gutiérrez, Carlos Esquivel, Panayiotis Mavroidis, Niko Papanikolaou
Departments of Radiology and Radiation Oncology, Cancer Therapy and Research Center, University of Texas Health Science Center, San Antonio, USA
Email: [email protected]
Received August 4, 2012; revised September 7, 2012; accepted September 15, 2012
ABSTRACT
Purpose: Craniospinal axis irradiation (CSI) is a method of treating various central nervous system malignancies. The large target volume typically includes entire spinal cord and whole brain. Dosimetric comparison was performed be- tween tomotherapy, volumetric modulated arc therapy (VMAT), and 3D conformal radiation therapy (3D-CRT) for CSI. Methods and Materials: Five (n = 5) CSI patients were planned using 3D-CRT, VMAT, and tomotherapy (normalized such that 95% of PTV received at least 23.4 Gy in 13 fractions). Plans were compared using PTV conformity number (CN) and homogeneity index (HI), normal tissue (NT) dose statistics, integral dose, and treatment time. Results: On average, tomotherapy plans showed higher CN (0.932 vs. 0.860 and 0.672 for SmartArc and 3D-CRT). In terms of HI, VMAT plans consistently showed better dose homogeneity (1.07 vs. 1.15 and 1.13 for tomotherapy and 3D-CRT). SmartArc delivered lower maximum dose for majority of NT, but higher mean dose. 3D-CRT plans delivered higher maximum dose but lower mean dose to NT. Conclusions: SmartArc treatments achieved better PTV homogeneity and reduced maximum dose to NT. Tomotherapy showed better target conformity, but 3D-CRT was shown to reduce mean dose to NT. Integral doses were similar between treatment modalities, but tomotherapy treatment times were much longer. Keywords: CSI; TomoTherapy; SmartArc; Medulloblastoma
1. Introduction
Pediatric cases of central nervous system (CNS) tumors account for 20% - 25% of all cancer malignancies that occur in this age group of 0 - 19 years. Of these pediatric CNS tumors, medulloblastoma accounts for 15% - 20% of occurrences [1]. For infants, medulloblastoma makes up 20% - 40% of all CNS tumors. Craniospinal irradia- tion (CSI) is a necessary method of treatment for many CNS malignancies. The target for CSI consists of the whole brain, spinal cord, and overlying meninges and is typically prescribed a dose of 23.4 Gy for disease of ave- rage-risk. Along with a boost to the posterior fossa and chemotherapy, this CSI treatment allows for a five-year survival of 80% or better [2,3]. Radiation therapy, while beneficial, has long-term side effects with regards to the patient’s hearing, endocrine function, and cognitive abili- ties [2]. In order to minimize these future complications and better the long-term outcome for medulloblastoma
patients, it is imperative that the most conformal treat- ment modality be used in order to spare the surrounding critical structures.
With traditional three-dimensional conformal radiation therapy (3D-CRT), two lateral fields are used to treat the brain and a posterior spinal field [4]. The posterior spinal field may consist of two fields in order to encompass the entire spinal axis. Careful planning must be done in order to properly match the fields between the brain and spinal cord. In order to avoid over dosage or under dosage of the cervical spine, a “moving junction” is often employed between the fields of the brain and spinal cord. Angling the brain fields, using a half beam block for the two lat- eral brain fields, and rotating the couch are other meth- ods that are used to solve the homogeneity problem as well [1].
Because helical tomotherapy is able to treat longer, continuous fields by allowing the couch to move through the bore as it rotates, field matching is not a problem as it is with 3D-CRT. Tomotherapy has a wide range of beam angles that can be employed in order to obtain a more
*Conflict of Interest Statement: There are no conflicts of interest with regards to this manuscript.

P. MYERS ET AL. 31
conformal dose to the target area, which is ideal for pedi- atric cases in which the patient’s future is highly con- cerning. Sharma et al. reported that tomotherapy was superior to using intensity modulated radiation therapy (IMRT) as well as 3D-CRT in terms of greater homoge- neity to the spine area, conformality of dose in the brain, as well as achieving reduced maximum, mean, and inte- gral doses to many organs at risk [5]. Helical tomother- apy has been shown to produce better dosimetric results when compared with conformal arc therapy for vestibular schwannomas, but this may not be necessarily true for other treatment sites and must be tested [6].
Similar to tomotherapy, volume modulated arc therapy (VMAT) can deliver radiation in an arc motion. VMAT uses a cone beam that rotates around the patient in order to create a conformal dose in the target area and spare the surrounding critical structures. VMAT techniques also have the ability to reduce field junction difficulties that are encountered in conventional treatments by account- ing for the overlapping area between arcs during the process of optimization. The VMAT technique has been shown to improve dosimetry as well as reduce treatment time when compared to conventional IMRT [7]. When treating CSI pediatric patients, these benefits are ex- tremely useful considering any reduction in treatment time can decrease patient movement errors and increase patient comfort and is therefore important to consider.
In this study we aimed to determine the most effective method of delivering CSI treatments based on target coverage and homogeneity, beam-on time, as well as surrounding organ dose statistics. Although there have been papers published on the subject of craniospinal irra- diation using different delivery methods, the three meth- ods studied here have not been thoroughly compared and analyzed using the same patients and similar optimiza- tion criteria [5,8,9]. By comparing three different treat- ment techniques, we can ensure that patients are being treated with the most effective plans while minimizing normal tissue complications. Due to the complexity of conventional treatment techniques based on field junc- tions, developing new ways of treatment delivery using more modern IMRT techniques is essential. Using more advanced forms of treatment may also lead to better pa- tient outcomes as well as better patient comfort through- out treatment which is a critical aspect of any course of treatment.
2. Materials and Methods
Five random patients (n = 5) were chosen for this project that were previously treated with a TomoTherapy Hi-Art (TomoTherapy Inc., Madison, WI) unit. A single radia- tion oncologist contoured the target volumes and organs at risk in the Pinnacle3 Treatment Planning System (TPS) (Philips Medical, Fitchburg, WI). These contours were
then exported to the tomotherapy TPS. The contoured organs included the brain, spinal canal, liver, heart, colon, orbits, lungs, kidneys, thyroid, and breasts for the female patients. Plans for the same patients were also created for SmartArc and 3D conformal deliveries using the Pinna- cle3 TPS. For all patients, the planning target volume (PTV) was obtained as the union of the spinal canal after isotropic expansion by 0.7 cm and the brain with no ex- pansion. The prescription was such that 95% of the PTV would receive at least 23.4 Gy in 13 fractions. Objectives for tomotherapy and SmartArc plans were placed on the: PTV, liver, heart, colon, orbits, lungs, kidneys, thyroid, and breasts for the female patients.
2.1. Tomotherapy
The tomotherapy plans were optimized using field width of 5.02 cm, pitch of 0.287 to minimize the thread effect [10] and a modulation factor of 2.0 were used during optimization. A “NORMAL” dose grid, which in our case corresponds to 0.375 × 0.375 × 0.25 cm3 voxels, was used during dose calculation. An example of objec- tives used during optimization is shown in Table 1. These objectives varied depending on the patient and through- out the optimization in order to achieve an optimal plan.
2.2. SmartArc
The SmartArc plans, were optimized using two arcs, a superior and inferior arc as shown in Figure 1. A Varian 21EX linear accelerator (Varian Medical Systems, Palo Alto, CA) equipped with 120 millennium leaf multileaf collimator (MLC) was chosen for the optimization. The placement of the two isocenters was determined by the superior-inferior length of the PTV.
Both arcs were optimized with a gantry rotation span from 1 to 359 degrees, and a final gantry angle spacing of 4 degrees. Both arcs used a 6MV photon beam, and Table 1. An example of optimization parameters for tomo- therapy plans.
Structure Maximum Dose DVH Constraint
PTV 23.4 Gy 95% volume ≥ 23.4 Gy
Liver 10.0 Gy 10% volume < 6.0 Gy
Heart 9.0 Gy 10% volume < 6.0 Gy
Colon 7.0 Gy 10% volume < 6.0 Gy
Left & Right Orbits 16.0 Gy 10% volume < 15.0 Gy
Left & Right Lungs 15.0 Gy 10% volume < 12.0 Gy
Left & Right Kidneys 12.0 Gy 10% volume < 9.0 Gy
Thyroid 12.0 Gy 10% volume < 9.0 Gy
Left & Right Breasts 3.0 Gy 10% volume < 2.0 Gy
Copyright © 2013 SciRes. IJMPCERO

P. MYERS ET AL. 32
Table 2 shows the field sizes and collimator rotations for each of the five patient plans in this study. Similar objec- tives to those used in the tomotherapy (Table 1) planning for the surrounding critical organs were used to optimize the SmartArc plans. A dose grid that covered the entire patient was selected for each plan using a 0.3 × 0.3 × 0.3 cm3 voxel size. After optimization was completed, the plans were normalized such that 95% of the PTV re- ceived the prescription of 23.4 Gy in 13 fractions.
2.3. 3D Conformal Radiation Therapy
The 3D conformal treatment plans were also created with the Pinnacle3 TPS. Two lateral, opposing brain fields and one posterior spinal field were used in each plan using 6MV photon beams as shown in Figure 2. As mentioned in the Introduction, two spinal fields are sometimes nece- ssary based on the length of the PTV. For this study, none of the five patients required this extra spine field to cover the PTV. Using techniques such as extended sour- ce to surface distance (SSD) adequate PTV coverage was obtained with a single spinal field on all patients evalu- ated in this study. Blocks were drawn to shield the face of the patient for each of the brain fields and were im- plemented using the 120-leaf MLC. The collimator rota- tion for the lateral brain fields was adjusted in order to match the divergence of the posterior spinal field. The gantry angle was also rotated in order to avoid diver- gence of the brain fields into the orbits of the patient. The “gap match” technique, or locating the 50% isodose line at a point on the anterior of the spinal cord, was used at the junction of the brain and spinal fields as described by Khan [11].
Two prescriptions were set to deliver 23.4 Gy to two calculation points, one each in the brain and spinal cord, and the plan was normalized so that 95% of the PTV received at least the prescription dose in 13 fractions for comparison with the two other delivery methods.
2.4. Comparison
The Tomotherapy, SmartArc, and 3D-CRT plans were Table 2. SmartArc plan parameters for each of the five pa- tients.
Superior Arc Inferior Arc Patient Number Collimator
Rotation Field Size (cm) X/Y
Collimator Rotation
Field Size (cm) X/Y
1 180 23.1/35.0 180 8.5/32.0
2 185 21.8/36.0 185 14.0/32.0
3 175 26.7/40.0 185 17.3/39.0
4 180 20.9/28.5 180 18.1/37.0
5 175 20.8/29.0 185 18.0/40.0
Figure 1. Beam setup for a sample SmartArc CSI treatment plan.
Figure 2. Beam arrangement for a sample 3D-CRT CSI treatment plan. compared based on PTV conformity number (CN), PTV dose homogeneity index (HI), normal tissue dose statis- tics, integral dose and overall treatment time. The CN was used to quantify the ability of the treatment method to cover the PTV with the prescribed dose as well as how well the normal tissue surrounding the target was spared. The equation used for CN is shown below in Equation (1):
2PTV,pres
PTV pres
VCN
V V
(1)
where VPTV,pres is the defined as the volume of the PTV that is receiving at least the prescribed dose, VPTV is the volume of the PTV or target, and Vpres is the total volume receiving at least the prescribed dose [12]. The ideal CN is a value of 1.0 indicating optimal coverage and sparing.
The HI was used to quantify the uniformity of the dose over the PTV volume. Areas of over- or under-dosage
Copyright © 2013 SciRes. IJMPCERO

P. MYERS ET AL. 33
must be avoided in order most advantageously treat the patient’s disease. The HI was calculated for each plan as shown below in Equation (2):
max
pres
DHI=
D (2)
where Dmax is the maximum dose deposited to 1% of the PTV and Dpres is the prescribed dose [13]. The ideal HI value is 1.0 which would indicate a perfectly homoge- neous plan in the PTV region.
Normal tissue dose statistics were also used to com- pare the two treatment methods in order to assess the treatment technique’s ability to limit dose to the sur- rounding critical structures. These statistics included the mean dose and maximum dose to the following struc- tures: total lungs, total kidneys, thyroid, heart, liver, co- lon, and total breasts for female patients.
Integral dose (ID) was also chosen as part of the plan evaluation parameters. ID was computed based on the averaged organ density, averaged organ dose and volume as defined in Equation (3) as follows [14]:
ID D V (3)
where D is the averaged organ dose, is the aver- aged organ density, and V is the organ volume.
Beam-on time of each respective tomotherapy, 3D- CRT, and SmartArc plan was obtained and compared against one another. The beam-on times were obtained from the plan reports for tomotherapy and SmartArc plans from their respective TPS. Assuming a dose rate of 600 monitor units per minute for the 3D-CRT plans, the beam-on time was then estimated for comparison with tomotherapy and SmartArc using the monitor units for each plan obtained from the TPS. Total in-room patient time was also calculated taking into consideration time to get the patient in and out of the room, setup time, time due to isocenter shifting, and imaging time.
3. Results
Figures 3 and 4 show an example comparison of dose distributions for the same patient from: 1) a tomotherapy plan; 2) a SmartArc plan; 3) a 3D-CRT plan. The PTV, shown colorwashed in the above figure, is 95% covered by the 23.4 Gy isodose line for each technique. Isodose lines of 110%, 105%, 100%, 95%, 70%, and 50% of the prescribed dose are also displayed in the figure.
Figures 5 and 6 show a chart summary of the CN and HI values for each of the five patient plans based on the technique used as well as the average for each technique. Figure 7 shows an example dose volume histogram (DVH) for the PTV for one patient. On average, Smart- Arc had HI values closer to 1.0 (1.075 vs. 1.149 and 1.130), which indicates better uniformity throughout the
Figure 3. Example sagittal dose distribution for the same patient on: (a) tomotherapy; (b) SmartArc; (c) 3D-CRT.
Figure 4. Example axial dose distribution for the same pa- tient on: (a) Tomotherapy; (b) SmartArc; (c) 3D-CRT.
Figure 5. Chart of the CN values for each of the 5 patients and an average for each method.
Copyright © 2013 SciRes. IJMPCERO

P. MYERS ET AL. 34
Figure 6. Chart of the HI values for each of the 5 patients and an average for each method.
Figure 7. Example PTV DVH for one patient. PTV for SmartArc plans. Tomotherapy, however, on ave- rage had better CN values (0.932 vs. 0.860 and 0.672) indicating better coverage of the target and sparing of the surrounding critical structures. The 3D-CRT plans over- all had the poorest performing conformity and homoge- neity values. Figure 7 shows an example dose volume histogram (DVH) for the PTV for one patient.
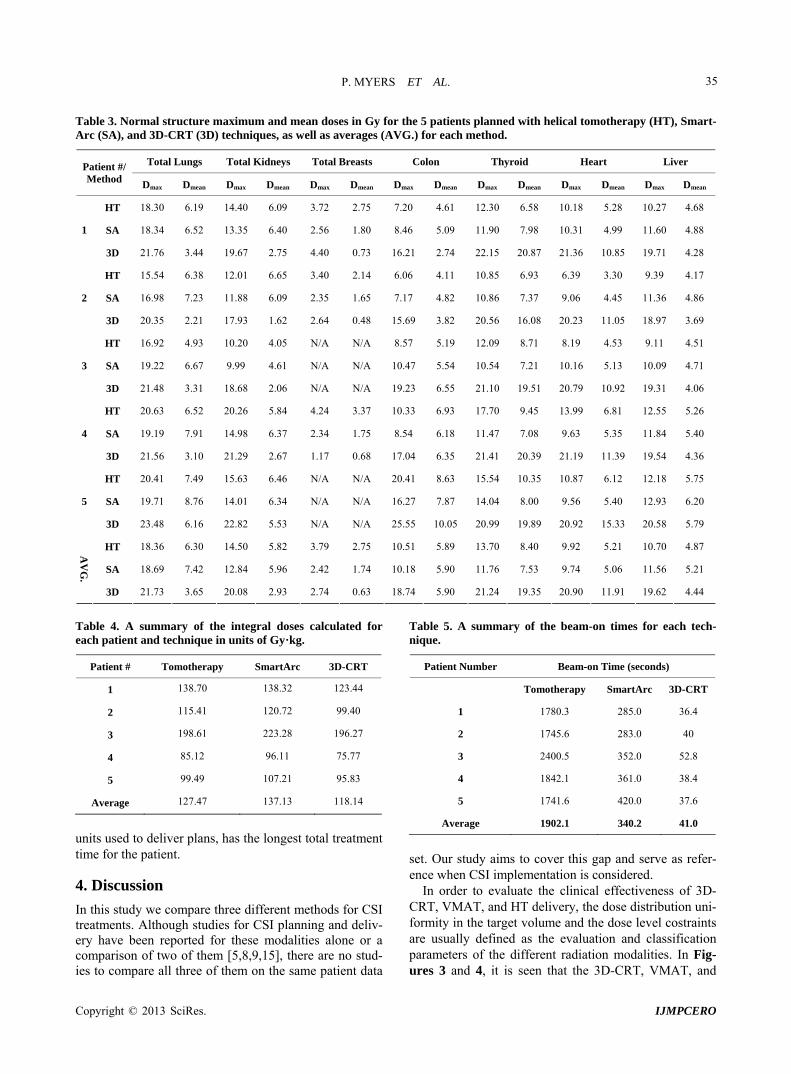
Table 3 shows a summary of the mean and maximum doses to the surrounding critical structures as well as their averages. On average, SmartArc delivers lower ab- solute maximum dose values to each of the surrounding critical structures while 3D-CRT delivers the highest ma- ximum dose on average. 3D-CRT, however, has lower mean dose values to the critical structures on average, and SmartArc has the highest average mean doses overall. Figure 8 shows this in an example DVH of the total lung dose for one patient.
Table 4 shows a summary of the integral doses calcu- lated for each of the five patients for each treatment me- thod. On average, the three treatment methods have simi- lar integral dose values. 3D-CRT provided the lowest average integral dose values while SmartArc plans show- ed the highest overall values.
Table 5 shows a summary of the beam-on times for each of the three methods for each patient and an average. The tomotherapy and SmartArc beam-on times were taken from the plan reports generated from the tomo- therapy and Pinnacle TPS. The beam-on times for the 3D-CRT plans were estimated by taking the total monitor units for each plans and using a dose rate of 600 monitor
Figure 8. Example total lung DVH for one patient. units per minute. Beam-on times for 3D-CRT were sig- nificantly shorter than those for tomotherapy and Smar- tArc plans (41.0 seconds vs. 1902.1 and 340.2 seconds). It should be mentioned that in the case of the 3D-CRT, one should consider the time necessary for the beam setup for each of the fields as well as the time for setup of the second isocenter. Tomotherapy treatment times are significantly longer which must be taken into account for the patient’s comfort as well as patient movement during the treatment. Faster treatment times ensure more effi- ciency in the clinic as well as greater patient comfort and less risk for patient movement that will negatively affect the patient’s treatment accuracy.
Table 6 shows a summary of the additional in-room patient times that were added to the beam-on times and the better estimate of the total treatment time for the pa- tient. The times reported are average times based on our clinic for each treatment method and are added to the average beam on time from Table 5 in order to report the overall, average treatment time for the patient. Patient in/out time consists of the time required to bring the pa- tient to the treatment room, time for the patient to change into and back out of a gown, and the time to exit the treatment room. Initial setup time is the amount of time, on average, that the therapist at our clinic uses to setup the patient according to the patient marks and the local- ization lasers in the treatment room. Imaging/registration time is the time needed by the therapist to image the pa- tient and correct the patient’s setup location based on the image acquired. This time varies between the three mo- dalities due to the differences in types of imaging per- formed. Tomotherapy utilizes a helical, MVCT image, SmartArc would use a kV cone beam computed tomo- graphy (kV-CBCT) image, and 3D-CRT uses two, one lateral brain and one posterior spinal field, electronic portal imaging device (EPID) images for patient registra- tion. Isocenter shift time is required for SmartArc and 3D-CRT treatments due to the multiple isocenters used, whereas tomotherapy is able to treat the patient without needing to shift during the treatment. On average, SmartArc and 3D-CRT have comparable total treatment times. Tomotherapy, due to the large number of monitor
Copyright © 2013 SciRes. IJMPCERO
P. MYERS ET AL.
Copyright © 2013 SciRes. IJMPCERO
35
Table 3. Normal structure maximum and mean doses in Gy for the 5 patients planned with helical tomotherapy (HT), Smart- Arc (SA), and 3D-CRT (3D) techniques, as well as averages (AVG.) for each method.
Total Lungs Total Kidneys Total Breasts Colon Thyroid Heart Liver
Patient #/ Method Dmax
Dmean Dmax Dmean Dmax Dmean Dmax Dmean Dmax Dmean Dmax Dmean Dmax Dmean
HT 18.30 6.19 14.40 6.09 3.72 2.75 7.20 4.61 12.30 6.58 10.18 5.28 10.27 4.68
SA 18.34 6.52 13.35 6.40 2.56 1.80 8.46 5.09 11.90 7.98 10.31 4.99 11.60 4.88 1
3D 21.76 3.44 19.67 2.75 4.40 0.73 16.21 2.74 22.15 20.87 21.36 10.85 19.71 4.28
HT 15.54 6.38 12.01 6.65 3.40 2.14 6.06 4.11 10.85 6.93 6.39 3.30 9.39 4.17
SA 16.98 7.23 11.88 6.09 2.35 1.65 7.17 4.82 10.86 7.37 9.06 4.45 11.36 4.86 2
3D 20.35 2.21 17.93 1.62 2.64 0.48 15.69 3.82 20.56 16.08 20.23 11.05 18.97 3.69
HT 16.92 4.93 10.20 4.05 N/A N/A 8.57 5.19 12.09 8.71 8.19 4.53 9.11 4.51
SA 19.22 6.67 9.99 4.61 N/A N/A 10.47 5.54 10.54 7.21 10.16 5.13 10.09 4.71 3
3D 21.48 3.31 18.68 2.06 N/A N/A 19.23 6.55 21.10 19.51 20.79 10.92 19.31 4.06
HT 20.63 6.52 20.26 5.84 4.24 3.37 10.33 6.93 17.70 9.45 13.99 6.81 12.55 5.26
SA 19.19 7.91 14.98 6.37 2.34 1.75 8.54 6.18 11.47 7.08 9.63 5.35 11.84 5.40 4
3D 21.56 3.10 21.29 2.67 1.17 0.68 17.04 6.35 21.41 20.39 21.19 11.39 19.54 4.36
HT 20.41 7.49 15.63 6.46 N/A N/A 20.41 8.63 15.54 10.35 10.87 6.12 12.18 5.75
SA 19.71 8.76 14.01 6.34 N/A N/A 16.27 7.87 14.04 8.00 9.56 5.40 12.93 6.20 5
3D 23.48 6.16 22.82 5.53 N/A N/A 25.55 10.05 20.99 19.89 20.92 15.33 20.58 5.79
HT 18.36 6.30 14.50 5.82 3.79 2.75 10.51 5.89 13.70 8.40 9.92 5.21 10.70 4.87
SA 18.69 7.42 12.84 5.96 2.42 1.74 10.18 5.90 11.76 7.53 9.74 5.06 11.56 5.21
AV
G.
3D 21.73 3.65 20.08 2.93 2.74 0.63 18.74 5.90 21.24 19.35 20.90 11.91 19.62 4.44
Table 4. A summary of the integral doses calculated for each patient and technique in units of Gy·kg.
Patient # Tomotherapy SmartArc 3D-CRT
1 138.70 138.32 123.44
2 115.41 120.72 99.40
3 198.61 223.28 196.27
4 85.12 96.11 75.77
5 99.49 107.21 95.83
Average 127.47 137.13 118.14
units used to deliver plans, has the longest total treatment time for the patient.
4. Discussion
In this study we compare three different methods for CSI treatments. Although studies for CSI planning and deliv- ery have been reported for these modalities alone or a comparison of two of them [5,8,9,15], there are no stud- ies to compare all three of them on the same patient data
Table 5. A summary of the beam-on times for each tech- nique.
Patient Number Beam-on Time (seconds)
Tomotherapy SmartArc 3D-CRT
1 1780.3 285.0 36.4
2 1745.6 283.0 40
3 2400.5 352.0 52.8
4 1842.1 361.0 38.4
5 1741.6 420.0 37.6
Average 1902.1 340.2 41.0
set. Our study aims to cover this gap and serve as refer- ence when CSI implementation is considered.
In order to evaluate the clinical effectiveness of 3D- CRT, VMAT, and HT delivery, the dose distribution uni- formity in the target volume and the dose level costraints are usually defined as the evaluation and classification parameters of the different radiation modalities. In Fig-ures 3 and 4, it is seen that the 3D-CRT, VMAT, and

P. MYERS ET AL. 36
Table 6. A summary of the treatment times for each tech- nique.
Time Factor Tomotherapy
(seconds) SmartArc (seconds)
3D-CRT (seconds)
Patient in/out 480 ± 60 480 ± 60 480 ± 60
Initial Setup 300 ± 30 300 ± 30 300 ± 30
Imaging/Registration 720 ± 60 480 ± 120 360 ± 30
Isocenter Shift 0 90 ± 10 90 ± 10
Average Beam-on 1902 ± 281 340 ± 58 41 ± 7
Average Treatment 3402.1 ± 295 1690.2 ± 150 1271.0 ± 138
HT plans, were forced to cover the PTV with the pre- scribed dose as mentioned in the Materials and Methods section. However, the involved OARs are better spared with the VMAT and the HT compared to the 3D-CRT in most cases. An exception is the total breast Dmax and Dmean where 3D-CRT shows lower breast doses on ave- rage. These results are in agreement with the results re- ported by others [5,9].
As seen in Figure 5 the conformity was highest for all the HT plans. The SmartArc plans had the second best conformality. The conformity index for HT, SmartArc and 3D CRT plans was 0.93 ± 0.02, 0.86 ± 0.03, and 0.67 ± 0.07. The 3D-CRT plans are inferior because the volu- me receiving the prescription dose is much larger than the PTV. In fact, as the data suggests, the volume of healthy tissue receiving the prescribed dose is approxi- mately 25% more that in the case of 3D-CRT when com- pared to HT and 20% when compared to SmartArc. As shown in Figures 3 and 4, in order to cover the anterior of the spinal canal, PTV hot spots on the order of 130% can exist in the normal tissue. These results are in agree- ment with published results [16-18] for comparisons be- tween HT and 3D-CRT and VMAT and 3DCRT.
Our results from Figure 6 show that HT and VMAT may produce dose distributions with homogeneous doses to the PTV while 3D-CRT had the worst homogeneity. From the five patient plans, the SmartArc plans were the most homogeneous while the HT and 3D-CRT homoge- neity was comparable between them. Only one of the pa- tients showed higher homogeneity index for the HT plans. Similar results on HT and 3D-CRT comparison are re-ported in the literature [14,16,18] and by Lee et al. [17] on comparison between VMAT and 3D-CRT for CSI plans.
Table 4 displays the results of the integral dose calcu- lations for each patient and each treatment method as well as the overall average for each treatment method. These whole body integral doses were tabulated using a normal tissue volume of the patient, taken to be from the top of the head to approximately 5 cm below the end of the spinal cord, and the average density of this volume.
The results indicate that the whole body integral dose is lower for the 3D-CRT treatment technique followed by tomotherapy and SmartArc with the overall highest inte- gral dose. The findings here are similar to those found by Penagaricano, et al. [19] for the cases of conventional and helical delivery.
Three of the five patients used for this study were fe- male patients and therefore breasts were contoured in order to be considered for this study. The breasts for young, developing females should be considered during treatment planning as was discussed by one of our physi- cians. The treatment modalities did not play a significant role in how much dose was delivered to the breasts. Due to the very low doses received by these organs, they did not significantly impact the optimization for any of the treatment modalities and therefore the data presented is used more to monitor dose they may receive and verify that they will not receive any highly significant amount of dose. Therefore, we do not believe the treatment mo- dality decision will need to be altered based on these organs.
The beam-on time and overall treatment time plays a crucial role in patient comfort, patient movement during the treatment, and efficiency for the clinic. Because of its importance to the patient as well as the clinic, treatment time must be taken into account when comparing differ- ent treatment modalities. Table 5 gives the beam-on times for each patient based on each method. On average beam-on time is comparable for 3D-CRT and SmartArc plans, and significantly longer for tomotherapy (41.0 and 340.2 vs. 1902.1 seconds). However, beam-on time is not necessarily representative of the total time the patient will spend in the treatment room. Factors such as shifting patients during treatment to different isocenters, couch shifts, gantry rotations, and patient setup and imaging must be considered for timing purposes (Table 6). Dur- ing the 3D-CRT and SmartArc treatments, a patient is initially setup at one isocenter and imaged and treated, and then the therapist must enter the treatment room to move the patient to the next isocenter. Including the av- erage beam-on times, the total treatment time would be approximately 1271.0 seconds for 3D-CRT and 1690.2 seconds for SmartArc (assuming one spinal field for the 3D-CRT plans as was the case for all of the patients in this study). This assumes one spinal field for the 3D- CRT plans as was the case for all of the patients in this study. It is important to note however that the values for the 3D-CRT plans in Table 6 for isocenter shift and im- aging/registration times would have to be doubled if a second spinal field is required, and therefore this would add approximately 450 seconds to the overall treatment time for conventional plans. Tomotherapy also requires image-guidance for patient setup, but may not require an interruption in the treatment due to its ability to treat long
Copyright © 2013 SciRes. IJMPCERO

P. MYERS ET AL. 37
fields without shifting isocenters. Some institutions, how- ever, split longer tomotherapy treatment deliveries into two deliveries so that the patient can be re-imaged half- way through the treatment to ensure the patient remains accurately positioned on the treatment couch. Without treatment interruption, total treatment time would be ap- proximately 3402.1 seconds. The need for patient seda- tion is another component that could affect the overall treatment time. Sedation is determined on a patient-by- patient basis and can add a considerable amount of time to the patient in the clinic. This time component however does not directly affect the time the patient is at the treatment unit and the length of time it takes to treat the patient. Sedation would cause the patient to require addi- tional time in pre-treatment clinical aspects. Because this time is common to the three methods discussed in this study, it is not considered to be a factor in the compari- son analysis. 3D-CRT and SmartArc treatment methods would be more advantageous than tomotherapy in terms of maximizing patient comfort and clinical efficiency while minimizing intrafraction patient movement.
5. Conclusion
The study served to show that SmartArc treatments achi- eve slightly better PTV homogeneity, and was noted to have reductions in maximum dose of selected organs at risk when compared to tomotherapy and 3D-CRT plans. Tomotherapy showed better target conformity. 3D-CRT plans were shown to have the poorest PTV conformity and homogeneity as well as the highest maximum doses to the surrounding organs. The mean dose values to the surrounding organs however, were shown to be lowest with the 3D-CRT plans. Beam on times are significantly greater for the tomotherapy plans as compared to the other two methods with the 3D-CRT treatments having the shortest beam-on time.
REFERENCES [1] E. C. Halperin, C. A. Perez and L. W. Brady, “Perez and
Brady’s Principles and Practice of Radiation Oncology,” 5th Edition, Wolters Kluwer Health/Lippincott Williams & Wilkins, Philadelphia, 2008.
[2] N. Gupta, A. Banerjee and D. Haas-Kogan, “Pediatric CNS Tumors,” 2nd Editon, Springer, Berlin, 2010.
[3] R. J. Packer, et al., “Phase III Study of Craniospinal Ra- diation Therapy Followed by Adjuvant Chemotherapy for Newly Diagnosed Average-Risk Medulloblastoma,” Jour- nal of clinical oncology, Vol. 24, No. 25, 2006, pp. 4202- 4208. doi:10.1200/JCO.2006.06.4980
[4] J. M. Michalski, E. E. Klein and R. Gerber, “Method to Plan, Administer, and Verify Supine Craniospinal Irradia- tion,” Journal of applied clinical medical physics, Vol. 3, No. 4, 2002, pp. 310-316. doi:10.1120/1.1508013
[5] D. S. Sharma, et al., “High-Precision Radiotherapy for
Craniospinal Irradiation: Evaluation of Three-Dimen- sional Conformal Radiotherapy, Intensity-Modulated Ra- diation Therapy and Helical TomoTherapy,” The British Journal of Radiology, Vol. 82, No. 984, 2009, pp. 1000- 1009. doi:10.1259/bjr/13776022
[6] T. F. Lee, et al., “Dosimetric Comparison of Helical To- motherapy and Dynamic Conformal Arc Therapy in Ste- reotactic Radiosurgery for Vestibular Schwannomas. Me- dical Dosimetry, Vol. 36, No. 1, 2011, pp. 62-70. doi:10.1016/j.meddos.2009.11.005
[7] C. C. Popescu, et al., “Volumetric Modulated Arc The- rapy Improves Dosimetry and Reduces Treatment Time Compared to Conventional Intensity-Modulated Radio- therapy for Locoregional Radiotherapy of Left-Sided Bre- ast Cancer and Internal Mammary Nodes,” International Journal of Radiation Oncology, Biology, Physics, Vol. 76, No. 1, 2010, pp. 287-295. doi:10.1016/j.ijrobp.2009.05.038
[8] A. Fogliata, et al., “Cranio-Spinal Irradiation with Volu- metric Modulated Arc Therapy: A Multi-Institutional Treatment Experience,” Radiotherapy and Oncology, Vol. 99, No. 1, 2011, pp. 79-85. doi:10.1016/j.radonc.2011.01.023
[9] M. Yoon, et al., “Craniospinal Irradiation Techniques: A Dosimetric Comparison of Proton Beams with Standard and Advanced Photon Radiotherapy,” International Jour- nal of Radiation Oncology, Biology, Physics, Vol. 81, No. 3, 2011, pp. 637-646. doi:10.1016/j.ijrobp.2010.06.039
[10] M. W. Kissick, et al., “The Helical Tomotherapy Thread Effect,” Medical Physics, Vol. 32, No. 5, 2005, pp. 1414- 1423. doi:10.1118/1.1896453
[11] F. M. Khan, “Treatment Planning in Radiation Oncolo- gy,” 2nd Edition, Lippincott Williams & Wilkins, Phila- delphia, 2007.
[12] A. van’t Riet, et al., “A conformation Number to Quan- tify the Degree of Conformality in Brachytherapy and External Beam Irradiation: Application to the Prostate,” International Journal of Radiation Oncology, Biology, Physics, Vol. 37, No. 3, 1997, pp. 731-736. doi:10.1016/S0360-3016(96)00601-3
[13] L. Feuvret, et al., “Conformity Index: A Review,” Inter- national Journal of Radiation Oncology, Biology, Physics, Vol. 64, No. 2, 2006, pp. 333-342. doi:10.1016/j.ijrobp.2005.09.028
[14] C. Shi, J. Penagaricano and N. Papanikolaou, “Compari- son of IMRT Treatment Plans between Linac and Helical Tomotherapy Based on Integral Dose and Inhomogeneity Index,” Medical Dosimetry, Vol. 33, No. 3, 2008, pp. 215-221. doi:10.1016/j.meddos.2007.11.001
[15] P. Mavroidis, et al., “Comparison of the Helical Tomo- therapy and MLC-based IMRT Radiation Modalities in Treating Brain and Cranio-Spinal Tumors,” Technology in Cancer Research & Treatment, Vol. 8, No. 1, 2009, pp. 3-14.
[16] J. Y. Hong, et al., “Supine Linac Treatment versus To- motherapy in Craniospinal Irradiation: Planning Com- parison and Dosimetric Evaluation,” Radiation Protection Dosimetry, Vol. 146, No. 1-3, 2011, pp. 364-366. doi:10.1093/rpd/ncr190
Copyright © 2013 SciRes. IJMPCERO

P. MYERS ET AL.
Copyright © 2013 SciRes. IJMPCERO
38
[17] Y. K. Lee, et al., “Development and Evaluation of Multi- ple Isocentric Volumetric Modulated Arc Therapy Tech- nique for Craniospinal Axis Radiotherapy Planning,” In-ternational Journal of Radiation Oncology, Biology, Phy- sics, Vol. 82, No. 2, 2010, pp. 1006-1012.
[18] W. Parker, et al., “Intensity-Modulated Radiotherapy for Craniospinal Irradiation: Target Volume Considerations, Dose Constraints, and Competing Risks,” International Journal of Radiation Oncology, Biology, Physics, Vol. 69,
No. 1, 2007, pp. 251-257. doi:10.1016/j.ijrobp.2007.04.052
[19] J. A. Penagaricano, C. Shi and V. Ratanatharathorn, “Eva- luation of Integral Dose in Cranio-Spinal Axis (CSA) Ir- radiation with Conventional and Helical Delivery,” Tech- nology in Cancer Research & Treatment, Vol. 4, No. 6, 2005, pp. 683-689.