Embed Size (px)
Citation preview
Doing Positive Work:
On student understanding of thermodynamics
Helen Georgiou
A thesis submitted in fulfilment of the requirements for the degree of
Doctor of Philosophy
Faculty of Science
The University of Sydney
Australia
2014

i
Statement of Originality
To the best of my knowledge, this thesis contains no copy or paraphrasing of work published
by another person, except where duly acknowledge in the text. This thesis contains no
material which has been previously presented for a degree at The University of Sydney or
any other university.
Helen Georgiou

iii
Acknowledgements
First and foremost, I wish to express my sincerest gratitude to my extraordinary supervisor,
Manjula Sharma, for her support and guidance through the years. You have managed the
seemingly impossible task of providing the perfect amount of autonomy, support and
inspiration whilst also demonstrating your endless professional commitment and personal
kindness. If it weren’t for your words of encouragement and your passion for physics and
education, which I encountered as far back as Open Day 2001, I simply would not have
pursued this rewarding path.
To SUPER: I consider myself extremely lucky to be counted as a member of this exceptional
research group. To the backbone of the group, Brian McInnes, Ian Sefton and Ian Johnson, I
am grateful beyond words for the input, guidance and support you have afforded. Your
continued contributions are reflective of an uncommon and greatly respected altruism. To
SUPER alumni, Nigel Kuan, Derek Muller and Christine Lindstrøm, who have set the bar
extremely high, your achievements and commitment to the field, albeit in vastly different
ways, leaves a wonderful legacy for the rest of us. Christine, thanks for being such a huge
part of the beginning of my journey and for making the time, subsequently, to stay in close
contact. It means a lot to know you are only a Skype call away!
I also wish to thank those who remain committed to physics education issues within the
university, particularly John O’Byrne, and my associate supervisor Joe Khachan. I
appreciate your advocacy both for my personal work and on general physics education
matters within the School.
I would like to express special thanks to Karl Maton. I’m not sure what act of providence
culminated in me sitting in that class, but it could not have occurred at a better time or
place. Your commitment to clarity, honesty and justice in education and beyond is truly
magnificent and I am a better researcher and person because of it.

iv
To my colleagues, friends, and office mates, I consider you all a vital part of my support
network. Alexandra Yeung and Shane Wilkinson, thanks for your encouragement and
company and for tolerating my daily grievances. To Matthew Hill, I have great respect for
you and am glad we have been in a position to meaningfully engage on an academic and
personal level over the last few years.
These kinds of projects could not succeed without the help and cooperation of the students,
administrative staff and technicians in the School of Physics. Particular thanks should go to
Pulin Gong and Iver Cairns, I appreciate your support; it has been a pleasure working with
you. There were a great number of people who helped administer surveys outside of the
university who I also wish to thank, especially Chrissoula Sevastidis for the difficult
translation work.
To my family, home and away, I am always mindful of your support. Mum and Dad, your
love and kindness has been my sustenance. I don’t believe I will ever meet two people more
worthy of admiration and respect. Thank you for doing everything you did for all those years
–I know it wasn’t easy.
To Natalie Vella, time has only confirmed how valuable your persistent influence has been; I
can safely say that you planted the seed from which this whole thing grew. And, finally, to
David Fergusson, this thesis is as much a product of your support as my efforts. I hope you
feel I’ve done it justice.
This work was supported by the University of Sydney, School of Physics Denison Merit
Award.
v
Included papers and presentations
The following reference list includes refereed papers and presentations that arose from this
doctoral program and on which some of the chapters of this thesis are based.
Refereed papers
Georgiou, H., Maton, K., & Sharma, M. D. (2014) Recovering Knowledge for Science Education Research: Exploring the ‘Icarus effect’ in student work. The Canadian Journal of Science, Mathematics and Technology Education, in press.
Georgiou, H., & Sharma, M. D. (2010). A Report on a Preliminary Diagnostic for Identifying Thermal Physics Conceptions of Tertiary Students. International Journal of Innovation in Science and Mathematics Education, 18, 32-51.
Georgiou, H., & Sharma, M. D. (2011). University students' understanding of thermal physics in everyday contexts. The International Journal of Science and Mathematics Education, 1-24.
Book Chapter
Georgiou, H. (2014). Putting physics knowledge in the hot seat: The semantics of student understandings of thermodynamics. In K. Maton, S. Hood & S. Shay (eds), Knowledge-building: Educational studies in Legitimation Code Theory. London: Routledge.
Conference papers (refereed)
Georgiou, H., Sharma, M., O'Byrne, J., & McInnes, B. (2009). University students' conceptions about familiar thermodynamic processes and the implications for instruction. The UniServe Science 2009 Conference proceedings, Uniserve Science, Sydney.
Conference presentations
Georgiou, H., & Sharma, M. D. (2010a). A comparison of tertiary students' thermal physics conceptions across three English-speaking countries. Paper presented at the The 19th Australian Institute of Physics Congress incorporating the 35th Australian Conference on Optical Fibre Technology (AIP/ACOFT 2010), Melbourne.
vi
Georgiou, H., & Sharma, M. D. (2010b). An Intercultural Exploration of Conceptions in Thermal Physics. Paper presented at the UniServe Science, "Creating active minds in our science and mathematics students.", The University of Sydney, Sydney.
Georgiou, H., & Sharma, M. D. (2012). Analysing student responses using LCT. Paper presented at the First annual Legitimation Code Theory science and mathematics symposium, Sydney.
Georgiou, H., & Sharma, M. (2012). Exploring students' (mis)conceptions of physics. Paper presented at the 7th International Basil Bernstein Symposium, Aix-en-Provence, France.
Georgiou, H., Sharma, M. (2012). Why it is important to publish ‘null’ results: A project involving no change in learning gains from Interactive Lecture Demonstrations in first year thermal physics. Paper presented at the World Conference on Physics Education, Istanbul.
Conference presentations (poster)
Georgiou, H., & Sharma, M. D. (2011). They should have taught them that in High school. Paper presented at the The Australian Conference for Science and Mathematics Education, Melbourne University, Melbourne.
Georgiou, H., & Sharma, M. (2013a). Interactive engagement in thermodynamics lectures: successes and failures. Paper presented at the American Association of Physics Teachers (AAPT), Portland, Oregon.
Georgiou, H., & Sharma, M. (2013b). Physics Knowledge and its effects: a study of student responses in thermodynamics using Legitimation Code Theory. Paper presented at the Physics Education Research Conference (PERC), Portland, Oregon.

vii
Abstract
This thesis addresses several aspects of the teaching and learning of thermodynamics in the
context of first year university Physics. Thermodynamics is a topic that attracts far less
attention at the first year level, both in terms of instruction time but also in the literature.
The first part of the thesis focuses on the teaching aspect, and reports on a two-year
experiment that involved introducing Interactive Engagement techniques in lectures to
facilitate ‘Active Learning’. Two different Interactive Engagement techniques were
compared, the Interactive Lecture Demonstrations and the Interactive Exercises, across four
first year Physics thermodynamics ‘streams’ at The University of Sydney (approximately
N=600). In the first year, 2011, there were no differences in learning outcomes between the
four streams as measured by the Thermal Concepts Survey and the final first year Physics
exam (each technique was trialled in two classes). In 2012 the Thermal Concepts Survey
reveals a difference in the streams, with one of the streams which received the Interactive
Lecture Demonstration program performing significantly better than the others. Both
programs were characterised in terms of the activity of the lecturer and in terms of student
engagement. Evaluation surveys and interviews were deployed to gather more information
about how the programs were received by the students.
The second part of the thesis focuses on student understanding. First, student understanding
is examined using existing measures, such as the quantitative analysis of the Thermal
Concepts Survey and qualitative analysis of short answer responses to a series of
thermodynamics questions/problems (the Interactive Exercises). Several specific findings
were made, highlighting particular aspects of thermodynamics that caused difficulties for
students. In order to address some of the limitations in these existing approaches, and to
provide more explanatory analyses, a novel approach was pursued and developed. This
approach, Legitimation Code Theory, was used to examine student understanding of
thermodynamics through the focus on the organising principles of knowledge. The analysis
using Legitimation Code Theory reveals that the nature of the scientific knowledge students
encounter has real effects on their engagement with the subject, and this, in turn, has
consequences for instructional practices.

viii
It will be argued that Legitimation Code Theory is a powerful framework that can provide
substantial utility for the study of student understanding and to science and Physics
Education Research in general.
ix
Table of Contents
Statement of Originality ........................................................................................................................... i
Acknowledgements ................................................................................................................................. iii
Included papers and presentations .......................................................................................................... v
Abstract ................................................................................................................................................. vii
Table of Contents ................................................................................................................................... ix
1 Personal Orientation ....................................................................................................................... 1
2 Introduction and Outline ................................................................................................................. 5
3 Literature Review ............................................................................................................................ 9
3.1 Descriptions of student understanding .................................................................................... 9
3.1.1 Misconceptions and misnomers ......................................................................................... 11
3.1.2 The nature of students’ conceptions- ‘theory-like’ or ‘piece-like’ ..................................... 14
3.1.3 The Resources Framework ................................................................................................ 16
On context ................................................................................................................................. 17
Knowledge and knowledge structures ........................................................................................ 18
‘Epistemology’ ........................................................................................................................... 19
3.1.4 A summary of conceptions and theory .............................................................................. 22
3.2 PER: practical developments ................................................................................................ 23
3.2.1 Interactivity and Active Learning ..................................................................................... 23
3.2.2 Developing from Novices to Experts ................................................................................. 31
3.2.3 A Social turn ..................................................................................................................... 33
3.3 Methodologies ........................................................................................................................ 35
3.3.1 History of methodologies in Physics and science education research ................................ 35
3.3.2 Quantitative: Pre- and post- testing ................................................................................. 38
3.3.3 Qualitative: Structure Of Observed Learning Outcomes and Phenomenography ............. 41
3.4 Limitations- remaining questions .......................................................................................... 46
3.4.1 Knowledge blindness .......................................................................................................... 50
x
3.5 A New Theory ....................................................................................................................... 54
3.5.1 Legitimation Code Theory ................................................................................................. 54
3.5.2 LCT(Specialization) ........................................................................................................... 56
3.5.3 LCT(Semantics) ................................................................................................................ 60
3.5.4 The ‘external language of description’ .............................................................................. 61
4 Context .......................................................................................................................................... 63
4.1 Australian context ................................................................................................................. 63
4.1.1 Year 10 School certificate .................................................................................................. 64
4.1.2 Teacher survey .................................................................................................................. 64
4.1.3 Year 12 Higher School Certificate ..................................................................................... 69
4.1.4 Physics ............................................................................................................................... 70
4.2 The University and Physics ................................................................................................... 71
4.3 The Regular course ................................................................................................................ 72
4.4 The non-lecture part of the course ........................................................................................ 72
4.4.1 Workshop Tutorials ........................................................................................................... 72
4.4.2 The final exam ................................................................................................................... 74
4.4.3 Mastering Physics assignment questions. .......................................................................... 75
4.4.4 Laboratory work ................................................................................................................ 75
4.5 Lectures ................................................................................................................................. 75
4.6 Implementation- The Four Streams ...................................................................................... 76
4.7 Contributions ......................................................................................................................... 78
5 Development of Research tools and Learning Activities ............................................................... 79
5.1 Learning Activities ................................................................................................................ 79
5.1.1 Interactive Lecture Demonstrations .................................................................................. 79
5.1.2 Interactive Exercises .......................................................................................................... 81
5.2 Lecture Observation and Student Experience ....................................................................... 83
5.2.1 Background ........................................................................................................................ 83
5.2.2 Available tools ................................................................................................................... 84
xi
5.2.3 The Lecturer Activity and Student Engagement (LASE) tool ......................................... 86
Development of LA ................................................................................................................... 87
Development of SE .................................................................................................................... 90
5.2.4 Lecture evaluations ............................................................................................................ 93
5.2.5 Interviews .......................................................................................................................... 94
5.3 Student Learning Outcomes .................................................................................................. 94
5.3.1 Thermal concepts survey ................................................................................................... 94
5.3.2 Normalized gain and the Hake Plot .................................................................................. 95
5.3.3 Final exam ......................................................................................................................... 95
6 Introduction to Part One: Active Learning Experiment ............................................................... 97
7 Study One 2011 ............................................................................................................................. 99
7.1 Aim ........................................................................................................................................ 99
7.2 Sample- allocation of streams ................................................................................................ 99
7.2.1 Numbers ...........................................................................................................................100
7.2.2 Student high school marks and physics marks ................................................................. 102
7.2.3 Degrees enrolled in ........................................................................................................... 102
7.2.4 Gender .............................................................................................................................. 103
7.3 Method ................................................................................................................................. 104
7.4 Results .................................................................................................................................. 105
7.4.1 Overall learning gains ....................................................................................................... 105
7.4.2 Differences in learning outcomes ...................................................................................... 105
7.4.3 Other results .....................................................................................................................106
7.5 Discussion ............................................................................................................................. 117
8 Study Two 2012 ........................................................................................................................... 121
8.1 Aim ....................................................................................................................................... 121
8.2 Sample- allocation of streams ............................................................................................... 121
8.2.1 Numbers ........................................................................................................................... 122
8.2.2 Homogenous sample ......................................................................................................... 123
xii
8.2.3 Degrees enrolled in ........................................................................................................... 123
8.2.4 Gender .............................................................................................................................. 124
8.3 Method ................................................................................................................................. 125
8.4 Results .................................................................................................................................. 126
8.4.1 Learning outcomes- overall ............................................................................................... 126
8.4.2 Learning outcomes- gains on TCS with full participants ................................................. 126
8.4.3 Learning outcomes- other measures ................................................................................. 128
8.4.4 Other results ..................................................................................................................... 130
LASE ........................................................................................................................................ 130
Evaluations ............................................................................................................................... 137
8.5 Discussion ............................................................................................................................. 146
9 Introduction to Part Two: Student Understanding ...................................................................... 151
10 Student Understanding: Conventional Approaches ...................................................................... 153
10.1.1 Thermal Concepts Survey ............................................................................................ 154
10.1.2 Poorly answered questions ............................................................................................ 156
10.1.3 Accurately answered questions ..................................................................................... 159
10.2 Questions five and six from TCS & Interactive Exercise One: Thermal conductivity ......... 161
10.2.1 Concept-choices and explanations ................................................................................ 164
11 Case study with LCT analysis .....................................................................................................169
11.1 On a personal note ...............................................................................................................169
11.2 The question .........................................................................................................................170
11.3 Sample .................................................................................................................................. 171
11.4 The analysis .......................................................................................................................... 172
11.4.1 Previous Attempts at analysis: SOLO, phenomenography .......................................... 173
11.4.2 LCT analysis ................................................................................................................ 175
11.5 Results and discussion .......................................................................................................... 182
11.5.1 Semantic gravity in responses ...................................................................................... 182
11.5.2 Augmenting the conceptions research .......................................................................... 183
xiii
11.5.3 Semantic gravity range .................................................................................................186
11.5.4 Moving beyond conceptions: The Icarus Effect ............................................................ 191
11.6 Implications for instruction ..................................................................................................196
12 Discussion .....................................................................................................................................199
Conclusion ............................................................................................................................................209
References ............................................................................................................................................. 211
Appendices .............................................................................................................................................. 1
Appendix A Teacher Survey ............................................................................................................ 2
Appendix B Interactive Exercises .................................................................................................... 8
Appendix C Interactive Exercise solutions .................................................................................... 12
Appendix D Prediction and Results Sheets for ILDs ..................................................................... 16
Appendix E Ethics Approval ......................................................................................................... 34
Appendix F Internal Report on Student Evaluation Development ............................................... 42
Appendix G Student Engagement Template (LASE) .................................................................... 47
Appendix H Alternative ILD Sheet (LASE) .................................................................................. 48
Appendix I ILD Specific Student Evaluation ............................................................................... 49
Appendix J Interview Questions 2011/2012 .................................................................................. 51
Appendix K Thermal Concepts Survey ......................................................................................... 53
Supplementary Materials ....................................................................................................................... 65
1
1 Personal Orientation
As I began my post-graduate studies, I was strongly motivated by my experience as a
new teacher of physics. Two things struck me during that experience, the first being
that physics topics were extraordinarily difficult to teach (successfully), and the
second, that physics did not play a central (or any) role in most people’s lives. There
was one thing, however, that did not surprise me at all: students could reach a
‘transformation’ when physics instruction was successful. I also felt that some concepts
or areas in physics were more effective in helping students arrive at these
transformations; I found particular success with thermodynamics, which formed a part
of the A-level curriculum in England, where I held my longest teaching position.
During this period, I considered questions such as why it was so difficult for students
to come to a comprehensive understanding of physics, what can be done to help with
this, and why some physics subjects were more challenging to teach than others. These
fundamental questions are common ones in science education research. In fact, many
lecturers of physics, and particularly those who subsequently engaged with Physics
Education Research, have similar stories of coming to realise that their lectures were
not as successful as they had thought. Edward F. ‘Joe’ Redish provides a fascinating
account, in his 1998 Millikan lecture, of the discovery of students’ disappointing grades
on exam problems, despite all of his efforts:
I was sure that I could teach the subject in lecture. After all, it wasn't
very difficult, and I had great confidence in my ability to make things
clear … I wrote clear definitions on the board and walked a pattern and
made them graph it in their notebooks. I gave examples that were
realistic and related to their experience. I used our high quality
demonstration equipment … And then I gave their problem on my mid-
semester exam. (Redish, 1999, p. 569)
Eric Mazur’s ‘confessions of a converted lecturer’ talk and associated paper recounts a
similar story:
2
I had been teaching an introductory physics course for engineering and
science majors … since 1984. Until 1990 I taught a conventional course
consisting of lectures enlivened by classroom demonstrations. I was
generally satisfied with my teaching –my students did well on what I
considered difficult problems, and the evaluations I received from them
were very positive. As far as I knew, there were not many problems in
my class (Mazur, 2007, p. 2).
These accounts indicate a mismatch between what is measured by formal assessment
and what is known as conceptual understanding. Conceptual understanding was what
these lecturers wanted for their students. Why was it so difficult to achieve? Moreover,
why is it so important? Jan Meyer and Ray Land present a compelling theoretical
construct they refer to as the ‘threshold concept’, which I believe helps conceptualise
these questions:
A threshold concept is akin to a portal, opening up a new and previously
inaccessible way of thinking about something. It represents a
transformed way of understanding, or interpreting, or viewing something
without which the learner cannot progress. As a consequence of
comprehending a threshold concept there may thus be a transformed
internal view of subject matter, subject landscape, or even world view.
This transformation may be sudden or it may be protracted over a
considerable period, with the transition to understanding proving
troublesome. Such a transformed view or landscape may represent how
people ‘think’ in a discipline, or how they perceive, apprehend, or
experience particular phenomena within that discipline (more generally)
(Meyer & Land, 2006, p. 3).
For me, much of the content in thermodynamics seemed to resonate strongly with the
idea of Meyer and Land’s ‘threshold concept’. After instruction, students were more
likely to emerge with a view that was more ‘physics-like’. I later discovered that
Marcia Linn (and others) makes a similar link between thermodynamics understanding
3
and sophisticated scientific literacy (Hurley, 2005; Linn, 1993). The splendour of
thermodynamics has not escaped even the most famous of physicists:
A theory is the more impressive the greater the simplicity of its premises,
the more different kinds of things it relates, and the more extended its
area of applicability. Therefore the deep impression that classical
thermodynamics made upon me. It is the only physical theory of
universal content which I am convinced will never be overthrown, within
the framework of applicability of its basic concepts (Einstein, 1973).
However, I was soon to find that thermodynamics, arguably one of the most
fundamental of the physics subjects, was not amongst the most represented physics
subjects throughout formal instruction, and thus also not amongst the most studied in
educational research. For this and other reasons, the lofty questions I began this
project with beget even more questions, many of which I could not feasibly answer in a
doctoral program.
Furthermore, I was ignorant of the nature and precariousness of the academic field I
was to enter. In making the professional transition from studying or teaching science to
educational research, I expected everything to change apart from the foundation of my
motivation: to study something scientifically. I reached a point where I began to
question even this foundation and was surprised to observe the term –scientism–
commonly used as a pejorative accusation. As a physics teacher and physics graduate
looking at physics education, it was enlightening to be exposed to views completely
outside of my own. It was once pondered; ‘what should they know of England who
only England know?’, and it is certainly true that I learned a great deal about the
scientific endeavour through the eyes of those outside of it.
The pages following shall document the scholarly exploration of many of these issues.

5
2 Introduction and Outline
This thesis is the result of a major research endeavour that examined both the teaching
of thermodynamics and student understanding of it in the context of first year Physics.
On the one hand, the project has a relatively uncontentious focus: encouraging Active
Learning and negotiating instructional design in an under-researched subject
(thermodynamics), and on the other, arguably the most contentious, student
understanding and theories of learning. Despite the structural bifurcation, the study
was always intended to be experienced as a coherent whole, each part as important as
the other. That is, to understand if and how we can teach better we must comprehend
student understanding better. The first part presents the two-year implementation of
an Active Learning program in first year Physics that was successful in improving
student learning. This part of the thesis will report on all aspects of the
implementation of the Active Learning program, including: a characterisation of the
thermodynamics lecture course, a description of how the Active Learning program was
implemented and received, the learning outcomes of the Active Learning program, the
general issues associated with its insertion into a first year course, and some reasons for
its various degrees of success. The second part presents the development of a
framework that aims to examine student understanding of thermodynamics through
the focus on the organising principles of knowledge, using Legitimation Code Theory
(LCT). This part of the thesis will first report on student alternative conceptions of
thermodynamics through existing methods. A new approach will then be presented as
LCT is used to analyse one group of student responses to a thermodynamics problem.
It will be argued that LCT is a powerful framework that can provide substantial utility
to science and Physics Education Research in general.
The two main aims of the project are related but also independent, particularly with
respect to their relationship to the extant literature. The first part, concerning Active
Learning techniques, emerges from a comprehensive and cumulative body of work,
albeit one that more prominently reflects other physics subject areas, such as
6
mechanics. The substance of the second part which focuses on student understanding,
does not extend as easily from one single body of work. The literature review will
therefore present these two research agendas as outcomes of more than half a century
worth of work in the science and Physics Education Research fields and the field of
educational research more generally.
In Chapter 3, therefore, the literature review will centre around a historical (and
current) account of the theoretical, epistemological, methodological and the practical
considerations around the teaching and learning on physics. The review on this aspect
is comprehensive and necessary if a new theoretical framework is to be presented to the
field. The literature review will cover the fundamental (or ‘basic’) work on student
understanding generally, but will also present some of the practical, instructional
products of the research agenda (the ‘applied’), which includes the Active Learning
agenda. The review will culminate in the presentation of a new approach and will
outline the relevant and fundamental principles of Legitimating Code Theory.
Chapter 4 will outline the local context. The wider Australian educational setting is
described first, followed by results from a brief survey about thermodynamics in high
school. The university setting, the sample, the outline of the experiment and the
details about the first year Physics course will also be provided in this Chapter.
Chapter 5 will detail the research tools and the learning activities. The learning
resources that form part of the Active Learning implementation, which were either
borrowed from the literature or original developments, are described in detail, as are
the tools used to evaluate the program. These tools include the Thermal Concepts
Survey, the tool used to characterise the lectures and the various evaluation surveys.
Chapter 6 is a short introduction to the two chapters following, and demarcates ‘Part
One’ of the thesis, involving the Active Learning implementation.
7
In Part One, Chapters 7 and 8 represent findings from ‘Study One’, which was the
first iteration of the Active Learning program in the first year Physics course, and
‘Study Two’, which involved the integration of several methodological improvements
based on Study One results. Each chapter occasions slightly different aims; however,
both include a report of the student outcomes and attitudes towards the program, as
well as a characterisation of the implementation in both years.
Chapter 9 is a short introduction to the two chapters following, and demarcates ‘Part
Two’ of the thesis, which focuses on student understanding.
In Chapter 10, student understanding is examines through conventional means,
namely, through quantitative measures based around the Thermal Concepts Survey.
Chapter 10 will also report on findings stemming from qualitative analyses of short-
answer responses.
Chapter 11 is the report on the application of Legitimation Code Theory. This chapter
will involve an explanation of how LCT was enlisted, which concepts of the theory
were applied and a comprehensive description of the analysis of student responses using
these concepts. The implications for instruction are also discussed.
The thesis will conclude with Chapter 12, a discussion around the merits of the new
approach and a general discussion of the thesis as a whole.

9
3 Literature Review
3.1 Descriptions of student understanding
Descriptions of student understanding –otherwise known as research on conceptual
change, concepts and alternative conceptions (summarised from here on as
‘conceptions’ research for brevity) –is undoubtedly the central focus of science
education research (Chang, Chang, & Tseng, 2010; Cummings, 2013; Lee, Wu, & Tsai,
2009; Tsai & Wen, 2005). It is based on the following fundamentals:
• that students of all ages, cultures and abilities demonstrate common difficulties
in almost all scientific domains, and
• that these difficulties are persistent, often remaining unchanged after formal
instruction.
These fundamentals echo through the decades of literature on the topic; from the
beginning of the research program (Nussbaum & Novak, 1976) to the most recent
publication as of writing (Lelliott, 2013). Particularly astonishing are the reports that
students emerge from science instruction with little to no improvement in conceptual
understanding (Hake, 1998; Halloun & Hestenes, 1985).
The conceptions movement was driven by notion of ‘constructivism’, summarised
under the statement of: “knowledge is constructed in the mind of the learner” (Bodner,
1986, p. 873). Constructivism helped provide an explanation as to why some students
held and maintained conceptual difficulties –students construct their own knowledge
and doing so erroneously could explain why these difficulties, or misconceptions,
existed and persisted. Constructivism is a contested and diversely applied expression in
education (and beyond) but, as embraced by the science education research
community, constructivism was associated with a period of significant influence and
reform. It also brought epistemological considerations to the fore:
10
… somewhere during the five year period 1978-1983 the seeds were sown
for constructivism to become a dominant way of making sense of
mathematics and then science education (Tobin, 2000, p. 232).
A new field of study has acquired a new vocabulary which focuses
attention on the pupils own ideas … The vocabulary was picked up by
others, thus launching constructivism (Solomon, 1994, p. 4).
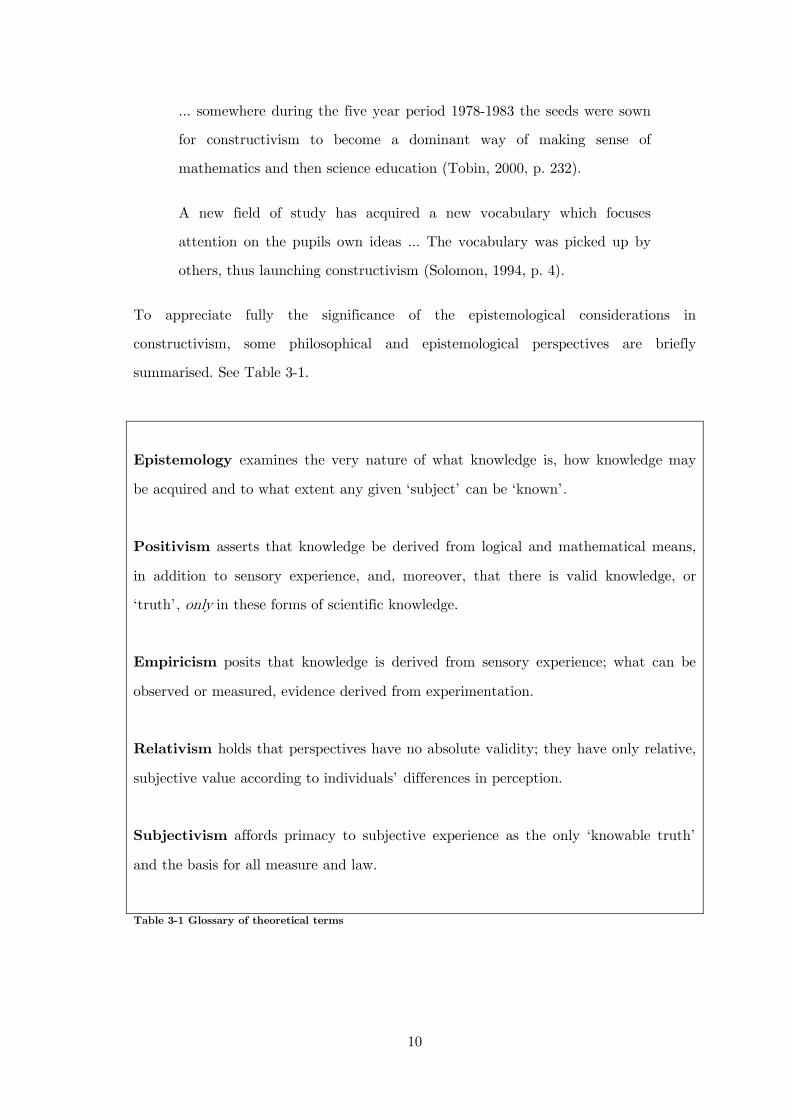
To appreciate fully the significance of the epistemological considerations in
constructivism, some philosophical and epistemological perspectives are briefly
summarised. See Table 3-1.
Epistemology examines the very nature of what knowledge is, how knowledge may
be acquired and to what extent any given ‘subject’ can be ‘known’.
Positivism asserts that knowledge be derived from logical and mathematical means,
in addition to sensory experience, and, moreover, that there is valid knowledge, or
‘truth’, only in these forms of scientific knowledge.
Empiricism posits that knowledge is derived from sensory experience; what can be
observed or measured, evidence derived from experimentation.
Relativism holds that perspectives have no absolute validity; they have only relative,
subjective value according to individuals’ differences in perception.
Subjectivism affords primacy to subjective experience as the only ‘knowable truth’
and the basis for all measure and law.
Table 3-1 Glossary of theoretical terms
11
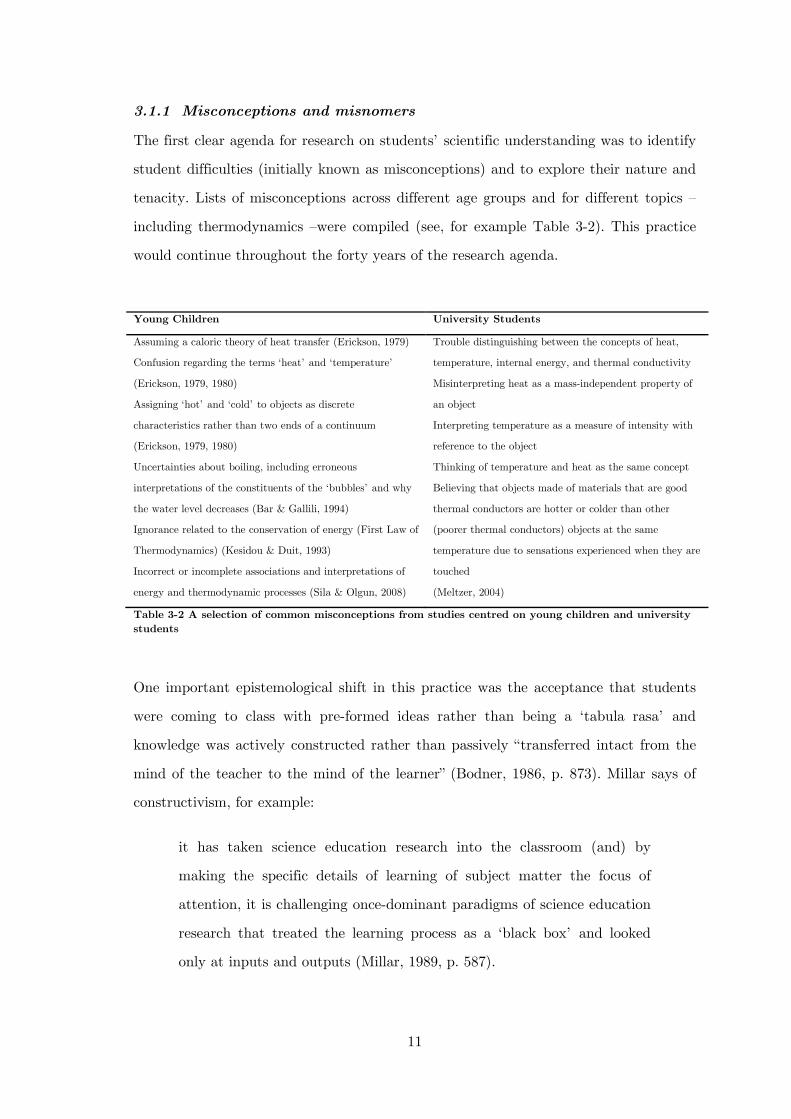
3.1.1 Misconceptions and misnomers
The first clear agenda for research on students’ scientific understanding was to identify
student difficulties (initially known as misconceptions) and to explore their nature and
tenacity. Lists of misconceptions across different age groups and for different topics –
including thermodynamics –were compiled (see, for example Table 3-2). This practice
would continue throughout the forty years of the research agenda.
Table 3-2 A selection of common misconceptions from studies centred on young children and university students
One important epistemological shift in this practice was the acceptance that students
were coming to class with pre-formed ideas rather than being a ‘tabula rasa’ and
knowledge was actively constructed rather than passively “transferred intact from the
mind of the teacher to the mind of the learner” (Bodner, 1986, p. 873). Millar says of
constructivism, for example:
it has taken science education research into the classroom (and) by
making the specific details of learning of subject matter the focus of
attention, it is challenging once-dominant paradigms of science education
research that treated the learning process as a ‘black box’ and looked
only at inputs and outputs (Millar, 1989, p. 587).
Young Children University Students
Assuming a caloric theory of heat transfer (Erickson, 1979)
Confusion regarding the terms ‘heat’ and ‘temperature’
(Erickson, 1979, 1980)
Assigning ‘hot’ and ‘cold’ to objects as discrete
characteristics rather than two ends of a continuum
(Erickson, 1979, 1980)
Uncertainties about boiling, including erroneous
interpretations of the constituents of the ‘bubbles’ and why
the water level decreases (Bar & Gallili, 1994)
Ignorance related to the conservation of energy (First Law of
Thermodynamics) (Kesidou & Duit, 1993)
Incorrect or incomplete associations and interpretations of
energy and thermodynamic processes (Sila & Olgun, 2008)
Trouble distinguishing between the concepts of heat,
temperature, internal energy, and thermal conductivity
Misinterpreting heat as a mass-independent property of
an object
Interpreting temperature as a measure of intensity with
reference to the object
Thinking of temperature and heat as the same concept
Believing that objects made of materials that are good
thermal conductors are hotter or colder than other
(poorer thermal conductors) objects at the same
temperature due to sensations experienced when they are
touched
(Meltzer, 2004)
12
Ausubel, quoted by Novak, famously states:
If [he] had to reduce all of educational psychology to just one principle,
[he] would say this: The most important single factor influencing learning
is what the learner already knows. Ascertain this and teach him
accordingly (Ausubel, 1968, p. vi).
A second major epistemological shift was the discussion around the value placed on
student’s ideas. Initially, a deficit model was identifiable; where student’s ideas were
incorrect and instruction was to provide a remedy. Consider the following excerpts
from Warren, one of the earliest researchers in thermodynamics education:
One hundred and forty eight university entrants in various branches of
science and engineering were asked to define heat and internal energy,
and to state their relationship. Not one gave meaningful definitions of
both these quantities, nor was there a single statement of the first law of
thermodynamics (Warren, 1972, p. 42).
energy is not something of which anyone can be aware by commonplace
experience … It is a very advanced concept which must be learned
through systematic instruction, which can only be understood if the
student has first mastered several difficult basic ideas … and has an
extensive knowledge of elementary physics … the only way to overcome
these difficulties is by teaching the subject logically to students who have
been properly prepared (Warren, 1982, pp. 295-296)
Warren took the view that physics concepts have one unambiguous definition and
students may acquire understanding of a concept after logically structured preparation.
This view eventually fell out of favour. The general discomfort around accepting an
exclusive way of knowing (Greene, 1994) strongly influenced conceptions research and
is most obviously reflected in the changing terminology (Abimbola, 1988).
‘Misconceptions’ or any term that implied a singular or objective truth or fact was
rejected in preference for accommodating multiple legitimate ways of knowing.
13
‘Superstitions’, ‘misconceptions’, ‘mistakes’, ‘misunderstandings’ (Helm, 1980;
Matteson & Kambly, 1940; Vicklund, 1940) fell out of favour to ‘preconceptions’
(Ausubel, 1968), ‘prior schemata’ (Posner, Strike, Hewson, & Gertzog, 1982),
‘alternative frameworks’ (Driver & Easley, 1978) and ‘alternative conceptions’
(Hewson, 1981). Gauld (1987) notes that during this period, there were over 20
different alternative terms for misconceptions.
Driver et. al further explain that:
The empiricist’s view of science suggests that scientific ideas and theories
are reached by a process of induction … pupils or practicing scientists
observe facts objectively… if one subscribes to such a view then
alternative interpretations of events imply either incorrect observations
or faulty logic could be called ‘wrong’ ideas (rather than) recognised as
partial explanations of limited scope (Driver & Easley, 1978, p. 62).
The acceptance of multiple legitimate versions of a scientific concept opens up dialogue
concerning the conditions of legitimacy and the assignment, to student’s conceptions,
of varying degrees of legitimacy. Students’ ideas, for example, could be considered
categorically at odds with scientific knowledge, or they could be tolerated as a building
block towards accepted scientific knowledge, or in the most extreme form of relativism,
they would be just as legitimate as scientific knowledge. Osborne provides one view in
this dialogue, in asserting that “there are entities for which we have well-established
arguments … and reliable theories that have superior explanatory power than those of
common-sense reasoning”, and questions the expectation that a student may be in a
position to be aware of the value of these ‘entities’: “But how is the child to judge that
the scientist’s description is more viable?” (Osborne, 1996, p. 58). He also flags the
insufficiency of constructivism to explore this issue.
Clearly, these questions indicate a maturation of the field and, as the field matured, so
did the scope of the research. A bibliography of the conceptions work had been
produced in the seventies and maintained for a period of time by Helga Pfundt and
14
Reinders Duit. Duit neatly summarises the development of the ‘conceptions movement’
and the constructivist influence in the introduction to this bibliography:
Initially, the focus was on students' conceptions of various science topics.
As this area has developed towards constructivist perspectives of
conceptual change the emphasis of the bibliography has also changed
(from students’ alternative frameworks and science education to
students’ and teachers’ conceptions and science education). The new
name of the bibliography takes these changes into account. This is the
last version of the bibliography available. After more than 30 years it has
become more and more difficult to adjust the initial system of keywords
to the rapid developments in science education research. (Duit, 2009).
The revisions to this bibliography indicate a history of a field in which there existed an
initial, strong focus on categorisation that led to a wider adoption of constructivism
and, ultimately, gave way to a diversification. It is at this point that researchers
claimed it is no longer possible to maintain the bibliography without considerable
effort. The last update includes upwards of 8000 records.
Although the issue of legitimacy was not to become a dominant theme in the study of
student understanding in the science education research literature, ‘theoretical’
discussions were nonetheless prioritised, and culminated in two opposing perspectives
on the nature of personal knowledge structures which became termed ‘theory-like’ or
‘piece-like’ (Özdemir & Clark, 2007). Accepting either of these two perspectives would
affect how the researcher interprets student understanding (and therefore also
conceptual change) (see, for example, diSessa, 2006; Guzzetti & Hynd, 1998; Özdemir
& Clark, 2007; Vosniadou, 2008).
3.1.2 The nature of students’ conceptions- ‘theory-like’ or ‘piece-like’
The proponents of the ‘theory-like’ description of student conceptions include Carey
(1985), McCloskey (1983), Chi (1992) and Vosniadou (2002), who believe students’
conceptions are concrete manifestations of theory-like cognitive structures. This
15
research is influenced by the Kuhnian and Piagetian ideas, since they assumed students
have certain epistemological and ontological commitments, and these assumptions, like
those of science itself, are paradigmatic and difficult to shift. The essence of the theory-
like perspective is that each individual idea or set of ideas stems from a coherent
theory that is present within the mind of the student from an early age. These ideas
are well articulated, strongly held and persistent. One theoretical concept resulting
from taking a theory-like perspective on student understanding is the concept of
‘ontologies’. Chi (1992) shows that, when engaged in science learning, students practise
‘ontological classification’ and she describes conceptual change as overcoming
ontological misclassification. For example, students often classify ‘heat’ as a fluid; they
talk of it as ‘flowing’ (Table 3-2). To physicists, heat, strictly speaking, is an energy
transfer due to a temperature difference (Warren, 1982). In taking such a view,
overcoming this misclassification is not merely, as Warren puts it, a matter of
“systematic instruction…teaching the subject logically to students who have been
properly prepared” (Warren, 1982, pp. 295-296) but instead, it is an ontological re-
classification that should be explicitly facilitated (Chi, 2000).
The opposing ‘piece-like’ view purports that knowledge is constructed from elements
that are ‘quasi-independent’; elements that are linked or connected through dynamic
activation which occurs in the learning context. These pieces, or elements, are
described at different levels, from the most discrete and concrete to the more complex
and ‘abstracted’. For example, Minstrell (2001) talks of discrete and independent units
called ‘facets’ that characterize a student’s scientific repertoire. Minstrell’s collection of
facets is extensive, and ranges from characterizing the ‘scientific method’ (e.g.
Experimenting: changing things and seeing what happens) to describing individual
scientific ideas (e.g. Heavier falls faster). The use of facets allows for the identification
of the ideas of students; ideas that are shown to be present in a large number of
students of the same age and ability and which are problematic to learning. These
facets are considered to be a ‘crude’ and functional way of becoming aware of
students’ thinking in the classroom context.
16
Another theoretical construct to emerge from the piece-like perspective is the
‘phenomenological primitive’ (p-prim)(diSessa, 1993). A p-prim is a unit of knowledge
that describes a general mechanism or action that students believe is an irreducible
feature of reality (requiring no further explanation). For example, if a student believes
that the reason is it hot in summer is because the Earth is closer to the sun at this
time in its orbit, then this student may hold the p-prim ‘closer is stronger’. ‘Closer is
stronger’ is both intuitive and true in other contexts, such as the opposite poles of
magnets attracting each other, or feeling warmth from a fire, and so a justification is
not considered necessary. The p-prim has a further characteristic of being quickly
substantiated and difficult to abandon. Successful conceptual change, or learning,
would involve reorganizing the structure around which the p-prim is embedded. That
is, the ‘expert’ may still exhibit the same p-prim as the student, but the student’s is
part of a ‘very broad and shallow explanatory system’ whilst the expert’s p-prims are
part of a more complex system such that “the physical laws are the explanatory unit,
rather than a slew of p-prims” (diSessa, 1993, p. 143). The identification of a p-prim
presents a way of representing elements of student understanding, which helps to
facilitate communication amongst researchers and students and, like Chi’s ‘ontologies’,
helps explicate and describe the basis of the difficulty.
3.1.3 The Resources Framework
The Resources Framework (RF)(Redish, 2004) is the most sophisticated and
comprehensive assimilation of theoretical concepts to develop from the ‘piece-like’
view, and offers a structure into which smaller units –or resources –are integrated. P-
prims and facets, both ‘resources’, may be considered different grain sizes of interest in
this structure. This is also the case with mis- or alternative conceptions. Redish writes,
on the necessity for a subsuming theoretical structure, that “A shared language and
shared assumptions that can both guide and allow us to compare different approaches
and ways of thinking” (p. 2). Redish also states that his account of learning is based on
research from cognitive science, neuroscience and sociolinguistics in an effort to “help
transform a collection of independent ‘facts’ into a coherent science, capable of
evaluating, refining, and making sense of our accumulated experimental data” (p. 1).
17
The RF is based on the idea of connections between resources and amongst resources
(concepts, facets, p-prims etc.), where resources are ‘quasi’ independent rather than
manifestations of a coherent ‘naïve’ theory. This places the RF at odds with the views
of theory-like proponents, such as Vosniadou. The choice of which resource is utilised,
in the theoretical respect, is dependent on the research context or question that needs
to be addressed, so that the use of facets may be more illuminating in one particular
case and p-prims in another. The theoretical framework, which is multidisciplinary and
explicated in a substantial document and subsequent papers, is centred on explaining
‘local conceptual coherences’ in student thinking. Redish has proposed three different
classes of cognitive mechanism that can contribute to local conceptual coherences in
student thinking: those relating the effect of context, those relating to the structure of
knowledge and those relating to effect of personal ‘epistemologies’.
On context
Neuroscience strongly informs the context aspect of the framework –although the
resultant principles do not depend upon specific neuroscientific mechanisms. For
example, based on the neuroscientific description of memory and memory activation,
the following principle is proposed:
The activation of a particular resource in response to a presented
stimulus can depend not only on the stimulus but on the context – the
activation pattern existing in the brain when the stimulus is presented
(Redish, p. 15).
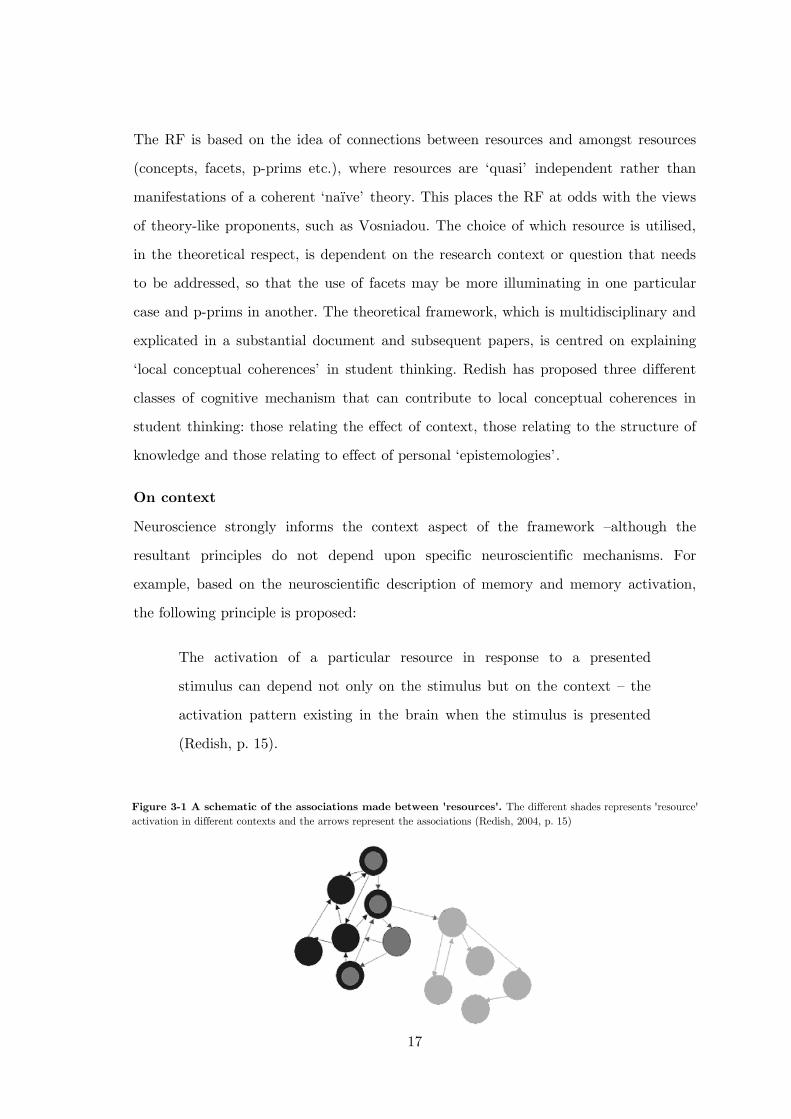
Figure 3-1 A schematic of the associations made between 'resources'. The different shades represents 'resource' activation in different contexts and the arrows represent the associations (Redish, 2004, p. 15)
18
Figure 3-1 shows a representation of this mechanism: the nodes do not necessarily
represent neural networks or physical ‘nodes’; they represent some abstraction of a
‘knowledge piece’. Important, is the presence of several resources and their activation
(and therefore the implied suppression of others under different circumstances). Redish,
diSessa and others suggest that this is a useful representation in that it reduces the
tendency to apply the ‘misconceptions’ model of replacing incorrect ideas with
scientifically consistent ones, and allows for a variety of different cognitive responses to
the same stimuli –even with respect to just one individual.
However, they also admit that due to the huge numbers of activated resources for even
a short, simple learning task, we are a long way off from using this as a model in any
empirical sense; the nodes and their connectives are figurative, rather than
characterising.
Knowledge and knowledge structures
The knowledge and knowledge structure aspect of the framework centres on the nature
and structure of a student’s knowledge. Apart from simply taking a ‘pieces-like’ view,
Redish also ascribes organization to these pieces. Consider the characteristics of the
resources mentioned so far: facets are ‘concrete’ (or least abstracted) nodes and p-
prims are slightly more abstracted ones. P-prims are more abstracted in that they are
the more general form of a number of more specific pieces; they may cover more than
one specific idea (being closer to the fire or bringing the magnets closer together).
Redish is able to convincingly extend and integrate these two concepts by assigning
internal structure to p-prims such that they represent two levels of ‘abstraction’ where
the less abstract level is now replaced with the ‘facet’. P-prims, therefore, now consist
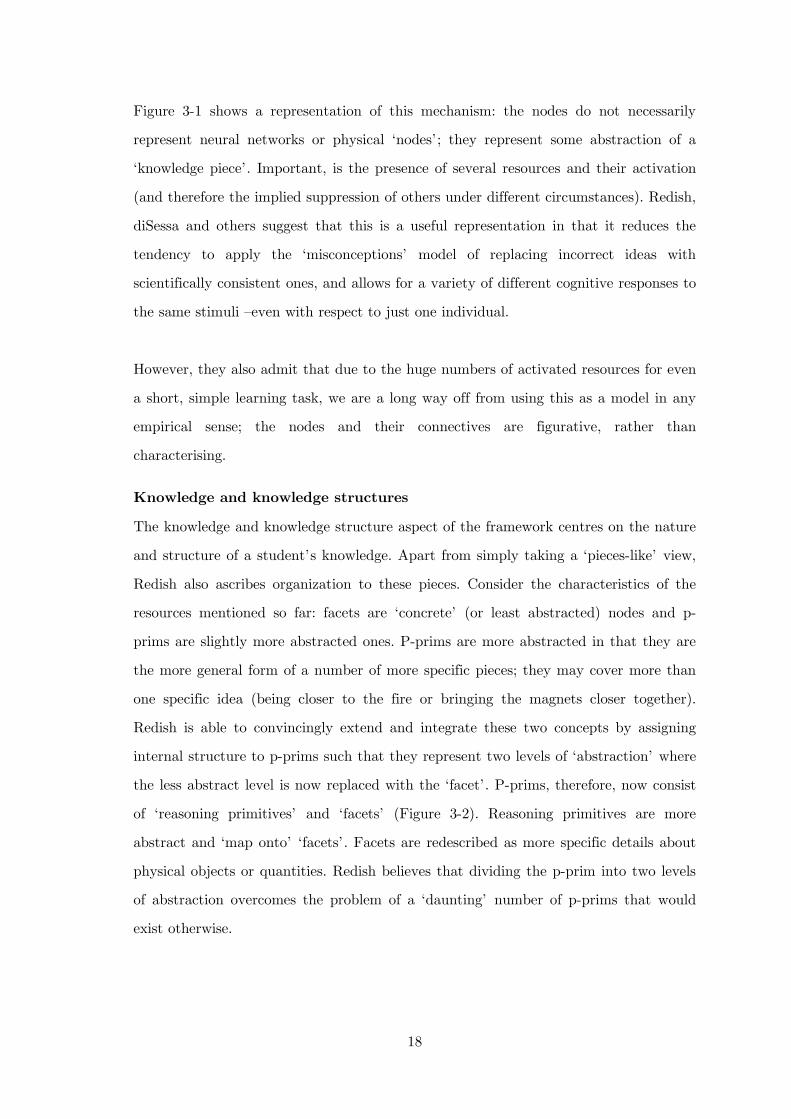
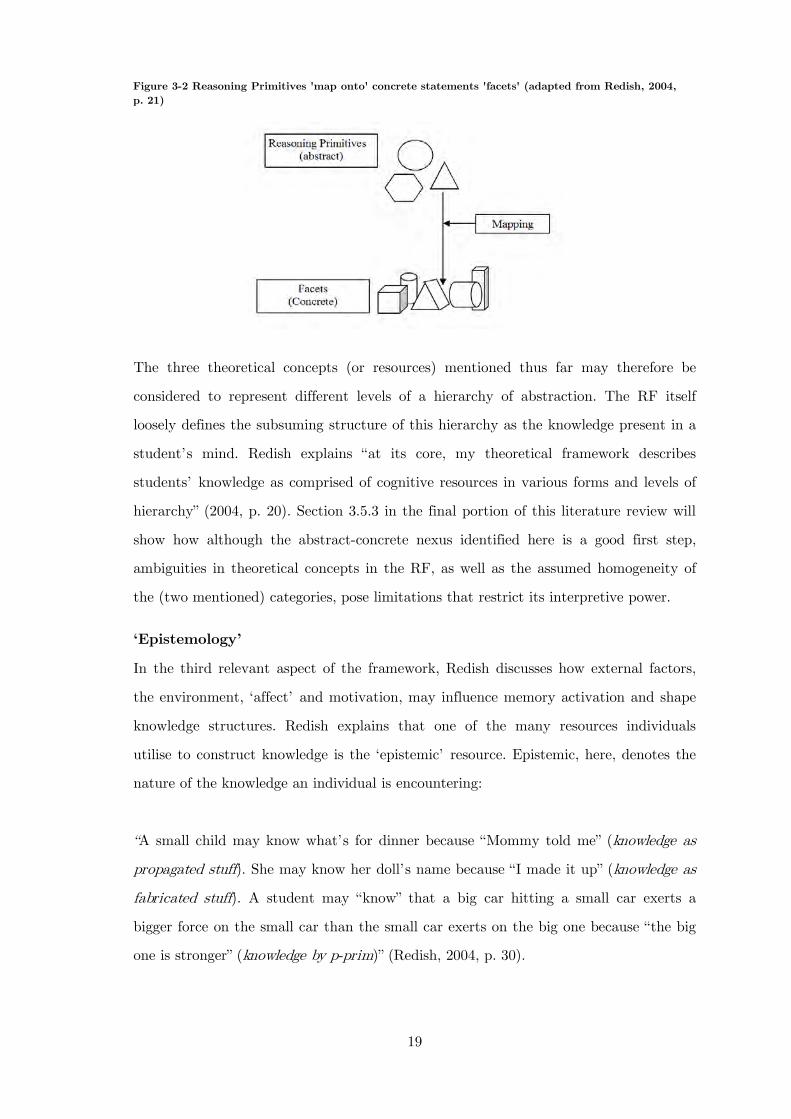
of ‘reasoning primitives’ and ‘facets’ (Figure 3-2). Reasoning primitives are more
abstract and ‘map onto’ ‘facets’. Facets are redescribed as more specific details about
physical objects or quantities. Redish believes that dividing the p-prim into two levels
of abstraction overcomes the problem of a ‘daunting’ number of p-prims that would
exist otherwise.
19
The three theoretical concepts (or resources) mentioned thus far may therefore be
considered to represent different levels of a hierarchy of abstraction. The RF itself
loosely defines the subsuming structure of this hierarchy as the knowledge present in a
student’s mind. Redish explains “at its core, my theoretical framework describes
students’ knowledge as comprised of cognitive resources in various forms and levels of
hierarchy” (2004, p. 20). Section 3.5.3 in the final portion of this literature review will
show how although the abstract-concrete nexus identified here is a good first step,
ambiguities in theoretical concepts in the RF, as well as the assumed homogeneity of
the (two mentioned) categories, pose limitations that restrict its interpretive power.
‘Epistemology’
In the third relevant aspect of the framework, Redish discusses how external factors,
the environment, ‘affect’ and motivation, may influence memory activation and shape
knowledge structures. Redish explains that one of the many resources individuals
utilise to construct knowledge is the ‘epistemic’ resource. Epistemic, here, denotes the
nature of the knowledge an individual is encountering:
“A small child may know what’s for dinner because “Mommy told me” (knowledge as
propagated stuff). She may know her doll’s name because “I made it up” (knowledge as
fabricated stuff). A student may “know” that a big car hitting a small car exerts a
bigger force on the small car than the small car exerts on the big one because “the big
one is stronger” (knowledge by p-prim)” (Redish, 2004, p. 30).
Figure 3-2 Reasoning Primitives 'map onto' concrete statements 'facets' (adapted from Redish, 2004, p. 21)
20
Redish explains that a device that is useful for thinking about the environments in
which epistemic resources are enacted is ‘frames’. Redish describes frames as
circumstances (physical or otherwise) which influence student’s choice of epistemic
resources. Students in one frame may misconstrue what is happening because they
believe they are acting in another and therefore apply inappropriate resources. Thus,
we must consider that when students enter a classroom, they ‘frame’ what is going on.
This framing process has many components:
• a social component (Who will I interact with and how?)
• a physical component (What materials will I be using?)
• a skills component (What will I actually be doing?)
• an affect component (How will I feel about what I’m going to be doing?)
• an epistemological component (How will I learn/build new knowledge here? and
What counts as knowledge here?)
Redish explains that the ‘epistemological’ aspect of framing is the most important in
teaching and learning contexts (p. 34). He further shows how a ‘mismatch’ in framing
can be problematic, that students frames can be robust, and that attending to framing
‘clashes’ results in positive learning and motivational outcomes.
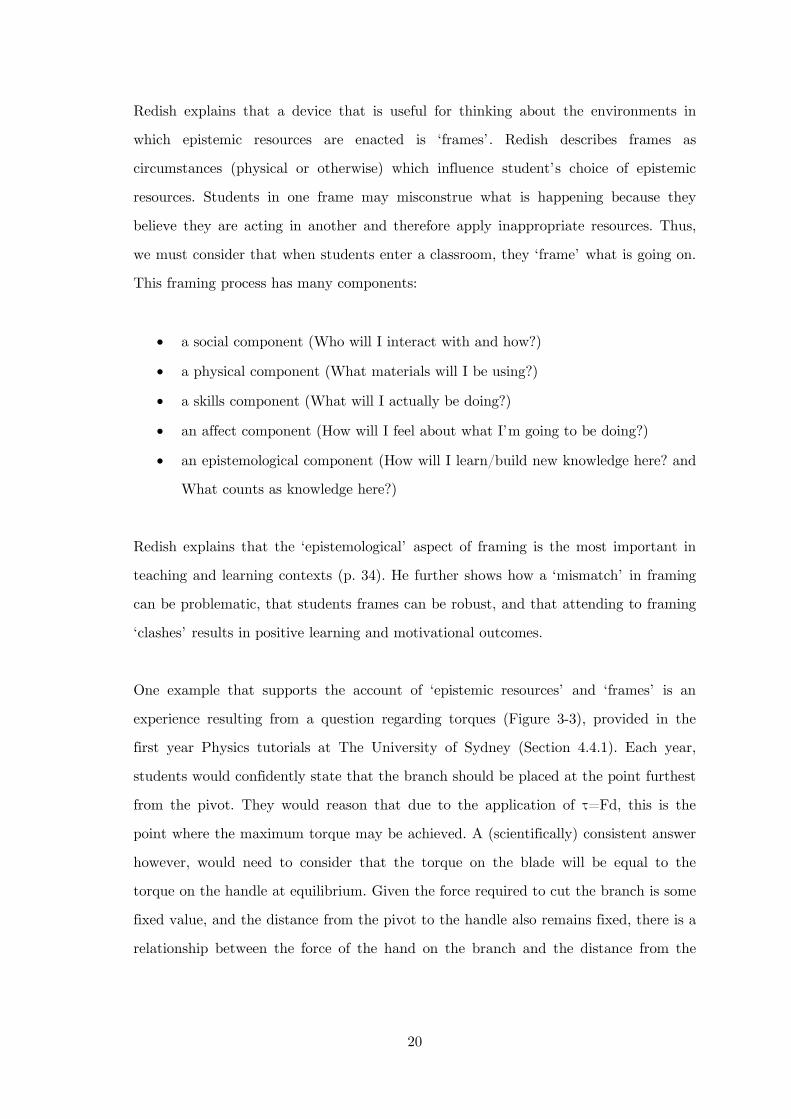
One example that supports the account of ‘epistemic resources’ and ‘frames’ is an
experience resulting from a question regarding torques (Figure 3-3), provided in the
first year Physics tutorials at The University of Sydney (Section 4.4.1). Each year,
students would confidently state that the branch should be placed at the point furthest
from the pivot. They would reason that due to the application of τ=Fd, this is the
point where the maximum torque may be achieved. A (scientifically) consistent answer
however, would need to consider that the torque on the blade will be equal to the
torque on the handle at equilibrium. Given the force required to cut the branch is some
fixed value, and the distance from the pivot to the handle also remains fixed, there is a
relationship between the force of the hand on the branch and the distance from the
21
pivot to the branch: the closer the branch is to the pivot, the smaller the force required
from the hand.
On reaching this explanation during discussions with their tutors and each other, the
students recognise that they are familiar with this outcome; they have physically
experienced placing an object nearer the pivot on a pair of scissors to make cutting the
object easier. When asked why they did not utilize this intuition or experience when
answering the question, students would often reply “because that’s real life and this is
physics!”.
This example shows how ‘frame clashes’ may affect learning, (common sense frames
clashing with physics knowledge frames), and how being aware of these frames allows
the instructor to help the students reach a better understanding (by acknowledging it
is acceptable to use common sense in some situations). However, the issue with this
approach is that it falls into the trap of the p-prim; it describes knowledge as a
plethora of categories that are not only too numerous to work with, but, again, also
not clearly defined. For example, what are the qualities of the different kinds of
knowledge that make them different?
Figure 3-3 Tutorial Question on Torques (also past exam question)
22
These are precisely the problems that invited a different approach from LCT, since one
of the most powerful aspects of theory is its description of the organizing principles of
knowledge. LCT is concerned with explicating the characteristics that make knowledge
different (and therefore produce these different frames). That is, how can we describe
qualities of knowledge that allow it to be classified as ‘knowledge as propagated stuff’
or knowledge as ‘common sense’ or knowledge as stated by an ‘authority’? These
questions will be further detailed in Section 3.5.
3.1.4 A summary of conceptions and theory
The Resources Framework is neither a theory of knowledge or of learning; it is a
coherent and subsuming structure through which other research agendas and scientific
findings can be embedded to give them more explanatory power. A particular example
can be made of conceptions research. One of the most problematic aspects of the early
conceptions research was that misconceptions, whether in description or through
methodological analysis, were assumed to be discrete, homogenous and somewhat fixed.
The misconception that heat is a substance, for example, is depicted as a unitary
structure that may or may not be linked to other knowledge, it takes the same form
whenever identified in a student’s thinking and should be replaced with the correct
conception relating to heat being an energy transfer. In incorporating findings from the
literature that show student’s ideas being context dependent and dynamic, the RF can
instead characterise misconceptions as inappropriate ‘mapping’ between primitives and
facets. Using this framework, external factors are expected to ‘activate’ different
arrangements of these resources meaning that this mapping may occur differently in
response to different environments and contexts.
There is a secondary, ‘meta’ advantage of the RF; it is really the only theoretical
framework in science education research. Those researchers developing the RF identify
as belonging to the field of Physics Education Researcher (PER). PER is a unique
subset of what is known in science education research as the Discipline Based
Educational Research (DBER) coalition. No other DBER faction has engaged in
23
consistent, progressive efforts to develop any other theoretical program apart from the
RF and as such, no other theory dominates.
Ironically, PER is also one of the most focused on the other ‘applied’ end of the
spectrum. It is described as the development of ‘research-based …tools and processes
for practitioners’ (Burkhardt & Schoenfeld, 2003, p. 3). In fact, some researchers in
PER are concerned that the focus on theoretical or social aspects weakens the position
and influence of the field and would prefer it be a powerhouse for the improvement of
practices (McDermott, 1990). Furthermore, although the resources framework is
tolerated, many other social and educational theories are not (Morais, 2002) and
methodological and practical research is accepted to proceed (and be published)
without any specific reference to theory (See also, Section 3.4).
This seemingly contradictory characteristic of the field of PER will be explicated in the
next section, where the more ‘applied’ developments in the field are described. These
practical advances, synonymous with PER, do not rely on any theoretical or
epistemological constructs and include the Expert-Novice work and the work on Active
Learning.
3.2 PER: practical developments
3.2.1 Interactivity and Active Learning
Second only to conceptual change and conceptions in terms of prominence in the
science education research agenda is the matter of ‘Instructional Practice’ (Chang et
al., 2010). This is not surprising, given that many in science education, particularly
physics education, are part of science faculties and are encouraged to work on
improving local teaching programs. In the context of the large lecture classes of first
year Physics courses, the literature is uncommonly consistent in recommending Active
Learning practices as a way of improving instruction above all others (Hake, 1998;
Meltzer & Manivannan, 2002). Active Learning reflects the strengthening of student
participation for the purpose of positively affecting student learning and attitudes
towards learning.

24
Although it is unsurprising that during an undergraduate degree the level of
involvement of students in their studies is related to their success and enjoyment of
them, this area of research looks at specific instructional interventions that facilitate
this involvement. The instructional method used to facilitate Active Learning (in
science education research) is generally known as ‘Interactive Engagement’ (IE).
The Active Learning movement stemmed from the constructivist movement but, often,
academic papers on Active Learning do not refer to constructivism or only refer very
broadly to it, instead simply highlighting student involvement –‘hands on, mind on’ –
or student-centeredness as theoretical grounding. An appropriate theoretical framework
is not suggested or called upon from this large body of research, nor is its requirement,
in terms of delivering local improvements in learning due to specific instructional
developments, convincing.
Descriptions of the most common types of IE employed in science education are
provided below.
Demonstrations: Demonstrations involve an instructor illustrating a concept or idea
with reference to scientific equipment or other physical or virtual apparatus.
Demonstrations have a very long history in science education –particularly physics –
and have always played a part in the standard undergraduate course as a way of
showing physical phenomena or scientific processes on a larger scale. Demonstrations
are very popular with undergraduate students, with evaluations persistently returning
opinions of them being the ‘best part’ of the course. However, some time ago, it
emerged that the use of Demonstrations has not been critically examined as much as it
should; that their usefulness has been taken for granted and more research should be
drawn on when designing or using Demonstrations (Garrett & Roberts, 1982). Since
then, several issues associated with Demonstrations have been further examined,
mainly those identified to be associated with the question of whether there was any
academic advantage beyond entertainment value (Crouch, 2004). The community now
25
makes a distinction between just ‘Demonstrations’ and demonstrations that engage the
learner in a more meaningful way, such as those which also include the use of Peer
Instruction, Personal Response Systems or Interactive Lecture Demonstrations.
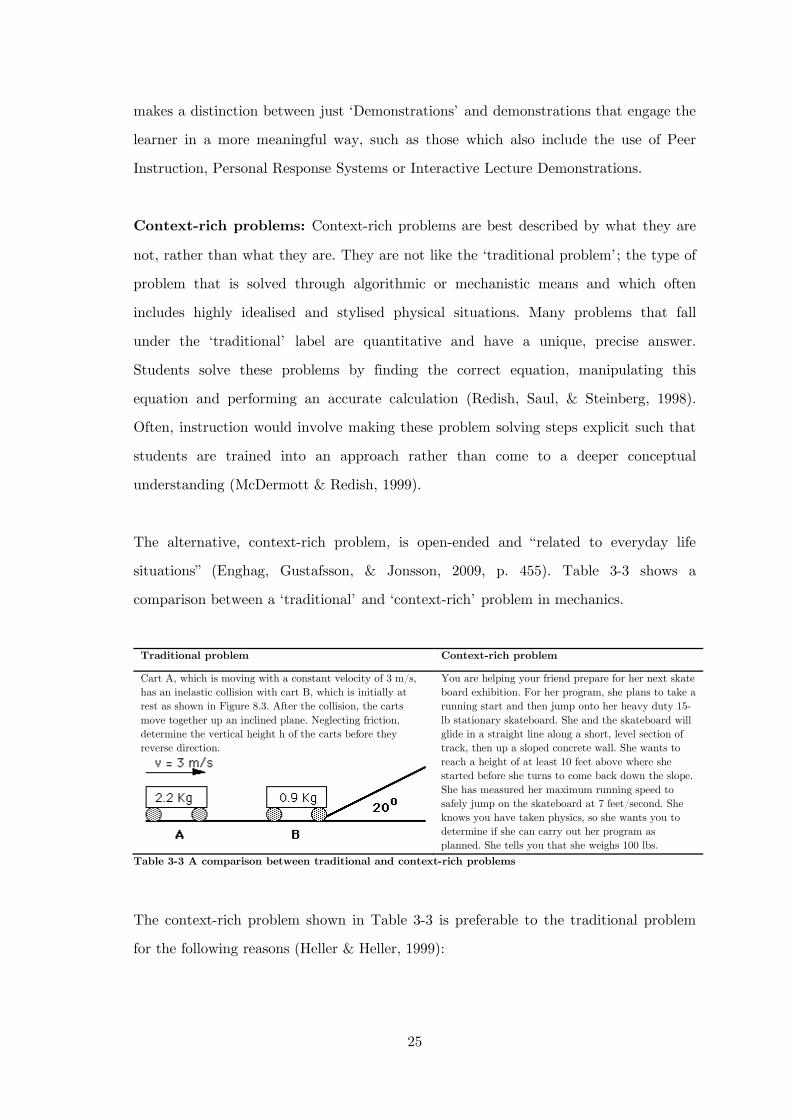
Context-rich problems: Context-rich problems are best described by what they are
not, rather than what they are. They are not like the ‘traditional problem’; the type of
problem that is solved through algorithmic or mechanistic means and which often
includes highly idealised and stylised physical situations. Many problems that fall
under the ‘traditional’ label are quantitative and have a unique, precise answer.
Students solve these problems by finding the correct equation, manipulating this
equation and performing an accurate calculation (Redish, Saul, & Steinberg, 1998).
Often, instruction would involve making these problem solving steps explicit such that
students are trained into an approach rather than come to a deeper conceptual
understanding (McDermott & Redish, 1999).
The alternative, context-rich problem, is open-ended and “related to everyday life
situations” (Enghag, Gustafsson, & Jonsson, 2009, p. 455). Table 3-3 shows a
comparison between a ‘traditional’ and ‘context-rich’ problem in mechanics.
Traditional problem Context-rich problem
Cart A, which is moving with a constant velocity of 3 m/s, has an inelastic collision with cart B, which is initially at rest as shown in Figure 8.3. After the collision, the carts move together up an inclined plane. Neglecting friction, determine the vertical height h of the carts before they reverse direction.
You are helping your friend prepare for her next skate board exhibition. For her program, she plans to take a running start and then jump onto her heavy duty 15-lb stationary skateboard. She and the skateboard will glide in a straight line along a short, level section of track, then up a sloped concrete wall. She wants to reach a height of at least 10 feet above where she started before she turns to come back down the slope. She has measured her maximum running speed to safely jump on the skateboard at 7 feet/second. She knows you have taken physics, so she wants you to determine if she can carry out her program as planned. She tells you that she weighs 100 lbs.
Table 3-3 A comparison between traditional and context-rich problems
The context-rich problem shown in Table 3-3 is preferable to the traditional problem
for the following reasons (Heller & Heller, 1999):
26
• It portrays real objects that tie physics to the real world.
• Students must make a decision about which physics to mobilise and which
assumptions are relevant
• Student must select which representations are best, rather than use the ones
presented to them in the question
• Variables are not pre-defined, encouraging the students to consider which
variables would be relevant
Active Learning is encouraged by “creating physics problems that are contextualised
and anchored in the lives of learners (so) that the physics problem solving is
meaningful and interesting to learners and relevant to their own lives” (Enghag,
Gustafsson, & Jonsson, 2007, p. 449). Although context-rich problems have been
mildly successful in improving student understanding, more success has been noted in
motivational aspects, particularly with students ‘taking ownership’ of their own
learning and for encouraging social participation within the scientific culture when used
in peer learning environments. Despite these findings, research on context-based
problems (and context-based instruction) remains considerably under-developed
(Taasoobshirazi & Carr, 2008).
‘Clickers’ or other form of Audience Response System (ARS): These systems,
electronic or otherwise, involve students revealing their reckoning to the instructor,
usually by selecting a multiple-choice alternative. The reasoning for this technique is to
involve all students in the class and is geared towards the large lecture format. Some
instructors have utilised and continue to use the individual whiteboard as a mechanism
for compiling feedback from students due to its price and convenience; however, at the
tertiary level electronic systems are much more widespread (Fallon & Forrest, 2011;
Lasry, 2008). Electronic devices have the advantage of tracking student responses over
a period of time and also storing responses for future analysis. They are known under
many pseudonyms (“kee-pads” in the United States and “handsets” or “zappers” in the
United Kingdom) but generally consist of a remote-control-like device with numbered
or lettered buttons that work wirelessly with corresponding software to allow two-way

27
communication. More recently, freeware has allowed students to use their own devices
(Tremblay, 2010) making the technique more accessible. At the same time, more
sophisticated systems like Pearson’s ‘Learning Catalytics’ 1
, have also been developed
to cater for more comprehensive usages. ARSs have been associated with many positive
outcomes including engagement, retention and increased learning outcomes
(Beuckman, Rebello, & Zollman, 2007; Brady, Seli, & Rosenthal, 2013; Caldwell, 2007;
Draper & Brown, 2004; Kay & LeSage, 2009; Keller et al., 2007; Knight & Wood, 2005;
MacArthur & Jones, 2008; Sharma, Khachan, Chan, & O'Byrne, 2005; Willoughby &
Gustafson, 2009).
Peer Instruction: Peer Instruction is a teaching method popularised by Eric Mazur
of Harvard University and involves shifting the nature of the activities taking place in
formal class time. Usually, this shift occurs away from lecturer presentation of material
and towards student discussion of concepts and problems (Mazur, 2001). In Mazur’s
model, Peer Instruction involves allocating activities or readings before the lecture, so
that during the lecture, students consider a concept or problem first individually, then
with their peers, and then engage in a feedback loop with the lecturer. This approach
has been reported as successful yet effortful to successfully implement and maintain
(Lasry, Mazur, & Watkins, 2008; Mazur, 2001; Turpen & Finkelstein, 2009). In more
recent years, Peer Instruction has been appropriated and in some cases has morphed
into ‘Flipped’ teaching, which has gathered enormous momentum within and beyond
higher education (The White House, 2013). This move has been facilitated by
developments in the quality and accessibility of online resources, particularly
instructional videos, which students may engage with outside of and usually before
formal class time.
Workshop Tutorials: Workshop Tutorials is an initiative that comes out of the
University of Washington and involve an interactive, cooperative, student driven
problem solving environment which will often take place in addition to lectures (and in
place of recitations). The tutor is facilitator and students work in small collaborative 1 https://learningcatalytics.com/

28
groups to solve context-rich problems that have been the product of a collaborative
and iterative research process (McDermott & Shaffler, 2002). Workshop Tutorials have
been shown to be highly effective for first year Physics courses (Galili, 2011;
McDermott, 2001; Sharma, Mendez, & O'Byrne, 2005).
Laboratory sessions: Laboratory sessions are common but not always mandatory
requirement of a first year Physics course. They involve working with experimental
equipment to strengthen laboratory skills and consolidate important scientific concepts.
Usually, this activity occurs outside the lecture course. Early laboratory work followed
a prescriptive process but developments in educational research have resulted in more
‘inquiry based’ techniques which involve more autonomous thinking on behalf of the
student (Buntine et al., 2007; Hofstein & Lunetta, 2004).
Interactive Lecture Demonstrations (ILDs): Interactive Lecture Demonstrations
are a teaching technique developed by Sokoloff and Thornton (1997) whereby students
interact with a demonstration through a series of worksheets that are designed to illicit
student ideas and develop them through discussion with peers and feedback to the
instructor. It effectively involves a combination of a range of research based techniques
including Peer Instruction and sometimes ARSs (Bonwell & Eison, 1991; Mazur, 2001).
The ILDs were developed in many physics topics such as mechanics, heat and
temperature and optics, and there exists a large body of research that documents their
implementation and success (Sharma et al., 2010; Sokoloff & Thornton, 2004). During
the implementation, the students are handed two identical sheets (of different
functions): one on which to write their predictions and hand in, and the other, to keep
as a record of the outcomes of the demonstrations. Each demonstration involves: an
introduction to the equipment, an introduction to the problem, time for students to
make a prediction both individually and with peers and finally, a presentation of the
results. During this last stage, students record the ‘correct’ outcome on the sheet they
will keep (see also Section 5.1.1).

29
Studio teaching: Studio teaching involves students working in a ‘studio’ classroom
environment which usually takes the form of a room that combines a lab, homework
and tutorial. Although the studio teaching model may vary, the main premise is that
students work collaboratively in small groups on context rich problems and with
experimental equipment. They also have access to significant resources and high tutor
to student ratios (Beichner et al., 2007; Cummings, Marx, Thornton, & Kuhl, 1999). In
its purest form, it is arguably the most interactive form of teaching physics. However,
it has also been adapted to work in large lecture theatres under the same name or as
SCALE-Up with less effect (Beichner et al., 2007).
To avoid the controversy that often surrounds listing, the following issues should be
considered in regards to the IEs mentioned above. First, the descriptions provided refer
to the ideal form of each technique. Whether this ideal form is achieved when
implemented in practice is dependent on a number of factors including: individual
instructors interpretation of the implementation, student cooperation, time and
apparatus constraints and educational ability (Prince, 2004). Some researchers would
also disagree with the nomenclature or descriptions, as has been the case in the
literature around the Problem-Based-Learning or Inquiry debates (Camp, 1996;
Kirschner, Sweller, & Clark, 2006) and even ‘Student-centered’ approaches, which
exhibit “ a marked tendency for there to be more discussion and lip-service paid to the
idea, than actual practice” (Farrington, 1991, p. 16). Also, many of these approaches
may involve one or more additional IE at some point during the implementation, such
as the use of clickers in Peer Instruction or the use of Demonstrations in Workshop
Tutorials.
Despite the general consensus of the triumph of IE approaches, there exists criticism
which ranges from the logistical to the philosophical and is deserving of consideration.
Firstly, it is widely reported that some IE techniques are time consuming to prepare,
employ and maintain (Wieman, 2009). Weiman has noted that even if IE techniques
are introduced and employed by one member of staff, it is not easy to convince others
to cooperate (2009), resulting in a relatively small sphere of influence:
30
Physics Education Research (PER) practitioners have engaged in
substantial curriculum development and dissemination work in recent
years. Yet, it appears that this work has had minimal influence on the
fundamental teaching practices of the typical physics faculty (Henderson
& Dancy, 2008, p. 79).
Because physics education researchers are almost always also physics lecturers, and
these IE techniques are meant to be used by lecturers, the reasons that research based
instructional design is not taken up by faculty are of importance. In this respect,
pedagogical techniques like Active Learning are susceptible to criticism by instructors
of physics because they are part of a movement that is often placed in opposition to
‘traditional’ modes of teaching. Such binary oppositions are common in the educational
literature: “Phonics (versus) whole language approach(es), skills-based versus
experience based, concrete versus abstract, directed versus discovery- the categories
and their curricular offshoots seem endless” (Alexander, Murphy, & Woods, 1996, p.
31) and this can negatively impact on the respective research areas. ‘New’ or ‘non-
traditional’ modes of teaching are often criticised for being different versions of a
previously seen technique or ‘flavour of the moment’ and although these criticisms
may, in some cases, be valid, Alexander et al. explain that it also may be a problem
between the design of the innovation and its implementation. They argue that the
innovation may fail due to implementers not having a ‘rich understanding’ of it, which
leads to superficial application, or that they do not have “an extensive knowledge of
the literature or research that underlie these innovations, resulting in the reinvention
or recycling of old movements under new labels” (1996, p. 31).
It is also demonstrated that if not properly implemented, IE techniques may not result
in Active Learning at all (Turpen & Finkelstein, 2009). For example, if clickers are
used for testing a sequence of multiple-choice questions with no time for challenging
certain popular but incorrect student responses and there is no time for discussions,
then the use of the clickers may not have the desired outcomes. To that effect, the
Andrew’s et al. study (2011) outlines that many positive results from interventions
focusing on increasing interactivity have involved science education experts actually
31
conducting the IE and show no improvements when corrected for a random selection of
instructors. Although many studies on Active Learning reveal positive reactions
towards IE techniques, (Vernon & Blake, 1993), it is also clear that students feel
somewhat uncomfortable in approaches such as Peer Instruction, which often
significantly alter the standard lecture format.
Amongst these concerns, conclusions about exactly what the ‘active ingredient’ in
Active Learning is have not been fully scrutinized (Bonwell & Eison, 1991; Prince,
2004). For example, a recent study around IE implementation in Biology shows that
learning gains are not merely related to increasing interactivity but more to the specific
objective of the IE, such as addressing misconceptions (Andrews et al., 2011), engaging
with context (Buncick, Betts, & Horgan, 2001), or introducing other ‘research based
activities’ (Cummings, Marx, Thornton, & Kuhl, 1999).
In an effort to address the issue with transparency, some researchers have identified
the need for instruments designed to assess the fidelity of the implementation (Granger
et al., 2012). These instruments are designed to provide information about what the
instructor was doing, what the students were doing and how effective the programs
implementation was (see for example, Section 5.2.3 ), although such instruments are
not yet the norm for Active Learning studies.
3.2.2 Developing from Novices to Experts
The next major ‘practical’ focus in PER that will be discussed is the work on ‘novices’
and ‘experts’. This research is based on early assumptions around the hierarchical
nature of development. For example, Nussbaum and Novak’s study explains that
children ‘had five different notions or concepts’ about the earth (Nussbaum & Novak,
1976, p. 542) where notion five contains all the ‘necessary aspects of the concept’ and
where ‘each succeeding notion exhibits some significant attainment that the lower one
lacks’ (p. 546).
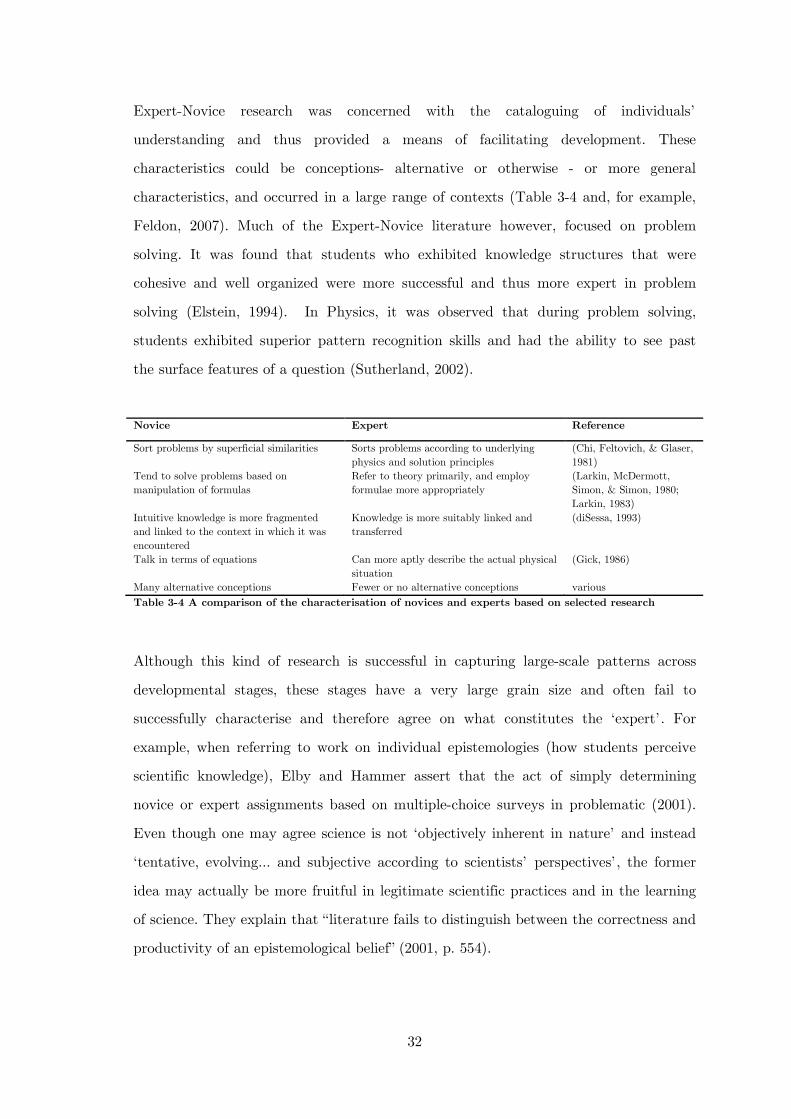
32
Expert-Novice research was concerned with the cataloguing of individuals’
understanding and thus provided a means of facilitating development. These
characteristics could be conceptions- alternative or otherwise - or more general
characteristics, and occurred in a large range of contexts (Table 3-4 and, for example,
Feldon, 2007). Much of the Expert-Novice literature however, focused on problem
solving. It was found that students who exhibited knowledge structures that were
cohesive and well organized were more successful and thus more expert in problem
solving (Elstein, 1994). In Physics, it was observed that during problem solving,
students exhibited superior pattern recognition skills and had the ability to see past
the surface features of a question (Sutherland, 2002).
Novice Expert Reference
Sort problems by superficial similarities Sorts problems according to underlying physics and solution principles
(Chi, Feltovich, & Glaser, 1981)
Tend to solve problems based on manipulation of formulas
Refer to theory primarily, and employ formulae more appropriately
(Larkin, McDermott, Simon, & Simon, 1980; Larkin, 1983)
Intuitive knowledge is more fragmented and linked to the context in which it was encountered
Knowledge is more suitably linked and transferred
(diSessa, 1993)
Talk in terms of equations Can more aptly describe the actual physical situation
(Gick, 1986)
Many alternative conceptions Fewer or no alternative conceptions various Table 3-4 A comparison of the characterisation of novices and experts based on selected research
Although this kind of research is successful in capturing large-scale patterns across
developmental stages, these stages have a very large grain size and often fail to
successfully characterise and therefore agree on what constitutes the ‘expert’. For
example, when referring to work on individual epistemologies (how students perceive
scientific knowledge), Elby and Hammer assert that the act of simply determining
novice or expert assignments based on multiple-choice surveys in problematic (2001).
Even though one may agree science is not ‘objectively inherent in nature’ and instead
‘tentative, evolving… and subjective according to scientists’ perspectives’, the former
idea may actually be more fruitful in legitimate scientific practices and in the learning
of science. They explain that “literature fails to distinguish between the correctness and
productivity of an epistemological belief” (2001, p. 554).
33
Hence it is not just ‘what’ an expert is thinking that is important, it is also ‘why’. The
former issue is well serviced by the categorisation-based research agenda but the latter
can only be answered by looking at the social and epistemological aspects. Osborne
asserts that “knowledge and understanding of the epistemology of science is an
essential aspect of any education in science, and any approach which neglects a
consideration of it is incomplete and epistemologically thin” (1996, p. 55). Relevant
social considerations that have influenced science education research are provided in
the next section.
3.2.3 A Social turn
Steiner and Mahn point out that the birth of sociocultural theories occurred with
Vygotksy, who ‘conceptualized development as the transformation of socially shared
activities into internalised processes’ whilst rejecting the Cartesian dichotomy of ‘the
internal and the external’ (John-Steiner & Mahn, 1996, p. 192). The external approach
to the construction of knowledge refers to behaviourism while the internal can be
considered as encompassing ‘individual views of learning’ and therefore has its focus on
subjective experiences (Leach & Scott, 2008). Individual, or subjectivist, views of
learning form the basis of most work in science and physics education research. That
is, there is a strong focus on what is ‘in the mind’ of the student. Consider the
following theoretical constructs which appear at various times throughout the
conceptions movement: conceptions, p-prims, conceptual ecologies, mental models, even
the Expert-Novice field of research –these terms all refer to individual knowledge.
Although there is, undoubtedly, a social shift in such research, knowledge construction
is almost always described as occurring firmly within the individual. Even when social
factors are considered, they are considered as acting as influences on a separate system;
the working mind. For example, in Redish’s RF, context (the environment or stimuli)
results in different arrangements of resources being activated (Figure 3-1) and
interactions with peers or ‘tools’ (epistemic forms) are ultimately described again as
activations of resources. These resources are both considered to be in the mind of the
student.
34
Leach and Scott argue that such individual, subjectivist models will always be
incomplete (Leach & Scott, 2008). They believe that the emphasis should be shifted
more clearly to the social, such that social factors do not merely influence cognition,
but become primary in the process of knowledge construction. They state, for example,
that ‘in formal learning situations, the concept of ‘viability’ has ‘more to do with social
reinforcement than reinforcement from perceptions of the physical world’ (Leach &
Scott, 2008, p. 94).
Sociocultural views fundamentally assume all higher mental functioning in the
individual is derived from social life. “In the first instance, language and other semiotic
mechanisms provide the means for scientific ideas to be talked through on the social
plane … the process of internalisation is where individuals then appropriate tools first
encountered on the social plane” (Vygotsky, 1978, p.128 in Leach & Scott, 2008, p.128,
p99). Driver et al. add that:
making meaning is thus a dialogic process involving persons-in-
conversation, and learning is seen as the process by which individuals are
introduced to a culture by more skilled members. As this happens they
‘appropriate’ the cultural tools, particularly language, through their
involvement in the activities of this culture (Driver, Asoko, Leach,
Mortimer, & Scott, 1994, p. 7).
One important issue, which was highlighted through sociocultural perspectives in
science education, was the primacy of language; language is no longer simply a means
of transportation of meaning, nor should it be considered neutral; language is a central
tool through which meaning in mediated. The centrality of language should be no great
surprise to scientists, as the ‘scientific language’ is perhaps amongst the most
specialised of languages, and one which has shaped the history of science. In
thermodynamics, for example, the word ‘heat’ has represented variable and ambiguous
physical processes throughout history, arguably influencing the development of the
science of thermodynamics (Morris, 1972). This word continues to be used to represent
35
multiple meanings, resulting in calls for clarification or disposal (Doige & Day, 2012;
Romer, 2001; Wiser & Carey, 1983; Zemansky, 1970).
In many ways, the social turn in educational research signalled a further
epistemological shift; it moved the focus away from the individual and further rejected
positivist notions. However, the interpretation of sociocultural views tended towards a
description that either posited ‘many individuals’ as being the repository of knowledge,
and thus merely compounding issues in the ‘subjectivist’ approach, or saw knowledge
as the ‘disguised interests of social groups’ (Maton, 2014). Maton (2014) explains that
this false dichotomy –between positivist and relativist constructivism– obscures
knowledge itself, a claim further expanded in Section 3.4.1.
As always, these theoretical views strongly influenced methodological and instructional
approaches. More attention was placed on the social environment as studies shifted to
consider ‘authentic’ learning environments, rather than conducted in isolation or as
sterile psychological experiments. Learning was considered an apprenticeship into a
culture and instructors were facilitators rather than the suppliers of knowledge.
However, while sociocultural views of learning became popular ‘ways of thinking’, their
lack of proliferation in the science education literature indicates that the
methodological and instructional consequences were not yet appropriately amenable or
adequate.
3.3 Methodologies
3.3.1 History of methodologies in Physics and science education research
The relationship between theory, research methods and changes to practice is
significant since developments in one sphere translate into another. This relationship
can be both fruitful and detrimental. A short history of research methods and the
significance of educational research on practice will be presented in an effort show both
aspects of this interrelationship. Specific examples of the most common quantitative
and qualitative methodologies widely used in science education research (and this

36
major project) will be presented to show their specific utility as well as their
limitations.
In the constructivist and misconceptions studies of the 1970’s, it was common to utilise
the ‘clinical interview’ methodology, popularised by Jean Piaget, the father of
‘constructivism’, to ascertain children’s ideas (although it is often stated that Piaget
had no interest in education, and constructivism, as conceived by Piaget, was of a very
different nature to the form it ‘morphed’ into for educational purposes). In the
interviews he conducted, which often included drawings, models and apparatus, Piaget
would quiz students, ask for predictions and explanations, and record understanding.
Many misconceptions authors adapted this method. Erickson, for example, conducted
interviews to gauge students’ understanding of thermodynamics concepts (Erickson,
1979). Ten students were quizzed about their ideas around certain situations involving
experiments or demonstrations with
heat. The goal of this approach was
to produce a ‘conceptual inventory’
of each student; a representation of
each student’s beliefs of certain
categories (Figure 3-4). One student,
for example, under the category ‘1.0
Composition of heat’, expressed the
idea that ‘there are two types of
heat- hot heat and cold heat’ and for
‘2.0 Movement of heat’ this student
said ‘heat moves through all substances’. Research that revealed students’
preconceptions or existing ideas in this way subsequently influenced instructional
practices. Most tangibly, instructional practices were changed to promote awareness
amongst both the student and the instructor. “Teachers should be aware that their
students may develop their own versions of the concept.” (Nussbaum & Novak, 1976,
p. 547). Specific strategies recommended to achieve this aim in the classroom included
“providing opportunities for pupils to make their own ideas explicit” and “encouraging
Figure 3-4 Categories of conceptions (Erickson, 1979b, p. 225)

37
the generation of a range of conceptual schemes” (Driver & Tiberghien, 1985, p. 200).
Teachers were encouraged to engage in anything from surveying their students
informally to producing wholesale teaching programmes based on the existence of
student’s own ideas (Bentley & Watts, 1994). Instruction was therefore considered to
be necessarily more ‘student-centred’ in that it was now vital that student’s ideas were
garnered and that students engaged in discussions both amongst themselves and with
the instructor. Although, retrospectively, the valorisation of ‘student-centeredness’ has
questionable foundations (see, for example, Farrington, 1991), it nonetheless allowed a
context for this kind of research to flourish.
Student’s ideas were also categorised with respect to what can be considered ‘quality’
(as opposed to content). Piaget’s ‘stage theory approach’ (stages of aptitude as defined
by certain criteria) was the basis for a large portion of research focused on determining
encouraging student sophistication in science. Categories defining each of these (or
other, adapted) stages were therefore used in methodologies ascertaining student’s
progression and were also referred to when considering the development of
instructional programs in schools. Several researchers and even some policy makers
drove to shape curricula, assessment and classroom practice around these stages.
Shayer and Wylam (1981), for example, conducted a study in the context of
Figure 3-5 Descriptions of differentiated levels for conceptions of heat (Shayer & Wylam, 1981 p.428)
38
understanding thermodynamics concepts to investigate at which stage students should
encounter heat concepts by producing a table adapted to the context of learning about
heat concepts that was representative of Piaget’s own hierarchical levels (Figure 3-5).
The analysis would indicate not only the level of sophistication level that the students
were currently operating at, but what the next stages of progression would look like.
There existed a reasonable level of success when describing and developing
understanding in this way, however, practitioners attested to confusion around what to
do when students fit in several stages at different times and when students are
operating above or below their expected developmental levels in different subject areas.
It was also not always clear exactly how progression through the stages could be
facilitated or accelerated (Case & Fry, 1973; Linn & Their, 1975).
3.3.2 Quantitative: Pre- and post- testing
As the precipitation of PER from the broader science education research field occurred,
the Piagetian methodologies became less popular and other, more specific
methodological developments surfaced. Research methodologies, quantitative and
qualitative, had to adapt to suit needs that are ever more specific and for PER, this
need was centred on the practitioner, and involved measuring the outcomes of
instructional development. To determine whether instructional developments have been
successful and to what degree, or if mis- or alternative conceptions have been
overcome, some sort of measurement of student learning must take place. In PER, this
occurs largely through testing students before instruction, after instruction and
sometimes weeks or months later. This pre- and post- is often mentioned as the field’s
main achievements in ascertaining the success of a particular implementation
(Cummings, 2013). Instruments used in pre- and post-testing include tiered multiple
choice exams to account for reasons for selections (Caleon & Subramaniam, 2010), brief
free-response questions (Kautz, Heron, Shaffer, & McDermott, 2005) and even
interviews (Clark, 2006). However, the straightforward multiple-choice test –intended
for very large samples and often including distractors that represent known
misconceptions –remains amongst the most popular. These multiple-choice tests
themselves have myriad labels including surveys, concept tests, concept inventories,
39
conceptual surveys, and topic specific labels such as ‘Thermal Concept Inventory’ or
‘Force Concept Inventory’. Often with conceptual surveys, distractors have been
canvassed from the students themselves through interview sessions and results from
these tests are also subsequently triangulated using other qualitative results. Due to all
of these characteristics, these surveys are considered the most successful way of
assessing students’ conceptual understanding (Ding & Liu, 2012).
The Force Concept Inventory (FCI) (Hestenes, Wells, & Swackhamer, 1992), a
multiple-choice instrument aimed at first year university students or high school
Physics students is the most well known of all the pre-post instruments although
instruments exist for almost all other scientific subjects and educational levels;
including, for example, evolution, higher-tertiary optics, quantum mechanics and many
others (Duit, 2009)2
. Survey research has also extended beyond ‘concepts’ (scientific
content) to include nature of science ideas, motivation, self-efficacy, epistemology etc.
These tests all share the common feature of being used before and after instruction to
measure some difference. In the area of thermodynamics, several different multiple-
choice style instruments exist (Kautz, Heron, Loverude, & McDermott, 2005; Kautz,
Heron, Shaffer, & McDermott, 2005; Loverude, Kautz, & Heron, 2002; Meltzer, 2004;
Wattanakasiwich, Talaeb, Sharma, & Johnston, 2013; Yeo & Zadnik, 2001).
The methods commonly used to measure whether change has occurred for quantitative
(multiple-choice) instruments include t-tests or ANOVA and also a newly appropriated
measure, the ‘Normalized Gain’ (<g>), a measure specially designed for use with
concept tests, particularly the FCI (Hake, 1998; Marx & Cummings, 2007). The <g>
measurement is considered a more appropriate quantitative measure of student
achievement since it takes into consideration pre-scores as well as overall gain and may
be used for individual students or large groups. Hake (1998) has also produced a graph
of gains versus pre-tests scores using thousands of individual test scores that outlines
what is considered a low, medium or high gain for the FCI (Figure 3-6).
2 Numerous tests in a variety of disciplines may be found at http://www.flaguide.org/tools/tools_discipline.php#anchor_astro
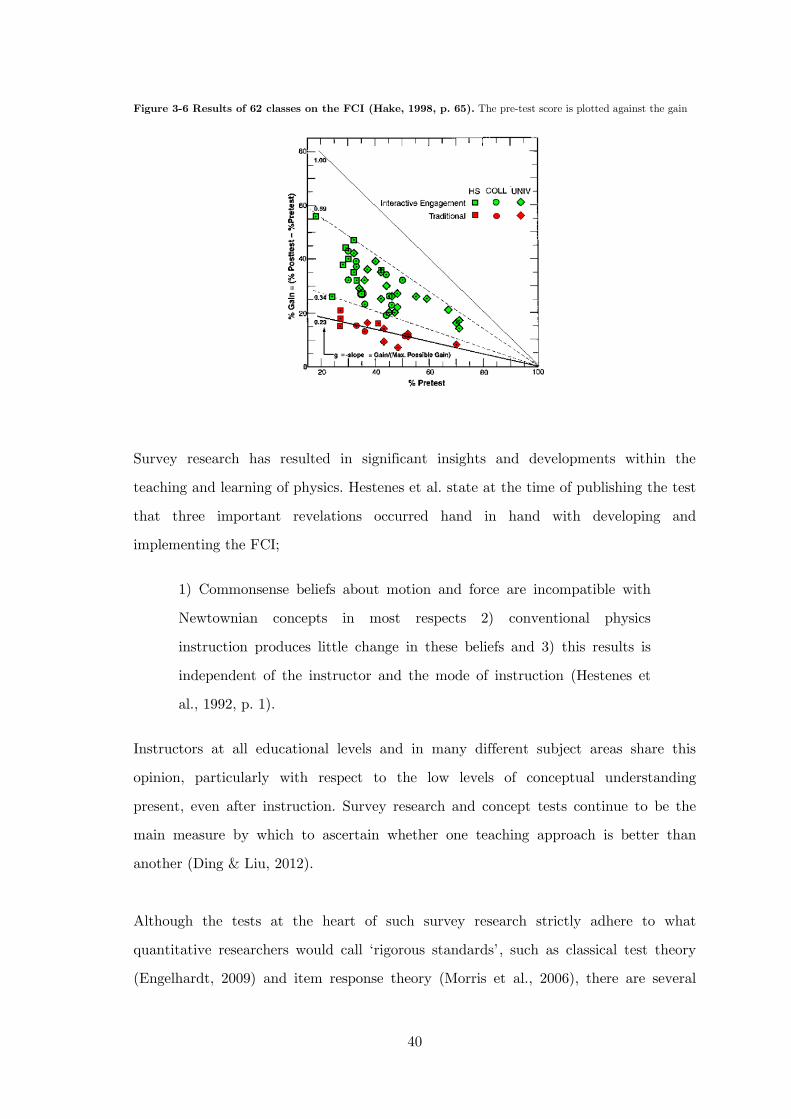
40
Figure 3-6 Results of 62 classes on the FCI (Hake, 1998, p. 65). The pre-test score is plotted against the gain
Survey research has resulted in significant insights and developments within the
teaching and learning of physics. Hestenes et al. state at the time of publishing the test
that three important revelations occurred hand in hand with developing and
implementing the FCI;
1) Commonsense beliefs about motion and force are incompatible with
Newtownian concepts in most respects 2) conventional physics
instruction produces little change in these beliefs and 3) this results is
independent of the instructor and the mode of instruction (Hestenes et
al., 1992, p. 1).
Instructors at all educational levels and in many different subject areas share this
opinion, particularly with respect to the low levels of conceptual understanding
present, even after instruction. Survey research and concept tests continue to be the
main measure by which to ascertain whether one teaching approach is better than
another (Ding & Liu, 2012).
Although the tests at the heart of such survey research strictly adhere to what
quantitative researchers would call ‘rigorous standards’, such as classical test theory
(Engelhardt, 2009) and item response theory (Morris et al., 2006), there are several
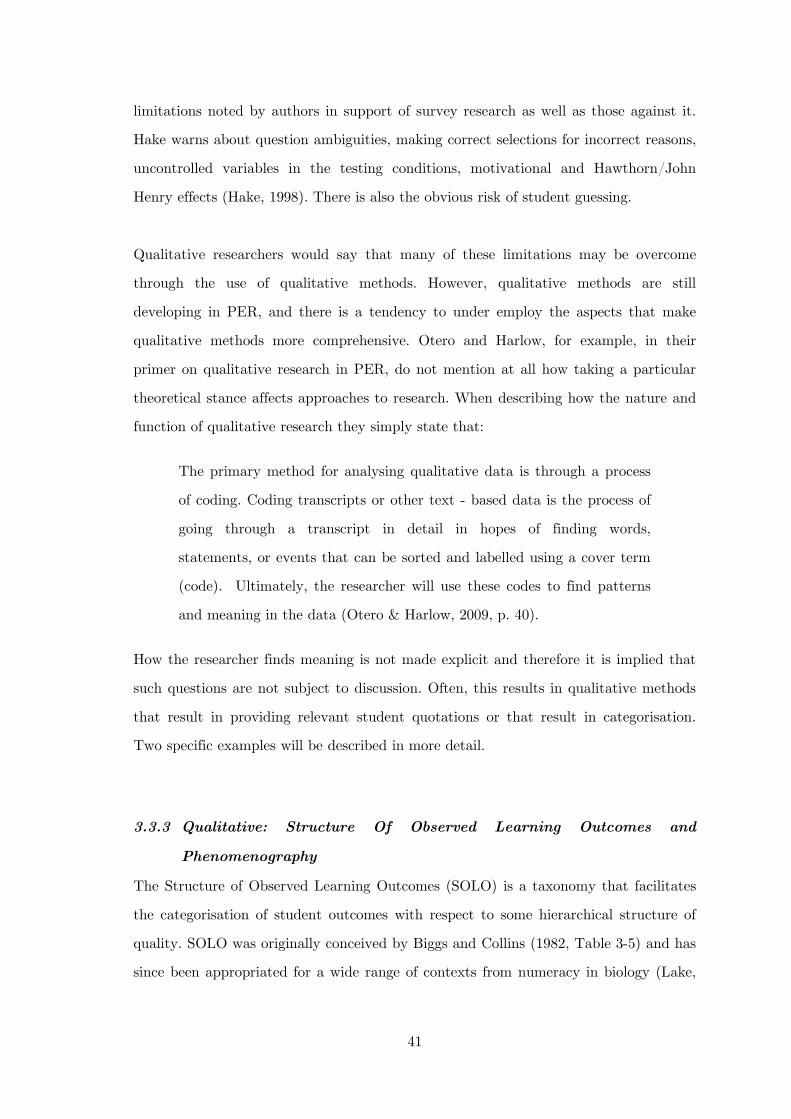
41
limitations noted by authors in support of survey research as well as those against it.
Hake warns about question ambiguities, making correct selections for incorrect reasons,
uncontrolled variables in the testing conditions, motivational and Hawthorn/John
Henry effects (Hake, 1998). There is also the obvious risk of student guessing.
Qualitative researchers would say that many of these limitations may be overcome
through the use of qualitative methods. However, qualitative methods are still
developing in PER, and there is a tendency to under employ the aspects that make
qualitative methods more comprehensive. Otero and Harlow, for example, in their
primer on qualitative research in PER, do not mention at all how taking a particular
theoretical stance affects approaches to research. When describing how the nature and
function of qualitative research they simply state that:
The primary method for analysing qualitative data is through a process
of coding. Coding transcripts or other text - based data is the process of
going through a transcript in detail in hopes of finding words,
statements, or events that can be sorted and labelled using a cover term
(code). Ultimately, the researcher will use these codes to find patterns
and meaning in the data (Otero & Harlow, 2009, p. 40).
How the researcher finds meaning is not made explicit and therefore it is implied that
such questions are not subject to discussion. Often, this results in qualitative methods
that result in providing relevant student quotations or that result in categorisation.
Two specific examples will be described in more detail.
3.3.3 Qualitative: Structure Of Observed Learning Outcomes and
Phenomenography
The Structure of Observed Learning Outcomes (SOLO) is a taxonomy that facilitates
the categorisation of student outcomes with respect to some hierarchical structure of
quality. SOLO was originally conceived by Biggs and Collins (1982, Table 3-5) and has
since been appropriated for a wide range of contexts from numeracy in biology (Lake,
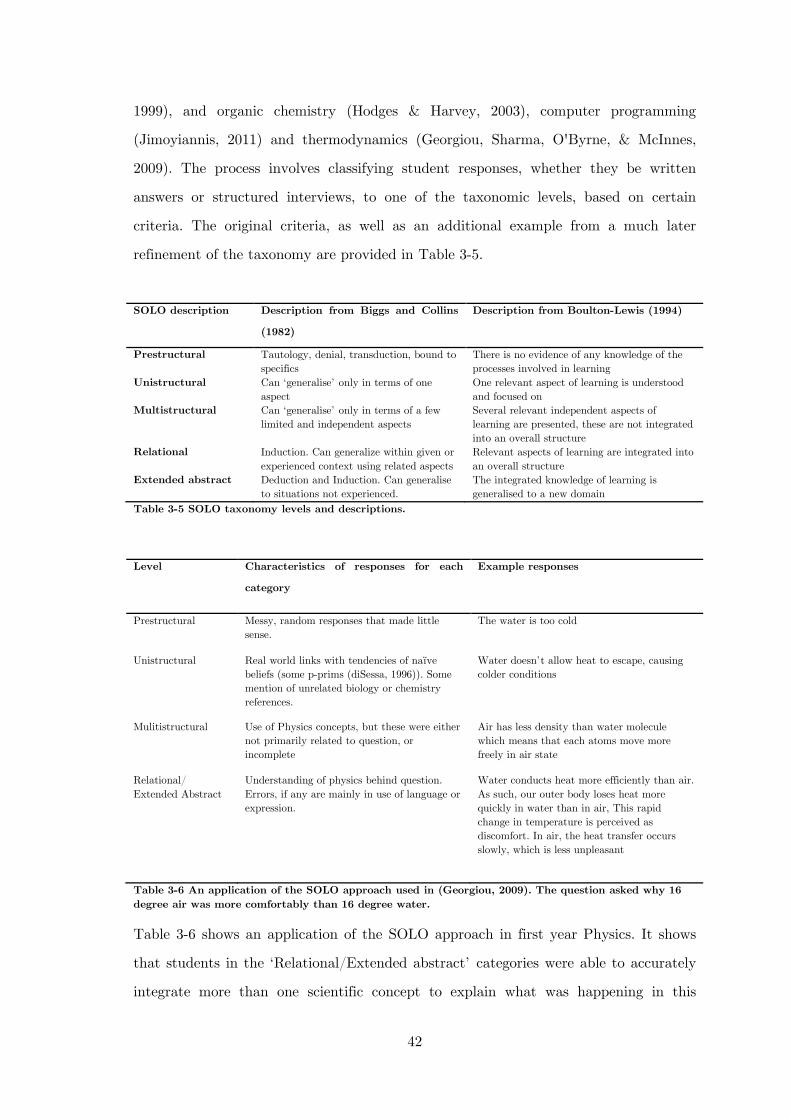
42
1999), and organic chemistry (Hodges & Harvey, 2003), computer programming
(Jimoyiannis, 2011) and thermodynamics (Georgiou, Sharma, O'Byrne, & McInnes,
2009). The process involves classifying student responses, whether they be written
answers or structured interviews, to one of the taxonomic levels, based on certain
criteria. The original criteria, as well as an additional example from a much later
refinement of the taxonomy are provided in Table 3-5.
SOLO description Description from Biggs and Collins
(1982)
Description from Boulton-Lewis (1994)
Prestructural Tautology, denial, transduction, bound to specifics
There is no evidence of any knowledge of the processes involved in learning
Unistructural Can ‘generalise’ only in terms of one aspect
One relevant aspect of learning is understood and focused on
Multistructural Can ‘generalise’ only in terms of a few limited and independent aspects
Several relevant independent aspects of learning are presented, these are not integrated into an overall structure
Relational Induction. Can generalize within given or experienced context using related aspects
Relevant aspects of learning are integrated into an overall structure
Extended abstract Deduction and Induction. Can generalise to situations not experienced.
The integrated knowledge of learning is generalised to a new domain
Table 3-5 SOLO taxonomy levels and descriptions.
Level Characteristics of responses for each
category
Example responses
Prestructural Messy, random responses that made little sense.
The water is too cold
Unistructural Real world links with tendencies of naïve beliefs (some p-prims (diSessa, 1996)). Some mention of unrelated biology or chemistry references.
Water doesn’t allow heat to escape, causing colder conditions
Mulitistructural Use of Physics concepts, but these were either not primarily related to question, or incomplete
Air has less density than water molecule which means that each atoms move more freely in air state
Relational/ Extended Abstract
Understanding of physics behind question. Errors, if any are mainly in use of language or expression.
Water conducts heat more efficiently than air. As such, our outer body loses heat more quickly in water than in air, This rapid change in temperature is perceived as discomfort. In air, the heat transfer occurs slowly, which is less unpleasant
Table 3-6 An application of the SOLO approach used in (Georgiou, 2009). The question asked why 16 degree air was more comfortably than 16 degree water.
Table 3-6 shows an application of the SOLO approach in first year Physics. It shows
that students in the ‘Relational/Extended abstract’ categories were able to accurately
integrate more than one scientific concept to explain what was happening in this
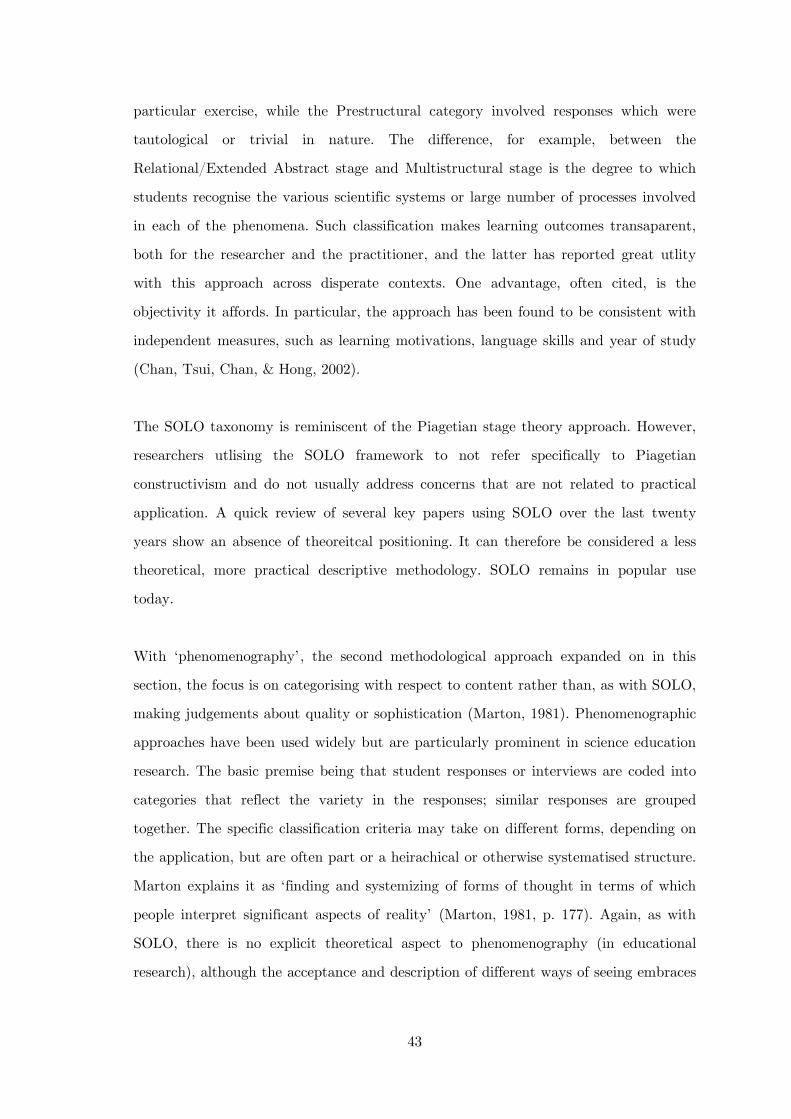
43
particular exercise, while the Prestructural category involved responses which were
tautological or trivial in nature. The difference, for example, between the
Relational/Extended Abstract stage and Multistructural stage is the degree to which
students recognise the various scientific systems or large number of processes involved
in each of the phenomena. Such classification makes learning outcomes transaparent,
both for the researcher and the practitioner, and the latter has reported great utlity
with this approach across disperate contexts. One advantage, often cited, is the
objectivity it affords. In particular, the approach has been found to be consistent with
independent measures, such as learning motivations, language skills and year of study
(Chan, Tsui, Chan, & Hong, 2002).
The SOLO taxonomy is reminiscent of the Piagetian stage theory approach. However,
researchers utlising the SOLO framework to not refer specifically to Piagetian
constructivism and do not usually address concerns that are not related to practical
application. A quick review of several key papers using SOLO over the last twenty
years show an absence of theoreitcal positioning. It can therefore be considered a less
theoretical, more practical descriptive methodology. SOLO remains in popular use
today.
With ‘phenomenography’, the second methodological approach expanded on in this
section, the focus is on categorising with respect to content rather than, as with SOLO,
making judgements about quality or sophistication (Marton, 1981). Phenomenographic
approaches have been used widely but are particularly prominent in science education
research. The basic premise being that student responses or interviews are coded into
categories that reflect the variety in the responses; similar responses are grouped
together. The specific classification criteria may take on different forms, depending on
the application, but are often part or a heirachical or otherwise systematised structure.
Marton explains it as ‘finding and systemizing of forms of thought in terms of which
people interpret significant aspects of reality’ (Marton, 1981, p. 177). Again, as with
SOLO, there is no explicit theoretical aspect to phenomenography (in educational
research), although the acceptance and description of different ways of seeing embraces
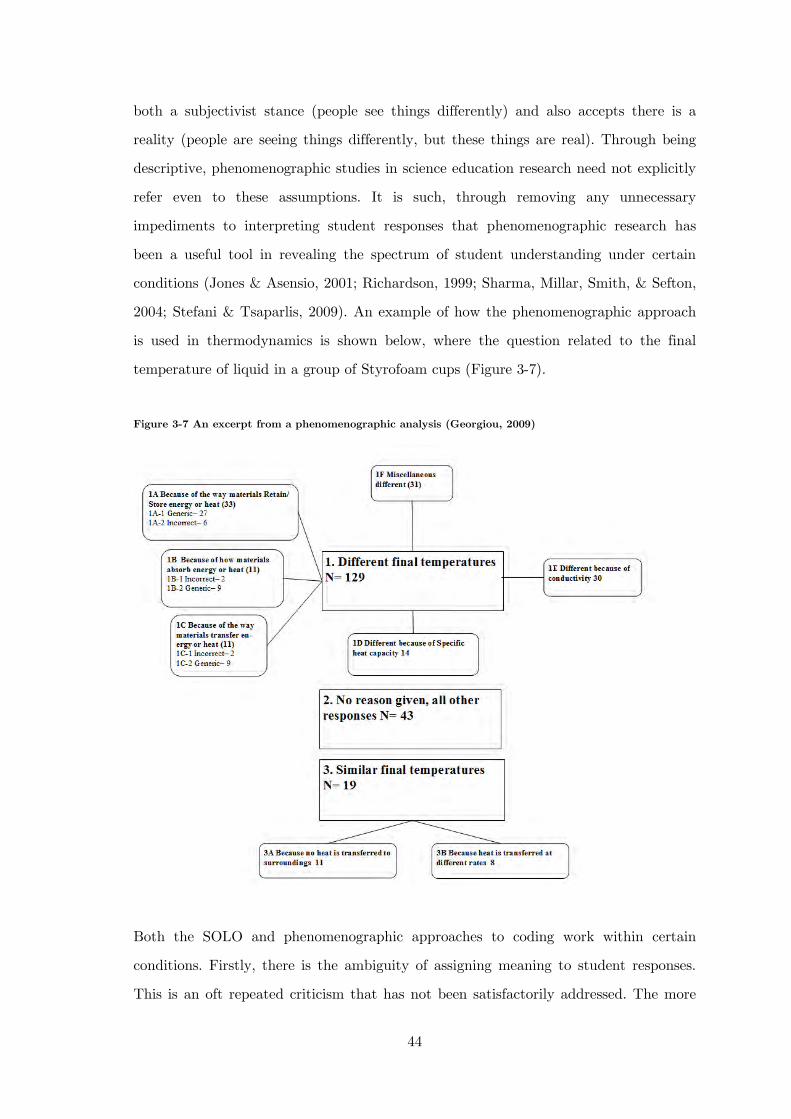
44
both a subjectivist stance (people see things differently) and also accepts there is a
reality (people are seeing things differently, but these things are real). Through being
descriptive, phenomenographic studies in science education research need not explicitly
refer even to these assumptions. It is such, through removing any unnecessary
impediments to interpreting student responses that phenomenographic research has
been a useful tool in revealing the spectrum of student understanding under certain
conditions (Jones & Asensio, 2001; Richardson, 1999; Sharma, Millar, Smith, & Sefton,
2004; Stefani & Tsaparlis, 2009). An example of how the phenomenographic approach
is used in thermodynamics is shown below, where the question related to the final
temperature of liquid in a group of Styrofoam cups (Figure 3-7).
Figure 3-7 An excerpt from a phenomenographic analysis (Georgiou, 2009)
Both the SOLO and phenomenographic approaches to coding work within certain
conditions. Firstly, there is the ambiguity of assigning meaning to student responses.
This is an oft repeated criticism that has not been satisfactorily addressed. The more
45
comprehensive the student’s response, the more likely the researcher is interpreting the
response legimitately, however, many analyses look to cover a few concepts in as
efficient a time period as possible, meaning they must make value jugements about
what the students mean. This is particularly difficult when researchers have some idea
of what they are looking for. Using a SOLO taxonomy also becomes problematic when
student responses to particular questions cannot be easily classified. That is, if levels of
sophistication are not readily ascertained (Chan et al., 2002; Chick, 1998). Particularly
common, surprisingly, is the mistaking of the extended abstract with the pre-structural
levels (Chan et al., 2002). Phenomenographic analyses can also greatly underestimate
the nuances in the data, particularly as responses are often assigned to only one
category (Richardson, 1999). Interrater reliability, the name given to the agreement
between different coders on coding categories, is also dependent on the sometimes
arbitrary correct selection of ‘high’ or ‘low’ levels of reliability (Anderson, Mitchell, &
Osgood, 2008).
Although each of these approaches became more and more sophisticated over time, the
sophistication was in the mechanics of the method, rather than the understanding of it.
This paucity in epistemological or theoretical discussion is arguably the basis of the
more general and tenacious criticisms of these practices. For example, more often than
not, the methods mentioned above are arbitrarily adapted to each specific context such
that it is difficult to see what makes this a SOLO or phenomenographic approach.
That is, what aspects of the methodology may be changed such that it retains its
integrity? There also exists a somewhat blurry boundary between research methods
and pedagogical methods. For example, the SOLO approach is considered meaningful
only when longitudinal analyses are utilised, or if sample sizes are large, such that is it
legitimate to generalise about a particular level of sophistication. Most recently, studies
use SOLO to assign solitary student responses in categories, neglecting the research on
the tenacity and flexibility of student’s ideas. This is particularly the case in classroom
practice3
3 The Essential Secondary Science Assessment in New South Wales, for example, is based on the SOLO taxonomy
.
46
The clearest advantage that these approaches have on most other coding in PER
(particularly multiple choice diagnostics) is that they refer to a conceptual framework.
Like the use of the framework involving Piagentian developmental stages or Bloom’s
taxonomy, the shared language allows communication across different contexts and
times. This is preferable to the alterantive, where researchers will code ad hoc within
the context of the individual study (Otero & Harlow, 2009). Ultimately, there is a
trade off between describing the individual study and translating findings across
studies. In short, supporters assert that it is beneficial to qualitatively summarise
conceptions with some structure and consistency, whilst its critics object to the
vagueness of the method (Ashworth & Lucas, 1998).
3.4 Limitations- remaining questions
Academic and public sentiment on educational research, science education research
included, gives the sense of a field in disarray (Constas & Ripple, 1987; Riding &
Wheldall, 1981). It is argued, on the one hand, that the research agenda has resulted in
widespread reform and improvement and on the other, just as persuasively, that there
is a lack of convincing evidence for any pervasive positive outcomes at all (Duschl,
1988; Lather, 2004). Pleas for the ‘integration’ of miscellaneous factions are abundant
and persistent (Galton, 2000; Yslas Velez, 1996) and there are unsettled disputes
within the field on whether the focus should reside more on local improvements in
instructional practices or ‘basic’ research into teaching and learning. These persistent
and legitimate criticisms should not continue to be ignored, particularly in research
areas that have reached somewhat of a plateau.
47
As far as conceptions research goes, several important and persistent criticisms should
be considered more deeply. Specific criticism towards the conceptions and conceptual
change movement include that it is predominately deficit-driven, focusing on what
students do not know and are not able to do and that it is overly simplistic in that it
focuses on unitary, fixed conceptions (Bauer, 2013; Stark, 2002). Catalogues of
misconceptions have been likened to ‘stamp collecting’ thereby exhibiting very low
interpretive power (Caravita & Halldén, 1994).
More generally, the field’s theoretical basis of constructivism has also attracted
significant criticism for having ‘low precision’ and not being clearly defined. Solomon
argues that although the language of constructivism has allowed a functional and
productive research field, he warns that “if constructivism obscures other perspectives,
either by its popularity or its blandness –that could be damaging.” (Solomon, 1994, p.
17). Some have considered constructivism much more damaging, particularly in terms
of constructivist teaching or instructional programmes, due to it being detached from
any theoretical meaning (Matthews, 1994; Sjoberg, 2007). Driver and Easley (1978)
appreciated these weaknesses (problem with teaching or with constructivism as a
coherent framework) when they published their seminal article and it does not seem
time has developed a suitable response. Furthermore, the ideological conflicts also pose
a problem. Sjoberg explains: “It seems to distinguish the good guys (constructivists)
from the bad guys (traditionalists)” (p. 1).
One example to illustrate the charge of triviality against the constructivist movement
is to consider the trends within the conceptions research in science education. In
describing student’s ideas, the embrace of constructivism signalled a rejection of
positivism for a sort of relativism. Student’s ideas were considered more valuable than
before and the cataloguing of misconceptions was considered obsolescent. Years on,
constructivism is referred to more as a convenient scaffold necessary for publication,
rather than a meaningful theoretical basis of knowledge construction. Studies released
just this year, for example, still discuss misconceptions as a collection of ideas; the
48
various alternative terminologies intended to highlight the shift away from positivism
are now referred to as inconveniences:
For this study, the term ‘misconception’ (also termed in the literature as
alternative conceptions, alternative frameworks, alternative ideas,
conceptual misunderstandings, conceptual prisms, erroneous ideas, errors,
false ideas, incomplete or naive notions, intuitive notions, mistakes,
misunderstanding, non-scientific beliefs, oversimplifications, preconceived
notions, preconceptions and untutored beliefs) was broadly applied to
any belief which is contrary to current scientific understanding regarding
the topic (Francek, 2013, p. 33).
In this particular case, either the positivist-relativist dichotomy implied by
constructivism was not seen as relevant, or constructivism in itself did not provide
strong enough boundaries to frame the study of conceptions. Any development here
has been limited to the particular concept area that is being investigated, rather than
development of the theoretical basis of the study of misconceptions themselves. This
can only end in endless refinements of conceptual surveys that identify or confirm or
reject the existence of misconceptions, and reduce the conceptions research to stamp
collecting once more –despite these misconceptions being shown to be manifold and
dynamic.
Some consider the general lack of theory in science education research amongst its
most serious limitations (Fensham, 2004; Usher, 1996). Joining Redish in arguing for
theoretical deference in PER specifically, Reif (2000) asserts that any significant
progress in the field is entirely dependent on stronger frameworks. Due to the
positivist/empiricist influence of scientific research on science education research,
theoretical, and particularly epistemological, considerations are not as emphasised as in
other educational research fields. Fensham, for example, in interviewing over 80
influential science education researchers, states that they “carry out their studies in
ways that suggest that theory has little importance for them. If they do use the word,
it tends to be as a source of descriptors for their findings, rather than as something
49
beyond the findings that their studies are designed to refine or refute” (p. 80). He also
states that science education relies on borrowed theories (usually from cognitive science
and psychology) with which researchers superimpose concepts onto their data. He
believes this provides nothing more than a descriptive framework that does not develop
over time. Fensham explains that this is because science education researchers are ill
equipped to deal with epistemological or theoretical considerations, as most come from
scientific backgrounds, from being researchers for a significant period before turning to
educational research. In many cases, they have not been exposed to the ‘humanities’.
Referring to Posner et al.’s (Posner, Strike, Hewson, & Gertzog, 1982) conceptual
change model specifically, Fensham explains that “it served for them as a useful frame
to discuss the findings of their own studies, but in no sense were they trying to extend,
test or redefine its features” (p. 111). Many researchers themselves attest that they are
‘agnostic about a theoretical stance’, and even contest that theoretical dispositions are
a disadvantage (Otero & Harlow, 2009, p. 43). Some have even argued that the
broadening of research to embrace social (and other) theories betrayed the ‘base’; to
service practitioners (Cummings, 2013).
Furthermore, between science education researchers and other social researchers there
exists some divergence, meaning developments across the different fields are not likely
to provide utility outside of the field in which they were produced. Cummings states
that as part of her commissioned report into PER, several key researchers expressed:
that they sensed social scientists had (and perhaps still have) little
respect for the work done in the field of PER believing that physics
education researchers ignore the work of social scientists, PERs’ methods
are crude or our choices of topics are superficial (p. 7).
One does not have to look very far to discover that ‘the work of social scientists’ does
not feature prominently in PER studies either. Matthews, for example, laments the
time it has taken for even the history and philosophy of science to inform science
education endeavours (Matthews, 1994). One specific issue that will be foregrounded
50
from this discussion is that of ‘knowledge blindness’, which will be explained in the
following section.
3.4.1 Knowledge blindness
Joseph Schwab (1978) described a heuristic for the study of science education, which
he called ‘commonplaces’. Schwab’s original four commonplaces comprised the teacher,
student, subject matter, and milieu (environment), which he emphasised as equally
important:
None of these can be omitted without omitting a vital factor in
educational thought and practice. No one of them may be allowed to
dominate the deliberation unless that domination is conscious and
capable of defense in terms of the circumstances. (1978, p. 371)
Helms and Carlone (1999) suggested Schwab’s heuristic “provides the opportunity to
meld perspectives from metascience disciplines and science education to connect theory
and practice” (1999, p. 242) and could improve understanding of classroom practices.
However, as yet, not all four commonplaces have received equal attention in science
education research. As mentioned above, ‘the student’ and ‘the teacher’ have been the
focus of considerable and sustained research; student conceptions and instructional
strategies have been dominant objects of study for the field. The ‘milieu’ has come to
increasing prominence since the 1970s with the rise of sociocultural theories. ‘Subject
matter’, however, remains relatively underexplored - it is a ‘commonplace’ that is
rarely discussed.
This ‘knowledge-blindness’ is not confined to science education research - it reflects a
wider ‘subjectivist doxa’ in educational research (Maton, 2014, pp. 3-8). Since the late
1990s a growing number of ‘social realists’ (Maton, 2010; Maton & Moore, 2010;
Moore, 2009; Wheelahan, 2012) have argued that knowledge has been largely neglected
by educational research, thanks to a “widespread belief that ‘knowledge’ entirely
comprises a state of mind, consciousness or a disposition to act, is wholly sensory in
51
source, and must be inextricably associated with a knowing subject” (Maton, 2014, p.
4).
They highlight that psychologically-influenced approaches typically focus on students’
learning processes, and sociologically-influenced approaches typically foreground how
students’ experiences are shaped by power relations (whether with the teacher or
within the milieu). Both thereby tend to foreground the knowing of knowers and
background knowledge; both obscure the nature of what is being learned, treating
knowledge itself as homogeneous and neutral. Knowledge as an object of study
emergent from but irreducible to the ways and contexts in which individuals or groups
know has been largely obscured. In contrast, social realists highlight a growing body of
work (see below) that reveals how different forms of knowledge have effects, including
on the foci of other ‘commonplaces’. Student learning outcomes, for example, are
formed through interactions not simply with a phenomenon but also (and often only)
with existing knowledge of different kinds – commonsense knowledge, popular forms of
scientific knowledge, educational knowledge – and the forms taken by these knowledges
help shape students’ understandings (Maton, 2013; Maton, 2014).
Typically, in PER, ‘subject matter’ considerations have been displaced by the
‘student’. Consider, for example, ‘epistemological framing’ as described by the RF. In
it, the “student’s perception or judgement (unconscious or conscious) as to what class
of tools and skills are appropriate in a given context” (Redish & Bing, 2009, p. 1) is
highlighted. It is shown that student’s ideas about the nature of scientific knowledge,
such as being “fixed and absolute or as being relative to one’s point of view” (2009, p.
3) influence how a student approaches instructional tasks. This work valuably
foregrounds differences in the forms taken by student conceptions of knowledge.
However, were this to be equated with (rather than complemented by)
conceptualisation of the knowledge itself, an understanding of ‘subject matter’ would
be reduced to analysing ‘the student’.
52
As a further example, Redish, in defining an ‘epistemic form’ as “an external structure
or representation and the cognitive tools to manipulate and interpret that structure”
(p. 30) goes on to say that “when I refer to an epistemic form, I really mean the
cognitive structures that we possess for using and interpreting the results of
manipulating the structures” (p. 31). Again, this focus remains on the ‘subjective’
knowledge of the individual, forgoing the opportunity to examine how characteristics of
these external structures guide individual cognition.
Even if such a view is extended to embrace knowledge as well as knowing, this first
step requires developing further to overcome the tendency of existing models towards
an undifferentiated and often atomistic image of science knowledge. For example,
diSessa (1993) foregrounds pieces of knowledge in physics that students believe are an
irreducible feature of reality (p-prims). Leaving aside this focus on students’
understanding, the p-prims themselves are homogeneous in form and science education
is reductively conceived as the sum of learning individual parts. In the RF, the
homogeneity of the form taken by p-prims is differentiated into two types of
knowledge (the abstract primitive and the more concrete facet) that have distinct
functions for explaining the natural world. It is clear that organising knowledge in
terms of context dependence rather than discrete atomistic categories reduces the
‘number of parts’, but it is unclear why this should mean only two levels of context-
dependency are considered.
While pointing in the right direction, therefore, these models require development to
overcome the limits of the kind of theorising such approaches embody. Typologies,
including Bloom’s (Bloom, 1976; Krathwohl, 2002), ‘PCK’ (Shulman, 1986) and such
widely-used but ill-defined dichotomies as abstract/concrete, struggle to capture both
empirical practices, which rarely fit within their lists of types, and processes of change
within and between types. They thus need to be developed to conceptualize the
organizing principles that generate diverse types of knowledge practices.
53
Although the science education literature does not necessarily focus on knowledge in
the theoretical or empirical sense, there is a persistent reference and appreciation for
the effects of knowledge on the teaching and learning of physics. Solomon explains that
“formal over-arching knowledge systems, such as science or jurisprudence” are “at
almost the opposite pole to lifeworld knowing” and should both exist simultaneously in
the student’s minds (Solomon, 1994). Posner et al., express in their seminal conceptual
change model paper, that it is the student’s “separation between ‘physics’ and ‘the real
world” that prevents their making conceptual changes (Posner et al., 1982, p. 206).
Instead of meaningful learning, students simply learn to play the game of physics,
however disconnected its rules are. Caravita et al., add that in “mastering ‘playing the
game of physics… the students must first become aware of what kind of game they are
playing’” (Caravita & Halldén, 1994, p. 109). Even more explicitly, Taber supports the
general promotion of the difference between an individual’s knowledge structure and
that of the discipline, citing both Gilbert and Watts and Phillips (Taber, 2009).
Henri Poincaré (1985, quoted in Scribner, 1963) summarises the sentiment in these
views in his description that science is no more a collection of primitive parts than a
house is a pile of bricks – scientific knowledge embodies an architecture based on
organising principles. It is apprenticeship into these organising principles as much as, if
not more than learning specific atomic propositions that comprises the work of science
education.
Maton calls these references a ‘call to arms’ and points out that although the
significance of knowledge is accentuated, the elusiveness of an appropriate means for
analysis does not encourage anything further (2014). Morais similarly points out that
the level of functionality of theory to service analysis of empirical practice (and vice
versa) affects the ‘order’ in a field. They note that the current ‘disorder’ is “partially
responsible for the rejection of sociological by many educators” (Morais, 2002, p. 564),
and go on to cite science educators specifically. That is, there are many approaches
that are not being considered by educators and researchers because there is not an
appropriate means for analysis.
54
Solomon finally adds that all perspectives, theoretical or otherwise, are important, as
no single perspective is likely to provide a full picture of science education (Solomon,
1994).
Legitimation Code Theory addresses these limitations in both its focus on the
organising principles of knowledge, and in providing a means for analysis. The relevant
tenets of the theory as well as the methodological toolkit utilized in this project are
provided in the next section.
3.5 A New Theory
3.5.1 Legitimation Code Theory
Legitimation Code Theory (LCT) is an explanatory framework for analysing and
changing practice. It forms a core part of social realism, a broad ‘coalition’ of
approaches which reveal knowledge as both socially produced and real, in the sense of
having effects, and which explore those effects (Maton, 2014; Maton & Moore, 2010).
LCT extends and integrates ideas from a range of theories, most centrally the
frameworks of Pierre Bourdieu and Basil Bernstein.
This ongoing theoretical development is in close relation with empirical research. LCT
is a practical approach and designed to be an open-ended endeavour that foresees its
own repeated refinement, deepening and extension through substantive studies (Maton,
2014). The framework is rapidly growing as a basis for empirical research into
education at all institutional levels and across the disciplinary map – from primary
schools to universities, from physics to jazz – in a widening range of national contexts,
as well as beyond education (Maton, Hood & Shay, 2014)4
. The framework of LCT
comprises a multi-dimensional conceptual toolkit, where each dimension offers concepts
for analysing different organizing principles underlying practices.
4 Numerous examples of this body of work can be found at the LCT website: http://www.legitimationcodetheory.com
55
Maton explains further:
Each field has its own distinctive ways of working, resources and forms
of status that are specific in terms of their realizations yet similar in
terms of their underlying generative principles. Within each field actors
cooperate and struggle to maximize their relational positions in its
hierarchies by striving both to attain more of that which defines
achievement and to shape what is defined as achievement to match their
own practices. LCT highlights that actors’ practices thereby represent
competing claims to legitimacy, whether explicit or tacit (such as
routinized ways of working) - they are languages of legitimation. These
strategies to shape the ‘rules of the game’ are themselves shaped by
relations between actors’ dispositions (which are in turn shaped by
previous and ongoing experiences in fields) and the current structure of
the field. The organizing principles of dispositions, practices and fields
are conceptualized by LCT in terms of legitimation codes, each ‘code’
representing in effect a currency proposed by actors as the ruler of the
field. (Maton, 2014, Ch. 1)
The framework has five dimensions (Figure 3-8) only two of which will be mentioned
here; Specialization and Semantics. Within Specialization, we work with Specialization
codes and within Semantics, semantic codes.
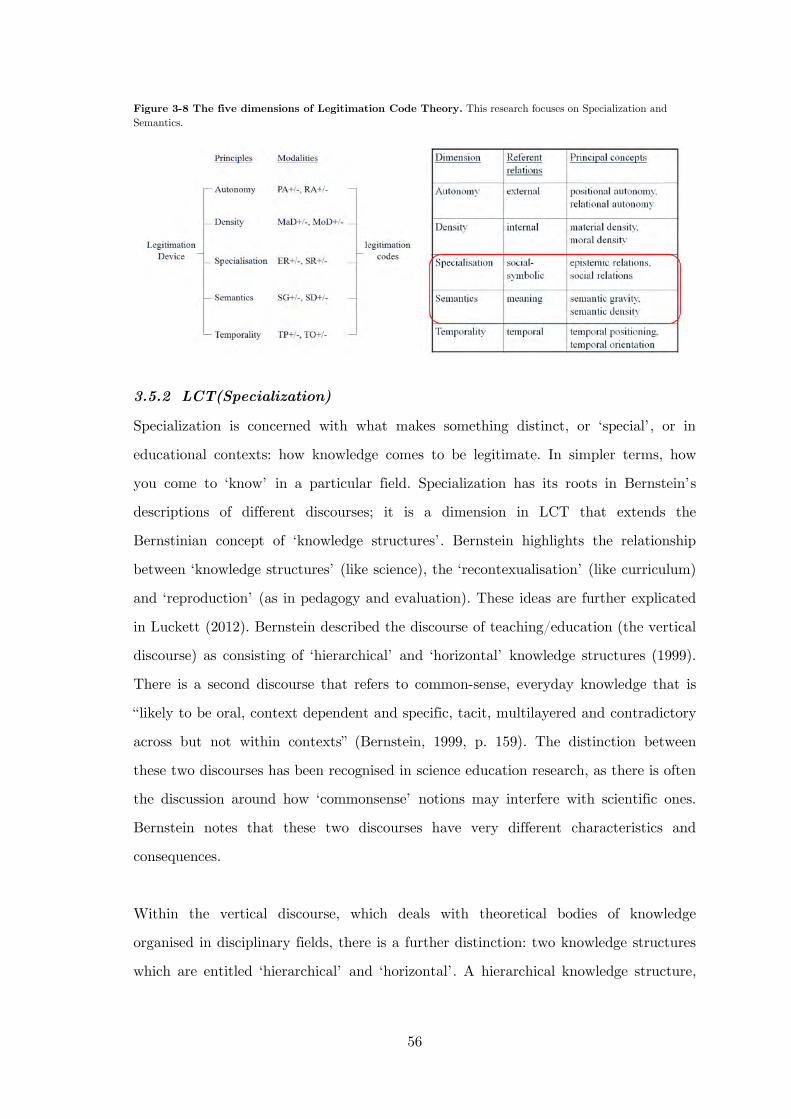
56
Figure 3-8 The five dimensions of Legitimation Code Theory. This research focuses on Specialization and Semantics.
3.5.2 LCT(Specialization)
Specialization is concerned with what makes something distinct, or ‘special’, or in
educational contexts: how knowledge comes to be legitimate. In simpler terms, how
you come to ‘know’ in a particular field. Specialization has its roots in Bernstein’s
descriptions of different discourses; it is a dimension in LCT that extends the
Bernstinian concept of ‘knowledge structures’. Bernstein highlights the relationship
between ‘knowledge structures’ (like science), the ‘recontexualisation’ (like curriculum)
and ‘reproduction’ (as in pedagogy and evaluation). These ideas are further explicated
in Luckett (2012). Bernstein described the discourse of teaching/education (the vertical
discourse) as consisting of ‘hierarchical’ and ‘horizontal’ knowledge structures (1999).
There is a second discourse that refers to common-sense, everyday knowledge that is
“likely to be oral, context dependent and specific, tacit, multilayered and contradictory
across but not within contexts” (Bernstein, 1999, p. 159). The distinction between
these two discourses has been recognised in science education research, as there is often
the discussion around how ‘commonsense’ notions may interfere with scientific ones.
Bernstein notes that these two discourses have very different characteristics and
consequences.
Within the vertical discourse, which deals with theoretical bodies of knowledge
organised in disciplinary fields, there is a further distinction: two knowledge structures
which are entitled ‘hierarchical’ and ‘horizontal’. A hierarchical knowledge structure,
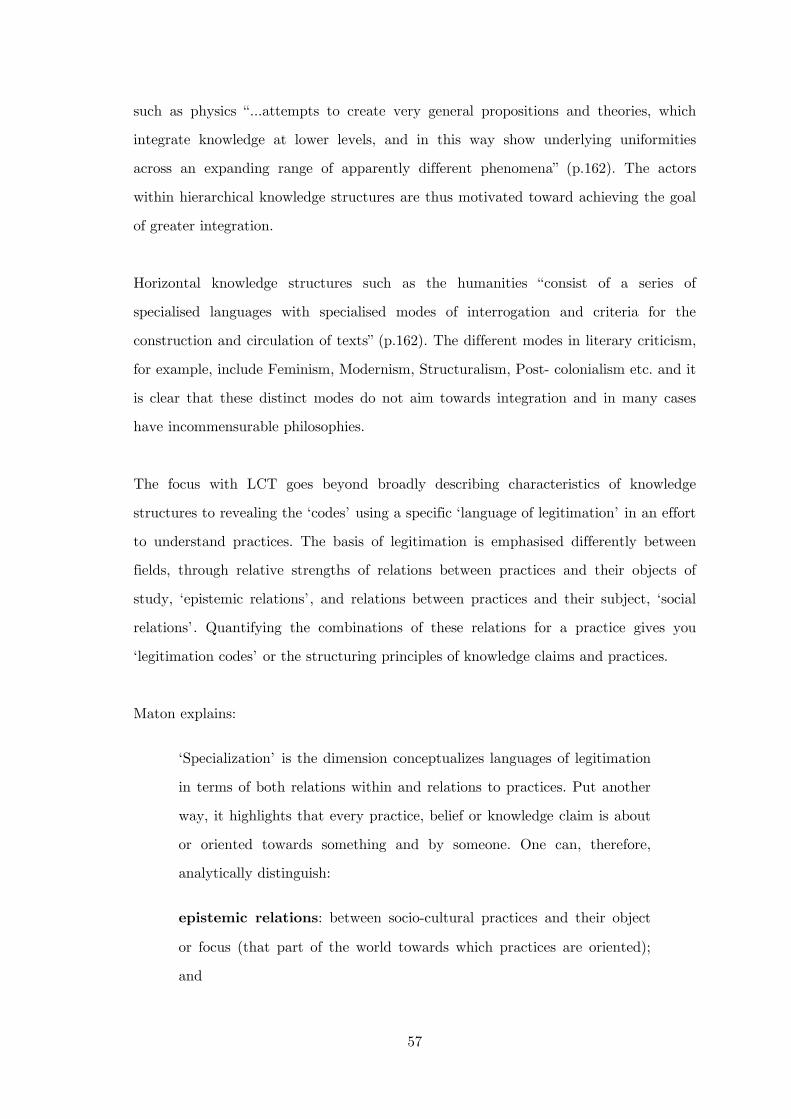
57
such as physics “…attempts to create very general propositions and theories, which
integrate knowledge at lower levels, and in this way show underlying uniformities
across an expanding range of apparently different phenomena” (p.162). The actors
within hierarchical knowledge structures are thus motivated toward achieving the goal
of greater integration.
Horizontal knowledge structures such as the humanities “consist of a series of
specialised languages with specialised modes of interrogation and criteria for the
construction and circulation of texts” (p.162). The different modes in literary criticism,
for example, include Feminism, Modernism, Structuralism, Post- colonialism etc. and it
is clear that these distinct modes do not aim towards integration and in many cases
have incommensurable philosophies.
The focus with LCT goes beyond broadly describing characteristics of knowledge
structures to revealing the ‘codes’ using a specific ‘language of legitimation’ in an effort
to understand practices. The basis of legitimation is emphasised differently between
fields, through relative strengths of relations between practices and their objects of
study, ‘epistemic relations’, and relations between practices and their subject, ‘social
relations’. Quantifying the combinations of these relations for a practice gives you
‘legitimation codes’ or the structuring principles of knowledge claims and practices.
Maton explains:
‘Specialization’ is the dimension conceptualizes languages of legitimation
in terms of both relations within and relations to practices. Put another
way, it highlights that every practice, belief or knowledge claim is about
or oriented towards something and by someone. One can, therefore,
analytically distinguish:
epistemic relations: between socio-cultural practices and their object
or focus (that part of the world towards which practices are oriented);
and
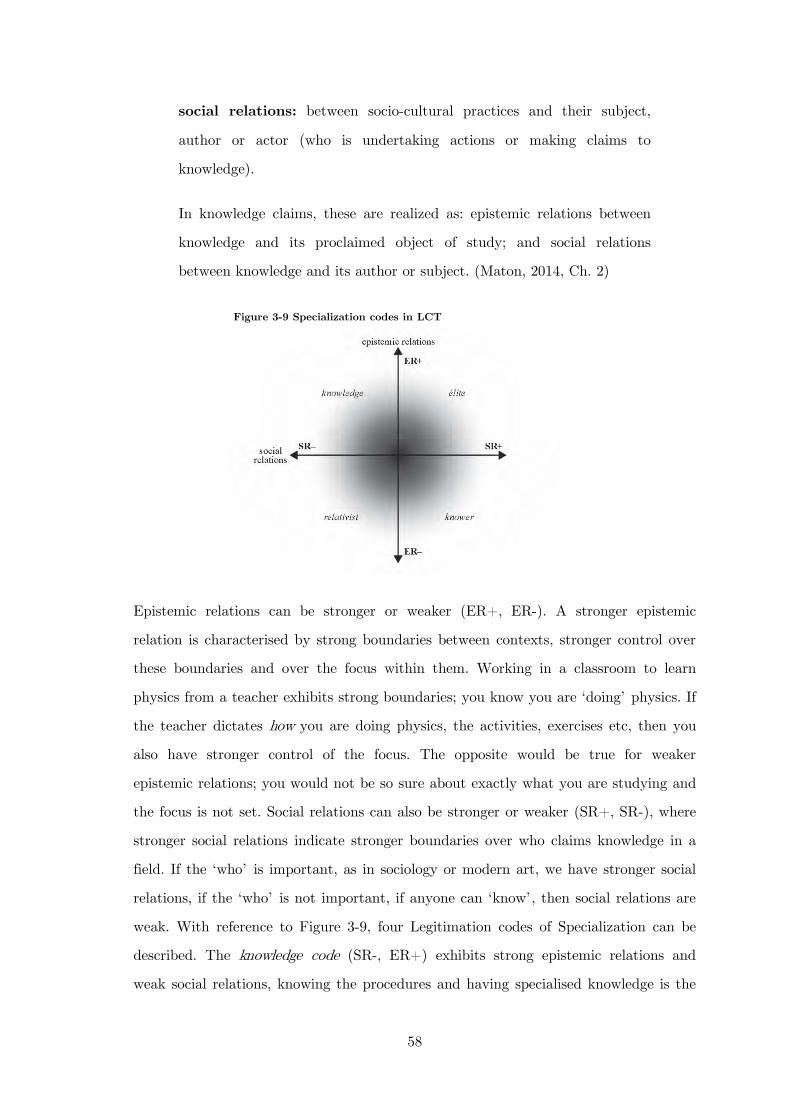
58
social relations: between socio-cultural practices and their subject,
author or actor (who is undertaking actions or making claims to
knowledge).
In knowledge claims, these are realized as: epistemic relations between
knowledge and its proclaimed object of study; and social relations
between knowledge and its author or subject. (Maton, 2014, Ch. 2)
Epistemic relations can be stronger or weaker (ER+, ER-). A stronger epistemic
relation is characterised by strong boundaries between contexts, stronger control over
these boundaries and over the focus within them. Working in a classroom to learn
physics from a teacher exhibits strong boundaries; you know you are ‘doing’ physics. If
the teacher dictates how you are doing physics, the activities, exercises etc, then you
also have stronger control of the focus. The opposite would be true for weaker
epistemic relations; you would not be so sure about exactly what you are studying and
the focus is not set. Social relations can also be stronger or weaker (SR+, SR-), where
stronger social relations indicate stronger boundaries over who claims knowledge in a
field. If the ‘who’ is important, as in sociology or modern art, we have stronger social
relations, if the ‘who’ is not important, if anyone can ‘know’, then social relations are
weak. With reference to Figure 3-9, four Legitimation codes of Specialization can be
described. The knowledge code (SR-, ER+) exhibits strong epistemic relations and
weak social relations, knowing the procedures and having specialised knowledge is the
Figure 3-9 Specialization codes in LCT
59
basis of achievement and the individuals are downplayed (e.g., physics). A knower code
(SR+, ER-) emphasises the attributes of the individual and the knowledge and
procedures are less important (as found in standpoint theories such as feminism). An
elite code (SR+, ER+) indicates you must know the right procedures and knowledge
but also be the right kind of knower (as found in architecture) and a relativist code
(SR-, ER-) de-emphasises both (anything goes).
An example will help to show how this conceptualisation brings clarity to educational
issues. Lamont and Maton (2008, 2010) examine the reasons for the low uptake for
high school music studies in England. Despite changing assessment practices and
including popular music, only 10% of the school population choose to continue their
music studies at Stage 4 (14+). Using the specialization codes of LCT to examine
curricular material, the authors explain that primary school music exhibits a ‘knower
code’, as “achievement is defined in terms of pupils capacity to express themselves
rather than demonstrate skills or knowledge” (2010, p. 69). As students move to the
first three years of high school, they experience a ‘knowledge code’ as “aptitude,
attitude and personal engagement are downplayed in favour of the demonstration of
musical skills and knowledge and (there is) an emphasis on the formal elements of
music and critical thinking”. At the next level, Lamont and Maton claim students are
faced with an ‘elite code’, “requiring pupils to demonstrate both their capacity for
personal expression and aesthetic sensitivity and their musical knowledge and technical
skills.”
The framework thereby provided a means of characterizing the basis of
achievement at different levels, highlighting code shifts through the
curriculum (p. 69).
The study goes on to claim, through the empirical analysis, that the code shift that
proved most problematic was the second: from the knowledge code to the elite code.
60
Although physics is assumed to be the archetypal ‘knowledge code’, very few
researchers actually study physics empirically and the impact code clashes or shifts
have on students of physics is so far underexplored.
3.5.3 LCT(Semantics)
The LCT dimension of Semantics constructs social fields of practice as ‘semantic
structures’, whose organizing principles are conceptualized as ‘semantic codes’.
Semantic gravity, which is the central analytical method underpinning this thesis, is
part of the semantic codes of LCT, together with semantic density. As Maton
describes it:
Semantic gravity (SG) refers to the degree to which meaning relates
to its context. Semantic gravity may be relatively stronger (+) or weaker
(–) along a continuum of strengths. The stronger the semantic gravity
(SG+), the more meaning is dependent on its context; the weaker the
semantic gravity (SG–), the less dependent meaning is on its context. All
meanings relate to a context of some kind; semantic gravity
conceptualizes how much they depend on that context to make sense.”
Semantic density (SD) refers to the degree of condensation of
meaning within sociocultural practices, whether these comprise symbols,
terms, concepts, phrases, expressions, gestures, clothing, etc. Semantic
density may be relatively stronger (+) or weaker (-) along a continuum
of strengths. The stronger the semantic density (SD+), the more
meanings are condensed within practices; the weaker the semantic
density (SD-), the less meanings are condensed. (The nature of these
meanings, which may comprise formal definitions, empirical descriptions,
feelings, political sensibilities, taste, values, morals, affiliations, etc., is
analysed using other concepts (2008, p. 10).
61
Essentially, semantic gravity characterizes degrees of context dependence5
3.5.4 The ‘external language of description’
. Unlike
typological conceptions of knowledge, the notion of ‘semantic gravity’ is not a
homogeneous box into which variegated and changing practices are to be reduced.
Rather, all practices are characterised by semantic gravity, the difference lies in their
relative strengths. Thus the concept represents a continuum allowing both for infinite
gradation among practices and for tracing change within practices over time.
Dynamising the continuum captures weakening semantic gravity, such as moving from
the concrete particulars of a specific case towards generalizations and abstractions
whose meanings are less dependent on that context; and strengthening semantic
gravity, such as moving from abstract or generalized ideas towards concrete and
delimited cases (Maton, 2013, p. 11). One can also describe the gravity range of
practices (the difference between their strongest and weakest strengths) and the gravity
profile that changes in strengths trace over time (Maton, 2014, Ch. 3).
This flexibility in the use of the concepts does not occur at the expense of empirical
precision. LCT includes the notion of developing an ‘external language of description’,
or means for translating between concepts and empirical data that show how concepts
are realised within the specific object of study being explored (Chen, 2014). For
example, an external language of description for ‘semantic gravity’ defines what is
meant by ‘context’ and how relative strengths are determined in the data under
analysis. Studies in LCT therefore have a way of ‘speaking to each other’; with the
community very coherent and regular meetings constructive despite the range of
disciplines or subject areas covered and methods are quantitative or qualitative, with
no need for either to be valued more than the other6
.
5 Context dependence when used in science education is usually an issue that is related to the lack of stability of student understanding across contexts (Section 3.1.3). However, this is not what context dependence refers to within the LCT framework.
6 See legitimationcodetheory.com for information about symposia
62
It should be emphasised that ‘semantic gravity’ is not the only concept in the
dimension of Semantics, and Semantics is not the only dimension of LCT. Our
illustrative focus on one small part of the framework is for the sake of brevity.
Nonetheless, this concept is being widely adopted in studies of education, including
biology and history (Martin & Maton, 2013), design (Shay & Steyn, 2014), engineering
(Wolff & Luckett, 2013), environmental science (Tan, 2013), jazz (Martin, 2012),
journalism (Kilpert & Shay, 2013), and teacher education (Shalem & Slonimsky, 2010).
As this suggests, LCT concepts such as ‘semantic gravity’ have wide applicability,
enabling research into knowledge practices in diverse contexts to cumulatively build on
one another. Within LCT, studies of science inform and are informed by studies of the
arts and humanities, as well as informal learning contexts, such as museums (Carvalho,
2014).
63
4 Context
4.1 Australian context
Australia’s educational system is comprised of three broad but distinct types of school;
71% Public (government), 18% Catholic and 11% Independent (including secular and
non-Catholic-religiously-affiliated schools) that are classified primarily with respect to
sources of funding. Public schools are inclusive and fully funded by the government
whilst Catholic and Independent schools are partly privately-funded, with Independent
schools generally attracting much higher fees than Catholic. The Australian
constitution requires that the states and territories are responsible for delivering
schooling to children of school age. Each of the eight states or territories is therefore
responsible for the operation and regulation of schools within their jurisdiction,
including the provision of a syllabus. The states have until now enjoyed autonomy in
this provision but from 2013 onwards will be required to base their respective syllabi
on a new national Australian Curriculum. Australia performs relatively well on
international standardised testing, ranking in the top ten for reading, science and
mathematics (PISA, 2009). However, there is much disparity between the eight states
and territories (ACARA, 2012).
The New South Wales Board of Studies (BoS) is the bureaucratic unit responsible for
the state of New South Wales (NSW) and is the largest in the country. Most students
attending The University of Sydney have completed the NSW course set out by the
BoS, which included the year ten School Certificate (this award is now abolished) and
the Higher School Certificate (HSC), which is the award on which university entrance
is determined. A brief explanation of the relevant aspects of the NSW program is
provided below.
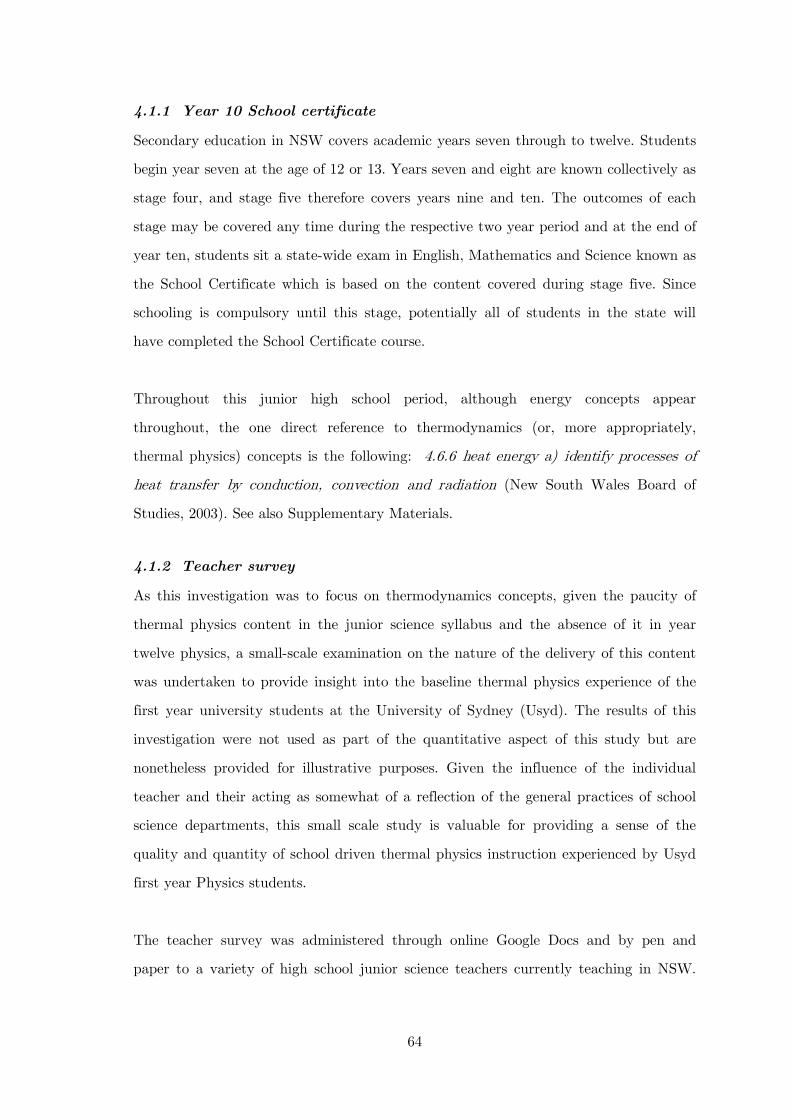
64
4.1.1 Year 10 School certificate
Secondary education in NSW covers academic years seven through to twelve. Students
begin year seven at the age of 12 or 13. Years seven and eight are known collectively as
stage four, and stage five therefore covers years nine and ten. The outcomes of each
stage may be covered any time during the respective two year period and at the end of
year ten, students sit a state-wide exam in English, Mathematics and Science known as
the School Certificate which is based on the content covered during stage five. Since
schooling is compulsory until this stage, potentially all of students in the state will
have completed the School Certificate course.
Throughout this junior high school period, although energy concepts appear
throughout, the one direct reference to thermodynamics (or, more appropriately,
thermal physics) concepts is the following: 4.6.6 heat energy a) identify processes of
heat transfer by conduction, convection and radiation (New South Wales Board of
Studies, 2003). See also Supplementary Materials.
4.1.2 Teacher survey
As this investigation was to focus on thermodynamics concepts, given the paucity of
thermal physics content in the junior science syllabus and the absence of it in year
twelve physics, a small-scale examination on the nature of the delivery of this content
was undertaken to provide insight into the baseline thermal physics experience of the
first year university students at the University of Sydney (Usyd). The results of this
investigation were not used as part of the quantitative aspect of this study but are
nonetheless provided for illustrative purposes. Given the influence of the individual
teacher and their acting as somewhat of a reflection of the general practices of school
science departments, this small scale study is valuable for providing a sense of the
quality and quantity of school driven thermal physics instruction experienced by Usyd
first year Physics students.
The teacher survey was administered through online Google Docs and by pen and
paper to a variety of high school junior science teachers currently teaching in NSW.
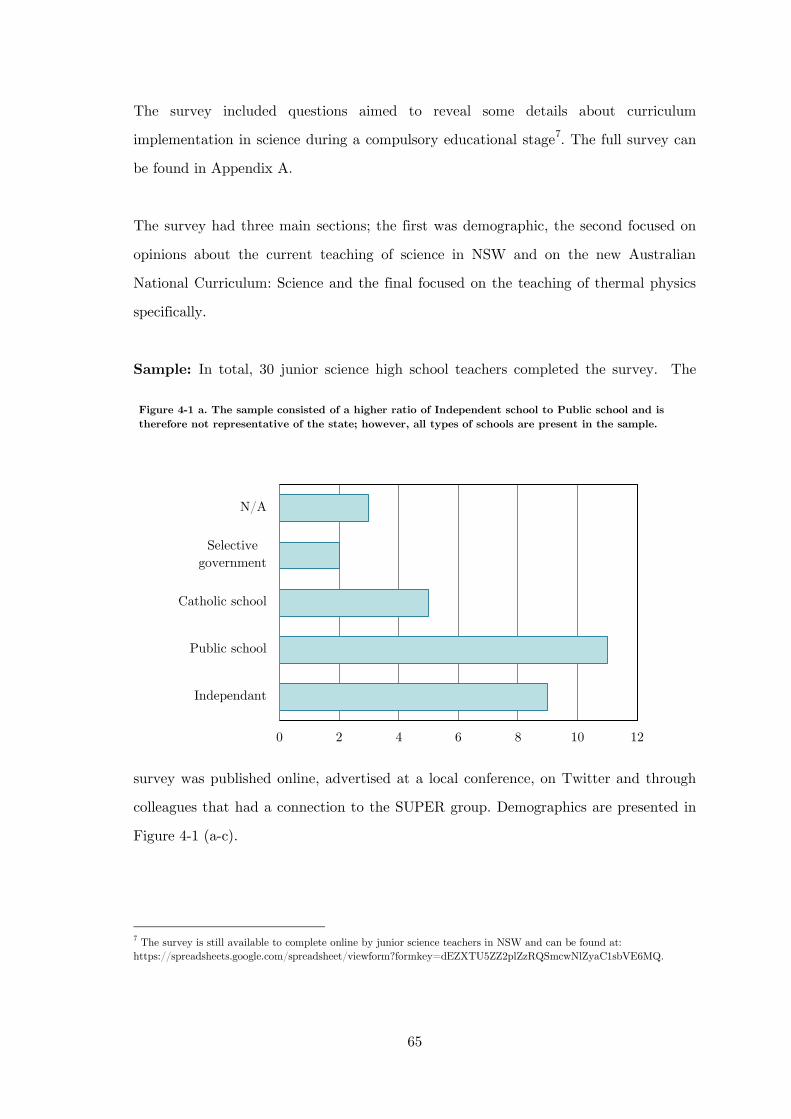
65
The survey included questions aimed to reveal some details about curriculum
implementation in science during a compulsory educational stage7
. The full survey can
be found in Appendix A.
The survey had three main sections; the first was demographic, the second focused on
opinions about the current teaching of science in NSW and on the new Australian
National Curriculum: Science and the final focused on the teaching of thermal physics
specifically.
Sample: In total, 30 junior science high school teachers completed the survey. The
survey was published online, advertised at a local conference, on Twitter and through
colleagues that had a connection to the SUPER group. Demographics are presented in
Figure 4-1 (a-c).
7 The survey is still available to complete online by junior science teachers in NSW and can be found at: https://spreadsheets.google.com/spreadsheet/viewform?formkey=dEZXTU5ZZ2plZzRQSmcwNlZyaC1sbVE6MQ.
0 2 4 6 8 10 12
Independant
Public school
Catholic school
Selective government
N/A
Figure 4-1 a. The sample consisted of a higher ratio of Independent school to Public school and is therefore not representative of the state; however, all types of schools are present in the sample.
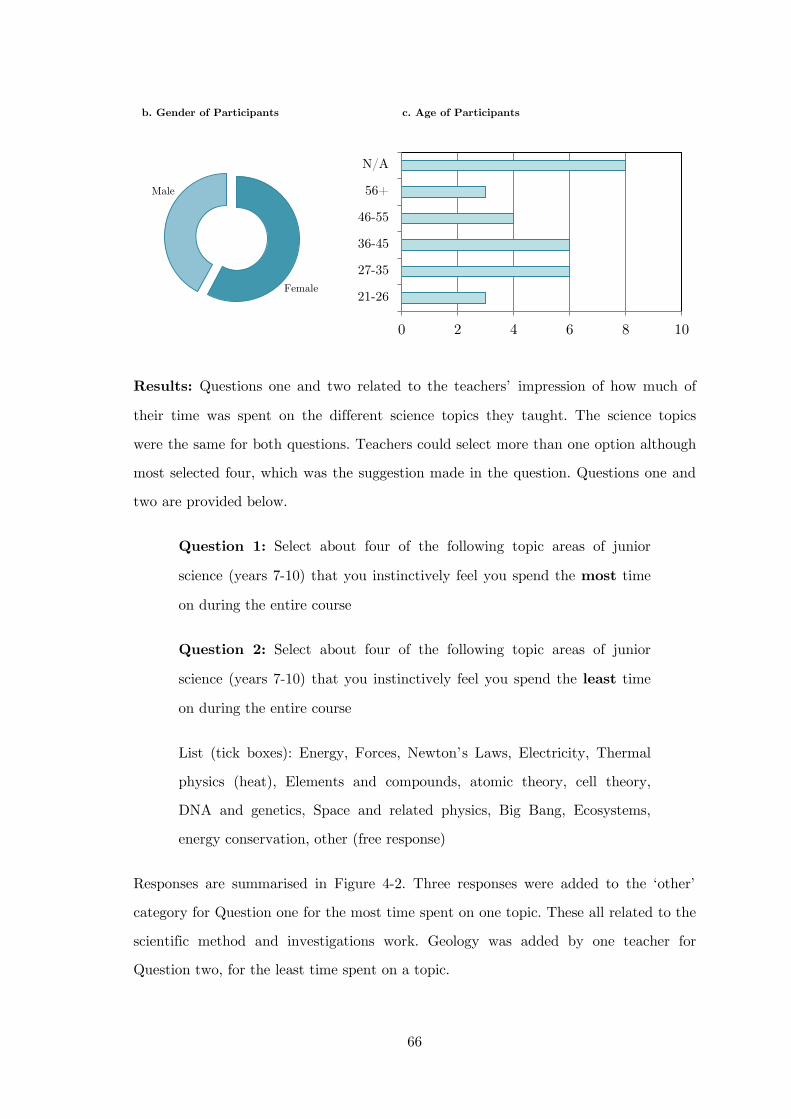
66
Results: Questions one and two related to the teachers’ impression of how much of
their time was spent on the different science topics they taught. The science topics
were the same for both questions. Teachers could select more than one option although
most selected four, which was the suggestion made in the question. Questions one and
two are provided below.
Question 1: Select about four of the following topic areas of junior
science (years 7-10) that you instinctively feel you spend the most time
on during the entire course
Question 2: Select about four of the following topic areas of junior
science (years 7-10) that you instinctively feel you spend the least time
on during the entire course
List (tick boxes): Energy, Forces, Newton’s Laws, Electricity, Thermal
physics (heat), Elements and compounds, atomic theory, cell theory,
DNA and genetics, Space and related physics, Big Bang, Ecosystems,
energy conservation, other (free response)
Responses are summarised in Figure 4-2. Three responses were added to the ‘other’
category for Question one for the most time spent on one topic. These all related to the
scientific method and investigations work. Geology was added by one teacher for
Question two, for the least time spent on a topic.
0 2 4 6 8 10
21-26
27-35
36-45
46-55
56+
N/A
Female
Male
b. Gender of Participants c. Age of Participants
67
Figure 4-2 Teachers' reports of subjects with most and least coverage during junior high school science
Thermal physics was reported to be the least covered in the junior curriculum, followed
closely by the Big Bang. Teachers felt they spent the most time teaching chemistry
topics (elements and compounds), followed closely by energy concepts.
The next question related to the amount of time spent on thermal physics in stages
four and five:
Question 7: How much time would you usually allocate for the
statement provided above from the stage 4/5 syllabus?
The average time taken by the 30 respondents was exactly 3 hours, with the vast
majority reporting three hours and a small number reporting both two and four.
The next question was an attempt to probe which topics beyond the ‘three methods of
heat transfer’ stipulated in the syllabus were covered during the coverage of thermal
physics topics. Question ten is provided below.
0% 10% 20% 30% 40% 50% 60% 70% 80% 90%
100%
Least Middle Most
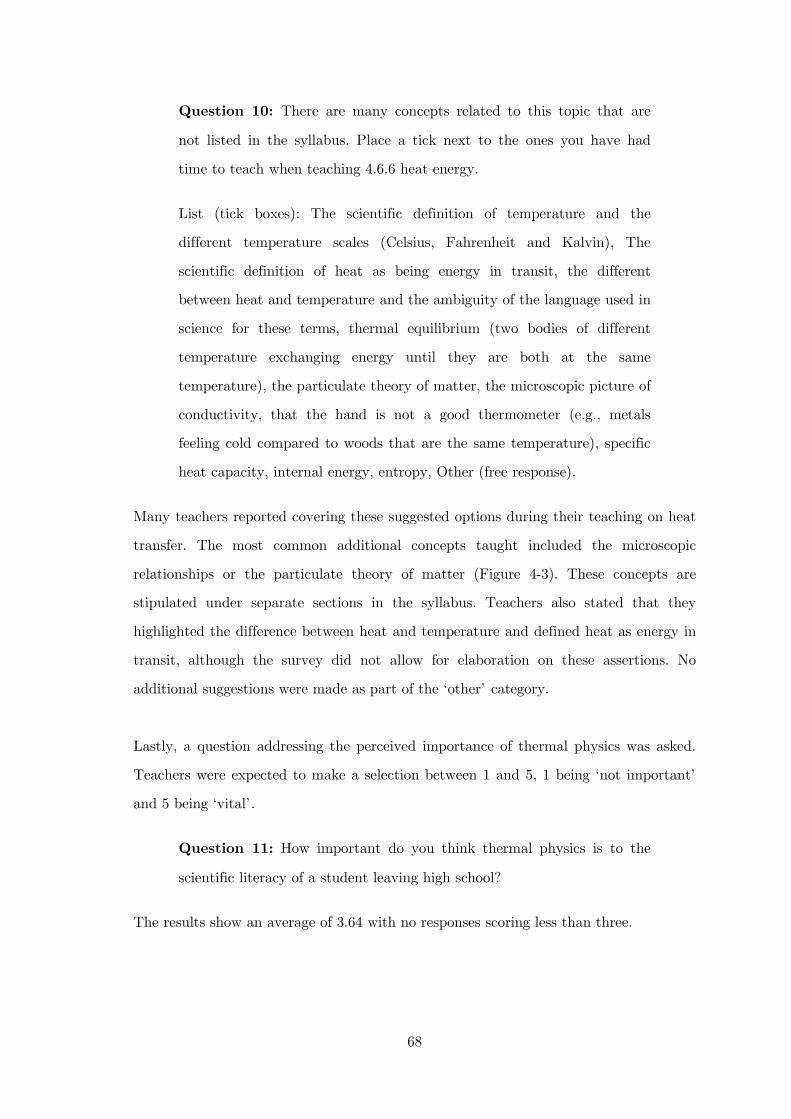
68
Question 10: There are many concepts related to this topic that are
not listed in the syllabus. Place a tick next to the ones you have had
time to teach when teaching 4.6.6 heat energy.
List (tick boxes): The scientific definition of temperature and the
different temperature scales (Celsius, Fahrenheit and Kalvin), The
scientific definition of heat as being energy in transit, the different
between heat and temperature and the ambiguity of the language used in
science for these terms, thermal equilibrium (two bodies of different
temperature exchanging energy until they are both at the same
temperature), the particulate theory of matter, the microscopic picture of
conductivity, that the hand is not a good thermometer (e.g., metals
feeling cold compared to woods that are the same temperature), specific
heat capacity, internal energy, entropy, Other (free response).
Many teachers reported covering these suggested options during their teaching on heat
transfer. The most common additional concepts taught included the microscopic
relationships or the particulate theory of matter (Figure 4-3). These concepts are
stipulated under separate sections in the syllabus. Teachers also stated that they
highlighted the difference between heat and temperature and defined heat as energy in
transit, although the survey did not allow for elaboration on these assertions. No
additional suggestions were made as part of the ‘other’ category.
Lastly, a question addressing the perceived importance of thermal physics was asked.
Teachers were expected to make a selection between 1 and 5, 1 being ‘not important’
and 5 being ‘vital’.
Question 11: How important do you think thermal physics is to the
scientific literacy of a student leaving high school?
The results show an average of 3.64 with no responses scoring less than three.
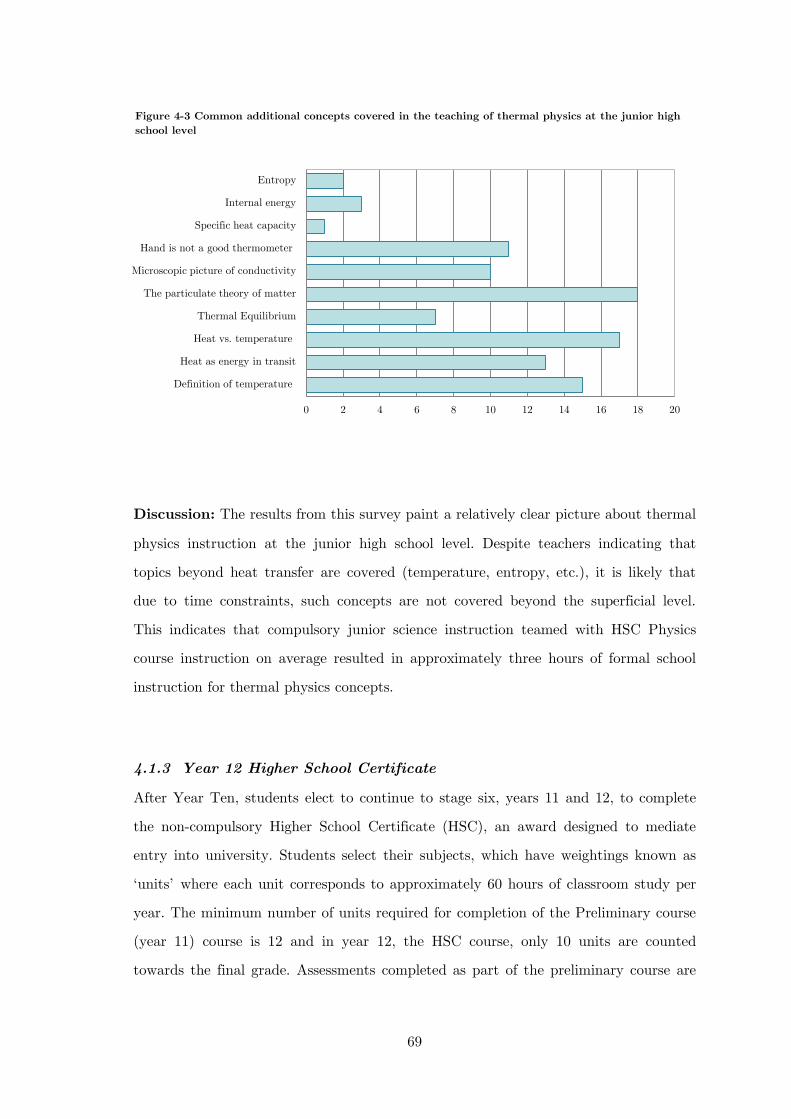
69
Discussion: The results from this survey paint a relatively clear picture about thermal
physics instruction at the junior high school level. Despite teachers indicating that
topics beyond heat transfer are covered (temperature, entropy, etc.), it is likely that
due to time constraints, such concepts are not covered beyond the superficial level.
This indicates that compulsory junior science instruction teamed with HSC Physics
course instruction on average resulted in approximately three hours of formal school
instruction for thermal physics concepts.
4.1.3 Year 12 Higher School Certificate
After Year Ten, students elect to continue to stage six, years 11 and 12, to complete
the non-compulsory Higher School Certificate (HSC), an award designed to mediate
entry into university. Students select their subjects, which have weightings known as
‘units’ where each unit corresponds to approximately 60 hours of classroom study per
year. The minimum number of units required for completion of the Preliminary course
(year 11) course is 12 and in year 12, the HSC course, only 10 units are counted
towards the final grade. Assessments completed as part of the preliminary course are
0 2 4 6 8 10 12 14 16 18 20
Definition of temperature
Heat as energy in transit
Heat vs. temperature
Thermal Equilibrium
The particulate theory of matter
Microscopic picture of conductivity
Hand is not a good thermometer
Specific heat capacity
Internal energy
Entropy
Figure 4-3 Common additional concepts covered in the teaching of thermal physics at the junior high school level
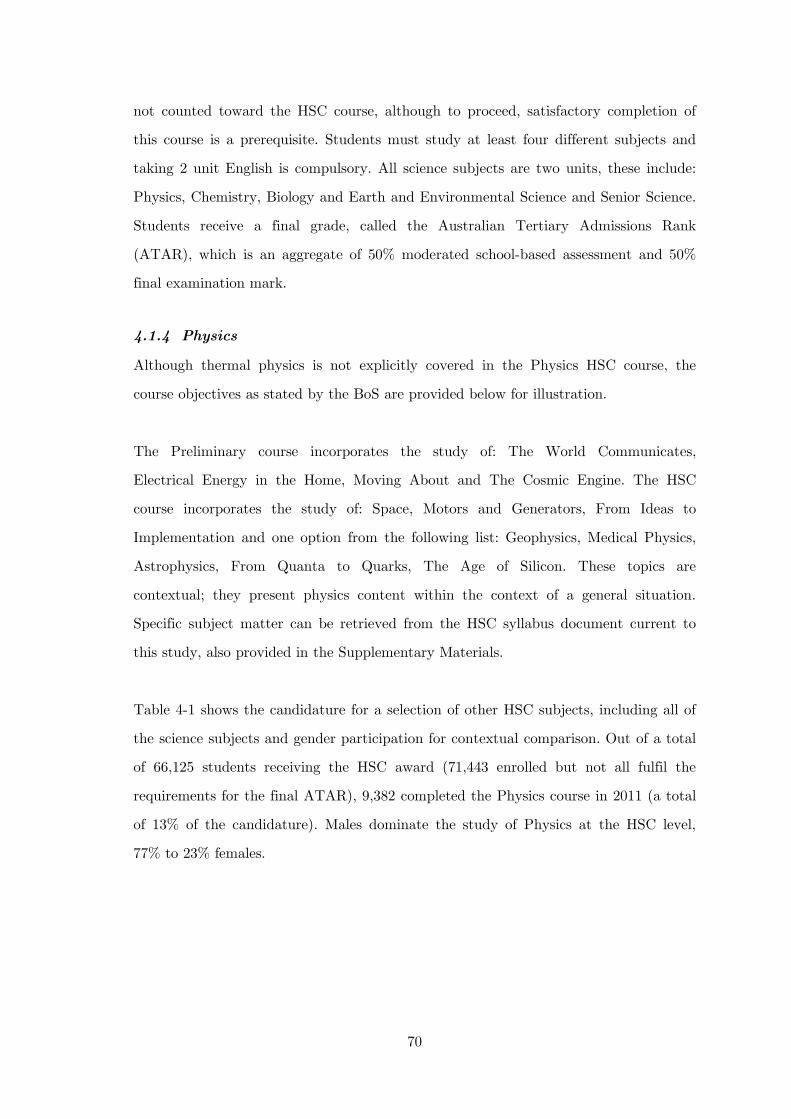
70
not counted toward the HSC course, although to proceed, satisfactory completion of
this course is a prerequisite. Students must study at least four different subjects and
taking 2 unit English is compulsory. All science subjects are two units, these include:
Physics, Chemistry, Biology and Earth and Environmental Science and Senior Science.
Students receive a final grade, called the Australian Tertiary Admissions Rank
(ATAR), which is an aggregate of 50% moderated school-based assessment and 50%
final examination mark.
4.1.4 Physics
Although thermal physics is not explicitly covered in the Physics HSC course, the
course objectives as stated by the BoS are provided below for illustration.
The Preliminary course incorporates the study of: The World Communicates,
Electrical Energy in the Home, Moving About and The Cosmic Engine. The HSC
course incorporates the study of: Space, Motors and Generators, From Ideas to
Implementation and one option from the following list: Geophysics, Medical Physics,
Astrophysics, From Quanta to Quarks, The Age of Silicon. These topics are
contextual; they present physics content within the context of a general situation.
Specific subject matter can be retrieved from the HSC syllabus document current to
this study, also provided in the Supplementary Materials.
Table 4-1 shows the candidature for a selection of other HSC subjects, including all of
the science subjects and gender participation for contextual comparison. Out of a total
of 66,125 students receiving the HSC award (71,443 enrolled but not all fulfil the
requirements for the final ATAR), 9,382 completed the Physics course in 2011 (a total
of 13% of the candidature). Males dominate the study of Physics at the HSC level,
77% to 23% females.
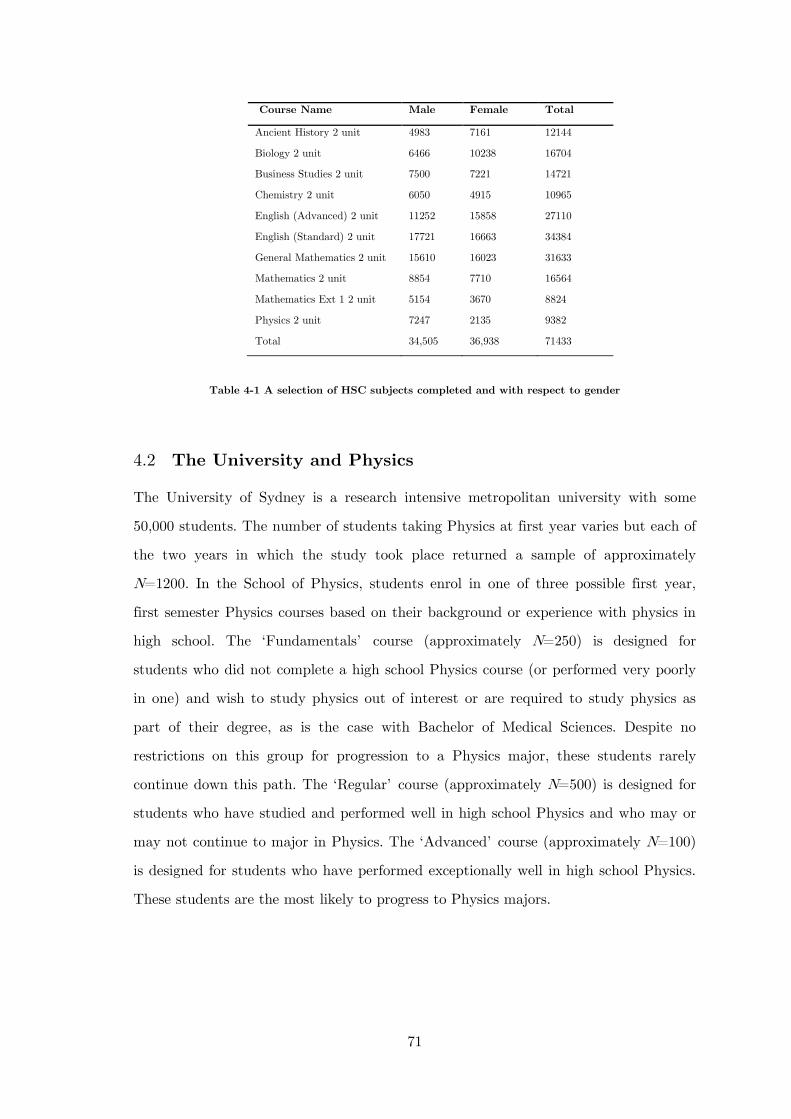
71
Course Name Male Female Total
Ancient History 2 unit 4983 7161 12144
Biology 2 unit 6466 10238 16704
Business Studies 2 unit 7500 7221 14721
Chemistry 2 unit 6050 4915 10965
English (Advanced) 2 unit 11252 15858 27110
English (Standard) 2 unit 17721 16663 34384
General Mathematics 2 unit 15610 16023 31633
Mathematics 2 unit 8854 7710 16564
Mathematics Ext 1 2 unit 5154 3670 8824
Physics 2 unit 7247 2135 9382
Total 34,505 36,938 71433
Table 4-1 A selection of HSC subjects completed and with respect to gender
4.2 The University and Physics
The University of Sydney is a research intensive metropolitan university with some
50,000 students. The number of students taking Physics at first year varies but each of
the two years in which the study took place returned a sample of approximately
N=1200. In the School of Physics, students enrol in one of three possible first year,
first semester Physics courses based on their background or experience with physics in
high school. The ‘Fundamentals’ course (approximately N=250) is designed for
students who did not complete a high school Physics course (or performed very poorly
in one) and wish to study physics out of interest or are required to study physics as
part of their degree, as is the case with Bachelor of Medical Sciences. Despite no
restrictions on this group for progression to a Physics major, these students rarely
continue down this path. The ‘Regular’ course (approximately N=500) is designed for
students who have studied and performed well in high school Physics and who may or
may not continue to major in Physics. The ‘Advanced’ course (approximately N=100)
is designed for students who have performed exceptionally well in high school Physics.
These students are the most likely to progress to Physics majors.
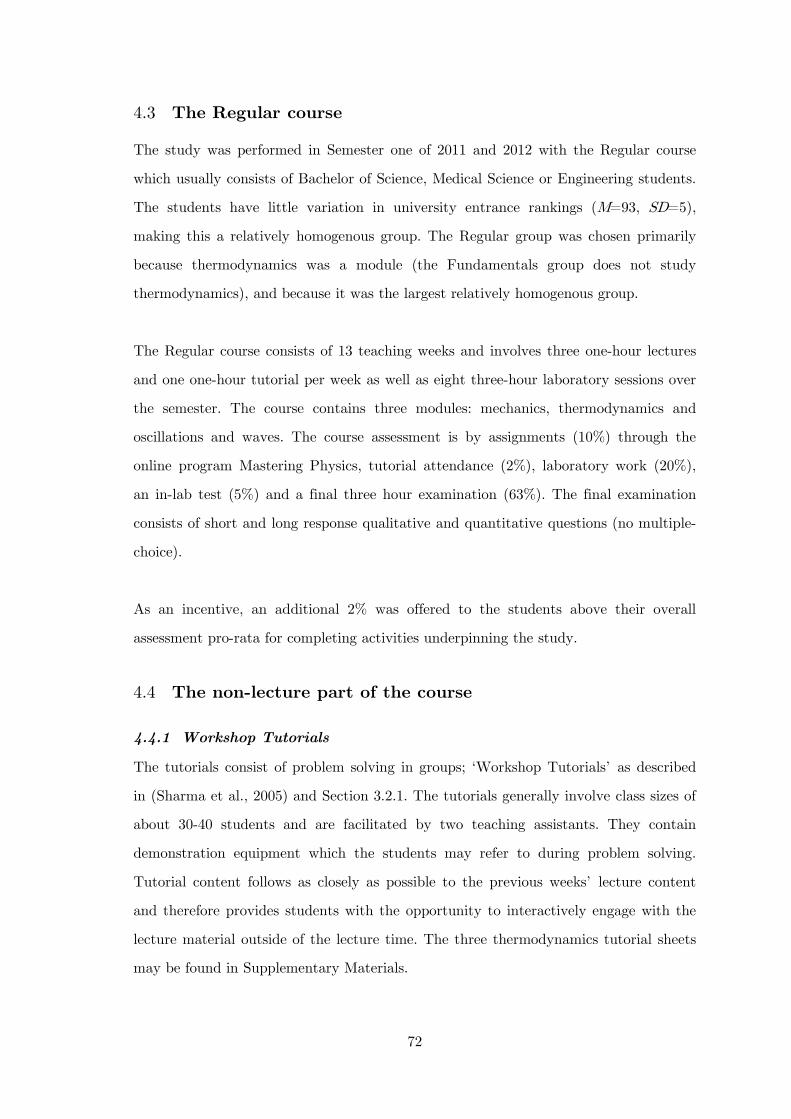
72
4.3 The Regular course
The study was performed in Semester one of 2011 and 2012 with the Regular course
which usually consists of Bachelor of Science, Medical Science or Engineering students.
The students have little variation in university entrance rankings (M=93, SD=5),
making this a relatively homogenous group. The Regular group was chosen primarily
because thermodynamics was a module (the Fundamentals group does not study
thermodynamics), and because it was the largest relatively homogenous group.
The Regular course consists of 13 teaching weeks and involves three one-hour lectures
and one one-hour tutorial per week as well as eight three-hour laboratory sessions over
the semester. The course contains three modules: mechanics, thermodynamics and
oscillations and waves. The course assessment is by assignments (10%) through the
online program Mastering Physics, tutorial attendance (2%), laboratory work (20%),
an in-lab test (5%) and a final three hour examination (63%). The final examination
consists of short and long response qualitative and quantitative questions (no multiple-
choice).
As an incentive, an additional 2% was offered to the students above their overall
assessment pro-rata for completing activities underpinning the study.
4.4 The non-lecture part of the course
4.4.1 Workshop Tutorials
The tutorials consist of problem solving in groups; ‘Workshop Tutorials’ as described
in (Sharma et al., 2005) and Section 3.2.1. The tutorials generally involve class sizes of
about 30-40 students and are facilitated by two teaching assistants. They contain
demonstration equipment which the students may refer to during problem solving.
Tutorial content follows as closely as possible to the previous weeks’ lecture content
and therefore provides students with the opportunity to interactively engage with the
lecture material outside of the lecture time. The three thermodynamics tutorial sheets
may be found in Supplementary Materials.
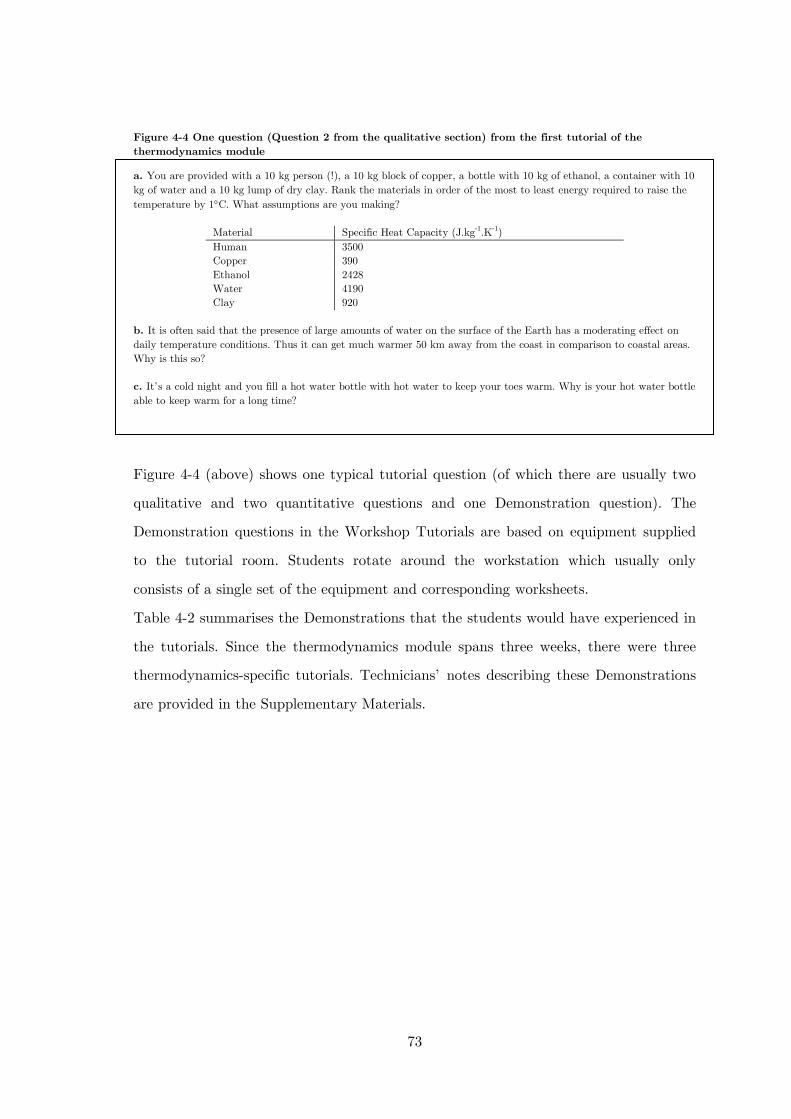
73
a. You are provided with a 10 kg person (!), a 10 kg block of copper, a bottle with 10 kg of ethanol, a container with 10 kg of water and a 10 kg lump of dry clay. Rank the materials in order of the most to least energy required to raise the temperature by 1°C. What assumptions are you making?
Material Specific Heat Capacity (J.kg-1.K-1
Human )
3500 Copper 390 Ethanol 2428 Water 4190 Clay 920
b. It is often said that the presence of large amounts of water on the surface of the Earth has a moderating effect on daily temperature conditions. Thus it can get much warmer 50 km away from the coast in comparison to coastal areas. Why is this so? c. It’s a cold night and you fill a hot water bottle with hot water to keep your toes warm. Why is your hot water bottle able to keep warm for a long time?
Figure 4-4 (above) shows one typical tutorial question (of which there are usually two
qualitative and two quantitative questions and one Demonstration question). The
Demonstration questions in the Workshop Tutorials are based on equipment supplied
to the tutorial room. Students rotate around the workstation which usually only
consists of a single set of the equipment and corresponding worksheets.
Table 4-2 summarises the Demonstrations that the students would have experienced in
the tutorials. Since the thermodynamics module spans three weeks, there were three
thermodynamics-specific tutorials. Technicians’ notes describing these Demonstrations
are provided in the Supplementary Materials.
Figure 4-4 One question (Question 2 from the qualitative section) from the first tutorial of the thermodynamics module
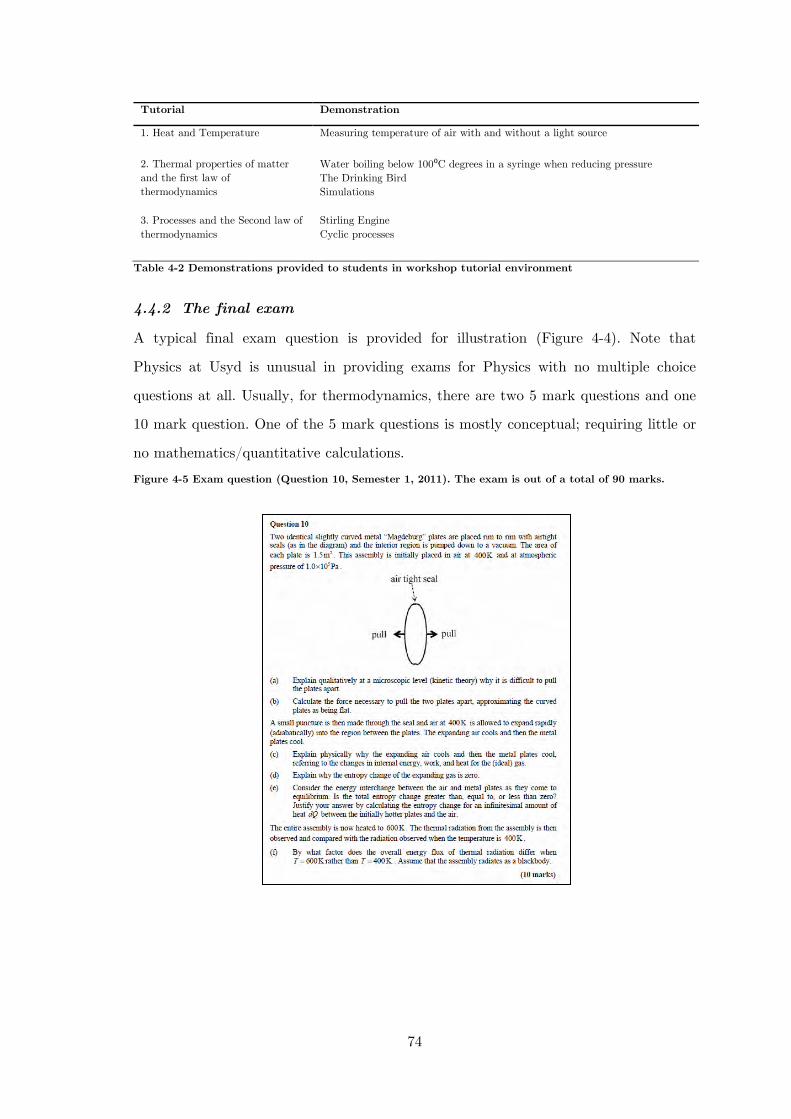
74
Tutorial Demonstration
1. Heat and Temperature Measuring temperature of air with and without a light source
2. Thermal properties of matter and the first law of thermodynamics
Water boiling below 100⁰C degrees in a syringe when reducing pressure The Drinking Bird Simulations
3. Processes and the Second law of thermodynamics
Stirling Engine Cyclic processes
Table 4-2 Demonstrations provided to students in workshop tutorial environment
4.4.2 The final exam
A typical final exam question is provided for illustration (Figure 4-4). Note that
Physics at Usyd is unusual in providing exams for Physics with no multiple choice
questions at all. Usually, for thermodynamics, there are two 5 mark questions and one
10 mark question. One of the 5 mark questions is mostly conceptual; requiring little or
no mathematics/quantitative calculations.
Figure 4-5 Exam question (Question 10, Semester 1, 2011). The exam is out of a total of 90 marks.
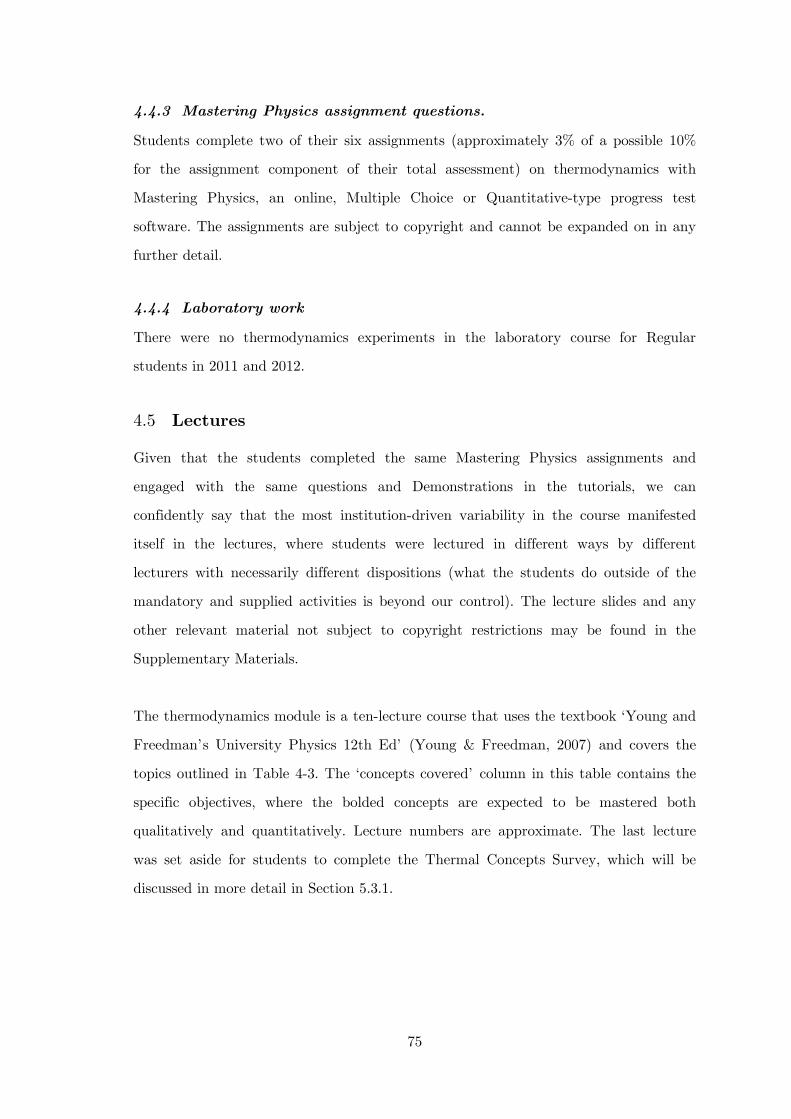
75
4.4.3 Mastering Physics assignment questions.
Students complete two of their six assignments (approximately 3% of a possible 10%
for the assignment component of their total assessment) on thermodynamics with
Mastering Physics, an online, Multiple Choice or Quantitative-type progress test
software. The assignments are subject to copyright and cannot be expanded on in any
further detail.
4.4.4 Laboratory work
There were no thermodynamics experiments in the laboratory course for Regular
students in 2011 and 2012.
4.5 Lectures
Given that the students completed the same Mastering Physics assignments and
engaged with the same questions and Demonstrations in the tutorials, we can
confidently say that the most institution-driven variability in the course manifested
itself in the lectures, where students were lectured in different ways by different
lecturers with necessarily different dispositions (what the students do outside of the
mandatory and supplied activities is beyond our control). The lecture slides and any
other relevant material not subject to copyright restrictions may be found in the
Supplementary Materials.
The thermodynamics module is a ten-lecture course that uses the textbook ‘Young and
Freedman’s University Physics 12th Ed’ (Young & Freedman, 2007) and covers the
topics outlined in Table 4-3. The ‘concepts covered’ column in this table contains the
specific objectives, where the bolded concepts are expected to be mastered both
qualitatively and quantitatively. Lecture numbers are approximate. The last lecture
was set aside for students to complete the Thermal Concepts Survey, which will be
discussed in more detail in Section 5.3.1.
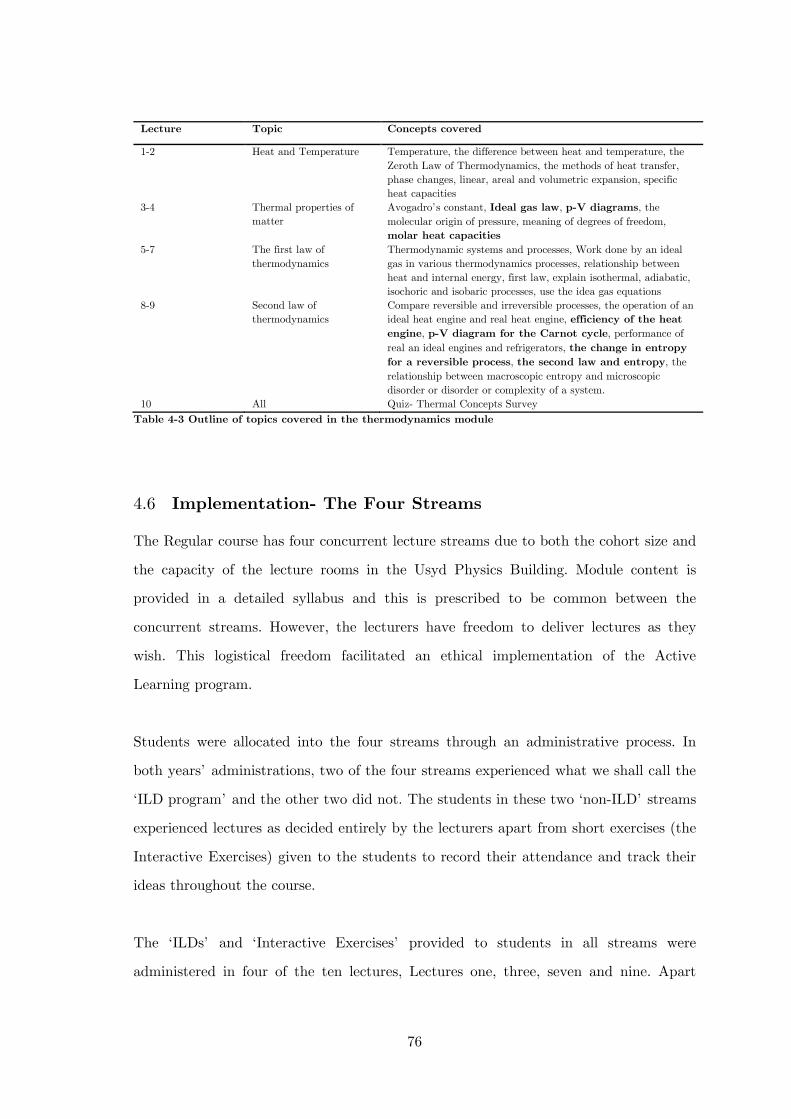
76
Table 4-3 Outline of topics covered in the thermodynamics module
4.6 Implementation- The Four Streams
The Regular course has four concurrent lecture streams due to both the cohort size and
the capacity of the lecture rooms in the Usyd Physics Building. Module content is
provided in a detailed syllabus and this is prescribed to be common between the
concurrent streams. However, the lecturers have freedom to deliver lectures as they
wish. This logistical freedom facilitated an ethical implementation of the Active
Learning program.
Students were allocated into the four streams through an administrative process. In
both years’ administrations, two of the four streams experienced what we shall call the
‘ILD program’ and the other two did not. The students in these two ‘non-ILD’ streams
experienced lectures as decided entirely by the lecturers apart from short exercises (the
Interactive Exercises) given to the students to record their attendance and track their
ideas throughout the course.
The ‘ILDs’ and ‘Interactive Exercises’ provided to students in all streams were
administered in four of the ten lectures, Lectures one, three, seven and nine. Apart
Lecture Topic Concepts covered
1-2 Heat and Temperature Temperature, the difference between heat and temperature, the Zeroth Law of Thermodynamics, the methods of heat transfer, phase changes, linear, areal and volumetric expansion, specific heat capacities
3-4 Thermal properties of matter
Avogadro’s constant, Ideal gas law, p-V diagrams, the molecular origin of pressure, meaning of degrees of freedom, molar heat capacities
5-7 The first law of thermodynamics
Thermodynamic systems and processes, Work done by an ideal gas in various thermodynamics processes, relationship between heat and internal energy, first law, explain isothermal, adiabatic, isochoric and isobaric processes, use the idea gas equations
8-9 Second law of thermodynamics
Compare reversible and irreversible processes, the operation of an ideal heat engine and real heat engine, efficiency of the heat engine, p-V diagram for the Carnot cycle, performance of real an ideal engines and refrigerators, the change in entropy for a reversible process, the second law and entropy, the relationship between macroscopic entropy and microscopic disorder or disorder or complexity of a system.
10 All Quiz- Thermal Concepts Survey
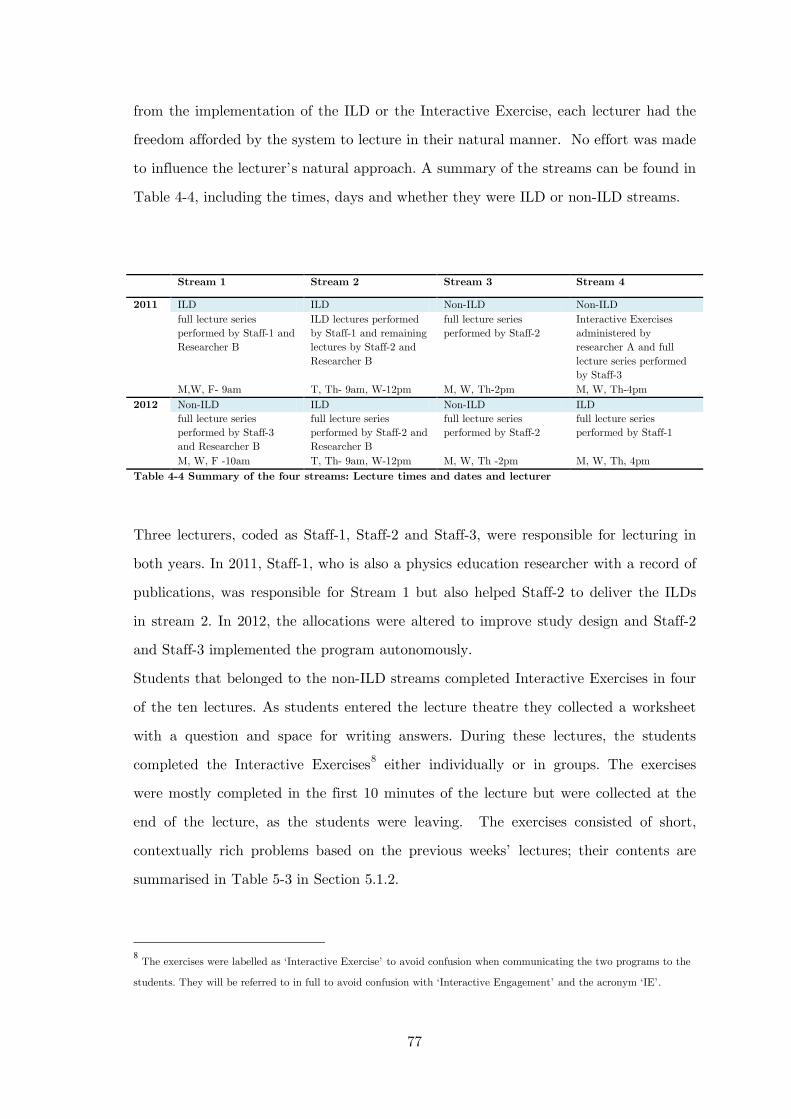
77
from the implementation of the ILD or the Interactive Exercise, each lecturer had the
freedom afforded by the system to lecture in their natural manner. No effort was made
to influence the lecturer’s natural approach. A summary of the streams can be found in
Table 4-4, including the times, days and whether they were ILD or non-ILD streams.
Stream 1 Stream 2 Stream 3 Stream 4
2011 ILD ILD Non-ILD Non-ILD full lecture series performed by Staff-1 and Researcher B
ILD lectures performed by Staff-1 and remaining lectures by Staff-2 and Researcher B
full lecture series performed by Staff-2
Interactive Exercises administered by researcher A and full lecture series performed by Staff-3
M,W, F- 9am T, Th- 9am, W-12pm M, W, Th-2pm M, W, Th-4pm 2012 Non-ILD ILD Non-ILD ILD
full lecture series performed by Staff-3 and Researcher B
full lecture series performed by Staff-2 and Researcher B
full lecture series performed by Staff-2
full lecture series performed by Staff-1
M, W, F -10am T, Th- 9am, W-12pm M, W, Th -2pm M, W, Th, 4pm Table 4-4 Summary of the four streams: Lecture times and dates and lecturer
Three lecturers, coded as Staff-1, Staff-2 and Staff-3, were responsible for lecturing in
both years. In 2011, Staff-1, who is also a physics education researcher with a record of
publications, was responsible for Stream 1 but also helped Staff-2 to deliver the ILDs
in stream 2. In 2012, the allocations were altered to improve study design and Staff-2
and Staff-3 implemented the program autonomously.
Students that belonged to the non-ILD streams completed Interactive Exercises in four
of the ten lectures. As students entered the lecture theatre they collected a worksheet
with a question and space for writing answers. During these lectures, the students
completed the Interactive Exercises8
Table 5-3
either individually or in groups. The exercises
were mostly completed in the first 10 minutes of the lecture but were collected at the
end of the lecture, as the students were leaving. The exercises consisted of short,
contextually rich problems based on the previous weeks’ lectures; their contents are
summarised in in Section 5.1.2.
8 The exercises were labelled as ‘Interactive Exercise’ to avoid confusion when communicating the two programs to the
students. They will be referred to in full to avoid confusion with ‘Interactive Engagement’ and the acronym ‘IE’.
78
An explanation of each exercise was provided in the first 5 minutes of the following
lecture and students were supplied with the PowerPoint presentation used in the
explanation (Appendix C). Common problems encountered by the students were
compiled and presented during the presentation of the explanation. The lecture then
continued as planned by the lecturer.
Students that belonged to ILD streams experienced the ILD program in four of the ten
lectures. The ILDs went ahead as specified in the list in the Section 3.2.1 and took the
majority of the lecture. The ILDs altered the existing lecture arrangement and the
content of the lecture slides were therefore also altered to accommodate this. Staff-1, 2,
and 3, Researcher A, along with Researcher B and technical staff attended a series of
meetings to make these significant changes.
4.7 Contributions
As with any research, multiple people contribute in different ways. The SUPER group
have contributed in validation in terms of insights on conventional categorisation and
instrument construction. Karl Maton and Christine Lindstrom (later labelled as S3)
have added direction and insight on LCT. The most significant contribution has been
from Researcher B, Dr. Pornrat Wattanakasiwich, from Chang Mai University, who
was a visiting Endeavour Fellow at the University of Sydney from February to June,
2011 and April, 2012. Dr. Wattanakasiwich developed the conceptual survey and some
of the ILDs. Both will be further detailed in Chapter 5.
79
5 Development of Research tools and Learning
Activities
This chapter will detail the various activities and instruments used in the two
iterations of the Active Learning implementation (Chapters 7, 8). The learning
activities will be described first, the observation tools and the evaluation of student
experiences will follow, while the instruments used to gauge student attainment will be
presented last. Some of these tools are used wholesale from existing PER research
output, others were amended somewhat, while some were completely original
developments. The scope of each description will reflect these characteristics; some will
be described with more detail than others.
5.1 Learning Activities
5.1.1 Interactive Lecture Demonstrations
The Interactive Lecture Demonstrations (ILDs) were implemented to act as an IE
method: to increase students’ participation and involvement in lectures to improve
attitudes to, and attainment in, thermodynamics. Of the range of ILDs used, some
were applied directly from The Physics Suite (Sokoloff & Thornton, 2004), whilst
original creations were also included to cover the range of concepts in the
thermodynamics module at Usyd. The development of the additional ILDs is described
in a separate research paper (Wattanakasiwich, Khamcharean, Taleab, & Sharma,
2012) and the ILDs themselves are authentic to the format and purpose of the original
design. That is, they confront ideas known to cause difficulties, abide by the 8-step
process (Table 5-1) and are supplemented by two worksheets, one for predictions, the
Prediction Sheet, and the other for recording, the Results Sheet.
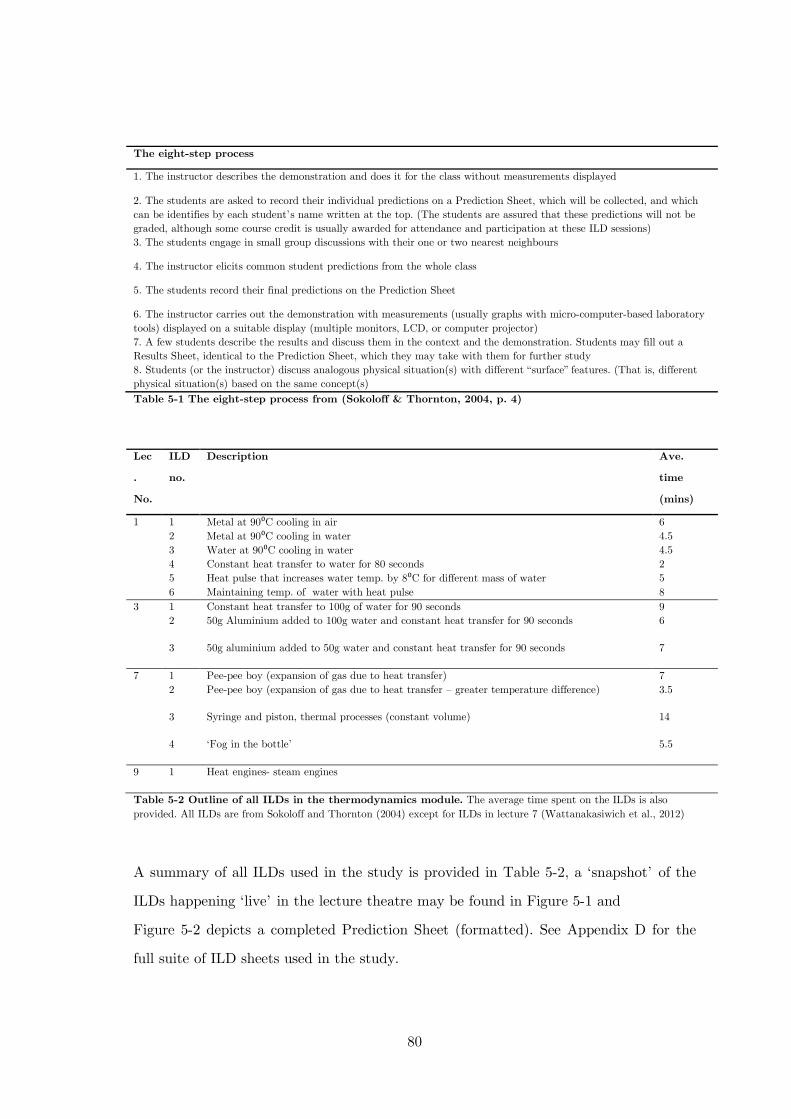
80
Table 5-1 The eight-step process from (Sokoloff & Thornton, 2004, p. 4)
Lec
.
No.
ILD
no.
Description Ave.
time
(mins)
1 1 Metal at 90⁰C cooling in air 6 2 Metal at 90⁰C cooling in water 4.5 3 Water at 90⁰C cooling in water 4.5 4 Constant heat transfer to water for 80 seconds 2 5 Heat pulse that increases water temp. by 8⁰C for different mass of water 5 6 Maintaining temp. of water with heat pulse 8
3 1 Constant heat transfer to 100g of water for 90 seconds 9
2 50g Aluminium added to 100g water and constant heat transfer for 90 seconds 6
3 50g aluminium added to 50g water and constant heat transfer for 90 seconds 7
7 1 Pee-pee boy (expansion of gas due to heat transfer) 7
2 Pee-pee boy (expansion of gas due to heat transfer – greater temperature difference) 3.5
3 Syringe and piston, thermal processes (constant volume) 14
4 ‘Fog in the bottle’ 5.5
9 1 Heat engines- steam engines
Table 5-2 Outline of all ILDs in the thermodynamics module. The average time spent on the ILDs is also provided. All ILDs are from Sokoloff and Thornton (2004) except for ILDs in lecture 7 (Wattanakasiwich et al., 2012)
A summary of all ILDs used in the study is provided in Table 5-2, a ‘snapshot’ of the
ILDs happening ‘live’ in the lecture theatre may be found in Figure 5-1 and
Figure 5-2 depicts a completed Prediction Sheet (formatted). See Appendix D for the
full suite of ILD sheets used in the study.
The eight-step process
1. The instructor describes the demonstration and does it for the class without measurements displayed
2. The students are asked to record their individual predictions on a Prediction Sheet, which will be collected, and which can be identifies by each student’s name written at the top. (The students are assured that these predictions will not be graded, although some course credit is usually awarded for attendance and participation at these ILD sessions) 3. The students engage in small group discussions with their one or two nearest neighbours
4. The instructor elicits common student predictions from the whole class
5. The students record their final predictions on the Prediction Sheet
6. The instructor carries out the demonstration with measurements (usually graphs with micro-computer-based laboratory tools) displayed on a suitable display (multiple monitors, LCD, or computer projector) 7. A few students describe the results and discuss them in the context and the demonstration. Students may fill out a Results Sheet, identical to the Prediction Sheet, which they may take with them for further study 8. Students (or the instructor) discuss analogous physical situation(s) with different “surface” features. (That is, different physical situation(s) based on the same concept(s)
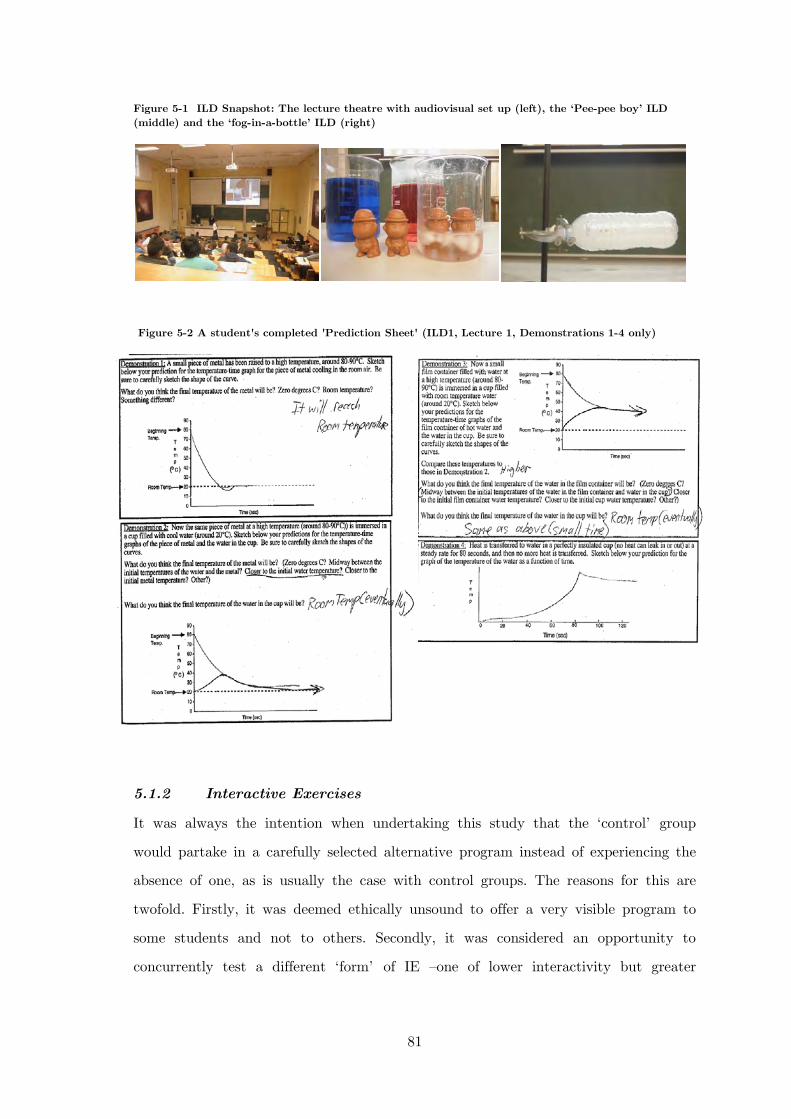
81
Figure 5-1 ILD Snapshot: The lecture theatre with audiovisual set up (left), the ‘Pee-pee boy’ ILD (middle) and the ‘fog-in-a-bottle’ ILD (right)
5.1.2 Interactive Exercises
It was always the intention when undertaking this study that the ‘control’ group
would partake in a carefully selected alternative program instead of experiencing the
absence of one, as is usually the case with control groups. The reasons for this are
twofold. Firstly, it was deemed ethically unsound to offer a very visible program to
some students and not to others. Secondly, it was considered an opportunity to
concurrently test a different ‘form’ of IE –one of lower interactivity but greater
Figure 5-2 A student's completed 'Prediction Sheet' (ILD1, Lecture 1, Demonstrations 1-4 only)
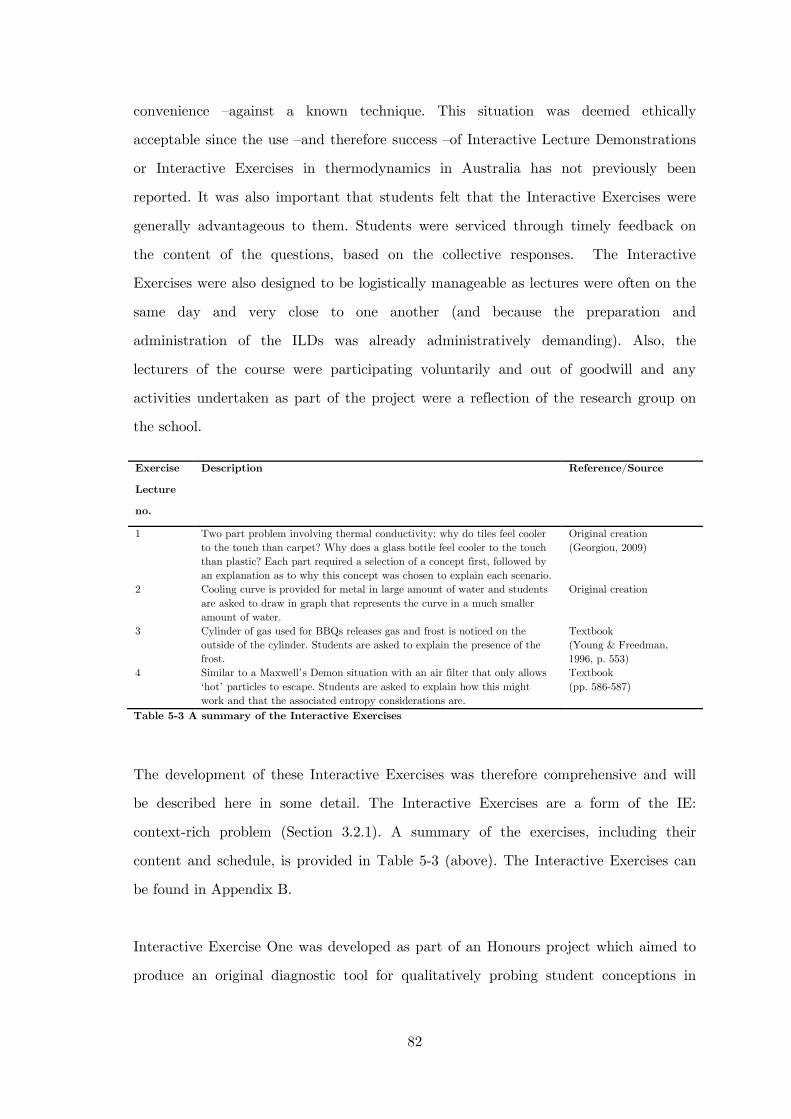
82
convenience –against a known technique. This situation was deemed ethically
acceptable since the use –and therefore success –of Interactive Lecture Demonstrations
or Interactive Exercises in thermodynamics in Australia has not previously been
reported. It was also important that students felt that the Interactive Exercises were
generally advantageous to them. Students were serviced through timely feedback on
the content of the questions, based on the collective responses. The Interactive
Exercises were also designed to be logistically manageable as lectures were often on the
same day and very close to one another (and because the preparation and
administration of the ILDs was already administratively demanding). Also, the
lecturers of the course were participating voluntarily and out of goodwill and any
activities undertaken as part of the project were a reflection of the research group on
the school.
Table 5-3 A summary of the Interactive Exercises
The development of these Interactive Exercises was therefore comprehensive and will
be described here in some detail. The Interactive Exercises are a form of the IE:
context-rich problem (Section 3.2.1). A summary of the exercises, including their
content and schedule, is provided in Table 5-3 (above). The Interactive Exercises can
be found in Appendix B.
Interactive Exercise One was developed as part of an Honours project which aimed to
produce an original diagnostic tool for qualitatively probing student conceptions in
Exercise
Lecture
no.
Description Reference/Source
1 Two part problem involving thermal conductivity: why do tiles feel cooler to the touch than carpet? Why does a glass bottle feel cooler to the touch than plastic? Each part required a selection of a concept first, followed by an explanation as to why this concept was chosen to explain each scenario.
Original creation (Georgiou, 2009)
2 Cooling curve is provided for metal in large amount of water and students are asked to draw in graph that represents the curve in a much smaller amount of water.
Original creation
3 Cylinder of gas used for BBQs releases gas and frost is noticed on the outside of the cylinder. Students are asked to explain the presence of the frost.
Textbook (Young & Freedman, 1996, p. 553)
4 Similar to a Maxwell’s Demon situation with an air filter that only allows ‘hot’ particles to escape. Students are asked to explain how this might work and that the associated entropy considerations are.
Textbook (pp. 586-587)
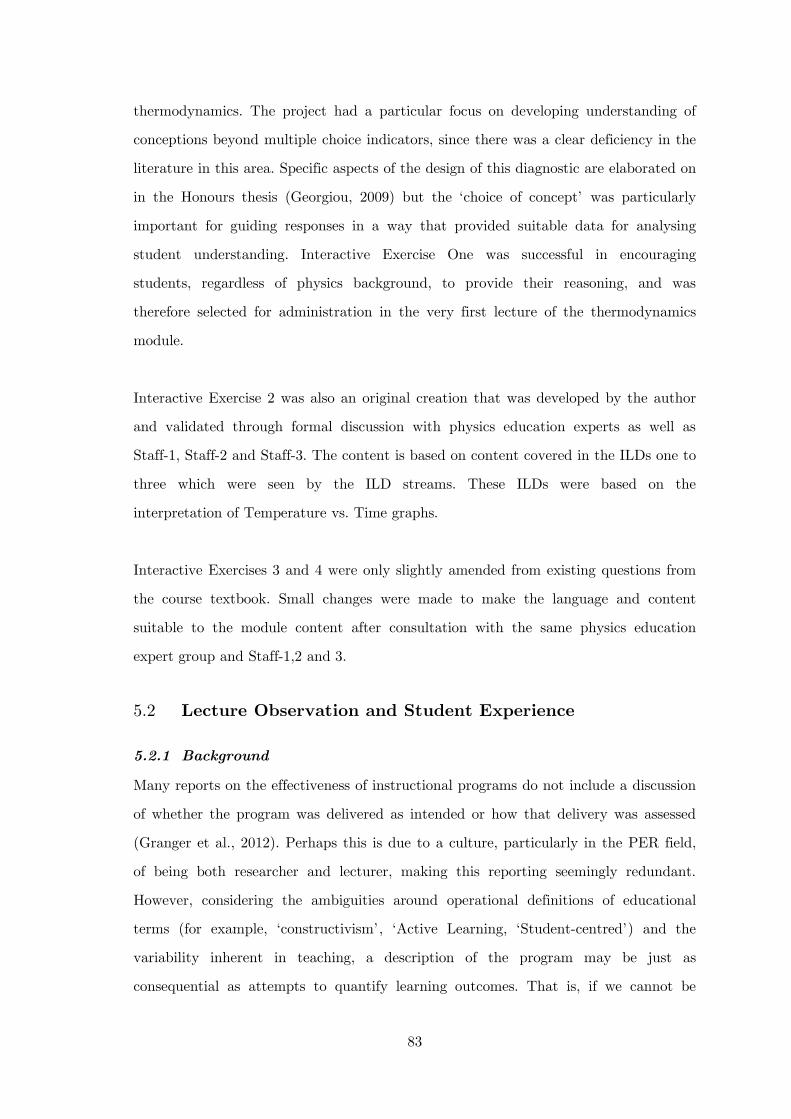
83
thermodynamics. The project had a particular focus on developing understanding of
conceptions beyond multiple choice indicators, since there was a clear deficiency in the
literature in this area. Specific aspects of the design of this diagnostic are elaborated on
in the Honours thesis (Georgiou, 2009) but the ‘choice of concept’ was particularly
important for guiding responses in a way that provided suitable data for analysing
student understanding. Interactive Exercise One was successful in encouraging
students, regardless of physics background, to provide their reasoning, and was
therefore selected for administration in the very first lecture of the thermodynamics
module.
Interactive Exercise 2 was also an original creation that was developed by the author
and validated through formal discussion with physics education experts as well as
Staff-1, Staff-2 and Staff-3. The content is based on content covered in the ILDs one to
three which were seen by the ILD streams. These ILDs were based on the
interpretation of Temperature vs. Time graphs.
Interactive Exercises 3 and 4 were only slightly amended from existing questions from
the course textbook. Small changes were made to make the language and content
suitable to the module content after consultation with the same physics education
expert group and Staff-1,2 and 3.
5.2 Lecture Observation and Student Experience
5.2.1 Background
Many reports on the effectiveness of instructional programs do not include a discussion
of whether the program was delivered as intended or how that delivery was assessed
(Granger et al., 2012). Perhaps this is due to a culture, particularly in the PER field,
of being both researcher and lecturer, making this reporting seemingly redundant.
However, considering the ambiguities around operational definitions of educational
terms (for example, ‘constructivism’, ‘Active Learning, ‘Student-centred’) and the
variability inherent in teaching, a description of the program may be just as
consequential as attempts to quantify learning outcomes. That is, if we cannot be
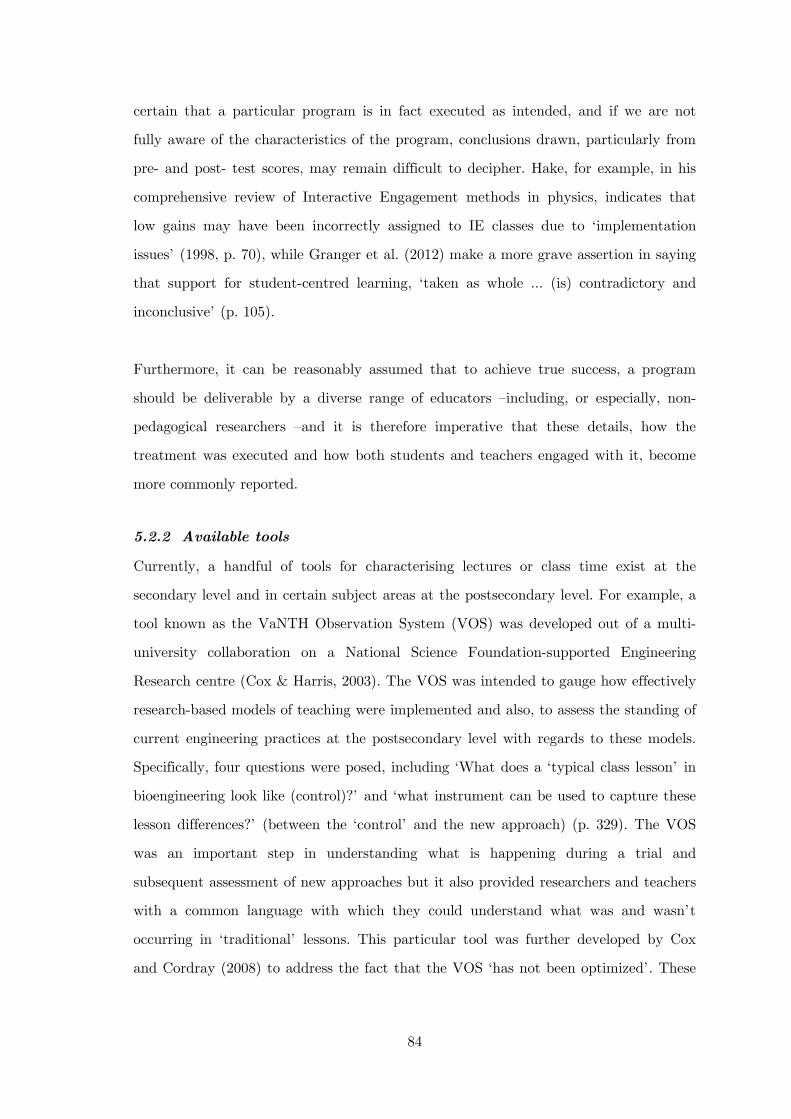
84
certain that a particular program is in fact executed as intended, and if we are not
fully aware of the characteristics of the program, conclusions drawn, particularly from
pre- and post- test scores, may remain difficult to decipher. Hake, for example, in his
comprehensive review of Interactive Engagement methods in physics, indicates that
low gains may have been incorrectly assigned to IE classes due to ‘implementation
issues’ (1998, p. 70), while Granger et al. (2012) make a more grave assertion in saying
that support for student-centred learning, ‘taken as whole … (is) contradictory and
inconclusive’ (p. 105).
Furthermore, it can be reasonably assumed that to achieve true success, a program
should be deliverable by a diverse range of educators –including, or especially, non-
pedagogical researchers –and it is therefore imperative that these details, how the
treatment was executed and how both students and teachers engaged with it, become
more commonly reported.
5.2.2 Available tools
Currently, a handful of tools for characterising lectures or class time exist at the
secondary level and in certain subject areas at the postsecondary level. For example, a
tool known as the VaNTH Observation System (VOS) was developed out of a multi-
university collaboration on a National Science Foundation-supported Engineering
Research centre (Cox & Harris, 2003). The VOS was intended to gauge how effectively
research-based models of teaching were implemented and also, to assess the standing of
current engineering practices at the postsecondary level with regards to these models.
Specifically, four questions were posed, including ‘What does a ‘typical class lesson’ in
bioengineering look like (control)?’ and ‘what instrument can be used to capture these
lesson differences?’ (between the ‘control’ and the new approach) (p. 329). The VOS
was an important step in understanding what is happening during a trial and
subsequent assessment of new approaches but it also provided researchers and teachers
with a common language with which they could understand what was and wasn’t
occurring in ‘traditional’ lessons. This particular tool was further developed by Cox
and Cordray (2008) to address the fact that the VOS ‘has not been optimized’. These
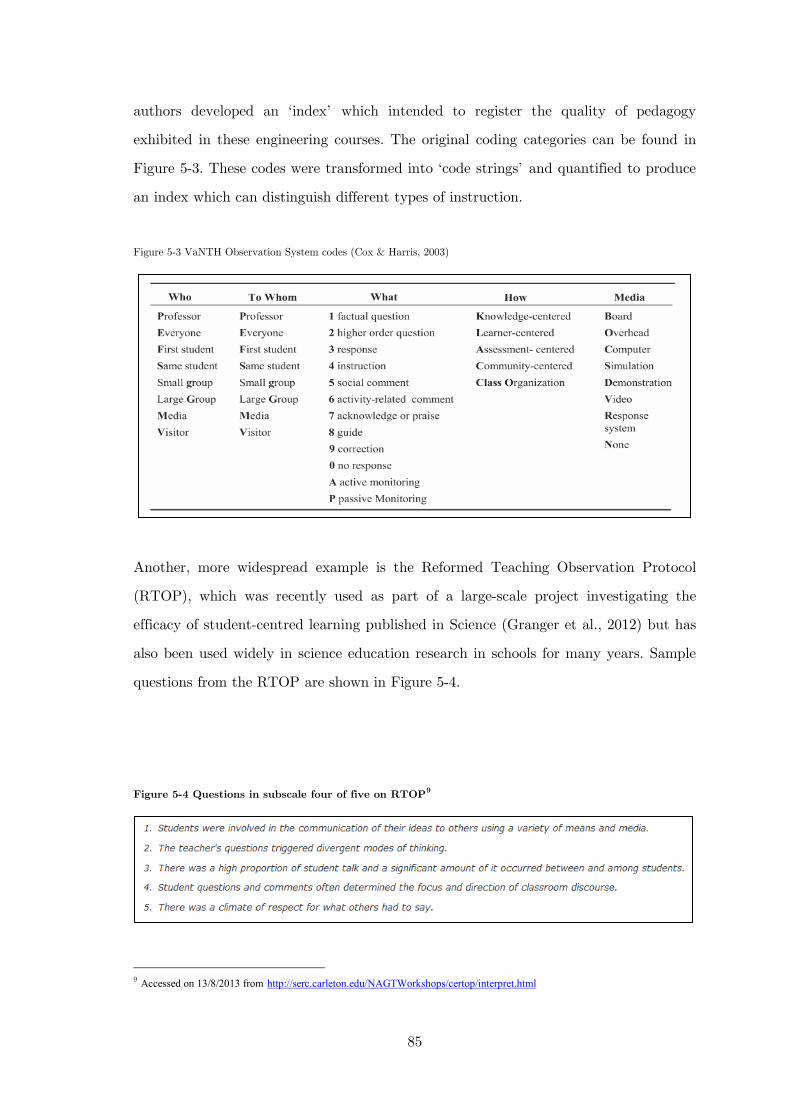
85
authors developed an ‘index’ which intended to register the quality of pedagogy
exhibited in these engineering courses. The original coding categories can be found in
Figure 5-3. These codes were transformed into ‘code strings’ and quantified to produce
an index which can distinguish different types of instruction.
Figure 5-3 VaNTH Observation System codes (Cox & Harris, 2003)
Another, more widespread example is the Reformed Teaching Observation Protocol
(RTOP), which was recently used as part of a large-scale project investigating the
efficacy of student-centred learning published in Science (Granger et al., 2012) but has
also been used widely in science education research in schools for many years. Sample
questions from the RTOP are shown in Figure 5-4.
Figure 5-4 Questions in subscale four of five on RTOP9
9 Accessed on 13/8/2013 from http://serc.carleton.edu/NAGTWorkshops/certop/interpret.html
86
Although the VOS was content-specific and the RTOP was specifically designed for use
in the K-12 context, their common purpose provides examples of the form of specific
measures that have proven useful in our own implementation.
The adjusted instrument used in our implementation will be referred to as the Lecturer
Activity and Student Engagement (LASE) tool. This tool is far less specific than its
predecessors but offers a simple and practical way to gauge the activities occurring
during the implementation of a new approach. It also helps uncover differences in
approaches, particularly in a naturalistic setting. Most importantly, it makes what is
happening in the lecture transparent.
5.2.3 The Lecturer Activity and Student Engagement (LASE) tool
As mentioned in Section 4.5, the main variety experiences by students in the Physics
course occurred in the lectures (since the tutorials, assignments and laboratory sessions
were equivalent). Therefore, it was the lectures that were coded as we tried to
characterise differences.
The Lecture Activity part of the tool codes with respect to activities and expectations
of the lecturer: what they are doing during their presentation and what they inherently
expect the students do. The Student Engagement part of the tool records how students
engage with these activities. Students are observed to determine what effect the lecture
activities have on them.
The main coding categories for the LA part are geared towards identifying the levels of
‘interactivity’ in the lectures. It can be noted that lectures in the School of Physics at
The University of Sydney are fairly ‘standard’ in that lecturers give a PowerPoint
presentation of one hour, lecture notes are shared and lecturers aim to cover content in
similar amounts of time.
All physics lectures at the University of Sydney are recorded and made available for
download and streaming for enrolled students. In 2011, the audio was available and in
87
2012, a visual component was also added, meaning that the students could access the
slides as well as any video the lecturer recorded during the lecture hour. Analysis of
the hit rate of each lecture shows that a minimal number of students used this service.
In 2011, on average, between 3 and 7 students accessed each audio lecture and in 2012,
between 7 and 10 students accessed the slide-shows per lecture. These data indicate
that the dominant channel for delivery of the physics content occurred face-to-face
during lectures.
The SE part of the tool involved directly observing students behaviour in lectures. The
lectures from 2011 and 2012 were analysed with regards to the Lecture Activity and in
2012, ethics approval (Appendix E) was sought to observe the lectures to record
Student Engagement. Although, due to logistical reasons, the LASE was technically
used asynchronously, there is no special reason for this to occur, that is, the LA and
SE part of the tool may be used together or separately.
Development of LA
Lecture activity was observed through the researcher acing as a non-participant
observer. Recordings of lectures were made through the School of Physics recording
system (Lectopia in 2011, Echo in 2012). Lecturers were not aware that the coding was
occurring until after they had delivered both years of lectures. Permission was sought
and received at this time from the lecturers. Mp3 files were downloaded and imported
into the software program NVivo where they were analysed. Further analysis and
statistical testing occurred in SPSS. In total, there were ten lectures in four streams
and therefore approximately 40 hours of recordings. The audio was automatically
programmed to cover the full hour, although Usyd classes generally begin at five past
the hour and finish five to the hour to give students enough time to move between
classes, resulting in a total of 50 minutes lecture time. No section of the lecture was
coded more than once, meaning all lectures were coded for a total of 60 minutes,
including the five minutes before and after when the recording was still running. Slides
were provided and used if there was any uncertainty in coding.
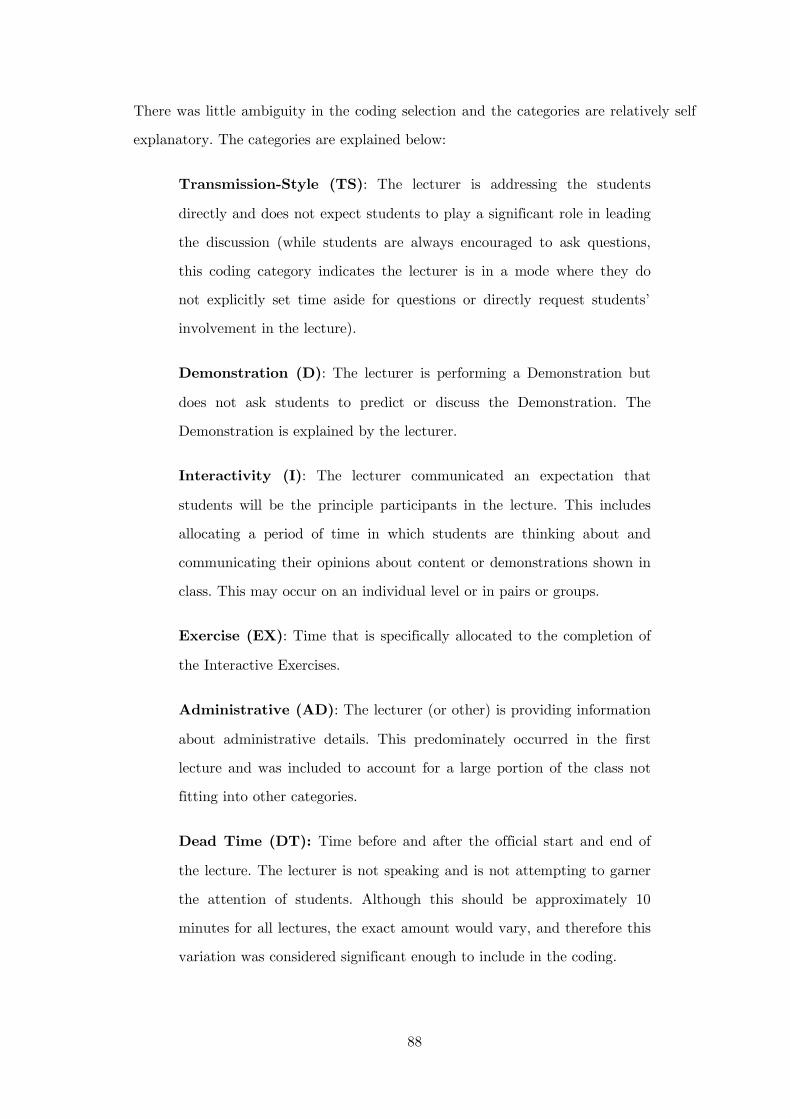
88
There was little ambiguity in the coding selection and the categories are relatively self
explanatory. The categories are explained below:
Transmission-Style (TS): The lecturer is addressing the students
directly and does not expect students to play a significant role in leading
the discussion (while students are always encouraged to ask questions,
this coding category indicates the lecturer is in a mode where they do
not explicitly set time aside for questions or directly request students’
involvement in the lecture).
Demonstration (D): The lecturer is performing a Demonstration but
does not ask students to predict or discuss the Demonstration. The
Demonstration is explained by the lecturer.
Interactivity (I): The lecturer communicated an expectation that
students will be the principle participants in the lecture. This includes
allocating a period of time in which students are thinking about and
communicating their opinions about content or demonstrations shown in
class. This may occur on an individual level or in pairs or groups.
Exercise (EX): Time that is specifically allocated to the completion of
the Interactive Exercises.
Administrative (AD): The lecturer (or other) is providing information
about administrative details. This predominately occurred in the first
lecture and was included to account for a large portion of the class not
fitting into other categories.
Dead Time (DT): Time before and after the official start and end of
the lecture. The lecturer is not speaking and is not attempting to garner
the attention of students. Although this should be approximately 10
minutes for all lectures, the exact amount would vary, and therefore this
variation was considered significant enough to include in the coding.
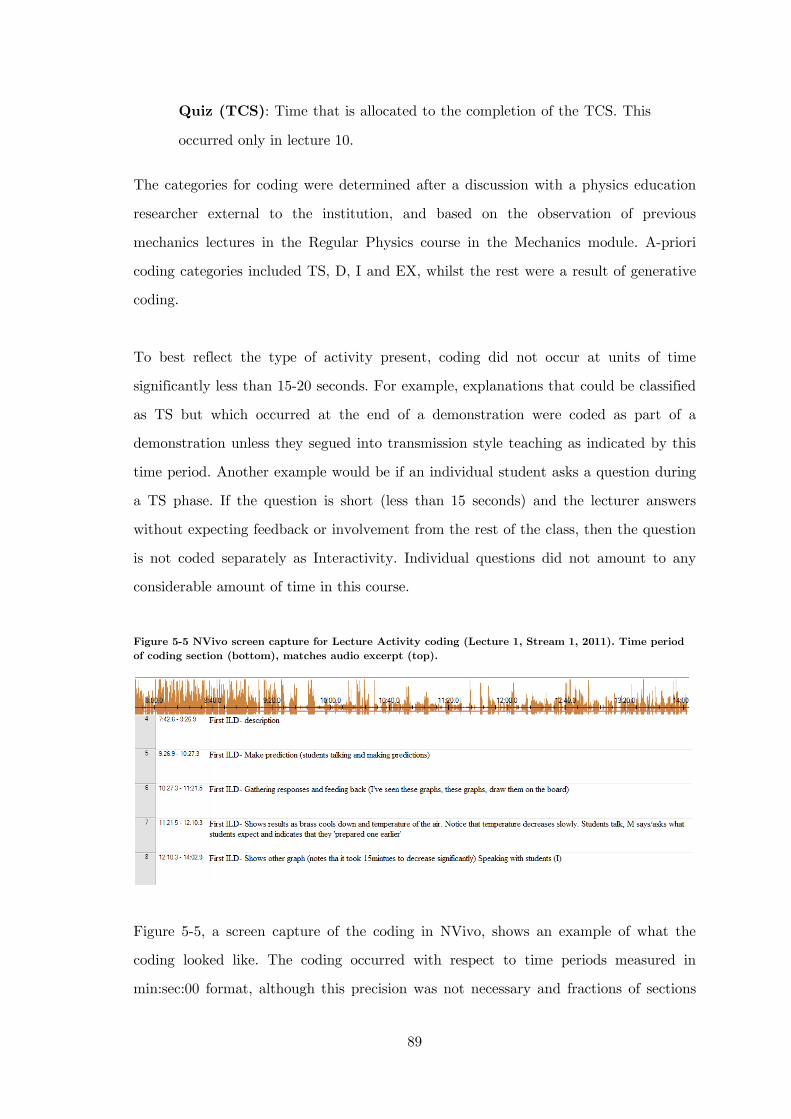
89
Quiz (TCS): Time that is allocated to the completion of the TCS. This
occurred only in lecture 10.
The categories for coding were determined after a discussion with a physics education
researcher external to the institution, and based on the observation of previous
mechanics lectures in the Regular Physics course in the Mechanics module. A-priori
coding categories included TS, D, I and EX, whilst the rest were a result of generative
coding.
To best reflect the type of activity present, coding did not occur at units of time
significantly less than 15-20 seconds. For example, explanations that could be classified
as TS but which occurred at the end of a demonstration were coded as part of a
demonstration unless they segued into transmission style teaching as indicated by this
time period. Another example would be if an individual student asks a question during
a TS phase. If the question is short (less than 15 seconds) and the lecturer answers
without expecting feedback or involvement from the rest of the class, then the question
is not coded separately as Interactivity. Individual questions did not amount to any
considerable amount of time in this course.
Figure 5-5 NVivo screen capture for Lecture Activity coding (Lecture 1, Stream 1, 2011). Time period of coding section (bottom), matches audio excerpt (top).
Figure 5-5, a screen capture of the coding in NVivo, shows an example of what the
coding looked like. The coding occurred with respect to time periods measured in
min:sec:00 format, although this precision was not necessary and fractions of sections
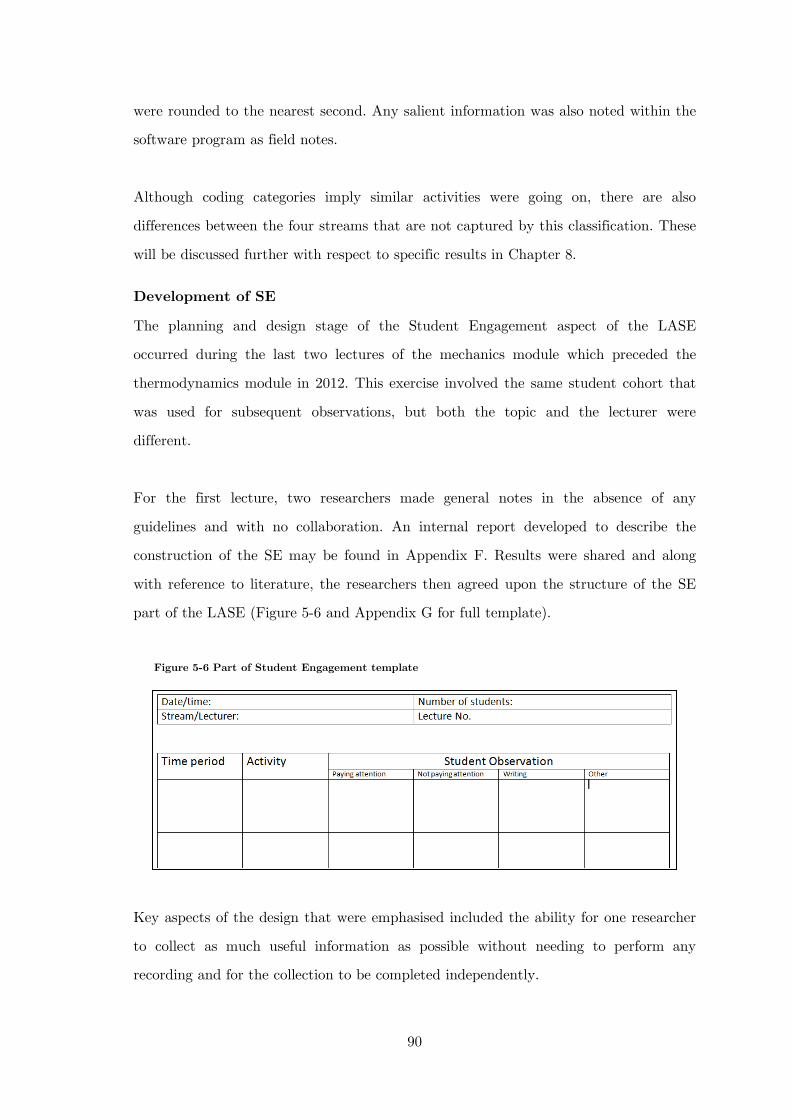
90
were rounded to the nearest second. Any salient information was also noted within the
software program as field notes.
Although coding categories imply similar activities were going on, there are also
differences between the four streams that are not captured by this classification. These
will be discussed further with respect to specific results in Chapter 8.
Development of SE
The planning and design stage of the Student Engagement aspect of the LASE
occurred during the last two lectures of the mechanics module which preceded the
thermodynamics module in 2012. This exercise involved the same student cohort that
was used for subsequent observations, but both the topic and the lecturer were
different.
For the first lecture, two researchers made general notes in the absence of any
guidelines and with no collaboration. An internal report developed to describe the
construction of the SE may be found in Appendix F. Results were shared and along
with reference to literature, the researchers then agreed upon the structure of the SE
part of the LASE (Figure 5-6 and Appendix G for full template).
Figure 5-6 Part of Student Engagement template
Key aspects of the design that were emphasised included the ability for one researcher
to collect as much useful information as possible without needing to perform any
recording and for the collection to be completed independently.
91
The agreed method involved the following instructions:
Find a covert place at the back of the lecture theatre
Select ten students on the basis of position (and peer group diversity) as
well as visibility
Allocate students with Unique ID (Numbering one through ten,
anticlockwise around lecture theatre)
At periods of 10 minutes (or when distinct and notable activities are
taking place, i.e., the ILDs), starting at number 1, fill in the LASE form,
starting with lecture activity taking place and then recording what
individual students were doing during the observation period.
Field notes should be made at the beginning and throughout the lecture
to record salient events.
Coder reliability was confirmed during the second lecture. However, the specific
approach was designed to limit subjectivity and therefore be predominantly carried out
by only one researcher. Elaboration and justifications for certain characteristics of the
SE are provided below. Information and images of the two lecture theatres used for the
thermodynamics module and the SE may be found in Figure 5-7.
Limited number of students observed: Only 10 students (between
10-20% of lecture attendance) were directly observed. Due to the SE
being intended for common usage, the unfeasibility of attaining ethics for
recording lectures meant that this was the most appropriate viable
alternative. Supplementary notes were taken when this observation was
not satisfactorily representative of the lecture room at this time.
Selected lectures only: Each different ‘type’ of lecture was observed.
Not all lectures were observed but care was taken to observe salient
lectures: the first, the lectures with and without ILDs and Exercises, and
a lecture with known high levels of Demonstrations.

92
Individual tracing: Students were allocated a unique ID within each
lecture to ascertain instances of repeated behaviour. Students were not
tracked across lectures.
Attempts at representation: Students from all physical locations
were selected and students which were ‘interacting’ were avoided such
that behaviours were not linked.
Irregular time intervals: At times, it was necessary to alter the
regular time intervals of observation to capture behaviours during a
distinct type of lecture activity. For example, the in-class
demonstrations.
Alternative ILD sheet: because of the nature of this type of ILD
instruction. A slightly different sheet was used for ILD lectures
(Appendix H).
Specificity: Further specificity in coding was not sought due to the
objectives of this project. The resources needed to substantiate subjective
stances such as ‘did the teacher allow for discussion’, was outside the
scope of this particular project, although it would be very useful if these
or other aspects were added onto this prototype version.
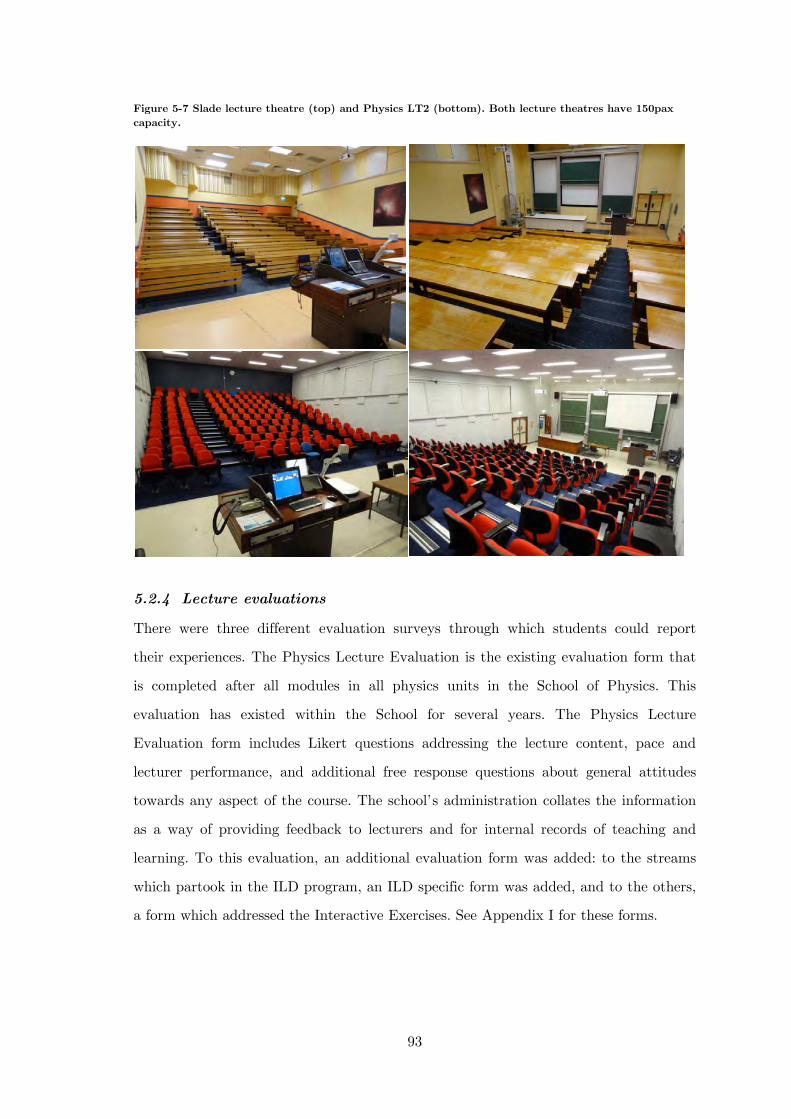
93
Figure 5-7 Slade lecture theatre (top) and Physics LT2 (bottom). Both lecture theatres have 150pax capacity.
5.2.4 Lecture evaluations
There were three different evaluation surveys through which students could report
their experiences. The Physics Lecture Evaluation is the existing evaluation form that
is completed after all modules in all physics units in the School of Physics. This
evaluation has existed within the School for several years. The Physics Lecture
Evaluation form includes Likert questions addressing the lecture content, pace and
lecturer performance, and additional free response questions about general attitudes
towards any aspect of the course. The school’s administration collates the information
as a way of providing feedback to lecturers and for internal records of teaching and
learning. To this evaluation, an additional evaluation form was added: to the streams
which partook in the ILD program, an ILD specific form was added, and to the others,
a form which addressed the Interactive Exercises. See Appendix I for these forms.
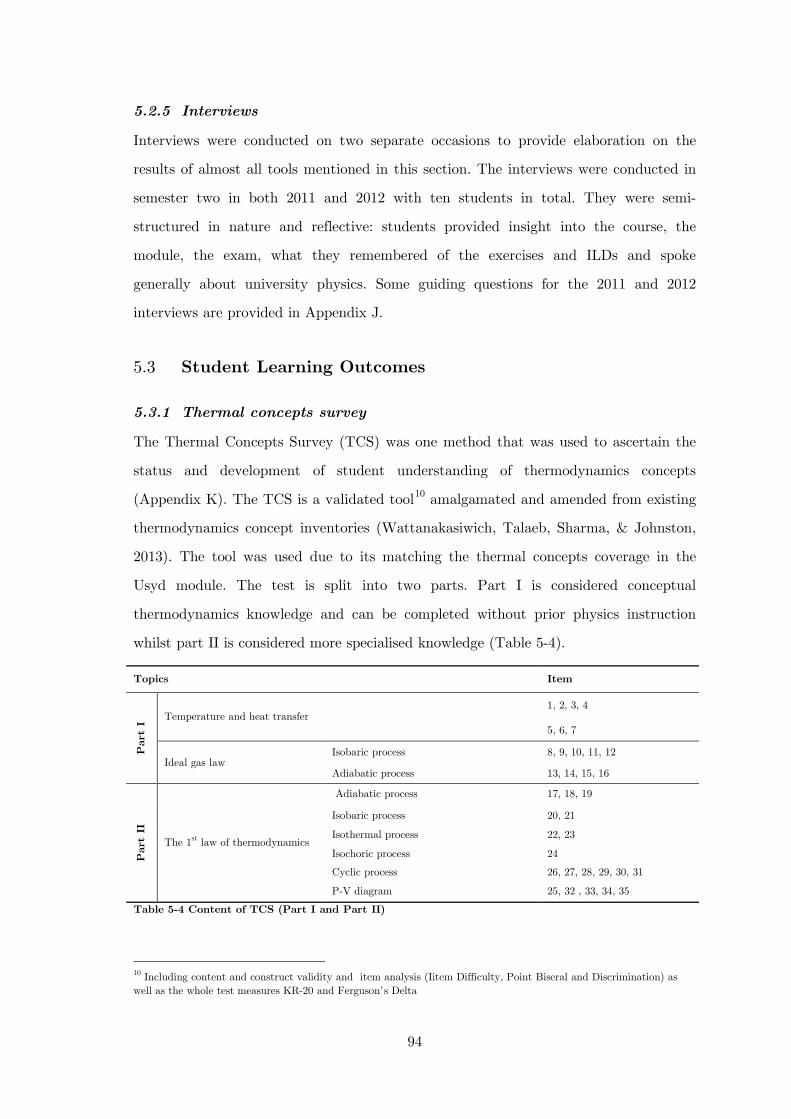
94
5.2.5 Interviews
Interviews were conducted on two separate occasions to provide elaboration on the
results of almost all tools mentioned in this section. The interviews were conducted in
semester two in both 2011 and 2012 with ten students in total. They were semi-
structured in nature and reflective: students provided insight into the course, the
module, the exam, what they remembered of the exercises and ILDs and spoke
generally about university physics. Some guiding questions for the 2011 and 2012
interviews are provided in Appendix J.
5.3 Student Learning Outcomes
5.3.1 Thermal concepts survey
The Thermal Concepts Survey (TCS) was one method that was used to ascertain the
status and development of student understanding of thermodynamics concepts
(Appendix K). The TCS is a validated tool10
Table 5-4
amalgamated and amended from existing
thermodynamics concept inventories (Wattanakasiwich, Talaeb, Sharma, & Johnston,
2013). The tool was used due to its matching the thermal concepts coverage in the
Usyd module. The test is split into two parts. Part I is considered conceptual
thermodynamics knowledge and can be completed without prior physics instruction
whilst part II is considered more specialised knowledge ( ).
Table 5-4 Content of TCS (Part I and Part II)
10 Including content and construct validity and item analysis (Iitem Difficulty, Point Biseral and Discrimination) as well as the whole test measures KR-20 and Ferguson’s Delta
Topics Item
Par
t I Temperature and heat transfer
1, 2, 3, 4
5, 6, 7
Ideal gas law Isobaric process 8, 9, 10, 11, 12
Adiabatic process 13, 14, 15, 16
Par
t II
The 1st
Adiabatic process
law of thermodynamics
17, 18, 19
Isobaric process 20, 21
Isothermal process 22, 23
Isochoric process 24
Cyclic process 26, 27, 28, 29, 30, 31
P-V diagram 25, 32 , 33, 34, 35
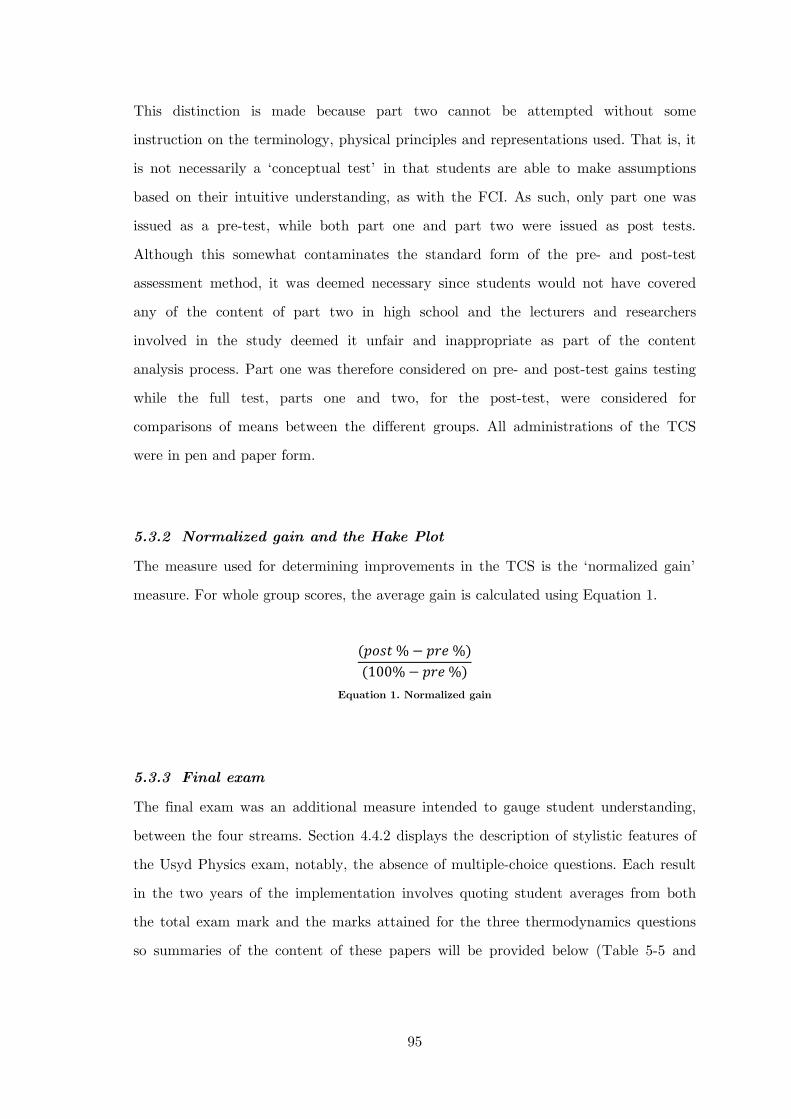
95
This distinction is made because part two cannot be attempted without some
instruction on the terminology, physical principles and representations used. That is, it
is not necessarily a ‘conceptual test’ in that students are able to make assumptions
based on their intuitive understanding, as with the FCI. As such, only part one was
issued as a pre-test, while both part one and part two were issued as post tests.
Although this somewhat contaminates the standard form of the pre- and post-test
assessment method, it was deemed necessary since students would not have covered
any of the content of part two in high school and the lecturers and researchers
involved in the study deemed it unfair and inappropriate as part of the content
analysis process. Part one was therefore considered on pre- and post-test gains testing
while the full test, parts one and two, for the post-test, were considered for
comparisons of means between the different groups. All administrations of the TCS
were in pen and paper form.
5.3.2 Normalized gain and the Hake Plot
The measure used for determining improvements in the TCS is the ‘normalized gain’
measure. For whole group scores, the average gain is calculated using Equation 1.
(𝑝𝑜𝑠𝑡 % − 𝑝𝑟𝑒 %)(100%− 𝑝𝑟𝑒 %)
Equation 1. Normalized gain
5.3.3 Final exam
The final exam was an additional measure intended to gauge student understanding,
between the four streams. Section 4.4.2 displays the description of stylistic features of
the Usyd Physics exam, notably, the absence of multiple-choice questions. Each result
in the two years of the implementation involves quoting student averages from both
the total exam mark and the marks attained for the three thermodynamics questions
so summaries of the content of these papers will be provided below (Table 5-5 and
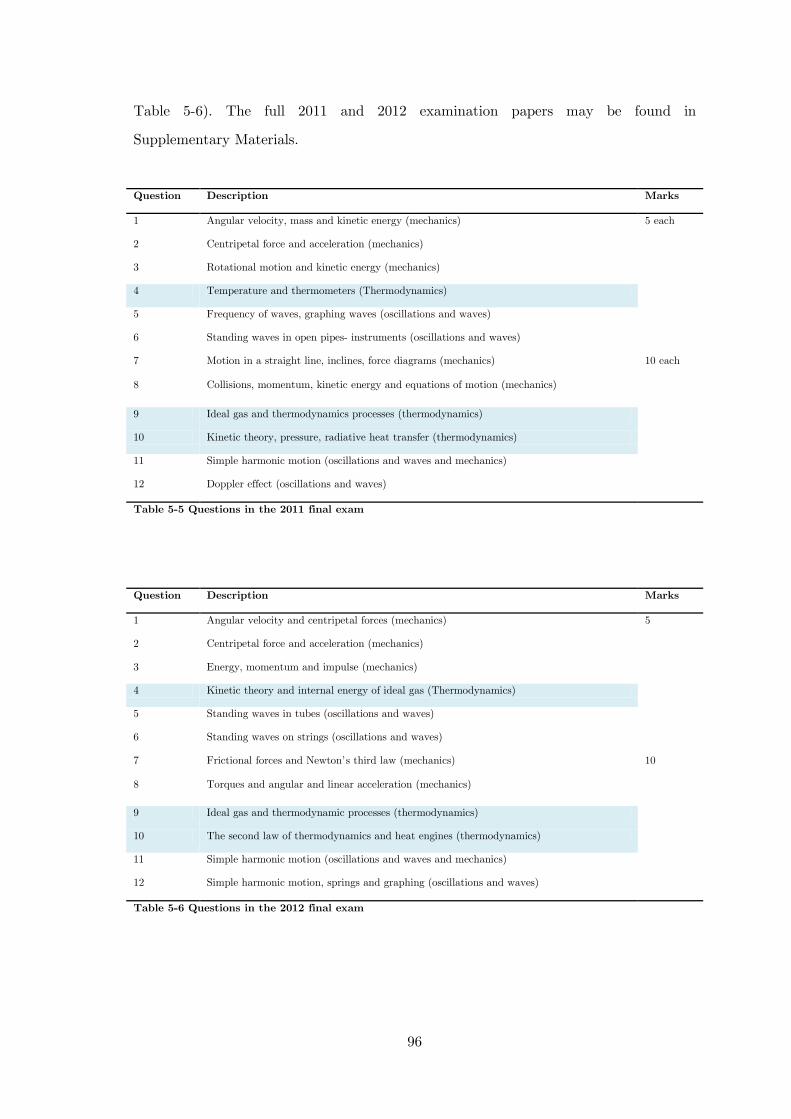
96
Table 5-6). The full 2011 and 2012 examination papers may be found in
Supplementary Materials.
Question Description Marks
1 Angular velocity, mass and kinetic energy (mechanics) 5 each
2 Centripetal force and acceleration (mechanics)
3 Rotational motion and kinetic energy (mechanics)
4 Temperature and thermometers (Thermodynamics)
5 Frequency of waves, graphing waves (oscillations and waves)
6 Standing waves in open pipes- instruments (oscillations and waves)
7 Motion in a straight line, inclines, force diagrams (mechanics) 10 each
8 Collisions, momentum, kinetic energy and equations of motion (mechanics)
9 Ideal gas and thermodynamics processes (thermodynamics)
10 Kinetic theory, pressure, radiative heat transfer (thermodynamics)
11 Simple harmonic motion (oscillations and waves and mechanics)
12 Doppler effect (oscillations and waves)
Table 5-5 Questions in the 2011 final exam
Question Description Marks
1 Angular velocity and centripetal forces (mechanics) 5
2 Centripetal force and acceleration (mechanics)
3 Energy, momentum and impulse (mechanics)
4 Kinetic theory and internal energy of ideal gas (Thermodynamics)
5 Standing waves in tubes (oscillations and waves)
6 Standing waves on strings (oscillations and waves)
7 Frictional forces and Newton’s third law (mechanics) 10
8 Torques and angular and linear acceleration (mechanics)
9 Ideal gas and thermodynamic processes (thermodynamics)
10 The second law of thermodynamics and heat engines (thermodynamics)
11 Simple harmonic motion (oscillations and waves and mechanics)
12 Simple harmonic motion, springs and graphing (oscillations and waves)
Table 5-6 Questions in the 2012 final exam

97
6 Introduction to Part One: Active Learning
Experiment
This part of the thesis will report on the implementation of an Active Learning
program in first year Physics at The University of Sydney.
Study One, the first version of the experiment, took place in Semester one, April 2011,
with first year Physics students in the Regular course, which consisted of four streams.
One of the lecturers, Staff-1 was a pedagogical researcher. The other two (Staff-2 and
Staff-3) volunteered to take part out of goodwill. Staff-2 was assisted by Staff-1 in the
implementation of the ILDs but only in the experiment lectures.
Study Two, the second iteration of the experiment, took place in semester one, April
(and May) 2012, with first year Physics students in the Regular course, which again
consisted of the four streams. The same three staff were involved in this iteration,
although several aspects of the implementation were improved, including the sample
allocations and pre- and post- test matching.

99
7 Study One 2011
7.1 Aim
There were several aims of the experiment, all of which related to the main research
question of characterising the first year thermodynamics lectures with respect to
learning outcomes, student attitudes and experiences during an Active Learning
implementation. The individual aims are made explicit below:
1. To determine the overall learning gains of students during the
thermodynamics module as measured by the pre- and post- TCS
part I.
2. To determine whether there was a difference in learning outcomes
as measured by the TCS (part I and II), the thermodynamics
questions on the final exam, and the overall final exam score.
3. To examine student attitudes towards the two methods of IE
through the student evaluation surveys and interviews.
4. To characterise the lectures with respect to the interactivity
present in the lecture streams throughout the thermodynamics
module as measured by the LA part of the LASE tool.
7.2 Sample- allocation of streams
Students enrolling in the Regular course in first year Physics are fairly similar in terms
of their physics background and performance in high school. Therefore, since
characterisation of the four streams was not possible prior to allocation due to delays
in the retrieval/permission of demographic information, it was hoped that the
administrative allocation of students to the four streams would be akin to random
selection. The measures used to ascertain homogeneity of samples were the following:
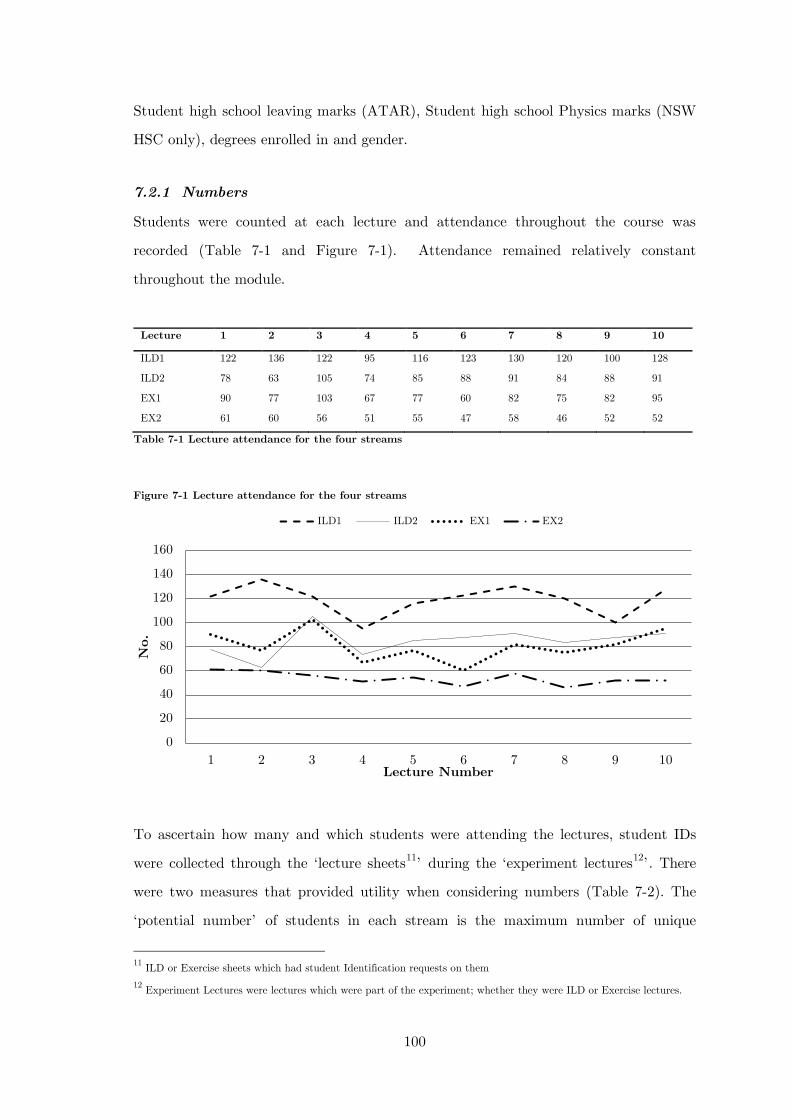
100
Student high school leaving marks (ATAR), Student high school Physics marks (NSW
HSC only), degrees enrolled in and gender.
7.2.1 Numbers
Students were counted at each lecture and attendance throughout the course was
recorded (Table 7-1 and Figure 7-1). Attendance remained relatively constant
throughout the module.
Lecture 1 2 3 4 5 6 7 8 9 10
ILD1 122 136 122 95 116 123 130 120 100 128
ILD2 78 63 105 74 85 88 91 84 88 91
EX1 90 77 103 67 77 60 82 75 82 95
EX2 61 60 56 51 55 47 58 46 52 52
Table 7-1 Lecture attendance for the four streams
Figure 7-1 Lecture attendance for the four streams
To ascertain how many and which students were attending the lectures, student IDs
were collected through the ‘lecture sheets11’ during the ‘experiment lectures12
Table 7-2
’. There
were two measures that provided utility when considering numbers ( ). The
‘potential number’ of students in each stream is the maximum number of unique
11 ILD or Exercise sheets which had student Identification requests on them 12 Experiment Lectures were lectures which were part of the experiment; whether they were ILD or Exercise lectures.
0
20
40
60
80
100
120
140
160
1 2 3 4 5 6 7 8 9 10
No.
Lecture Number
ILD1 ILD2 EX1 EX2
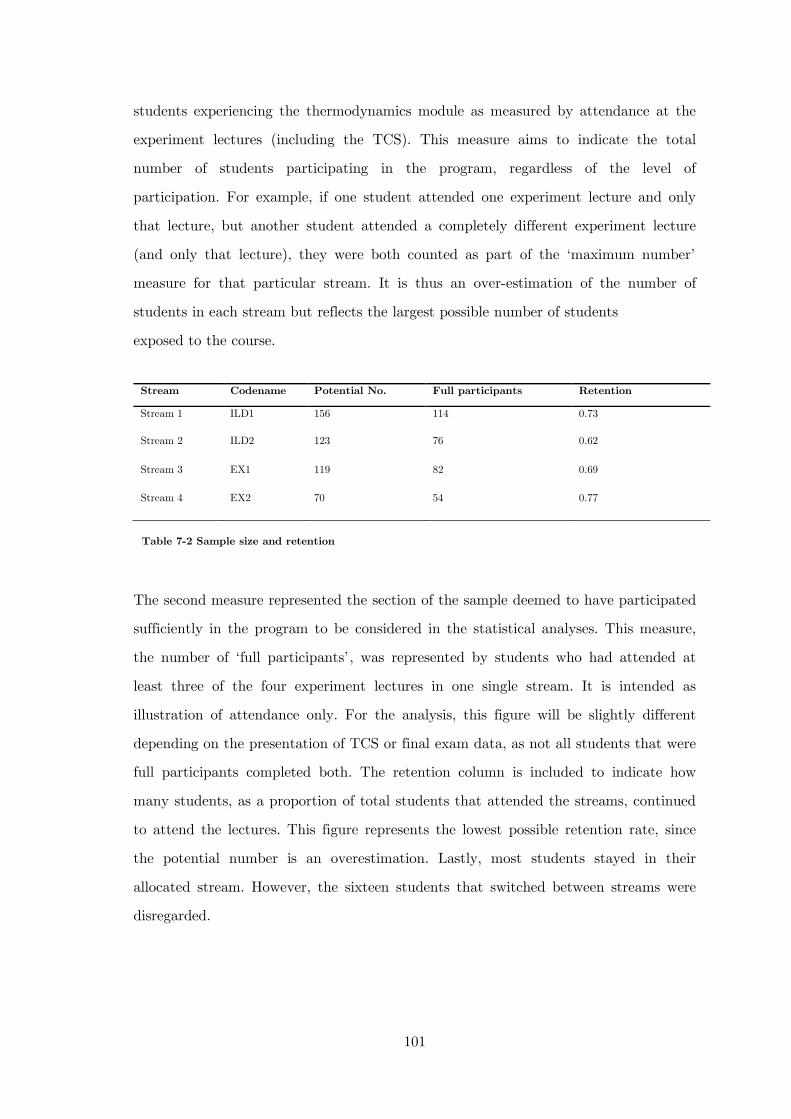
101
students experiencing the thermodynamics module as measured by attendance at the
experiment lectures (including the TCS). This measure aims to indicate the total
number of students participating in the program, regardless of the level of
participation. For example, if one student attended one experiment lecture and only
that lecture, but another student attended a completely different experiment lecture
(and only that lecture), they were both counted as part of the ‘maximum number’
measure for that particular stream. It is thus an over-estimation of the number of
students in each stream but reflects the largest possible number of students
exposed to the course.
The second measure represented the section of the sample deemed to have participated
sufficiently in the program to be considered in the statistical analyses. This measure,
the number of ‘full participants’, was represented by students who had attended at
least three of the four experiment lectures in one single stream. It is intended as
illustration of attendance only. For the analysis, this figure will be slightly different
depending on the presentation of TCS or final exam data, as not all students that were
full participants completed both. The retention column is included to indicate how
many students, as a proportion of total students that attended the streams, continued
to attend the lectures. This figure represents the lowest possible retention rate, since
the potential number is an overestimation. Lastly, most students stayed in their
allocated stream. However, the sixteen students that switched between streams were
disregarded.
Stream Codename Potential No. Full participants Retention
Stream 1 ILD1 156 114 0.73
Stream 2 ILD2 123 76 0.62
Stream 3 EX1 119 82 0.69
Stream 4 EX2 70 54 0.77
Table 7-2 Sample size and retention
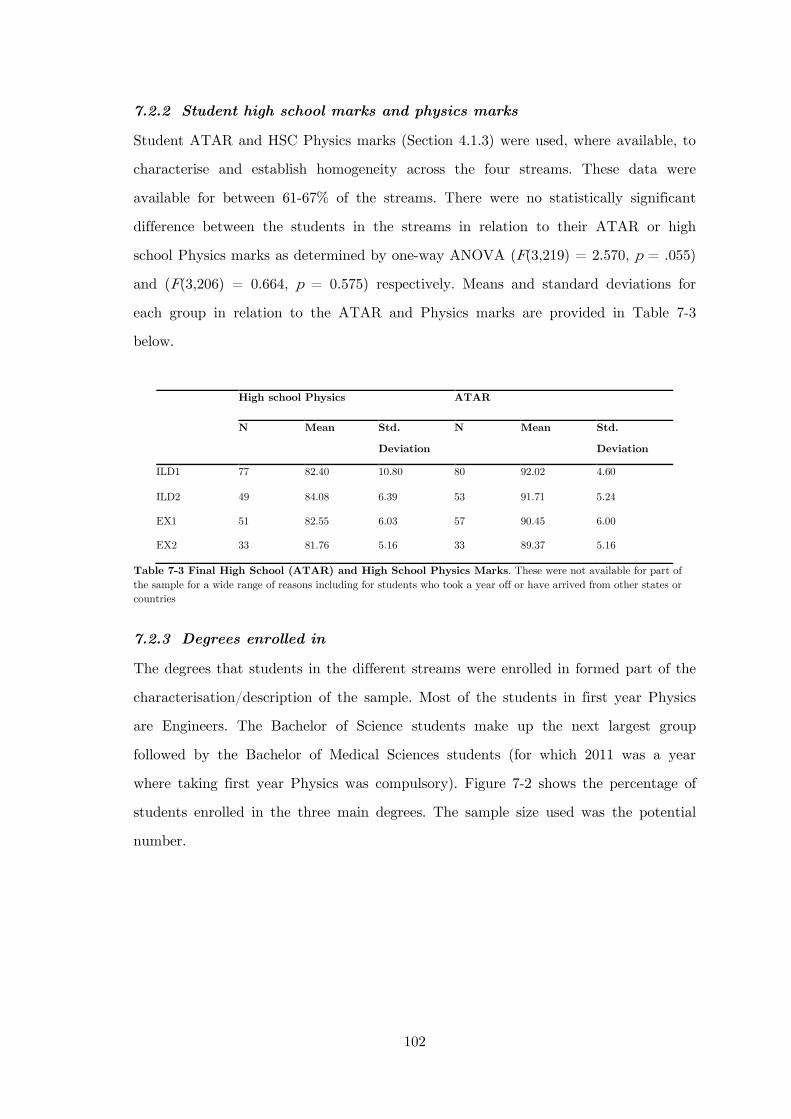
102
7.2.2 Student high school marks and physics marks
Student ATAR and HSC Physics marks (Section 4.1.3) were used, where available, to
characterise and establish homogeneity across the four streams. These data were
available for between 61-67% of the streams. There were no statistically significant
difference between the students in the streams in relation to their ATAR or high
school Physics marks as determined by one-way ANOVA (F(3,219) = 2.570, p = .055)
and (F(3,206) = 0.664, p = 0.575) respectively. Means and standard deviations for
each group in relation to the ATAR and Physics marks are provided in Table 7-3
below.
High school Physics ATAR
N Mean Std.
Deviation
N Mean Std.
Deviation
ILD1 77 82.40 10.80 80 92.02 4.60
ILD2 49 84.08 6.39 53 91.71 5.24
EX1 51 82.55 6.03 57 90.45 6.00
EX2 33 81.76 5.16 33 89.37 5.16
Table 7-3 Final High School (ATAR) and High School Physics Marks. These were not available for part of the sample for a wide range of reasons including for students who took a year off or have arrived from other states or countries
7.2.3 Degrees enrolled in
The degrees that students in the different streams were enrolled in formed part of the
characterisation/description of the sample. Most of the students in first year Physics
are Engineers. The Bachelor of Science students make up the next largest group
followed by the Bachelor of Medical Sciences students (for which 2011 was a year
where taking first year Physics was compulsory). Figure 7-2 shows the percentage of
students enrolled in the three main degrees. The sample size used was the potential
number.
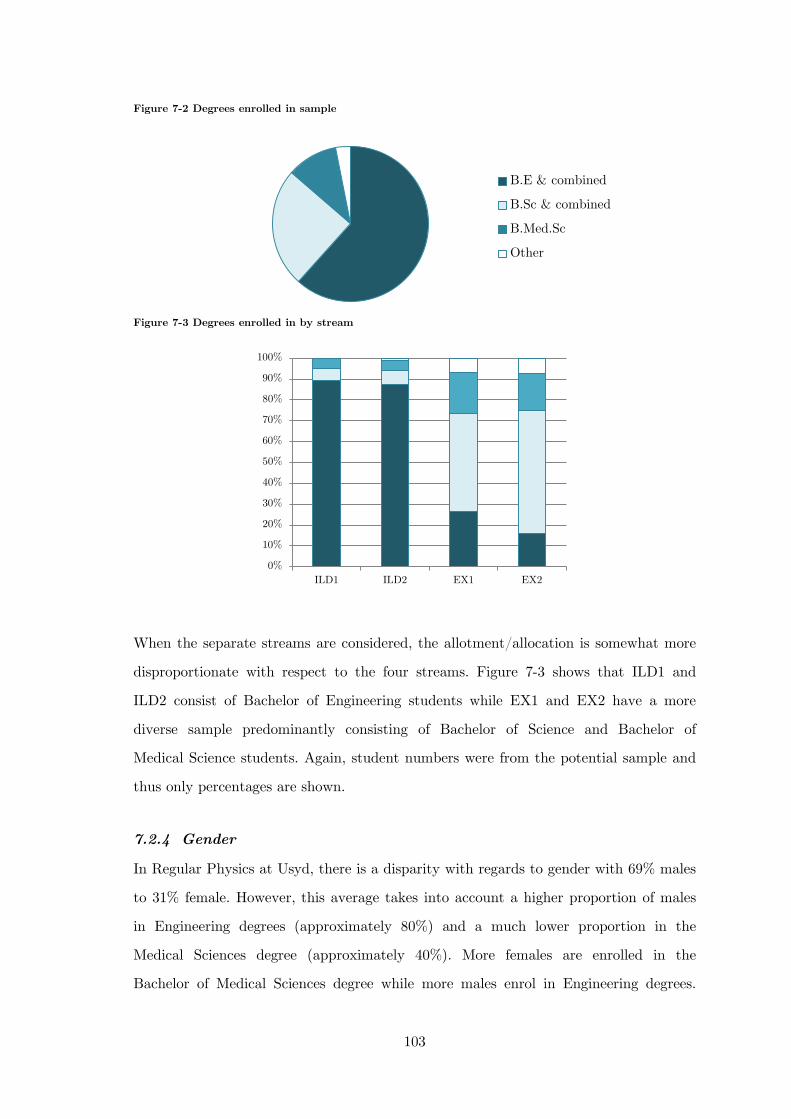
103
Figure 7-2 Degrees enrolled in sample
Figure 7-3 Degrees enrolled in by stream
When the separate streams are considered, the allotment/allocation is somewhat more
disproportionate with respect to the four streams. Figure 7-3 shows that ILD1 and
ILD2 consist of Bachelor of Engineering students while EX1 and EX2 have a more
diverse sample predominantly consisting of Bachelor of Science and Bachelor of
Medical Science students. Again, student numbers were from the potential sample and
thus only percentages are shown.
7.2.4 Gender
In Regular Physics at Usyd, there is a disparity with regards to gender with 69% males
to 31% female. However, this average takes into account a higher proportion of males
in Engineering degrees (approximately 80%) and a much lower proportion in the
Medical Sciences degree (approximately 40%). More females are enrolled in the
Bachelor of Medical Sciences degree while more males enrol in Engineering degrees.
0%
10%
20%
30%
40%
50%
60%
70%
80%
90%
100%
ILD1 ILD2 EX1 EX2
B.E & combined
B.Sc & combined
B.Med.Sc
Other
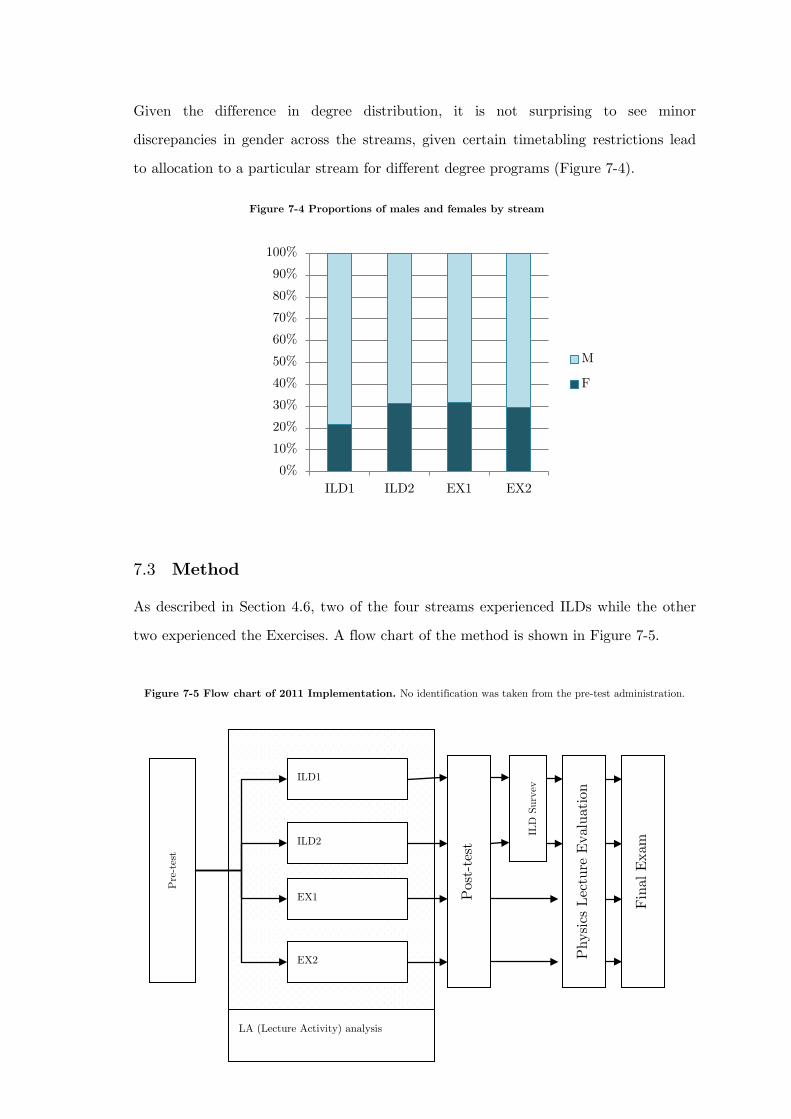
104
Given the difference in degree distribution, it is not surprising to see minor
discrepancies in gender across the streams, given certain timetabling restrictions lead
to allocation to a particular stream for different degree programs (Figure 7-4).
7.3 Method
As described in Section 4.6, two of the four streams experienced ILDs while the other
two experienced the Exercises. A flow chart of the method is shown in Figure 7-5.
0%
10%
20%
30%
40%
50%
60%
70%
80%
90%
100%
ILD1 ILD2 EX1 EX2
M
F
Figure 7-4 Proportions of males and females by stream
Pre
-tes
t
ILD1
ILD2
EX1
EX2
LA (Lecture Activity) analysis
Phy
sics
Lec
ture
Eva
luat
ion
Fin
al E
xam
ILD
Sur
vey
Pos
t-te
st
Figure 7-5 Flow chart of 2011 Implementation. No identification was taken from the pre-test administration.
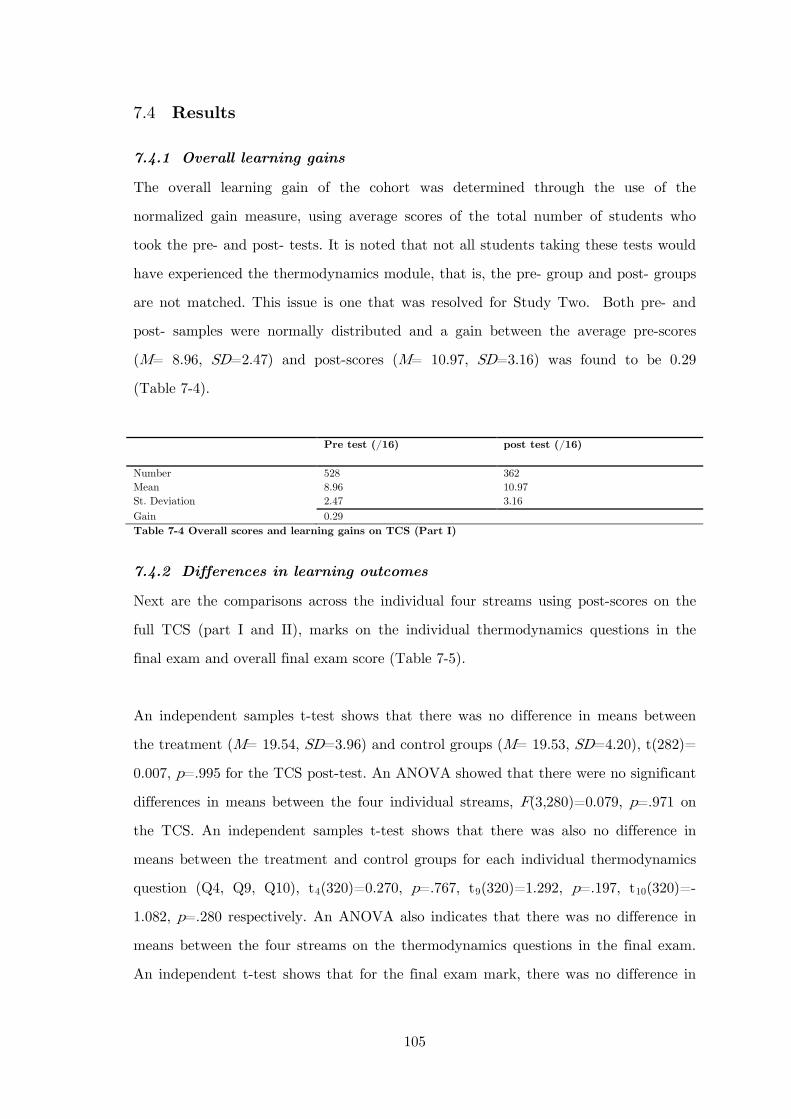
105
7.4 Results
7.4.1 Overall learning gains
The overall learning gain of the cohort was determined through the use of the
normalized gain measure, using average scores of the total number of students who
took the pre- and post- tests. It is noted that not all students taking these tests would
have experienced the thermodynamics module, that is, the pre- group and post- groups
are not matched. This issue is one that was resolved for Study Two. Both pre- and
post- samples were normally distributed and a gain between the average pre-scores
(M= 8.96, SD=2.47) and post-scores (M= 10.97, SD=3.16) was found to be 0.29
(Table 7-4).
Pre test (/16) post test (/16)
Number 528 362 Mean 8.96 10.97 St. Deviation 2.47 3.16 Gain 0.29 Table 7-4 Overall scores and learning gains on TCS (Part I)
7.4.2 Differences in learning outcomes
Next are the comparisons across the individual four streams using post-scores on the
full TCS (part I and II), marks on the individual thermodynamics questions in the
final exam and overall final exam score (Table 7-5).
An independent samples t-test shows that there was no difference in means between
the treatment (M= 19.54, SD=3.96) and control groups (M= 19.53, SD=4.20), t(282)=
0.007, p=.995 for the TCS post-test. An ANOVA showed that there were no significant
differences in means between the four individual streams, F(3,280)=0.079, p=.971 on
the TCS. An independent samples t-test shows that there was also no difference in
means between the treatment and control groups for each individual thermodynamics
question (Q4, Q9, Q10), t4(320)=0.270, p=.767, t9(320)=1.292, p=.197, t10(320)=-
1.082, p=.280 respectively. An ANOVA also indicates that there was no difference in
means between the four streams on the thermodynamics questions in the final exam.
An independent t-test shows that for the final exam mark, there was no difference in
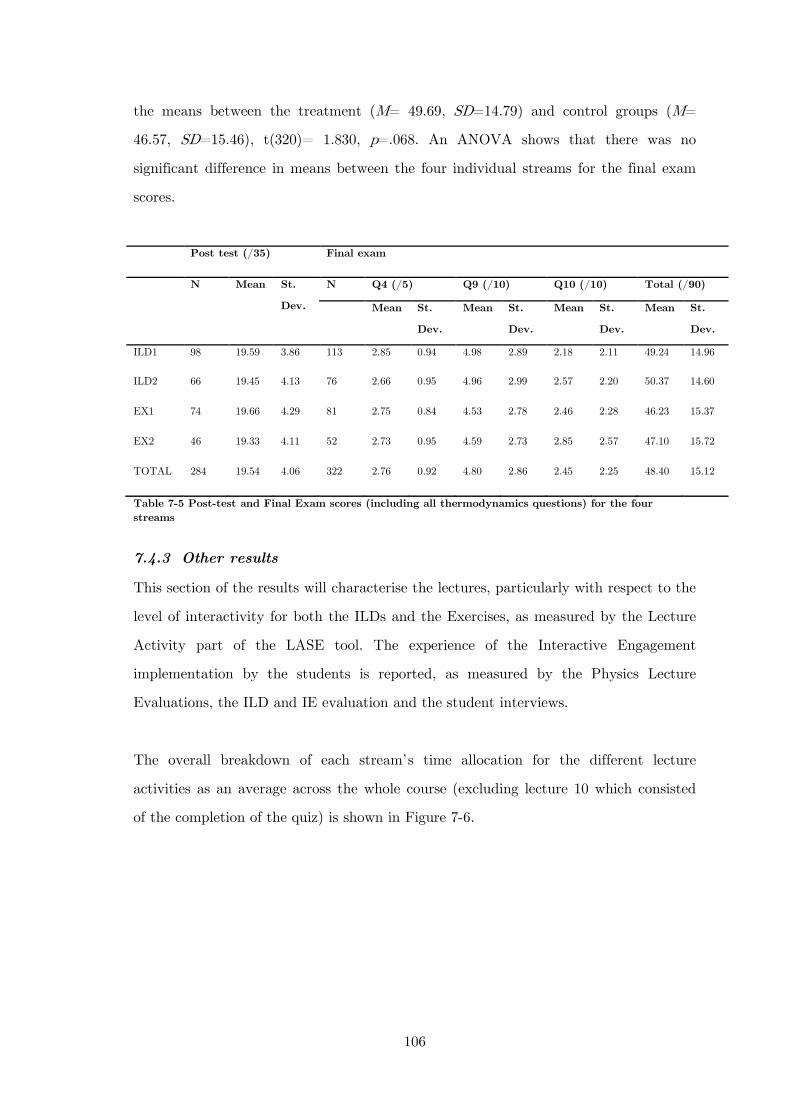
106
the means between the treatment (M= 49.69, SD=14.79) and control groups (M=
46.57, SD=15.46), t(320)= 1.830, p=.068. An ANOVA shows that there was no
significant difference in means between the four individual streams for the final exam
scores.
Post test (/35) Final exam
N Mean St.
Dev.
N Q4 (/5) Q9 (/10) Q10 (/10) Total (/90)
Mean St.
Dev.
Mean St.
Dev.
Mean St.
Dev.
Mean St.
Dev.
ILD1 98 19.59 3.86 113 2.85 0.94 4.98 2.89 2.18 2.11 49.24 14.96
ILD2 66 19.45 4.13 76 2.66 0.95 4.96 2.99 2.57 2.20 50.37 14.60
EX1 74 19.66 4.29 81 2.75 0.84 4.53 2.78 2.46 2.28 46.23 15.37
EX2 46 19.33 4.11 52 2.73 0.95 4.59 2.73 2.85 2.57 47.10 15.72
TOTAL 284 19.54 4.06 322 2.76 0.92 4.80 2.86 2.45 2.25 48.40 15.12
Table 7-5 Post-test and Final Exam scores (including all thermodynamics questions) for the four streams
7.4.3 Other results
This section of the results will characterise the lectures, particularly with respect to the
level of interactivity for both the ILDs and the Exercises, as measured by the Lecture
Activity part of the LASE tool. The experience of the Interactive Engagement
implementation by the students is reported, as measured by the Physics Lecture
Evaluations, the ILD and IE evaluation and the student interviews.
The overall breakdown of each stream’s time allocation for the different lecture
activities as an average across the whole course (excluding lecture 10 which consisted
of the completion of the quiz) is shown in Figure 7-6.
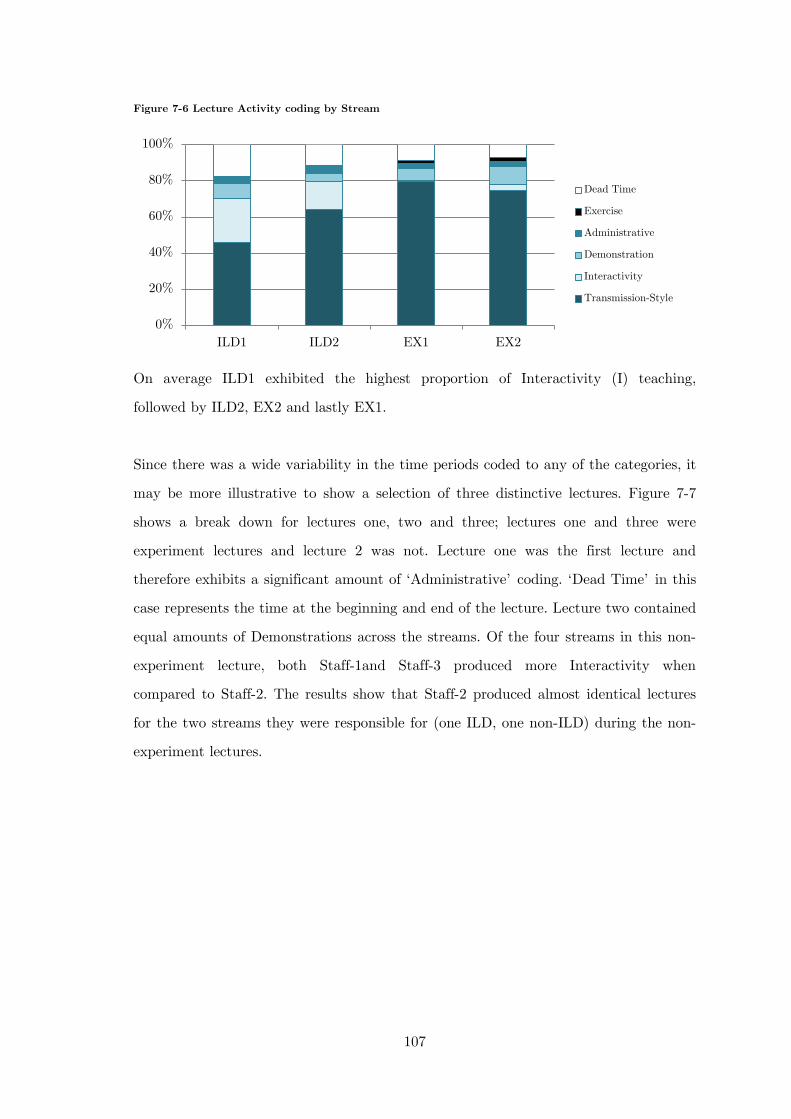
107
Figure 7-6 Lecture Activity coding by Stream
On average ILD1 exhibited the highest proportion of Interactivity (I) teaching,
followed by ILD2, EX2 and lastly EX1.
Since there was a wide variability in the time periods coded to any of the categories, it
may be more illustrative to show a selection of three distinctive lectures. Figure 7-7
shows a break down for lectures one, two and three; lectures one and three were
experiment lectures and lecture 2 was not. Lecture one was the first lecture and
therefore exhibits a significant amount of ‘Administrative’ coding. ‘Dead Time’ in this
case represents the time at the beginning and end of the lecture. Lecture two contained
equal amounts of Demonstrations across the streams. Of the four streams in this non-
experiment lecture, both Staff-1and Staff-3 produced more Interactivity when
compared to Staff-2. The results show that Staff-2 produced almost identical lectures
for the two streams they were responsible for (one ILD, one non-ILD) during the non-
experiment lectures.
0%
20%
40%
60%
80%
100%
ILD1 ILD2 EX1 EX2
Dead Time
Exercise
Administrative
Demonstration
Interactivity
Transmission-Style
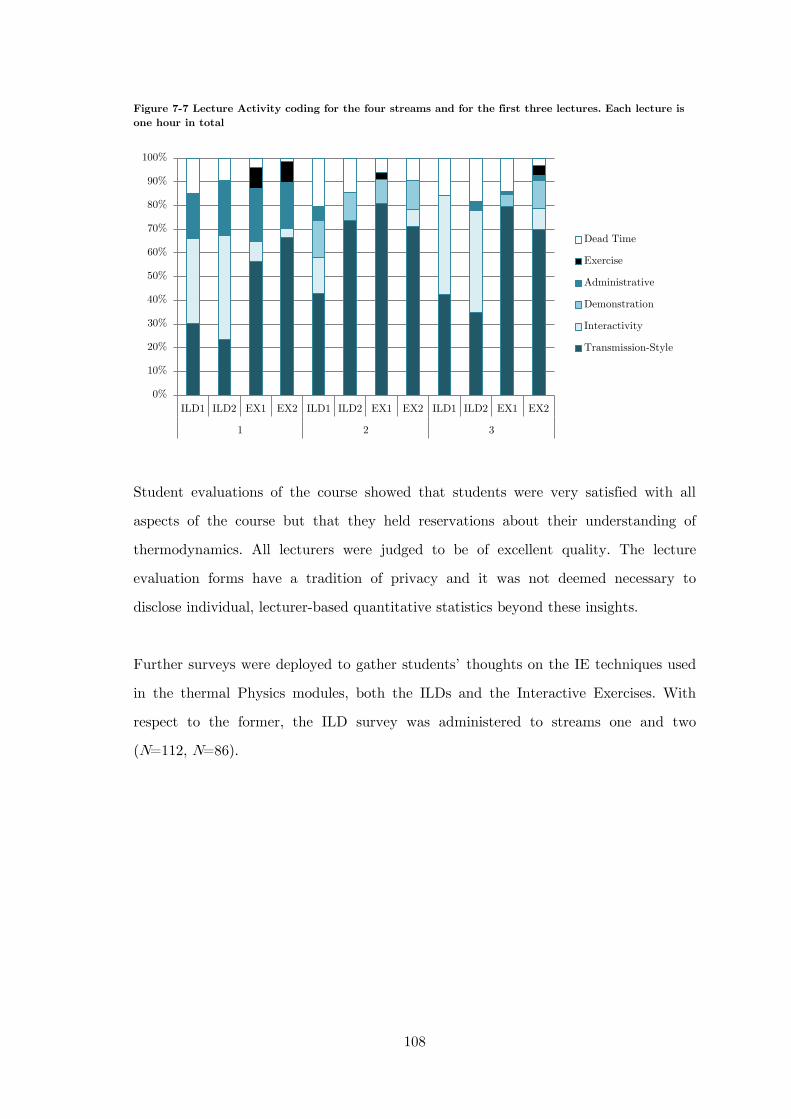
108
Figure 7-7 Lecture Activity coding for the four streams and for the first three lectures. Each lecture is one hour in total
Student evaluations of the course showed that students were very satisfied with all
aspects of the course but that they held reservations about their understanding of
thermodynamics. All lecturers were judged to be of excellent quality. The lecture
evaluation forms have a tradition of privacy and it was not deemed necessary to
disclose individual, lecturer-based quantitative statistics beyond these insights.
Further surveys were deployed to gather students’ thoughts on the IE techniques used
in the thermal Physics modules, both the ILDs and the Interactive Exercises. With
respect to the former, the ILD survey was administered to streams one and two
(N=112, N=86).
0%
10%
20%
30%
40%
50%
60%
70%
80%
90%
100%
ILD1 ILD2 EX1 EX2 ILD1 ILD2 EX1 EX2 ILD1 ILD2 EX1 EX2
1 2 3
Dead Time
Exercise
Administrative
Demonstration
Interactivity
Transmission-Style
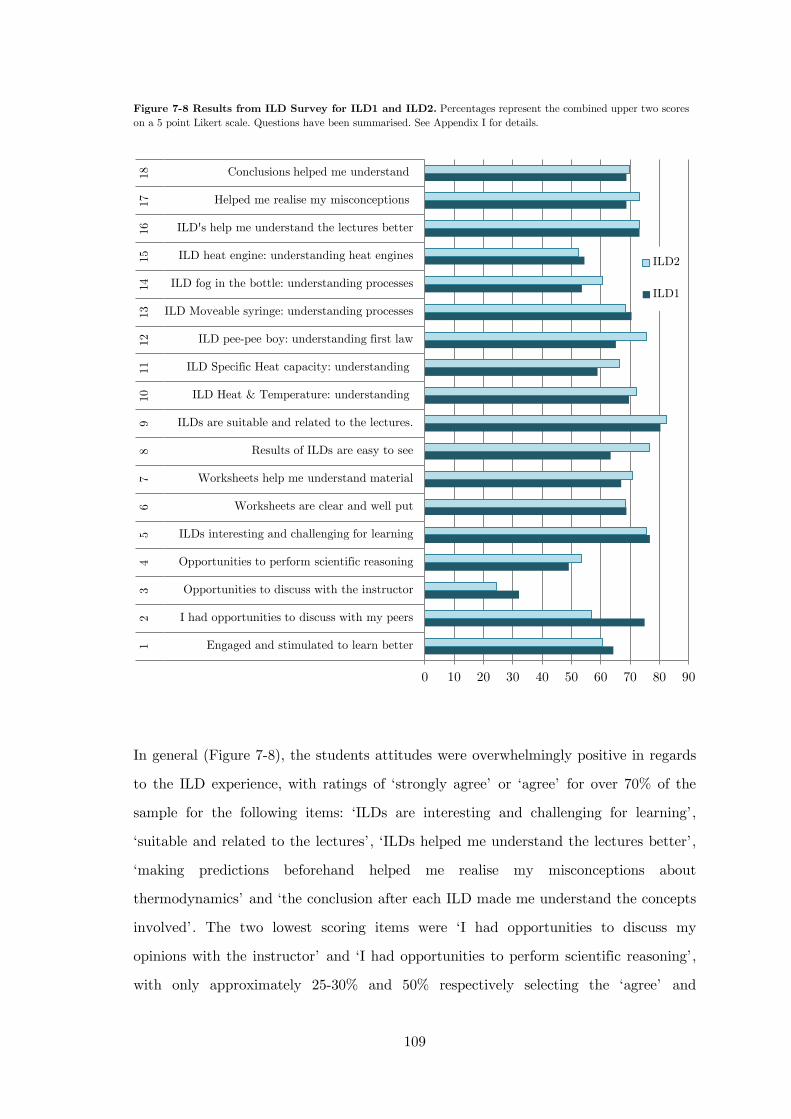
109
Figure 7-8 Results from ILD Survey for ILD1 and ILD2. Percentages represent the combined upper two scores on a 5 point Likert scale. Questions have been summarised. See Appendix I for details.
In general (Figure 7-8), the students attitudes were overwhelmingly positive in regards
to the ILD experience, with ratings of ‘strongly agree’ or ‘agree’ for over 70% of the
sample for the following items: ‘ILDs are interesting and challenging for learning’,
‘suitable and related to the lectures’, ‘ILDs helped me understand the lectures better’,
‘making predictions beforehand helped me realise my misconceptions about
thermodynamics’ and ‘the conclusion after each ILD made me understand the concepts
involved’. The two lowest scoring items were ‘I had opportunities to discuss my
opinions with the instructor’ and ‘I had opportunities to perform scientific reasoning’,
with only approximately 25-30% and 50% respectively selecting the ‘agree’ and
0 10 20 30 40 50 60 70 80 90
Engaged and stimulated to learn better
I had opportunities to discuss with my peers
Opportunities to discuss with the instructor
Opportunities to perform scientific reasoning
ILDs interesting and challenging for learning
Worksheets are clear and well put
Worksheets help me understand material
Results of ILDs are easy to see
ILDs are suitable and related to the lectures.
ILD Heat & Temperature: understanding
ILD Specific Heat capacity: understanding
ILD pee-pee boy: understanding first law
ILD Moveable syringe: understanding processes
ILD fog in the bottle: understanding processes
ILD heat engine: understanding heat engines
ILD's help me understand the lectures better
Helped me realise my misconceptions
Conclusions helped me understand
1 2
3 4
5 6
7 8
9 10
11
12
13
14
15
16
17
18
ILD2
ILD1
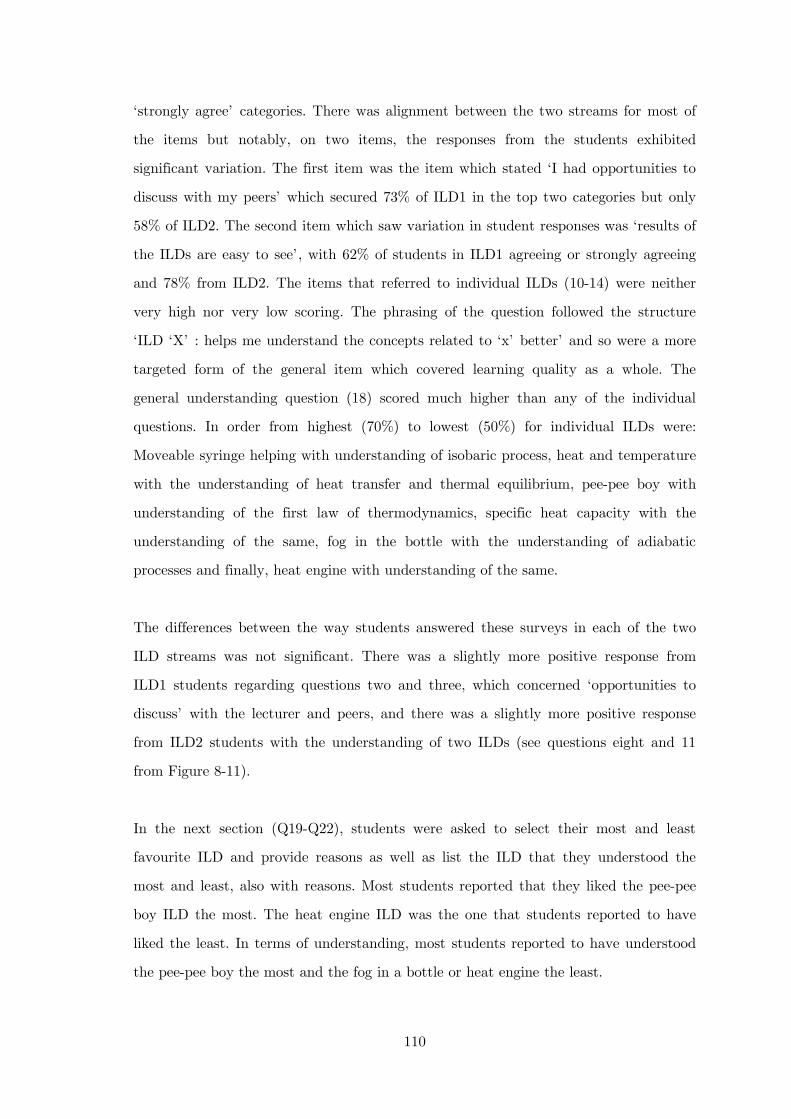
110
‘strongly agree’ categories. There was alignment between the two streams for most of
the items but notably, on two items, the responses from the students exhibited
significant variation. The first item was the item which stated ‘I had opportunities to
discuss with my peers’ which secured 73% of ILD1 in the top two categories but only
58% of ILD2. The second item which saw variation in student responses was ‘results of
the ILDs are easy to see’, with 62% of students in ILD1 agreeing or strongly agreeing
and 78% from ILD2. The items that referred to individual ILDs (10-14) were neither
very high nor very low scoring. The phrasing of the question followed the structure
‘ILD ‘X’ : helps me understand the concepts related to ‘x’ better’ and so were a more
targeted form of the general item which covered learning quality as a whole. The
general understanding question (18) scored much higher than any of the individual
questions. In order from highest (70%) to lowest (50%) for individual ILDs were:
Moveable syringe helping with understanding of isobaric process, heat and temperature
with the understanding of heat transfer and thermal equilibrium, pee-pee boy with
understanding of the first law of thermodynamics, specific heat capacity with the
understanding of the same, fog in the bottle with the understanding of adiabatic
processes and finally, heat engine with understanding of the same.
The differences between the way students answered these surveys in each of the two
ILD streams was not significant. There was a slightly more positive response from
ILD1 students regarding questions two and three, which concerned ‘opportunities to
discuss’ with the lecturer and peers, and there was a slightly more positive response
from ILD2 students with the understanding of two ILDs (see questions eight and 11
from Figure 8-11).
In the next section (Q19-Q22), students were asked to select their most and least
favourite ILD and provide reasons as well as list the ILD that they understood the
most and least, also with reasons. Most students reported that they liked the pee-pee
boy ILD the most. The heat engine ILD was the one that students reported to have
liked the least. In terms of understanding, most students reported to have understood
the pee-pee boy the most and the fog in a bottle or heat engine the least.
111
In their justifications of these selections, students responded by explaining that the
most easily understood demonstrations were preferred and the preferred
demonstrations were ‘fun’ or ‘interesting’. See comments below (the demonstration
students are referring to is in parentheses).
“interesting, clearly demonstrated principle” (for pee-pee boy)
“The thermodynamics concept was easy to understand and it was easy to
listen and watch because it was entertaining” (pee-pee boy)
“It was good to be able to see a temp change, it helped me understand”
(heat and temperature)
“Very well explained after attempting to hypothesize the reason. Made a
lot of sense about the explansion of the air and the resulting change of
pressure” (moveable syringe)
“ILD was paced well and demonstrations clearly related to topic. Also
cleared a lot of misconception”
“It was unexpected” (fog in a bottle)
“Still unsure how it works” (fog in a bottle)
“I have seen the similar experiment before” (heat and temperature)
Overall, comments about the ILDs were positive and strongly linked to students
understanding the concepts more fully, seeing a different perspective and tying in with
the objectives of the course.
In 2011, the Exercise Evaluation form was not yet constructed; however, the standard
Physics Lecture Evaluation form was used as a vehicle to garner attitudes towards the
112
Exercises through the inclusion of an additional single open ended question about the
exercises.
Please provide your opinion(s) about the Interactive Exercises you
completed throughout the course
For the EX4 stream, 18 of the 50 returned evaluation sheets contained comments for
the question related to the Exercises. Of these 18, 12 were positive or very positive
about the exercises and even though none were negative, six did not mention the
activities at all, either commenting on the fact they appreciated that they encouraged
lecture attendance or included positive comments about the lecturer. For the EX3
stream, out of the 80 evaluation sheets that were returned, 37 contained comments for
the question related to the exercises. 25 were positive, six did not comment directly
about the exercises and six were negative. Of those negative six, all but one (“not
really useful”) were negative only due to administrative issues. Examples are included
below to illustrate.
Examples of positive, negative and neutral comments:
“I think that they're a good incentive to analyse the content without
worry of the consequence.”
“it was a great experience to test myself about this topic. And since the
questions covered was about this real life examples, it was more
interesting to answer and read the feedback”
“Interesting and useful”
“Interactive Exercises was a great idea to keep up with the workload and
have some practical questions”
“Useful in confirming understanding of course content”
113
“it was sort of distracting trying to do it but also listening to the
lecturer”
“I thought it was pretty average. It didn't really help that much, I didn't
know whether I got it right or not. Despite this, they helped me think
about the relevance of the concepts.”
Student interviews were conducted in Semester 2, 2011 after the course was completed.
An email was sent to all students requesting volunteers for a research project and of
the five that replied only two were students which took part of the Regular course in
Semester one. Both of these students were part of the non-ILD (Interactive Exercise)
streams so no elaboration of opinions of the ILDs was possible. Students were not
directly asked their opinions about specific parts of the intervention so that their
reactions reflected their organic memory of the experience. This resulted in little being
said about thermodynamics learning or about the intervention. Since so little was said,
all references to the thermal Physics modules or the exercises is provided below in full.
On impressions on the Semester one course:
S1: I think the thermal physics part was what I probably did best at last
semester and um… I think that was partially because of the bonus two
marks and I attended the most lectures for that module but also the
lecturer was really good and he… I mean he really explained things well.
On what they remember about the exercises:
S1: I can’t remember specific details but I do remember sometimes I
thought that the exercises wasn’t that relevant to that particular lecture.
Sometimes it was…
H: Would you have preferred it to be relevant?
114
S1: I suppose it could have been a bit more, its more useful that way
because you might remember the content of the lecture more if you have
to um… do an exercise like that... yeah… I don’t really know what to
think of those. Sometimes I thought they were… yeah… sometimes not
that relevant to the material so I don’t know how beneficial they were…
I mean I think it just would have been more helpful if you just got a
typical like a Mastering Physics or typical sort of exam question, not too
hard but you know that sort of thing, that sort of question might be…
On explaining how an ‘Eski13
S1: OK, well, so presumably the cans of drink will be at a higher
temperature than um the inside of the eski so as soon as you put them in
and close the lid they'll start transferring heat energy into the eski into
those icepacks and eventually the temperature of the cans of drink and
the temperature of the ice packs and the inside of the eski will increase
and decrease respectively to the point where they will reach thermal
equilibrlium.
’ works
H: so how do you think energy is transferrred in this case
S1: how is it transferred...? Do you mean on a molecular level?
H: Yeah, what is actually happening
S1: oh, well, um... the, the molecules of the cans of drink are they're
moving...uh.... faster than the well, first the container that they're in so
they will increase the internal energy of that material and then the
....uh... molecules inside the can the material they'll be vibrating I
13 The ‘Eski’ is a thermally insulated portable container used to store or transport food and drink. Eski’s are the generic term used for these containers but the name reflects a brand, rather than the object itself.
115
suppose faster than the molecules of the air and the icepacks next to
them so they'll transfer the energy to those molecules.
H: how do they do that?
S1: I don't know... I suppose it’s like an abacus like situation
H: so one kind of bumps into the other...
S1: yeah, and travels that way.....
H: and then the whole eski over time?
S1: well it's designed so that it doesn't lose heat very quickly but
eventually it's gonna lose some energy over time so after a while um
after a long time the inside of the eski will reach the same temperature
or close to the same temperaure as the outside...
H: so it will lose energy
S1: um... yeah. It will lose energy. But it won't... yes... it will lose
entropy. It'll go into the surroundings so entropy will still increase. And
the second law of thermodynamics won't be violated.
On impressions about Semester one course:
S2: I did find the thermal physics pretty interesting, I did do some
reading about um… uh… some of the internet in my free time but
nothing that would be too relevant to my course, just some things that I
felt… do you want me to talk about this…?
H: Yeah
S2: I don’t know if you have heard of, oh, you probably heave heard of
something like this, I think it was called uh... it was a thought
116
experiment called ‘Maxwell's Demon’, so if I remember corectly, it was
sort of a box and its uh... divided in two by some sort of a wall and
there's a little... in one chamber there's a gas of some temperature and
the other chamber is colder and there's a gap in the wall seperating the
two chambers and a little demon and somehow he's able to ...um... only
allow molecules of a certain speed to pass through so the idea is that
um... if you could do that... the uh... if you could make the entropy of
the system involving the box of hot molecules uh... decrease or
something like that its supposed to be in violation of the second law but
then um... someone said uh... for him to do that he would actually have
to use energy... yeah... so
On the exercises:
S2: They were a little bit distracting cause we weren't really given time
to do it so either you are paying attention to the lecturer or trying to do
it... I thought they were pretty… they weren't too complicated... you
didn't need to think too hard about it... they were pretty easy to fill
out... it helps you think about it.
T: Did you... um... were you encouraged to turn up to those lectures
because of those bonus marks that were attached to those exercises?
S2: Yeah, I go to all of my lectures anyway but I guess it does, it's more
of an incentive.
On explaining how an Eski works:
S: Well, the heat flows from warm to cold and the cans are warmer than
the ice so the heat flows out of them into the ice until they reach the
same temperature like so the ice warms up while the cans cool down
117
until they become the same temperature and then they slowly they'll
slowly interacting with the air outside because it's not completely um...
um.... it's not uh... completely closed system so um.... um... heat does
slowly seep in to the eski and it slowly all warms up until it's the same
temperature as the air outside.
7.5 Discussion
Overall, the normalized gain for the 2011 cohort on the thermodynamics module as
measured by the TCS was 0.29. Hake’s measure of normalized gain allows some
inferences to be made about the degree of student success at the completion of a
course. His large study indicates that in mechanics, a gain of about 0.23 is considered
normal for ‘traditional’ lectures. There exist very few studies that use normalized gain
in thermodynamics courses at the tertiary level, particularly that compare ‘traditional’
with Interactive Engagement methods, so it is difficult to be conclusive about whether
the overall gain of 0.29 is a low, medium or high gain. For example, a study of thermal
concepts in a first year Engineering course reports gains of up to 0.9 for individual
questions and 0.4 on a conceptual survey after implementing ‘inquiry based’ learning.
However, by their own account, they use surveys that are not validated or consistent
(Prince, Vigeant, & Nottis, 2009). In 2012, the same authors constructed and validated
a thermal concepts survey, predominantly on heat and temperature (similar to Part I
of our TCS) and showed very mild gains of 0.10 (Prince, Vigeant, & Nottis, 2012),
citing the inherent conceptual difficulty of concept surveys as the reason for the very
slight gain. Meltzer, in his teams’ extensive work on thermodynamics, also includes an
analysis of the introduction of Active Learning methods. However, these results are
mostly qualitative, not pre- and post- and overall inconclusive, showing little
improvement in student understanding. Given the vast data on mechanics, an overall
gain of 0.29 can be therefore tentatively declared as medium to high. A more thorough
analysis of normalized gain was performed in Study Two, where pre-test scores for
individual students were collected.
118
Students performed satisfactorily –and consistently –in most measures of learning
outcomes; the TCS, final exam and Q4 on the final exam saw scores averaging around
55% on each. However, students were less successful with Q9, scoring on average 48%,
and a concerning 25% on Q10, which was the lowest scoring question in the exam. This
suggests several important issues. Firstly, one measure of student achievement may not
be sufficient in concluding students are proficient in thermodynamics concepts.
Secondly, thermodynamics is still a very troublesome topic in first year Physics. The
ability to apply thermodynamics to everyday situations was also not particularly
sophisticated after the course, with one student explaining that a cool Esky will
become warmer over time by losing energy and another saying that heat will flow into
the system because it is not ‘a completely closed’ system. This supports previous
research showing that students have trouble applying their thermodynamics knowledge
to real world situations, particularly if they apply of the ‘heat as substance’ view.
The comparisons between streams showed that there were no differences in means for
any of the measured learning outcomes. One weakness of the 2011 implementation was
that the streams could not be satisfactorily assumed as identical. Although the streams
were identical with respect to ATAR and physics background, only 60% of the sample
was accounted for. This may have had an effect on the improvements on the pre- and
post- tests and the overall learning outcomes, since students with missing scores are
students who have completed high school in other states or countries and thus
represent a highly variable sample. These issues are be rectified in Study Two by
ensuring samples are identical with respect to pre-test scores instead.
In terms of the analyses of the course, several general conclusions can be made. Firstly,
it was clear that the introduction of the ILDs in Streams one and two increased the
level that students were physically ‘engaging’ with the lecturer and demonstration. A
comparison between the two ILD streams shows that ILD1 exhibited twice as much
Interactivity as ILD2, 23% versus 11%. Further analysis shows that the difference
manifested itself in both how much time was spent on interactivity-based activity
during the ILD program and also, how much persisted in the non-experimental
119
lectures. For example, recall that the item on the ILD evaluation: ‘I had opportunities
to discuss with my peers’ was rated significantly lower for ILD2 compared to ILD1.
That is, Staff-2 both spent less time allowing ‘interaction’ to occur during the ILDs,
but also did not engage in any ‘Interactive’ teaching during the remaining lectures.
This can be clearly seen with reference to the Lecture Activity coding of EX1 which
was the other stream taken by Staff-2, where less than two minutes of Interactivity
during the nine one-hour lectures took place. Therefore, even with only three different
staff, there is a significant difference in how they choose to divide lecture time for
different activities, despite similar lecture notes and identical curricula.
Students provided some insight into how these differences, and the program in general,
were perceived through the evaluation surveys and interviews. Overall, students were
very positive about both the ILDs and the Interactive Exercises. ILDs have known to
produce positive attitudinal gains amongst students and as such, this finding is not
incredibly surprising. Students appreciate “clearly seeing” the concepts in a way that
was considered “entertaining”. However, it was found that students also appreciated
the opportunity to make predictions beforehand, as seen in comments such as: “very
well explained after attempting to hypothesize the reason” and “it was unexpected”,
“also cleared a lot of misconception”.
What was most surprising was that the students, without coaxing beyond the presence
of a single optional question on the lecture evaluation form, were overwhelmingly
supportive of the Interactive Exercises. Particularly striking was students’
appreciation that the Exercises were low stakes (marks were only allocated for
completion and feedback was provided in a timely fashion), were based on everyday
occurrences, were interesting and were a way of bringing together the various concepts
in the course. The majority of negative comments referred to logistical issues. This
feedback confirms that the Exercises were indeed ‘context-rich problems’ and a form of
Interactive engagement: students recognised them as a distinct activity, separate from
the lectures, and engaged in ‘Active Learning’, despite not necessarily discussing them
with peers or the lecturer.

120
The findings related to student engagement are expanded on to include these other
important factors in Study Two. That is, more analysis will be conducted to
appropriately consider ‘hands on’ as well as ‘minds on’ Active Learning, specifically
addressing questions around how the students respond to different types of lecture
activity, what do students’ think about these differences and do different types of
lecture have any effect on student learning outcomes. These findings will occur in the
context of the amended research methods, particularly the control of student
backgrounds (degrees) and pre-test scores for Study Two.
121
8 Study Two 2012
8.1 Aim
The aims of Study Two extend those in Study One and are as follows:
1. To determine the overall learning gains of students during the
thermodynamics module as measured by the pre- and post- TCS
part I
2. To determine whether there was a difference in learning outcomes
for students using the measures of TCS gains
3. To explore whether there were differences in final scores: post-
test, in thermodynamics questions in the final exam and overall
final exam score
4. To examine student attitudes towards the two methods of IE
through student evaluation surveys and interviews
5. To characterise the lectures with respect to the interactivity
present in the lecture streams and the degree to which students
are engaging throughout the thermodynamics module as
measured by the full LASE protocol
8.2 Sample- allocation of streams
In Study Two, after students had been administratively allocated to streams, student
demographics were acquired and revealed similar imbalances to Study One (Engineers
versus Science/Medical Science degrees). Given this information was provided a-priori,
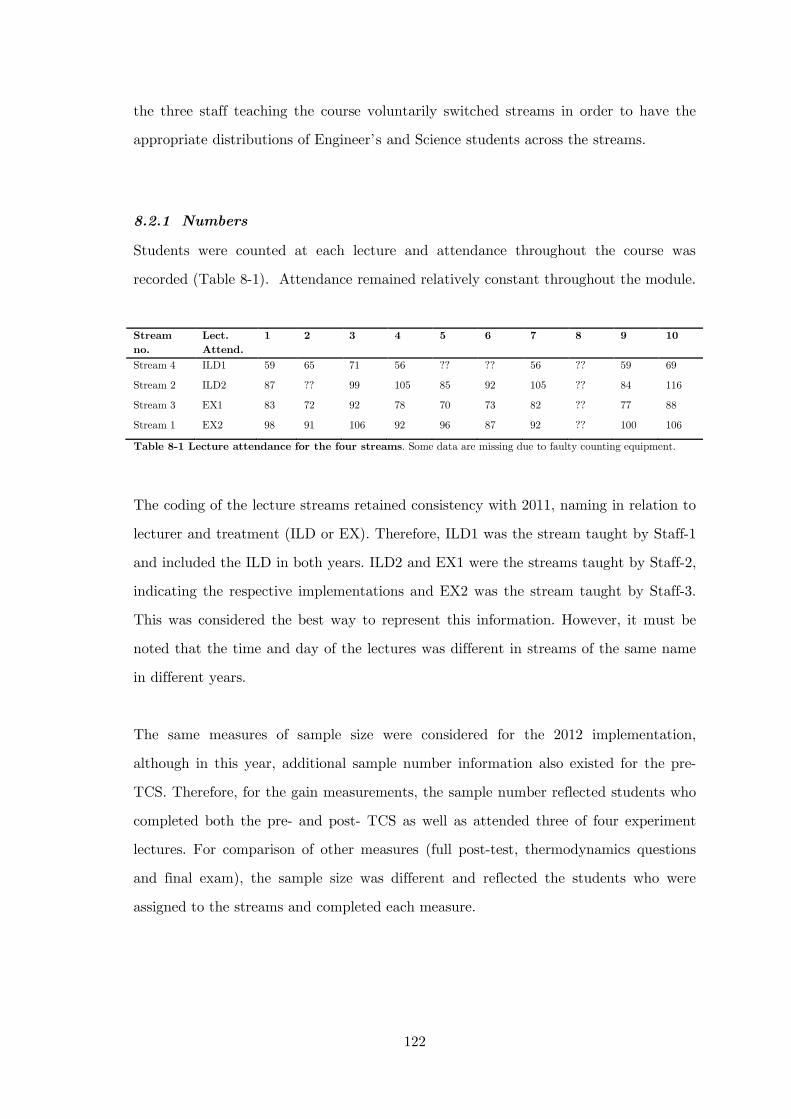
122
the three staff teaching the course voluntarily switched streams in order to have the
appropriate distributions of Engineer’s and Science students across the streams.
8.2.1 Numbers
Students were counted at each lecture and attendance throughout the course was
recorded (Table 8-1). Attendance remained relatively constant throughout the module.
Stream no.
Lect. Attend.
1 2 3 4 5 6 7 8 9 10
Stream 4 ILD1 59 65 71 56 ?? ?? 56 ?? 59 69
Stream 2 ILD2 87 ?? 99 105 85 92 105 ?? 84 116
Stream 3 EX1 83 72 92 78 70 73 82 ?? 77 88
Stream 1 EX2 98 91 106 92 96 87 92 ?? 100 106
Table 8-1 Lecture attendance for the four streams. Some data are missing due to faulty counting equipment.
The coding of the lecture streams retained consistency with 2011, naming in relation to
lecturer and treatment (ILD or EX). Therefore, ILD1 was the stream taught by Staff-1
and included the ILD in both years. ILD2 and EX1 were the streams taught by Staff-2,
indicating the respective implementations and EX2 was the stream taught by Staff-3.
This was considered the best way to represent this information. However, it must be
noted that the time and day of the lectures was different in streams of the same name
in different years.
The same measures of sample size were considered for the 2012 implementation,
although in this year, additional sample number information also existed for the pre-
TCS. Therefore, for the gain measurements, the sample number reflected students who
completed both the pre- and post- TCS as well as attended three of four experiment
lectures. For comparison of other measures (full post-test, thermodynamics questions
and final exam), the sample size was different and reflected the students who were
assigned to the streams and completed each measure.
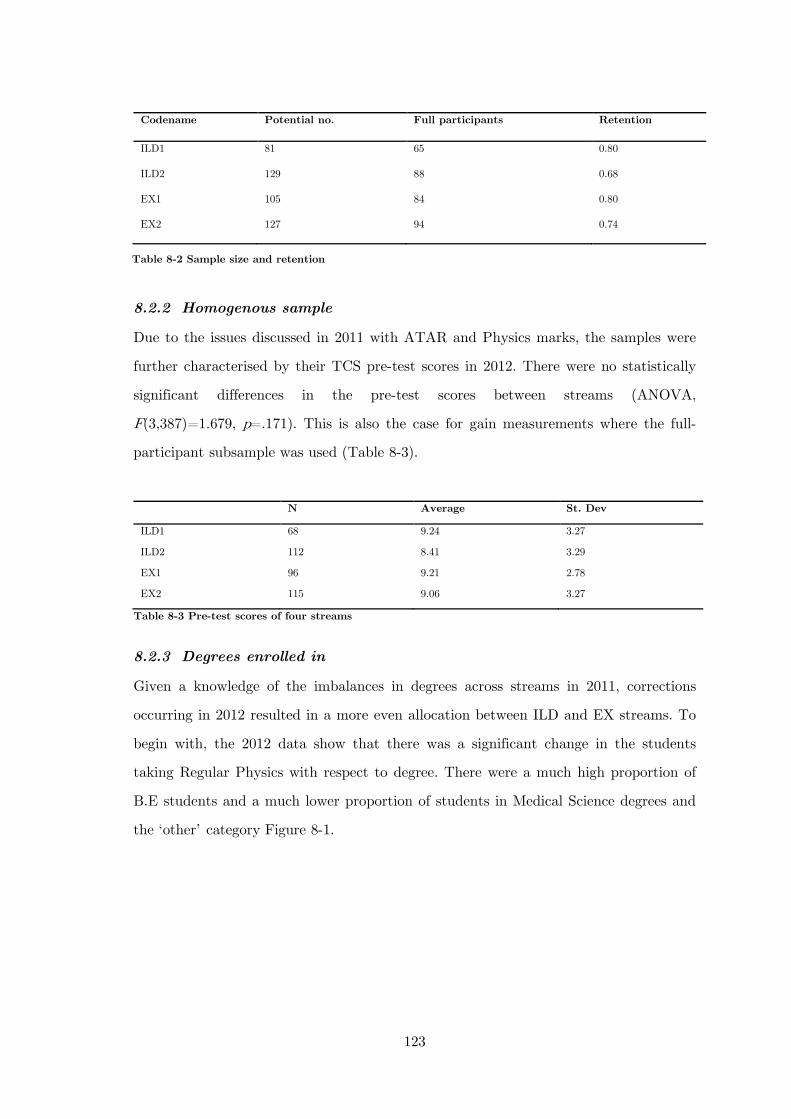
123
8.2.2 Homogenous sample
Due to the issues discussed in 2011 with ATAR and Physics marks, the samples were
further characterised by their TCS pre-test scores in 2012. There were no statistically
significant differences in the pre-test scores between streams (ANOVA,
F(3,387)=1.679, p=.171). This is also the case for gain measurements where the full-
participant subsample was used (Table 8-3).
N Average St. Dev
ILD1 68 9.24 3.27
ILD2 112 8.41 3.29
EX1 96 9.21 2.78
EX2 115 9.06 3.27
Table 8-3 Pre-test scores of four streams
8.2.3 Degrees enrolled in
Given a knowledge of the imbalances in degrees across streams in 2011, corrections
occurring in 2012 resulted in a more even allocation between ILD and EX streams. To
begin with, the 2012 data show that there was a significant change in the students
taking Regular Physics with respect to degree. There were a much high proportion of
B.E students and a much lower proportion of students in Medical Science degrees and
the ‘other’ category Figure 8-1.
Codename Potential no. Full participants Retention
ILD1 81 65 0.80
ILD2 129 88 0.68
EX1 105 84 0.80
EX2 127 94 0.74
Table 8-2 Sample size and retention
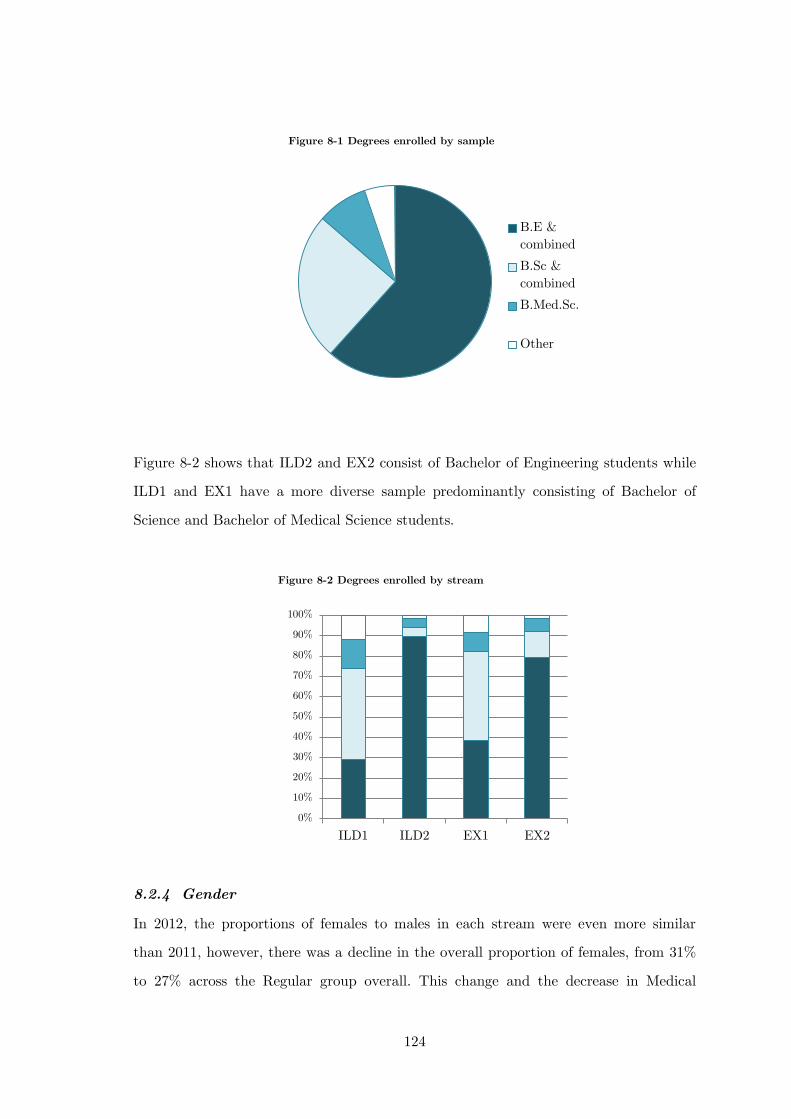
124
Figure 8-2 shows that ILD2 and EX2 consist of Bachelor of Engineering students while
ILD1 and EX1 have a more diverse sample predominantly consisting of Bachelor of
Science and Bachelor of Medical Science students.
8.2.4 Gender
In 2012, the proportions of females to males in each stream were even more similar
than 2011, however, there was a decline in the overall proportion of females, from 31%
to 27% across the Regular group overall. This change and the decrease in Medical
B.E & combined
B.Sc & combined
B.Med.Sc.
Other
Figure 8-1 Degrees enrolled by sample
0%
10%
20%
30%
40%
50%
60%
70%
80%
90%
100%
ILD1 ILD2 EX1 EX2
Figure 8-2 Degrees enrolled by stream
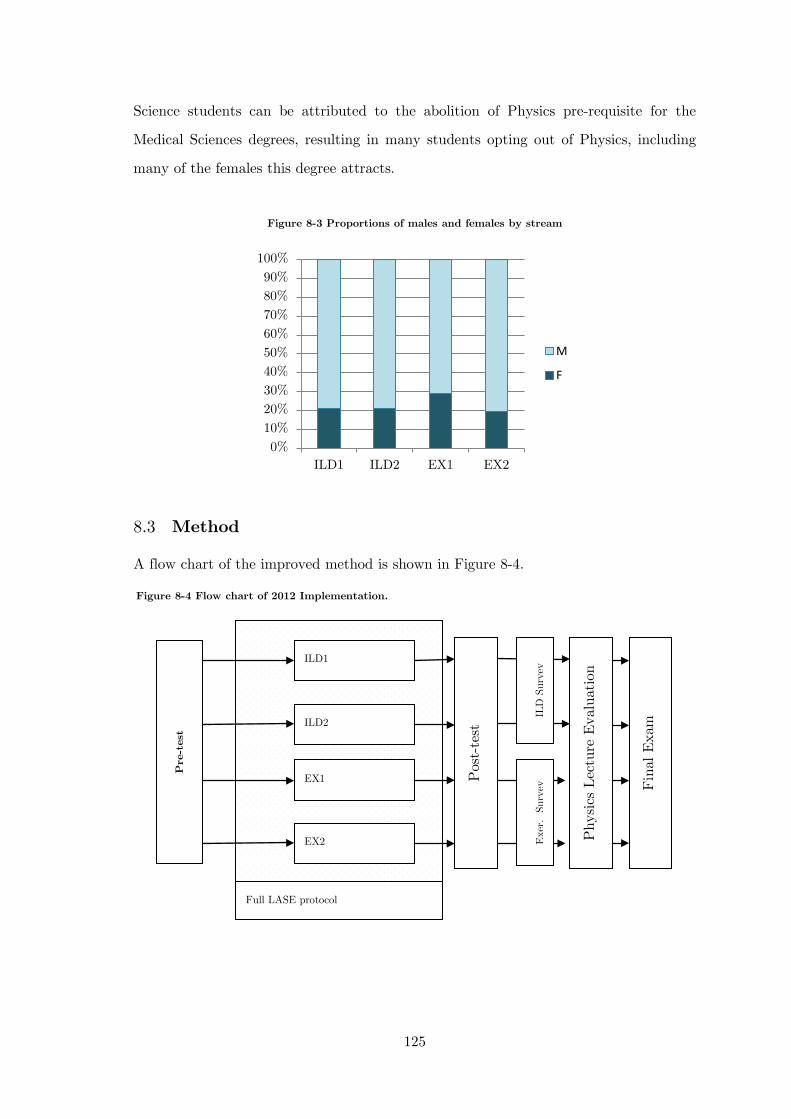
125
Science students can be attributed to the abolition of Physics pre-requisite for the
Medical Sciences degrees, resulting in many students opting out of Physics, including
many of the females this degree attracts.
Figure 8-3 Proportions of males and females by stream
8.3 Method
A flow chart of the improved method is shown in Figure 8-4.
0% 10% 20% 30% 40% 50% 60% 70% 80% 90%
100%
ILD1 ILD2 EX1 EX2
M
F
Pre
-tes
t
ILD1
ILD2
EX1
EX2
Full LASE protocol
Phy
sics
Lec
ture
Eva
luat
ion
Fin
al E
xam
ILD
Sur
vey
Pos
t-te
st
Exe
r. Su
rvey
Figure 8-4 Flow chart of 2012 Implementation.
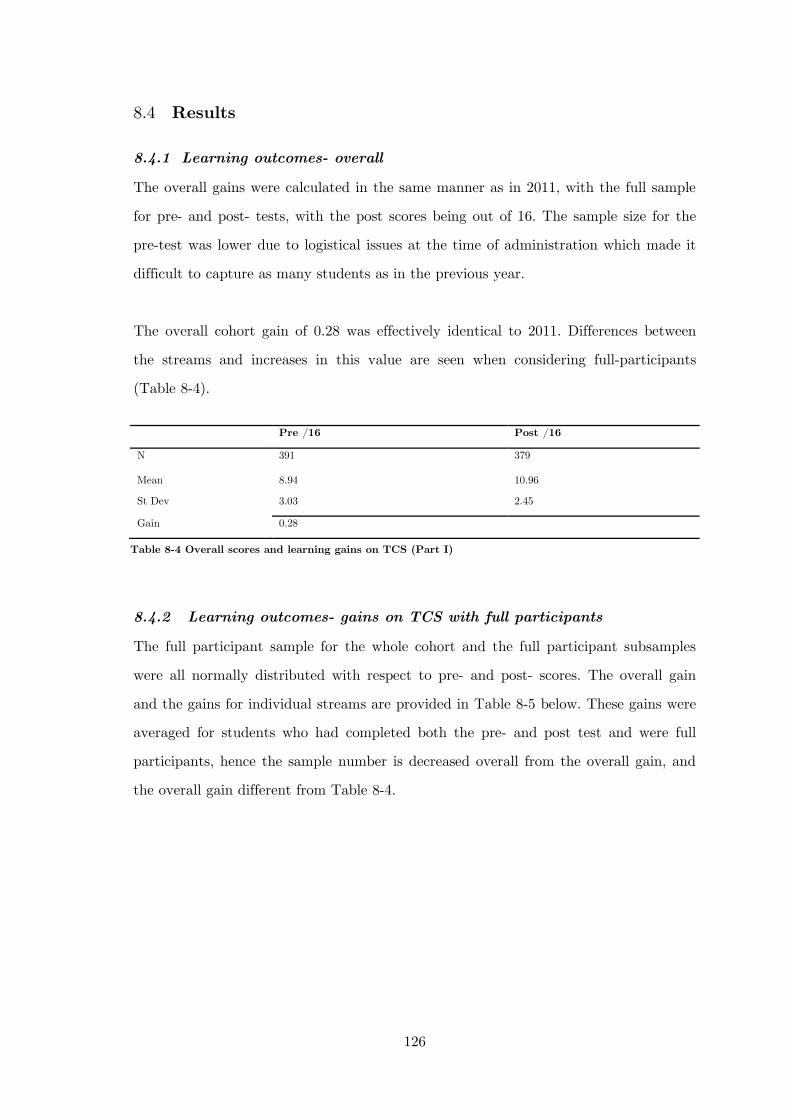
126
8.4 Results
8.4.1 Learning outcomes- overall
The overall gains were calculated in the same manner as in 2011, with the full sample
for pre- and post- tests, with the post scores being out of 16. The sample size for the
pre-test was lower due to logistical issues at the time of administration which made it
difficult to capture as many students as in the previous year.
The overall cohort gain of 0.28 was effectively identical to 2011. Differences between
the streams and increases in this value are seen when considering full-participants
(Table 8-4).
8.4.2 Learning outcomes- gains on TCS with full participants
The full participant sample for the whole cohort and the full participant subsamples
were all normally distributed with respect to pre- and post- scores. The overall gain
and the gains for individual streams are provided in Table 8-5 below. These gains were
averaged for students who had completed both the pre- and post test and were full
participants, hence the sample number is decreased overall from the overall gain, and
the overall gain different from Table 8-4.
Pre /16 Post /16
N 391 379
Mean 8.94 10.96
St Dev 3.03 2.45
Gain 0.28
Table 8-4 Overall scores and learning gains on TCS (Part I)
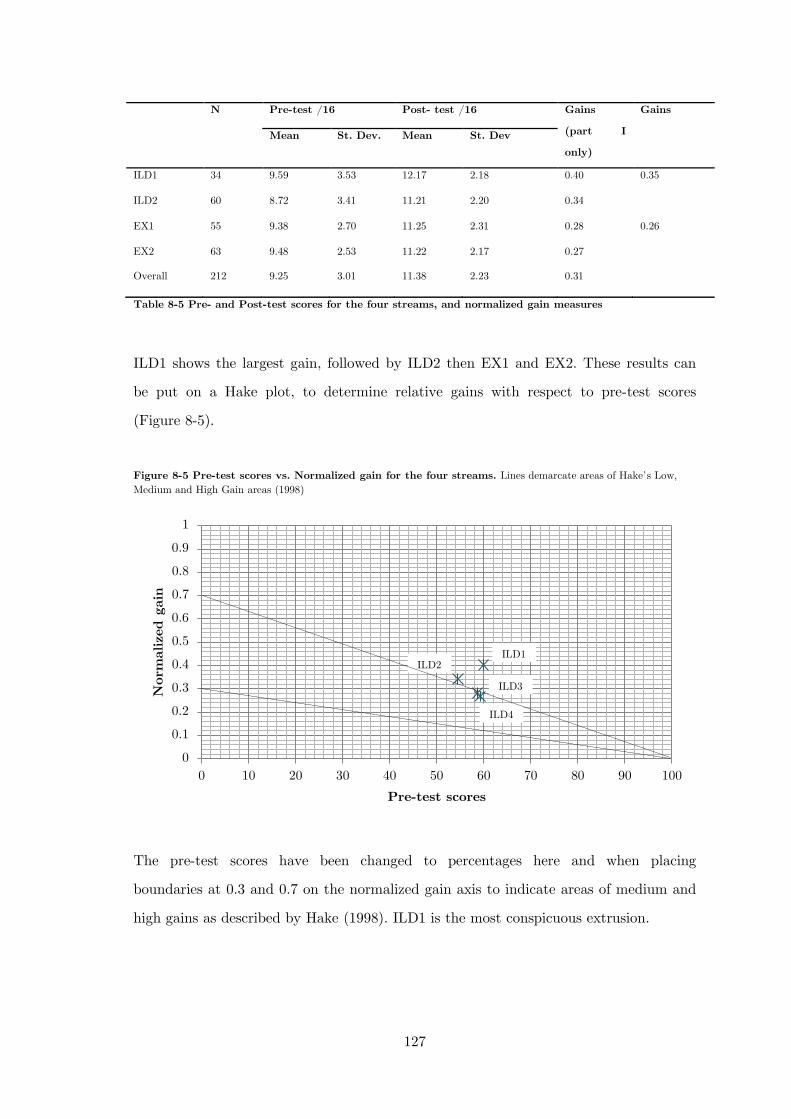
127
N Pre-test /16 Post- test /16 Gains
(part I
only)
Gains
Mean St. Dev. Mean St. Dev
ILD1 34 9.59 3.53 12.17 2.18 0.40 0.35
ILD2 60 8.72 3.41 11.21 2.20 0.34
EX1 55 9.38 2.70 11.25 2.31 0.28 0.26
EX2 63 9.48 2.53 11.22 2.17 0.27
Overall 212 9.25 3.01 11.38 2.23 0.31
Table 8-5 Pre- and Post-test scores for the four streams, and normalized gain measures
ILD1 shows the largest gain, followed by ILD2 then EX1 and EX2. These results can
be put on a Hake plot, to determine relative gains with respect to pre-test scores
(Figure 8-5).
Figure 8-5 Pre-test scores vs. Normalized gain for the four streams. Lines demarcate areas of Hake’s Low, Medium and High Gain areas (1998)
The pre-test scores have been changed to percentages here and when placing
boundaries at 0.3 and 0.7 on the normalized gain axis to indicate areas of medium and
high gains as described by Hake (1998). ILD1 is the most conspicuous extrusion.
0
0.1
0.2
0.3
0.4
0.5
0.6
0.7
0.8
0.9
1
0 10 20 30 40 50 60 70 80 90 100
Nor
mal
ized
gai
n
Pre-test scores
ILD1 ILD2
ILD3
ILD4
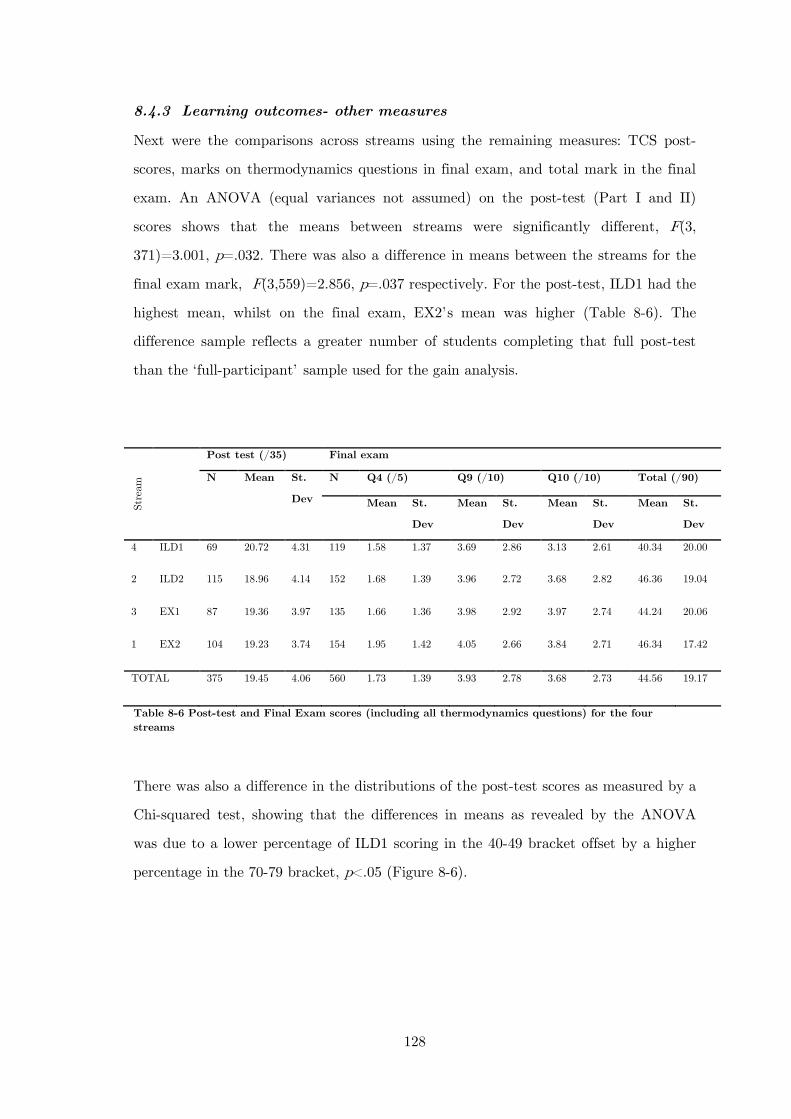
128
8.4.3 Learning outcomes- other measures
Next were the comparisons across streams using the remaining measures: TCS post-
scores, marks on thermodynamics questions in final exam, and total mark in the final
exam. An ANOVA (equal variances not assumed) on the post-test (Part I and II)
scores shows that the means between streams were significantly different, F(3,
371)=3.001, p=.032. There was also a difference in means between the streams for the
final exam mark, F(3,559)=2.856, p=.037 respectively. For the post-test, ILD1 had the
highest mean, whilst on the final exam, EX2’s mean was higher (Table 8-6). The
difference sample reflects a greater number of students completing that full post-test
than the ‘full-participant’ sample used for the gain analysis.
Stre
am
Post test (/35) Final exam
N Mean St.
Dev
N Q4 (/5) Q9 (/10) Q10 (/10) Total (/90)
Mean St.
Dev
Mean St.
Dev
Mean St.
Dev
Mean St.
Dev
4 ILD1 69 20.72 4.31 119 1.58 1.37 3.69 2.86 3.13 2.61 40.34 20.00
2 ILD2 115 18.96 4.14 152 1.68 1.39 3.96 2.72 3.68 2.82 46.36 19.04
3 EX1 87 19.36 3.97 135 1.66 1.36 3.98 2.92 3.97 2.74 44.24 20.06
1 EX2 104 19.23 3.74 154 1.95 1.42 4.05 2.66 3.84 2.71 46.34 17.42
TOTAL 375 19.45 4.06 560 1.73 1.39 3.93 2.78 3.68 2.73 44.56 19.17
Table 8-6 Post-test and Final Exam scores (including all thermodynamics questions) for the four streams
There was also a difference in the distributions of the post-test scores as measured by a
Chi-squared test, showing that the differences in means as revealed by the ANOVA
was due to a lower percentage of ILD1 scoring in the 40-49 bracket offset by a higher
percentage in the 70-79 bracket, p<.05 (Figure 8-6).
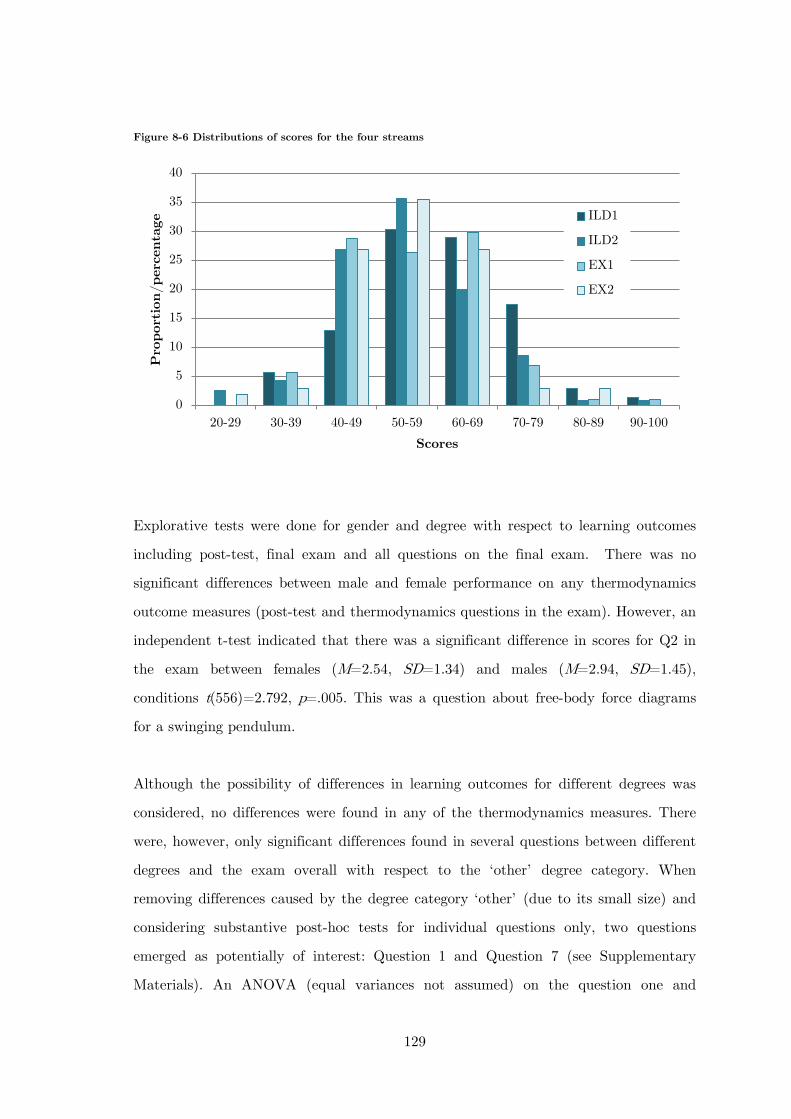
129
Figure 8-6 Distributions of scores for the four streams
Explorative tests were done for gender and degree with respect to learning outcomes
including post-test, final exam and all questions on the final exam. There was no
significant differences between male and female performance on any thermodynamics
outcome measures (post-test and thermodynamics questions in the exam). However, an
independent t-test indicated that there was a significant difference in scores for Q2 in
the exam between females (M=2.54, SD=1.34) and males (M=2.94, SD=1.45),
conditions t(556)=2.792, p=.005. This was a question about free-body force diagrams
for a swinging pendulum.
Although the possibility of differences in learning outcomes for different degrees was
considered, no differences were found in any of the thermodynamics measures. There
were, however, only significant differences found in several questions between different
degrees and the exam overall with respect to the ‘other’ degree category. When
removing differences caused by the degree category ‘other’ (due to its small size) and
considering substantive post-hoc tests for individual questions only, two questions
emerged as potentially of interest: Question 1 and Question 7 (see Supplementary
Materials). An ANOVA (equal variances not assumed) on the question one and
0
5
10
15
20
25
30
35
40
20-29 30-39 40-49 50-59 60-69 70-79 80-89 90-100
Pro
port
ion/
perc
enta
ge
Scores
ILD1
ILD2
EX1
EX2
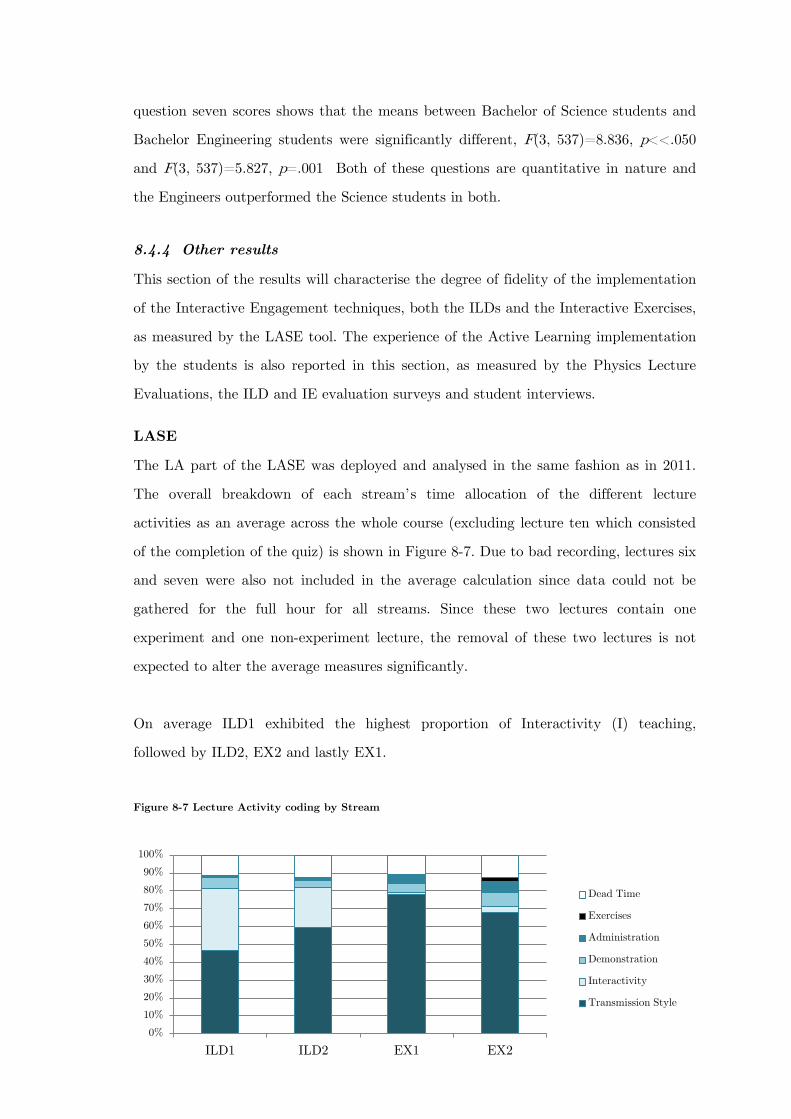
130
question seven scores shows that the means between Bachelor of Science students and
Bachelor Engineering students were significantly different, F(3, 537)=8.836, p<<.050
and F(3, 537)=5.827, p=.001 Both of these questions are quantitative in nature and
the Engineers outperformed the Science students in both.
8.4.4 Other results
This section of the results will characterise the degree of fidelity of the implementation
of the Interactive Engagement techniques, both the ILDs and the Interactive Exercises,
as measured by the LASE tool. The experience of the Active Learning implementation
by the students is also reported in this section, as measured by the Physics Lecture
Evaluations, the ILD and IE evaluation surveys and student interviews.
LASE
The LA part of the LASE was deployed and analysed in the same fashion as in 2011.
The overall breakdown of each stream’s time allocation of the different lecture
activities as an average across the whole course (excluding lecture ten which consisted
of the completion of the quiz) is shown in Figure 8-7. Due to bad recording, lectures six
and seven were also not included in the average calculation since data could not be
gathered for the full hour for all streams. Since these two lectures contain one
experiment and one non-experiment lecture, the removal of these two lectures is not
expected to alter the average measures significantly.
On average ILD1 exhibited the highest proportion of Interactivity (I) teaching,
followed by ILD2, EX2 and lastly EX1.
Figure 8-7 Lecture Activity coding by Stream
0%
10%
20%
30%
40%
50%
60%
70%
80%
90%
100%
ILD1 ILD2 EX1 EX2
Dead Time
Exercises
Administration
Demonstration
Interactivity
Transmission Style
131
Data for the first three lectures is provided to illustrate how these average values
translated to individual lectures of different types (Figure 8-8); the ‘first’ lecture, the
‘non-experiment’ lecture and the ‘experiment’ lecture (that wasn’t also the first lecture
of the module). Lecture 1 naturally presented the most Administrative teaching with
ILD1 and ILD2 showing significantly less administrative activities than the other non-
ILD streams. This was presumably due to the lecture having the largest suite of ILDs
to get through. This assertion is also supported by the very large portion of time
(around 70-75%) dedicated to the ILDs themselves. This lecture recorded the minimum
time spent on Transmission-Style teaching in the whole module and occurred with
ILD1; less than 10 minutes was spent giving direct instruction in this instance. Lecture
2 supports results from 2011 data that shows that in non-experiment lectures, Staff-2
lectured identically between their ILD and Interactive Exercise stream; a claim further
substantiated through observations, lecture slides and descriptive field notes. Staff-2
did spend some time on administrative details for the ILD2 stream, presumably to
make up for the lack of time in lecture 1 due to time pressures for the ILD program. In
contrast, ILD1 still maintained a high level of Interactivity (around 20%- the highest),
despite lecture 2 being a non-experiment lecture. Staff-3 also showed a considerable
amount of Interactivity (just over 10%) in this lecture, in contrast to lecture 1 where
the focus was on administration, demonstrations and giving students time to complete
the Interactive Exercises.
In lecture 3, another experiment lecture, several results appear: Firstly, there was
almost twice as much Interactivity in ILD1 compared to ILD2, despite both completing
the ILD program. This is accounted for in two ways: Staff-1 spent more time on the
ILDs, particularly in providing more time for student discussion, and Staff-1 also
included Interactivity in addition to the ILDs in the form of clicker questions and Peer
Instruction. An example can be seen from the coding excerpt in Table 8-7. It is also
evident that Staff-3 in EX2 provided explicit time for the completion of the exercises in
Lecture 3 whereas the students in EX1 did not receive this time. EX2 also spent more
time on demonstrations.
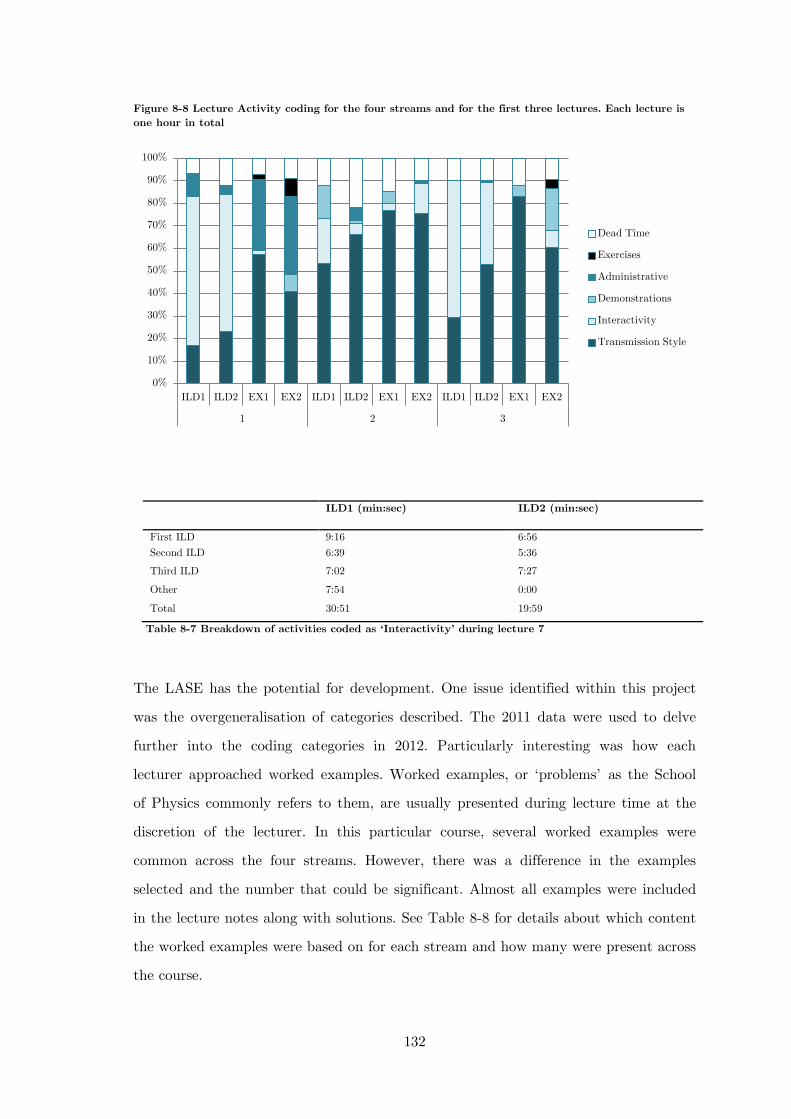
132
Figure 8-8 Lecture Activity coding for the four streams and for the first three lectures. Each lecture is one hour in total
ILD1 (min:sec) ILD2 (min:sec)
First ILD 9:16 6:56 Second ILD 6:39 5:36
Third ILD 7:02 7:27
Other 7:54 0:00
Total 30:51 19:59
Table 8-7 Breakdown of activities coded as ‘Interactivity’ during lecture 7
The LASE has the potential for development. One issue identified within this project
was the overgeneralisation of categories described. The 2011 data were used to delve
further into the coding categories in 2012. Particularly interesting was how each
lecturer approached worked examples. Worked examples, or ‘problems’ as the School
of Physics commonly refers to them, are usually presented during lecture time at the
discretion of the lecturer. In this particular course, several worked examples were
common across the four streams. However, there was a difference in the examples
selected and the number that could be significant. Almost all examples were included
in the lecture notes along with solutions. See Table 8-8 for details about which content
the worked examples were based on for each stream and how many were present across
the course.
0%
10%
20%
30%
40%
50%
60%
70%
80%
90%
100%
ILD1 ILD2 EX1 EX2 ILD1 ILD2 EX1 EX2 ILD1 ILD2 EX1 EX2
1 2 3
Dead Time
Exercises
Administrative
Demonstrations
Interactivity
Transmission Style
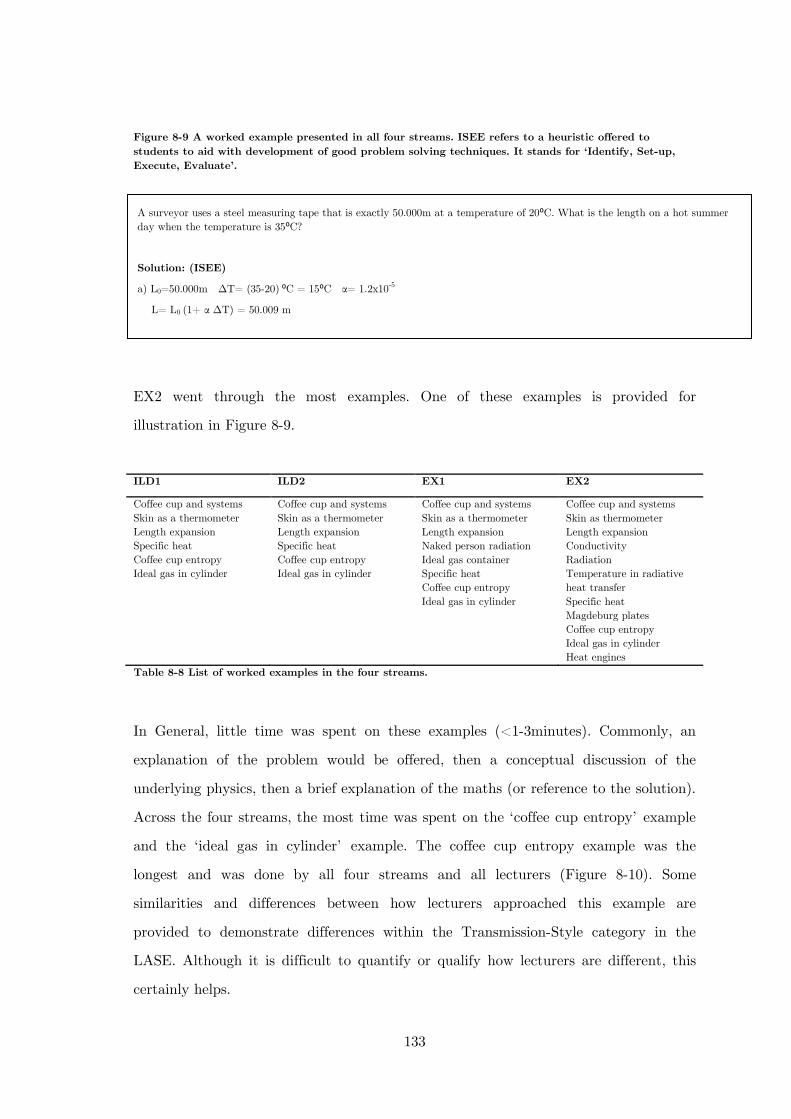
133
Figure 8-9 A worked example presented in all four streams. ISEE refers to a heuristic offered to students to aid with development of good problem solving techniques. It stands for ‘Identify, Set-up, Execute, Evaluate’.
EX2 went through the most examples. One of these examples is provided for
illustration in Figure 8-9.
ILD1 ILD2 EX1 EX2
Coffee cup and systems Skin as a thermometer Length expansion Specific heat Coffee cup entropy Ideal gas in cylinder
Coffee cup and systems Skin as a thermometer Length expansion Specific heat Coffee cup entropy Ideal gas in cylinder
Coffee cup and systems Skin as a thermometer Length expansion Naked person radiation Ideal gas container Specific heat Coffee cup entropy Ideal gas in cylinder
Coffee cup and systems Skin as thermometer Length expansion Conductivity Radiation Temperature in radiative heat transfer Specific heat Magdeburg plates Coffee cup entropy Ideal gas in cylinder Heat engines
Table 8-8 List of worked examples in the four streams.
In General, little time was spent on these examples (<1-3minutes). Commonly, an
explanation of the problem would be offered, then a conceptual discussion of the
underlying physics, then a brief explanation of the maths (or reference to the solution).
Across the four streams, the most time was spent on the ‘coffee cup entropy’ example
and the ‘ideal gas in cylinder’ example. The coffee cup entropy example was the
longest and was done by all four streams and all lecturers (Figure 8-10). Some
similarities and differences between how lecturers approached this example are
provided to demonstrate differences within the Transmission-Style category in the
LASE. Although it is difficult to quantify or qualify how lecturers are different, this
certainly helps.
A surveyor uses a steel measuring tape that is exactly 50.000m at a temperature of 20⁰C. What is the length on a hot summer day when the temperature is 35⁰C?
Solution: (ISEE)
a) L0=50.000m ΔT= (35-20) ⁰C = 15⁰C α= 1.2x10⁻⁵
L= L0 (1+ α ΔT) = 50.009 m
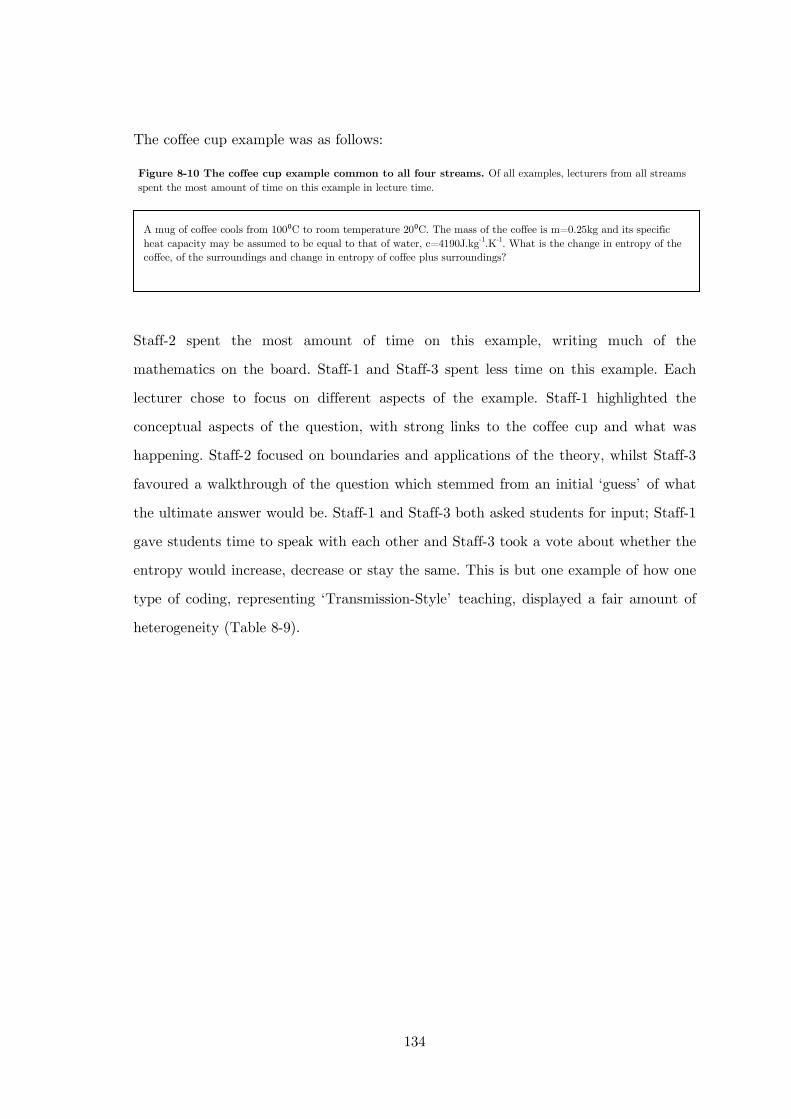
134
The coffee cup example was as follows:
Staff-2 spent the most amount of time on this example, writing much of the
mathematics on the board. Staff-1 and Staff-3 spent less time on this example. Each
lecturer chose to focus on different aspects of the example. Staff-1 highlighted the
conceptual aspects of the question, with strong links to the coffee cup and what was
happening. Staff-2 focused on boundaries and applications of the theory, whilst Staff-3
favoured a walkthrough of the question which stemmed from an initial ‘guess’ of what
the ultimate answer would be. Staff-1 and Staff-3 both asked students for input; Staff-1
gave students time to speak with each other and Staff-3 took a vote about whether the
entropy would increase, decrease or stay the same. This is but one example of how one
type of coding, representing ‘Transmission-Style’ teaching, displayed a fair amount of
heterogeneity (Table 8-9).
A mug of coffee cools from 100⁰C to room temperature 20⁰C. The mass of the coffee is m=0.25kg and its specific heat capacity may be assumed to be equal to that of water, c=4190J.kg-1.K-1. What is the change in entropy of the coffee, of the surroundings and change in entropy of coffee plus surroundings?
Figure 8-10 The coffee cup example common to all four streams. Of all examples, lecturers from all streams spent the most amount of time on this example in lecture time.
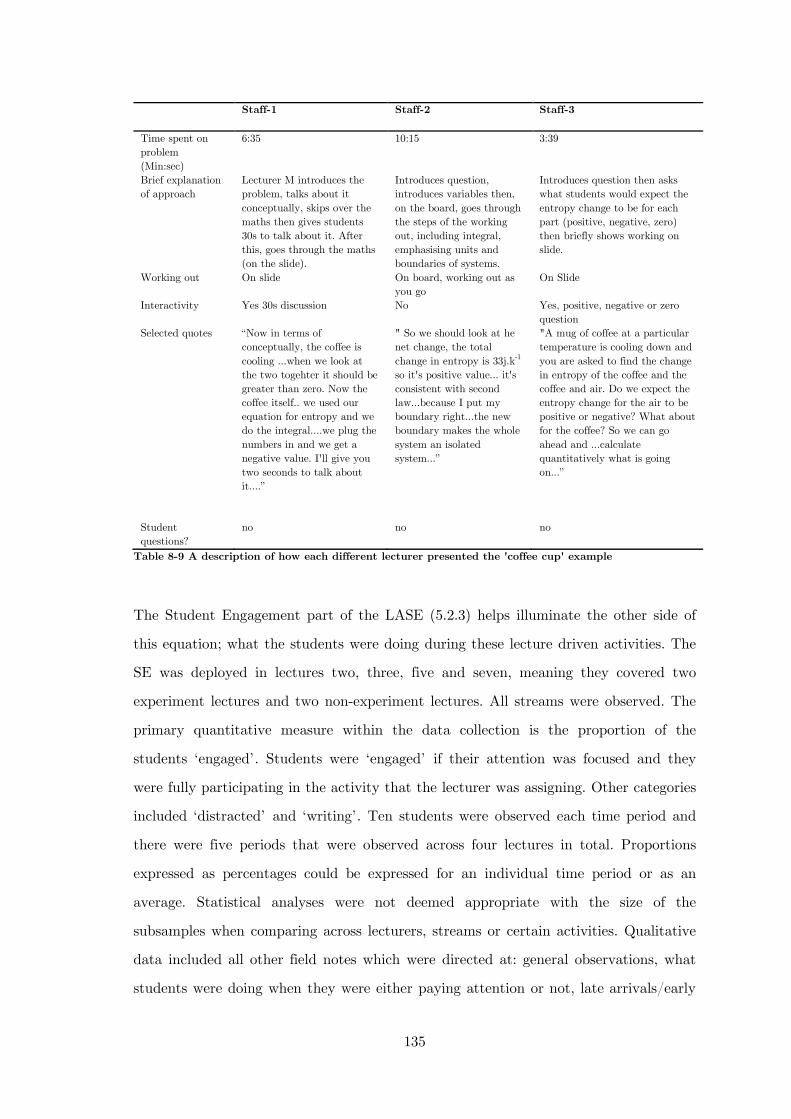
135
Staff-1 Staff-2 Staff-3
Time spent on problem (Min:sec)
6:35 10:15 3:39
Brief explanation of approach
Lecturer M introduces the problem, talks about it conceptually, skips over the maths then gives students 30s to talk about it. After this, goes through the maths (on the slide).
Introduces question, introduces variables then, on the board, goes through the steps of the working out, including integral, emphasising units and boundaries of systems.
Introduces question then asks what students would expect the entropy change to be for each part (positive, negative, zero) then briefly shows working on slide.
Working out On slide On board, working out as you go
On Slide
Interactivity Yes 30s discussion No Yes, positive, negative or zero question
Selected quotes “Now in terms of conceptually, the coffee is cooling …when we look at the two togehter it should be greater than zero. Now the coffee itself.. we used our equation for entropy and we do the integral.…we plug the numbers in and we get a negative value. I'll give you two seconds to talk about it....”
" So we should look at he net change, the total change in entropy is 33j.k-1
so it's positive value... it's consistent with second law...because I put my boundary right...the new boundary makes the whole system an isolated system...”
"A mug of coffee at a particular temperature is cooling down and you are asked to find the change in entropy of the coffee and the coffee and air. Do we expect the entropy change for the air to be positive or negative? What about for the coffee? So we can go ahead and …calculate quantitatively what is going on...”
Student questions?
no no no
Table 8-9 A description of how each different lecturer presented the 'coffee cup' example
The Student Engagement part of the LASE (5.2.3) helps illuminate the other side of
this equation; what the students were doing during these lecture driven activities. The
SE was deployed in lectures two, three, five and seven, meaning they covered two
experiment lectures and two non-experiment lectures. All streams were observed. The
primary quantitative measure within the data collection is the proportion of the
students ‘engaged’. Students were ‘engaged’ if their attention was focused and they
were fully participating in the activity that the lecturer was assigning. Other categories
included ‘distracted’ and ‘writing’. Ten students were observed each time period and
there were five periods that were observed across four lectures in total. Proportions
expressed as percentages could be expressed for an individual time period or as an
average. Statistical analyses were not deemed appropriate with the size of the
subsamples when comparing across lecturers, streams or certain activities. Qualitative
data included all other field notes which were directed at: general observations, what
students were doing when they were either paying attention or not, late arrivals/early
136
departures, use of technology in lectures, materials brought to lectures and any
noteworthy events.
Generally, students were not persistently distracted (playing on their phones, speaking
to their neighbours or sleeping/daydreaming). Overall, nine out of ten students were
engaged as an average. Full engagement (100%) occurred at least once for all lecturers
and for all types of activities, from Transmission-Style teaching to Interactive teaching.
For example, 100% of students were engaged in the following situations: with Staff-3
during Transmission-Style teaching in lecture 3, with Staff-2 during a demonstration in
lecture 5 and with Staff-1 during an introduction in lecture 5. The lowest levels of
engagement occurred across similar situations: 50% during Transmission-Style lecturing
in lecture 5 with Staff-3, 60% during Transmission-Style teaching with Staff-2 in
lecture 7 and 30% for Interaction teaching (buzz questions) with Staff-1. That is, it
was not straightforward to make conclusions about which activities, lectures or
lecturers were more successful in engaging the students. However, given the LA and
field note data, some more specific conclusions may be reached. Firstly, very few
students were taking notes during the lecture- with the exception of the ILD or IE
program and when staff wrote on the board. That is, students were not writing down
their own notes or thoughts throughout the lecture and only copied derivations
wholesale when the lecturer was writing them up as they went. This was also the case
with students with laptops. Secondly, although it is often reported that students tend
to lose interest and become distracted when given the opportunity to have discussions
with friends during ILDs, this was controlled quite heavily and effectively by Staff-1
and Staff-2. If students were seen to be off task, Peer Instruction was halted, and if
students took longer than expected to settle back into listening, they were very quickly
reprimanded. Conversely, Staff-3, who displayed more tolerance and patience, often
waited the longest to remind students that they were not to be talking when he was
talking unless they had a question to ask. It is safe to say in this case that lecturer
disposition was also an important factor in ‘engagement’. A final observation was the
comparison between the ILD and EX implementations. More targeted field notes were
taken during the ILD implementation, to account for how students were taking to the
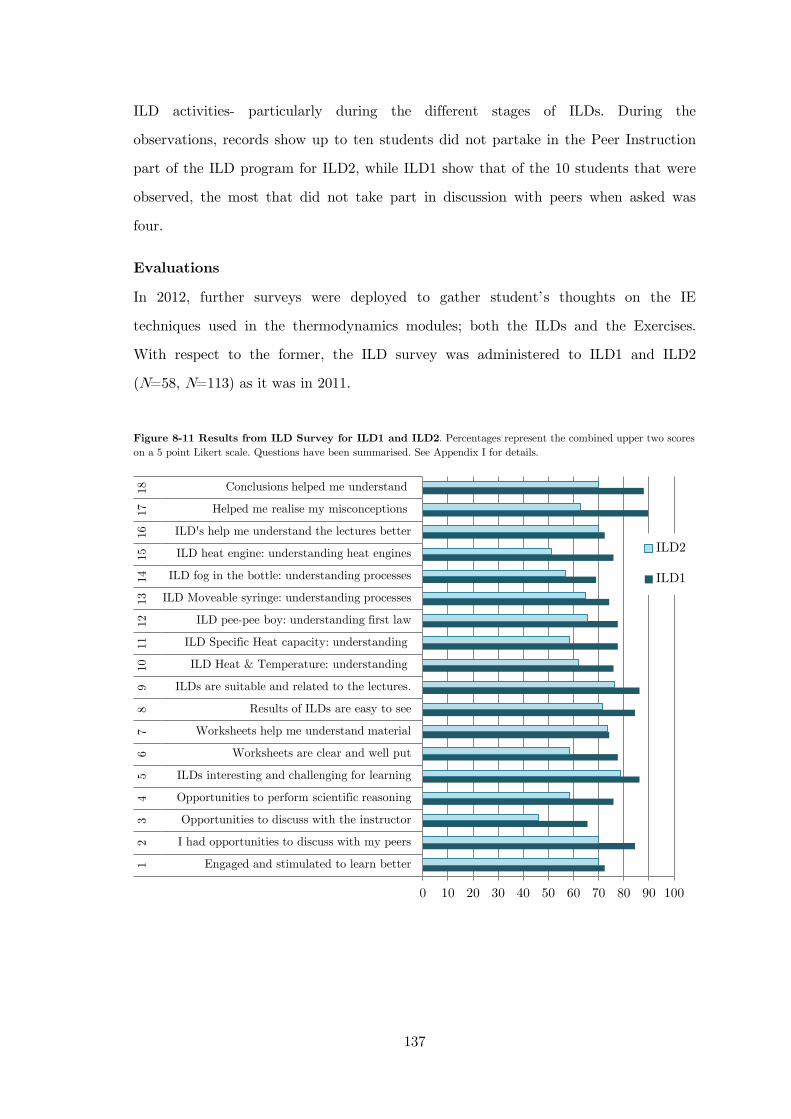
137
ILD activities- particularly during the different stages of ILDs. During the
observations, records show up to ten students did not partake in the Peer Instruction
part of the ILD program for ILD2, while ILD1 show that of the 10 students that were
observed, the most that did not take part in discussion with peers when asked was
four.
Evaluations
In 2012, further surveys were deployed to gather student’s thoughts on the IE
techniques used in the thermodynamics modules; both the ILDs and the Exercises.
With respect to the former, the ILD survey was administered to ILD1 and ILD2
(N=58, N=113) as it was in 2011.
Figure 8-11 Results from ILD Survey for ILD1 and ILD2. Percentages represent the combined upper two scores on a 5 point Likert scale. Questions have been summarised. See Appendix I for details.
0 10 20 30 40 50 60 70 80 90 100
Engaged and stimulated to learn better
I had opportunities to discuss with my peers
Opportunities to discuss with the instructor
Opportunities to perform scientific reasoning
ILDs interesting and challenging for learning
Worksheets are clear and well put
Worksheets help me understand material
Results of ILDs are easy to see
ILDs are suitable and related to the lectures.
ILD Heat & Temperature: understanding
ILD Specific Heat capacity: understanding
ILD pee-pee boy: understanding first law
ILD Moveable syringe: understanding processes
ILD fog in the bottle: understanding processes
ILD heat engine: understanding heat engines
ILD's help me understand the lectures better
Helped me realise my misconceptions
Conclusions helped me understand
1 2
3 4
5 6
7 8
9 10
11
12
13
14
15
16
17
18
ILD2
ILD1
138
As with the 2011 implementation, the 2012 evaluations indicate that the ILD
experience was overwhelmingly positive for the students (Figure 8-11). Unlike the 2011
implementation, the 2012 implementation shows large disparities between the two ILD
streams. Supporting evidence from the LASE, student responses on the ILD evaluation
show that there were considerable logistical or administrative differences between ILD1
and ILD2. For example, only 70% of students in ILD2 stated that they ‘agree’ or
‘strongly agree’ with the statement that they had opportunities to discuss with their
peers, compared to 85% of ILD1. More telling was that less than half of students in
ILD2 stated they had opportunities to speak with the lecturer compared to 65% of
ILD1. Finally, students in ILD2 also rated this stream lower on ‘clear and well put’
and ‘easy to see’ when compared to the students in ILD1.
Such logistical and administrative differences seem to manifest themselves in
differences in terms of student attitudes toward understanding. For example, students
in ILD1 consistently rated the ‘understanding’ questions much higher than students in
ILD2. The specific heat capacity and heat engine understanding between the two
streams showed the largest disparity with only 50% of ILD2 saying that they
understood heat engines better after the demonstration whilst 75% of ILD1 students
responding in the affirmative for this demonstration. Perhaps the most surprising result
was related to questions 17 and 18, which asked students to comment on the
effectiveness of making predictions before the demonstrations and commenting on
whether the conclusions reached after the demonstration helped them understand the
content better. Only 60-70% of ILD2 students agreed with this statement, yet this
agreement occurred for around 90% of ILD1 students for both questions.
Students expanded on these selections by providing comments. Unlike the standard
Physics Lecture Evaluations, most students provided written feedback to support their
Likert selections. In terms of general attitudes towards the ILDs:
“It got me to think about the multiple processes, as well as providing a
good laugh to break up the lecture”
139
“My predictions were correct! Also, it was really interesting and I
understood the concept well”
“Thermal physics has been one of the best classes I've been to, the
lecturer is very easy to understand, maybe going a little slower with
ILD's, but otherwise all very helpful.”
The following quotation was from a student in ILD2:
“Be careful not to explain too briefly before doing the demonstration, if
the theory is missed the prac makes no sense”
This attitude was common amongst students in ILD2. When asked about the reasons
why they listed their least favourite ILD or the one that they understood the least,
students remarked that the ILD was discussed too briefly, the demonstration did not
make sense, it wasn’t well explained, it was too complicated and it was unclear: “Very
brief, unclear explanation then quick demonstration and move on”. Whereas responses
from ILD1 were more focused on personal tastes or whether or not the ILD was
exciting or not, e.g. for the heat engine demonstration: “No other reason, than I
already understood this” and “Interesting but less fun”
When students remarked positively, students from both streams stated that the ILDs
were easy to understand, they (the results) were unexpected, the concepts were clear,
the students were happy to see their prediction right or wrong, the ILDs were relevant,
made sense, evoked curiosity and were fun and exciting.
In 2012, the Exercise Evaluation form was deployed to both EX streams to garner
more direct and specific attitudes towards the exercises. In terms of logistics, students
on average took about 8 minutes to complete the exercises. They also reported to have
completed 2.6 exercises and accessed 1.2 solutions from the online resources on average.
The results from students’ responses are presented in Table 8-10.
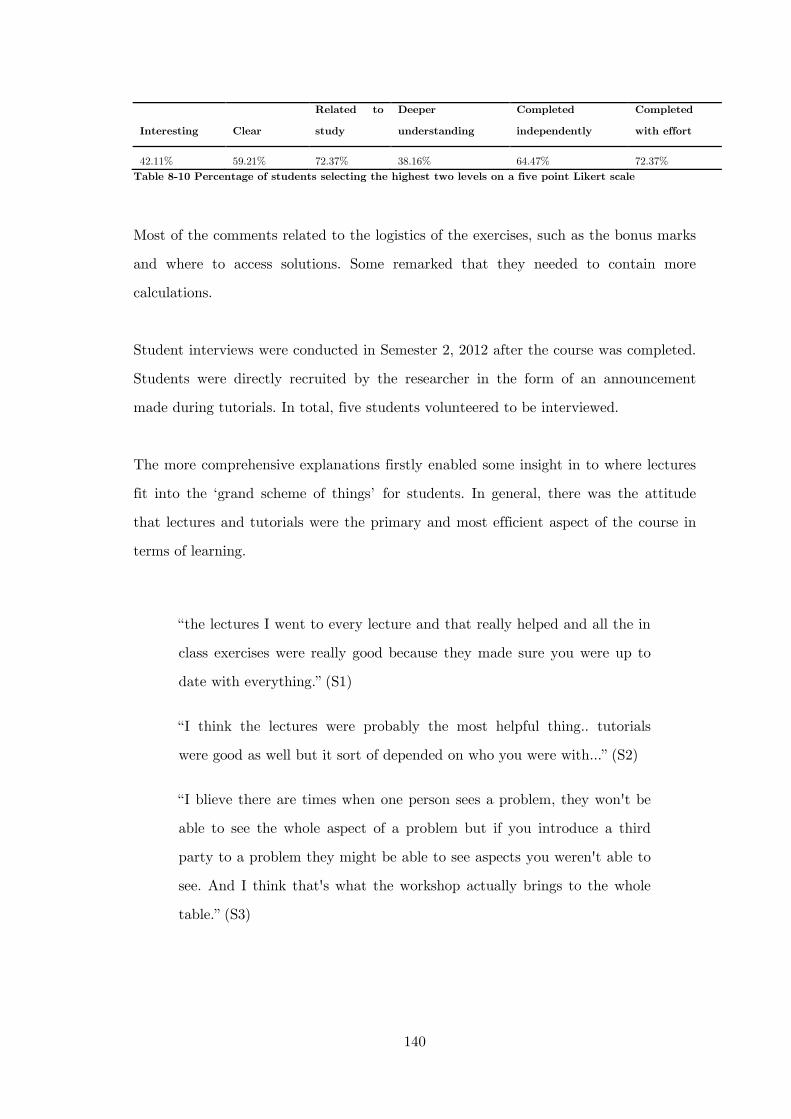
140
Interesting Clear
Related to
study
Deeper
understanding
Completed
independently
Completed
with effort
42.11% 59.21% 72.37% 38.16% 64.47% 72.37% Table 8-10 Percentage of students selecting the highest two levels on a five point Likert scale
Most of the comments related to the logistics of the exercises, such as the bonus marks
and where to access solutions. Some remarked that they needed to contain more
calculations.
Student interviews were conducted in Semester 2, 2012 after the course was completed.
Students were directly recruited by the researcher in the form of an announcement
made during tutorials. In total, five students volunteered to be interviewed.
The more comprehensive explanations firstly enabled some insight in to where lectures
fit into the ‘grand scheme of things’ for students. In general, there was the attitude
that lectures and tutorials were the primary and most efficient aspect of the course in
terms of learning.
“the lectures I went to every lecture and that really helped and all the in
class exercises were really good because they made sure you were up to
date with everything.” (S1)
“I think the lectures were probably the most helpful thing.. tutorials
were good as well but it sort of depended on who you were with…” (S2)
“I blieve there are times when one person sees a problem, they won't be
able to see the whole aspect of a problem but if you introduce a third
party to a problem they might be able to see aspects you weren't able to
see. And I think that's what the workshop actually brings to the whole
table.” (S3)
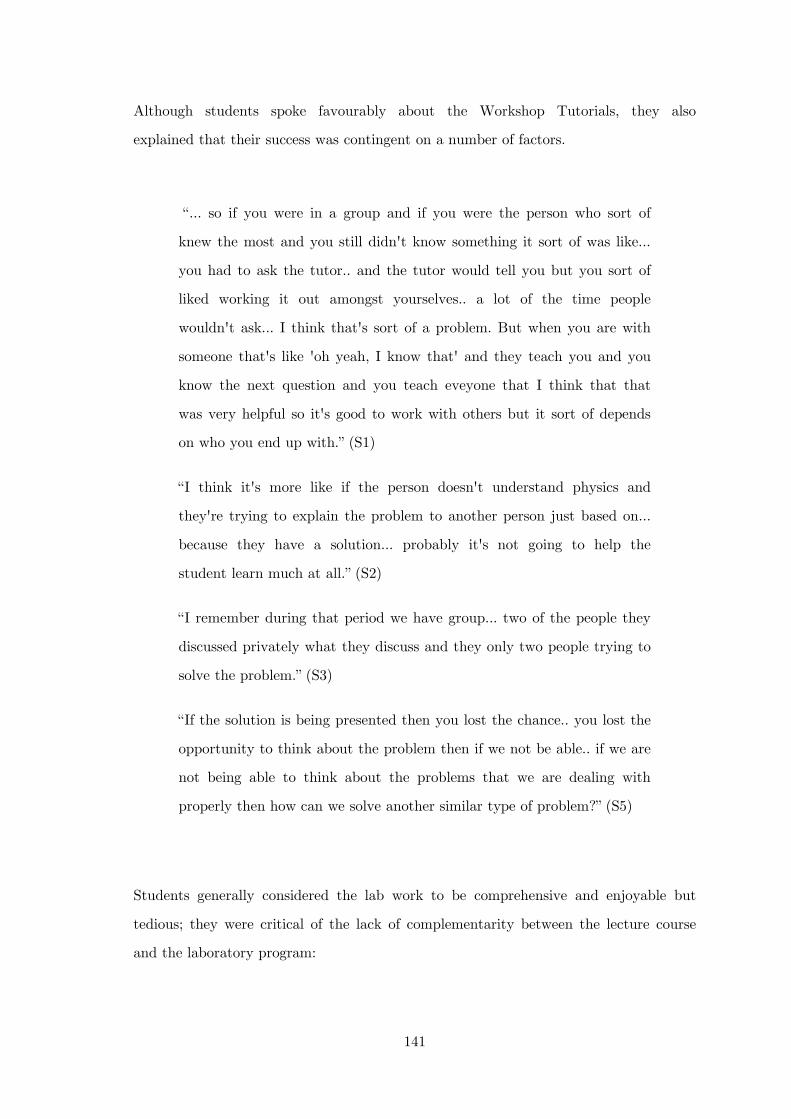
141
Although students spoke favourably about the Workshop Tutorials, they also
explained that their success was contingent on a number of factors.
“… so if you were in a group and if you were the person who sort of
knew the most and you still didn't know something it sort of was like...
you had to ask the tutor.. and the tutor would tell you but you sort of
liked working it out amongst yourselves.. a lot of the time people
wouldn't ask... I think that's sort of a problem. But when you are with
someone that's like 'oh yeah, I know that' and they teach you and you
know the next question and you teach eveyone that I think that that
was very helpful so it's good to work with others but it sort of depends
on who you end up with.” (S1)
“I think it's more like if the person doesn't understand physics and
they're trying to explain the problem to another person just based on…
because they have a solution… probably it's not going to help the
student learn much at all.” (S2)
“I remember during that period we have group... two of the people they
discussed privately what they discuss and they only two people trying to
solve the problem.” (S3)
“If the solution is being presented then you lost the chance.. you lost the
opportunity to think about the problem then if we not be able.. if we are
not being able to think about the problems that we are dealing with
properly then how can we solve another similar type of problem?” (S5)
Students generally considered the lab work to be comprehensive and enjoyable but
tedious; they were critical of the lack of complementarity between the lecture course
and the laboratory program:
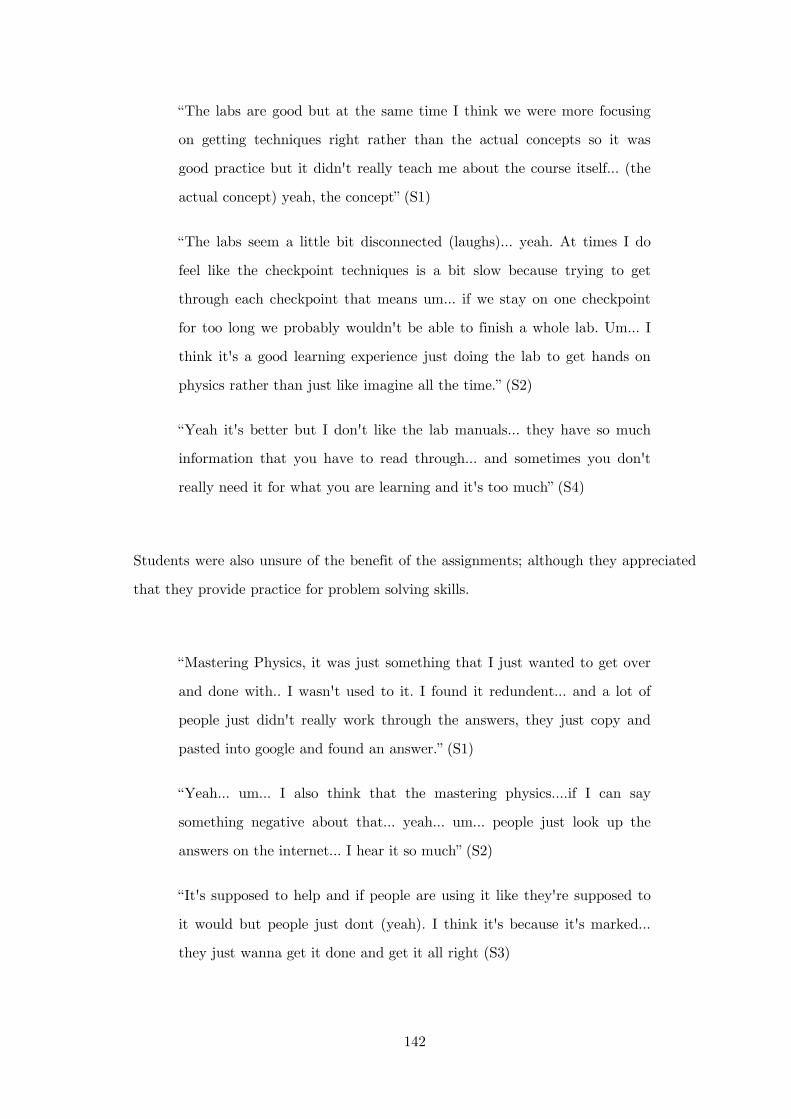
142
“The labs are good but at the same time I think we were more focusing
on getting techniques right rather than the actual concepts so it was
good practice but it didn't really teach me about the course itself... (the
actual concept) yeah, the concept” (S1)
“The labs seem a little bit disconnected (laughs)… yeah. At times I do
feel like the checkpoint techniques is a bit slow because trying to get
through each checkpoint that means um... if we stay on one checkpoint
for too long we probably wouldn't be able to finish a whole lab. Um... I
think it's a good learning experience just doing the lab to get hands on
physics rather than just like imagine all the time.” (S2)
“Yeah it's better but I don't like the lab manuals... they have so much
information that you have to read through... and sometimes you don't
really need it for what you are learning and it's too much” (S4)
Students were also unsure of the benefit of the assignments; although they appreciated
that they provide practice for problem solving skills.
“Mastering Physics, it was just something that I just wanted to get over
and done with.. I wasn't used to it. I found it redundent... and a lot of
people just didn't really work through the answers, they just copy and
pasted into google and found an answer.” (S1)
“Yeah… um... I also think that the mastering physics....if I can say
something negative about that... yeah... um... people just look up the
answers on the internet... I hear it so much” (S2)
“It's supposed to help and if people are using it like they're supposed to
it would but people just dont (yeah). I think it's because it's marked...
they just wanna get it done and get it all right (S3)
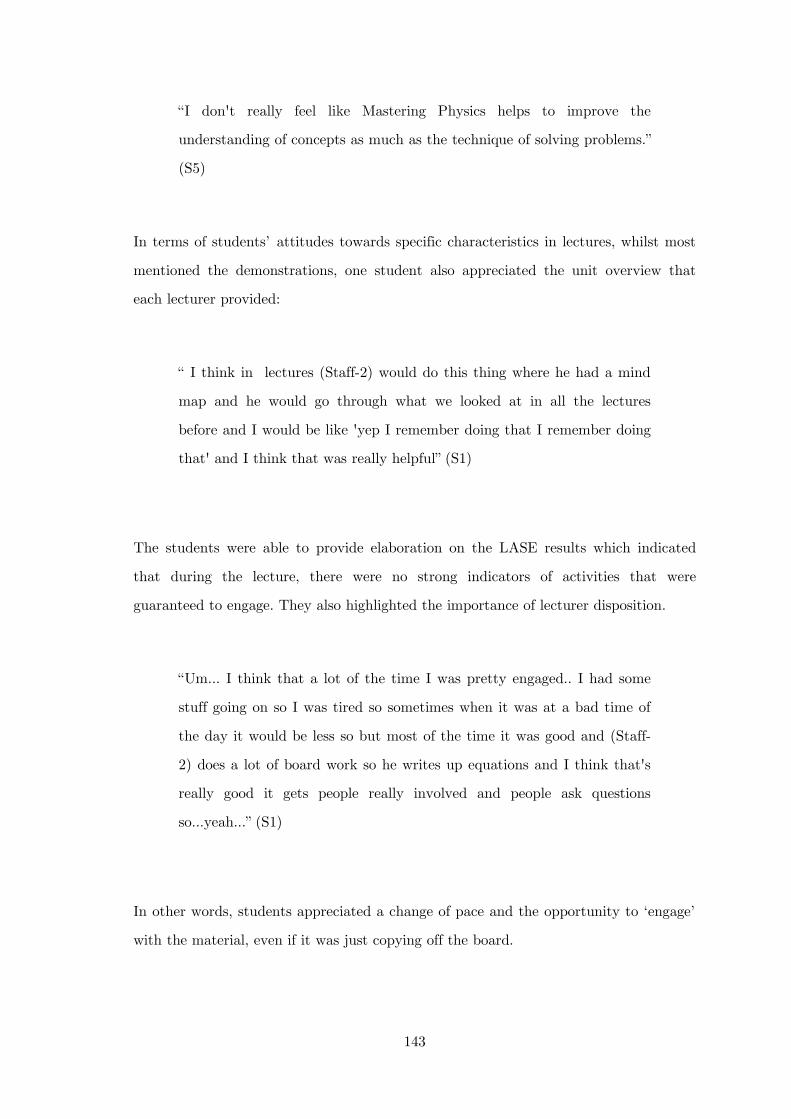
143
“I don't really feel like Mastering Physics helps to improve the
understanding of concepts as much as the technique of solving problems.”
(S5)
In terms of students’ attitudes towards specific characteristics in lectures, whilst most
mentioned the demonstrations, one student also appreciated the unit overview that
each lecturer provided:
“ I think in lectures (Staff-2) would do this thing where he had a mind
map and he would go through what we looked at in all the lectures
before and I would be like 'yep I remember doing that I remember doing
that' and I think that was really helpful” (S1)
The students were able to provide elaboration on the LASE results which indicated
that during the lecture, there were no strong indicators of activities that were
guaranteed to engage. They also highlighted the importance of lecturer disposition.
“Um... I think that a lot of the time I was pretty engaged.. I had some
stuff going on so I was tired so sometimes when it was at a bad time of
the day it would be less so but most of the time it was good and (Staff-
2) does a lot of board work so he writes up equations and I think that's
really good it gets people really involved and people ask questions
so...yeah...” (S1)
In other words, students appreciated a change of pace and the opportunity to ‘engage’
with the material, even if it was just copying off the board.
144
“To be honest, last semester in thermodynamics I ... the lecturer was
very soft toned and um.. if feels like someone is telling you a bedtime
story… it's like into a lecture, like probably 20 or 30 minutes and I'm
like (pretends to sleep, laughs)” (S3)
When asked what a lecturer could do to guarantee or facilitate student engagement,
one student remarked:
“Well if he's doing an experiment he'll ask us like 'why it happened like
that' and 'can you explain that' and that forces us to think about it
rather than he just explains that to us...” (S2)
Which was a theme echoed from the comments about the tutorial also; students
appreciated ‘working it out for themselves’ (as long as the material was not too
difficult), rather than the demonstrators providing them with the answers:
“But for the lecture slides, probably it's not a good idea... um... to just
have the slides there for students to have it cause in a way... I think it's
normal for people to actually … cause they think it's there... they
probably don't pay much attention to the lectures” (S1)
“I think it's important for the lecture to engage the student and they
just kept going through the things on their own. I know they’re a nice
person but if you're not engaging your student and just talking by
yourself they will never learn anything unless... I spoke to other students
and they feel the same way... but .. you know I understand that they...
the lecturers have their limitations as well! (Laughs)” (S2)
145
In terms of the ILD activities themselves, as with most evaluation surveys, students
are quick to point out that the demonstrations are the ‘best bits’. However, it is too
crude to accept these statements wholesale. That is, often students say they enjoy the
demonstrations the most because they stood out the most; they were the most explicit
and easily communicated and compartmentalised activity. During these interviews,
students were further questioned for details.
S3: Like the demos were really good
H: So can you tell me a bit more about them
S3: The models were really easy to understand and they were pretty
good and sometimes going to the lectures to just see the demo that some
friend told me that was really really useful to really udnerstand that
concepts ....
Students also articulated why or if the ILDs were different to ‘regular’ Demonstrations.
“Um... the ones that... well definitely the ones that made you think of
course were a lot more helpful because they develop your sense of
understanding and you think of a question but the ones that they just
show at the front they were also really good because it’s... sometimes it
was fun so it's a good way to remember a concept and yeah... so like…
both were pretty good but in terms of probably learning… the ones that
they gave us… that we had to make predictions were probably more
useful.” (S1)
“They're (regular Demonstrations) probably not really directly like not
really um... a method for teaching but really its the questions that we
kind of think about why things are the way they are that makes us...
146
helps us relate a concept we've learned but there's still quite a
distinction between contextually seeing things and seeing things. They
(ILDs/demonstrations) do that –different levels of impact.” (S2)
“OK, well last semester I found the Demonstration questions in the
tutorials really helpful. Because it was really easy to actually see what
was going on and yeah.” (S3)
“Yeah and I think that's um.. actually really good because it means
everyone is really focused and um… yeah... it's um, a lot easier to
concentrate that way and follow what's going on and stuff” (S4)
One student also highlighted the risk of losing interest because of the freedom to speak
with peers that the ILDs allow:
“Um, just if we are given too much time to ourselves to think about
things or too much time to discuss with our neighbour and that sort of
thing it's sort of off-putting a little bit. It makes us drift and talk about
other things” (S2)
8.5 Discussion
The second iteration of this study, in 2012, saw the same overall course gains than
2011. However, due to improvements in research design, a more appropriate measure of
gain was employed to determine if there were any differences between the four streams.
Using the normalized gain measurement, ILD1 showed the most gain, 0.40, followed
ILD2 with 0.34 and EX1 and EX2 with gains of 0.28 and 0.27 respectively. According
to the thresholds indicated on Hake plots, the gain for ILD1 is considered ‘very high’
although the other three gains are also in the ‘high’ area. Although there was no
statistically significant difference in means in the pre-test scores, the post-test scores
147
did differ (Table 8-6). There was also a difference in the distribution of the scores, with
ILD1 having a higher proportion of students in the 70-79% bracket and a much lower
proportion in the 40-49% bracket.
Extensive exploration was conducted to account for this outstanding result. The first
assertion is that increasing interactivity results in increases in learning gains. However,
if this was the case, ILD2 should have seen similar gains to ILD1. There are two
reasons that may explain this, according to the data presented above in quantitative
and qualitative analyses:
1. The ‘pedagogical researcher effect’: This effect postulates that a
gain in one implementation of ILDs and not the other was due to
the lecturer with a background in PER or pedagogical research
being able to implement the IE technique more successfully. A
more successful implementation involved a greater amount of
‘Interactive’ time and a greater quality of time spent on ILDs.
These results, as measured by the LASE and the student
evaluations, show that, firstly, ILD1 implemented more
‘Interactive teaching’. Interactive teaching occurred in the non-
experiment lectures as well as the lectures when the ILDs were
taking place. That is, ILD1 featured more time spent on the ILDs
themselves when compared with ILD2 but also encouraged
interactivity in other teaching. The quality of the interactive time
on the ILDs was gauged through student evaluation forms, which
indicated that students believed there was not enough time for
discussion in ILD2 and that the activities seemed ‘rushed’.
Students in ILD1 also reported more positively on seemingly
unrelated measures. For example, ILD1 students scored higher on
whether the questions were ‘clear and well put’. They also scored
higher on understanding of several concepts: heat and
temperature, the first law of thermodynamics, thermal processes
148
and heat engines; the latter attracting over 20% more students in
the affirmative for understanding. Most significantly, however,
was the improvement in perception of general outcomes: the
perceptions of ILD1 students overwhelmingly surpassed those of
ILD2 when asked whether ‘making predictions beforehand helped
me realise my misconceptions’ and ‘the conclusion after each ILD
made me understand the concept better’. This indicates that the
vast majority of students in ILD1 (around 90%) agreed that the
ILD specific activities of prediction and recording lead to greater
understanding. The differences in the lecturer approach to the
ILDs also manifested itself in the Student Engagement analysis,
where there were a markedly lower proportion of students
‘participating’ in the ILDs, particularly in the Peer Instruction
portion. Such data supports the assertion that the way a lecturer
implements an IE technique is not necessarily uniform and that
this has real and significant implications for supporters of IE
techniques. That is, many different types of lecturers will attempt
to introduce new techniques in their teaching but unless these
techniques are implemented as intended, Active Learning is not
guaranteed. This may be an important finding for supporting the
reporting of and justifying null results in the literature (Georgiou
& Sharma, 2012). It is also an important finding for course
designers and instructors: a particular activity may not be
consumed in the way it is intended. Student interviews revealed
that this was already the case in other aspects of the course: if
tutorials groups weren’t appropriate, learning was not facilitated
and it was easy to bypass the ‘Just in time’ teaching built into
the online Mastering Physics assignments by looking up the
answers online.
2. The ‘Engineers’ effect: that Engineer’s may not be as open to
participating to Active Learning environments as students in
149
other degree programs are. The first explanation does not fully
explain why there was no difference in learning outcomes in 2011.
One suggestion, that there was not a sufficiently homogenous
sample to begin with, is an option. It may also be the case the all
lecturers needed to sufficiently familiarise themselves with the IE
techniques used. There is evidence to indicate instead that
engineers might be less receptive to the ILD techniques. For
example, when considering attendance, in 2011 the stream with
the most engineers displayed the sharpest decline in attendance
for non-experiment lectures (these were the lectures with no mark
allocation). When considering the attendances as recorded by the
Exercise and ILD sheets, again, Engineering students were
participating less. The exam results also show that Engineering
students performed statistically significantly better on calculation
or very quantitative questions, supporting the claim that they are
less interested in the ‘conceptual’ understanding emphasised by
the ILDs and IE techniques in general. Further examination
shows that the degree enrolled in does correlate to outcome
measures, although none of these measures were thermodynamics-
related. Although nothing conclusive can be asserted at this
point, the attitude of Engineers versus Science students towards
the first year course would be an interesting avenue to pursue in
the future.
The other possibility is, of course, that there was no difference in learning outcomes
because the improvements in the TCS for ILD1 were not mirrored in any of the other
learning outcomes. Indeed, it can be argued that since students received marks for
completion rather than individual responses on the TCS, they may not have invested
as much effort in completing the test and therefore the final exam is a better measure
of learning outcome. A criticism of such a statement might exploit literature on
conceptual surveys, which explains that they should not be treated as regular course

150
assessment but rather, they have a specific purpose which is to clearly and uniquely
address known difficulties in thermodynamics. Questions in the final exam will also not
necessarily cover all or even most of the content.
There are also improvements that are possible with the LASE that may add detail in
the analysis. For example, the Lecture Activity analysis relied on coding of only six
categories because this was deemed appropriate for the purposes of determining how
much interactivity is driven by lecturers during lectures. However, as the expanded
analysis of the Transmission-Style category shows, these categories do not reflect
homogenous activities. It is important to stress that without all aspects of the LASE,
including field notes, conclusions may be more difficult to substantiate. For example,
the finding that Staff-1 drove more Interactivity in their class was substantiated by the
Lecture Activity coding, further substantiated through transcription, then triangulated
through data from the Student Engagement part of the tool and again supported by
evidence from student evaluation and student interviews. In other words, one should
always be cautious about any claims being made as a consequence this coding.
Finally, it should also be noted that although the thermodynamics course is by all
accounts a successful one when comparing gains with international counterparts and
when considering student attitudes, it is still noted that students, on average, are not
necessarily performing remarkably. When considering the thermodynamics questions on
the final exam, for example, the cohort average was 9.65 (SD=5.57) out of a possible
25. Question 10, a thermodynamics question, showed the lowest average marks in the
entire exam. Such observations reinforce the need to understand more fully why
students find thermodynamics so difficult.
151
9 Introduction to Part Two: Student
Understanding
It is clear from the measurements of learning outcomes from Part One of this project
and the literature that there are still some fundamental and robust difficulties
experienced by students in thermodynamics. It is also clear that even after standard
(or purposely designed) instructional techniques, a very ‘patchy’ and tenuous
understanding of thermodynamics is the best that can be achieved for the majority of
students. In Part One, student understanding was simply gauged by global
quantitative measures; the TCS and final exam marks. These measures were useful in
signalling two very broad conclusions: firstly, that intentional instructional changes
may improve conceptual understanding (indicated by different gains on the TCS) and
secondly, that significant difficulties still exist (indicated by modest achievement on
the TCS and sub-par achievement in the final exam). In Part Two, these broad
conclusions will be further examined. Chapter 10 will focus on employing existing
methods, including item analysis on the TCS and thematic coding on the Interactive
Exercises, to provide insights into where these difficulties lay and how universal and
resistant they were.
Chapter 11 takes a different approach: Legitimation Code Theory. LCT was utilised to
overcome existing limitations in methodologies and as such, the original challenges in
working with these methodologies, specifically, SOLO and Phenomenography, are
chronicled. The application of Legitimation Code Theory was itself a trial. Through the
presentation of the LCT analysis, it will be shown how theoretical, as well as
methodological improvements were also achieved. These theoretical aspects are
primarily based on foregrounding ‘knowledge’ rather than ‘knowing’ or ‘the knower’
and therefore require adopting a different perspective on student understanding. It will
be shown how taking this viewpoint opens up promising avenues when considering not
only the development of ways to gauge student understanding, but also on the
interplay between student understanding and instructional practice.

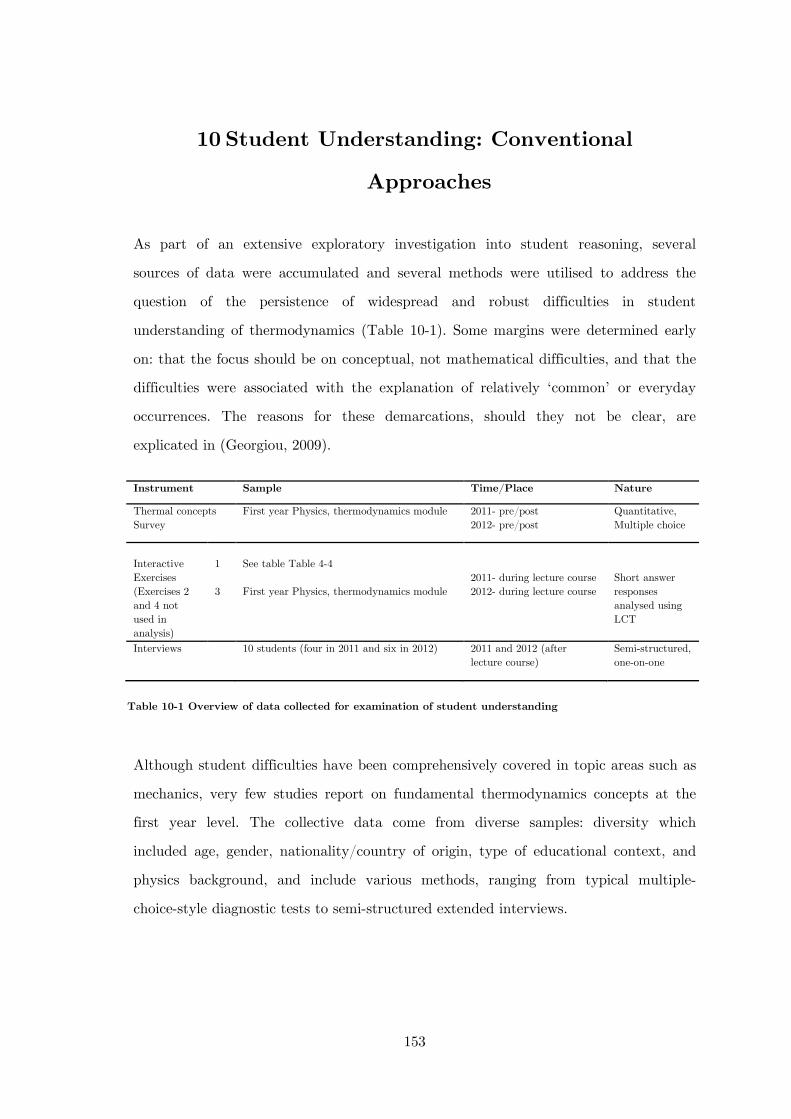
153
10 Student Understanding: Conventional
Approaches
As part of an extensive exploratory investigation into student reasoning, several
sources of data were accumulated and several methods were utilised to address the
question of the persistence of widespread and robust difficulties in student
understanding of thermodynamics (Table 10-1). Some margins were determined early
on: that the focus should be on conceptual, not mathematical difficulties, and that the
difficulties were associated with the explanation of relatively ‘common’ or everyday
occurrences. The reasons for these demarcations, should they not be clear, are
explicated in (Georgiou, 2009).
Although student difficulties have been comprehensively covered in topic areas such as
mechanics, very few studies report on fundamental thermodynamics concepts at the
first year level. The collective data come from diverse samples: diversity which
included age, gender, nationality/country of origin, type of educational context, and
physics background, and include various methods, ranging from typical multiple-
choice-style diagnostic tests to semi-structured extended interviews.
Instrument Sample Time/Place Nature
Thermal concepts Survey
First year Physics, thermodynamics module 2011- pre/post 2012- pre/post
Quantitative, Multiple choice
Interactive Exercises (Exercises 2 and 4 not used in analysis)
1
See table Table 4-4
3
First year Physics, thermodynamics module
2011- during lecture course 2012- during lecture course
Short answer responses analysed using LCT
Interviews 10 students (four in 2011 and six in 2012) 2011 and 2012 (after lecture course)
Semi-structured, one-on-one
Table 10-1 Overview of data collected for examination of student understanding
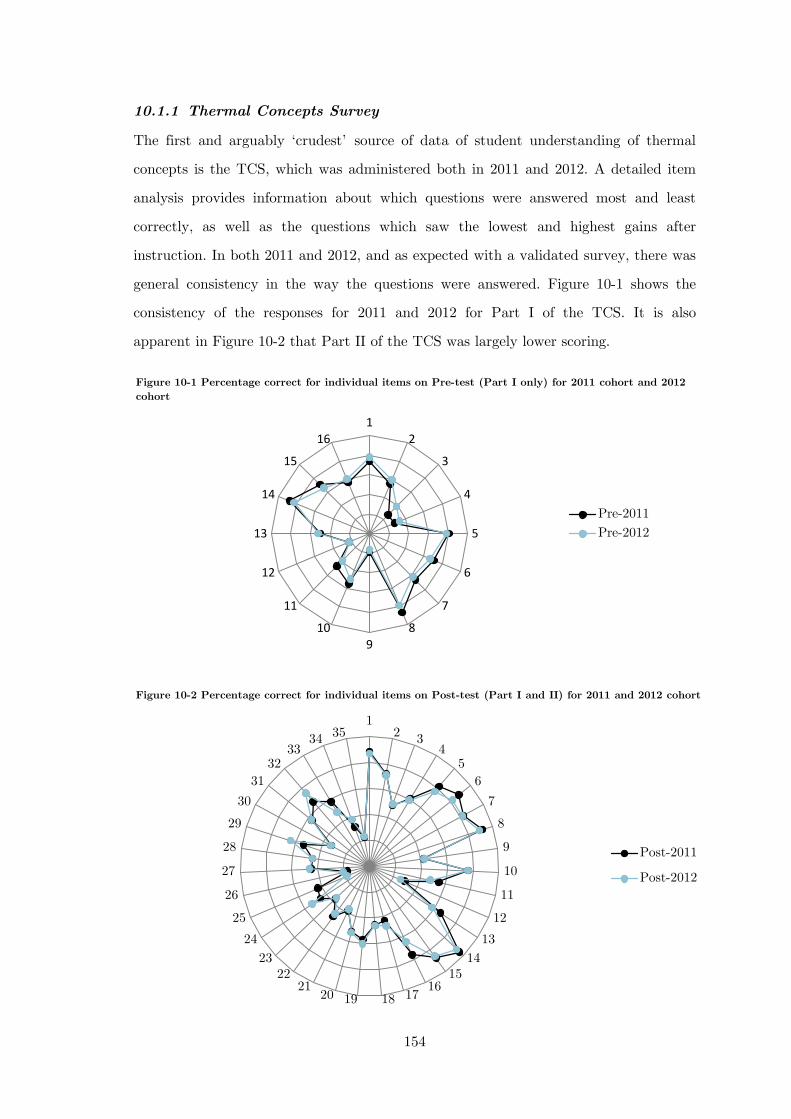
154
10.1.1 Thermal Concepts Survey
The first and arguably ‘crudest’ source of data of student understanding of thermal
concepts is the TCS, which was administered both in 2011 and 2012. A detailed item
analysis provides information about which questions were answered most and least
correctly, as well as the questions which saw the lowest and highest gains after
instruction. In both 2011 and 2012, and as expected with a validated survey, there was
general consistency in the way the questions were answered. Figure 10-1 shows the
consistency of the responses for 2011 and 2012 for Part I of the TCS. It is also
apparent in Figure 10-2 that Part II of the TCS was largely lower scoring.
1 2
3
4
5
6
7
8 9
10
11
12
13
14
15
16
Pre-2011 Pre-2012
Figure 10-1 Percentage correct for individual items on Pre-test (Part I only) for 2011 cohort and 2012 cohort
1 2 3
4 5
6 7
8
9
10
11
12 13
14 15
16 17 18 19 20 21 22
23 24
25
26
27
28
29
30 31
32 33
34 35
Post-2011
Post-2012
Figure 10-2 Percentage correct for individual items on Post-test (Part I and II) for 2011 and 2012 cohort
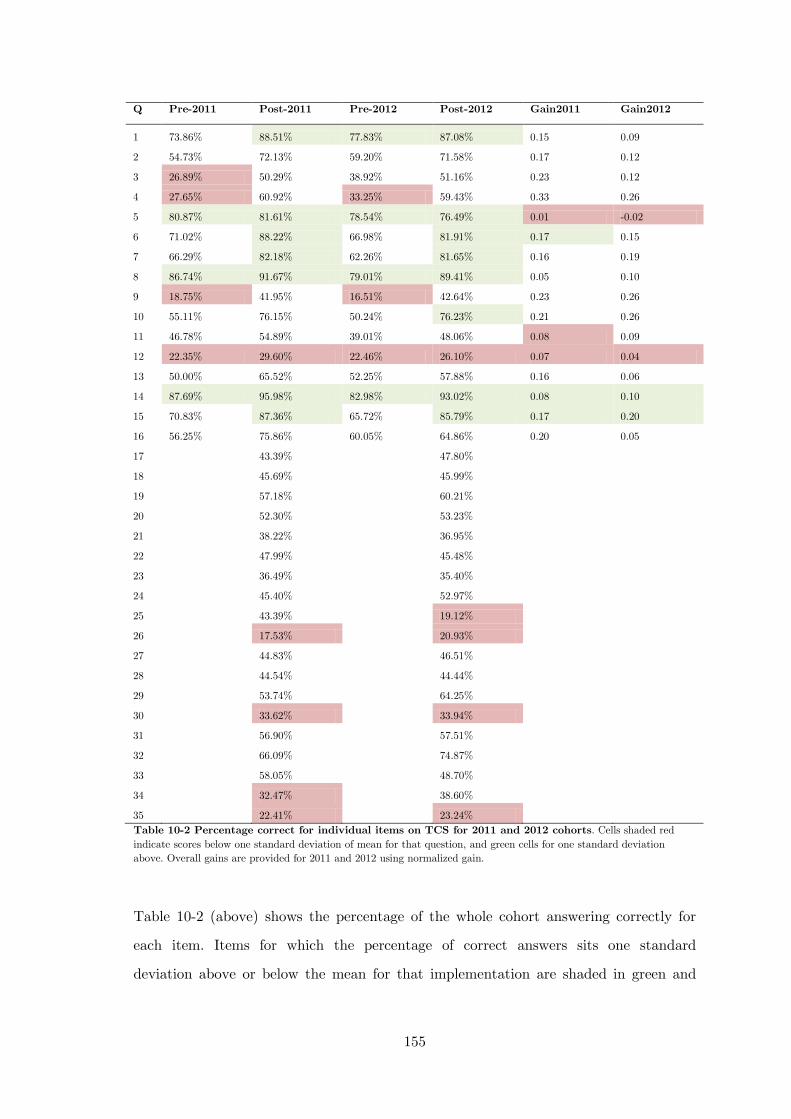
155
Q Pre-2011 Post-2011 Pre-2012 Post-2012 Gain2011 Gain2012
1 73.86% 88.51% 77.83% 87.08% 0.15 0.09
2 54.73% 72.13% 59.20% 71.58% 0.17 0.12
3 26.89% 50.29% 38.92% 51.16% 0.23 0.12
4 27.65% 60.92% 33.25% 59.43% 0.33 0.26
5 80.87% 81.61% 78.54% 76.49% 0.01 -0.02
6 71.02% 88.22% 66.98% 81.91% 0.17 0.15
7 66.29% 82.18% 62.26% 81.65% 0.16 0.19
8 86.74% 91.67% 79.01% 89.41% 0.05 0.10
9 18.75% 41.95% 16.51% 42.64% 0.23 0.26
10 55.11% 76.15% 50.24% 76.23% 0.21 0.26
11 46.78% 54.89% 39.01% 48.06% 0.08 0.09
12 22.35% 29.60% 22.46% 26.10% 0.07 0.04
13 50.00% 65.52% 52.25% 57.88% 0.16 0.06
14 87.69% 95.98% 82.98% 93.02% 0.08 0.10
15 70.83% 87.36% 65.72% 85.79% 0.17 0.20
16 56.25% 75.86% 60.05% 64.86% 0.20 0.05
17
43.39%
47.80% 18
45.69%
45.99%
19
57.18%
60.21% 20
52.30%
53.23%
21
38.22%
36.95% 22
47.99%
45.48%
23
36.49%
35.40% 24
45.40%
52.97%
25
43.39%
19.12% 26
17.53%
20.93%
27
44.83%
46.51% 28
44.54%
44.44%
29
53.74%
64.25% 30
33.62%
33.94%
31
56.90%
57.51% 32
66.09%
74.87%
33
58.05%
48.70% 34
32.47%
38.60%
35
22.41%
23.24% Table 10-2 Percentage correct for individual items on TCS for 2011 and 2012 cohorts. Cells shaded red
indicate scores below one standard deviation of mean for that question, and green cells for one standard deviation above. Overall gains are provided for 2011 and 2012 using normalized gain.
Table 10-2 (above) shows the percentage of the whole cohort answering correctly for
each item. Items for which the percentage of correct answers sits one standard
deviation above or below the mean for that implementation are shaded in green and
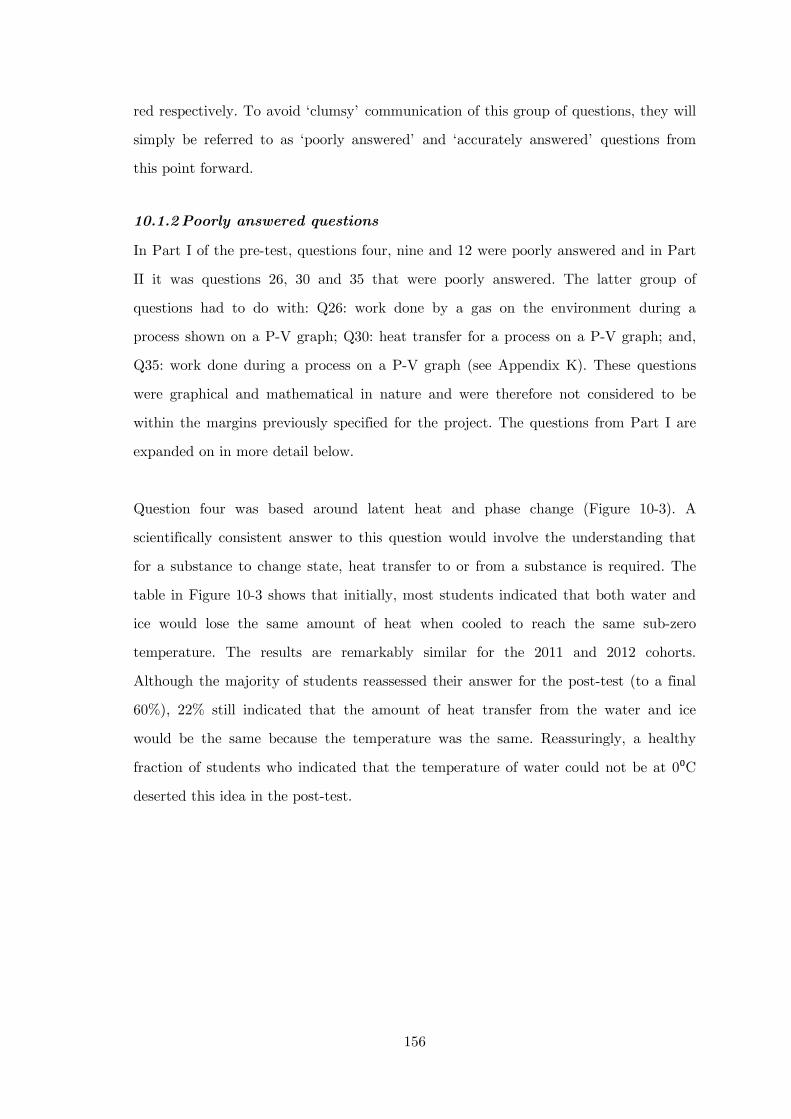
156
red respectively. To avoid ‘clumsy’ communication of this group of questions, they will
simply be referred to as ‘poorly answered’ and ‘accurately answered’ questions from
this point forward.
10.1.2 Poorly answered questions
In Part I of the pre-test, questions four, nine and 12 were poorly answered and in Part
II it was questions 26, 30 and 35 that were poorly answered. The latter group of
questions had to do with: Q26: work done by a gas on the environment during a
process shown on a P-V graph; Q30: heat transfer for a process on a P-V graph; and,
Q35: work done during a process on a P-V graph (see Appendix K). These questions
were graphical and mathematical in nature and were therefore not considered to be
within the margins previously specified for the project. The questions from Part I are
expanded on in more detail below.
Question four was based around latent heat and phase change (Figure 10-3). A
scientifically consistent answer to this question would involve the understanding that
for a substance to change state, heat transfer to or from a substance is required. The
table in Figure 10-3 shows that initially, most students indicated that both water and
ice would lose the same amount of heat when cooled to reach the same sub-zero
temperature. The results are remarkably similar for the 2011 and 2012 cohorts.
Although the majority of students reassessed their answer for the post-test (to a final
60%), 22% still indicated that the amount of heat transfer from the water and ice
would be the same because the temperature was the same. Reassuringly, a healthy
fraction of students who indicated that the temperature of water could not be at 0⁰C
deserted this idea in the post-test.
157
Question 4: If 100g of ice at 0⁰C and 100g of water at 0⁰C are put into a
freezer, which has a temperature below 0⁰C. After waiting until their
temperature equals to the freezer temperature, which one will eventually lose the
greatest amount of heat?
2012-pre 2012-post ice 7% 7% water 33% 60% same because T same 37% 22% no answer because ice has no heat 1% 2% no answer because water cannot be at T=0⁰C 17% 9% Total (N) 424 387
Question nine was based on the pressure of an ideal gas (Figure 10-4). A scientifically
consistent answer to this question would involve the understanding that the system is
at mechanical equilibrium with its surroundings and since the piston in the cylinder is
frictionless, the pressure of the gas will always be equal to atmospheric pressure. The
table in Figure 10-4 shows that, initially, an overwhelming majority of students (57%)
indicated that the pressure would increase. About half of the students abandoned this
conception after instruction for the scientifically correct response of ‘no change’,
meaning that the percentage of students selecting the correct answer rose from 17% to
43%.
Figure 10-3 Question four of the TCS with pre- and post- test scores
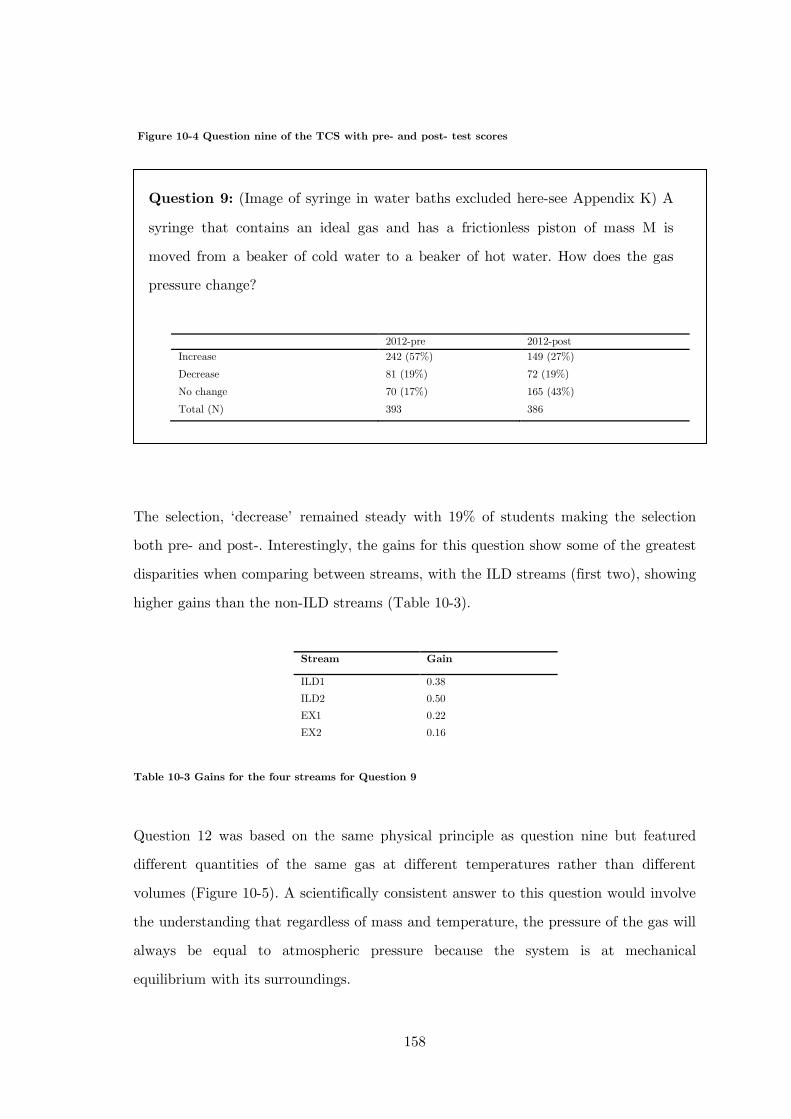
158
Question 9: (Image of syringe in water baths excluded here-see Appendix K) A
syringe that contains an ideal gas and has a frictionless piston of mass M is
moved from a beaker of cold water to a beaker of hot water. How does the gas
pressure change?
2012-pre 2012-post Increase 242 (57%) 149 (27%)
Decrease 81 (19%) 72 (19%)
No change 70 (17%) 165 (43%)
Total (N) 393 386
The selection, ‘decrease’ remained steady with 19% of students making the selection
both pre- and post-. Interestingly, the gains for this question show some of the greatest
disparities when comparing between streams, with the ILD streams (first two), showing
higher gains than the non-ILD streams (Table 10-3).
Stream Gain
ILD1 0.38 ILD2 0.50 EX1 0.22 EX2 0.16
Table 10-3 Gains for the four streams for Question 9
Question 12 was based on the same physical principle as question nine but featured
different quantities of the same gas at different temperatures rather than different
volumes (Figure 10-5). A scientifically consistent answer to this question would involve
the understanding that regardless of mass and temperature, the pressure of the gas will
always be equal to atmospheric pressure because the system is at mechanical
equilibrium with its surroundings.
Figure 10-4 Question nine of the TCS with pre- and post- test scores
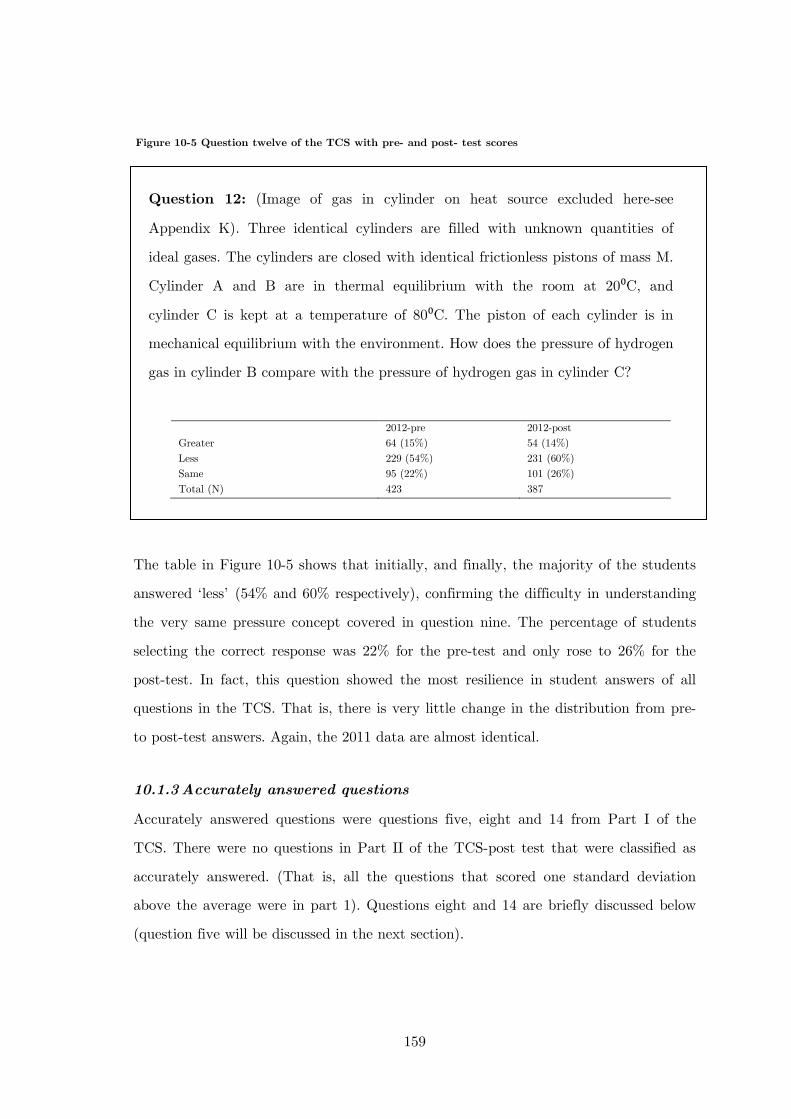
159
Question 12: (Image of gas in cylinder on heat source excluded here-see
Appendix K). Three identical cylinders are filled with unknown quantities of
ideal gases. The cylinders are closed with identical frictionless pistons of mass M.
Cylinder A and B are in thermal equilibrium with the room at 20⁰C, and
cylinder C is kept at a temperature of 80⁰C. The piston of each cylinder is in
mechanical equilibrium with the environment. How does the pressure of hydrogen
gas in cylinder B compare with the pressure of hydrogen gas in cylinder C?
2012-pre 2012-post Greater 64 (15%) 54 (14%) Less 229 (54%) 231 (60%) Same 95 (22%) 101 (26%) Total (N) 423 387
The table in Figure 10-5 shows that initially, and finally, the majority of the students
answered ‘less’ (54% and 60% respectively), confirming the difficulty in understanding
the very same pressure concept covered in question nine. The percentage of students
selecting the correct response was 22% for the pre-test and only rose to 26% for the
post-test. In fact, this question showed the most resilience in student answers of all
questions in the TCS. That is, there is very little change in the distribution from pre-
to post-test answers. Again, the 2011 data are almost identical.
10.1.3 Accurately answered questions
Accurately answered questions were questions five, eight and 14 from Part I of the
TCS. There were no questions in Part II of the TCS-post test that were classified as
accurately answered. (That is, all the questions that scored one standard deviation
above the average were in part 1). Questions eight and 14 are briefly discussed below
(question five will be discussed in the next section).
Figure 10-5 Question twelve of the TCS with pre- and post- test scores
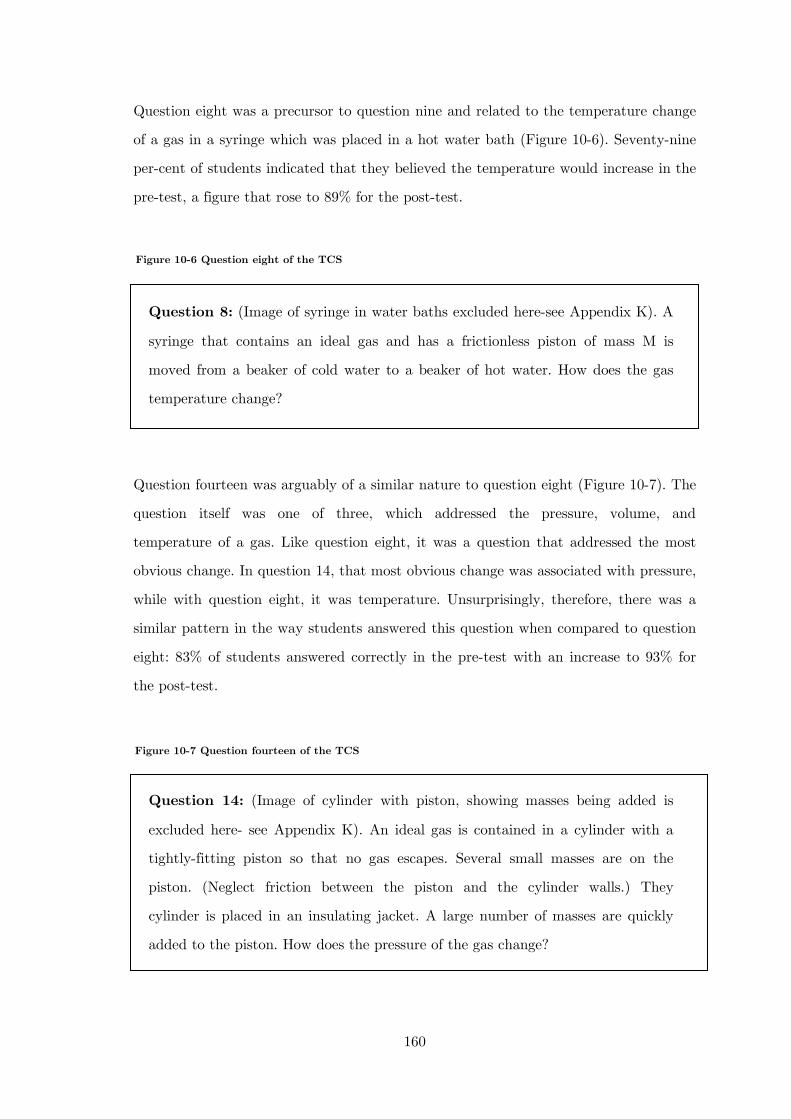
160
Question eight was a precursor to question nine and related to the temperature change
of a gas in a syringe which was placed in a hot water bath (Figure 10-6). Seventy-nine
per-cent of students indicated that they believed the temperature would increase in the
pre-test, a figure that rose to 89% for the post-test.
Question 8: (Image of syringe in water baths excluded here-see Appendix K). A
syringe that contains an ideal gas and has a frictionless piston of mass M is
moved from a beaker of cold water to a beaker of hot water. How does the gas
temperature change?
Question fourteen was arguably of a similar nature to question eight (Figure 10-7). The
question itself was one of three, which addressed the pressure, volume, and
temperature of a gas. Like question eight, it was a question that addressed the most
obvious change. In question 14, that most obvious change was associated with pressure,
while with question eight, it was temperature. Unsurprisingly, therefore, there was a
similar pattern in the way students answered this question when compared to question
eight: 83% of students answered correctly in the pre-test with an increase to 93% for
the post-test.
Question 14: (Image of cylinder with piston, showing masses being added is
excluded here- see Appendix K). An ideal gas is contained in a cylinder with a
tightly-fitting piston so that no gas escapes. Several small masses are on the
piston. (Neglect friction between the piston and the cylinder walls.) They
cylinder is placed in an insulating jacket. A large number of masses are quickly
added to the piston. How does the pressure of the gas change?
Figure 10-6 Question eight of the TCS
Figure 10-7 Question fourteen of the TCS
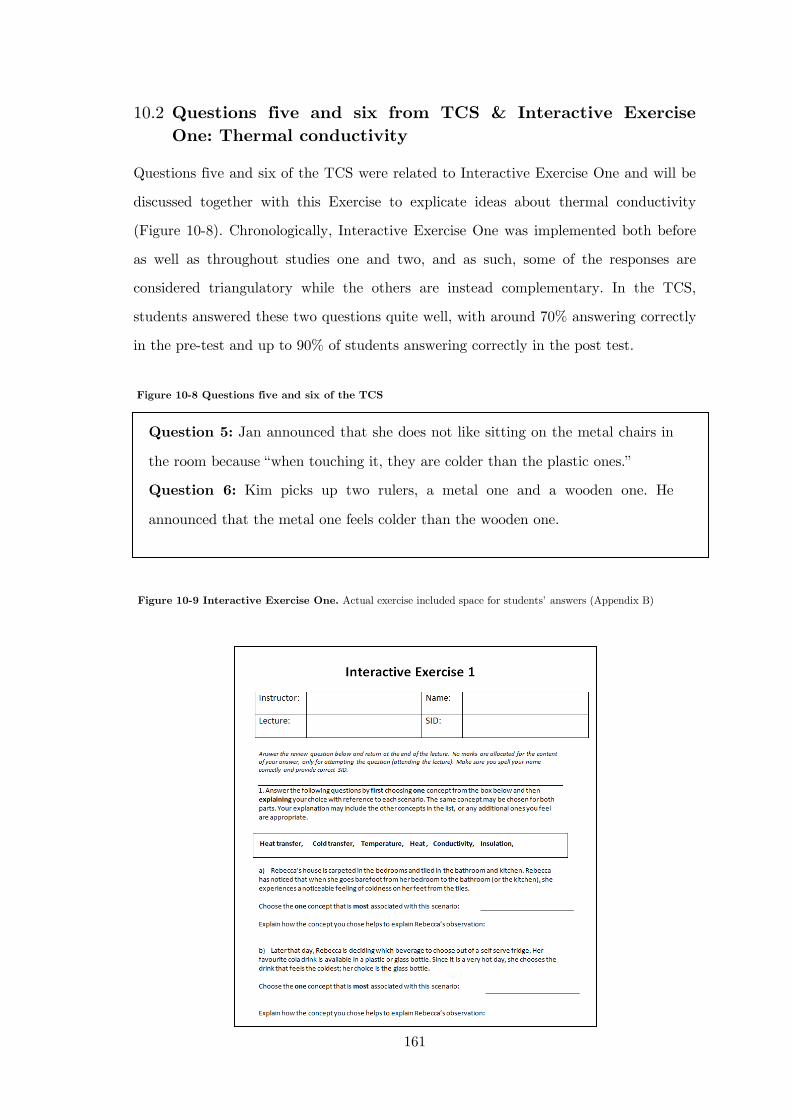
161
10.2 Questions five and six from TCS & Interactive Exercise One: Thermal conductivity
Questions five and six of the TCS were related to Interactive Exercise One and will be
discussed together with this Exercise to explicate ideas about thermal conductivity
(Figure 10-8). Chronologically, Interactive Exercise One was implemented both before
as well as throughout studies one and two, and as such, some of the responses are
considered triangulatory while the others are instead complementary. In the TCS,
students answered these two questions quite well, with around 70% answering correctly
in the pre-test and up to 90% of students answering correctly in the post test.
Question 5: Jan announced that she does not like sitting on the metal chairs in
the room because “when touching it, they are colder than the plastic ones.”
Question 6: Kim picks up two rulers, a metal one and a wooden one. He
announced that the metal one feels colder than the wooden one.
Figure 10-8 Questions five and six of the TCS
Figure 10-9 Interactive Exercise One. Actual exercise included space for students’ answers (Appendix B)

162
Group Year Institution Course/degree Student background No. Contact
US 2010 Curry College, Massachusetts,
Algebra-based first year Physics
Mostly no high school Physics
16 Jerry Touger
SGPRE 2010 Sydney Girls High school, NSW, Australia
Yr 8 (age:13/14) before and after completion of thermal physics coverage.
No formal thermal physics instruction, high socio-economic status school. Girls only.
57 Jeff Stanger
SGPOST 2010 60
MSW8 2010 Muswellbrook High School, NSW, Australia
Yr 8 (age:13/14) Co-Ed regional school students before thermal physics instruction
28 Andrew Roberts
MSW12 2010 Yr12 Physics class (age:17/18)
Co-Ed regional school students studying HSC Physics course
10
LDN13 2010 St Philomena’s Catholic High school for Girls, Surrey, England.
Yr 13 (age:17/18) final year (A-level) Physics
Girls only. Students have relatively strong backgrounds in science
6 Julie Di Rocco
LDN11 2010 Yr 11 (age 15/16) triple science, GSCE
29
CT1maj 2010 University of Cape Town, South Africa
First year mainstream Physics (1004W)
Students have physics background and intend to continue toward a Physics major
65 Andy Buffler
CT3rd 2010 Third year mainstream Physics (3021F)
Students who have performed well enough in second year to proceed to third
16
CT2nd 2010 Second year mainstream Physics (2014)
Students who have performed well enough in first year to proceed to second
20
CT1nov 2010 First year introductory course for non-majors
Students have diverse backgrounds. Mainly, students do not have a strong background in physics or science
77
SydMast 2009 University of Sydney, NSW, Australia
Master of Education Post graduate students in education
16
SydPri 2009 First year Primary Education
Students mainly without HSC Physics studying to be primary school teachers
63
SydAdv 2009 First year Physics Advanced
First year Physics students likely to major that performed well in the HSC or Physics
51
SydReg 2009 First year Physics regular
First year Physics students that could possibly major in Physics or Engineering students
345
SydFund 2009 First year Physics students Fundamentals
First year Physics students who did not complete Physics at high school and will most likely not be Physics majors
139
Greek 2010 University of Athens, Greece
Third year nursing students
65 Anna Kozak
Polish 2010 Zespol skol Zawodowych, Zgorzelec, Poland
High school students 17/18 year olds in math at a technical college (part of high school)
57
EX1-11 2011 University of Sydney, NSW, Australia
First year Physics regular
First year Physics students that could possibly major in Physics or Engineering students
90 EX2-11 2011 61 EX1-12 2012 83 EX2-12 2012 98 Table 10-4 Sample description for Interactive Exercise One
163
Interactive Exercise One is considered a context-rich problem and provided in full in
Figure 10-9. The various samples and years that this question was administered to can
be found in Table 10-4 (above)
The data consisted of categorical data (the selection of concept, which will be referred
to as the students’ ‘concept-choice’) and qualitative data which were coded
(thematically) for most of the sample.
The question is effectively presented as a single question with two parts and based on
the ideas behind questions five and six in the TCS: the ‘feeling’ of coldness when
touching objects made of different materials in thermal equilibrium. In both parts of
the question, a scientifically consistent answer would involve: a recognition that objects
that are in contact with each other or a common third object will have reached
thermal equilibrium after a reasonable amount of time; that the hand or foot is not a
food thermometer; and that a sensation of coldness is a result of the relative thermal
conductivity of a material. In part a) the situation involves bathroom or kitchen tiles
and bedroom carpets. In part b) the two objects are plastic and glass bottles in a self-
serve refrigerator. A suitable response then for part a) would be: ‘the tiles feel colder
because heat is transferred at a faster rate from the feet to the tiles than from the feet
to the carpet. The tiles and the carpet are both actually at the same temperature’.
The analysis of this question was multifaceted. Firstly there was the characterisation of
the students’ concept-choice across samples; secondly, there were also their
justifications for this concept-choice which were coded using thematic coding; and
lastly, the analysis is further enriched by having two analogous problems (with respect
to the physics involved), masked behind different surface features, which allowed
comparisons between the two.
164
10.2.1 Concept-choices and explanations
The concept-choice of the student is most informative when coupled with coding of
their responses. However, there were also some interesting ‘at-a-glance’ findings
regarding the choice of the concept alone.
Firstly, in all samples, some concept-choices were clearly more favoured than others.
This result was achieved by simply counting the concept-choices in NVivo for all
groups. ‘temperature’ and ‘heat’, typically the concepts mentioned first and most in
thermodynamics up to the junior high school level, were the least popular across the
sample. Concept-choice ‘heat’ was selected in 6.6% of responses across both parts of
the question and ‘temperature’, 5.7% (N=1625).
‘Cold transfer’ was the next most popular concept-choice, but, unlike ‘heat’ and
‘temperature’, it varied widely in its use across different samples. The notion that
‘cold’ as opposed to ‘heat’ can be transferred is reported widely as an alternative
conception. The reason that it is ‘alternative’ is that there is no physically distinct
entity known as ‘cold’, there are simply varying degrees of heat transfer or states of
matter that are described by temperature. The concept-choice query for part a) and
part b) for the concept-choice ‘cold transfer’ show that the prevalence of the concept
as a real concept is high in a number of the various groups sampled, particularly
amongst the younger novice groups (e.g., the year 8 science students from a rural NSW
school, MSW8, and the first year Cape Town group, CT1nonmaj). The selection of the
concept was absent in the English senior Physics class from London and the Advanced
first year Physics group from Sydney. That is, none of the students in either sample
selected ‘cold transfer’ for either part of the question (Figure 10-10).
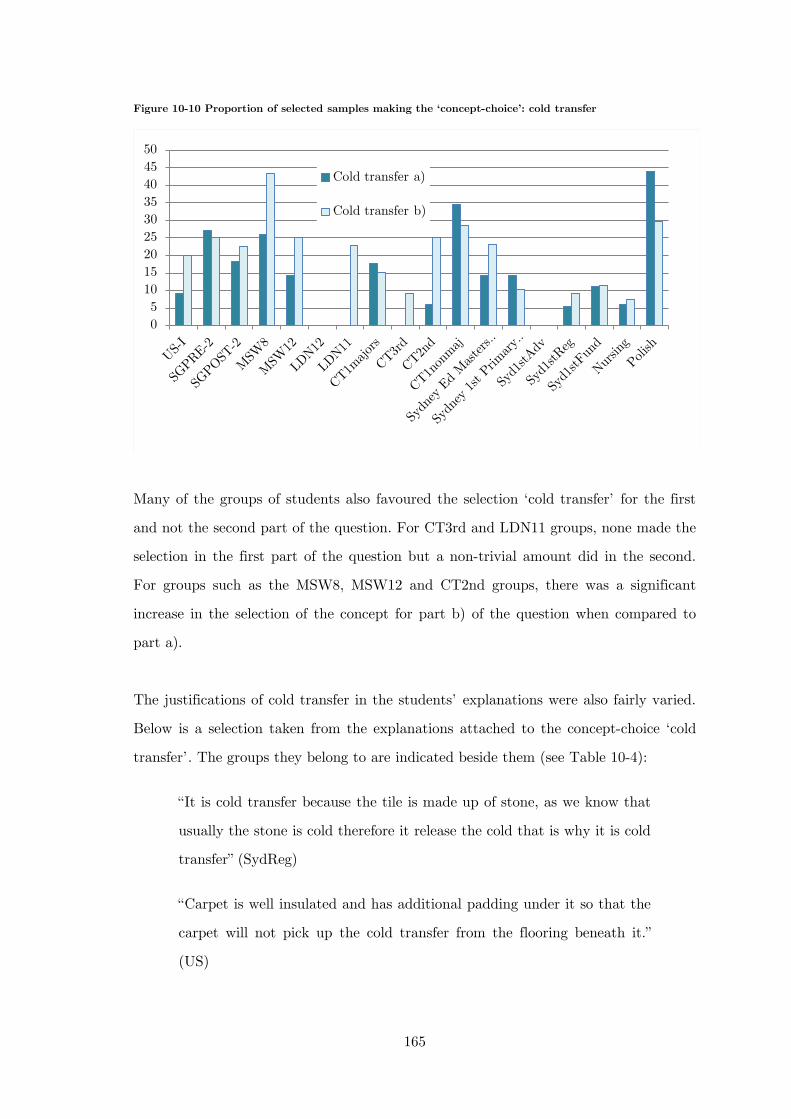
165
Figure 10-10 Proportion of selected samples making the ‘concept-choice’: cold transfer
Many of the groups of students also favoured the selection ‘cold transfer’ for the first
and not the second part of the question. For CT3rd and LDN11 groups, none made the
selection in the first part of the question but a non-trivial amount did in the second.
For groups such as the MSW8, MSW12 and CT2nd groups, there was a significant
increase in the selection of the concept for part b) of the question when compared to
part a).
The justifications of cold transfer in the students’ explanations were also fairly varied.
Below is a selection taken from the explanations attached to the concept-choice ‘cold
transfer’. The groups they belong to are indicated beside them (see Table 10-4):
“It is cold transfer because the tile is made up of stone, as we know that
usually the stone is cold therefore it release the cold that is why it is cold
transfer” (SydReg)
“Carpet is well insulated and has additional padding under it so that the
carpet will not pick up the cold transfer from the flooring beneath it.”
(US)
0 5
10 15 20 25 30 35 40 45 50
Cold transfer a)
Cold transfer b)
166
“Personally, I find that cold transfer is most associated with the scenario
because the surface of the glass is able to stay cool even in rather
uncomfortably hot weather.” (SGPRE)
“As she steps onto the tiles that are cold, the cold transfers from the tiles
over to her feet while stealing the warmth from Rebecca's foot” (MSW8)
“Her body temperature is higher (warm). So when she goes to the
bathroom without shoes she feels the cold because there is a temperature
difference. The cold goes to the warm so the process is cold transfer”
(SydReg)
“Conductivity is the transfer of thermal energy through contact. It is not
restricted to heat transfer, but also cold transfer. So the cold tiles
transfer their thermal energy, which in the case is very low to Rebecca's
feet” (SydReg)
These excerpts highlight the diversity of views represented by the ‘alternative
conception’ of cold transfer. In fact, excerpt five actually blends the ‘cold transfer’
concept with the ‘scientifically consistent’ concept of heat transfer, while excerpt six
actually states the first law of thermodynamics, albeit in an irregular form: ‘the cold
goes to the warm’. The use of cold and heat transfer interchangeably brings into
question the significance of the ‘alternative conception’ of cold transfer and confirms
the variability of the conception.
Further examination was conducted into the combinations of concept-choices between
part a) and part b), particularly with respect to ‘matched’ choices. This was achieved
using the matrix-coding function in NVivo and checking the concept choices for a
select sample in the data (Figure 10-11).
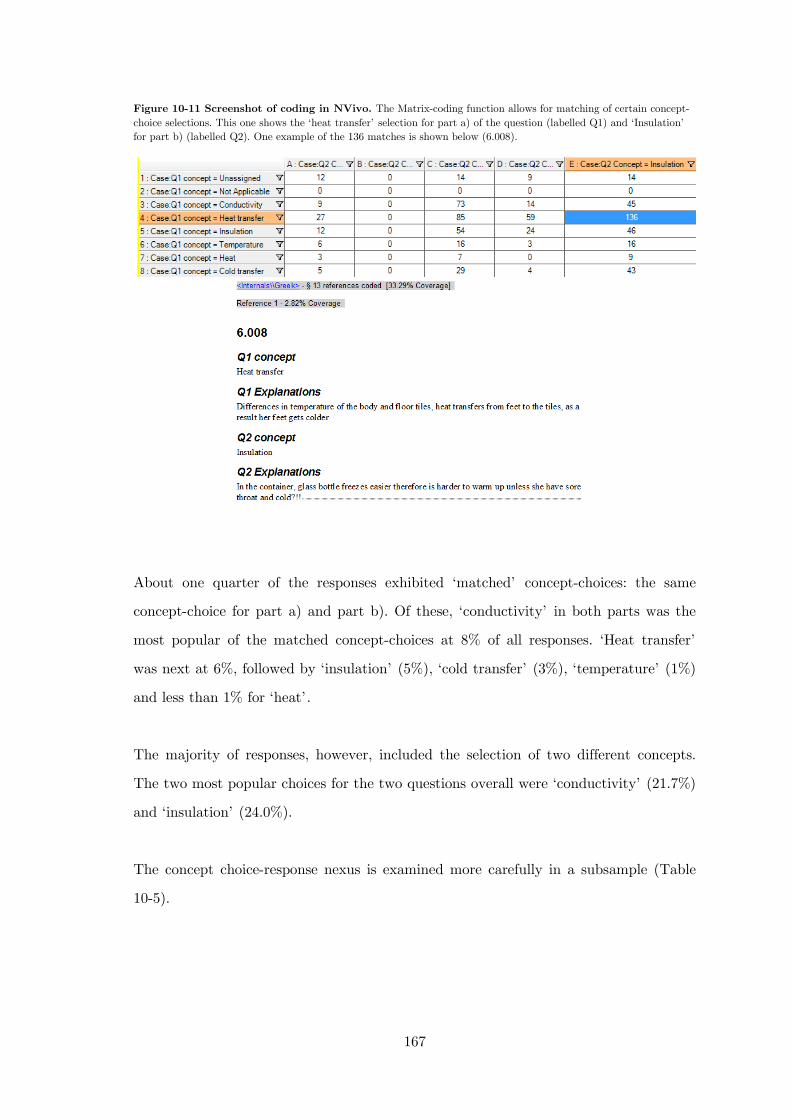
167
Figure 10-11 Screenshot of coding in NVivo. The Matrix-coding function allows for matching of certain concept-choice selections. This one shows the ‘heat transfer’ selection for part a) of the question (labelled Q1) and ‘Insulation’ for part b) (labelled Q2). One example of the 136 matches is shown below (6.008).
About one quarter of the responses exhibited ‘matched’ concept-choices: the same
concept-choice for part a) and part b). Of these, ‘conductivity’ in both parts was the
most popular of the matched concept-choices at 8% of all responses. ‘Heat transfer’
was next at 6%, followed by ‘insulation’ (5%), ‘cold transfer’ (3%), ‘temperature’ (1%)
and less than 1% for ‘heat’.
The majority of responses, however, included the selection of two different concepts.
The two most popular choices for the two questions overall were ‘conductivity’ (21.7%)
and ‘insulation’ (24.0%).
The concept choice-response nexus is examined more carefully in a subsample (Table
10-5).
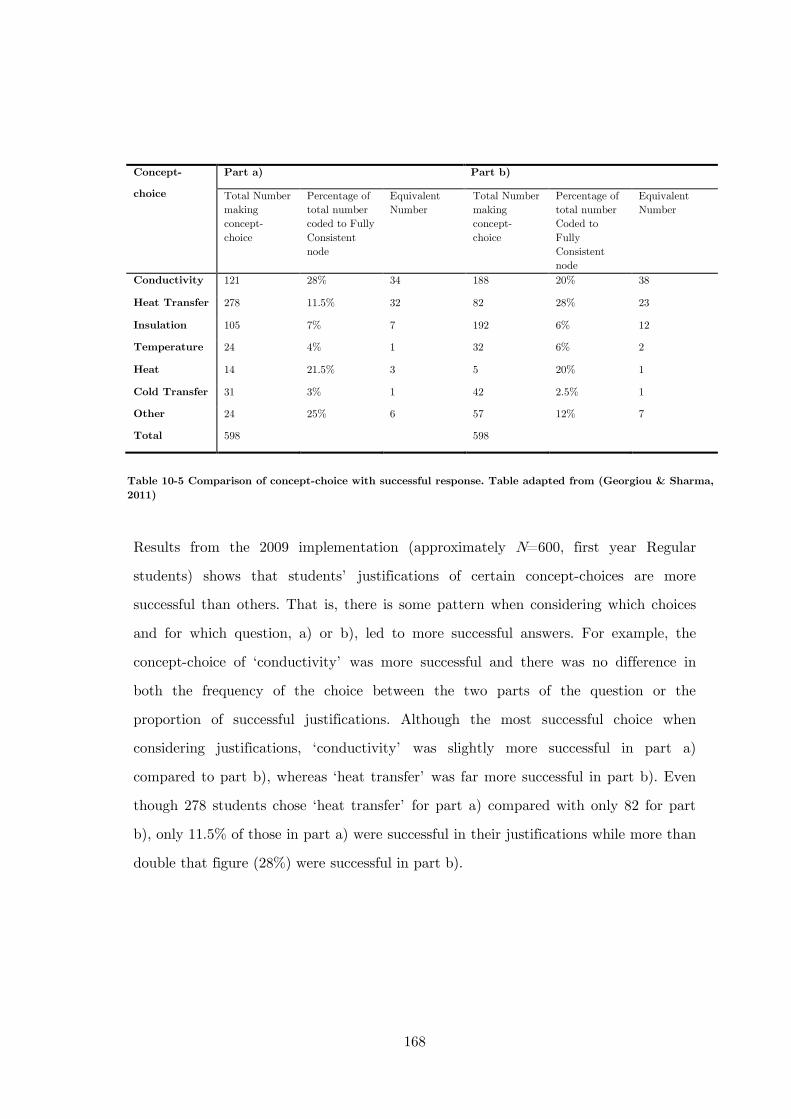
168
Results from the 2009 implementation (approximately N=600, first year Regular
students) shows that students’ justifications of certain concept-choices are more
successful than others. That is, there is some pattern when considering which choices
and for which question, a) or b), led to more successful answers. For example, the
concept-choice of ‘conductivity’ was more successful and there was no difference in
both the frequency of the choice between the two parts of the question or the
proportion of successful justifications. Although the most successful choice when
considering justifications, ‘conductivity’ was slightly more successful in part a)
compared to part b), whereas ‘heat transfer’ was far more successful in part b). Even
though 278 students chose ‘heat transfer’ for part a) compared with only 82 for part
b), only 11.5% of those in part a) were successful in their justifications while more than
double that figure (28%) were successful in part b).
Concept-
choice
Part a) Part b)
Total Number making concept- choice
Percentage of total number coded to Fully Consistent node
Equivalent Number
Total Number making concept- choice
Percentage of total number Coded to Fully Consistent node
Equivalent Number
Conductivity 121 28% 34 188 20% 38
Heat Transfer 278 11.5% 32 82 28% 23
Insulation 105 7% 7 192 6% 12
Temperature 24 4% 1 32 6% 2
Heat 14 21.5% 3 5 20% 1
Cold Transfer 31 3% 1 42 2.5% 1
Other 24 25% 6 57 12% 7
Total 598 598
Table 10-5 Comparison of concept-choice with successful response. Table adapted from (Georgiou & Sharma, 2011)
169
11 Case study with LCT analysis
11.1 On a personal note
Thus far, the study of student understanding has reported on the TCS to identify
patterns of student responses that indicate difficulties, it has looked to the ‘normalized
gain’ and other measures to show that some ideas are more flexible than others, and it
has combined TCS findings with short answer responses that reveal further details of
particular student difficulties.
To provide the reader with some context, these aspects of the project were complete
within the first half of the doctoral program. However, despite the diverse
methodological practices that were utilised, many fundamental questions remained:
• Why do students think in the ways that they do?
• Why is it difficult for student understanding to be developed in the area of
thermodynamics?
• Why is there not a more coherent way to approach these issues?
It was at this time that I took a course (recommended to me by a colleague) that was
to cover concepts in Legitimation Code Theory and was given by the theory’s author. I
was convinced that this approach could prove valuable to research in science
education. In the later part of my project, therefore, I engaged in a comprehensive case
study involving the use of LCT in analysing student responses. The success of this
application rested on several key elements; the utility of the approach as determined
by the constructive description of student understanding, the ease of communicability
of the approach, the implications for instruction, and the potential for further work,
particularly in addressing social and linguistic features of science education, hitherto
underdeveloped.
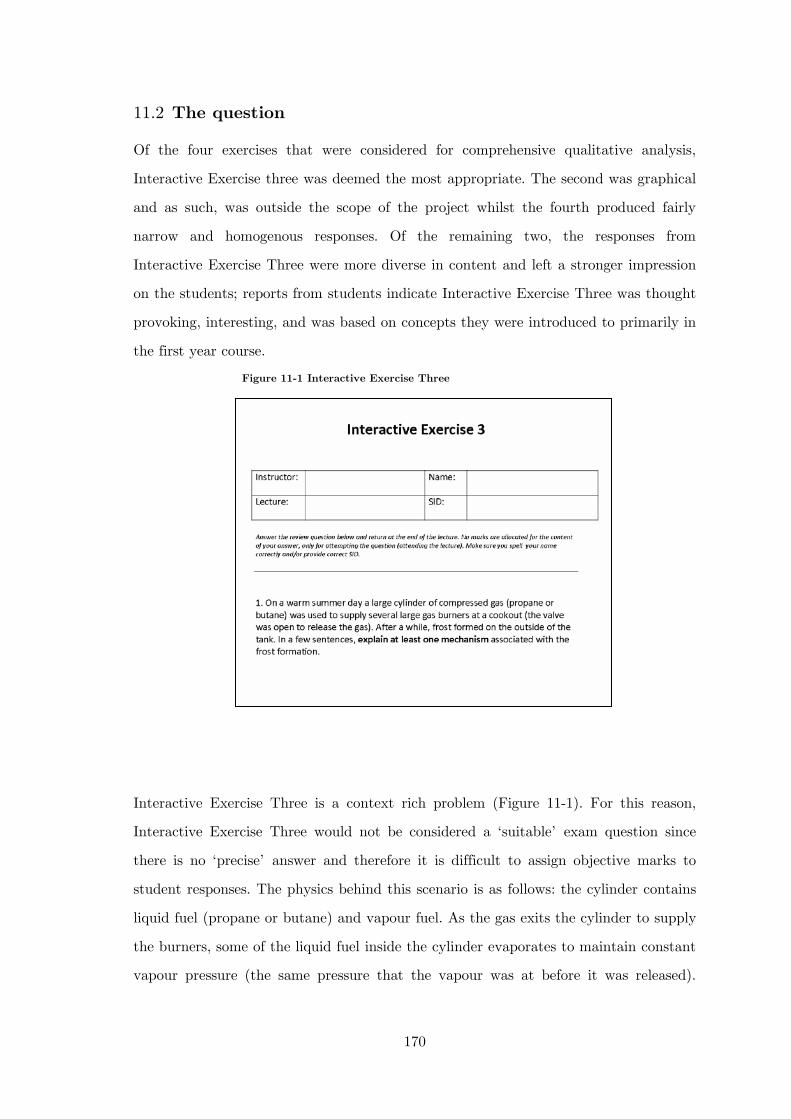
170
11.2 The question
Of the four exercises that were considered for comprehensive qualitative analysis,
Interactive Exercise three was deemed the most appropriate. The second was graphical
and as such, was outside the scope of the project whilst the fourth produced fairly
narrow and homogenous responses. Of the remaining two, the responses from
Interactive Exercise Three were more diverse in content and left a stronger impression
on the students; reports from students indicate Interactive Exercise Three was thought
provoking, interesting, and was based on concepts they were introduced to primarily in
the first year course.
Interactive Exercise Three is a context rich problem (Figure 11-1). For this reason,
Interactive Exercise Three would not be considered a ‘suitable’ exam question since
there is no ‘precise’ answer and therefore it is difficult to assign objective marks to
student responses. The physics behind this scenario is as follows: the cylinder contains
liquid fuel (propane or butane) and vapour fuel. As the gas exits the cylinder to supply
the burners, some of the liquid fuel inside the cylinder evaporates to maintain constant
vapour pressure (the same pressure that the vapour was at before it was released).
Figure 11-1 Interactive Exercise Three
171
Evaporation requires an energy input, and this is achieved through heat transfer first
from the cylinder walls to the liquid, then from the air outside of the cylinder to the
cylinder walls. Air contains water molecules and the heat transfer from the air is
significant enough to result in the water molecules condensing and freezing onto the
outside of the cylinder.
One unforeseen complication with this question is that it assumes knowledge of the
workings of a gas cylinder; that it contains both liquid and gas. If this assumption is
not taken into account, a scientifically consistent response could proceed as follows: an
expanding gas does work and therefore requires heat transfer to it. The subsequent
heat transfer from the cylinder and consequently the surrounding air results in the
condensation of the water molecules in the air and their ultimate freezing. Strictly
speaking, it is more important that students apply scientific reasoning consistently
rather than understand the precise workings of the cylinder.
In these responses, because the question asks for ‘at least one mechanism’ it is
expected that students will reveal both which concepts were deemed most relevant and
an explanation of how those concepts applied to the provided scenario. The fact that
the question assumed knowledge of the working of a gas cylinder that some students
had and others didn’t, combined with the requirement to explain ‘at least one
mechanism’ meant that there was an extensive range of physics content presented in
the responses. The diversity in responses thus provided us with rich insights into
student reasoning.
11.3 Sample
The data used were the 2011 data from the Active Learning implementation and
occurred in the non-ILD streams (EX1 and EX2) (N=133).
The students in this sample are mainly Bachelors of Science, Medical Science or
Engineering, with very similar ATARs (M=93, SD=5), placing them in the top 10 per
cent of the state. The question was administered at the beginning of selected lecture
172
classes and collected at the end. Lecture observations indicate that the students
completed the question largely autonomously and reported to invest a serious effort in
completing them, taking approximately 10 minutes to write their responses. The
average length was three to four sentences with some use of equations and limited use
of diagrams.
11.4 The analysis
The application of LCT in the context of physics teaching and learning was completely
original and therefore required comprehensive collaboration. Figure 11-2 shows an
outline of the analysis, which began with the data collection in 2011 and was developed
over the better part of two years. Initially, after Interactive Exercise Three was
selected as the question of interest, an analysis with existing methods (SOLO,
phenomenography) was sought, to provide a baseline for the LCT analysis through
either triangulation or comparison. The selection of the concept of semantic gravity
occurred after consultation primarily with experts in LCT, whilst the coding was
mainly achieved through collaboration with PER experts. The analysis was presented
to both a scientific and LCT audience, at two separate symposia, to confirm the
validity of the approach.
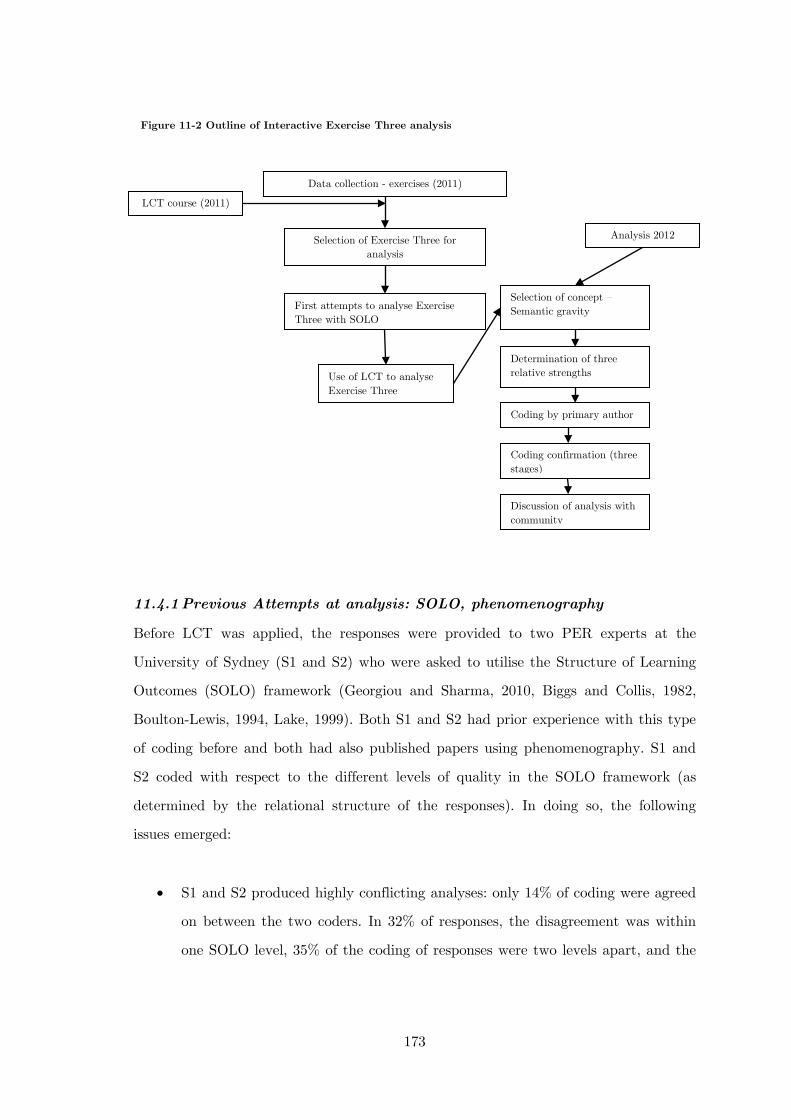
173
11.4.1 Previous Attempts at analysis: SOLO, phenomenography
Before LCT was applied, the responses were provided to two PER experts at the
University of Sydney (S1 and S2) who were asked to utilise the Structure of Learning
Outcomes (SOLO) framework (Georgiou and Sharma, 2010, Biggs and Collis, 1982,
Boulton-Lewis, 1994, Lake, 1999). Both S1 and S2 had prior experience with this type
of coding before and both had also published papers using phenomenography. S1 and
S2 coded with respect to the different levels of quality in the SOLO framework (as
determined by the relational structure of the responses). In doing so, the following
issues emerged:
• S1 and S2 produced highly conflicting analyses: only 14% of coding were agreed
on between the two coders. In 32% of responses, the disagreement was within
one SOLO level, 35% of the coding of responses were two levels apart, and the
Data collection - exercises (2011)
LCT course (2011)
Selection of Exercise Three for analysis
First attempts to analyse Exercise Three with SOLO
Use of LCT to analyse Exercise Three
Selection of concept –Semantic gravity
Determination of three relative strengths
Coding by primary author
Coding confirmation (three stages)
Discussion of analysis with community
Analysis 2012
Figure 11-2 Outline of Interactive Exercise Three analysis
174
remainder were four levels apart and ambiguous due to the inability of one or
other of the coders to assign to one level without ambiguity.
• S1 and S2 both adapted the criteria slightly in an effort to suit the data. S1
and S2 both agreed that there was no ‘extended-abstract’ level and both
offered different ways of applying the criteria to the data
• Both S1 and S2 reported they were not confident in their final codings.
Despite S1 and S2 having extensive experience with the relevant methodologies and
with the physics, the use of SOLO was deemed unsuccessful in this case. S1 made
additional comments regarding a possible phenomenographic application. Some of the
suggestions for phenomenographic categories are provided below and although these do
not qualify as a comprehensive approach, they are useful as preliminary insights.
look at the logical structures
various physical principles evoked
nature of assumptions used (explicit and implicit)
Applicability of principles to the situation
Failure to localise effects (e.g. gas cools on expansion so cylinder cools).
Argument from label (e.g. endothermic process).
Incorrect logic. (Probably the commonest mistake is to correctly quote
the ideal gas law and then assert or imply that P is proportional to T.)
Coherent arguments spoiled by incorrect usage of technical terms (e.g.
“heat” instead of “temperature”; first law named as second law).
The attempts to apply SOLO and phenomenography by S1 and S2 highlight the
difficulty in coding a context-rich problem, and also provide some justification for the
desire to attempt subsequent analysis using LCT. The phenomenographic suggestions
were integrated into the LCT approach and will be discussed later.
175
11.4.2 LCT analysis
The LCT dimension of Semantics was an obvious choice for the analysis of Interactive
Exercise Three. Semantics involves both ‘semantic gravity’ and ‘semantic density’,
however, time allowed only for the development of the former.
Once the concept of semantic gravity was deemed most appropriate for this analysis,
several stages were traversed as part of the coding and analysis. First, discussions
around the themes of the student responses took place. The primary author collated
the ideas from S1 and S2 and then conferred with one other researcher (S3) familiar
with both the physics in the question and LCT to confirm the validity of the selection
of three relative strengths of semantic gravity. Coding was subsequently conducted
mainly by the primary researcher. Validity, calibration and confirmation of coding
were achieved through the following three stages:
• Coding with S1 and S2: a formal meeting took place with S1 and S2, discussing
the new framework and the concept of semantic gravity. Explanations of the
semantic gravity strengths were provided and S1 and S2 independently coded
in accordance with these guidelines.
• Collaboration with S3: S3 was provided with the same framework and student
responses and was asked to consider some exemplars in an effort to reach
validity. Some minor changes were made, and the external language of
description, the tool through which the concept is operationalised, was
produced.
• Meeting with SUPER: A meeting took place with the PER group at the
University of Sydney (SUPER) and validation of coding took place though
confirmatory means (each group was assigned to different selections).

176
The following external language of description resulted (Table 11-1). Overall, an inter-
coder reliability of 90% was reached. The analysis was then presented at a science
symposium and an LCT roundtable, both held at the University of Sydney.
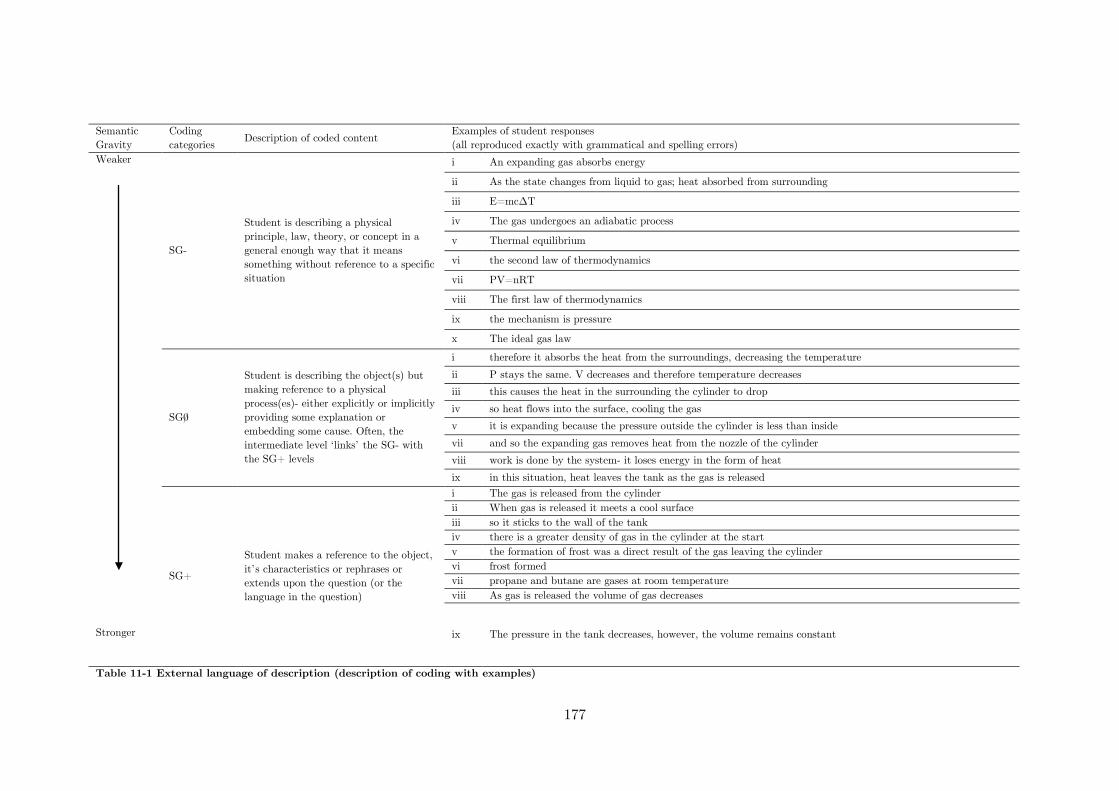
177
Semantic Gravity
Coding categories Description of coded content
Examples of student responses (all reproduced exactly with grammatical and spelling errors)
Weaker Stronger
SG-
Student is describing a physical principle, law, theory, or concept in a general enough way that it means something without reference to a specific situation
i An expanding gas absorbs energy
ii As the state changes from liquid to gas; heat absorbed from surrounding
iii E=mcΔT
iv The gas undergoes an adiabatic process
v Thermal equilibrium
vi the second law of thermodynamics
vii PV=nRT
viii The first law of thermodynamics
ix the mechanism is pressure
x The ideal gas law
SG0/
Student is describing the object(s) but making reference to a physical process(es)- either explicitly or implicitly providing some explanation or embedding some cause. Often, the intermediate level ‘links’ the SG- with the SG+ levels
i therefore it absorbs the heat from the surroundings, decreasing the temperature
ii P stays the same. V decreases and therefore temperature decreases iii this causes the heat in the surrounding the cylinder to drop
iv so heat flows into the surface, cooling the gas v it is expanding because the pressure outside the cylinder is less than inside
vii and so the expanding gas removes heat from the nozzle of the cylinder viii work is done by the system- it loses energy in the form of heat
ix in this situation, heat leaves the tank as the gas is released
SG+
Student makes a reference to the object, it’s characteristics or rephrases or extends upon the question (or the language in the question)
i The gas is released from the cylinder ii When gas is released it meets a cool surface iii so it sticks to the wall of the tank iv there is a greater density of gas in the cylinder at the start v the formation of frost was a direct result of the gas leaving the cylinder vi frost formed vii propane and butane are gases at room temperature viii As gas is released the volume of gas decreases
ix The pressure in the tank decreases, however, the volume remains constant
Table 11-1 External language of description (description of coding with examples)

178
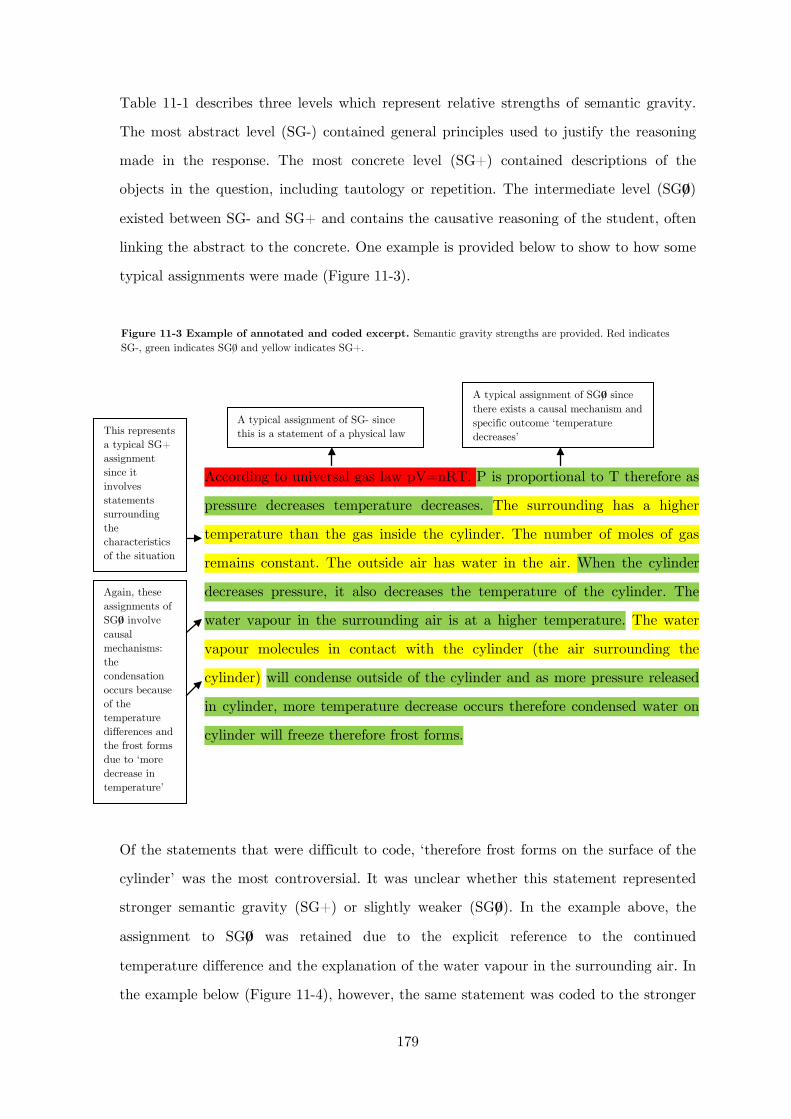
179
Table 11-1 describes three levels which represent relative strengths of semantic gravity.
The most abstract level (SG-) contained general principles used to justify the reasoning
made in the response. The most concrete level (SG+) contained descriptions of the
objects in the question, including tautology or repetition. The intermediate level (SG0/
)
existed between SG- and SG+ and contains the causative reasoning of the student, often
linking the abstract to the concrete. One example is provided below to show to how some
typical assignments were made (Figure 11-3).
According to universal gas law pV=nRT. P is proportional to T therefore as
pressure decreases temperature decreases. The surrounding has a higher
temperature than the gas inside the cylinder. The number of moles of gas
remains constant. The outside air has water in the air. When the cylinder
decreases pressure, it also decreases the temperature of the cylinder. The
water vapour in the surrounding air is at a higher temperature. The water
vapour molecules in contact with the cylinder (the air surrounding the
cylinder) will condense outside of the cylinder and as more pressure released
in cylinder, more temperature decrease occurs therefore condensed water on
cylinder will freeze therefore frost forms.
Of the statements that were difficult to code, ‘therefore frost forms on the surface of the
cylinder’ was the most controversial. It was unclear whether this statement represented
stronger semantic gravity (SG+) or slightly weaker (SG0/). In the example above, the
assignment to SG
Figure 11-4
0/ was retained due to the explicit reference to the continued
temperature difference and the explanation of the water vapour in the surrounding air. In
the example below ( ), however, the same statement was coded to the stronger
A typical assignment of SG- since this is a statement of a physical law
A typical assignment of SG0/ since there exists a causal mechanism and specific outcome ‘temperature decreases’ This represents
a typical SG+ assignment since it involves statements surrounding the characteristics of the situation
Again, these assignments of SG0/ involve causal mechanisms: the condensation occurs because of the temperature differences and the frost forms due to ‘more decrease in temperature’
Figure 11-3 Example of annotated and coded excerpt. Semantic gravity strengths are provided. Red indicates SG-, green indicates SG0/ and yellow indicates SG+.
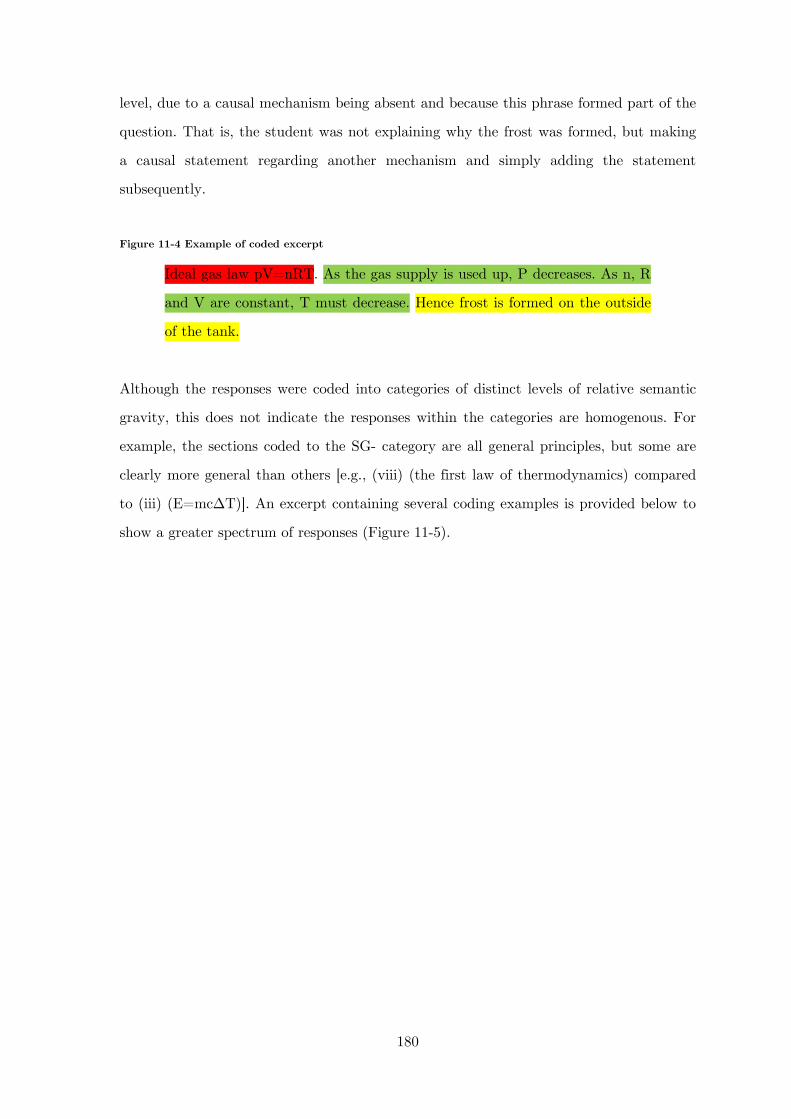
180
level, due to a causal mechanism being absent and because this phrase formed part of the
question. That is, the student was not explaining why the frost was formed, but making
a causal statement regarding another mechanism and simply adding the statement
subsequently.
Figure 11-4 Example of coded excerpt
Ideal gas law pV=nRT. As the gas supply is used up, P decreases. As n, R
and V are constant, T must decrease. Hence frost is formed on the outside
of the tank.
Although the responses were coded into categories of distinct levels of relative semantic
gravity, this does not indicate the responses within the categories are homogenous. For
example, the sections coded to the SG- category are all general principles, but some are
clearly more general than others [e.g., (viii) (the first law of thermodynamics) compared
to (iii) (E=mcΔT)]. An excerpt containing several coding examples is provided below to
show a greater spectrum of responses (Figure 11-5).
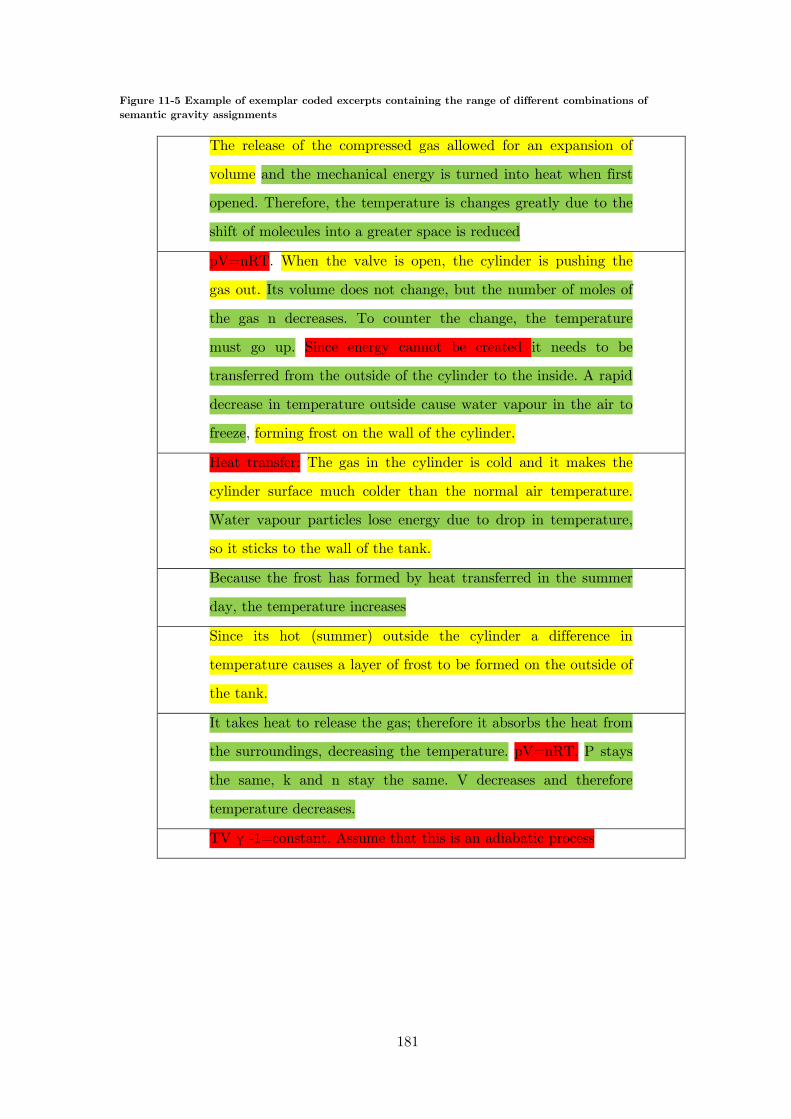
181
Figure 11-5 Example of exemplar coded excerpts containing the range of different combinations of semantic gravity assignments
The release of the compressed gas allowed for an expansion of
volume and the mechanical energy is turned into heat when first
opened. Therefore, the temperature is changes greatly due to the
shift of molecules into a greater space is reduced
pV=nRT. When the valve is open, the cylinder is pushing the
gas out. Its volume does not change, but the number of moles of
the gas n decreases. To counter the change, the temperature
must go up. Since energy cannot be created it needs to be
transferred from the outside of the cylinder to the inside. A rapid
decrease in temperature outside cause water vapour in the air to
freeze, forming frost on the wall of the cylinder.
Heat transfer: The gas in the cylinder is cold and it makes the
cylinder surface much colder than the normal air temperature.
Water vapour particles lose energy due to drop in temperature,
so it sticks to the wall of the tank.
Because the frost has formed by heat transferred in the summer
day, the temperature increases
Since its hot (summer) outside the cylinder a difference in
temperature causes a layer of frost to be formed on the outside of
the tank.
It takes heat to release the gas; therefore it absorbs the heat from
the surroundings, decreasing the temperature. pV=nRT. P stays
the same, k and n stay the same. V decreases and therefore
temperature decreases.
TV γ -1=constant. Assume that this is an adiabatic process
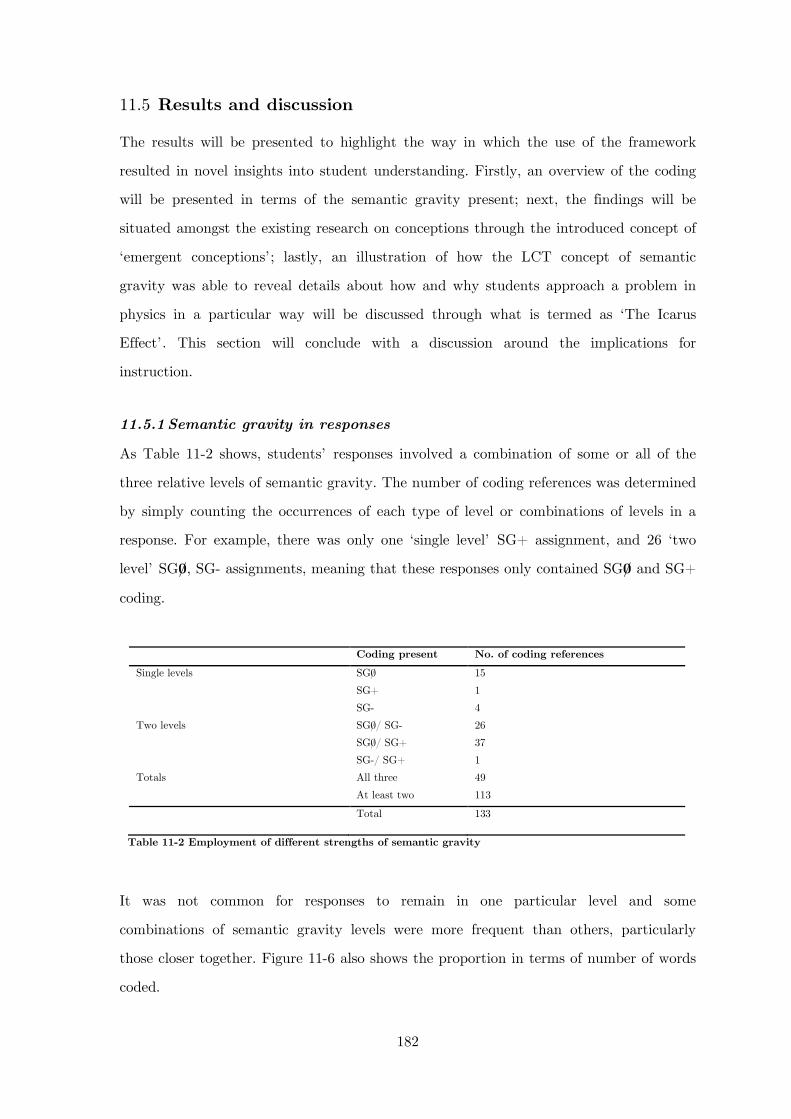
182
11.5 Results and discussion
The results will be presented to highlight the way in which the use of the framework
resulted in novel insights into student understanding. Firstly, an overview of the coding
will be presented in terms of the semantic gravity present; next, the findings will be
situated amongst the existing research on conceptions through the introduced concept of
‘emergent conceptions’; lastly, an illustration of how the LCT concept of semantic
gravity was able to reveal details about how and why students approach a problem in
physics in a particular way will be discussed through what is termed as ‘The Icarus
Effect’. This section will conclude with a discussion around the implications for
instruction.
11.5.1 Semantic gravity in responses
As Table 11-2 shows, students’ responses involved a combination of some or all of the
three relative levels of semantic gravity. The number of coding references was determined
by simply counting the occurrences of each type of level or combinations of levels in a
response. For example, there was only one ‘single level’ SG+ assignment, and 26 ‘two
level’ SG0/, SG- assignments, meaning that these responses only contained SG
0/ and SG+
coding.
Coding present No. of coding references
Single levels SG0/ 15
SG+ 1
SG- 4
Two levels SG0/ 26 / SG-
SG0/ 37 / SG+
SG-/ SG+ 1
Totals All three 49
At least two 113
Total 133
Table 11-2 Employment of different strengths of semantic gravity
It was not common for responses to remain in one particular level and some
combinations of semantic gravity levels were more frequent than others, particularly
those closer together. Figure 11-6 also shows the proportion in terms of number of words
coded.
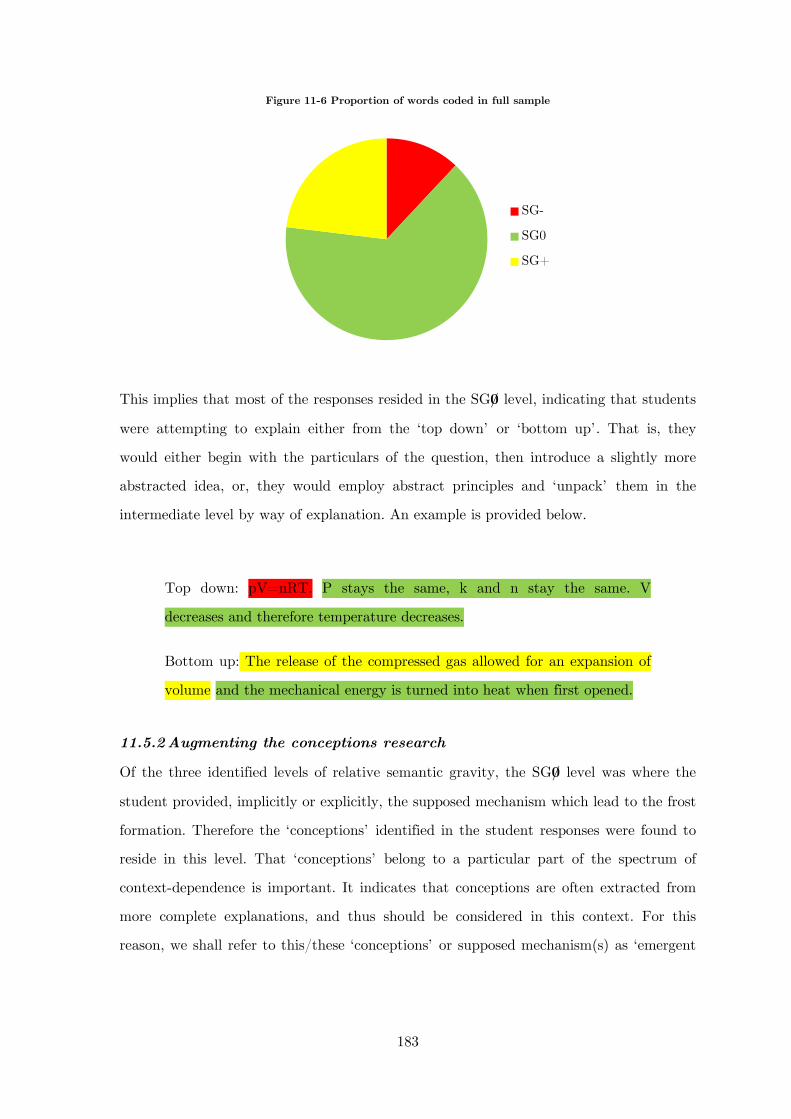
183
Figure 11-6 Proportion of words coded in full sample
This implies that most of the responses resided in the SG0/
level, indicating that students
were attempting to explain either from the ‘top down’ or ‘bottom up’. That is, they
would either begin with the particulars of the question, then introduce a slightly more
abstracted idea, or, they would employ abstract principles and ‘unpack’ them in the
intermediate level by way of explanation. An example is provided below.
Top down: pV=nRT. P stays the same, k and n stay the same. V
decreases and therefore temperature decreases.
Bottom up: The release of the compressed gas allowed for an expansion of
volume and the mechanical energy is turned into heat when first opened.
11.5.2 Augmenting the conceptions research
Of the three identified levels of relative semantic gravity, the SG0/ level was where the
student provided, implicitly or explicitly, the supposed mechanism which lead to the frost
formation. Therefore the ‘conceptions’ identified in the student responses were found to
reside in this level. That ‘conceptions’ belong to a particular part of the spectrum of
context-dependence is important. It indicates that conceptions are often extracted from
more complete explanations, and thus should be considered in this context. For this
reason, we shall refer to this/these ‘conceptions’ or supposed mechanism(s) as ‘emergent
SG-
SG0
SG+
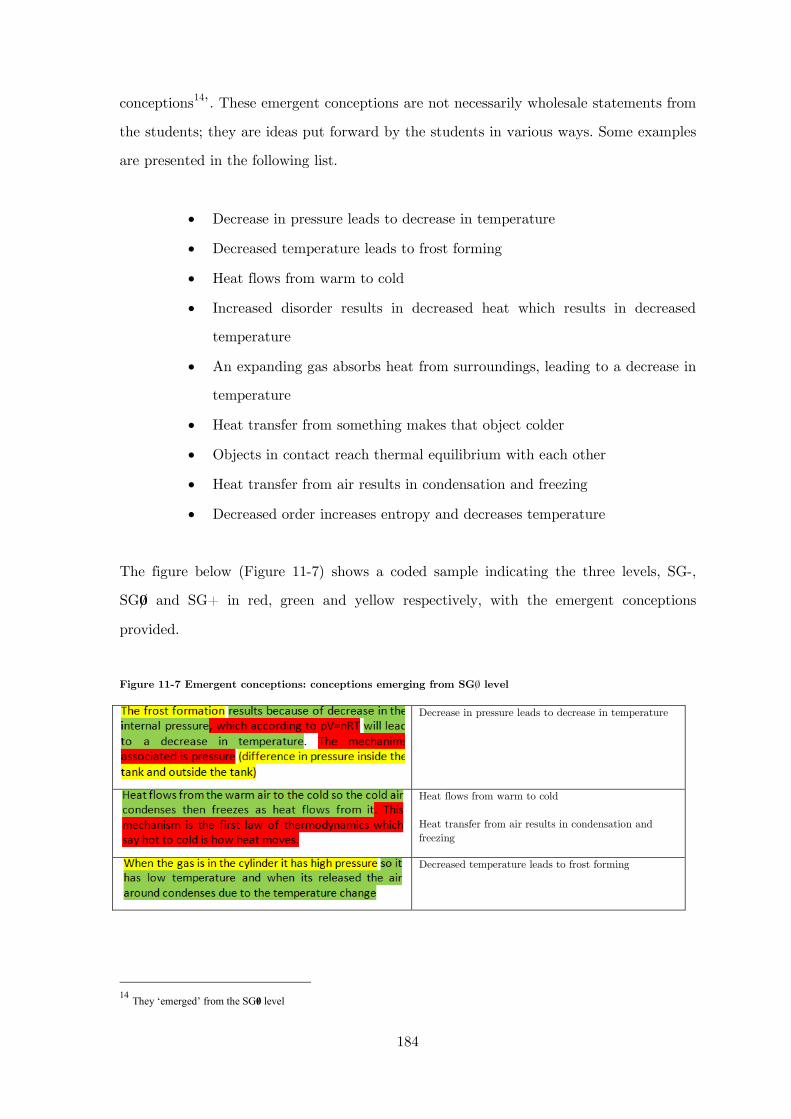
184
conceptions14
’. These emergent conceptions are not necessarily wholesale statements from
the students; they are ideas put forward by the students in various ways. Some examples
are presented in the following list.
• Decrease in pressure leads to decrease in temperature
• Decreased temperature leads to frost forming
• Heat flows from warm to cold
• Increased disorder results in decreased heat which results in decreased
temperature
• An expanding gas absorbs heat from surroundings, leading to a decrease in
temperature
• Heat transfer from something makes that object colder
• Objects in contact reach thermal equilibrium with each other
• Heat transfer from air results in condensation and freezing
• Decreased order increases entropy and decreases temperature
The figure below (Figure 11-7) shows a coded sample indicating the three levels, SG-,
SG0/
and SG+ in red, green and yellow respectively, with the emergent conceptions
provided.
Figure 11-7 Emergent conceptions: conceptions emerging from SG0/
level
Decrease in pressure leads to decrease in temperature
Heat flows from warm to cold Heat transfer from air results in condensation and freezing
Decreased temperature leads to frost forming
14 They ‘emerged’ from the SG0/ level
185
These examples show that the emergent conceptions can occur: anywhere in the
explanation, more than once in a single explanation and in the presence of both or one of
the other levels.
Some of these emergent conceptions are fairly general, for example, ‘objects in contact
reach thermal equilibrium with each other’, while others are more unique to the question
asked: ‘decreased temperature leads to frost formation’. There were a small number of
SG0/
segments that could not be described in this list of emergent conceptions, such as:
“and the mechanical energy is turned into heat when first opened.
Therefore, the temperature is changes greatly due to the shift of molecules
into a greater space is reduced”.
Many of the emergent conceptions are identified as alternative conceptions (or
misconceptions) and catalogued in the extant literature. Take, for example, ‘decrease in
pressure leads to decrease in temperature’. This alternative conception has been reported
as arising from different contextual situations, in Physics, chemistry and at different
levels of study. However, many of the explanations around this conception are actually
quite general. For example, the pressure-temperature relationship has been associated
with an over-reliance on algorithmic thinking, or inappropriate use of mathematical
formula instead of physical reasoning (Boudreaux & Campbell, 2012). Such general
findings are extremely important and yet seem destined to exist within the confines of
the individual studies. This is presumably because the main research thread in this area
revolves around ‘constructivism’ and misconceptions, and therefore defines research in
the standard narrative: students have existing ideas, these ideas may be incompatible
with scientific ideas and therefore students should be encouraged to move away from
inconsistent, naïve ideas to consistent, scientifically consistent ideas.
It is important that these emergent conceptions are not considered in isolation. As
discussed in the literature review, students’ ideas are highly dynamic. Boudreaux and
Campbell state that “in reporting student difficulties, we do not necessarily imply that
student ideas are stable and coherent, as a ‘misconceptions model’ of student reasoning
186
would suggest.” (p. 710), however it is difficult to see how studies which simply identify
students’ ideas can avoid representing them as ‘stable and coherent’.
In these student responses, since the SG+ level contained details about the scenario
(cylinder, frost etc.) and the SG- level contained statements of general laws and
principles, it is very easy to disregard the importance of these details, however, doing so
reduces the qualitative analysis simply to multiple-choice options; the ‘misconceptions
model’.
Instead, accepting the idea of emergent conceptions allows us to recognize that
‘explanations’ are supported by students’ linking their ideas to general principles and/or
the details of the question. One significant consequence of this recognition is detailed in
the next result ‘semantic gravity range’, which will explain how emergent conceptions fit
into the global structure of responses and why this is significant for physics knowledge.
In summary, the LCT concept of semantic gravity allows us to describe ‘Emergent
conceptions’. By ‘residing’ in the SG0/
11.5.3 Semantic gravity range
level, emergent conceptions, otherwise labelled as
misconceptions/alternative conceptions or facets cannot easily be misconstrued as
isolated and discrete; researchers are forced to consider the context of the student’s
response.
The concept of the ‘semantic range’ of students’ responses is identified in order to more
easily refer to the number of different relative levels of semantic gravity present. A larger
semantic range indicates that a greater number of levels were present in a response whilst
a smaller range indicates that only one level was utilised. Most students’ responses (85
%) exhibited a larger semantic range, meaning they employed at least two relative
strengths of semantic gravity in their responses. This includes, in approximately equal
measures, responses which were coded to both SG- and SG0/ and the SG
0/ and SG+ level.
Such structure in responses indicated that students attempted to link general principles
or use established physics mechanisms to explain a concrete physical phenomenon.
187
Although a larger semantic range in student responses seems fairly obvious (or it would
to physics instructors and educational researchers), it is a distinct quality in response to
a somewhat unique knowledge structure (Lindstrøm, 2012). As mentioned in the
literature review (Section 3.5.2), physics exhibits a ‘hierarchical’ knowledge structure,
meaning that, units of knowledge are subsumed and integrated within other units of
knowledge. This is not necessarily the case in all knowledge structures. For example,
amongst literary critical theories, many units of knowledge are incommensurable to one
another. They exhibit ‘horizontal’ knowledge structures.
The display of a larger semantic range therefore indicates that students recognise these
characteristics of the knowledge structure; that context-dependence is important in
explaining physical phenomena; and that tangible experience may be explained through
utilisation of physical theories. This context dependency is what Redish draws attention
to when he talks about ‘abstract reasoning primitives’ mapping onto ‘concrete facets’
(Figure 3-2). The importance of context-dependency is also therefore implicitly
highlighted in diSessa’s p-prims on which Redish bases the ‘mapping’ process. The
usefulness of the language of the theoretical framework of LCT is palpable when
considering what Redish calls ‘mapping’. It provides a stronger explanatory basis by
imposing a definition on ‘concrete’ and ‘abstract’ through the language of description,
defining the substance and quantity of ‘mapping’ through the concept of semantic range
and allows application to existing research.
An example of an application of the concept of semantic range using this language is the
Expert-Novice literature in PER (and science education research). According to the
Expert-Novice literature, students begin to develop distinct characteristics as they
become more expert learners; they are able to see past the surface features of a question,
successfully link theory to example and use the correct terminology. In terms of a
sociocultural view of learning, students become further ‘encultured’ into the discipline, in
this case, the understanding of thermodynamics and physics in general. The student
progressively takes on the characteristics of the expert and this is hopefully facilitated by
the educator. This view is a powerful one that has driven the Expert-Novice literature.
However, much of the Expert-Novice literature has focused predominantly on content
188
knowledge, and to a lesser extent ‘approaches to learning’, ‘self-efficacy’ and
‘epistemology’. The recognition that the knowledge structure of physics is distinct has
not been explored. Using the concept of semantic range, this dimension of ‘becoming
more expert’ or ‘becoming more encultured’ can be more precisely described. The
explanation is instead framed as more novice students exhibiting a smaller semantic
range, while the more expert students are recognising the need for a larger semantic
range. This allows comparisons between groups and over time. It also affords a different
way of approaching the problem.
For example, students less exposed to physics, when asked to explain a physics
phenomenon, are more likely to give concrete answers or answers resembling opinions,
responses that reflect a narrower semantic range. Since Interactive Exercise Three was
not an appropriate question to provide to ‘novices’ data were used from Interactive
Exercise One to support this assertion. The following responses are from either part of
the question and by two different groups; junior high school students, and university
students.
Responses from 15-16 year-olds (SGPRE/POST, in Table 10-4)
“Personally, I find that cold transfer is most associated with the scenario
because the surface of the glass is able to stay cool even in rather
uncomfortably hot weather.”
“I think because the cola was actually the same temperature, but that
plastic acts as a sort of insulator so that you can't feel the cold as much”
“Maybe carpet holds more heat because it is layered and tiles are cold
because it is smoother? If you are insulating a house or something I'd
rather choose carpet than tiles.”
“It just does. The tiles are cold and when she steps on them, the coldness
touches her feet.”
189
“If the temperature was hot, the tiles would be hotter. If the temperature
was cold, the tiles would be colder. Don't know why though.”
Responses from first year university Physics students (SydReg 2009, in Table 10-4):
“Heat is transferred from our bodies to the floor more easily when the floor
is made of tiles. Tiles are more conductive. The heat on our bodies leave
out bodies more easily when we step on tiles compared to stepping on the
carpet. Tiles are better conductors”
“Carpeted floor has a higher heat capacity than the tiled floor. Heat is
transferred from Rebecca's foot to the tiles more and faster than the heat
is transferred from Rebecca's foot to the carpet. Rebecca’s foot lost more
heat when she walked on the tile floor”
“The conductivity of glass is better than plastic, so the glass get
equilibrium with cola faster than plastic”
“The plastic is a better insulator of heat than glass. Since the glass bottle
doesn't retain any heat it feels colder than the plastic bottle. Note: Both
bottles have coke inside at the same temperature and that the glass bottle
reaches a temperature closer to the coke than the plastic bottle”
The responses from the first, younger group were rooted in the details of the question
and often included personal feelings. They spoke about objects, whether they were cold
or hot, and their personal opinions about what they would do. The second, older group,
with more experience in physics, even when not providing the ‘correct’ answer, were
attempting to draw on a physical mechanism; they were detached and objective, more
likely writing in third person (typical of a scientists’ writing).
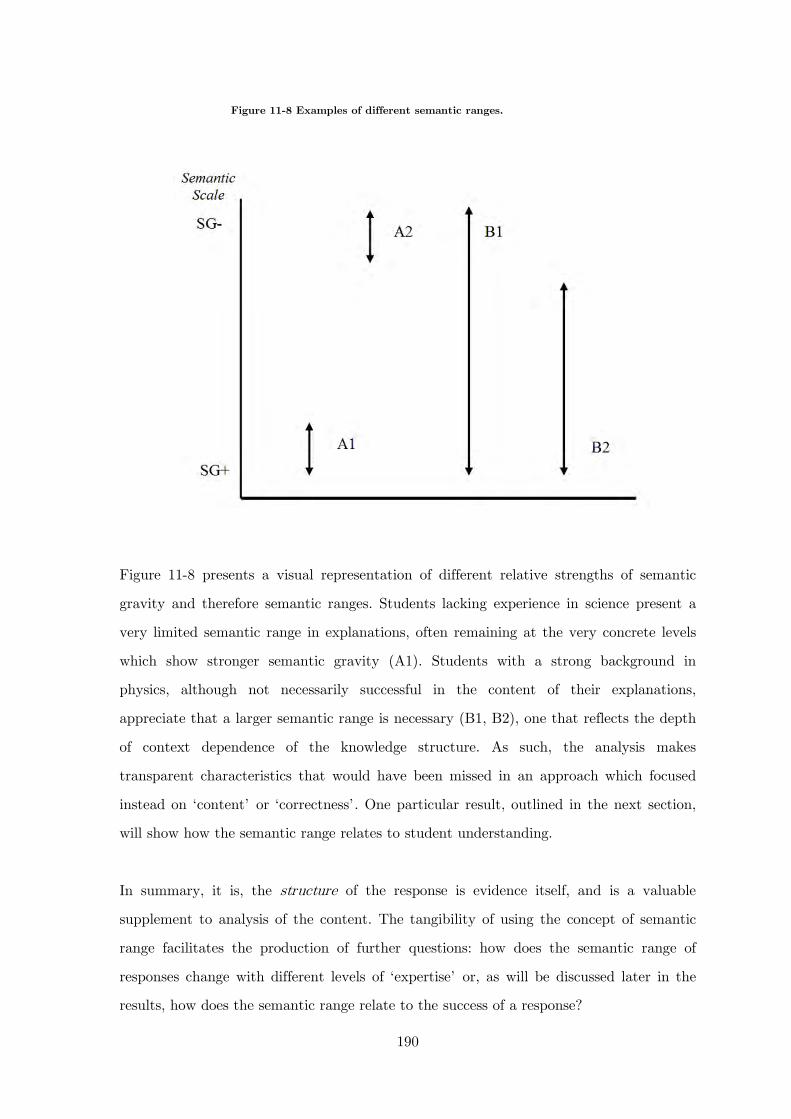
190
Figure 11-8 presents a visual representation of different relative strengths of semantic
gravity and therefore semantic ranges. Students lacking experience in science present a
very limited semantic range in explanations, often remaining at the very concrete levels
which show stronger semantic gravity (A1). Students with a strong background in
physics, although not necessarily successful in the content of their explanations,
appreciate that a larger semantic range is necessary (B1, B2), one that reflects the depth
of context dependence of the knowledge structure. As such, the analysis makes
transparent characteristics that would have been missed in an approach which focused
instead on ‘content’ or ‘correctness’. One particular result, outlined in the next section,
will show how the semantic range relates to student understanding.
In summary, it is, the structure of the response is evidence itself, and is a valuable
supplement to analysis of the content. The tangibility of using the concept of semantic
range facilitates the production of further questions: how does the semantic range of
responses change with different levels of ‘expertise’ or, as will be discussed later in the
results, how does the semantic range relate to the success of a response?
Figure 11-8 Examples of different semantic ranges.
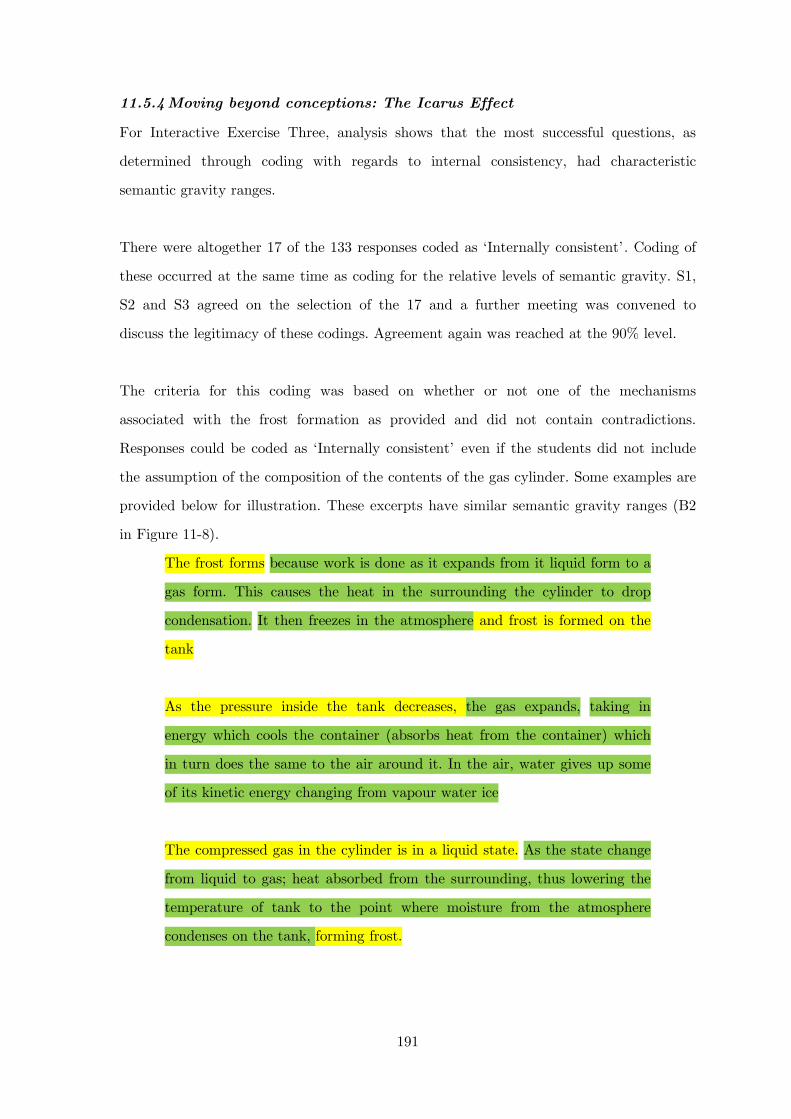
191
11.5.4 Moving beyond conceptions: The Icarus Effect
For Interactive Exercise Three, analysis shows that the most successful questions, as
determined through coding with regards to internal consistency, had characteristic
semantic gravity ranges.
There were altogether 17 of the 133 responses coded as ‘Internally consistent’. Coding of
these occurred at the same time as coding for the relative levels of semantic gravity. S1,
S2 and S3 agreed on the selection of the 17 and a further meeting was convened to
discuss the legitimacy of these codings. Agreement again was reached at the 90% level.
The criteria for this coding was based on whether or not one of the mechanisms
associated with the frost formation as provided and did not contain contradictions.
Responses could be coded as ‘Internally consistent’ even if the students did not include
the assumption of the composition of the contents of the gas cylinder. Some examples are
provided below for illustration. These excerpts have similar semantic gravity ranges (B2
in Figure 11-8).
The frost forms because work is done as it expands from it liquid form to a
gas form. This causes the heat in the surrounding the cylinder to drop
condensation. It then freezes in the atmosphere and frost is formed on the
tank
As the pressure inside the tank decreases, the gas expands, taking in
energy which cools the container (absorbs heat from the container) which
in turn does the same to the air around it. In the air, water gives up some
of its kinetic energy changing from vapour water ice
The compressed gas in the cylinder is in a liquid state. As the state change
from liquid to gas; heat absorbed from the surrounding, thus lowering the
temperature of tank to the point where moisture from the atmosphere
condenses on the tank, forming frost.
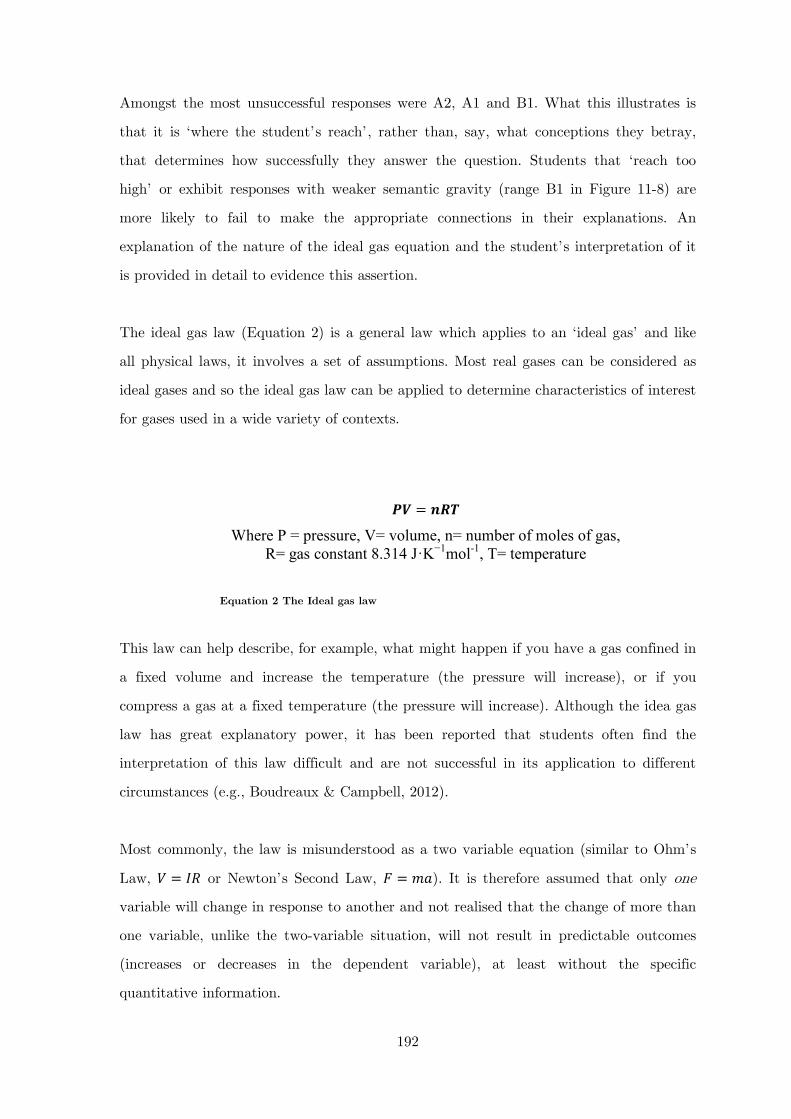
192
Amongst the most unsuccessful responses were A2, A1 and B1. What this illustrates is
that it is ‘where the student’s reach’, rather than, say, what conceptions they betray,
that determines how successfully they answer the question. Students that ‘reach too
high’ or exhibit responses with weaker semantic gravity (range B1 in Figure 11-8) are
more likely to fail to make the appropriate connections in their explanations. An
explanation of the nature of the ideal gas equation and the student’s interpretation of it
is provided in detail to evidence this assertion.
The ideal gas law (Equation 2) is a general law which applies to an ‘ideal gas’ and like
all physical laws, it involves a set of assumptions. Most real gases can be considered as
ideal gases and so the ideal gas law can be applied to determine characteristics of interest
for gases used in a wide variety of contexts.
This law can help describe, for example, what might happen if you have a gas confined in
a fixed volume and increase the temperature (the pressure will increase), or if you
compress a gas at a fixed temperature (the pressure will increase). Although the idea gas
law has great explanatory power, it has been reported that students often find the
interpretation of this law difficult and are not successful in its application to different
circumstances (e.g., Boudreaux & Campbell, 2012).
Most commonly, the law is misunderstood as a two variable equation (similar to Ohm’s
Law, 𝑉 = 𝐼𝑅 or Newton’s Second Law, 𝐹 = 𝑚𝑎). It is therefore assumed that only one
variable will change in response to another and not realised that the change of more than
one variable, unlike the two-variable situation, will not result in predictable outcomes
(increases or decreases in the dependent variable), at least without the specific
quantitative information.
𝑷𝑽 = 𝒏𝑹𝑻
Where P = pressure, V= volume, n= number of moles of gas, R= gas constant 8.314 J·K−1mol-1, T= temperature
Equation 2 The Ideal gas law
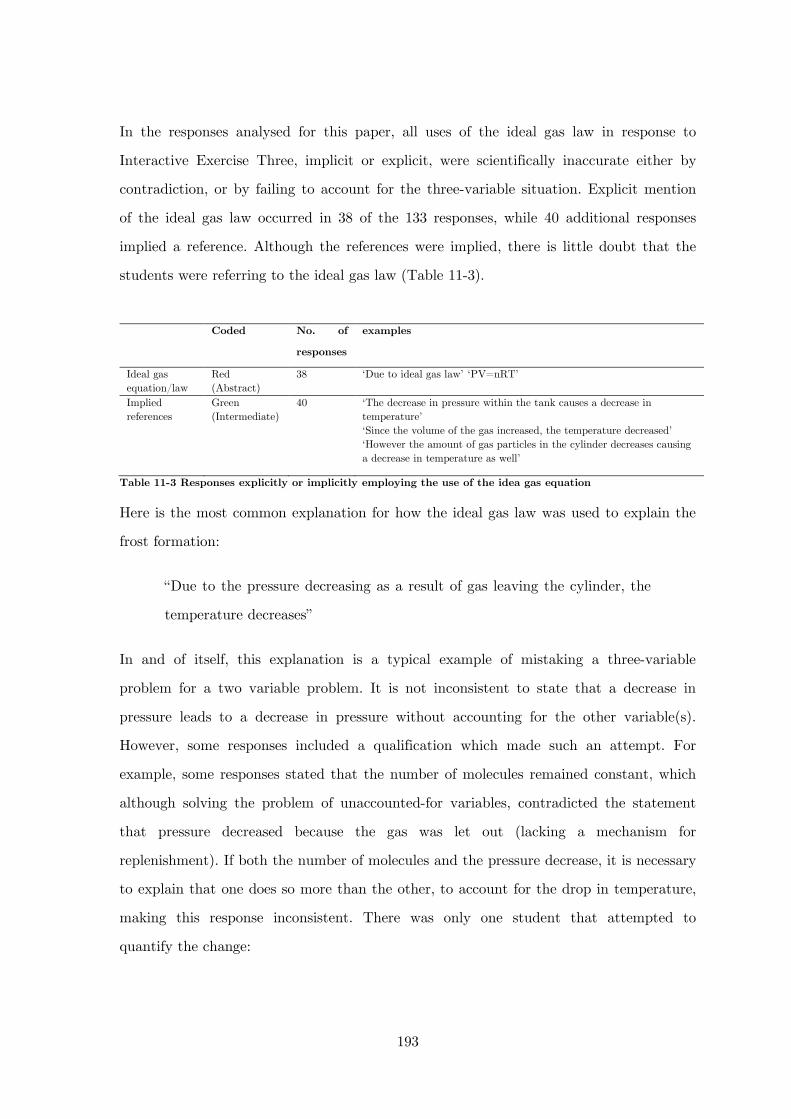
193
In the responses analysed for this paper, all uses of the ideal gas law in response to
Interactive Exercise Three, implicit or explicit, were scientifically inaccurate either by
contradiction, or by failing to account for the three-variable situation. Explicit mention
of the ideal gas law occurred in 38 of the 133 responses, while 40 additional responses
implied a reference. Although the references were implied, there is little doubt that the
students were referring to the ideal gas law (Table 11-3).
Coded No. of
responses
examples
Ideal gas equation/law
Red (Abstract)
38 ‘Due to ideal gas law’ ‘PV=nRT’
Implied references
Green (Intermediate)
40 ‘The decrease in pressure within the tank causes a decrease in temperature’ ‘Since the volume of the gas increased, the temperature decreased’ ‘However the amount of gas particles in the cylinder decreases causing a decrease in temperature as well’
Table 11-3 Responses explicitly or implicitly employing the use of the idea gas equation
Here is the most common explanation for how the ideal gas law was used to explain the
frost formation:
“Due to the pressure decreasing as a result of gas leaving the cylinder, the
temperature decreases”
In and of itself, this explanation is a typical example of mistaking a three-variable
problem for a two variable problem. It is not inconsistent to state that a decrease in
pressure leads to a decrease in pressure without accounting for the other variable(s).
However, some responses included a qualification which made such an attempt. For
example, some responses stated that the number of molecules remained constant, which
although solving the problem of unaccounted-for variables, contradicted the statement
that pressure decreased because the gas was let out (lacking a mechanism for
replenishment). If both the number of molecules and the pressure decrease, it is necessary
to explain that one does so more than the other, to account for the drop in temperature,
making this response inconsistent. There was only one student that attempted to
quantify the change:
194
“pV=nRT T=PV/nr. As the gas is released from the cylinder, the
pressure and number of molecules decrease. From the modified equation,
the numerator decreases faster than the denominator, causing a decrease in
temperature.”
In this case, even if we accept that the student had no resources to understand that the
cylinder contains a liquid as well as the gas, there is no reason provided for why one
variable should change more than the other. Furthermore, mathematically, the statement
is inaccurate; an additional decrease in the numerator would actually lead to a higher
temperature.
There was also a second solution involving a volume increase:
“pV=nRT therefore pressure decrease will cause both volume expansion
and temperature decrease”
The typical oversight in regards to the three-variable problem resurfaces here; the failure
to recognize that an outcome cannot be ascertained when all three variables are changing
at the same time. The pressure decrease cannot both result in both volume increasing
and temperature decreasing.
These examples of students attempting to link changes in pressure, volume and number
of molecules to a change in temperature clearly confirm the difficulty of reasoning
attached to a three-variable problem. But it suggests more than that. Students were not
provided with a question about an ideal gas under certain conditions, a ubiquitous
question in first year thermodynamics. They had a choice. This question type does not
involve merely providing students with the content and asking them to work through it,
it required a decision to be made by the student on which concept(s) they were going to
use in their explanations. The question therefore becomes: why did they choose to use the
three-variable problem in the first place? They did need to employ SG- reasoning in their
responses but in fact accommodated them by making spurious or sometimes unreasonable
assertions.
195
Interview data suggests that students suppressed their intuition to ‘reach higher’ and
apply the ideal gas law to the situation. The students’ justifications for these choices
were compelling. Six students in total were given the question and asked to provide a
verbal explanation. All but one explained the question using the ideal gas law. All
students were asked why they drew upon the ideal gas law to provide an explanation for
the frost formation.
“Because we saw it a lot”
“Equations are easier and more convenient to use compared to a
conceptual understanding.”
“It’s one of the first things you look at when you look at gases and it has a
lot of things in it and it uses the word gas in it.”
Students were then prompted to consider alternative explanations:
T: Can you think of another way to explain this?
S: When the gas is expanding... it’s doing work on its surroundings....
T: So if a gas is doing work, how does it do this work?
S: Well.... the work... heat is equal to work.... so if.... the energy of the
work has to come from somewhere. That comes from the container, so the
temperature of the container decreases because the particles of the
container are moving slower and gave lower energy.
A second student came to the same conclusion. When arriving at the explanation that an
expanding gas requires energy the student commented that:
“I’d say the second one (explanation) was clearer because like you can
visualize it better... it’s less abstract”
Although it is possible to use the ideal gas law to explain what is happening with the
‘frosty cylinder’, it is not actually necessary or appropriate in this case. Students were
sufficiently enticed by the equation to ‘reach up’ to a higher level of abstraction than
196
needed and this may be a reflection of student attitudes toward physics or a consequence
of the way that physics is taught throughout school and university (general principles
first (A2), examples later (A1), and not necessarily with an intermediate link).
In essence, these results show that there was an appropriate semantic range associated
with Interactive Exercise Three (see B2, Figure 11-8) and that students that were not
successful drew on explanations that were too weak in semantic gravity; figuratively,
they flew too close to the sun (A2, B1). It wasn’t only that students had problems
understanding that three-variable equations could not be manipulated as two variable
equations, or that they were unable to successfully use the ideal gas law, it was also that
they were compelled to ‘reach up’ to a more general equation when it wasn’t necessary.
11.6 Implications for instruction
The albeit illustrative analysis presented here suggests that the form taken by knowledge
claims may be a significant factor in student achievement in science education.
Specifically, it highlights the potential importance of apprenticeship into appreciating the
degree of context-dependence of meaning that is appropriate at different stages of the
curriculum and for different kind of problems. This in turn has implications for research
into issues such as student conceptions.
In terms of instruction, semantic gravity allows for flexibility across different tasks and
contexts. There may be cases where a larger or smaller semantic gravity range is more
appropriate. It is known, for example, that most physics problems are highly specialised
(Teodorescu, Bennhold, Feldman, & Medsker, 2013). In thermodynamics courses students
are often provided with ‘traditional’ questions: ‘consider an ideal gas in a cylinder with a
frictionless piston…’, or ‘using Charles’s Law, predict …’. However, Interactive Exercise
Three, a ‘context-rich’ question, requires explanation of a real world phenomenon.
Students are expected to reach up the semantic scale from the context-dependent
problem to select which (less context-dependent) concept is appropriate and then move
down the semantic scale to enact this concept in an explanation of the given scenario.
Students find Interactive Exercise Three difficult because, while establishing the
strongest semantic gravity setting required (the concrete example), the question does not
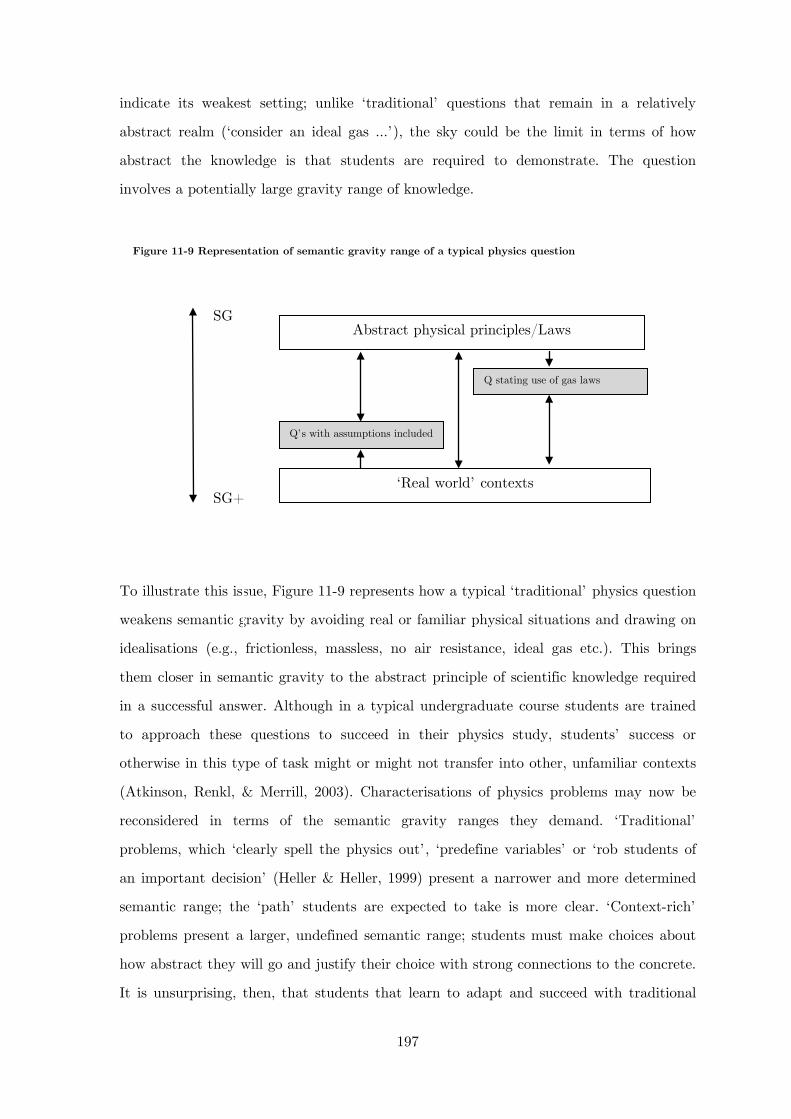
197
indicate its weakest setting; unlike ‘traditional’ questions that remain in a relatively
abstract realm (‘consider an ideal gas …’), the sky could be the limit in terms of how
abstract the knowledge is that students are required to demonstrate. The question
involves a potentially large gravity range of knowledge.
To illustrate this issue, Figure 11-9 represents how a typical ‘traditional’ physics question
weakens semantic gravity by avoiding real or familiar physical situations and drawing on
idealisations (e.g., frictionless, massless, no air resistance, ideal gas etc.). This brings
them closer in semantic gravity to the abstract principle of scientific knowledge required
in a successful answer. Although in a typical undergraduate course students are trained
to approach these questions to succeed in their physics study, students’ success or
otherwise in this type of task might or might not transfer into other, unfamiliar contexts
(Atkinson, Renkl, & Merrill, 2003). Characterisations of physics problems may now be
reconsidered in terms of the semantic gravity ranges they demand. ‘Traditional’
problems, which ‘clearly spell the physics out’, ‘predefine variables’ or ‘rob students of
an important decision’ (Heller & Heller, 1999) present a narrower and more determined
semantic range; the ‘path’ students are expected to take is more clear. ‘Context-rich’
problems present a larger, undefined semantic range; students must make choices about
how abstract they will go and justify their choice with strong connections to the concrete.
It is unsurprising, then, that students that learn to adapt and succeed with traditional
Figure 11-9 Representation of semantic gravity range of a typical physics question
SG
SG+ ‘Real world’ contexts
Abstract physical principles/Laws
Q’s with assumptions included
Q stating use of gas laws

198
problems still exhibit significant conceptual misunderstanding, as both Redish and Mazur
attest (Section 1). Questions like the frosty cylinder problem may require additional
instruction to establish the gravity range appropriate to their solution, either through
extensive modelling by teachers or through making the range explicit using concepts like
‘semantic gravity’ as a meta-language in teaching. However, it may be the case that,
through such exposure and apprenticeship in the structure of physics knowledge,
specifically the semantic gravity range, students may achieve a superior conceptual
understanding.

199
12 Discussion
This project has integrated many existing methods and approaches from science and
physics education research –and beyond –to examine the teaching and learning of
thermodynamics. The subject area of thermodynamics was chosen primarily due to the
paucity of thermal physics concepts covered in the high school curriculum in NSW and
the particular difficulties students have when undertaking first year thermodynamics
courses. Both the level of education and the subject matter have not been studied as
comprehensively as others and many gaps were filled in taking a closer look. However,
the findings from the study also extend beyond specific subject matter.
In the area of improving instruction, existing practices, such as the pre- and post-testing
methodology and Active Learning approaches were adapted and deployed.
The Active Learning program involved a number of Interactive Engagement methods,
most notably, the Interactive Lecture Demonstrations (ILDs). In the first year of the
implementation, where lectures with ILDs were compared against lectures with
Interactive Exercises, a null result in terms of student outcomes was realised. Student’s
attitudes towards both the Interactive Exercises and the ILDs were extremely positive,
indicating there was utility in both approaches. Methodological improvements and a
focus on the characterisation of the lectures were integrated into a second iteration in
2012.
The characterisation of the lectures, particularly in the 2012 implementation using the
full LASE, revealed two main results. Firstly, there was a clear difference in the time
that students were deemed to be ‘interactive’ in the lecture between the two streams
which experienced the ILD program and the two that had the Exercises. This is not
surprising, although the high level of Transmission-Style teaching indicates that this is
the most prevalent form of teaching in thermodynamics. Secondly, in 2012, there were
more marked differences between streams, even amongst lectures of the same ‘type’.
That is, both the two ILD and the two Exercise streams displayed different lecture
200
activity, different student engagement and different learning outcomes. One of the
reasons that the 2011 data were not as conclusive as the 2012 was that in 2011, the
program was new to all lectures and there was a great deal of support from technical
staff and Staff-1 and Researcher B. The higher level of autonomy in 2012 is considered to
have produced a more ‘naturalistic’ implementation.
In terms of the Lecture Activity, as measured by the LA, and with respect to the ILD
streams, ILD1 was found to exhibit more Interactivity overall compared with ILD2. This
difference manifested itself in both the time allocated for interactive activities during the
ILDs as well as during the remainder of the lecture program. For example, in the ILD
program in lecture seven, ILD1 were given more time to discuss with each other during
the prediction phase of the first ILD but were also subject to further class discussions
with clickers or engaged in general ‘Peer Instruction’ type questioning outside of the ILD
activities. There were also differences amongst the two Exercise, or non-ILD, streams.
For instance, Staff-3 had provided more unique time for the completion of the exercises
and referenced the Exercises throughout the lecture program. Figure 8-8 shows that in
lecture 1 and in lecture 3, Staff-3, in EX2 allowed more time for the completion of the
exercises.
Further examination through the evaluation surveys and interviews shows that these
differences were consequential for the students. In 2012, the students in the ILD1 stream,
which exhibited the most Interactivity, for example, said that they had more time to
discuss with their peers and the lecturer and indicated that they understood the concepts
better. They also indicated, more so than ILD2, that they were made aware of their
‘misconceptions’. Students in the non-ILD streams indicated that they found the
Exercises interesting and used them as a basis for thinking about the thermodynamics
concepts. Since Staff-2 in EX1 did not allocate much time for the Exercises, the students
in this streams tended to lament that the Exercises were ‘rushed’ and interfered with
their paying attention in the lectures.
The observations of differences between streams, together with the student’s reports
support the conclusion that these differences influenced student learning outcomes. Using
201
the Thermal Concepts Survey, it was found in 2012 that ILD1, the stream with the Staff-
1, exhibited the highest normalized gain of 0.40, followed closely by ILD2 with a gain of
0.34. The Exercise streams saw gains of 0.28 and 0.27. Staff-1 was the lecturer for ILD1,
which also exhibited the most ‘Interactivity’, both during and separate to the ILD
program.
In addition to these insights, several pertinent questions emerged. Firstly, despite the
medium to high gains, students did not demonstrate consistent, sophisticated
understanding of thermodynamics concepts. This was evidenced by the following:
relatively lower scores in Part II of the TCS, a 37% average score on the thermodynamics
questions in the final exam, and inconsistent explanations of basic thermodynamics
concepts in the interviews. Also, historically, the thermodynamics questions are
consistently the lowest scoring on the first year Physics exam.
Furthermore, when the study had concluded, the program in its entirety was not retained
for the following year (2013), despite both Staff-2 and Staff-3 being allocated the
thermodynamics module (Staff-1 was allocated to a different module). Staff-3 showed
interest in retaining both the Exercises and the TCS, however, both Staff-2 and the new
lecturer allocated to the thermodynamics module did not feel comfortable forgoing one
full lecture for its implementation. For equity reasons, the TCS was therefore not
administered in 2013. The newer staff member and Staff-2 also did not feel comfortable
running the ILDs without support. This indicates that although the lecturers found
aspects of the program useful, significant and continued support is necessary to ensure its
retention.
Finally, the SE part of the LASE indicated that students seemed to be ‘minds on’ during
all kinds of lecture activity, meaning that it is difficult to ascertain what is ‘minds on’
simply through observation. For example, the SE showed that there were periods where
students were seen to be fully engaged in ‘Transmission-Style’ Lecture Activity whilst
also appearing distracted during Interactive Engagement methods. Student interviews
indicated that student’s felt that giving them ‘too much’ time would encourage diversion.
202
These observations may be repositioned as two distinct issues that feature in the PER
literature. The first issue is associated with academic reporting and professional
communication. Although ‘Active Learning’ and associated terminology (Interactive
Engagement, Peer Instruction etc.) are described comprehensively as ‘types’ in the
literature, their interpretation into practice is much less scrutinised; the assumption
seems to be that the ‘type’ will be translated with sufficient fidelity. Since the
implementation of IE methods is highly variable, particularly amongst non-specialists,
the reporting of differences in the ways in which IE methods are implemented and
received is important. This reporting should also include the reporting of null results; if
and when they occur. An implementation that does not achieve a ‘positive’ outcome is
no less important, from the point of view of research, as one that does. Characterisations
which are occurring through observations and tools like the RTOP are welcomed, though
these do not often focus on what the students themselves are doing and are nonetheless
not common practice. Clarity is particularly relevant now, considering that many of the
more successful IE methods which have been reported to occur in very specific contexts
(namely, mechanics first-year calculus-based physics courses in the United States), are
being adapted to ever more international contexts. Success across these contexts
necessarily requires more meticulous characterisation.
The second issue, which has been discussed in detail in the literature review, involves the
inherent limitations in the view held by science and physics education researchers about
the nature of conceptions and of conceptual change. Practical and instructional
developments have depended primarily on the recognition and analysis of large scale
patterns: identifying misconceptions, exploring their characteristics and development,
analysing novices and experts to determine conceptions and other general characteristics
like motivations and ‘epistemologies’ and considering some social aspects. However, many
argue that the utility of these approaches will always be limited if they continue to
develop devoid of theoretical grounding. Many researchers, for example, have already
accepted that we should move beyond simply identifying and describing alternative
conceptions. The direction most are taking is the focus on the individual mind and of
‘knowing’, leaving behind issues surrounding knowledge itself. As Erduran and Scerri put
it: “Schwab (1962) argued that expertise in teaching requires both knowledge of a
203
content of a domain and knowledge about the epistemology of that domain. Teachers
develop the necessary capability of transforming subject into teachable content only
when they know how the disciplinary knowledge is structured” (2002, p. 22). In the
history of the work on conceptions, major advances were made in the presence of deeper
theoretical and epistemological discussions. For instance, highlighting the importance of
the views of children or students altered both the understanding of and approaches to
student understanding. There was also a shift when the ‘social’ aspect of understanding
became more prominent. In the current attempt, a shift, instead, to knowledge was
proposed, advocating the use of Legitimation Code Theory.
The utility of this approach was explored through the concept of ‘semantic gravity’, or
context dependence, which is one of many of the organising principles of knowledge. This
concept was used to analyse responses to a context-rich problem, Interactive Exercise
Three, and was completed by first year Physics students.
The first step in the analysis identified of the presence of combinations of different
strengths of semantic gravity –different semantic ranges –in student responses. The
students in the sample had high school backgrounds in physics (but not thermodynamics)
and produced answers with a clear structure; they tended towards larger semantic
ranges. This suggests that students who learn to ‘play the game’ of physics understand
that physics questions usually demand responses which show different degrees of context-
dependence; either connecting concepts with weaker semantic gravity to stronger, or
through weakening semantic gravity from a very concrete physical situation.
Comparisons made between these, more expert, students and students in junior high
school (albeit answering a different question-Interactive Exercise One), show that the
latter tend to produce responses that have stronger semantic gravity and very small
semantic ranges overall. These students, considered ‘novices’, produce responses that
communicate opinions or are not significantly abstracted from the physical situation
presented in the question.
However, more significantly, when both the structure and content of responses are
considered together, in this instance, students employing knowledge with relatively
204
weaker levels of semantic gravity – signalled by use of the ideal gas law – were more
likely to be unsuccessful. This result suggests that there is an appropriate semantic range
for success and that students who ‘reach too high’ may struggle to traverse the larger
semantic gravity range. Students indicated, during interviews, that knowledge with
weaker semantic gravity was attractive, not due to its relevance to the details of the
question, but due simply to the fact that it had weaker semantic gravity. Students are
tempted by more abstract principles for a variety of reasons and went to extraordinary
lengths to make them work; their decisions were skews by impression of ‘what physics
should be’ instead of how best to approach a problem.
It is unsurprising therefore, that ‘alternative conceptions’ were found to reside in the
level which was of intermediate semantic gravity; neither the strongest or the weakest. It
was in this intermediate level, SG0/
, where the ‘emergent conceptions’ were found. These
emergent conceptions are a shorthand way of communicating the reasoning of the
student. For Interactive Exercise Three, it was the mechanism that caused some aspect
of the freezing outside of the gas cylinder, such as ‘a decrease in pressure is equal to a
decrease in temperature’. The embedding of these conceptions within the greater
structure of the student’s response allowed a more functional conceptualisation of
‘alternative conceptions’ as intermediate links between general principles or as
abstractions from the situation provided in the question. The functionality manifested
itself in both the contextual consideration of the conception, as well as the content of the
conception.
The concept of semantic gravity provides a language with which to interpret
institutional practice in thermal physics. For example, many thermodynamics questions
are based on the ideal gas law. Most of these questions already include various
assumptions (e.g., consider a fixed volume cylinder). Effectively, such questions, known
as ‘traditional’ questions or problems, are popular (and useful) because there is usually a
unique and unambiguous solution that is relatively straightforward to grade. However,
researchers note that students’ achievement on ‘traditional’ problems and ‘conceptual’
problems are vastly different. This may be due to the relative weakening of the semantic
gravity of expected solutions. That is, the ‘typical physics question’ involves weakening
205
the relative semantic gravity and removing the need for students to practice this
themselves. When discussing the strengths of ‘context-rich’ problems compared to
‘traditional’ ones, this was referred to as ‘robbing’ the students of a valuable decision
(Section 3.2.1). Therefore, is it not surprising that there are reports that students are
unable to effectively transfer the learning of general principles to other, unfamiliar
contexts (Atkinson et al., 2003). This is particularly obvious when considering
fundamental understanding, which can remain underdeveloped despite increasing in
expertise in physics more generally, such as Meltzer’s study showing basic understanding
lacking in third year students (Meltzer, 2004).
Beyond question types, the concept of semantic gravity may also aid in considering the
nature of teaching. There have been various arguments for and against the sequencing of
thermodynamics concepts (e.g., Herrmann, 2004). In this very specific case regarding the
ideal gas law, it is possible to introduce its constituents separately. That is, one could
introduce Boyle’s Law, Charles’ Law and Avogadro’s Law, instead of or before the
introduction of the complete form of the ideal gas law. This equates to effectively
strengthening semantic gravity, or bringing the ‘top down’, and may mean that it may
be possible for students to develop more reliable links from the abstract laws to the
individual contexts they are studying. Once mastery within this narrower range of
semantic gravity is achieved, students can progress to working within a wider semantic
range, hopefully, more efficiently. However, it may also be the case that students become
dependent on these stronger gravity ‘crutches’. In either case, the identification of this
structure in allows for greater understanding of both successful and unsuccessful attempts
in teaching these concepts.
In discussing instructional practices, a hypothesis regarding the reported success of the
ILDs may be suggested. Namely, that the ILDs develop the links between the stronger
and weaker levels of semantic gravity. Rather than being simply ‘hands on’ or ‘minds on’
activities, the ILDs are carefully designed to facilitate ‘movement’ between different
strengths of semantic gravity, and the particular concepts are chosen so as to produce
the most effective and dependable links. This ‘movement’ has been otherwise named as
‘connectivity’. Buncick et al., explain:
206
“Connectivity means that the curriculum makes links to students’ concrete experiences,
and that course concepts are not taught in isolation but in relation to one another and to
everyday physical phenomena in which they play a part. Connectivity is fundamental to
both engagement and inclusivity: when students can relate to the material, they are in a
position to participate. Conventional teaching (where concepts are too often abstracted
from everyday physical phenomena and presented as isolated principles) is more likely to
result in a limited dialog between the teacher and a few ‘stars’ who are most comfortable
with the abstract language and imagery of the more experienced scientist.(2001, pp.
1237-1238)
A lack of connectivity has been associated, convincingly, with not only student
difficulties, but also in with attitudes about physics. Tobias and Hake address the
question, ‘what makes science hard’ for science majors and non-majors, citing students
who lament that: “I never really knew where we were heading or how much, in the real
scheme of things, we had already covered. Each topic the professor discusses feels like it’s
being pulled out of a hat” (Hake 1987, p. 162). The opposite should therefore also true:
that facilitating the connectivity should encourage deeper understanding of physics (and
a better attitude towards it). The concept of semantic gravity is one way of
conceptualising ‘connectivity’. It’s operationalisation in analysing demonstrations in
particular should prove fruitful, particularly as it is noted that some demonstrations are
more effective at encouraging conceptual understanding than others.
The concept of ‘connectivity’ or this ‘movement’ is not only underscored in physics
knowledge. Studies using the LCT concept of semantic gravity have resulted in the
production of a representation of the changes in the relative strengths of semantic gravity
over time (Figure 12-1). This simple representation is known as the ‘semantic wave’.
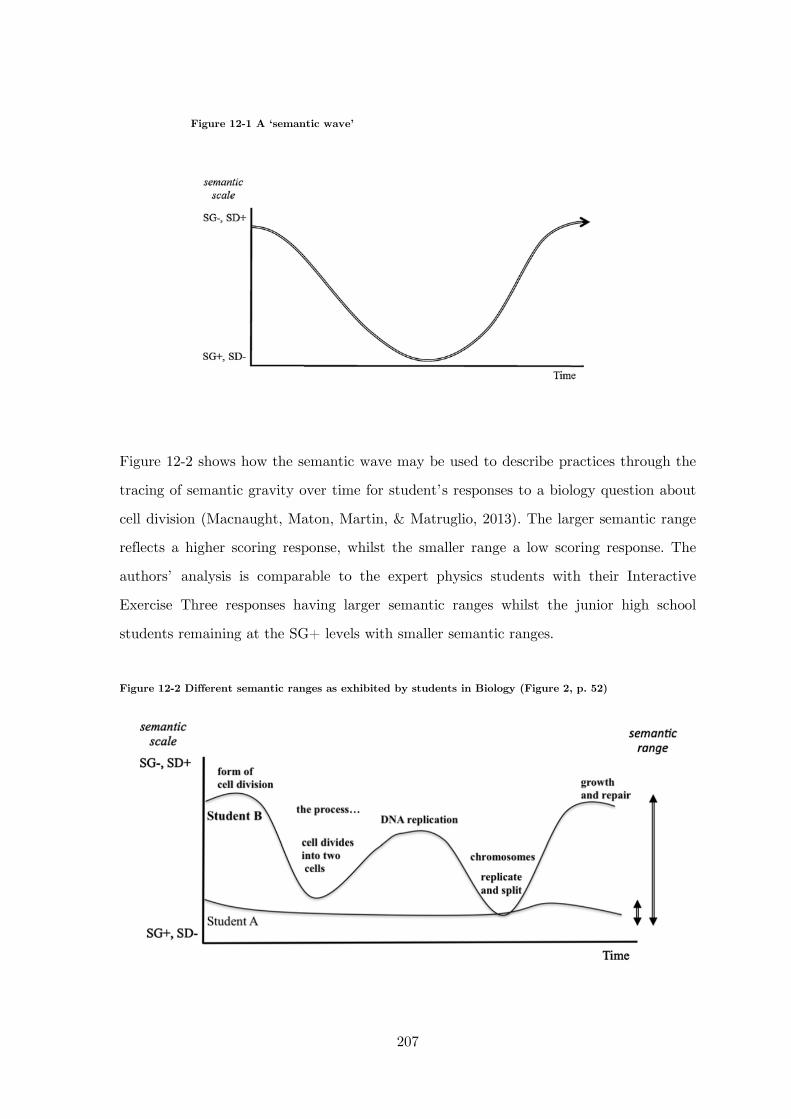
207
Figure 12-2 shows how the semantic wave may be used to describe practices through the
tracing of semantic gravity over time for student’s responses to a biology question about
cell division (Macnaught, Maton, Martin, & Matruglio, 2013). The larger semantic range
reflects a higher scoring response, whilst the smaller range a low scoring response. The
authors’ analysis is comparable to the expert physics students with their Interactive
Exercise Three responses having larger semantic ranges whilst the junior high school
students remaining at the SG+ levels with smaller semantic ranges.
Figure 12-2 Different semantic ranges as exhibited by students in Biology (Figure 2, p. 52)
Figure 12-1 A ‘semantic wave’

208
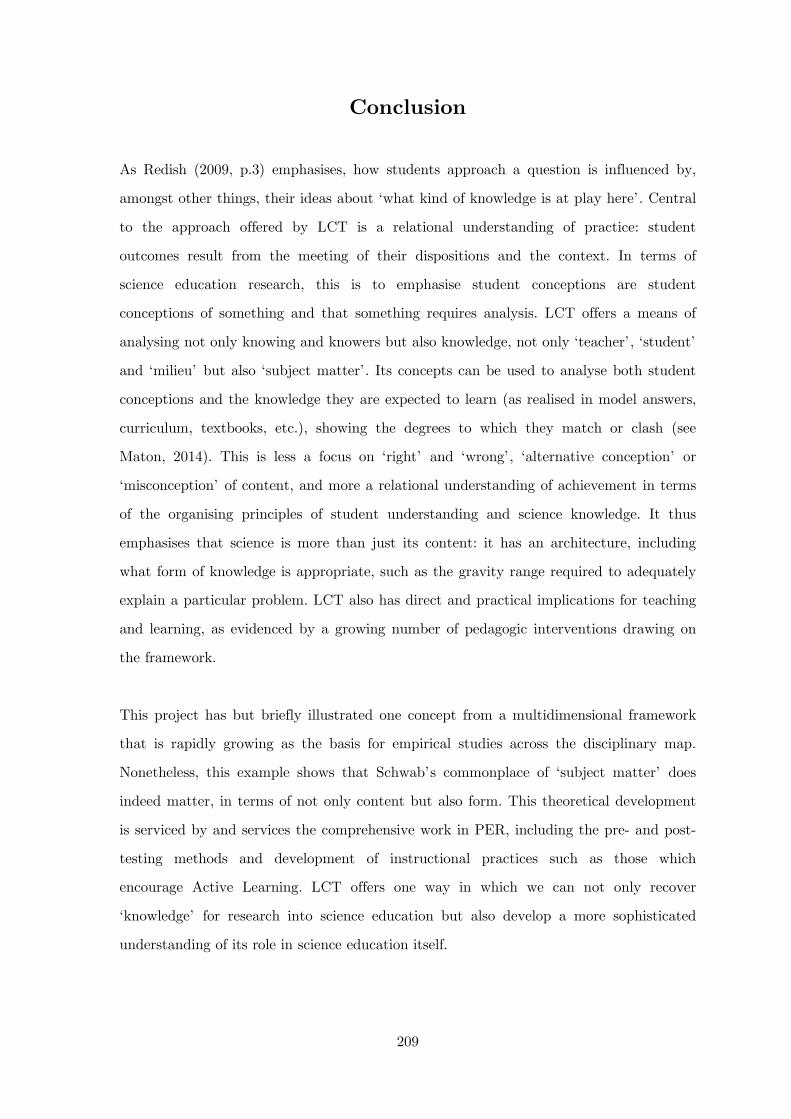
209
Conclusion
As Redish (2009, p.3) emphasises, how students approach a question is influenced by,
amongst other things, their ideas about ‘what kind of knowledge is at play here’. Central
to the approach offered by LCT is a relational understanding of practice: student
outcomes result from the meeting of their dispositions and the context. In terms of
science education research, this is to emphasise student conceptions are student
conceptions of something and that something requires analysis. LCT offers a means of
analysing not only knowing and knowers but also knowledge, not only ‘teacher’, ‘student’
and ‘milieu’ but also ‘subject matter’. Its concepts can be used to analyse both student
conceptions and the knowledge they are expected to learn (as realised in model answers,
curriculum, textbooks, etc.), showing the degrees to which they match or clash (see
Maton, 2014). This is less a focus on ‘right’ and ‘wrong’, ‘alternative conception’ or
‘misconception’ of content, and more a relational understanding of achievement in terms
of the organising principles of student understanding and science knowledge. It thus
emphasises that science is more than just its content: it has an architecture, including
what form of knowledge is appropriate, such as the gravity range required to adequately
explain a particular problem. LCT also has direct and practical implications for teaching
and learning, as evidenced by a growing number of pedagogic interventions drawing on
the framework.
This project has but briefly illustrated one concept from a multidimensional framework
that is rapidly growing as the basis for empirical studies across the disciplinary map.
Nonetheless, this example shows that Schwab’s commonplace of ‘subject matter’ does
indeed matter, in terms of not only content but also form. This theoretical development
is serviced by and services the comprehensive work in PER, including the pre- and post-
testing methods and development of instructional practices such as those which
encourage Active Learning. LCT offers one way in which we can not only recover
‘knowledge’ for research into science education but also develop a more sophisticated
understanding of its role in science education itself.

211
References
Abimbola, I. O. (1988). The problem of terminology in the study of student conceptions in science. Science Education, 72, 175-184.
Alexander, P. A., Murphy, P. K., & Woods, B. S. (1996). Of squalls and fathoms: navigating the seas of educational innovation. Educational Researcher, 25, 31.
Anderson, W. L., Mitchell, S. M., & Osgood, M. P. (2008). Gauging the gaps in student problem-solving skills: assessment of individual and group use of problem-solving strategies using online discussions. CBE Life Sciences Education, 7, 254-262.
Andrews, T. M., Leonard, M. J., Colgrove, C. A., & Kalinowsky, S. T. (2011). Active leaning not associated with student learning in a random sample of college biology courses. CBE life sciences education, 10, 394-405
Ashworth, P., & Lucas, U. (1998). What is the 'world' of phenomenography. Scandinavian Journal of Educational Research, 42(4), 415.
Atkinson, R. K., Renkl, A., & Merrill, M. M. (2003). Transitioning from studying examples to solving problems: Effects of self-explanation prompts and fading worked-out steps. Journal of Educational Psychology, 95, 774-783.
ACARA (Australian Curriculum and Reporting Agency) (2012). NAPLAN Achievement in Reading, Persuasive Writing, Language Conventions and Numeracy: National Report for 2012, Sydney.
Ausubel, D. (1968). Educational Psychology: A Cognitive View. New York and Toronto: Holt, Rinehart and Winston.
Bar, V., & Gallili, I. (1994). Stages of children's views about evaporation. International journal of science education, 16(2), 157-174.
Bauer, W. (2013). Conceptual Change Research in TVET. In L. Deitmer, U. Hauschildt, F. Rauner & H. Zelloth (Eds.), The Architecture of Innovative Apprenticeship (Vol. 18, pp. 219-229): Springer Netherlands.
Beichner, R. J., Saul, J. M., Abbott, D. S., Morse, J. J., Deardorff, D. L., Allain, R. J., . . . J.S, R. (2007). The Student-Centered Activities for Large Enrollment Undergraduate Programs (SCALE-UP) project. Research-based reform of introductory physics. http://www.compadre.org/PER/per_reviews/media/volume1/SCALE-UP-2007.pdf
Bentley, D., & Watts, M. (1994). Primary Science and Technology. Buckhingham: Open University Press.
Bernstein, B. (1999). Vertical and horizontal discourse: an essay. British Journal of Sociology and Education, 20(2).
212
Beuckman, J., Rebello, N. S., & Zollman, D. (2007). Impact of a classroom interaction system on student learning. In L. McCullough, L. Hsu & P. Heron (Eds.), 2006 Physics Education Research Conference (Vol. 883, pp. 129-132).
Biggs, J. B., & Collis, K. F. (1982). Evaluating the Quality of Learning: The SOLO taxonomy. New York: Academic Press.
Bloom, B. S. (1976). Human characteristics and school learning: McGraw-Hill.
Bodner, G. M. (1986). Constructivism- A Theory of Knowledge. Journal of Chemical Education, 63(10), 873-878.
Bonwell, C. C., & Eison, J. A. (1991). Active Learning: creating excitement in the classroom. In E. digest (Ed.). Washington DC: George Washington University.
Boudreaux, A., & Campbell, C. (2012a). Student Understanding of Liquid-Vapor Phase Equilibrium. Journal of Chemical Education, 89(6), 707-714.
Boulton-Lewis, G. (1994). Tertiary students' knowledge of their own learning and a solo taxonomy. Higher Education, 28(3), 387-402.
Brady, M., Seli, H., & Rosenthal, J. (2013). "Clickers" and metacognition: A quasi-experimental comparative study about metacognitive self-regulation and use of electronic feedback devices. Computers & Education, 65, 56-63.
Buncick, M. C., Betts, P. G., & Horgan, D. D. (2001). Using demonstrations as a contextual road map: enhancing course continuity and promoting active engagement in introductory college physics. International Journal of Science Educationm 23(12), 1237-1255.
Buntine, M. A., Read, J. R., Barrie, S. C., Bucat, R. B., Crisp, G. T., George, A. V., . . . Kable, S. H. (2007). Advancing Chemistry by Enhancing Learning in the Laboratory (ACELL): a model for providing professional and personal development and facilitating improved student laboratory learning outcomes. Chemistry Education Research and Practice, 8(2), 232-254.
Burkhardt, H., & Schoenfeld, A. H. (2003). Improving Educational Research:Toward a More Useful, More Influential, and Better-Funded Enterprise. Educational Researcher, 32(3), 3-14.
Caldwell, J. E. (2007). Clickers in the large classroom: current research and best-practice tips. CBE life sciences education, 6(1), 9-20.
Caleon, I. S., & Subramaniam, R. (2010). Do Students Know What They Know and What They Don't Know? Using a Four-Tier Diagnostic Test to Assess the Nature of Students' Alternative Conceptions. Research in Science Education, 40(3), 313-337.
Camp, G. (1996). Problem-based learning: A pradigm shift or a passing fad? Medical Education Online, 1. http://med-ed-online.net/index.php/meo/article/view/4282
Caravita, S., & Halldén, O. (1994). Re-framing the problem of conceptual change. Learning and Instruction, 4(1), 89-111.
213
Carey, S. (1985). Conceptual Change in Childhood. Cambridge, MA: MIT Press.
Carvalho, L., Maton, K., Dong, A. (2014). LCT into praxis: Creating an e-learning environment for informal learning. In S. Hood. K. Maton, & S. Shay (eds.), Knowledge-building: Educational studies in Legitimation Code Theory. London: Routledge.
Case, R., & Fry, C. (1973). Evaluation of an attempt to teach scientific inquiry and criticism in a working class high school. Journal of Research in Science Teaching, 10, 135-142.
Chan, C. C., Tsui, M. S., Chan, M. Y. C., & Hong, J. H. (2002). Applying the Structure of the Observed Learning Outcomes (SOLO) Taxonomy on Student's Learning Outcomes: An empirical study. Assessment & Evaluation in Higher Education, 27(6), 511-527.
Chang, Y. H., Chang, C. Y., & Tseng, Y. H. (2010). Trends of Science Education Research: An Automatic Content Analysis. Journal of Science Education and Technology, 19(4), 315-331.
Chen, R., Maton, K. (2014). LCT and qualitative research: Creating a language of description to study constructivist pedagogy’. In S. Hood. K. Maton, & S. Shay (eds.), Knowledge-building: Educational studies in Legitimation Code Theory. London: Routledge.
Chi, M. T. H (1992). Conceptual Change within and across ontological categories: Examples from learning and in science. In Giere (Ed.), Cognitive Models of Science: Minnesota studies in the philosophy of science (pp. 129-186). Minneapolis, MN: University of Minnesota Press.
Chi, M. T. H. (2000). Cognitive understanding levels. In A. Kazkin (Ed.), Encyclopedia of Psychology (pp. 146-151): APA and Oxford University Press.
Chi, M. T. H., Feltovich, P. J., & Glaser, R. (1981). Categorization and representation of physics problems by experts and novices. Cognitive Science, 5(2), 121-152.
Chick, H. (1998). Cognition in the formal modes: Research mathematics and the SOLO taxonomy. Mathematics Education Research Journal, 10(2), 4-26. doi: 10.1007/BF03217340
Clark, D. B. (2006). Longitudinal conceptual change in students' understanding of thermal equilibrium: An examination of the process of conceptual restructuring. Cognition and Instruction, 24(4), 467-563.
Constas, M. A., & Ripple, R. E. (1987). Educational psychology: Origins of a dichotomy and the parallel dependence model. Contemporary Educational Psychology, 12(1), 42-51.
Cox, M. F., & Cordray, D. S. (2008). Assessing Pedagogy in Bioengineering Classrooms: Quantifying Elements of the "How People Learn" Model Using the VaNTH Observation System (VOS). Journal of Engineering Education, 97(4), 413-431.
214
Cox, M. F., & Harris, A. H. (2003). Developing an observation system to capture instructional differences in engineering classrooms. Journal of Engineering education, 92(4), 329-336.
Crouch, C. H. Fagen, A P. Callan, J.P, Mazur, E. (2004). Classroom demonstrations: Learning tools or entertainment? American Journal of Physics, 72(6).
Cummings, K. (2013). A community-based report of the developmental history of PER. Paper presented at the American Association of Physics Teachers, Portland, Oregon.
Cummings, K., Marx, J., Thornton, R., & Kuhl, D. (1999). Evaluating innovation in studio physics. American Journal of Physics, 67(7), S38-S44.
Ding, L., & Liu, X. (2012). Getting Started with Quantitative Methods in Physics Education Research. Getting Started in PER, Reviews in PER Vol. 2. http://www.per-central.org/items/detail.cfm?ID=12601
diSessa, A. A. (1993). Toward an epistemology of physics. Cognition and Instruction, 10(2/3), 105-225.
diSessa, A. A. (1996). What do "just plain folk" know about physics? In D. R. Olsen &. Torrance, N. (Eds.), The Handbook of Education and Human Development: New Models of Learning, Teaching and Schooling (pp. 709-730). Cambridge: Blackwell.
diSessa, A. A. (2006). A history of conceptual change research: Threads and fault lines. In K. Sawyer (Ed.), The Cambridge Handbook of the Learning Sciences. New York: Cambridge University Press.
Doige, C. A., & Day, T. (2012). A Typology of Undergraduate Textbook Definitions of 'Heat' across Science Disciplines. International Journal of Science Education, 34(5), 677-700.
Draper, S. W., & Brown, M. I. (2004). Increasing interactivity in lectures using an electronic voting system. Journal of Computer Assisted Learning, 20(2), 81-94.
Driver, R., Asoko, H., Leach, J., Mortimer, E., & Scott, P. (1994). Constructing scientific knowledge in the classroom. Educational Researcher, 23, 5-12.
Driver, R., & Easley, J. (1978). Pupils and paradigms: A review of the literature related to concept development in adolescent science students. Studies in Science Education, 5, 61-84.
Driver, R., & Tiberghien, A. (1985). Children's Ideas in Science (R. G. Driver, Edith & A. Tiberghien Eds.). Philadelphia: Open University Press.
Duit, R. (2009). Bibliography- STCSE (Students' and Teachers' Conceptions and Science Education). Retrieved 13/08/2013 http://www.ipn.uni-kiel.de/aktuell/stcse/
Duschl, R. A. (1988). Abandoning the scientistic legacy of science education. Science Education, 72(1), 51-62.
Einstein, A. (1973). Albert Einstein: Philosopher -Scientist. La Salle, IL: Open Court Publishing Company.
215
Elby, A., & Hammer, D. (2001). On the substance of a sophisticated epistemology. Science Education, 85, 554-567.
Elstein, A. S. (1994). What goes around comes around: Return of the hypothetico‐deductive strategy. Teaching and Learning in Medicine: An International Journal, 6(2), 121-123.
Engelhardt, P. V. (2009). An introduction to classical test theory as applied to conceptual multiple-choice tests. Reviews in PER: Getting started in PER. College Park, MD: American Association of Physics Teachers. Retrieved from http://www.per-central. org/document/ServeFile.cfm.
Enghag, M., Gustafsson, P., & Jonsson, G. (2007). From everyday life experiences to physics understanding occurring in small group work with context rich problems during introductory physics work at university. Research in Science Education, 37(4), 449-467.
Enghag, M., Gustafsson, P., & Jonsson, G. (2009). Talking physics during small-group work with context-rich problem – analysied from an ownership persepctive. International Journal of Science and Mathematics Education, 7(3), 455-472.
Erduran, S., & Scerri, E. (2003). The nature of chemical knowledge and chemical education. In Chemical education: Towards research-based practice (pp. 7-27). Springer Netherlands..
Erickson, G. L. (1979). Childrens concpetions' of heat and temperature. Science Education, 63(2), 221-230.
Erickson, G. L. (1980). Childrens viewpoints of heat: a second look. Sceince Education, 64(3), 323-336.
Fallon, M., & Forrest, S. L. (2011). High-Tech Versus Low-Tech Instructional Strategies: A Comparison of Clickers and Handheld Response Cards. Teaching of Psychology, 38(3), 194-198.
Farrington, I. (1991). Student‐Centred Learning: Rhetoric and Reality? Journal of Further and Higher Education, 15(3), 16-21.
Feldon, D. F. (2007). The implications of research on expertise for curriculum and pedagogy. Educational Psychology Review, 19, 91-110.
Fensham, P. J. (2004). Defining an Identity: The Evolution of Science Education as a Field of Research Dordrecht, The Netherlands: Kluwer Academic Publishers.
Francek, M. (2013). A Compilation and Review of over 500 Geoscience Misconceptions. International Journal of Science Education, 35(1), 31-64.
Galili, I. (2011). Cultural content knowledge in Physics education. Paper presented at the Australian Conference on Science and Mathematics Education, Melbourne.
Galton, M. (2000). Integrating theory and practice: teachers' perspectives on educational research. Paper presented at the ESRC teaching and learning research programme,
216
first annual conference, University of Leicester. http://www.leeds.ac.uk/educol/documents/00003247.htm
Garrett, R. M., & Roberts, I. F. (1982). Demonstration versus small group practical work in science education. A critical review of studies since 1900. Studies in science education, 9(1), 109.
Gauld, C. (1987). Student beliefs and cognitive structure. Research in Science Education, 17(1), 87-93.
Georgiou, H. (2009). An Exploration of Tertiary students’ Conceptions of Familiar Thermodynamic Processes. (Science Honours Thesis), University of Sydney, Sydney.
Georgiou, H., Sharma, M., O'Byrne, J., & McInnes, B. (2009). University students' conceptions about familiar thermodynamic processes and the implications for instruction. Paper presented at the Uniserve Science, Sydney.
Georgiou, H., & Sharma, M. D. (2010). A Report on a Preliminary Diagnostic for Identifying Thermal Physics Conceptions of Tertiary Students. International Journal of Innovation in Science and Mathematics Education, 18, 32-51.
Georgiou, H., & Sharma, M. (2011). University students' understanding of thermal physics in everyday contexts. The International Journal of Science and Mathematics Education, 1-24.
Georgiou, H., Sharma, M. (2012). Why it is important to publish ‘null’ results: A project involving no change in learning gains from Interactive Lecture Demonstrations in first year thermal physics. Paper presented at the World Conference on Physics Education, Istanbul.
Gick, M. L. (1986). Problem-solving strategies. Educational Psychologist, 21(1-2), 99-120.
Granger, E. M., Bevis, T. H., Saka, Y., Southerland, S. A., Sampson, V., & Tate, R. L. (2012a). The Efficacy of Student-Centered Instruction in Supporting Science Learning. Science, 338(6103), 105-108.
Greene, M. (1994). Epistemology and educational research - The influence of recent approaches to knowledge. Review of Research in Education, 20, 1994, 20, 423-464.
Guzzetti, B., & Hynd, C. (1998). Perspectives on conceptual change. Mahwah, New Jersey: Lawrence Erlbaum Associates.
Hake, R. R. (1987). Promoting student crossover to the Newtonian world. American Journal of Physics, 55, 878.
Hake, R. R. (1998). Interactive-engagement versus traditional methods: A six-thousand-student survey of mechanics test data for introductory physics courses. American Journal of Physics, 66(1), 64-74.
Halloun, I. A., & Hestenes, D. (1985). The initial knowledge state of college physics students. American Journal of Physics, 53(11), 1043-1055.
217
Heller, K., & Heller, P. (1999). Context-Rich problems. University of Minnesota Physics Education Research group. http://groups.physics.umn.edu/physed/Research/CRP/crintro.html
Helm, H. (1980). Misconceptions in physics amongst South African students. Physics Education, 15(2), 93-105.
Helms, J. V., & Carlone, H. B. (1999). Science Education and the Commonplaces of Science. Science Education, 83, 233-245.
Henderson, C., & Dancy, M. H. (2008). Physics faculty and educational researchers: Divergent expectations as barriers to the diffusion of innovations. American Journal of Physics, 76(1), 79-91
Herrmann, F. (2004). Entropy from the beginning. Paper presented at the GIREP, Ostrava.
Hestenes, D., Wells, M., & Swackhamer, G. (1992). Force concept inventory. Physics Teacher, 141-158.
Hewson, P. W. (1981). A conceptual change approach to learning science. European Journal of Science Education, 3, 383-396.
Hodges, L. C., & Harvey, L. C. (2003). Evaluation of student learning in organic chemistry using the SOLO taxonomy. Journal of Chemical Education, 80(7), 785-787.
Hofstein, A., & Lunetta, V. N. (2004). The laboratory in science education: Foundations for the twenty-first century. Science Education, 88(1), 28-54.
Hurley, J. (2005). Truth is beauty, beauty is thermodynamics. American Physical Society Forum on Education Newsletter, Spring.
Jimoyiannis, A. (2011). Using SOLO taxonomy to explore students’ mental models of the programming variable and the assignment statement. Themes in Science and Technology Education, 4(2), 53-74.
John-Steiner, V., & Mahn, H. (1996). Sociocultural approaches to learning and development: A vygotskian framework. Educational Phychologist, 31(3/4), 191-206.
Jones, C., & Asensio, M. (2001). Experiences of assessment: using phenomenography for evaluation. Journal of computer assisted learning, 17, 314-321.
Kautz, C. H., Heron, P. R. L., Loverude, M. E., & McDermott, L. C. (2005). Student understanding of the ideal gas law, Part I: A macroscopic perspective. American Journal of Physics, 73(11), 1055-1063.
Kautz, C. H., Heron, P. R. L., Shaffer, P. S., & McDermott, L. C. (2005). Student understanding of the ideal gas law, Part II: A microscopic perspective. American Journal of Physics, 73(11), 1064-1071.
218
Kay, R. H., & LeSage, A. (2009). Examining the benefits and challenges of using audience response systems: A review of the literature. Computers & Education, 53(3), 819-827.
Keller, C., Finkelstein, N., Perkins, K., Pollock, S., Turpen, C., & Dubson, M. (2007). Research-based practices for effective clicker use. In L. Hsu, C. Henderson & L. McCullough (Eds.), 2007 Physics Education Research Conference (Vol. 951, pp. 128-131).
Kesidou, S., & Duit, R. (1993). Students conceptions of the 2nd law of thermodynamics - an interpretive study. Journal of Research in Science Teaching, 30(1), 85-106.
Kilpert, L., & Shay, S. (2013). Kindling fires: examining the potential for cumulative learning in a Journalism curriculum. Teaching in Higher Education, 18, 40-52.
Kirschner, P. A., Sweller, J., & Clark, R. E. (2006). Why minimal guidance during instruction does not work: An analysis of the failure of constructivist, discovery, problem-based, experiential, and inquiry-based teaching. Educational Psychologist, 41, 75-86.
Knight, J. K., & Wood, W. B. (2005). Teaching more by lecturing less. Cell biology education, 4(4), 298-310
Krathwohl, D. R. (2002). A revision of Bloom's taxonomy: An overview. Theory into practice, 41(4), 212-218.
Lake, D. (1999). Helping students to go SOLO: teaching critical numeracy in the biological sciences. Journal of Biological Education, 33(4), 191-198.
Lamont, A., & Maton, K. (2008). Choosing music: Exploratory studies into the low uptake of music GCSE. British Journal of Music Education, 25(03), 267-282.
Lamont, A., & Maton, K. (2010). Unpopular music: Beliefs and behaviours towards music in education. In R. Wright (Ed.), Sociology and music education (pp. 63-80). London: Ashgate.
Larkin, J., McDermott, J., Simon, D. P., & Simon, H. A. (1980). Expert and novice performance in solving physics problems. Science, 208(4450), 1335-1342.
Larkin, J. H. (1983). The role of problem representation in physics. Mental Models (pp. 77-98). Hillsdale, NJ: Lawrence Erlbaum Associates.
Lasry, N. (2008). Clickers or Flashcards: Is there really a difference? The Physics Teacher, 46. http://scitation.aip.org.ezproxy1.library.usyd.edu.au/journals/doc/PHTEAH-ft/vol_46/iss_4/242_1.html
Lasry, N., Mazur, E., & Watkins, J. (2008). Peer instruction: From Harvard to the two-year college. American Journal of Physics, 76(11), 1066-1069.
Lather, P. (2004). Scientific research in education: A critical perspective1. British Educational Research Journal, 30(6), 759-772.
219
Leach, J. T., & Scott, P. H. (2008). Teaching for conceptual understanding: An approach drawing on individual and sociocultural perspectives. In S. Vosniadou (Ed.), International Handbook of Research on Conceptual Change. New York: Routledge.
Lee, M. H., Wu, Y. T., & Tsai, C. C. (2009). Research Trends in Science Education from 2003 to 2007: A content analysis of publications in selected journals. International Journal of Science Education, 31(15), 1999-2020.
Lelliott, A. (2013). Understanding Gravity: The Role of a School Visit to a Science Centre. International Journal of Science Education, Part B, 1-18.
Lindstrøm, C. (2012). Cumulative knowledge-building in a hierarchically knowledge structured discipline: teaching university physics to novices. Paper presented at the Seventh International Bernstein Symposium, Aix-en-Provence.
Linn, M. C. (1993). How do students make sense of science? Merill-Palmer Quartlerly, 39(1), 47-73.
Linn, M. C., & Their, H. D. (1975). The effect of experiential science on development of logical thinking in children. The effect of experiential science on development of logical thinking in children, Journal of Research in Science Teaching(12), 49-62.
Loverude, M. E., Kautz, C. H., & Heron, P. R. L. (2002). Student understanding of the first law of thermodynamics: Relating work to the adiabatic compression of an ideal gas. American Journal of Physics, 70, 137-148.
Luckett, K. (2012). Disciplinarity in question: comparing knowledge and knower codes in sociology. Research Papers in Education, 27, 19-40.
MacArthur, J. R., & Jones, L. L. (2008). A review of literature reports of clickers applicable to college chemistry classrooms. Chemistry Education Research and Practice, 9(3), 187-195.
Macnaught, L., Maton, K., Martin, J. R., & Matruglio, E. (2013). Jointly constructing semantic waves: implications for teacher training. Linguistics and Education, 24, 50-63.
Martin, J. L. (2012). Instantiation, realisation and multimodal musical semantic waves. Paper presented at the International Systemic Functional Congress,, Sydney: ISFC.
Martin, J., Maton, K. (2013). Cumulative knowledge-building in secondary schooling: Guest editors’ preface. Linguistics and Education, 24(1), 1-3.
Marton, F. (1981). Phenomenography - Describing conceptions of the world around us. Instructional Science, 10, 177-200.
Marx, J. D., & Cummings, K. (2007). Normalized change. American Journal of Physics, 75, 87-91.
Maton, K. (2008). Grammars of Sociology: How to build knowledge or win friends and influence people. Paper presented at the Fifth International Basil Bernstein Symposium,, Cardiff, UK.
220
Maton, K. (2010). Analysing knowledge claims and practices: Languages of legitimation. In K. M. Moore, amp & Rob (Eds.), Social realism, knowledge and the sociology of education: coalitions of the mind. London: Continuum.
Maton, K. (2013). Making semantic waves: A key to cumulative knowledge-building. Linguistics and Education, 24, 8-22.
Maton, K. (2014). Knowledge and Knowers: Towards a realist sociology of education. London: Routledge.
Maton, K., Hood, S., & Shay, S., (Eds.) (2014) Knowledge-building: Educational studies in Legitimation Code Theory. London: Routledge.
Maton, K., & Moore, R. (2010). Social realism, knowledge and the sociology of education: Coalitions of the mind: Continuum International Publishing Group.
Matteson, H. D., & Kambly, P. E. (1940). Knowledge of science possessed by pupils entering seventh grade. School Science and Mathematics, 40(3), 244-247.
Matthews, M. R. (1994). Science Teaching: the role of History and Philosophy of Science. New York: Routledge.
Mazur, E. (2001). Peer Instruction: Ten years of experience and results. American Journal of Physics, 69(9), 970-977.
Mazur, E. (2007). Confessions of a converted lecturer. This paper, which accompanies a lecture delivered in May 2007 in Oporto, Portugal is adapted from Peer Instruction: A users Manual (Prentice Hall, 1997) by Eric Mazur.
McCloskey, M. (1983). Intuitive Physics. Scientific American, 248(4), 122-130.
McDermott, L. C. (1990). A view from physics. In Marjorie Gardner, James G. Greeno, Frederick Reif, Alan H. Schoenfeld, Andrea A. diSessa
McDermott, L. C. (2001). Oersted Medal Lecture 2001: "Physics Education Research—The Key to Student Learning". American Journal of Physics, 69(11).
(Eds.), Toward a Scientific Practice of Science Education (pp. 3-31). Hillsdale, New Jersey: Laurence Erlbaum Associates.
McDermott, L. C., & Redish, E. F. (1999). Resource Letter: PER-1: Physics Education Research. American Journal of Physics, 67(9), 12.
McDermott, L. C, & Shaffler, P. (2002). Tutorials In Introductory Physics. Upple Saddle River, NJ: Prentice Hall.
Meltzer, D. E. (2004). Investigation of students' reasoning regarding heat, work, and the first law of thermodynamics in an intriductory calculus-based general physics course. American Journal of Physics, 72(11), 1432-1446.
Meltzer, D. E., & Manivannan, K. (2002). Transforming the lecture-hall environment: The fully interactive physics lecture. American Journal of Physics, 70(6), 639-654.
221
Meyer, J. H. G., & Land, R. (2006). Threshold concepts and troublesome knowledge: An Introduction. In J.H.F. Meyer, and R. Land (eds), Overcoming Barriers to Student Understanding: Threshold concepts and troublesome knowledge. New York: Routledge.
Millar, R. (1989). Constructive criticisms. International Journal of Science Education, 11(5), 587-596.
Minstrell, J. (2001). Facets of students' thinking: Designing to cross the gap from research to standards-based practice. In K. Crowley, C. D. Schunn & T. Okada (Eds.), Designing for Science: Implications for Professional, Instructional, and Everyday Science (pp. 415-443). Mahwah: Lawrence Erlbaum Associates.
Moore, R. (2009). Towards the sociology of truth: Continuum International Publishing Group.
Morais, A. M. (2002). Basil Bernstein at the micro level of the classroom. British Journal of Sociology of Education, 23(4),
Morris, G. A., Branum-Martin, L., Harshman, N., Baker, S. D., Mazur, E., Dutta, S., . . . McCauley, V. (2006). Testing the test: Item response curves and test quality. American Journal of Physics, 74(5),
Morris, R. J. (1972). Lavoisier and the Caloric Theory. The British Journal for the History of Science, 6, 39.
New South Wales. Board of Studies. (2003). Science : stages 4-5 : syllabus. Retrieved 13/8/2013 http://www.boardofstudies.nsw.edu.au/syllabus_sc/
Nussbaum, J., & Novak, J. D. (1976). An assessment of children's concepts of the earth utilizing structure interviews. Science Education, 60(4), 535-550.
Osborne, J. F. (1996). Beyond constructivism. Science Education, 80(1), 53-82.
Otero, V. K., & Harlow, D. B. (2009). Getting Started in Qualitative Physics Education Research. Reviews in PER Vol. 2.
Özdemir, G., & Clark, D. B. (2007). An overview of conceptual change theories. Eurasia Journal of Mathematics, Science & Technology Education, 3(4), 351-361.
PISA. (2009). (OECD Programme for International School Assessment). Retrieved 13/8/2013 http://pisa2009.acer.edu.au/
Posner, G. J., Strike, K. A., Hewson, P. W., & Gertzog, W. A. (1982). Accommodation of a scientific conception:Toward a theory of conceptual change. Science Education, 66(2), 211-277.
Prince, M. (2004). Does Active Learning work? A review of the research. Journal of Engineering Education, 93, 223-231.
Prince, M., Vigeant, M., & Nottis, K. (2012). Development of the Heat and Energy Concept Inventory: Preliminary Results on the Prevalence and Persistence of
222
Engineering Students' Misconceptions. Journal of Engineering Education, 101(3), 412-438.
Redish, E. F. (1999). Millikan Lecture 1998: Building a science of teaching physics. American Journal of Physics, 67(7), 562-573.
Redish, E. F. (2004). A theoretical framework for physics education research: Modeling student thinking. Paper presented at the Proceedings of the Enrico Fermi Summer School, Course CLVI.
Redish, E. F., & Bing, T. J. (2009). Analyzing problem solving using math in physics: epistemological framing via warrents. Physical Review Special Topics- Physics Education Research, 5.
Redish, E. F., Saul, J. M., & Steinberg, R. N. (1998). Student expectations in introductory physics. American Journal of Physics, 66(3), 212-224.
Reif, F., (2000). Telephone Interview quoted in Cummings (2013)
Richardson, J. T. E. (1999). The concepts and methods of phenomenographic research. Review of Educational Research, 69, 53-82.
Riding, R. J., & Wheldall, K. (1981). Effective Educational Research. Educational Psychology, 1(1), 5-11.
Romer, R. H. (2001). Heat is not a noun. American Journal of Physics, 69(2), 3.
Schwab, J. J. (1978). Science, curriculum, and liberal education. Chicago: University of Chicago Press.
Scribner, C. (1963). Henri Poincaré and the principle of relativity. American Journal of Physics, 32, 673.
Shalem, Y., & Slonimsky, L. (2010). Seeing epistemic order: Construction and transmission of evaluative criteria. British Journal of Sociology Education, 31, 755-778.
Sharma, M., Millar, R., Smith, A., & Sefton, I. M. (2004). Students' Understandings of Gravity in an Orbiting Space-Ship. Research in Science Education, 34, 267–289.
Sharma, M. D., Johnston, I. D., Johnston, H., Varvell, K., Robertson, G., Hopkins, A., . . . Thornton, R. (2010). Use of interactive lecture demonstrations: A ten year study. Physical Review Special Topics-Physics Education Research, 6.
Sharma, M. D., Khachan, J., Chan, B., & O'Byrne, J. (2005). An investigation of the effectiveness of electronic classroom communication systems in large lecture classes. Australasian Journal of Educational Technology, 21, 137-154.
Sharma, M. D., Mendez, A., & O'Byrne, J. (2005). The Relationship Between Attendance in Student-Centred Physics Tutorials and Performance in University Examinations. International Journal of Science Education, 27(11), 1375-1389.

223
Shay, S., & Steyn, D. (2014). Enabling knowledge progression in vocational curricula: Design as a case study. In S. Hood. K. Maton, & S. Shay (Eds.), Knowledge-building: Educational studies in Legitimation Code Theory. London: Routledge.
Shayer, M., & Wylam, H. (1981). The development of the concepts of heat and temperature in 10-13 year-olds. Journal of research in science teaching, 18(5), 419-434.
Shulman, L. S. (1986). Those Who Understand: Knowledge Growth in Teaching. Educational Researcher, 15(2), 4-14.
Sila, O., & Olgun, C. (2008). Examining the fifth graders' understanding of heat and temperature concepts via concept mapping. Hacettepe Universitesi Egitim Fakultesi Dergisi-Hacettepe University Journal of Education(34), 54-62.
Sjoberg, S. (2007). Constructivism and Learning. In B. Sjoberg, McGaw and Peterson (Ed.), International Encyclopedia of Education. Oxford: Elsevier.
Sokoloff, D. R., & Thornton, R. K. (1997). Using interactive lecture demonstrations to create an Active Learning environment. In E. F Redish, J. S Rigden (Eds.), Changing Role of Physics Departments in Modern Universities - Proceedings of International Conference on Undergraduate Physics Education, Pts 1 and 2 (pp. 1061-1074).
Sokoloff, D. R., & Thornton, R. K. (2004). Interactive Lecture Demonstrations: Active learning in introductory physics. Hoboken, NJ: John Wiley & Sons, Inc.
Solomon, J. (1994). The rise and fall of constructivism. Studies in Science Education, 23(1).
Stark, R. (2002). Conceptual Change: kognitivistisch oder kontextualistisch? Research report no. 149: LMU Munich: chair of education and educational psychology.
Stefani, C., & Tsaparlis, G. (2009). Students' Levels of Explanations, Models, and Misconceptions in Basic Quantum Chemistry: A Phenomenographic Study. Journal of Research in Science Teaching, 46, 520-536.
Sutherland, L. (2002). Developing problem solving expertise: the impact of instruction in a question analysis strategy. Learning and Instruction, 12(2), 155-187.
Taasoobshirazi, G., & Carr, M. (2008). A review and critique of context-based physics instruction and assessment. Educational Research Review, 3(2), 155-167.
Taber, K. (2009). A Scientific Research Programme Within Science Education. In K. Taber (Ed.), Progressing Science Education (Vol. 37, pp. 111-146): Springer Netherlands.
Tan, M. (2013). Knowledge, truth, and schooling for social change: Studying environmental education in science classrooms. (PhD), University of Toronto, Canada.
224
Teodorescu, R. E., Bennhold, C., Feldman, G., & Medsker, L. (2013). New approach to analyzing physics problems: a taxonomy of instroductory physics problems. Physical Review Special Topics- Physics Education Research, 9.
Tobin, K. (2000). Constructivism in science education: moving on.... In D. C. Phillips (Ed.), Constructivism in education: opinions and second opinions on controversial issues (pp. 227-253). Chicago, Illinois: National Society for the Study of Education.
Tremblay, E. (2010). Educating the Mobile Generation – using personal cell phones as audience response systems in post-secondary science teaching. Journal of Computers in Mathematics and Science Teaching, 29(2), 217-227.
Tsai, C. C., & Wen, M. L. (2005). Research and trends in science education from 1998 to 2002: a content analysis of publication in selected journals. International Journal of Science Education, 27(1), 3-14.
Turpen, C., & Finkelstein, N. D. (2009). Not all interactive engagement is the same: Variations in physics professors' implementation of Peer Instruction. Physical Review Special Topics-Physics Education Research, 5(2), 18.
Usher, R. (1996). A critique of the neglected epistemological assumptions of educational research. In S. a. Usher (Ed.), Understanding Educational Research (pp. 9-32). London: Routledge.
Vernon, D. T. A., & Blake, R. L. (1993). Does problem-based learning work? – A metaanalysis of evaluative research. Academic Medicine, 68, 550-563.
Vicklund, O. U. (1940). The elimination of superstition in junior high school science. Science Education, 24(2), 93-99.
Vosniadou, S. (2002). On the nature of naive physics. In M. Limon. and L. Mason (Eds.), Reconsidering conceptual change: Issues in theory and practice (pp. 61-76). Dordrecht: Kluwer Academic Publishers.
Vosniadou, S. (2008). International handbook of research on conceptual change. New York: Routledge.
Warren, J. W. (1972). The teaching of the concept of heat. Physics Education, 7, 41-44.
Warren, J. W. (1982). The nature of energy. European Journal of Science Education, 4(3), 295-297.
Wattanakasiwich, P., Khamcharean, C., Taleab, P., & Sharma, M. (2012). Interactive lecture demonstration in thermodynamics. Latin American Journal of Physics Education, 6(4), 508-514.
Wattanakasiwich, P., Talaeb, P., Sharma, M., & Johnston, I. (2013). Construction and Implementation of a Conceptual Survey in Thermodynamics. International Journal of Innovation in Science and Mathematics Eucation. 21(1)
Wheelahan, L. (2012). Why knowledge matters in curriculum: A social realist argument: Routledge.
225
The White House Press Release. (2013 ). Fact Sheet on the President’s Plan to Make College More Affordable: A Better Bargain for the Middle Class. Retrieved 13/8/2013 http://www.whitehouse.gov/the-press-office/2013/08/22/fact-sheet-president-s-plan-make-college-more-affordable-better-bargain-.
Wieman, C. (2009). Galvanizing Science Departments. Science, 325, 1181-1181
Willoughby, S. D., & Gustafson, E. (2009). Technology talks: Clickers and grading incentive in the large lecture hall. American Journal of Physics, 77(2), 180-183.
Wiser, M., & Carey, S. (1983). When heat and temperature were one. In D. Gentner, A.L. Stevens (Eds.), Mental Models (pp. 267-298). Hillsdale, NJ: Lawrence Erlbaum Associates, Inc.
Wolff, K., & Luckett, K. (2013). Integrating multidisciplinary engineering knowledge. Teaching in Higher Education, 18(1), 78-92.
Yeo, S., & Zadnik, M. (2001). Introductory thermal concept evaluation: Assessing students' understanding. The Physics Teacher, 39, 496-504.
Young, H. D., & Freedman, R. A. (1996). University Physics (9th ed.). London: Addison-Wesley.
Yslas Velez, W. (1996). Integration of research and education: what does it mean and how can it be accomplished? Notices of the AMS, 43(10), 1142-1146.
Zemansky, M. W. (1970). The use and misuse of the word 'heat' in physics teaching. The Physics Teacher, 8(6).

226

1
Appendices

2
Appendix A Teacher Survey

3

4

5

6

7

8
Appendix B Interactive Exercises

9

10

11
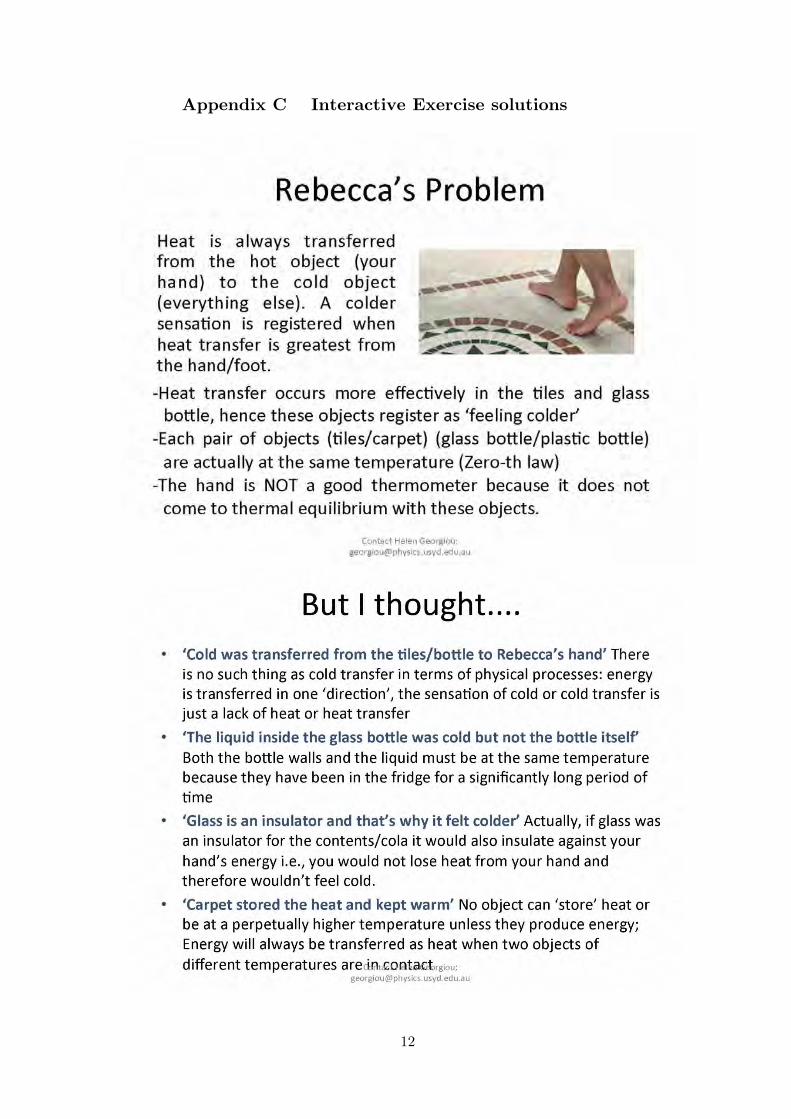
12
Appendix C Interactive Exercise solutions
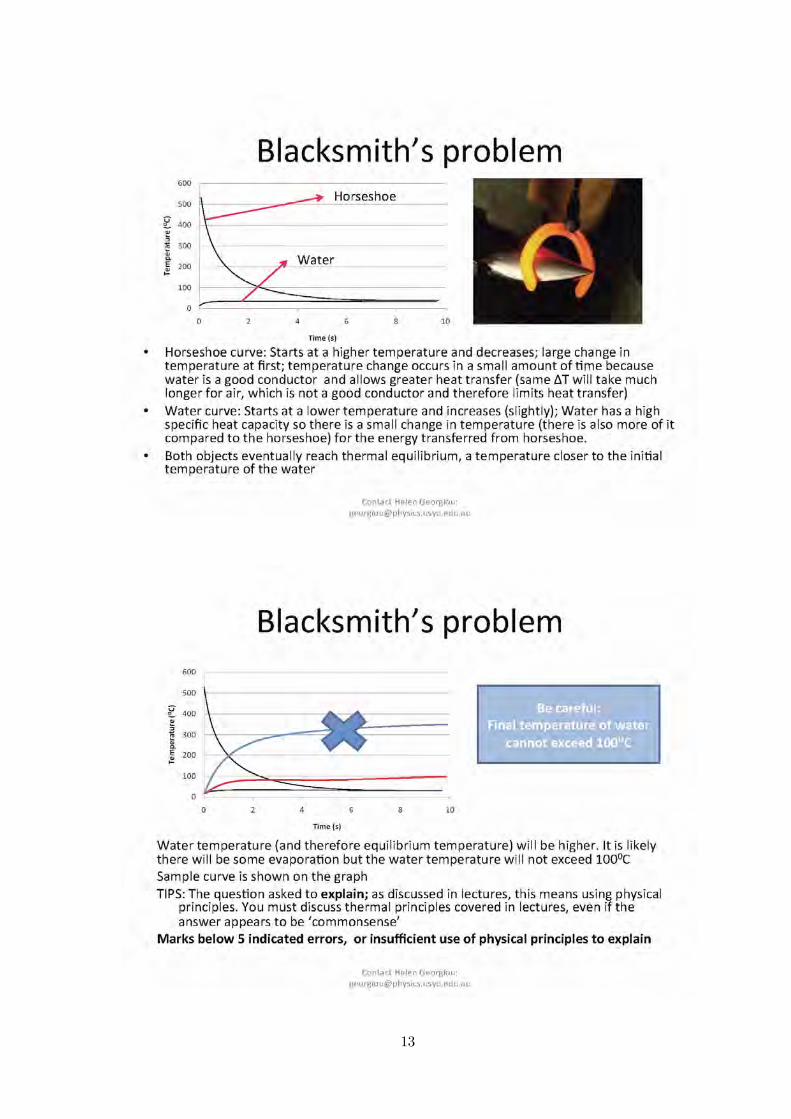
13
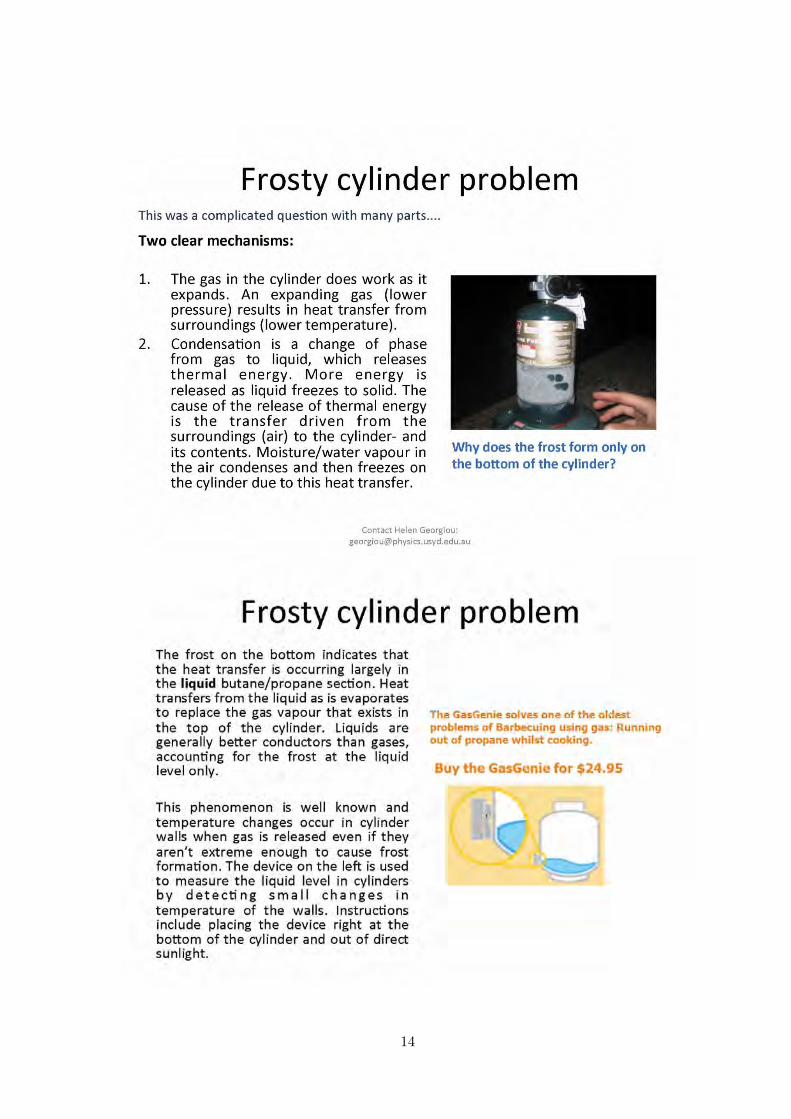
14
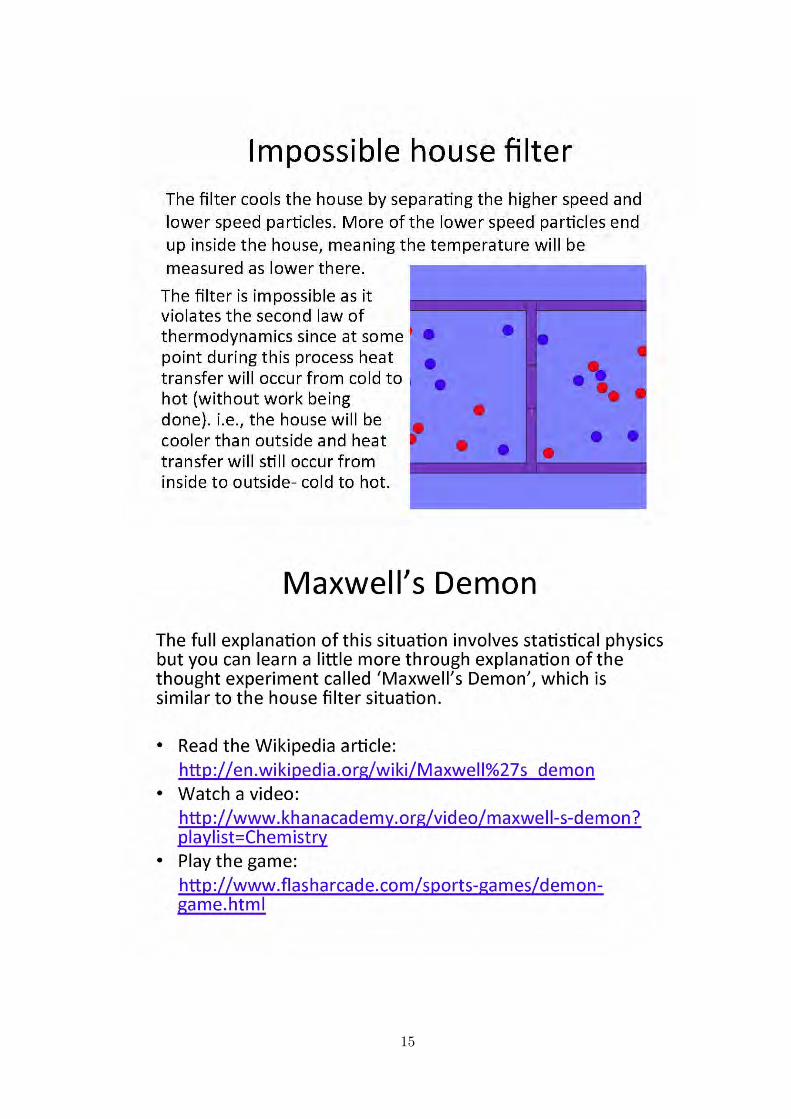
15

16
Appendix D Prediction and Results Sheets for ILDs
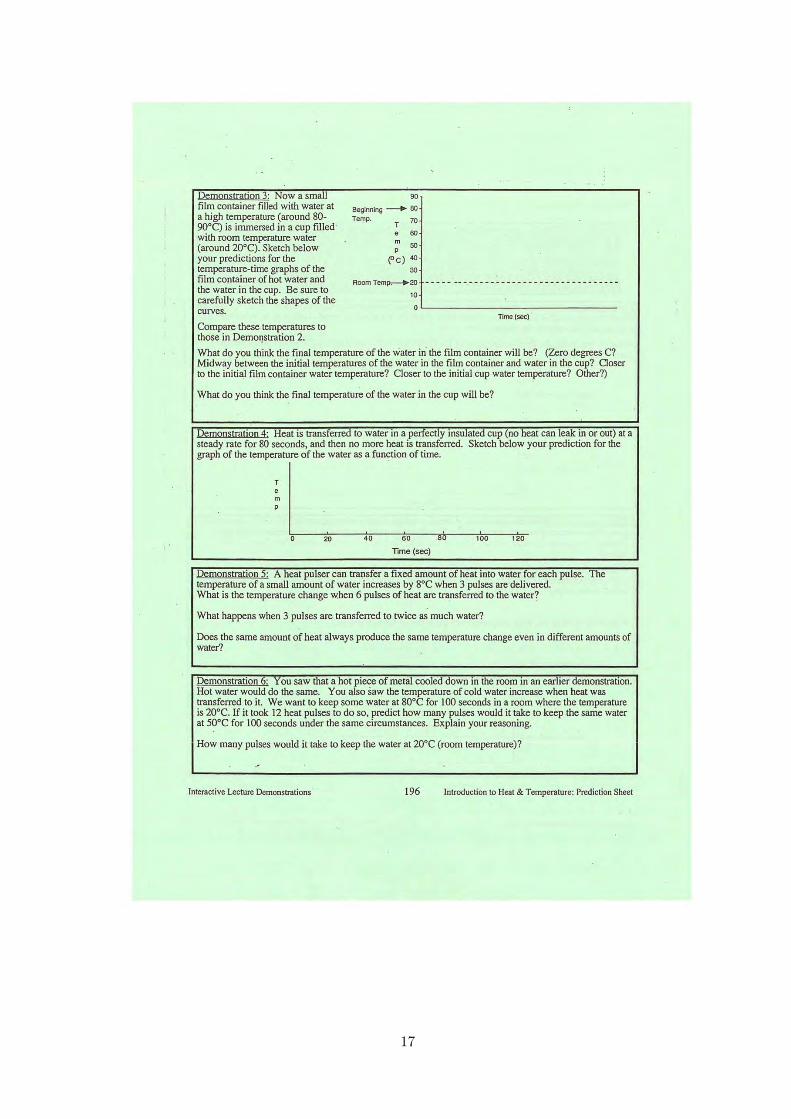
17
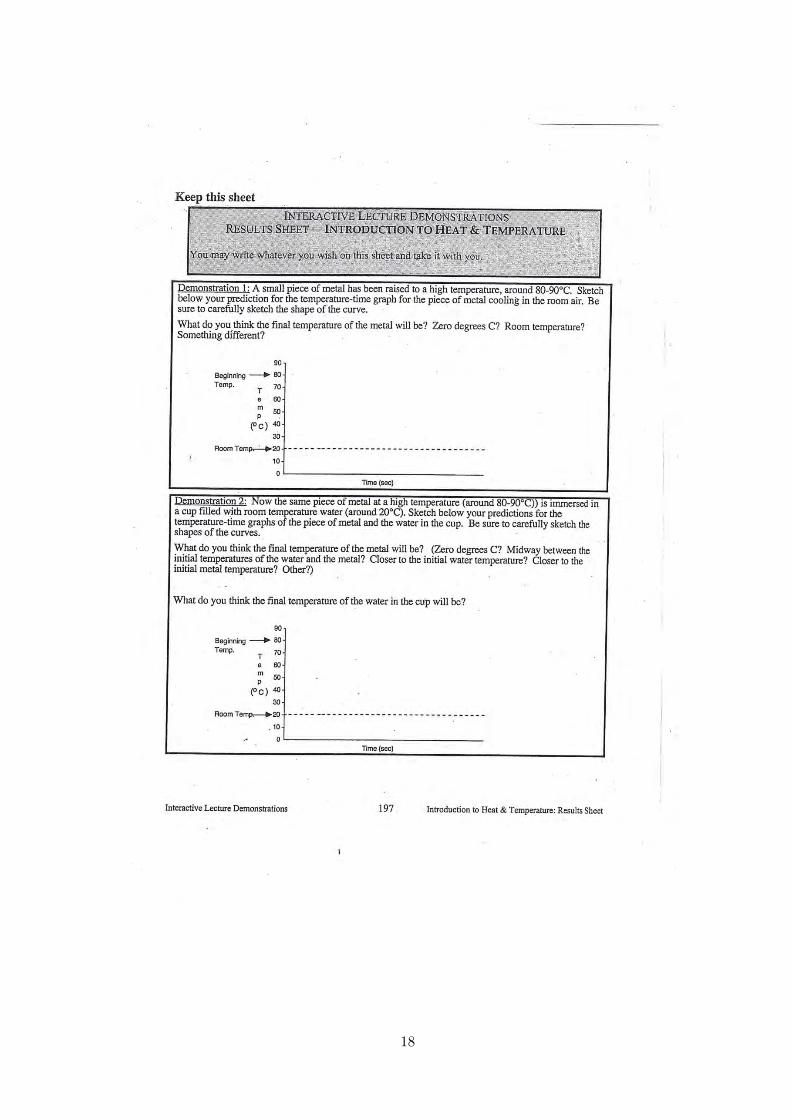
18
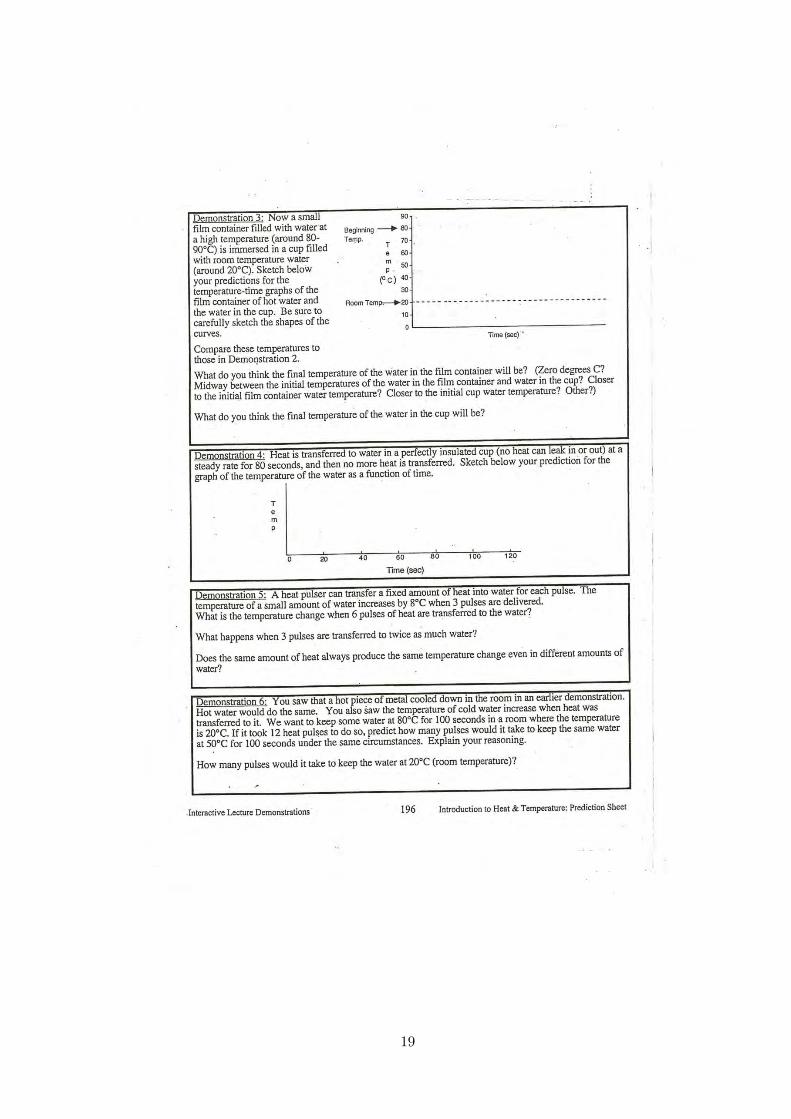
19
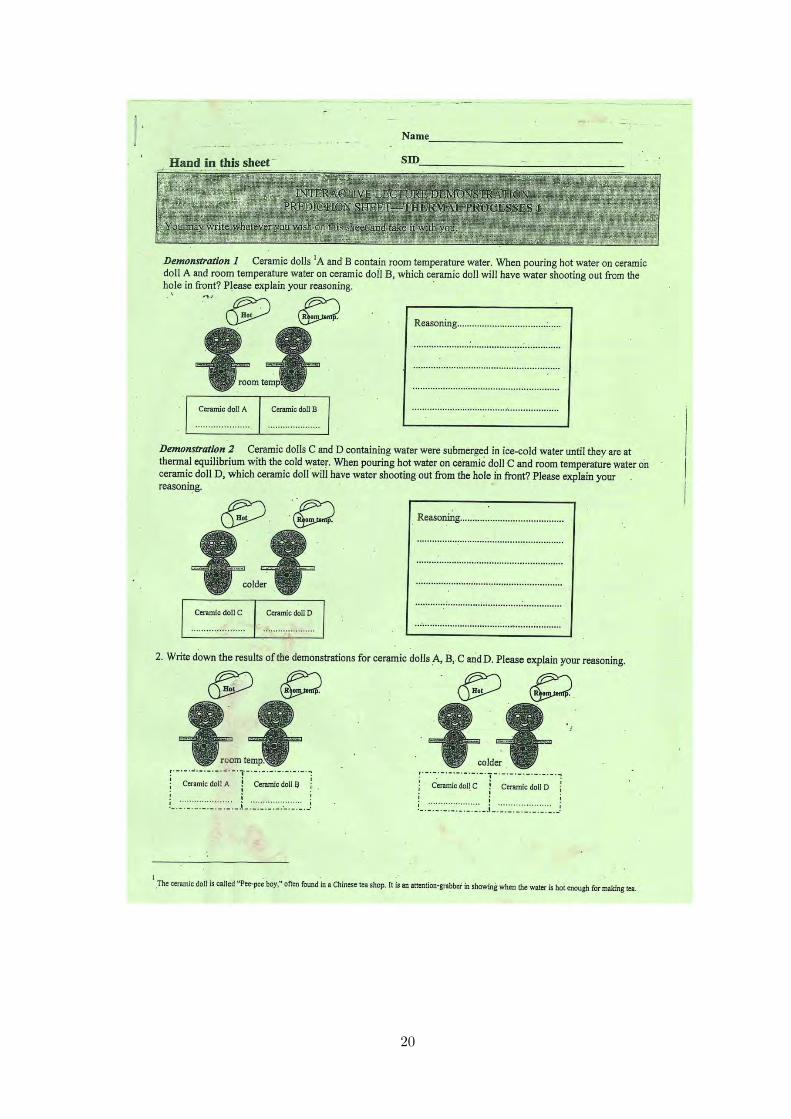
20

21
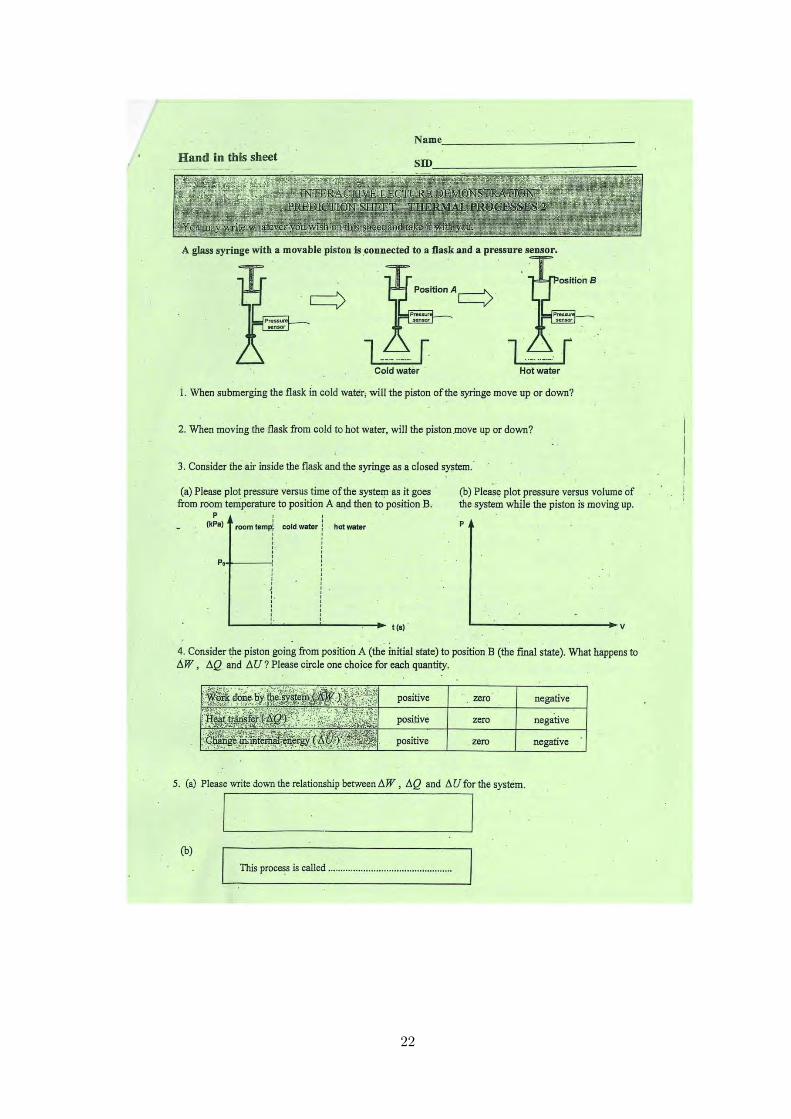
22
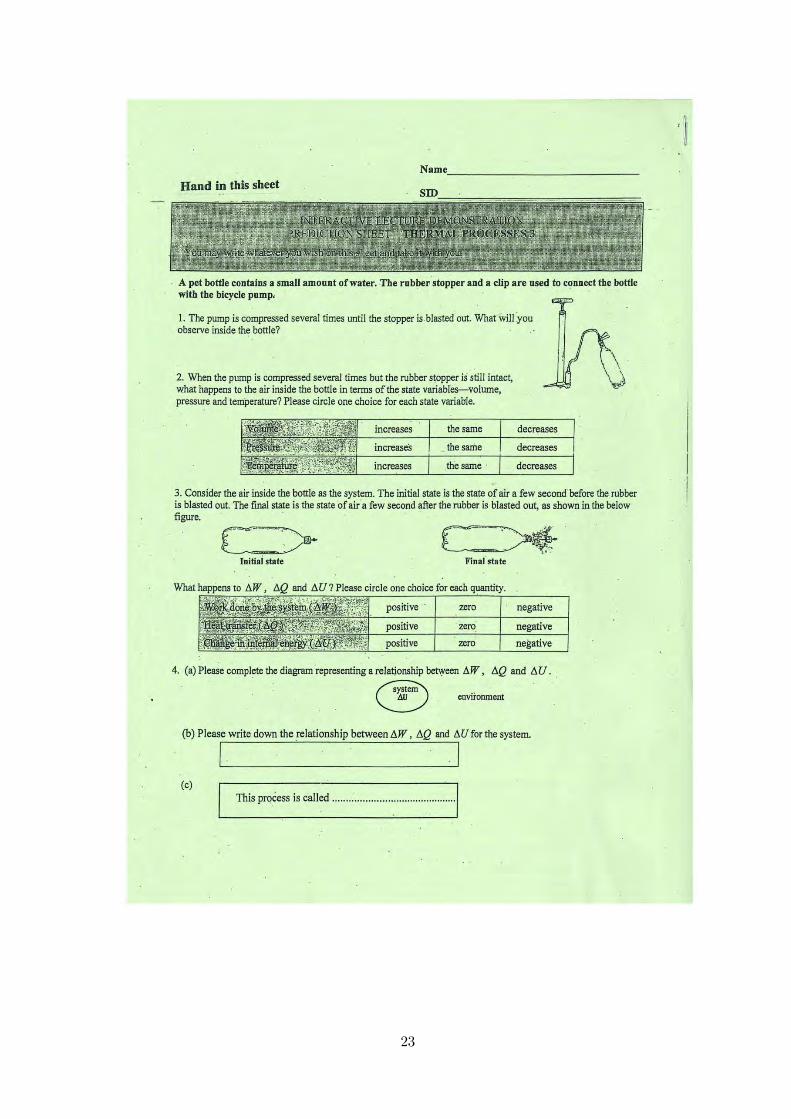
23
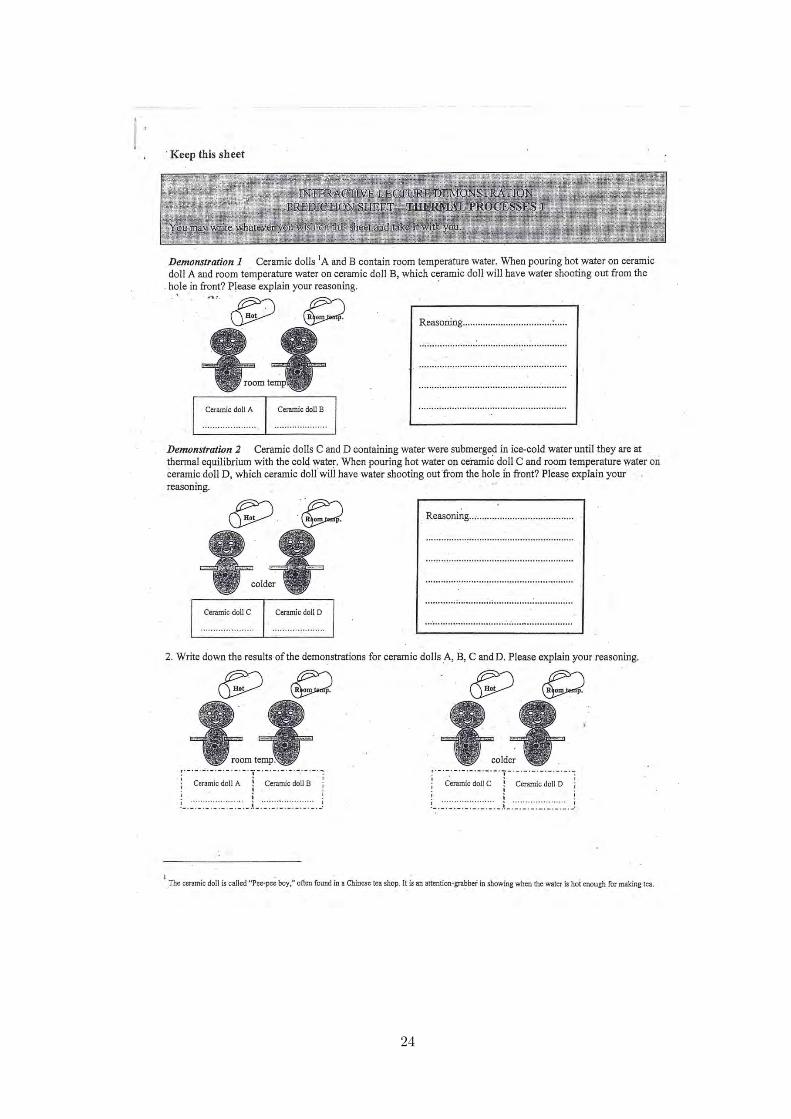
24
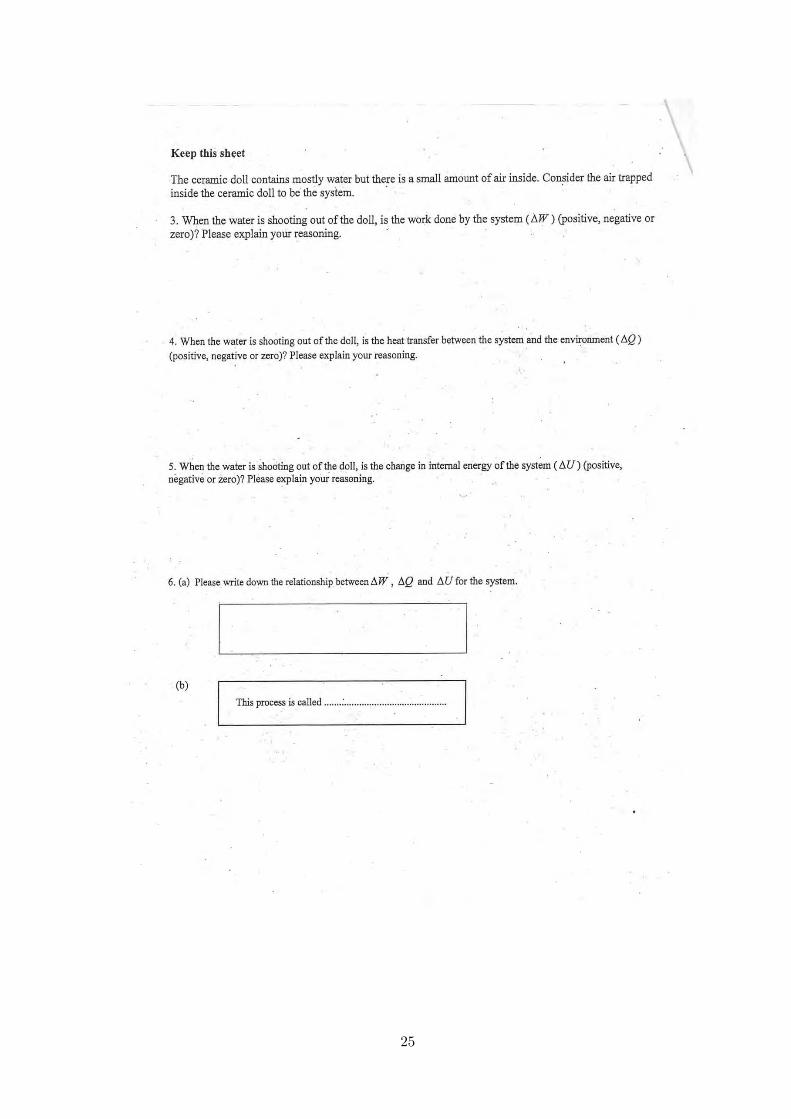
25
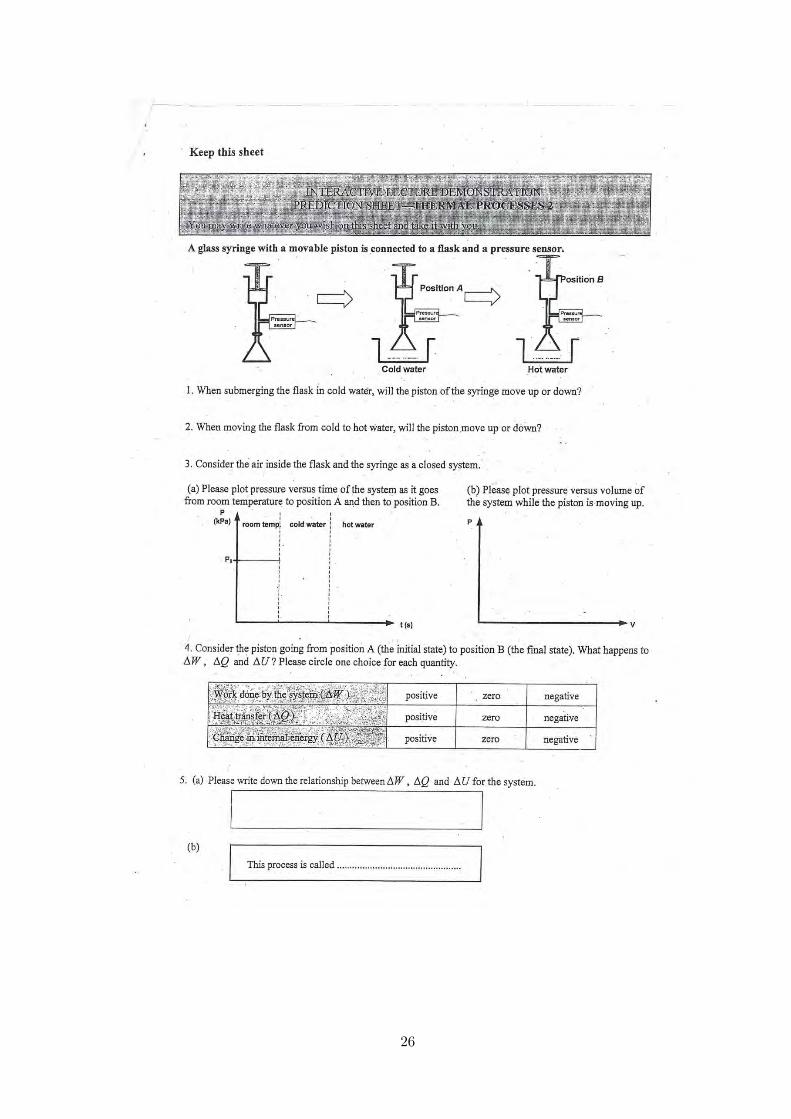
26
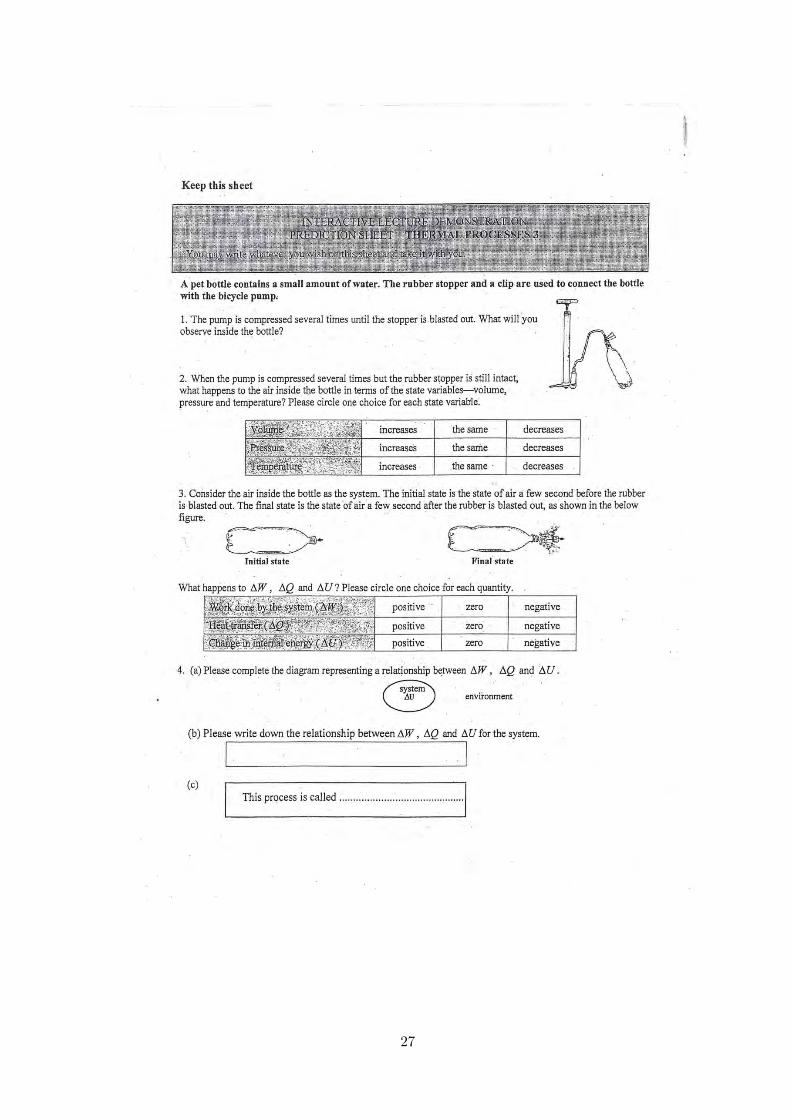
27

28
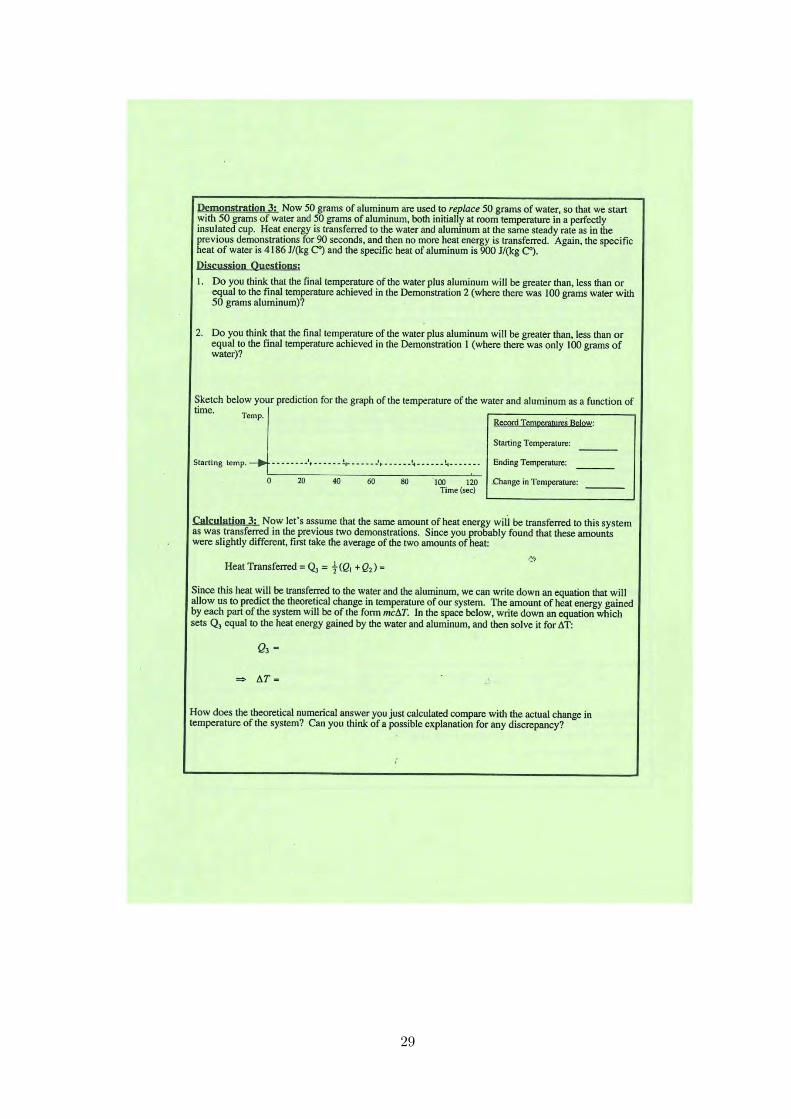
29
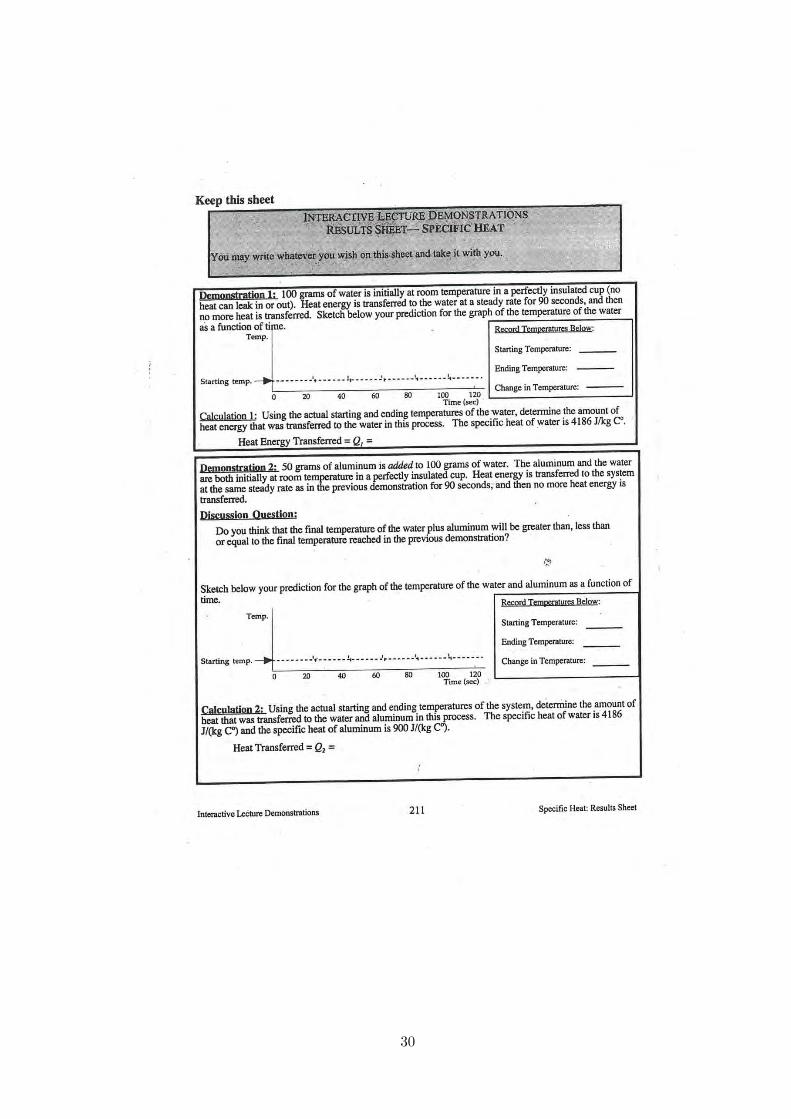
30
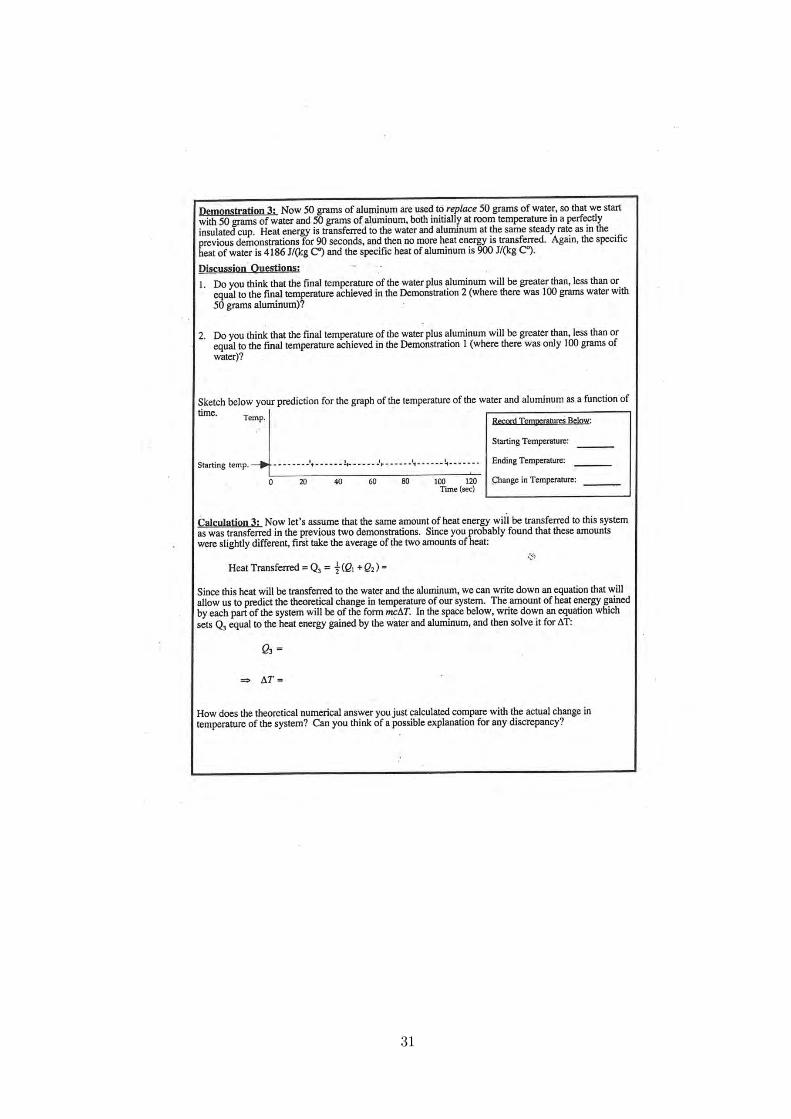
31
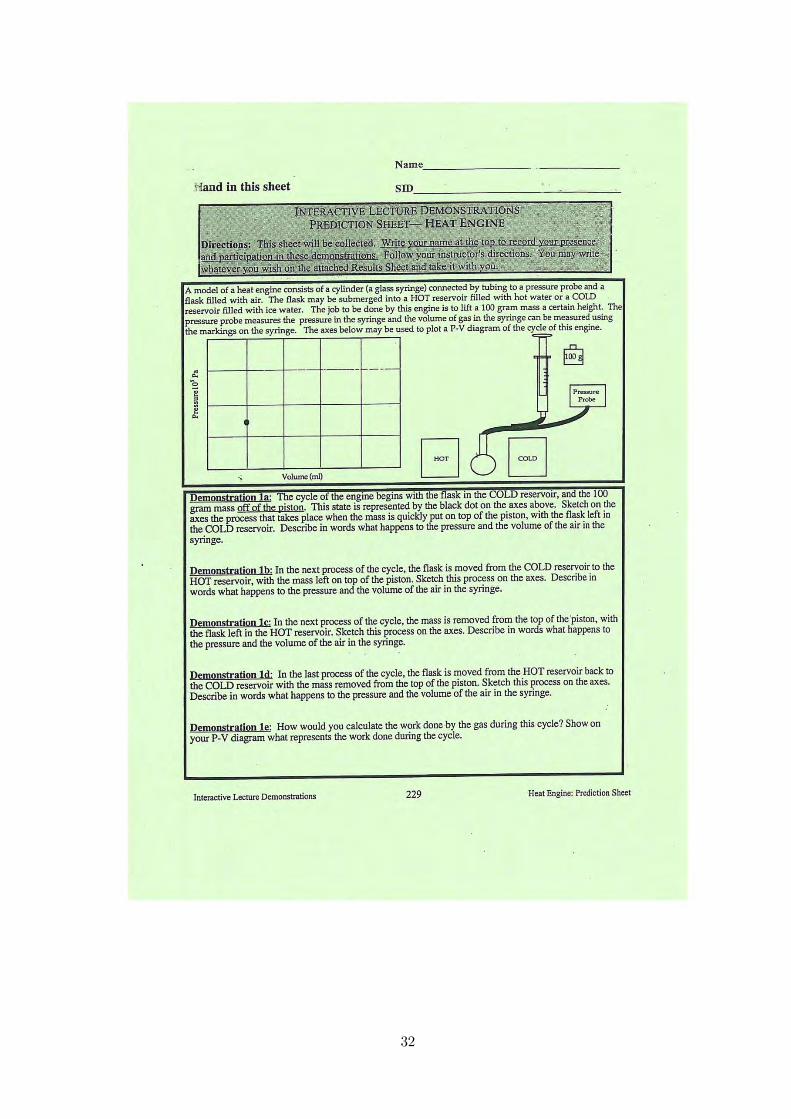
32

33
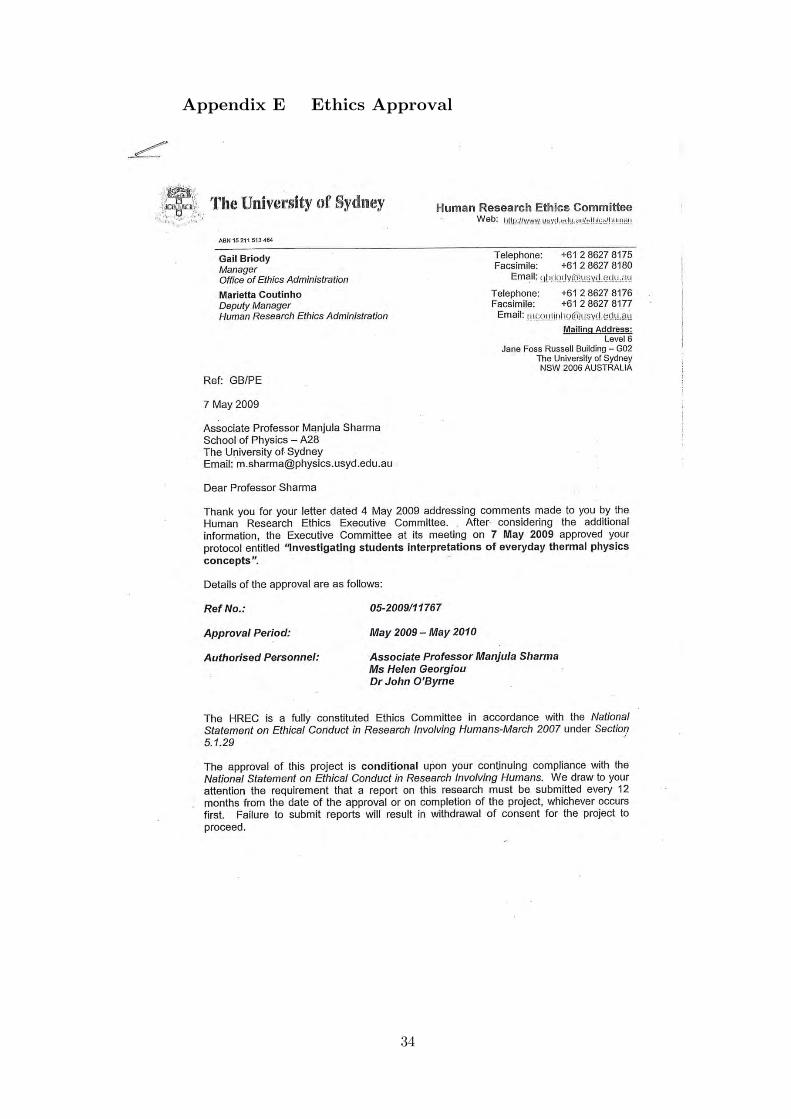
34
Appendix E Ethics Approval
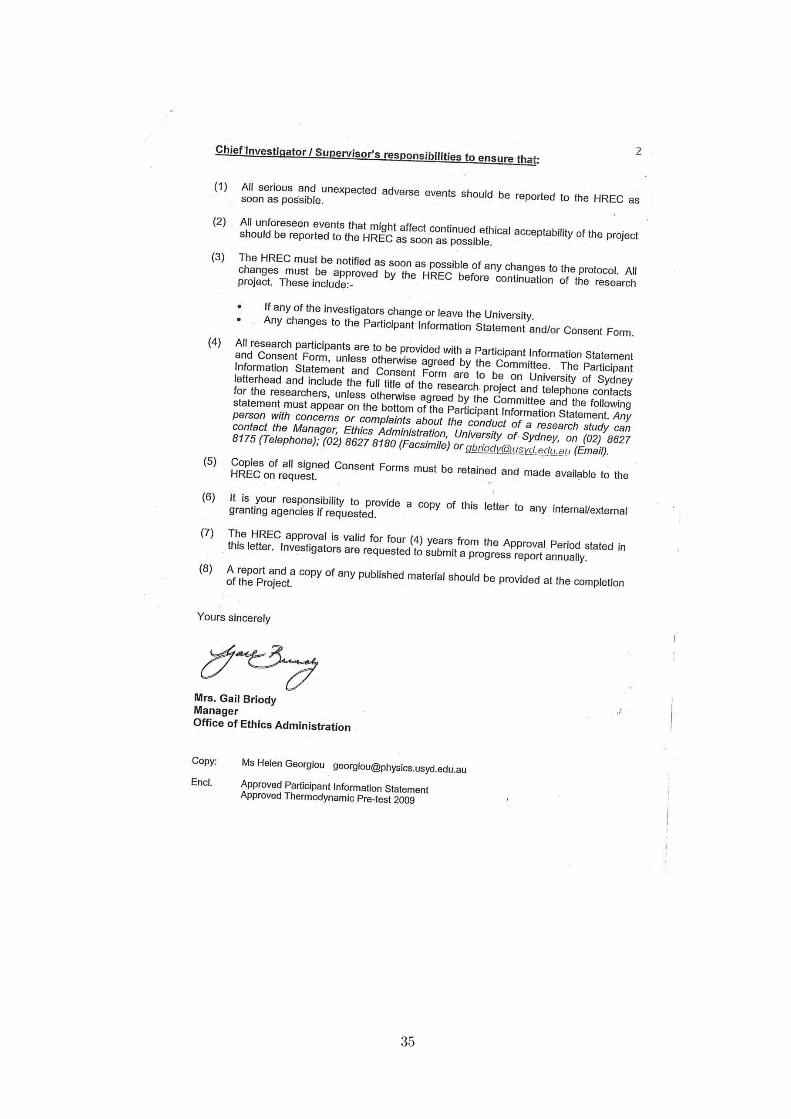
35
36
37
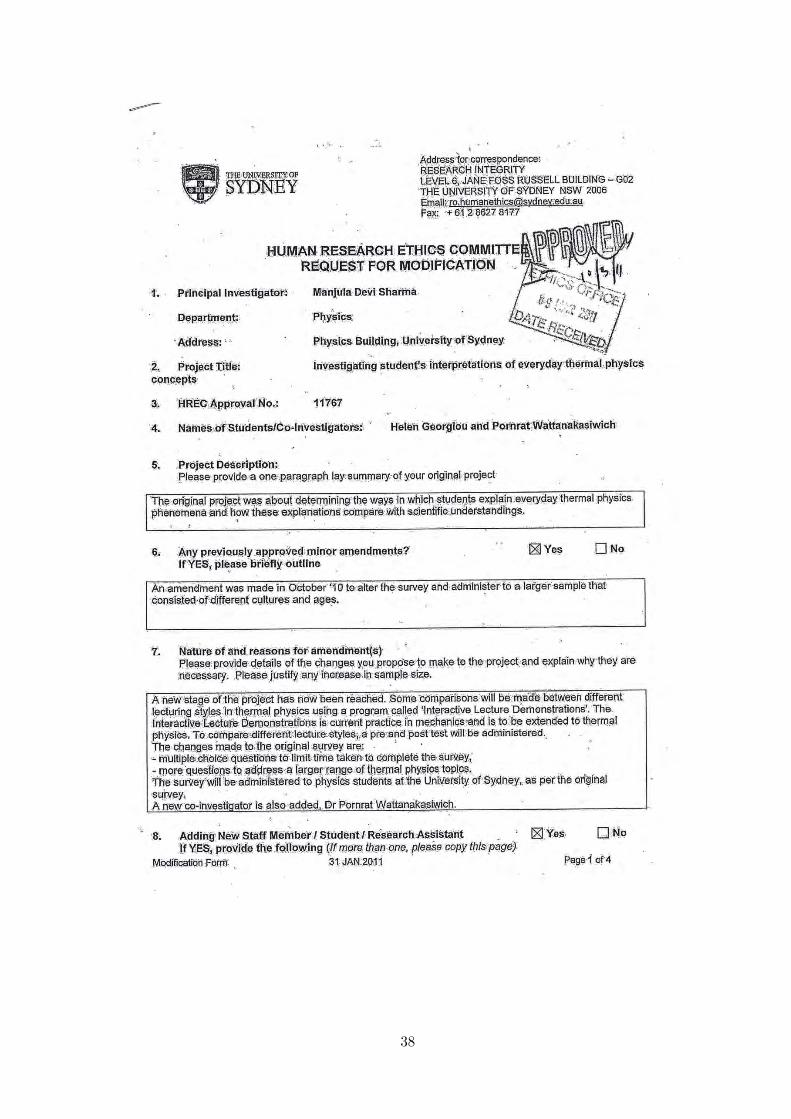
38
39
40

41
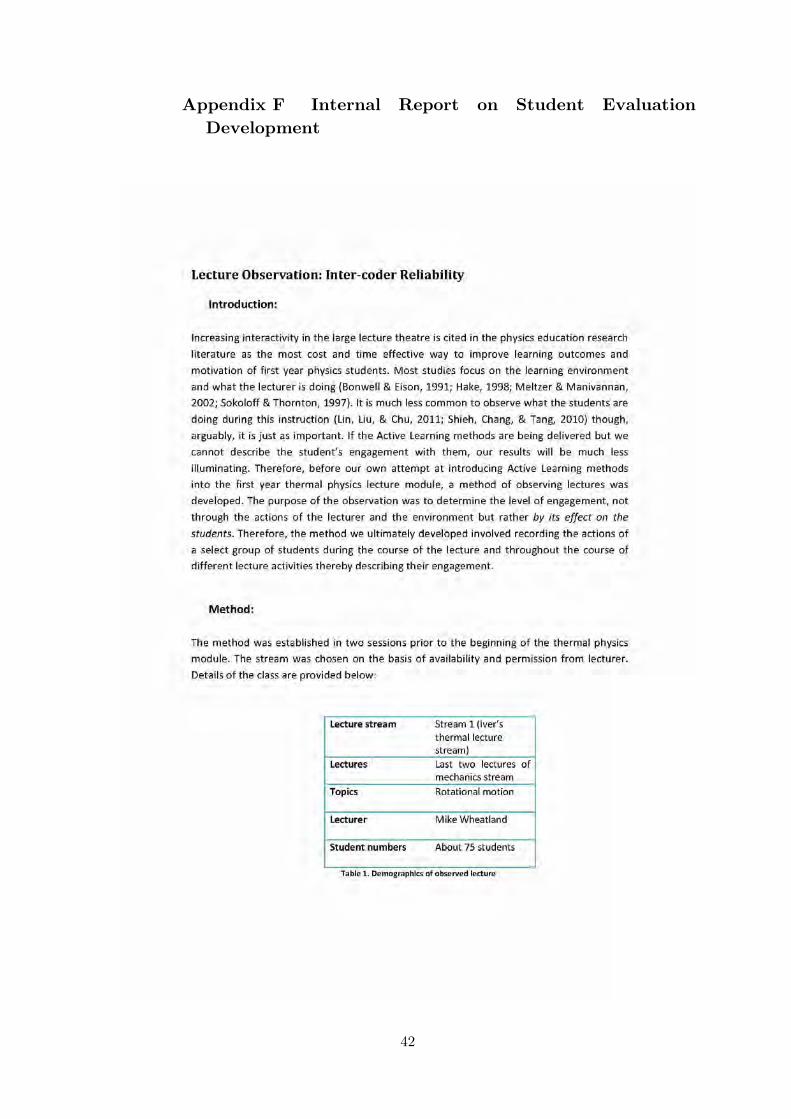
42
Appendix F Internal Report on Student Evaluation Development
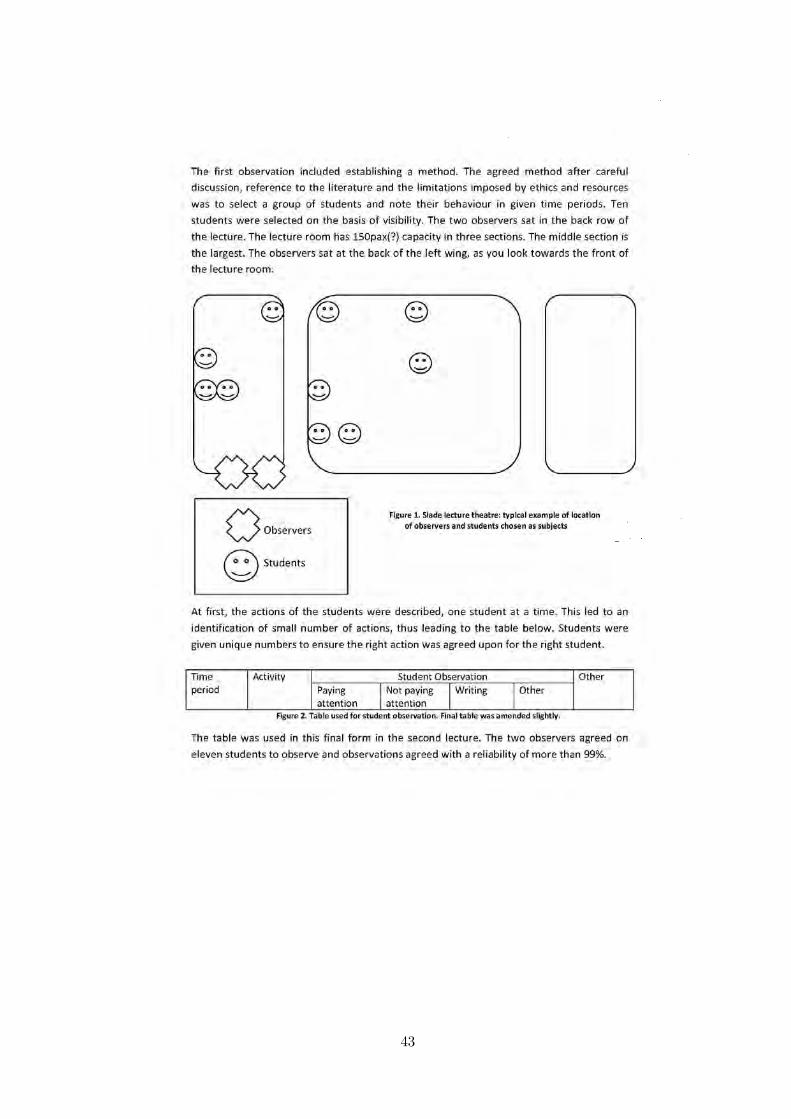
43

44

45
46

47
Appendix G Student Engagement Template (LASE)

48
Appendix H Alternative ILD Sheet (LASE)
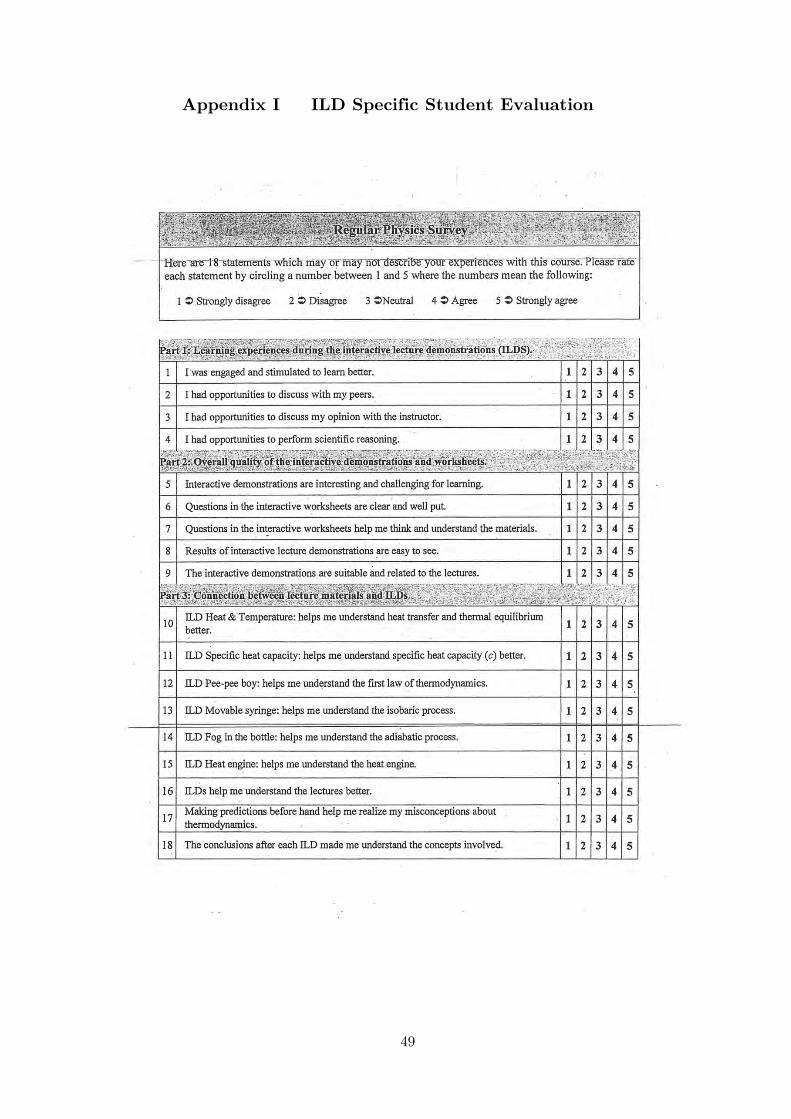
49
Appendix I ILD Specific Student Evaluation

50
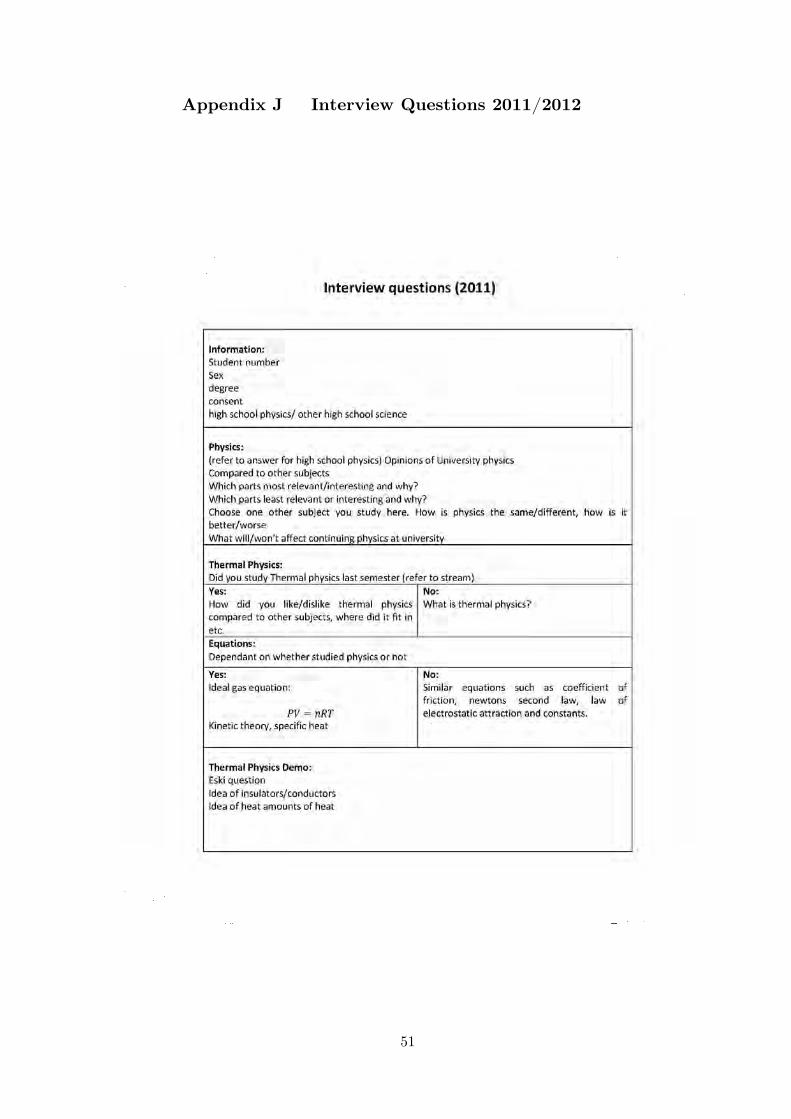
51
Appendix J Interview Questions 2011/2012
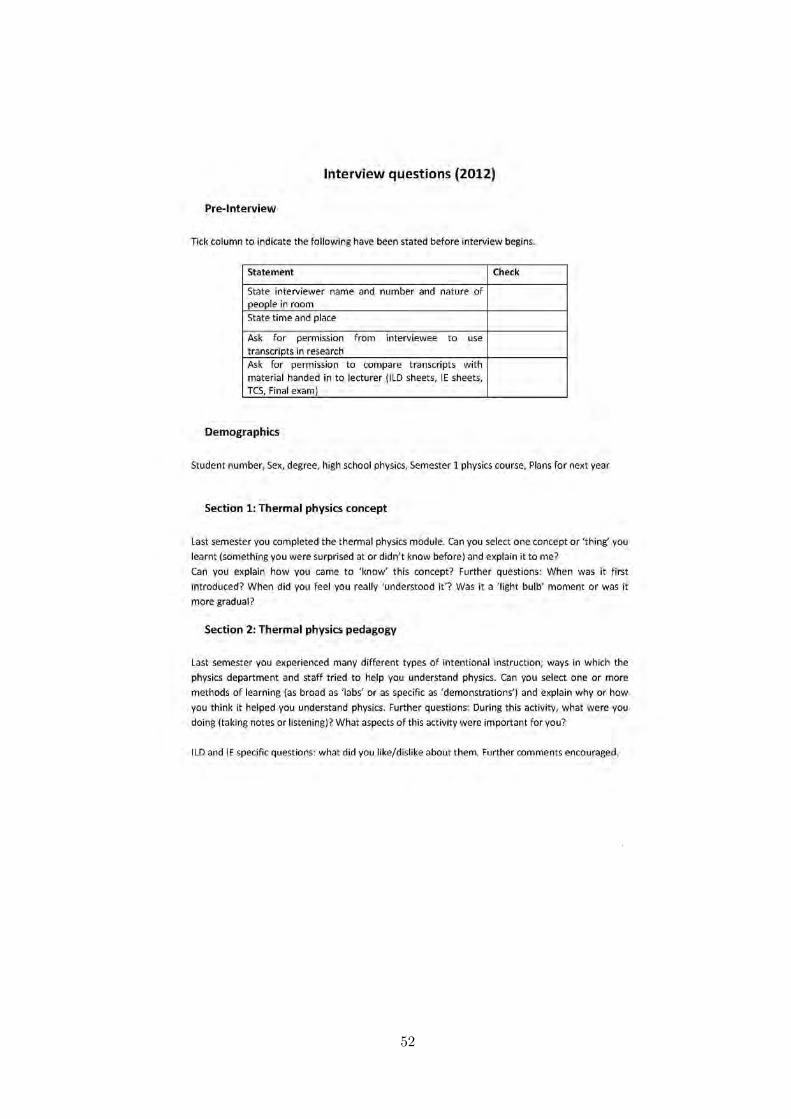
52
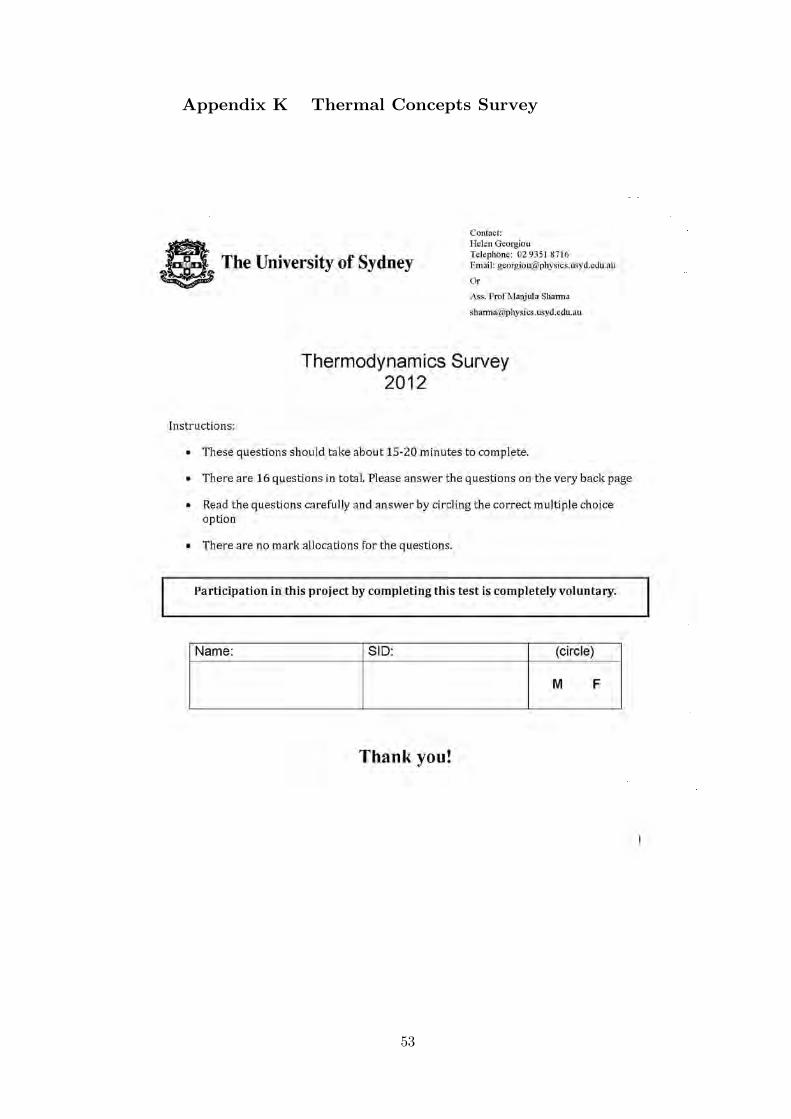
53
Appendix K Thermal Concepts Survey

54

55

56
57

58

59
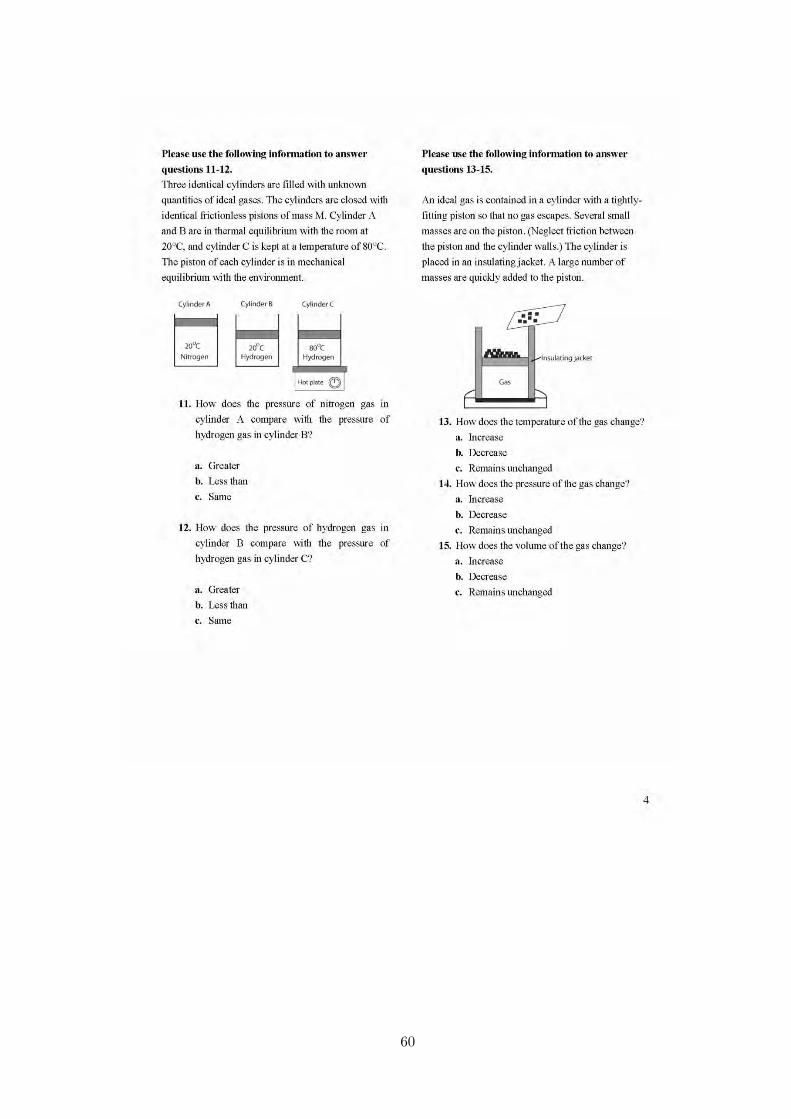
60

61

62

63

64

65
Supplementary Materials
The materials in this section are not publically available. They contain material that is
either subject to copyright legislation, sensitive or is excessively lengthy. Materials may
be granted by request from [email protected] or The School of Physics, The
University of Sydney, NSW, 2006. Ph: 9351 3037