Embed Size (px)
Citation preview

1
Doing Better for
Children and
upcoming OECD
projects
Dominic Richardson
OECD Social Policy Division
DCSF Seminar, London 16/11/09
Outline of the Report
• Overview of child well-being
• Comparing child well-being outcomes
• Public spending for children of different ages
• Policies for the under 3’s
• Effects of sole-parenthood on child outcomes
• Intergenerational inequality
• Recommendations to enhance child well-being

2
Dimensions of child well-being – no
country does well across the board
Some shared methodological
considerations
• Cause versus effect approach
– Do we expect internal reliability?
• Equal Weights (implicit weights in z scores?)
– Problems of consensus?
• Neither penalise variation
– Do we value consistency?
• Different numbers of indicators in each dimension

3
Selection of indicators within
dimensions
• Child-centred
• UN Convention on the Rights of the Child
• Policy amenable
• Country coverage and up-to-date data
• Conceptually Complementary
– Rights vs. Development
– Equity and Efficiency
– Age coverage
How is the OECD framework different
from the UNICEF framework?
• Selects policy amenable indicators
• Compares all 30 OECD countries
• Includes housing and environment data
• No final ranking
• Is more up-to-date
but…
• Still too adolescent focussed
• Not disaggregated by age, sex, ethnicity, etc.
• Missing info, e.g.
– Child protection and neglect/ Mental health
• Retains the methods (equal weights / causal approach)

4
Statistical coverage
Age Sex Migrant Age Sex Migrant Age Sex Migrant
Material well-being
Housing and
environment
Educational well-
being
Health and safety
Risky behaviours
Quality of school
life
Age coverageEarly (0-5 years) Mid (6 to 11 years) Late (12 to 17 years)
Statistical coverage
Age Sex Migrant Age Sex Migrant Age Sex Migrant
Material well-being
Housing and
environment
Educational well-
being
Health and safety
Risky behaviours
Quality of school
life
Age coverageEarly (0-5 years) Mid (6 to 11 years) Late (12 to 17 years)

5
Statistical coverage
Age Sex Migrant Age Sex Migrant Age Sex Migrant
Material well-being
Housing and
environment
Educational well-
being
Health and safety
Risky behaviours
Quality of school
life
Age coverageEarly (0-5 years) Mid (6 to 11 years) Late (12 to 17 years)
Statistical coverage
Age Sex Migrant Age Sex Migrant Age Sex Migrant
Material well-being O O O O O O O P P
Housing and
environment P O O P O O P O O
Educational well-
being O P P
Health and safety P P O P P O P P O
Risky behaviours P P O
Quality of school
life P P O P P O
Age coverageLate (12 to 17 years)Mid (6 to 11 years)Early (0-5 years)

6
Material well-being dimension • Three indicators
•Average child income
•Children in poor homes
•Educational deprivation
• Convention articles 27.3 and 17
• Complementarity •Family income and child deprivation
•Average income (efficiency) and poverty (equity)
•Income today and educational investment for tomorrow
• Policy levers: tax and benefit system, childcare, Active Labour Market Policies, schools
In the mid 2000s child poverty in the UK
was slightly below the OECD average
Data source: Data for this indicator is taken from the OECD Income Distribution Questionnaire, 2007 for the year 2005. The child
poverty measure used is the proportion of households with children living on an equivalised income below 50% of the national median
income. Children are defined as those aged 0-17 years. Data on child poverty is missing for three countries: Japan, Poland and
Switzerland.

7
Educational well-being
• Youth Inactivity / Educational Inequality / Average mean literacy (PISA)
• Convention articles 18 and 29(a)
• Complementarity
•Mean RLA (efficiency) 90/10 ratio (equity)
•Youth activity today and achievement for tomorrow
•Adolescent-focussed
• Policy levers: School environments, teaching practices, ALMP, family benefit changes, educational supplements
Educational inequality is lower for girls
across all of the OECD
Data source: Data for educational achievement is mathematics, reading and science literacy as measured in the PISA
surveys for 2006 (OECD/PISA, 2008). Mean literacy performance, is the average of the three literacy scores. The second is a
measure of country inequality in scores, again averaged across the three dimensions. The measure of inequality used is the
ratio of the 90th to the 10th percentile. Data is for the 15 year old school population. Reading literacy data was not available for
the United States in 2006 results are therefore averages for mathematics and science literacy only.

8
Health and safety
• Infant mortality / Low birth weight / Vaccinations / Physical activity / Avoidable mortality / Suicide
• Convention articles 6, 24, 29.1, 31.1.
• Complementarity
•Mortality and immunisations (covering both efficiency and equity for today and tomorrow)
•All age groups covered
• Policy levers: medical provision and practices, birth grants, baby packs and prenatal care (cct), childcare provision (cct), environments to play, school sports, safety in the community (e.g. traffic calming)
Rate reductions in infant mortality are moving
fastest in European OECD countries
Infant mortality: Deaths per 1 000 live births (2006)
Data source: OECD Health Data 2008 - Version: December 2008
Infant mortality: Deaths per 1 000 live births (1980 to 2006)
Data source: OECD Health Data 2008 - Version: December 2008

9
Rates of low birth weight babies are increasing
in all countries
Low birthweight % of total live births (1980 to 2006)
Data source: OECD Health Data 2008 - Version: December 2008
Low birthweight % of total live births (2006)
Data source: OECD Health Data 2008 - Version: December 2008
Risk behaviours
• Smoking / Drunkenness / Teen births
• Convention articles 33 and 24.2 (f) …but UNCRC art 17 (a)
• Complementarity •Reduced risks (efficiency) teen births (equity)
•Risks have both present well-being and developmentalist aspects
•Adolescent biased (but justifiably so?)
• Policy levers: age legalisation, advertising and sales laws, public information campaigns, taxation, family planning services, and sex education

10
The teenage fertility rates in the OECD have
dropped by one fifth in the last decade
Percentage fall in teenage fertility rate (1997 and 2006)
Data source: World Development indicators, 2008
Teenage fertility rates (2006)
Data source: World Development indicators, 2008
Young people across the OECD are
smoking and drinking less
Children smoking least one cigarette during the past week and children reporting to have been drunk two or more times
Data source:OECD calculations of Health Behaviour in School-aged Children data (1993-4 to 2005-06)

11
The UK compares well on smoking amongst
youth, but drunkenness remains too high
Children smoking least one cigarette during the past week and children reporting to have been drunk two or more times
Data source:OECD calculations of Health Behaviour in School-aged Children data (1993-4 to 2005-06)
Patterns of public expenditure on
children, why and how?
• What is spent on children and when
• Timing matters for child well-being
• Testing a Heckman proposition
• Social expenditure data and education data
• Allotted by types from prenatal to age 27 using benefit rules
•Cash and tax / In kind / Child care / Education

12
The youngest children in Europe are most
likely to be the poorest children
Calculations from EU SILC 2005 data.
Underlined countries have rates at least 3 points higher than for children overall.
Countries in the OECD tend to prioritise
spending on older children

13
The most common pattern is an inverted U-
shape, with education spending dominant
United Kingdom social spending in 2003.
Source: OECD (2009) Doing Better for Children
In fewer cases cash spending starts high and remains
high. In-kind spending and childcare feature more...
French public spending in 2003.
Source: OECD (2009) Doing Better for Children
14
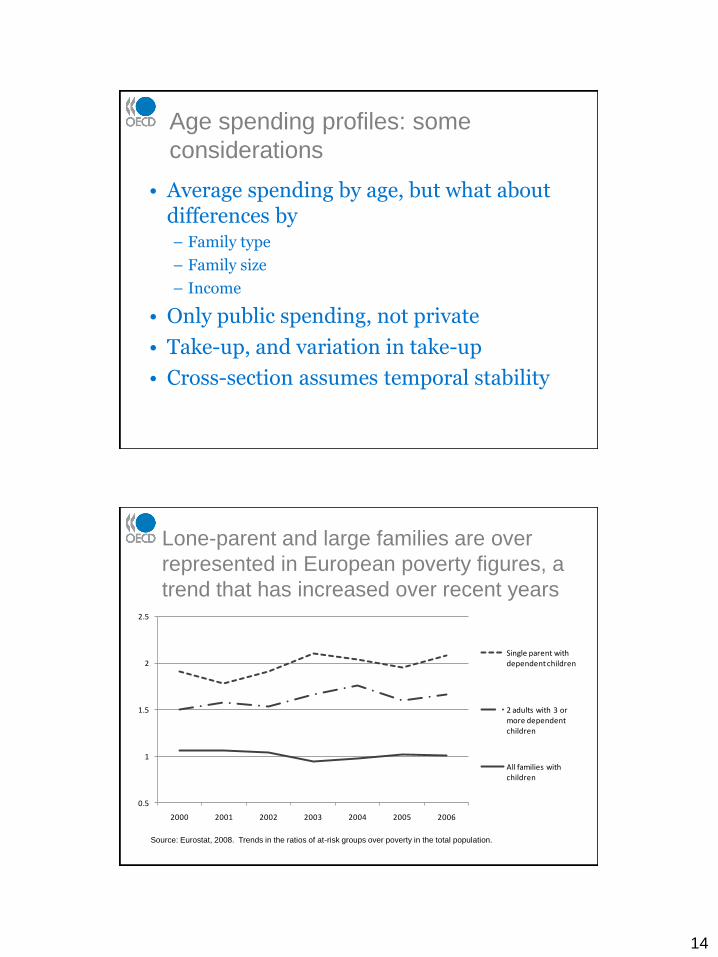
Age spending profiles: some
considerations
• Average spending by age, but what about differences by – Family type
– Family size
– Income
• Only public spending, not private
• Take-up, and variation in take-up
• Cross-section assumes temporal stability
Lone-parent and large families are over
represented in European poverty figures, a
trend that has increased over recent years
0.5
1
1.5
2
2.5
2000 2001 2002 2003 2004 2005 2006
Single parent with dependent children
2 adults with 3 or more dependent children
All families with children
Source: Eurostat, 2008. Trends in the ratios of at-risk groups over poverty in the total population.

15
An exploration of cash transfers by
family type in the United Kingdom
• Impact on family income by family types and ages of children
• Compare national approaches in eight OECD countries
• Child polices have been added to TAXBEN •Maternity / paternity benefits / parental leave / birth grants
• Linked with other benefits
• Children are born into the model when siblings are aged two
In 2003 the UK helped poor single
parents the most...
Ratio of two-parent to sole-parent net income over the child life cycle, 2003
Upward trends suggest a
disincentive for poor lone
parents to return to work

16
Child well-being: Conception to
kindergarten
• Focuses on early intervention for equity and efficiency
• Prenatal / birth / post natal
• Evidence of the variation in policies across the OECD
• Pre-birth child allowance
• Birth grants and baby packs
• Conditional cash transfers
• Immunisation bonus / Health checks
• Cascading services
• Where do social policies stop being labour market policies and start being child health or well-being policies?
Prenatal medical and social
interventions
• Life cycle – risk profile approach
• Staffing / stays / health checks
• Maternal leave policies
• Nutritional programs for pregnant mothers
• The positive effect of maternal health booklet

17
Preparations for childbirth vary greatly
across OECD countries
Births to obstetrician ratio (around 2005)
Data source: OECD Health Data 2008 - Version: December 2008
* Average excludes available data for Mexico (where the births per obstetrician ratio is180).
Recommended pre-natal care schedule, number of visits (most recent data)
Data source: OECD Child Well-being report (forthcoming)
Birth and post natal period
• Birth period • Variation in hospitalisation
• Baby friendly hospitals and breastfeeding
• Birth grants and baby packs
• Postnatal period • Well-child checks
• Home vs. centre-based follow-up
• Post-natal leave
• Child health booklets
• Universality vs. cascading services

18
The Finnish baby pack
The average OECD mother spends around
three days in hospital following birth
Days in hospital following a normal hospital birth (1995, 2005)
Births per paediatrician (2007)
Data source: OECD Health Data 2008 - Version: December 2008

19
Child well-being and sole parenthood
• Sole parenthood is often thought to cause low child well-being. Does it? And how big is the effect?
• A cross-OECD meta-analysis and literature survey examine the questions
• At best, the impact of sole parenthood on child well-being is small. Questions remain about whether sole parenthood causes low child well-being
The effects of sole parenthood on CWB are
always negative, but almost always small…

20
Intergenerational mobility
• Do children perpetuate the outcomes of their parents or are they socially mobile?
• Mobility varies within the OECD: earnings mobility is higher in Nordics & Canada than in France, the UK and the USA
• Policies directed at the early years and directed at equalising educational opportunities can raise mobility
In the UK around half the relative difference of
parental earnings are passed on to children, in
Denmark this is less than one-fifth
Note: The height of each bar represents the best point estimate of the intergenerational earnings elasticity resulting from the
meta-analysis carried out by Corak (2006), integrated with estimates from national studies for a few countries. Higher
parameters indicate a higher persistence of earnings across generations (i.e. lower intergenerational mobility).

21
Policy Recommendations I:
System design
• Support the present and future well-being of children across a range of domains of well-being.
• Develop policy to support child well-being as a system, with a coherent approach to the child life cycle and to the risks children face.
• Monitor child well-being to identify improvements and areas needing policy attention.
• Spend on children as if it were an investment portfolio. Subject the portfolio to a continuous iterative process of evaluation, reallocation and further evaluation to ensure child well-being is actually improved
• Set child well-being targets, unless these create strong perverse incentives.
Policy Recommendations II:
Resourcing
• “Frontload” spending early in the child life cycle. Spend relatively more on:
– Prenatal policies / Early childhood
• “Risk-load” spending. Spend relatively more on:
– Children at high risk of poor well-being especially early on
– Ensure that later investments in high risk children complement earlier investments
• Spend relatively less on:
– Highly medicalised, universal policies surrounding child birth
– Programmes captured by advantaged children, especially on children past the age of compulsory education

22
Policy Recommendations III:
Things to experiment with
• Prenatal interventions
• Coordinating breast-feeding with paid parental leave
• Home visiting and early childhood education interventions
• Methods of targeting resources to the most disadvantaged children
• Conditional cash transfers for children
• Experimental and non-experimental policy evaluation options
Things to consider for the future
• Stronger life cycle/developmental focus in choice of indicators
• In-utero measures
• More rigorous approach to the question of “ability for policy to have an influence”
• The prioritisation of child outcomes
• Future projects (consultation discussion)

23
Where next for child and family
research at the OECD?
• Doing better for families – Extend and refine the social expenditure analysis
– Look at evidence for the well-being aspects for children from ECEC
– Review schooling systems and interaction with out-of-school care
– Policies for disadvantaged teens
– Policies for institutionalised children –review the literature on their adult outcomes
Where next for child and family
research at the OECD?
• Child well-being database proposal – Including outcomes sensitive to age groups
– Including measures of efforts (system and spending)
– Include contextual variables
– Refine ECEC measurements
– Consideration of national specific measures
24
Where next for child and family
research at the OECD?
• Review of cross-national surveys of children – to recommend best practice
– Identify gaps in the data
– Identify gaps in child coverage
– Encourage harmonisation
– Make better use of available data
– Reassure policy makers
Some relevant details
www.oecd.org/els/childwellbeing
www.oecd.org/els/social/expenditure
www.oecd.org/els/social/family/database
+33 145 24 9456


![[OECD. Published by OECD Publishing] Regionalism(BookFi.org)](https://img.dokumen.tips/doc/110x75/55cf9387550346f57b9dbc6c/oecd-published-by-oecd-publishing-regionalismbookfiorg.jpg)