Embed Size (px)
Citation preview
Does Where You Stand Depend on Where You Sit?Tithing Donations and Self-Serving Beliefs
By GORDON B. DAHL AND MICHAEL R RANSOM*
Economists and psychologists argue that individuals skew personal beliefs toaccord with their own interests. To test for the presence of self-serving beliefs, wesurveyed 1,200 members of the Mormon Church about tithing. A tithe is a voluntarycontribution equal to 10 percent of income. Since respondents must decide privatelywhat income items to tithe, we observe how the income definition depends on anindividual’s religious and financial incentives. We find surprisingly little evidencethat an individual’s financial situation influences beliefs about what counts asincome for the tithe. However, ambiguity increases the role for self-serving biases.(JEL A12, D63)
Preacher:“Brother Brown, I want to makesure you understood my sermon on charitytoday. If you had two farms, and BrotherWhite had no means of support, wouldn’tyou give him one of your farms?”
Brother Brown:“I most certainly would.”
Preacher: “What if you had two tractors,and Brother White had no way to harvesthis crop. Wouldn’t you give him one ofyour tractors?”
Brother Brown:“Why, sure I would.”
Preacher:“What if you had two horses andBrother White’s only horse died. Wouldn’tyou give him one of your horses?”
Brother Brown:“Well, no. You see, Ihavetwo horses.”
Previous psychological and economic researchindicates that individuals are highly inclined to
skew reported beliefs to line up with selfish inter-ests. A recent paper by Linda C. Babcock andGeorge Loewenstein (1997) reports several exam-ples: workers feel that compensation for extrahours of work should be higher when they are theones working longer hours; in public-sector salarynegotiations that make reference to the salaries ofcomparable groups, the union’s list of compa-rables contains higher salary districts than the mu-nicipality’s list; and in a mock traffic-accidentlawsuit in which participants are asked to predictan impartial judge’s ruling, plaintiffs guess muchhigher award amounts than defendants. Additionalwork has focused on the self-serving behavior ofmanagers, so that, for example, the peer-companystock-return benchmarks chosen by managementfor required comparisons are downward biased(Wilbur G. Lewellen et al., 1996).
A self-serving bias occurs when individualssubconsciously alter their fundamental viewsabout what is fair or right in a way that benefitstheir interests. In many situations, these dis-torted beliefs cause individuals to behave moreself-servingly or to bargain harder to get their“just” rewards. It can be difficult to identifyself-serving beliefs, however, since what ap-pears to be a bias may merely be the result of anindividual’s self-presentation. That is, individu-als may knowingly pursue what is in their bestinterest but use the language of fairness to sup-port their actions. For example, both true self-serving biases and the conscious calculation forgain likely affect individuals’ stated beliefs on
* Dahl: Department of Economics, University of Roch-ester, Rochester, NY 14627 (e-mail: [email protected]); Ransom: Department of Economics, Brigham YoungUniversity, Provo, UT 84602 (e-mail: [email protected]).The authors are indebted to David Card and Cecilia Rousefor encouragement and valuable suggestions. The authorsthank Herb Abelson of the Princeton University SurveyResearch Center, seminar participants at Princeton Univer-sity, and three anonymous referees for helpful comments.Dahl gratefully acknowledges financial support from thePrinceton University Industrial Relations Section and theCenter for Economic Policy Studies at Princeton University.The authors bear sole responsibility for the content of thispaper.
703
how best to assess tax burdens. Individuals havethe direct financial incentive to consciously sup-port and vote for changes that lower their taxes,and not necessarily for reforms that they feel aremost equitable. Indirectly, individuals’ true per-ceptions of what is fair in taxation may bedistorted by self-interest in minimizing theirown taxes. While economists usually focus onthe direct incentive individuals have to benefitthemselves when making decisions, psycholo-gists emphasize the psychological inability ofindividuals to separate out their own self-interest when forming beliefs.
To test for the presence of self-interested be-liefs, we conducted a telephone survey of mem-bers of the Church of Jesus Christ of Latter-DaySaints and asked them about their practice oftithing. Tithing is similar to a flat tax with nodeductions, where individuals make voluntarycontributions to the Church equal to 10 percent oftheir income. While Latter-Day Saint doctrineteaches that paying an honest tithe is necessary tobe right with God, Church members must decidefor themselves what income items to tithe. Hence,we can observe how income definitions depend onan individual’s financial and religious incentives.With the identifying assumption that believingmembers will not try to “cheat” God by con-sciously excluding a valid income source from thetithing base, any observed bias in income defini-tions must be driven by self-justified perceptionsof what is right, and not the conscious calculationfor gain.
Somewhat surprisingly, we find only minorevidence that tithable income definitions areaffected by the potential for financial gain. Hav-ing received a sizable gift or inheritance doesnot seem to affect individuals’ views of whethergifts and inheritances should be tithed. Like-wise, whether an individual has invested in thestock market, been unemployed, or owned hisown business does little to change the percep-tion that stock-market gains, unemploymentbenefits, and monies used by the self-employedto purchase health insurance belong in the tith-ing base. In addition, the tithing treatment ofretirement accounts does not depend on whetheran individual has ever made contributions to anIRA or 401(k) plan. However, our results doreveal strong evidence of self-interested tithingbehavior in the treatment of capital gains from ahome, with homeowners being less likely to say
they would tithe a housing capital gain com-pared to renters.
Self-serving biases, as defined broadly bypsychologists, show up much stronger for non-financial motivations. While different incen-tives are created by the different financialsituations of survey respondents, different mo-tivations are also driven by beliefs about theimportance of the Church. Individuals who at-tend church regularly, who serve in volunteerchurch positions, and who have previouslyserved as missionaries think much more com-prehensively about what items should be tithed.In accord with previous research, individualsexhibit stronger self-serving biases in the tithingscenarios that they view more ambiguously. Inaddition, individuals who appear to be less cer-tain about tithing in general are also less gen-erous in their tithing donations. Finally,individuals who avoid seeking advice fromchurch leaders and others about what items totithe hold to a narrower definition of the tithableincome base. This finding supports MatthewRabin’s (1995) hypothesis that individualswhose moral dispositions serve as internal con-straints will avoid seeking advice that couldinterfere with their self-interest.
I. Tithing
“[Latter-Day Saints] shall pay one-tenthof all their interest annually; and this shallbe a standing law unto them forever ... .”(The Doctrine and Covenants of theChurch of Jesus Christ of Latter-DaySaints,Section 119, Verse 4)
Tithing is the practice of paying a tenth partof one’s income, or a tithe, as an offering toGod. It originated anciently, as the Bible reportsthat Abraham (Genesis 14:18–20) and Jacob(Genesis 28:20–22) both paid tithes. Tithingwas also a part of the law of Moses (see Leviti-cus 27:30). Today, tithing is an integral elementof the religious practice of the Church of JesusChrist of Latter-Day Saints, commonly calledthe LDS or Mormon Church. By its nature, thetithing system of the LDS Church represents avoluntary flat tax, where members decide forthemselves what income-base definition to use.Thus, its practice allows us to observe whetherindividuals with varying financial or religiousincentives define income in a self-serving fashion.
704 THE AMERICAN ECONOMIC REVIEW SEPTEMBER 1999
Current practice in the LDS Church is formembers to mail or hand deliver tithes to thebishop, the local leader of the congregation. Thebishop forwards the money collected to LDSChurch headquarters, where central authoritiesauthorize expenditures. Congregations receive abudget for the operation of local church pro-grams based on the size of the congregation, noton the amount of tithes collected. Tithes aregiven with the understanding that the LDSChurch may use them for any purpose. TheChurch uses tithing funds for the constructionand purchase of buildings and for the day-to-day operation of the Church; tithing funds arealso used to partially support education, mis-sionary, and welfare programs (see Howard D.Swainston, 1992). Hence, tithes do not repre-sent an entrance fee to a “local club,” nor doesthe amount of an individual’s donation directlybenefit his or her local congregation financially.Members are also encouraged to donate “fastofferings,” for the relief of the poor, and fundsfor the support of the LDS Church’s missionaryprogram. However, such contributions are notconsidered to be part of the tithe (Bruce R.McConkie, 1966).
For our purposes, it is important to note thattithing is a voluntary private matter. Churchleaders teach that payment of an honest tenth isnecessary to be right with God, but that suchmatters are between the individual and God.While the rate of 10 percent is immutable,1
precisely which items to tithe is not laid out indetail. Bishops do not ask members for an ac-counting of what income sources were tithed;rather, in a yearly interview, each member sim-ply declares to the bishop whether or not he haspaid a full tithe. TheGeneral Handbook ofInstructions (1989), which contains officialChurch policy and is distributed to everybishop, intentionally does not specify what in-come sources should be tithed. Under the sub-heading “Definition of Tithing,” the handbookquotes an official 1970 letter (p. 9-1):
The First Presidency has written: “Thesimplest statement we know of is the
statement of the Lord himself, namely,that the members of the Church shouldpay ‘one-tenth of all their interest annu-ally,’ which is understood to mean in-come. No one is justified in making anyother statement than this.”
This same 1970 letter further explains: “Everymember of the Church is entitled to make hisown decision as to what he thinks he owes theLord and to make payment accordingly” (citedin Swainston [1992 p. 1480]).
While little direction is given on what incomesources should be tithed, Church leaders ad-monish members to willingly and faithfullytithe, and they promise accompanying spiritualand temporal blessings (Stephen L. Richards,1983). As a result, there is a pervasive LDSculture that encourages members to donate gen-erously. According to LDS theology, God isomniscient; hence, members arguably have lit-tle incentive to try consciously to cheat on theincome definition, since they believe that Godwould discern any such dishonesty. Indeed,since one of the primary motivations for thetithe is obedience to God’s commandments, in-tentionally lying about the income definitionwould negate much of the purpose and per-ceived benefit of the tithe.
II. Survey
To gain insights into potential biases in per-sonal-income definitions, we conducted a sur-vey which asked members of the LDS Churchabout their tithing practices. Using computer-assisted telephone interviewing (CATI), a pro-fessional survey company interviewed 1,200Latter-Day Saints living in the state of Utahbetween May 7 and May 20, 1996.2 While theLDS Church has a worldwide membership to-taling 9.7 million, we chose this sample becauseof Utah’s high concentration of Church mem-bers. Martin B. Bradley et al. (1992) estimatethat approximately 72 percent of the state pop-ulation is LDS, and 73 percent of those ran-domly telephoned in our survey indicated thatthey were members of the LDS Church. Indi-viduals were eligible to complete the survey if
1 “Strictly speaking there is no such thing as a parttithing. Tithing is a tenth, and unless a person contributesthe tenth, he has only made a contribution to the tithingfunds of the Church” (McConkie, 1966 pp. 798–99).
2 A copy of the survey is available from the authors uponrequest.
705VOL. 89 NO. 4 DAHL AND RANSOM: TITHING AND SELF-SERVING BELIEFS
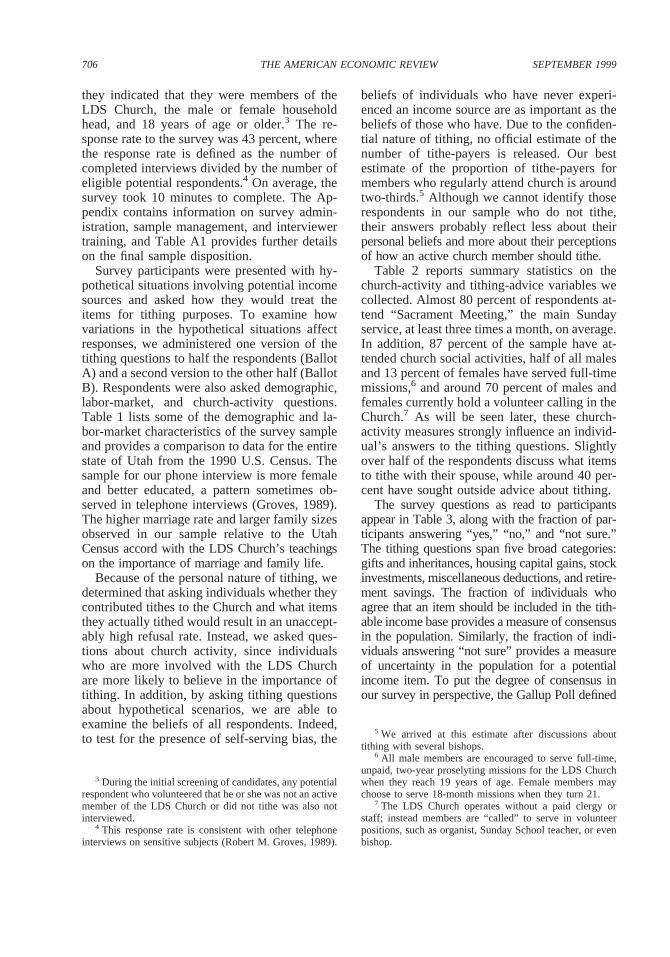
they indicated that they were members of theLDS Church, the male or female householdhead, and 18 years of age or older.3 The re-sponse rate to the survey was 43 percent, wherethe response rate is defined as the number ofcompleted interviews divided by the number ofeligible potential respondents.4 On average, thesurvey took 10 minutes to complete. The Ap-pendix contains information on survey admin-istration, sample management, and interviewertraining, and Table A1 provides further detailson the final sample disposition.
Survey participants were presented with hy-pothetical situations involving potential incomesources and asked how they would treat theitems for tithing purposes. To examine howvariations in the hypothetical situations affectresponses, we administered one version of thetithing questions to half the respondents (BallotA) and a second version to the other half (BallotB). Respondents were also asked demographic,labor-market, and church-activity questions.Table 1 lists some of the demographic and la-bor-market characteristics of the survey sampleand provides a comparison to data for the entirestate of Utah from the 1990 U.S. Census. Thesample for our phone interview is more femaleand better educated, a pattern sometimes ob-served in telephone interviews (Groves, 1989).The higher marriage rate and larger family sizesobserved in our sample relative to the UtahCensus accord with the LDS Church’s teachingson the importance of marriage and family life.
Because of the personal nature of tithing, wedetermined that asking individuals whether theycontributed tithes to the Church and what itemsthey actually tithed would result in an unaccept-ably high refusal rate. Instead, we asked ques-tions about church activity, since individualswho are more involved with the LDS Churchare more likely to believe in the importance oftithing. In addition, by asking tithing questionsabout hypothetical scenarios, we are able toexamine the beliefs of all respondents. Indeed,to test for the presence of self-serving bias, the
beliefs of individuals who have never experi-enced an income source are as important as thebeliefs of those who have. Due to the confiden-tial nature of tithing, no official estimate of thenumber of tithe-payers is released. Our bestestimate of the proportion of tithe-payers formembers who regularly attend church is aroundtwo-thirds.5 Although we cannot identify thoserespondents in our sample who do not tithe,their answers probably reflect less about theirpersonal beliefs and more about their perceptionsof how an active church member should tithe.
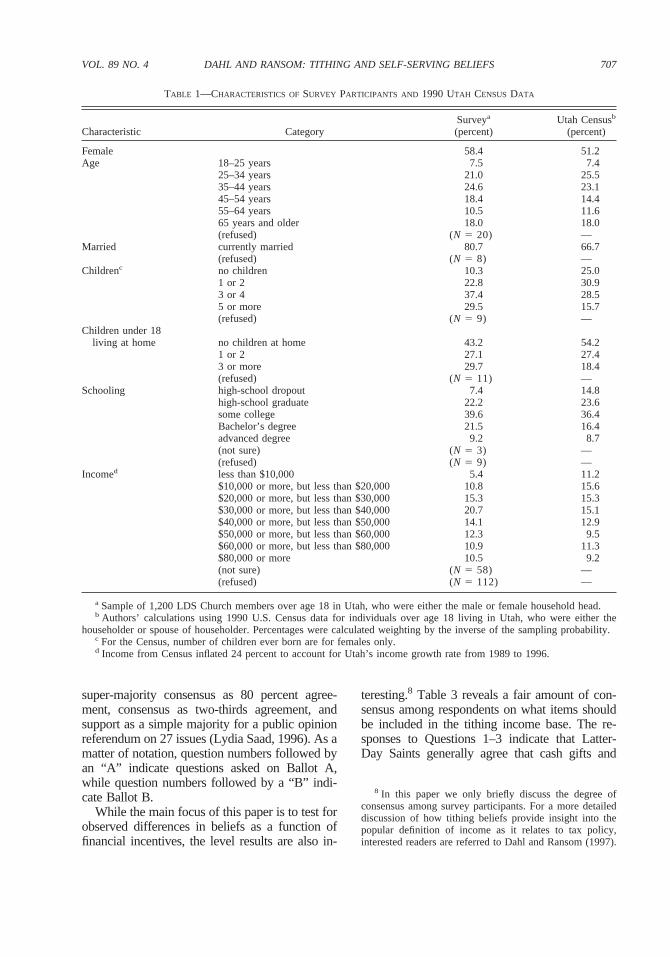
Table 2 reports summary statistics on thechurch-activity and tithing-advice variables wecollected. Almost 80 percent of respondents at-tend “Sacrament Meeting,” the main Sundayservice, at least three times a month, on average.In addition, 87 percent of the sample have at-tended church social activities, half of all malesand 13 percent of females have served full-timemissions,6 and around 70 percent of males andfemales currently hold a volunteer calling in theChurch.7 As will be seen later, these church-activity measures strongly influence an individ-ual’s answers to the tithing questions. Slightlyover half of the respondents discuss what itemsto tithe with their spouse, while around 40 per-cent have sought outside advice about tithing.
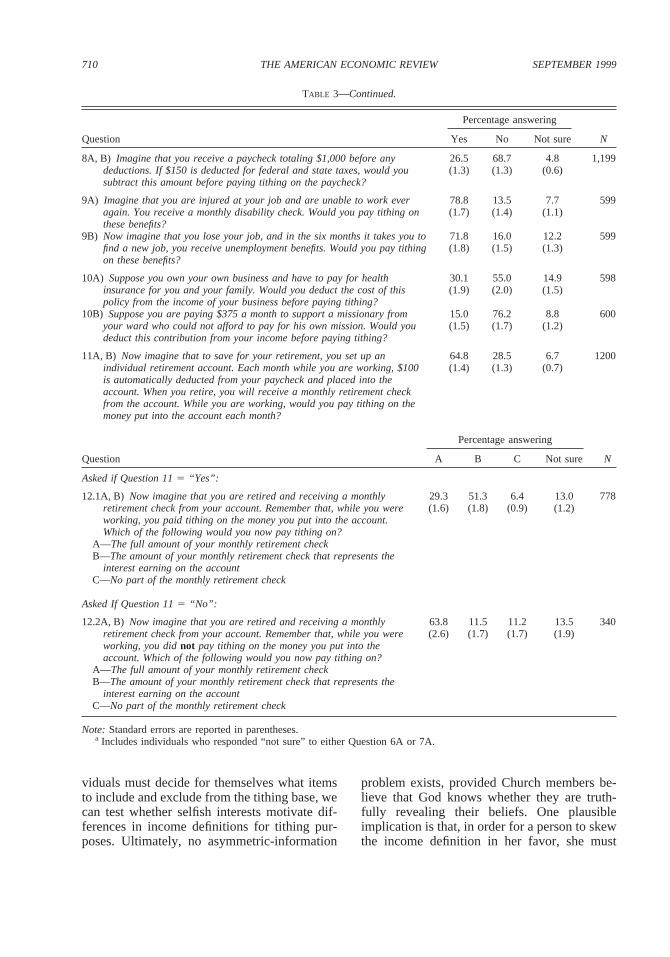
The survey questions as read to participantsappear in Table 3, along with the fraction of par-ticipants answering “yes,” “no,” and “not sure.”The tithing questions span five broad categories:gifts and inheritances, housing capital gains, stockinvestments, miscellaneous deductions, and retire-ment savings. The fraction of individuals whoagree that an item should be included in the tith-able income base provides a measure of consensusin the population. Similarly, the fraction of indi-viduals answering “not sure” provides a measureof uncertainty in the population for a potentialincome item. To put the degree of consensus inour survey in perspective, the Gallup Poll defined
3 During the initial screening of candidates, any potentialrespondent who volunteered that he or she was not an activemember of the LDS Church or did not tithe was also notinterviewed.
4 This response rate is consistent with other telephoneinterviews on sensitive subjects (Robert M. Groves, 1989).
5 We arrived at this estimate after discussions abouttithing with several bishops.
6 All male members are encouraged to serve full-time,unpaid, two-year proselyting missions for the LDS Churchwhen they reach 19 years of age. Female members maychoose to serve 18-month missions when they turn 21.
7 The LDS Church operates without a paid clergy orstaff; instead members are “called” to serve in volunteerpositions, such as organist, Sunday School teacher, or evenbishop.
706 THE AMERICAN ECONOMIC REVIEW SEPTEMBER 1999
super-majority consensus as 80 percent agree-ment, consensus as two-thirds agreement, andsupport as a simple majority for a public opinionreferendum on 27 issues (Lydia Saad, 1996). As amatter of notation, question numbers followed byan “A” indicate questions asked on Ballot A,while question numbers followed by a “B” indi-cate Ballot B.
While the main focus of this paper is to test forobserved differences in beliefs as a function offinancial incentives, the level results are also in-
teresting.8 Table 3 reveals a fair amount of con-sensus among respondents on what items shouldbe included in the tithing income base. The re-sponses to Questions 1–3 indicate that Latter-Day Saints generally agree that cash gifts and
8 In this paper we only briefly discuss the degree ofconsensus among survey participants. For a more detaileddiscussion of how tithing beliefs provide insight into thepopular definition of income as it relates to tax policy,interested readers are referred to Dahl and Ransom (1997).
TABLE 1—CHARACTERISTICS OFSURVEY PARTICIPANTS AND 1990 UTAH CENSUS DATA
Characteristic CategorySurveya
(percent)Utah Censusb
(percent)
Female 58.4 51.2Age 18–25 years 7.5 7.4
25–34 years 21.0 25.535–44 years 24.6 23.145–54 years 18.4 14.455–64 years 10.5 11.665 years and older 18.0 18.0(refused) (N 5 20) —
Married currently married 80.7 66.7(refused) (N 5 8) —
Childrenc no children 10.3 25.01 or 2 22.8 30.93 or 4 37.4 28.55 or more 29.5 15.7(refused) (N 5 9) —
Children under 18living at home no children at home 43.2 54.2
1 or 2 27.1 27.43 or more 29.7 18.4(refused) (N 5 11) —
Schooling high-school dropout 7.4 14.8high-school graduate 22.2 23.6some college 39.6 36.4Bachelor’s degree 21.5 16.4advanced degree 9.2 8.7(not sure) (N 5 3) —(refused) (N 5 9) —
Incomed less than $10,000 5.4 11.2$10,000 or more, but less than $20,000 10.8 15.6$20,000 or more, but less than $30,000 15.3 15.3$30,000 or more, but less than $40,000 20.7 15.1$40,000 or more, but less than $50,000 14.1 12.9$50,000 or more, but less than $60,000 12.3 9.5$60,000 or more, but less than $80,000 10.9 11.3$80,000 or more 10.5 9.2(not sure) (N 5 58) —(refused) (N 5 112) —
a Sample of 1,200 LDS Church members over age 18 in Utah, who were either the male or female household head.b Authors’ calculations using 1990 U.S. Census data for individuals over age 18 living in Utah, who were either the
householder or spouse of householder. Percentages were calculated weighting by the inverse of the sampling probability.c For the Census, number of children ever born are for females only.d Income from Census inflated 24 percent to account for Utah’s income growth rate from 1989 to 1996.
707VOL. 89 NO. 4 DAHL AND RANSOM: TITHING AND SELF-SERVING BELIEFS
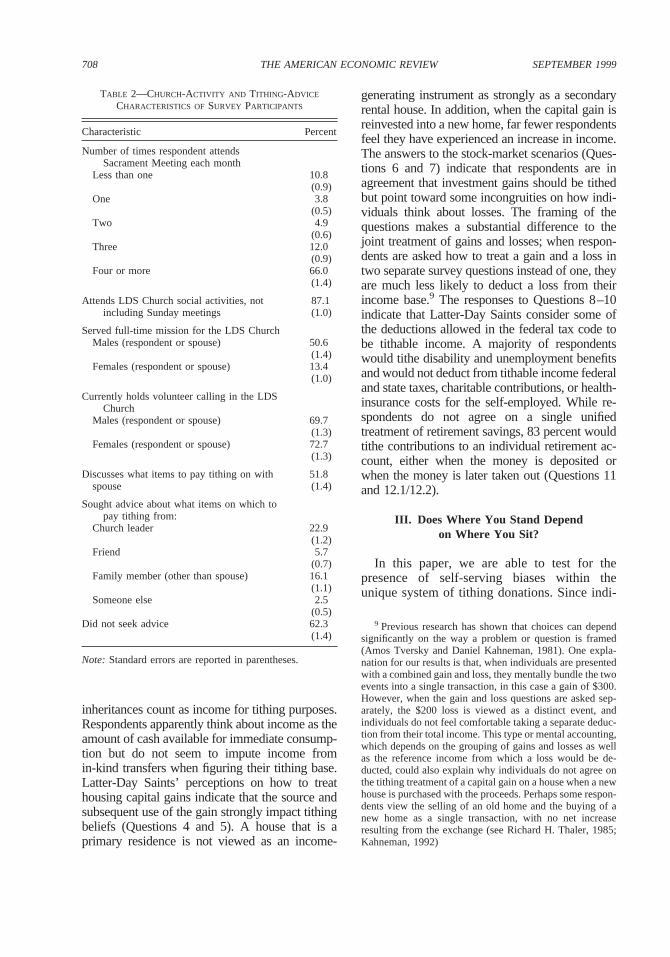
inheritances count as income for tithing purposes.Respondents apparently think about income as theamount of cash available for immediate consump-tion but do not seem to impute income fromin-kind transfers when figuring their tithing base.Latter-Day Saints’ perceptions on how to treathousing capital gains indicate that the source andsubsequent use of the gain strongly impact tithingbeliefs (Questions 4 and 5). A house that is aprimary residence is not viewed as an income-
generating instrument as strongly as a secondaryrental house. In addition, when the capital gain isreinvested into a new home, far fewer respondentsfeel they have experienced an increase in income.The answers to the stock-market scenarios (Ques-tions 6 and 7) indicate that respondents are inagreement that investment gains should be tithedbut point toward some incongruities on how indi-viduals think about losses. The framing of thequestions makes a substantial difference to thejoint treatment of gains and losses; when respon-dents are asked how to treat a gain and a loss intwo separate survey questions instead of one, theyare much less likely to deduct a loss from theirincome base.9 The responses to Questions 8–10indicate that Latter-Day Saints consider some ofthe deductions allowed in the federal tax code tobe tithable income. A majority of respondentswould tithe disability and unemployment benefitsand would not deduct from tithable income federaland state taxes, charitable contributions, or health-insurance costs for the self-employed. While re-spondents do not agree on a single unifiedtreatment of retirement savings, 83 percent wouldtithe contributions to an individual retirement ac-count, either when the money is deposited orwhen the money is later taken out (Questions 11and 12.1/12.2).
III. Does Where You Stand Dependon Where You Sit?
In this paper, we are able to test for thepresence of self-serving biases within theunique system of tithing donations. Since indi-
9 Previous research has shown that choices can dependsignificantly on the way a problem or question is framed(Amos Tversky and Daniel Kahneman, 1981). One expla-nation for our results is that, when individuals are presentedwith a combined gain and loss, they mentally bundle the twoevents into a single transaction, in this case a gain of $300.However, when the gain and loss questions are asked sep-arately, the $200 loss is viewed as a distinct event, andindividuals do not feel comfortable taking a separate deduc-tion from their total income. This type or mental accounting,which depends on the grouping of gains and losses as wellas the reference income from which a loss would be de-ducted, could also explain why individuals do not agree onthe tithing treatment of a capital gain on a house when a newhouse is purchased with the proceeds. Perhaps some respon-dents view the selling of an old home and the buying of anew home as a single transaction, with no net increaseresulting from the exchange (see Richard H. Thaler, 1985;Kahneman, 1992)
TABLE 2—CHURCH-ACTIVITY AND TITHING-ADVICE
CHARACTERISTICS OFSURVEY PARTICIPANTS
Characteristic Percent
Number of times respondent attendsSacrament Meeting each month
Less than one 10.8(0.9)
One 3.8(0.5)
Two 4.9(0.6)
Three 12.0(0.9)
Four or more 66.0(1.4)
Attends LDS Church social activities, notincluding Sunday meetings
87.1(1.0)
Served full-time mission for the LDS ChurchMales (respondent or spouse) 50.6
(1.4)Females (respondent or spouse) 13.4
(1.0)
Currently holds volunteer calling in the LDSChurch
Males (respondent or spouse) 69.7(1.3)
Females (respondent or spouse) 72.7(1.3)
Discusses what items to pay tithing on with 51.8spouse (1.4)
Sought advice about what items on which topay tithing from:
Church leader 22.9(1.2)
Friend 5.7(0.7)
Family member (other than spouse) 16.1(1.1)
Someone else 2.5(0.5)
Did not seek advice 62.3(1.4)
Note: Standard errors are reported in parentheses.
708 THE AMERICAN ECONOMIC REVIEW SEPTEMBER 1999
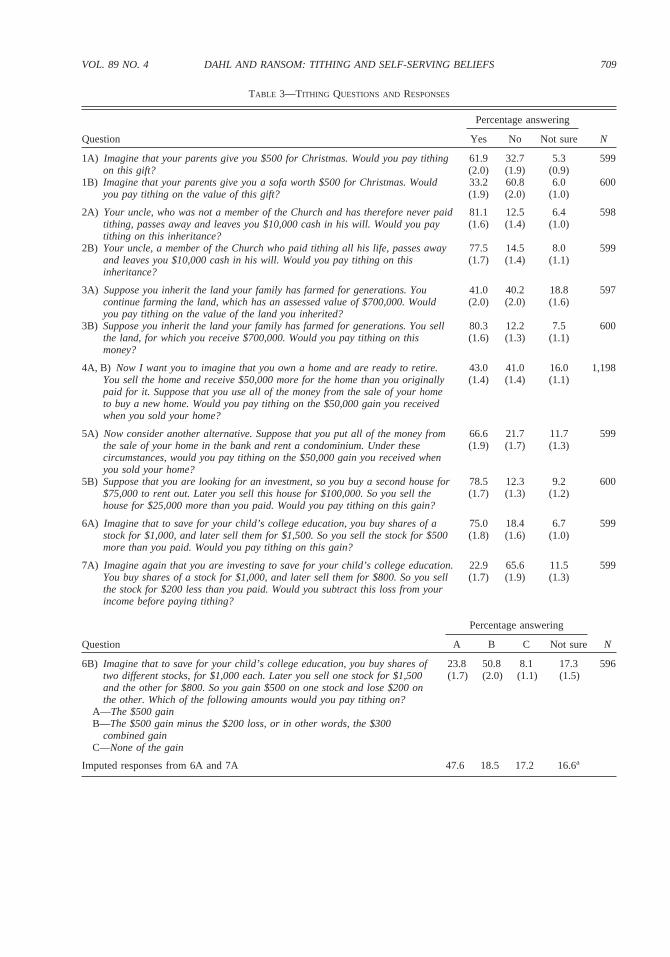
TABLE 3—TITHING QUESTIONS AND RESPONSES
Question
Percentage answering
NYes No Not sure
1A) Imagine that your parents give you $500 for Christmas. Would you pay tithingon this gift?
61.9(2.0)
32.7(1.9)
5.3(0.9)
599
1B) Imagine that your parents give you a sofa worth $500 for Christmas. Wouldyou pay tithing on the value of this gift?
33.2(1.9)
60.8(2.0)
6.0(1.0)
600
2A) Your uncle, who was not a member of the Church and has therefore never paidtithing, passes away and leaves you $10,000 cash in his will. Would you paytithing on this inheritance?
81.1(1.6)
12.5(1.4)
6.4(1.0)
598
2B) Your uncle, a member of the Church who paid tithing all his life, passes awayand leaves you $10,000 cash in his will. Would you pay tithing on thisinheritance?
77.5(1.7)
14.5(1.4)
8.0(1.1)
599
3A) Suppose you inherit the land your family has farmed for generations. Youcontinue farming the land, which has an assessed value of $700,000. Wouldyou pay tithing on the value of the land you inherited?
41.0(2.0)
40.2(2.0)
18.8(1.6)
597
3B) Suppose you inherit the land your family has farmed for generations. You sellthe land, for which you receive $700,000. Would you pay tithing on thismoney?
80.3(1.6)
12.2(1.3)
7.5(1.1)
600
4A, B) Now I want you to imagine that you own a home and are ready to retire.You sell the home and receive $50,000 more for the home than you originallypaid for it. Suppose that you use all of the money from the sale of your hometo buy a new home. Would you pay tithing on the $50,000 gain you receivedwhen you sold your home?
43.0(1.4)
41.0(1.4)
16.0(1.1)
1,198
5A) Now consider another alternative. Suppose that you put all of the money fromthe sale of your home in the bank and rent a condominium. Under thesecircumstances, would you pay tithing on the $50,000 gain you received whenyou sold your home?
66.6(1.9)
21.7(1.7)
11.7(1.3)
599
5B) Suppose that you are looking for an investment, so you buy a second house for$75,000 to rent out. Later you sell this house for $100,000. So you sell thehouse for $25,000 more than you paid. Would you pay tithing on this gain?
78.5(1.7)
12.3(1.3)
9.2(1.2)
600
6A) Imagine that to save for your child’s college education, you buy shares of astock for $1,000, and later sell them for $1,500. So you sell the stock for $500more than you paid. Would you pay tithing on this gain?
75.0(1.8)
18.4(1.6)
6.7(1.0)
599
7A) Imagine again that you are investing to save for your child’s college education.You buy shares of a stock for $1,000, and later sell them for $800. So you sellthe stock for $200 less than you paid. Would you subtract this loss from yourincome before paying tithing?
22.9(1.7)
65.6(1.9)
11.5(1.3)
599
Question
Percentage answering
NA B C Not sure
6B) Imagine that to save for your child’s college education, you buy shares oftwo different stocks, for $1,000 each. Later you sell one stock for $1,500and the other for $800. So you gain $500 on one stock and lose $200 onthe other. Which of the following amounts would you pay tithing on?
23.8(1.7)
50.8(2.0)
8.1(1.1)
17.3(1.5)
596
A—The $500 gainB—The $500 gain minus the $200 loss, or in other words, the $300
combined gainC—None of the gain
Imputed responses from 6A and 7A 47.6 18.5 17.2 16.6a
709VOL. 89 NO. 4 DAHL AND RANSOM: TITHING AND SELF-SERVING BELIEFS
viduals must decide for themselves what itemsto include and exclude from the tithing base, wecan test whether selfish interests motivate dif-ferences in income definitions for tithing pur-poses. Ultimately, no asymmetric-information
problem exists, provided Church members be-lieve that God knows whether they are truth-fully revealing their beliefs. One plausibleimplication is that, in order for a person to skewthe income definition in her favor, she must
TABLE 3—Continued.
Question
Percentage answering
NYes No Not sure
8A, B) Imagine that you receive a paycheck totaling $1,000 before anydeductions. If $150 is deducted for federal and state taxes, would yousubtract this amount before paying tithing on the paycheck?
26.5(1.3)
68.7(1.3)
4.8(0.6)
1,199
9A) Imagine that you are injured at your job and are unable to work everagain. You receive a monthly disability check. Would you pay tithing onthese benefits?
78.8(1.7)
13.5(1.4)
7.7(1.1)
599
9B) Now imagine that you lose your job, and in the six months it takes you tofind a new job, you receive unemployment benefits. Would you pay tithingon these benefits?
71.8(1.8)
16.0(1.5)
12.2(1.3)
599
10A) Suppose you own your own business and have to pay for healthinsurance for you and your family. Would you deduct the cost of thispolicy from the income of your business before paying tithing?
30.1(1.9)
55.0(2.0)
14.9(1.5)
598
10B) Suppose you are paying $375 a month to support a missionary fromyour ward who could not afford to pay for his own mission. Would youdeduct this contribution from your income before paying tithing?
15.0(1.5)
76.2(1.7)
8.8(1.2)
600
11A, B) Now imagine that to save for your retirement, you set up anindividual retirement account. Each month while you are working, $100is automatically deducted from your paycheck and placed into theaccount. When you retire, you will receive a monthly retirement checkfrom the account. While you are working, would you pay tithing on themoney put into the account each month?
64.8(1.4)
28.5(1.3)
6.7(0.7)
1200
Question
Percentage answering
NA B C Not sure
Asked if Question 115 “Yes”:
12.1A, B) Now imagine that you are retired and receiving a monthlyretirement check from your account. Remember that, while you wereworking, you paid tithing on the money you put into the account.Which of the following would you now pay tithing on?
29.3(1.6)
51.3(1.8)
6.4(0.9)
13.0(1.2)
778
A—The full amount of your monthly retirement checkB—The amount of your monthly retirement check that represents the
interest earning on the accountC—No part of the monthly retirement check
Asked If Question 115 “No”:
12.2A, B) Now imagine that you are retired and receiving a monthlyretirement check from your account. Remember that, while you wereworking, you didnot pay tithing on the money you put into theaccount. Which of the following would you now pay tithing on?
63.8(2.6)
11.5(1.7)
11.2(1.7)
13.5(1.9)
340
A—The full amount of your monthly retirement checkB—The amount of your monthly retirement check that represents the
interest earning on the accountC—No part of the monthly retirement check
Note: Standard errors are reported in parentheses.a Includes individuals who responded “not sure” to either Question 6A or 7A.
710 THE AMERICAN ECONOMIC REVIEW SEPTEMBER 1999
fundamentally convince herself that her defini-tion accords with God’s will. If this identifyingassumption is made, any self-serving incomedefinitions for tithing are the result of changesin underlying tithing beliefs, and not a con-scious calculation for gain. However, evenwithout this additional assumption, our surveyprovides a natural experiment for the presenceof self-serving behavior outside of the labora-tory setting.
A. Financial Motivations
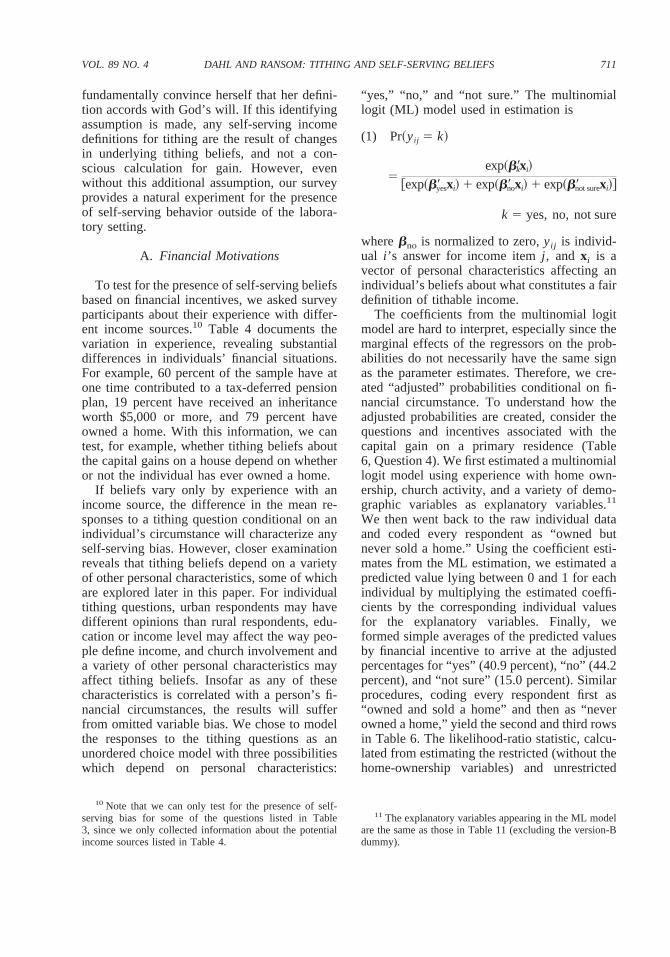
To test for the presence of self-serving beliefsbased on financial incentives, we asked surveyparticipants about their experience with differ-ent income sources.10 Table 4 documents thevariation in experience, revealing substantialdifferences in individuals’ financial situations.For example, 60 percent of the sample have atone time contributed to a tax-deferred pensionplan, 19 percent have received an inheritanceworth $5,000 or more, and 79 percent haveowned a home. With this information, we cantest, for example, whether tithing beliefs aboutthe capital gains on a house depend on whetheror not the individual has ever owned a home.
If beliefs vary only by experience with anincome source, the difference in the mean re-sponses to a tithing question conditional on anindividual’s circumstance will characterize anyself-serving bias. However, closer examinationreveals that tithing beliefs depend on a varietyof other personal characteristics, some of whichare explored later in this paper. For individualtithing questions, urban respondents may havedifferent opinions than rural respondents, edu-cation or income level may affect the way peo-ple define income, and church involvement anda variety of other personal characteristics mayaffect tithing beliefs. Insofar as any of thesecharacteristics is correlated with a person’s fi-nancial circumstances, the results will sufferfrom omitted variable bias. We chose to modelthe responses to the tithing questions as anunordered choice model with three possibilitieswhich depend on personal characteristics:
“yes,” “no,” and “not sure.” The multinomiallogit (ML) model used in estimation is
(1) Pr~yij 5 k!
5exp~b9kxi!
@exp~b9yesxi! 1 exp~b9noxi! 1 exp~b9not surexi!#
k 5 yes, no, not sure
wherebno is normalized to zero,yij is individ-ual i ’s answer for income itemj , and xi is avector of personal characteristics affecting anindividual’s beliefs about what constitutes a fairdefinition of tithable income.
The coefficients from the multinomial logitmodel are hard to interpret, especially since themarginal effects of the regressors on the prob-abilities do not necessarily have the same signas the parameter estimates. Therefore, we cre-ated “adjusted” probabilities conditional on fi-nancial circumstance. To understand how theadjusted probabilities are created, consider thequestions and incentives associated with thecapital gain on a primary residence (Table6, Question 4). We first estimated a multinomiallogit model using experience with home own-ership, church activity, and a variety of demo-graphic variables as explanatory variables.11
We then went back to the raw individual dataand coded every respondent as “owned butnever sold a home.” Using the coefficient esti-mates from the ML estimation, we estimated apredicted value lying between 0 and 1 for eachindividual by multiplying the estimated coeffi-cients by the corresponding individual valuesfor the explanatory variables. Finally, weformed simple averages of the predicted valuesby financial incentive to arrive at the adjustedpercentages for “yes” (40.9 percent), “no” (44.2percent), and “not sure” (15.0 percent). Similarprocedures, coding every respondent first as“owned and sold a home” and then as “neverowned a home,” yield the second and third rowsin Table 6. The likelihood-ratio statistic, calcu-lated from estimating the restricted (without thehome-ownership variables) and unrestricted
10 Note that we can only test for the presence of self-serving bias for some of the questions listed in Table3, since we only collected information about the potentialincome sources listed in Table 4.
11 The explanatory variables appearing in the ML modelare the same as those in Table 11 (excluding the version-Bdummy).
711VOL. 89 NO. 4 DAHL AND RANSOM: TITHING AND SELF-SERVING BELIEFS
ML equations, reveals that home ownership sig-nificantly affects tithing beliefs for Question 4.A similar procedure was used for other ques-tions, substituting the appropriate experiencevariables for home ownership.
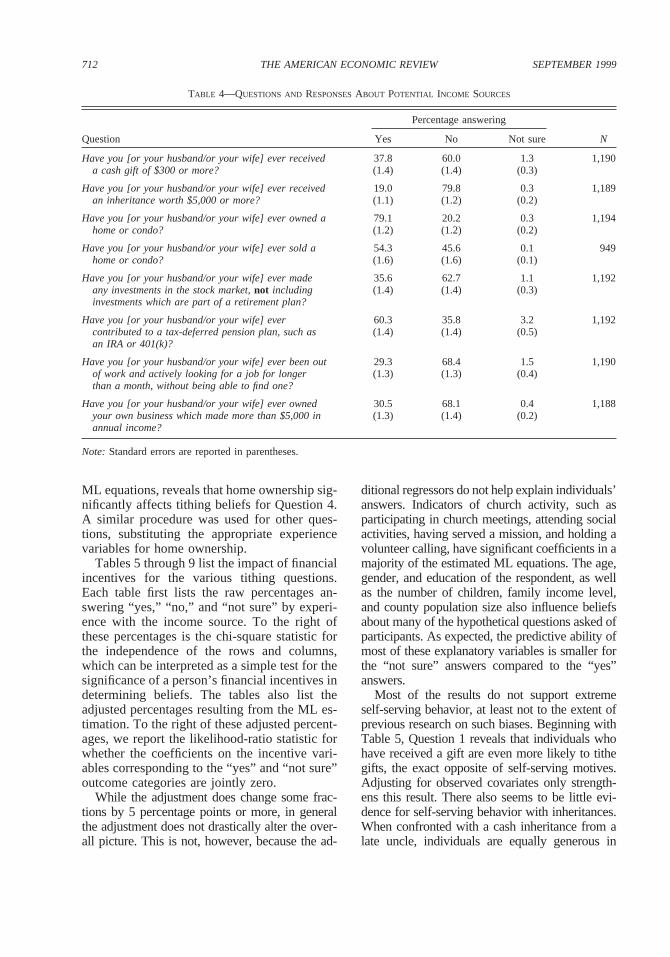
Tables 5 through 9 list the impact of financialincentives for the various tithing questions.Each table first lists the raw percentages an-swering “yes,” “no,” and “not sure” by experi-ence with the income source. To the right ofthese percentages is the chi-square statistic forthe independence of the rows and columns,which can be interpreted as a simple test for thesignificance of a person’s financial incentives indetermining beliefs. The tables also list theadjusted percentages resulting from the ML es-timation. To the right of these adjusted percent-ages, we report the likelihood-ratio statistic forwhether the coefficients on the incentive vari-ables corresponding to the “yes” and “not sure”outcome categories are jointly zero.
While the adjustment does change some frac-tions by 5 percentage points or more, in generalthe adjustment does not drastically alter the over-all picture. This is not, however, because the ad-
ditional regressors do not help explain individuals’answers. Indicators of church activity, such asparticipating in church meetings, attending socialactivities, having served a mission, and holding avolunteer calling, have significant coefficients in amajority of the estimated ML equations. The age,gender, and education of the respondent, as wellas the number of children, family income level,and county population size also influence beliefsabout many of the hypothetical questions asked ofparticipants. As expected, the predictive ability ofmost of these explanatory variables is smaller forthe “not sure” answers compared to the “yes”answers.
Most of the results do not support extremeself-serving behavior, at least not to the extent ofprevious research on such biases. Beginning withTable 5, Question 1 reveals that individuals whohave received a gift are even more likely to tithegifts, the exact opposite of self-serving motives.Adjusting for observed covariates only strength-ens this result. There also seems to be little evi-dence for self-serving behavior with inheritances.When confronted with a cash inheritance from alate uncle, individuals are equally generous in
TABLE 4—QUESTIONS AND RESPONSESABOUT POTENTIAL INCOME SOURCES
Question
Percentage answering
NYes No Not sure
Have you [or your husband/or your wife] ever receiveda cash gift of $300 or more?
37.8(1.4)
60.0(1.4)
1.3(0.3)
1,190
Have you [or your husband/or your wife] ever receivedan inheritance worth $5,000 or more?
19.0(1.1)
79.8(1.2)
0.3(0.2)
1,189
Have you [or your husband/or your wife] ever owned ahome or condo?
79.1(1.2)
20.2(1.2)
0.3(0.2)
1,194
Have you [or your husband/or your wife] ever sold ahome or condo?
54.3(1.6)
45.6(1.6)
0.1(0.1)
949
Have you [or your husband/or your wife] ever madeany investments in the stock market,not includinginvestments which are part of a retirement plan?
35.6(1.4)
62.7(1.4)
1.1(0.3)
1,192
Have you [or your husband/or your wife] evercontributed to a tax-deferred pension plan, such asan IRA or 401(k)?
60.3(1.4)
35.8(1.4)
3.2(0.5)
1,192
Have you [or your husband/or your wife] ever been outof work and actively looking for a job for longerthan a month, without being able to find one?
29.3(1.3)
68.4(1.3)
1.5(0.4)
1,190
Have you [or your husband/or your wife] ever ownedyour own business which made more than $5,000 inannual income?
30.5(1.3)
68.1(1.4)
0.4(0.2)
1,188
Note: Standard errors are reported in parentheses.
712 THE AMERICAN ECONOMIC REVIEW SEPTEMBER 1999
their payment of tithes whether or not they haveactually received an inheritance (Question 2).Those who have not received a cash inheritance,however, are three times as likely to answer “notsure”; perhaps these individuals had not seriouslythought about the question prior to the surveybecause they had no need to consider it.12 Theresults for inheriting the family farm likewiseshow little, if any, evidence of self-interested be-liefs. For example, for Question 3B, equal frac-tions (approximately 80 percent) of respondentswho have and have not received an inheritance feltthat a large land inheritance sold for cash shouldbe tithed.
The one outstanding exception to the lack ofself-serving behavior shows up with housing cap-ital gains in Table 6. With these questions, respon-
dents who have never owned a home are up to20-percent more likely to believe that tithingshould be paid on the capital gain. For example, inQuestion 5A, a super-majority (after adjusting forcovariates) of those who have never owned ahome feel that cash-realized gains from a primaryresidence should count as tithable income, com-pared to less than 63 percent of homeowners. ForQuestion 4, the effects of home ownership are alsohighly significant, both before and after adjustingfor observed covariates. The differences in beliefsbetween homeowners and non-homeowners dis-appear in Question 5A, when the capital gainresults from a secondary house purchased as aninvestment. Apparently, homeowners do not viewa primary residence as an income-generating in-strument as strongly as a secondary investmenthouse, while non-homeowners make no such dis-tinction (Question 5A vs. Question 5B). Interest-ingly, non-homeowners are less likely to answer“not sure” to most of the housing-capital-gainquestions. In fact, those who have owned and solda home are uniformly the most likely to answer
12 An alternative interpretation is that, when respondentsanswer “not sure,” they really mean “no.” If “not sure” isclassified as “no,” the results presented in Tables 5–9 becomeeven stronger, with a large bias for capital gains on a home andvery little self-serving bias for the remaining questions.
TABLE 5—GIFT AND INHERITANCE QUESTIONS BY POTENTIAL FINANCIAL INCENTIVE
Question and potential financialincentive
Raw percentages Chi-squaretesta
[p-value]
Covariate-adjustedpercentages
LR testb
[p-value]Yes No Not sure Yes No Not sure
1A) Imagine that your parents give you $500 for Christmas. Would you pay tithing on this gift?Received a gift 64.1 31.8 4.1 1.2 63.4 32.9 3.7 1.8Never received a gift 60.2 34.1 5.7 [0.545] 60.8 33.1 6.2 [0.414]
1B) Imagine that your parents give you a sofa worth $500 for Christmas. Would you pay tithing on the value of thisgift?
Received a gift 34.4 63.0 2.7 6.5 36.8 59.8 3.4 4.9Never received a gift 31.1 62.3 7.7 [0.038] 30.3 62.6 7.0 [0.088]
2A) Your uncle, who was not a member of the Church and has therefore never paid tithing, passes away and leaves you$10,000 cash in his will. Would you pay tithing on this inheritance?
Received an inheritance 90.3 7.8 1.9 6.9 86.5 11.4 2.1 4.2Never received an inheritance 78.7 13.2 7.1 [0.033] 80.7 12.2 7.1 [0.124]
2B) Your uncle, a member of the Church who paid tithing all his life, passes away and leaves you $10,000 cash in hiswill. Would you pay tithing on this inheritance?
Received an inheritance 79.0 18.5 2.5 6.2 74.2 23.0 2.7 11.9Never received an inheritance 77.3 13.9 8.7 [0.045] 78.1 12.8 9.1 [0.003]
3A) Suppose you inherit the land your family has farmed for generations. You continue farming the land, which has anassessed value of $700,000. Would you pay tithing on the value of the land you inherited?
Received an inheritance 39.8 40.8 19.4 0.0 38.1 46.7 15.1 2.6Never received an inheritance 40.6 40.4 19.0 [0.989] 40.9 38.9 20.2 [0.277]
3B) Suppose you inherit the land your family has farmed for generations. You sell the land, for which you receive$700,000. Would you pay tithing on this money?
Received an inheritance 82.4 10.9 6.7 0.5 80.0 14.4 5.5 1.3Never received an inheritance 79.5 13.1 7.4 [0.779] 80.0 12.0 8.0 [0.521]
a Chi-square test for independence of rows and columns.b Likelihood-ratio test for the incentive variables appearing in the multinomial logit equations.
713VOL. 89 NO. 4 DAHL AND RANSOM: TITHING AND SELF-SERVING BELIEFS
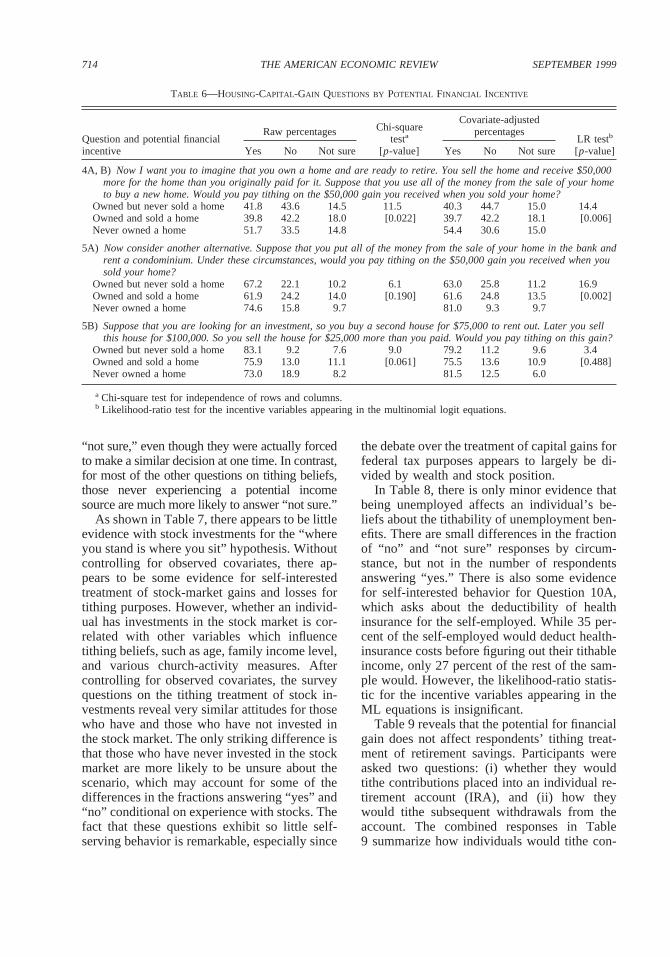
“not sure,” even though they were actually forcedto make a similar decision at one time. In contrast,for most of the other questions on tithing beliefs,those never experiencing a potential incomesource are much more likely to answer “not sure.”
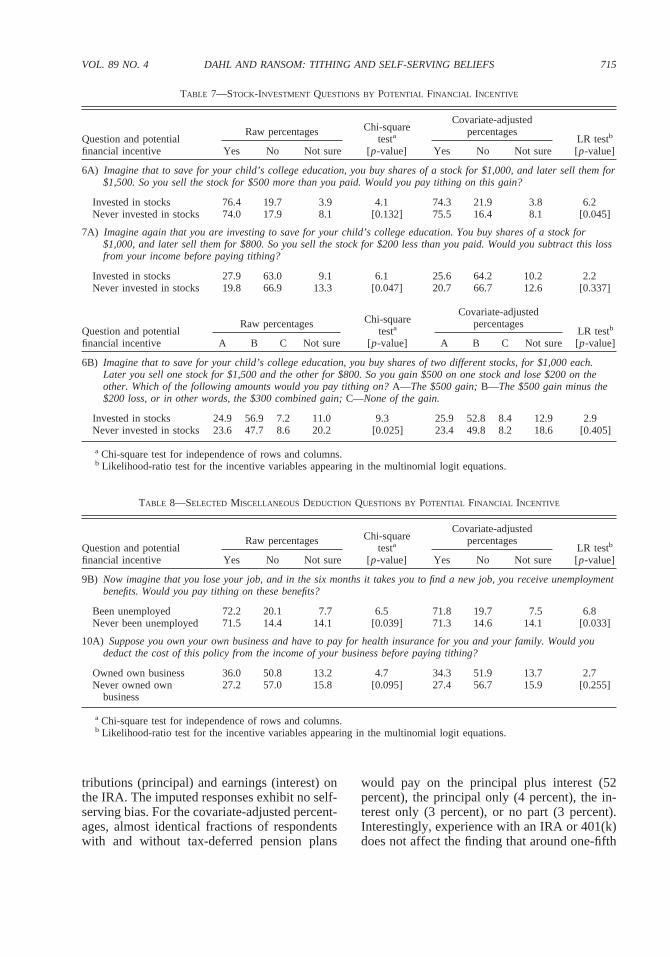
As shown in Table 7, there appears to be littleevidence with stock investments for the “whereyou stand is where you sit” hypothesis. Withoutcontrolling for observed covariates, there ap-pears to be some evidence for self-interestedtreatment of stock-market gains and losses fortithing purposes. However, whether an individ-ual has investments in the stock market is cor-related with other variables which influencetithing beliefs, such as age, family income level,and various church-activity measures. Aftercontrolling for observed covariates, the surveyquestions on the tithing treatment of stock in-vestments reveal very similar attitudes for thosewho have and those who have not invested inthe stock market. The only striking difference isthat those who have never invested in the stockmarket are more likely to be unsure about thescenario, which may account for some of thedifferences in the fractions answering “yes” and“no” conditional on experience with stocks. Thefact that these questions exhibit so little self-serving behavior is remarkable, especially since
the debate over the treatment of capital gains forfederal tax purposes appears to largely be di-vided by wealth and stock position.
In Table 8, there is only minor evidence thatbeing unemployed affects an individual’s be-liefs about the tithability of unemployment ben-efits. There are small differences in the fractionof “no” and “not sure” responses by circum-stance, but not in the number of respondentsanswering “yes.” There is also some evidencefor self-interested behavior for Question 10A,which asks about the deductibility of healthinsurance for the self-employed. While 35 per-cent of the self-employed would deduct health-insurance costs before figuring out their tithableincome, only 27 percent of the rest of the sam-ple would. However, the likelihood-ratio statis-tic for the incentive variables appearing in theML equations is insignificant.
Table 9 reveals that the potential for financialgain does not affect respondents’ tithing treat-ment of retirement savings. Participants wereasked two questions: (i) whether they wouldtithe contributions placed into an individual re-tirement account (IRA), and (ii) how theywould tithe subsequent withdrawals from theaccount. The combined responses in Table9 summarize how individuals would tithe con-
TABLE 6—HOUSING-CAPITAL-GAIN QUESTIONS BY POTENTIAL FINANCIAL INCENTIVE
Question and potential financialincentive
Raw percentages Chi-squaretesta
[p-value]
Covariate-adjustedpercentages
LR testb
[p-value]Yes No Not sure Yes No Not sure
4A, B) Now I want you to imagine that you own a home and are ready to retire. You sell the home and receive $50,000more for the home than you originally paid for it. Suppose that you use all of the money from the sale of your hometo buy a new home. Would you pay tithing on the $50,000 gain you received when you sold your home?
Owned but never sold a home 41.8 43.6 14.5 11.5 40.3 44.7 15.0 14.4Owned and sold a home 39.8 42.2 18.0 [0.022] 39.7 42.2 18.1 [0.006]Never owned a home 51.7 33.5 14.8 54.4 30.6 15.0
5A) Now consider another alternative. Suppose that you put all of the money from the sale of your home in the bank andrent a condominium. Under these circumstances, would you pay tithing on the $50,000 gain you received when yousold your home?
Owned but never sold a home 67.2 22.1 10.2 6.1 63.0 25.8 11.2 16.9Owned and sold a home 61.9 24.2 14.0 [0.190] 61.6 24.8 13.5 [0.002]Never owned a home 74.6 15.8 9.7 81.0 9.3 9.7
5B) Suppose that you are looking for an investment, so you buy a second house for $75,000 to rent out. Later you sellthis house for $100,000. So you sell the house for $25,000 more than you paid. Would you pay tithing on this gain?
Owned but never sold a home 83.1 9.2 7.6 9.0 79.2 11.2 9.6 3.4Owned and sold a home 75.9 13.0 11.1 [0.061] 75.5 13.6 10.9 [0.488]Never owned a home 73.0 18.9 8.2 81.5 12.5 6.0
a Chi-square test for independence of rows and columns.b Likelihood-ratio test for the incentive variables appearing in the multinomial logit equations.
714 THE AMERICAN ECONOMIC REVIEW SEPTEMBER 1999
tributions (principal) and earnings (interest) onthe IRA. The imputed responses exhibit no self-serving bias. For the covariate-adjusted percent-ages, almost identical fractions of respondentswith and without tax-deferred pension plans
would pay on the principal plus interest (52percent), the principal only (4 percent), the in-terest only (3 percent), or no part (3 percent).Interestingly, experience with an IRA or 401(k)does not affect the finding that around one-fifth
TABLE 7—STOCK-INVESTMENT QUESTIONS BY POTENTIAL FINANCIAL INCENTIVE
Question and potentialfinancial incentive
Raw percentages Chi-squaretesta
[p-value]
Covariate-adjustedpercentages
LR testb
[p-value]Yes No Not sure Yes No Not sure
6A) Imagine that to save for your child’s college education, you buy shares of a stock for $1,000, and later sell them for$1,500. So you sell the stock for $500 more than you paid. Would you pay tithing on this gain?
Invested in stocks 76.4 19.7 3.9 4.1 74.3 21.9 3.8 6.2Never invested in stocks 74.0 17.9 8.1 [0.132] 75.5 16.4 8.1 [0.045]
7A) Imagine again that you are investing to save for your child’s college education. You buy shares of a stock for$1,000, and later sell them for $800. So you sell the stock for $200 less than you paid. Would you subtract this lossfrom your income before paying tithing?
Invested in stocks 27.9 63.0 9.1 6.1 25.6 64.2 10.2 2.2Never invested in stocks 19.8 66.9 13.3 [0.047] 20.7 66.7 12.6 [0.337]
Question and potentialfinancial incentive
Raw percentages Chi-squaretesta
[p-value]
Covariate-adjustedpercentages
LR testb
[p-value]A B C Not sure A B C Not sure
6B) Imagine that to save for your child’s college education, you buy shares of two different stocks, for $1,000 each.Later you sell one stock for $1,500 and the other for $800. So you gain $500 on one stock and lose $200 on theother. Which of the following amounts would you pay tithing on?A—The $500 gain;B—The $500 gain minus the$200 loss, or in other words, the $300 combined gain;C—None of the gain.
Invested in stocks 24.9 56.9 7.2 11.0 9.3 25.9 52.8 8.4 12.9 2.9Never invested in stocks 23.6 47.7 8.6 20.2 [0.025] 23.4 49.8 8.2 18.6 [0.405]
a Chi-square test for independence of rows and columns.b Likelihood-ratio test for the incentive variables appearing in the multinomial logit equations.
TABLE 8—SELECTED MISCELLANEOUS DEDUCTION QUESTIONS BY POTENTIAL FINANCIAL INCENTIVE
Question and potentialfinancial incentive
Raw percentages Chi-squaretesta
[p-value]
Covariate-adjustedpercentages
LR testb
[p-value]Yes No Not sure Yes No Not sure
9B) Now imagine that you lose your job, and in the six months it takes you to find a new job, you receive unemploymentbenefits. Would you pay tithing on these benefits?
Been unemployed 72.2 20.1 7.7 6.5 71.8 19.7 7.5 6.8Never been unemployed 71.5 14.4 14.1 [0.039] 71.3 14.6 14.1 [0.033]
10A) Suppose you own your own business and have to pay for health insurance for you and your family. Would youdeduct the cost of this policy from the income of your business before paying tithing?
Owned own business 36.0 50.8 13.2 4.7 34.3 51.9 13.7 2.7Never owned own
business27.2 57.0 15.8 [0.095] 27.4 56.7 15.9 [0.255]
a Chi-square test for independence of rows and columns.b Likelihood-ratio test for the incentive variables appearing in the multinomial logit equations.
715VOL. 89 NO. 4 DAHL AND RANSOM: TITHING AND SELF-SERVING BELIEFS
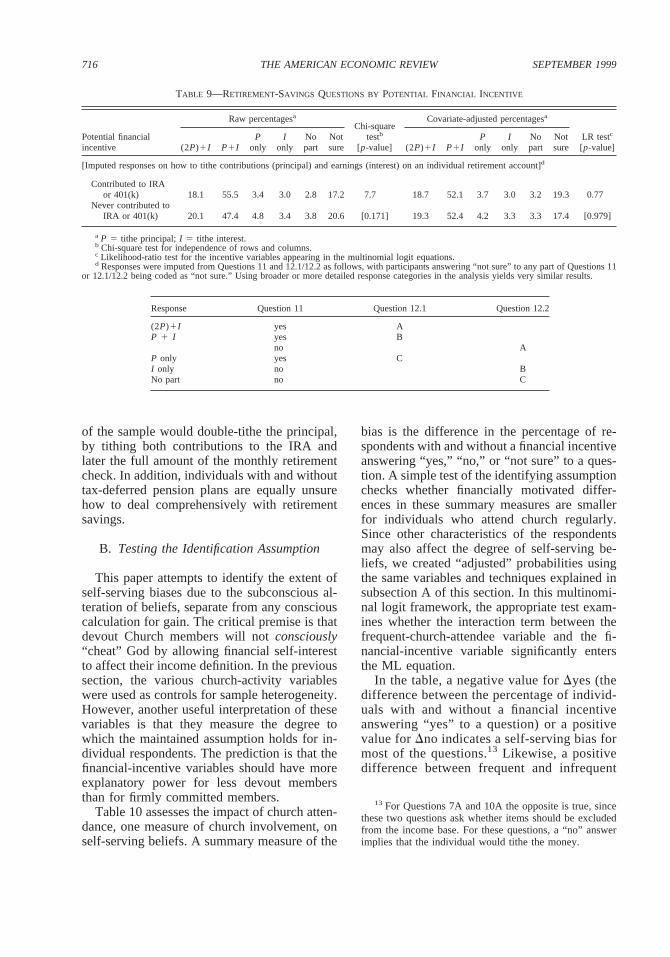
of the sample would double-tithe the principal,by tithing both contributions to the IRA andlater the full amount of the monthly retirementcheck. In addition, individuals with and withouttax-deferred pension plans are equally unsurehow to deal comprehensively with retirementsavings.
B. Testing the Identification Assumption
This paper attempts to identify the extent ofself-serving biases due to the subconscious al-teration of beliefs, separate from any consciouscalculation for gain. The critical premise is thatdevout Church members will notconsciously“cheat” God by allowing financial self-interestto affect their income definition. In the previoussection, the various church-activity variableswere used as controls for sample heterogeneity.However, another useful interpretation of thesevariables is that they measure the degree towhich the maintained assumption holds for in-dividual respondents. The prediction is that thefinancial-incentive variables should have moreexplanatory power for less devout membersthan for firmly committed members.
Table 10 assesses the impact of church atten-dance, one measure of church involvement, onself-serving beliefs. A summary measure of the
bias is the difference in the percentage of re-spondents with and without a financial incentiveanswering “yes,” “no,” or “not sure” to a ques-tion. A simple test of the identifying assumptionchecks whether financially motivated differ-ences in these summary measures are smallerfor individuals who attend church regularly.Since other characteristics of the respondentsmay also affect the degree of self-serving be-liefs, we created “adjusted” probabilities usingthe same variables and techniques explained insubsection A of this section. In this multinomi-nal logit framework, the appropriate test exam-ines whether the interaction term between thefrequent-church-attendee variable and the fi-nancial-incentive variable significantly entersthe ML equation.
In the table, a negative value forDyes (thedifference between the percentage of individ-uals with and without a financial incentiveanswering “yes” to a question) or a positivevalue forDno indicates a self-serving bias formost of the questions.13 Likewise, a positivedifference between frequent and infrequent
13 For Questions 7A and 10A the opposite is true, sincethese two questions ask whether items should be excludedfrom the income base. For these questions, a “no” answerimplies that the individual would tithe the money.
Response Question 11 Question 12.1 Question 12.2
(2P)1I yes AP 1 I yes B
no AP only yes CI only no BNo part no C
TABLE 9—RETIREMENT-SAVINGS QUESTIONS BY POTENTIAL FINANCIAL INCENTIVE
Potential financialincentive
Raw percentagesa
Chi-squaretestb
[p-value]
Covariate-adjusted percentagesa
LR testc
[p-value](2P)1I P1IP
onlyI
onlyNopart
Notsure (2P)1I P1I
Ponly
Ionly
Nopart
Notsure
[Imputed responses on how to tithe contributions (principal) and earnings (interest) on an individual retirement account]d
Contributed to IRAor 401(k) 18.1 55.5 3.4 3.0 2.8 17.2 7.7 18.7 52.1 3.7 3.0 3.2 19.3 0.77
Never contributed toIRA or 401(k) 20.1 47.4 4.8 3.4 3.8 20.6 [0.171] 19.3 52.4 4.2 3.3 3.3 17.4 [0.979]
a P 5 tithe principal;I 5 tithe interest.b Chi-square test for independence of rows and columns.c Likelihood-ratio test for the incentive variables appearing in the multinomial logit equations.d Responses were imputed from Questions 11 and 12.1/12.2 as follows, with participants answering “not sure” to any part of Questions 11
or 12.1/12.2 being coded as “not sure.” Using broader or more detailed response categories in the analysis yields very similar results.
716 THE AMERICAN ECONOMIC REVIEW SEPTEMBER 1999
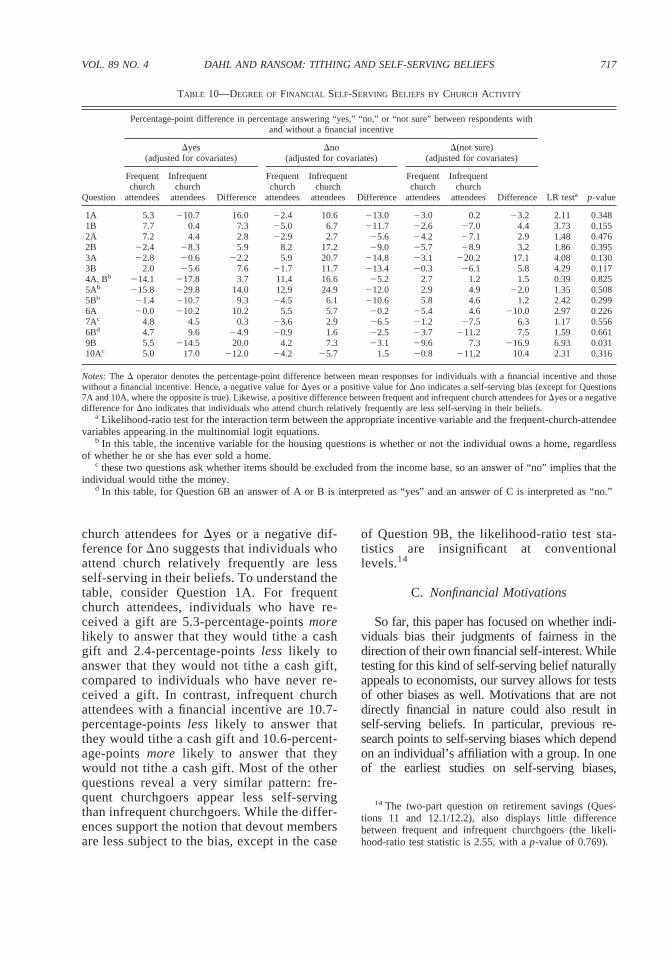
church attendees forDyes or a negative dif-ference forDno suggests that individuals whoattend church relatively frequently are lessself-serving in their beliefs. To understand thetable, consider Question 1A. For frequentchurch attendees, individuals who have re-ceived a gift are 5.3-percentage-pointsmorelikely to answer that they would tithe a cashgift and 2.4-percentage-pointsless likely toanswer that they would not tithe a cash gift,compared to individuals who have never re-ceived a gift. In contrast, infrequent churchattendees with a financial incentive are 10.7-percentage-pointsless likely to answer thatthey would tithe a cash gift and 10.6-percent-age-pointsmore likely to answer that theywould not tithe a cash gift. Most of the otherquestions reveal a very similar pattern: fre-quent churchgoers appear less self-servingthan infrequent churchgoers. While the differ-ences support the notion that devout membersare less subject to the bias, except in the case
of Question 9B, the likelihood-ratio test sta-tistics are insignificant at conventionallevels.14
C. Nonfinancial Motivations
So far, this paper has focused on whether indi-viduals bias their judgments of fairness in thedirection of their own financial self-interest. Whiletesting for this kind of self-serving belief naturallyappeals to economists, our survey allows for testsof other biases as well. Motivations that are notdirectly financial in nature could also result inself-serving beliefs. In particular, previous re-search points to self-serving biases which dependon an individual’s affiliation with a group. In oneof the earliest studies on self-serving biases,
14 The two-part question on retirement savings (Ques-tions 11 and 12.1/12.2), also displays little differencebetween frequent and infrequent churchgoers (the likeli-hood-ratio test statistic is 2.55, with ap-value of 0.769).
TABLE 10—DEGREE OFFINANCIAL SELF-SERVING BELIEFS BY CHURCH ACTIVITY
Question
Percentage-point difference in percentage answering “yes,” “no,” or “not sure” between respondents withand without a financial incentive
LR testa p-value
Dyes(adjusted for covariates)
Dno(adjusted for covariates)
D(not sure)(adjusted for covariates)
Frequentchurch
attendees
Infrequentchurch
attendees Difference
Frequentchurch
attendees
Infrequentchurch
attendees Difference
Frequentchurch
attendees
Infrequentchurch
attendees Difference
1A 5.3 210.7 16.0 22.4 10.6 213.0 23.0 0.2 23.2 2.11 0.3481B 7.7 0.4 7.3 25.0 6.7 211.7 22.6 27.0 4.4 3.73 0.1552A 7.2 4.4 2.8 22.9 2.7 25.6 24.2 27.1 2.9 1.48 0.4762B 22.4 28.3 5.9 8.2 17.2 29.0 25.7 28.9 3.2 1.86 0.3953A 22.8 20.6 22.2 5.9 20.7 214.8 23.1 220.2 17.1 4.08 0.1303B 2.0 25.6 7.6 21.7 11.7 213.4 20.3 26.1 5.8 4.29 0.1174A, Bb 214.1 217.8 3.7 11.4 16.6 25.2 2.7 1.2 1.5 0.39 0.8255Ab 215.8 229.8 14.0 12.9 24.9 212.0 2.9 4.9 22.0 1.35 0.5085Bb 21.4 210.7 9.3 24.5 6.1 210.6 5.8 4.6 1.2 2.42 0.2996A 20.0 210.2 10.2 5.5 5.7 20.2 25.4 4.6 210.0 2.97 0.2267Ac 4.8 4.5 0.3 23.6 2.9 26.5 21.2 27.5 6.3 1.17 0.5566Bd 4.7 9.6 24.9 20.9 1.6 22.5 23.7 211.2 7.5 1.59 0.6619B 5.5 214.5 20.0 4.2 7.3 23.1 29.6 7.3 216.9 6.93 0.03110Ac 5.0 17.0 212.0 24.2 25.7 1.5 20.8 211.2 10.4 2.31 0.316
Notes:The D operator denotes the percentage-point difference between mean responses for individuals with a financial incentive and thosewithout a financial incentive. Hence, a negative value forDyes or a positive value forDno indicates a self-serving bias (except for Questions7A and 10A, where the opposite is true). Likewise, a positive difference between frequent and infrequent church attendees forDyes or a negativedifference forDno indicates that individuals who attend church relatively frequently are less self-serving in their beliefs.
a Likelihood-ratio test for the interaction term between the appropriate incentive variable and the frequent-church-attendeevariables appearing in the multinomial logit equations.
b In this table, the incentive variable for the housing questions is whether or not the individual owns a home, regardlessof whether he or she has ever sold a home.
c these two questions ask whether items should be excluded from the income base, so an answer of “no” implies that theindividual would tithe the money.
d In this table, for Question 6B an answer of A or B is interpreted as “yes” and an answer of C is interpreted as “no.”
717VOL. 89 NO. 4 DAHL AND RANSOM: TITHING AND SELF-SERVING BELIEFS
Albert Hastorf and Hadley Cantril (1954) foundthat perceptions of potential penalities in a footballgame between Princeton and Dartmouth de-pended on the team allegiance of the spectator.More recently, David Moore (1997) found thatDemocrats and Republicans have very differentviews about the ethical standards of Bill Clintonversus Newt Gingrich.15
Perhaps the most obvious nonfinancial moti-vation in our survey is how much an individualcares about the Church. Presumably those moreinvolved with the LDS Church maximize utilityby thinking about the income base morebroadly, since they place more weight on over-all financial well-being of the Church. Peoplewho care less about the LDS Church may con-vince themselves that fewer things should betithed because that maximizes their utility. Asimple test for self-serving bias would examinewhether reported beliefs are tilted to line upwith an individual’s utility maximization, thatis, whether the tithable income base is posi-tively correlated with church-activity measures.
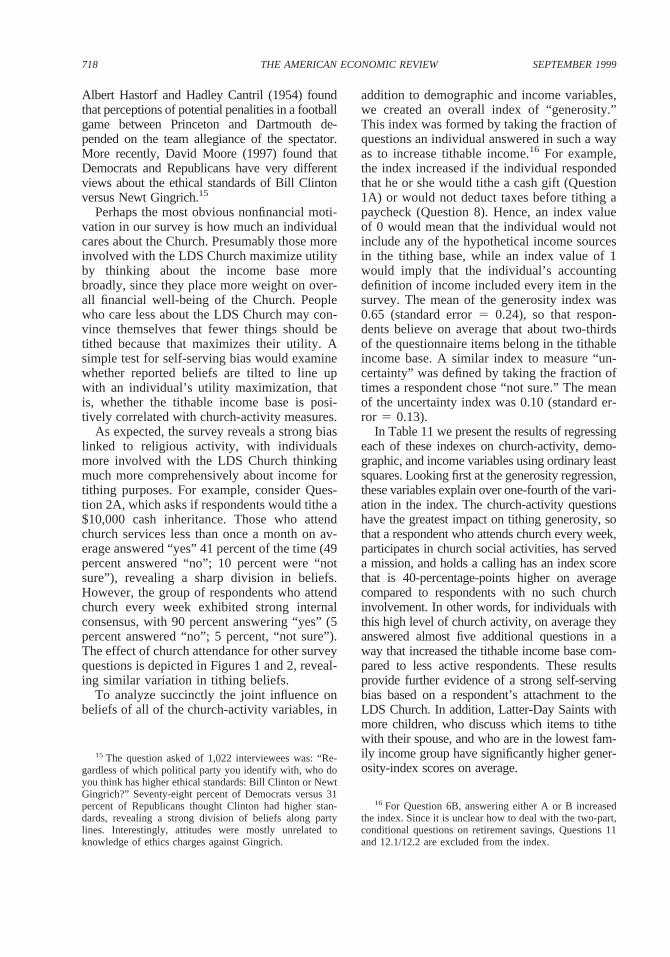
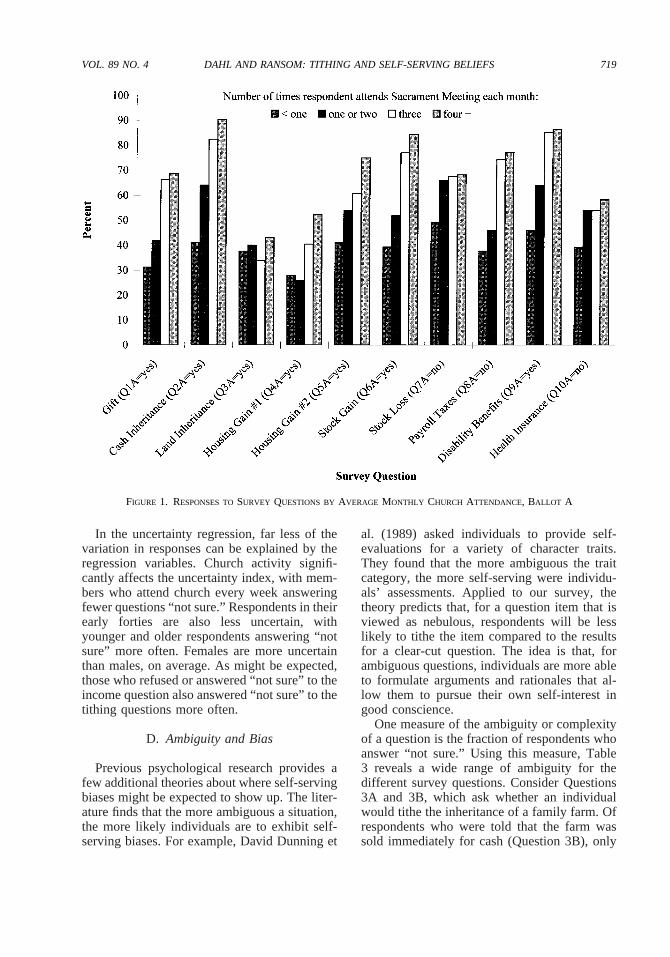
As expected, the survey reveals a strong biaslinked to religious activity, with individualsmore involved with the LDS Church thinkingmuch more comprehensively about income fortithing purposes. For example, consider Ques-tion 2A, which asks if respondents would tithe a$10,000 cash inheritance. Those who attendchurch services less than once a month on av-erage answered “yes” 41 percent of the time (49percent answered “no”; 10 percent were “notsure”), revealing a sharp division in beliefs.However, the group of respondents who attendchurch every week exhibited strong internalconsensus, with 90 percent answering “yes” (5percent answered “no”; 5 percent, “not sure”).The effect of church attendance for other surveyquestions is depicted in Figures 1 and 2, reveal-ing similar variation in tithing beliefs.
To analyze succinctly the joint influence onbeliefs of all of the church-activity variables, in
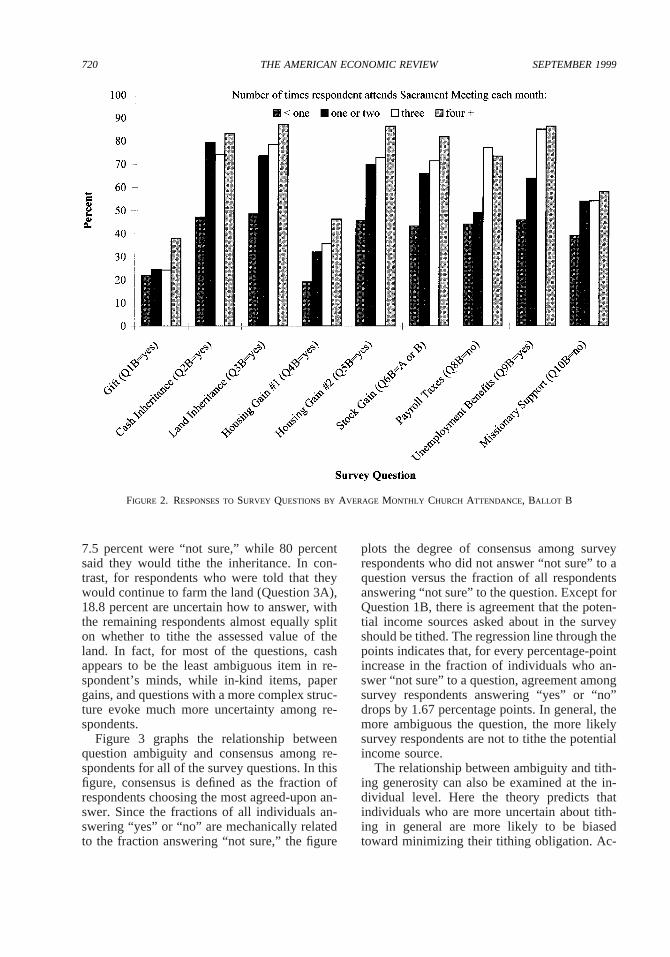
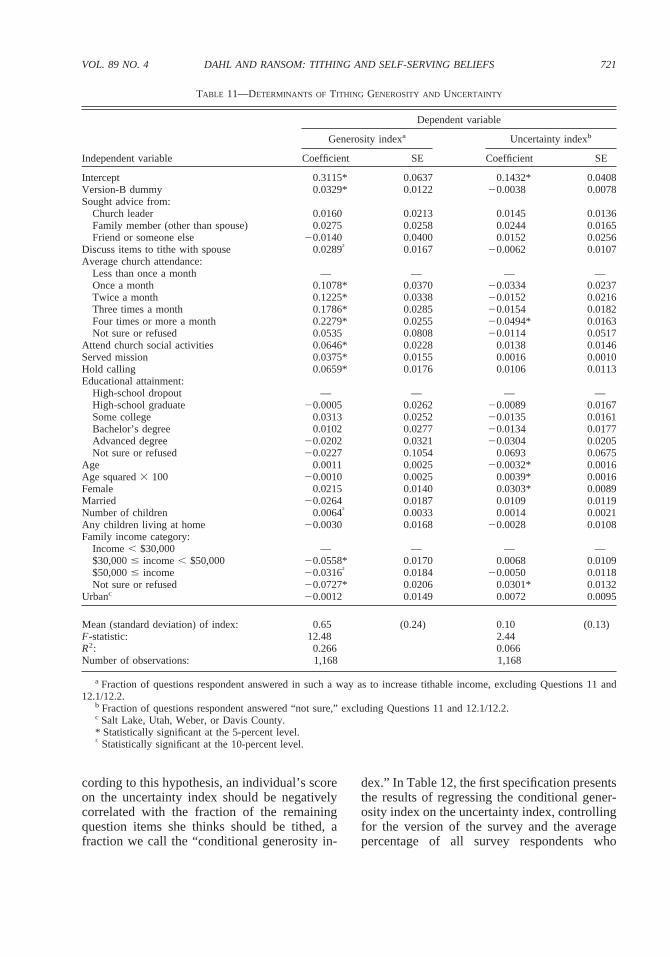
addition to demographic and income variables,we created an overall index of “generosity.”This index was formed by taking the fraction ofquestions an individual answered in such a wayas to increase tithable income.16 For example,the index increased if the individual respondedthat he or she would tithe a cash gift (Question1A) or would not deduct taxes before tithing apaycheck (Question 8). Hence, an index valueof 0 would mean that the individual would notinclude any of the hypothetical income sourcesin the tithing base, while an index value of 1would imply that the individual’s accountingdefinition of income included every item in thesurvey. The mean of the generosity index was0.65 (standard error5 0.24), so that respon-dents believe on average that about two-thirdsof the questionnaire items belong in the tithableincome base. A similar index to measure “un-certainty” was defined by taking the fraction oftimes a respondent chose “not sure.” The meanof the uncertainty index was 0.10 (standard er-ror 5 0.13).
In Table 11 we present the results of regressingeach of these indexes on church-activity, demo-graphic, and income variables using ordinary leastsquares. Looking first at the generosity regression,these variables explain over one-fourth of the vari-ation in the index. The church-activity questionshave the greatest impact on tithing generosity, sothat a respondent who attends church every week,participates in church social activities, has serveda mission, and holds a calling has an index scorethat is 40-percentage-points higher on averagecompared to respondents with no such churchinvolvement. In other words, for individuals withthis high level of church activity, on average theyanswered almost five additional questions in away that increased the tithable income base com-pared to less active respondents. These resultsprovide further evidence of a strong self-servingbias based on a respondent’s attachment to theLDS Church. In addition, Latter-Day Saints withmore children, who discuss which items to tithewith their spouse, and who are in the lowest fam-ily income group have significantly higher gener-osity-index scores on average.
15 The question asked of 1,022 interviewees was: “Re-gardless of which political party you identify with, who doyou think has higher ethical standards: Bill Clinton or NewtGingrich?” Seventy-eight percent of Democrats versus 31percent of Republicans thought Clinton had higher stan-dards, revealing a strong division of beliefs along partylines. Interestingly, attitudes were mostly unrelated toknowledge of ethics charges against Gingrich.
16 For Question 6B, answering either A or B increasedthe index. Since it is unclear how to deal with the two-part,conditional questions on retirement savings, Questions 11and 12.1/12.2 are excluded from the index.
718 THE AMERICAN ECONOMIC REVIEW SEPTEMBER 1999
In the uncertainty regression, far less of thevariation in responses can be explained by theregression variables. Church activity signifi-cantly affects the uncertainty index, with mem-bers who attend church every week answeringfewer questions “not sure.” Respondents in theirearly forties are also less uncertain, withyounger and older respondents answering “notsure” more often. Females are more uncertainthan males, on average. As might be expected,those who refused or answered “not sure” to theincome question also answered “not sure” to thetithing questions more often.
D. Ambiguity and Bias
Previous psychological research provides afew additional theories about where self-servingbiases might be expected to show up. The liter-ature finds that the more ambiguous a situation,the more likely individuals are to exhibit self-serving biases. For example, David Dunning et
al. (1989) asked individuals to provide self-evaluations for a variety of character traits.They found that the more ambiguous the traitcategory, the more self-serving were individu-als’ assessments. Applied to our survey, thetheory predicts that, for a question item that isviewed as nebulous, respondents will be lesslikely to tithe the item compared to the resultsfor a clear-cut question. The idea is that, forambiguous questions, individuals are more ableto formulate arguments and rationales that al-low them to pursue their own self-interest ingood conscience.
One measure of the ambiguity or complexityof a question is the fraction of respondents whoanswer “not sure.” Using this measure, Table3 reveals a wide range of ambiguity for thedifferent survey questions. Consider Questions3A and 3B, which ask whether an individualwould tithe the inheritance of a family farm. Ofrespondents who were told that the farm wassold immediately for cash (Question 3B), only
FIGURE 1. RESPONSES TOSURVEY QUESTIONS BY AVERAGE MONTHLY CHURCH ATTENDANCE, BALLOT A
719VOL. 89 NO. 4 DAHL AND RANSOM: TITHING AND SELF-SERVING BELIEFS
7.5 percent were “not sure,” while 80 percentsaid they would tithe the inheritance. In con-trast, for respondents who were told that theywould continue to farm the land (Question 3A),18.8 percent are uncertain how to answer, withthe remaining respondents almost equally spliton whether to tithe the assessed value of theland. In fact, for most of the questions, cashappears to be the least ambiguous item in re-spondent’s minds, while in-kind items, papergains, and questions with a more complex struc-ture evoke much more uncertainty among re-spondents.
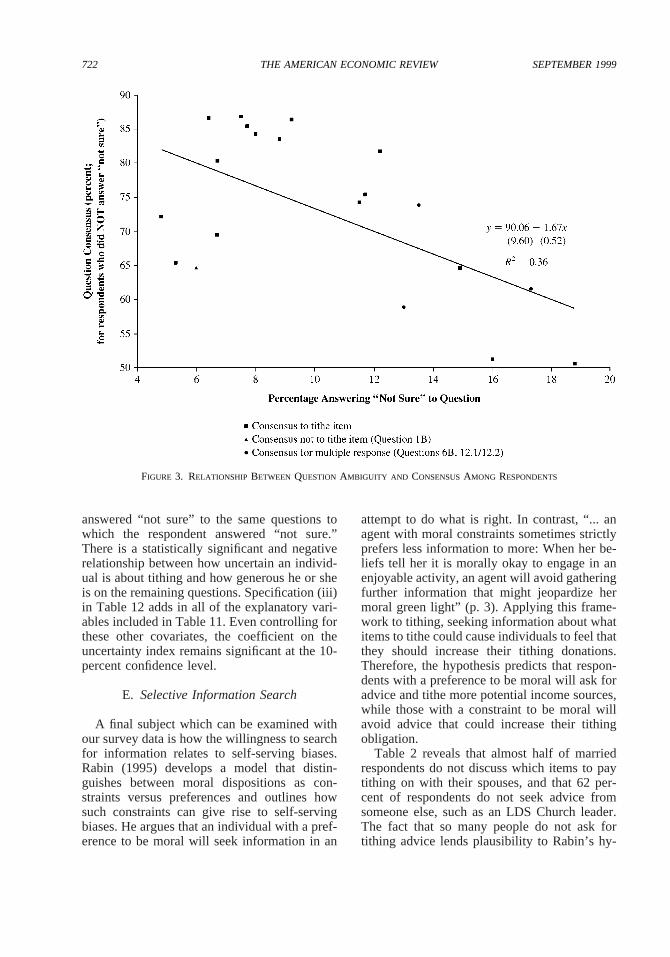
Figure 3 graphs the relationship betweenquestion ambiguity and consensus among re-spondents for all of the survey questions. In thisfigure, consensus is defined as the fraction ofrespondents choosing the most agreed-upon an-swer. Since the fractions of all individuals an-swering “yes” or “no” are mechanically relatedto the fraction answering “not sure,” the figure
plots the degree of consensus among surveyrespondents who did not answer “not sure” to aquestion versus the fraction of all respondentsanswering “not sure” to the question. Except forQuestion 1B, there is agreement that the poten-tial income sources asked about in the surveyshould be tithed. The regression line through thepoints indicates that, for every percentage-pointincrease in the fraction of individuals who an-swer “not sure” to a question, agreement amongsurvey respondents answering “yes” or “no”drops by 1.67 percentage points. In general, themore ambiguous the question, the more likelysurvey respondents are not to tithe the potentialincome source.
The relationship between ambiguity and tith-ing generosity can also be examined at the in-dividual level. Here the theory predicts thatindividuals who are more uncertain about tith-ing in general are more likely to be biasedtoward minimizing their tithing obligation. Ac-
FIGURE 2. RESPONSES TOSURVEY QUESTIONS BY AVERAGE MONTHLY CHURCH ATTENDANCE, BALLOT B
720 THE AMERICAN ECONOMIC REVIEW SEPTEMBER 1999
cording to this hypothesis, an individual’s scoreon the uncertainty index should be negativelycorrelated with the fraction of the remainingquestion items she thinks should be tithed, afraction we call the “conditional generosity in-
dex.” In Table 12, the first specification presentsthe results of regressing the conditional gener-osity index on the uncertainty index, controllingfor the version of the survey and the averagepercentage of all survey respondents who
TABLE 11—DETERMINANTS OF TITHING GENEROSITY AND UNCERTAINTY
Independent variable
Dependent variable
Generosity indexa Uncertainty indexb
Coefficient SE Coefficient SE
Intercept 0.3115* 0.0637 0.1432* 0.0408Version-B dummy 0.0329* 0.0122 20.0038 0.0078Sought advice from:
Church leader 0.0160 0.0213 0.0145 0.0136Family member (other than spouse) 0.0275 0.0258 0.0244 0.0165Friend or someone else 20.0140 0.0400 0.0152 0.0256
Discuss items to tithe with spouse 0.0289† 0.0167 20.0062 0.0107Average church attendance:
Less than once a month — — — —Once a month 0.1078* 0.0370 20.0334 0.0237Twice a month 0.1225* 0.0338 20.0152 0.0216Three times a month 0.1786* 0.0285 20.0154 0.0182Four times or more a month 0.2279* 0.0255 20.0494* 0.0163Not sure or refused 0.0535 0.0808 20.0114 0.0517
Attend church social activities 0.0646* 0.0228 0.0138 0.0146Served mission 0.0375* 0.0155 0.0016 0.0010Hold calling 0.0659* 0.0176 0.0106 0.0113Educational attainment:
High-school dropout — — — —High-school graduate 20.0005 0.0262 20.0089 0.0167Some college 0.0313 0.0252 20.0135 0.0161Bachelor’s degree 0.0102 0.0277 20.0134 0.0177Advanced degree 20.0202 0.0321 20.0304 0.0205Not sure or refused 20.0227 0.1054 0.0693 0.0675
Age 0.0011 0.0025 20.0032* 0.0016Age squared3 100 20.0010 0.0025 0.0039* 0.0016Female 0.0215 0.0140 0.0303* 0.0089Married 20.0264 0.0187 0.0109 0.0119Number of children 0.0064† 0.0033 0.0014 0.0021Any children living at home 20.0030 0.0168 20.0028 0.0108Family income category:
Income, $30,000 — — — —$30,000# income, $50,000 20.0558* 0.0170 0.0068 0.0109$50,000# income 20.0316† 0.0184 20.0050 0.0118Not sure or refused 20.0727* 0.0206 0.0301* 0.0132
Urbanc 20.0012 0.0149 0.0072 0.0095
Mean (standard deviation) of index: 0.65 (0.24) 0.10 (0.13)F-statistic: 12.48 2.44R2: 0.266 0.066Number of observations: 1,168 1,168
a Fraction of questions respondent answered in such a way as to increase tithable income, excluding Questions 11 and12.1/12.2.
b Fraction of questions respondent answered “not sure,” excluding Questions 11 and 12.1/12.2.c Salt Lake, Utah, Weber, or Davis County.* Statistically significant at the 5-percent level.† Statistically significant at the 10-percent level.
721VOL. 89 NO. 4 DAHL AND RANSOM: TITHING AND SELF-SERVING BELIEFS
answered “not sure” to the same questions towhich the respondent answered “not sure.”There is a statistically significant and negativerelationship between how uncertain an individ-ual is about tithing and how generous he or sheis on the remaining questions. Specification (iii)in Table 12 adds in all of the explanatory vari-ables included in Table 11. Even controlling forthese other covariates, the coefficient on theuncertainty index remains significant at the 10-percent confidence level.
E. Selective Information Search
A final subject which can be examined withour survey data is how the willingness to searchfor information relates to self-serving biases.Rabin (1995) develops a model that distin-guishes between moral dispositions as con-straints versus preferences and outlines howsuch constraints can give rise to self-servingbiases. He argues that an individual with a pref-erence to be moral will seek information in an
attempt to do what is right. In contrast, “... anagent with moral constraints sometimes strictlyprefers less information to more: When her be-liefs tell her it is morally okay to engage in anenjoyable activity, an agent will avoid gatheringfurther information that might jeopardize hermoral green light” (p. 3). Applying this frame-work to tithing, seeking information about whatitems to tithe could cause individuals to feel thatthey should increase their tithing donations.Therefore, the hypothesis predicts that respon-dents with a preference to be moral will ask foradvice and tithe more potential income sources,while those with a constraint to be moral willavoid advice that could increase their tithingobligation.
Table 2 reveals that almost half of marriedrespondents do not discuss which items to paytithing on with their spouses, and that 62 per-cent of respondents do not seek advice fromsomeone else, such as an LDS Church leader.The fact that so many people do not ask fortithing advice lends plausibility to Rabin’s hy-
FIGURE 3. RELATIONSHIP BETWEEN QUESTION AMBIGUITY AND CONSENSUSAMONG RESPONDENTS
722 THE AMERICAN ECONOMIC REVIEW SEPTEMBER 1999
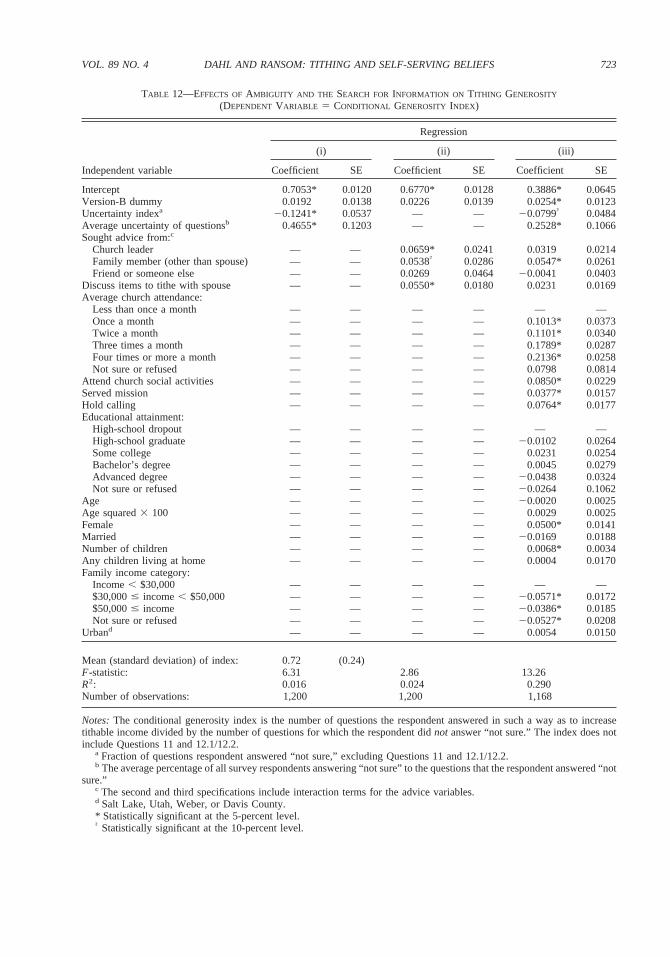
TABLE 12—EFFECTS OFAMBIGUITY AND THE SEARCH FOR INFORMATION ON TITHING GENEROSITY
(DEPENDENT VARIABLE 5 CONDITIONAL GENEROSITY INDEX)
Independent variable
Regression
(i) (ii) (iii)
Coefficient SE Coefficient SE Coefficient SE
Intercept 0.7053* 0.0120 0.6770* 0.0128 0.3886* 0.0645Version-B dummy 0.0192 0.0138 0.0226 0.0139 0.0254* 0.0123Uncertainty indexa 20.1241* 0.0537 — — 20.0799† 0.0484Average uncertainty of questionsb 0.4655* 0.1203 — — 0.2528* 0.1066Sought advice from:c
Church leader — — 0.0659* 0.0241 0.0319 0.0214Family member (other than spouse) — — 0.0538† 0.0286 0.0547* 0.0261Friend or someone else — — 0.0269 0.0464 20.0041 0.0403
Discuss items to tithe with spouse — — 0.0550* 0.0180 0.0231 0.0169Average church attendance:
Less than once a month — — — — — —Once a month — — — — 0.1013* 0.0373Twice a month — — — — 0.1101* 0.0340Three times a month — — — — 0.1789* 0.0287Four times or more a month — — — — 0.2136* 0.0258Not sure or refused — — — — 0.0798 0.0814
Attend church social activities — — — — 0.0850* 0.0229Served mission — — — — 0.0377* 0.0157Hold calling — — — — 0.0764* 0.0177Educational attainment:
High-school dropout — — — — — —High-school graduate — — — — 20.0102 0.0264Some college — — — — 0.0231 0.0254Bachelor’s degree — — — — 0.0045 0.0279Advanced degree — — — — 20.0438 0.0324Not sure or refused — — — — 20.0264 0.1062
Age — — — — 20.0020 0.0025Age squared3 100 — — — — 0.0029 0.0025Female — — — — 0.0500* 0.0141Married — — — — 20.0169 0.0188Number of children — — — — 0.0068* 0.0034Any children living at home — — — — 0.0004 0.0170Family income category:
Income, $30,000 — — — — — —$30,000# income, $50,000 — — — — 20.0571* 0.0172$50,000# income — — — — 20.0386* 0.0185Not sure or refused — — — — 20.0527* 0.0208
Urband — — — — 0.0054 0.0150
Mean (standard deviation) of index: 0.72 (0.24)F-statistic: 6.31 2.86 13.26R2: 0.016 0.024 0.290Number of observations: 1,200 1,200 1,168
Notes:The conditional generosity index is the number of questions the respondent answered in such a way as to increasetithable income divided by the number of questions for which the respondent didnot answer “not sure.” The index does notinclude Questions 11 and 12.1/12.2.
a Fraction of questions respondent answered “not sure,” excluding Questions 11 and 12.1/12.2.b The average percentage of all survey respondents answering “not sure” to the questions that the respondent answered “not
sure.”c The second and third specifications include interaction terms for the advice variables.d Salt Lake, Utah, Weber, or Davis County.* Statistically significant at the 5-percent level.† Statistically significant at the 10-percent level.
723VOL. 89 NO. 4 DAHL AND RANSOM: TITHING AND SELF-SERVING BELIEFS
pothesis. Assuming that the costs of gatheringinformation are not prohibitive, the main com-peting explanation for why some people remainunsure about which items should be tithed isthat theywantto be uncertain about what shouldbe tithed. For example, there are few alternativeexplanations for why people who have soldtheir homes remain uncertain about the tithabil-ity of those gains (see Table 6).
We test Rabin’s hypothesis more formally inTable 12. In specification (ii) of Table 12, weregress the conditional generosity index on thevarious advice variables. As Rabin’s theory pre-dicts, individuals who seek advice from Churchleaders, friends, spouses, or other family mem-bers are more generous in their tithing donationson average. While theR2 value for this regres-sion is small, the coefficients on three of thefour advice variables are statistically significant.In specification (iii) of the table, which addscontrols for individual characteristics, only thefamily-member-advice variable remains signif-icant, while the other coefficients fall by morethan 50 percent. In Table 11, where the depen-dent variable is the generosity index as opposedto the conditional generosity index, only thespouse-advice variable is significant.
What explains the differences among thesethree specifications? First, Table 11 reveals thatindividuals who seek advice are more likely tobe uncertain. The generosity index confoundsthis correlation, while the conditional generos-ity index does not.17 Secondly, individuals whoseek advice appear to be those individuals whoare more involved in the LDS Church. Forexample, seeking advice from a Church leaderis strongly positively correlated with whether ornot an individual attends church three times ormore each month (r 5 0.18,p-value5 0.001).One interpretation is that members who areregular churchgoers have a preference, and nota constraint, to be moral, so that they are pre-cisely the respondents who are more likely toask for advice. Viewed in this light, adding
church-activity measures into the regressionpartially controls for individuals who have apreference to be moral.
IV. Conclusion
Does where you stand depend on where yousit? The results from our survey are mixed. Incontrast to previous studies on self-serving bi-ases in other domains, our survey reveals thattithable income definitions are not strongly mo-tivated by the potential for financial gain. Wefind surprisingly little evidence that an individ-ual’s financial position influences tithing be-liefs. Individuals’ experience with gifts andinheritances, the stock market, unemployment,tax-deferred pension plans, and self-employ-ment all have little effect on how individualswould tithe (respectively) gifts and inheritances,stock gains and losses, unemployment benefits,retirement-plan contributions and withdrawals,and health-insurance expenditures for the self-employed. Only in the tithing treatment of cap-ital gains from a home do we find solid evidenceof self-interested tithing behavior.
However, we observe large self-serving bi-ases based on religious motivations, so that in-dividuals with a strong attachment to the LDSChurch have a very different view of whatcounts as income for tithing purposes. Respon-dents who have served a mission, participate inchurch social events, hold a volunteer calling,and attend church regularly define the incomebase to include almost twice as many incomeitems on average compared to less involvedmembers. As previous research predicts, self-serving biases show up more for questionswhich respondents view as ambiguous, and in-dividuals who display more uncertainty in an-swering the questions are biased towardminimizing the tithable income base. Finally,our survey lends support to Rabin’s (1995) hy-pothesis that individuals who are constrained tobe moral avoid seeking advice about tithing thatmight cause them to feel they should increasetheir tithing donations.
Our research on tithing practices does notimply that individuals will not protect their self-interest by professing to hold beliefs that benefitthem. Rather, our research focuses on how self-interest influences beliefs at the subconsciouslevel. We find that, when thinking about the
17 In general, the estimated coefficient from any covari-ate that is correlated with the uncertainty index suffers fromomitted-variable bias in Table 11. For example, using thegenerosity index masks the fact that females are moregenerous than males when controlling for the fact thatfemales are also more uncertain (compare Tables 11 and12).
724 THE AMERICAN ECONOMIC REVIEW SEPTEMBER 1999
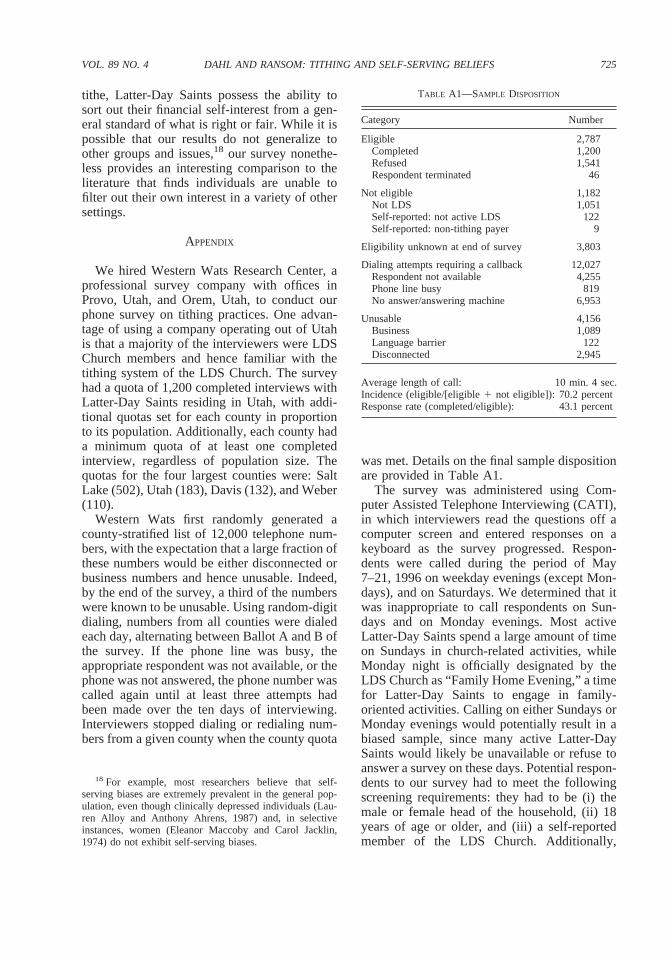
tithe, Latter-Day Saints possess the ability tosort out their financial self-interest from a gen-eral standard of what is right or fair. While it ispossible that our results do not generalize toother groups and issues,18 our survey nonethe-less provides an interesting comparison to theliterature that finds individuals are unable tofilter out their own interest in a variety of othersettings.
APPENDIX
We hired Western Wats Research Center, aprofessional survey company with offices inProvo, Utah, and Orem, Utah, to conduct ourphone survey on tithing practices. One advan-tage of using a company operating out of Utahis that a majority of the interviewers were LDSChurch members and hence familiar with thetithing system of the LDS Church. The surveyhad a quota of 1,200 completed interviews withLatter-Day Saints residing in Utah, with addi-tional quotas set for each county in proportionto its population. Additionally, each county hada minimum quota of at least one completedinterview, regardless of population size. Thequotas for the four largest counties were: SaltLake (502), Utah (183), Davis (132), and Weber(110).
Western Wats first randomly generated acounty-stratified list of 12,000 telephone num-bers, with the expectation that a large fraction ofthese numbers would be either disconnected orbusiness numbers and hence unusable. Indeed,by the end of the survey, a third of the numberswere known to be unusable. Using random-digitdialing, numbers from all counties were dialedeach day, alternating between Ballot A and B ofthe survey. If the phone line was busy, theappropriate respondent was not available, or thephone was not answered, the phone number wascalled again until at least three attempts hadbeen made over the ten days of interviewing.Interviewers stopped dialing or redialing num-bers from a given county when the county quota
was met. Details on the final sample dispositionare provided in Table A1.
The survey was administered using Com-puter Assisted Telephone Interviewing (CATI),in which interviewers read the questions off acomputer screen and entered responses on akeyboard as the survey progressed. Respon-dents were called during the period of May7–21, 1996 on weekday evenings (except Mon-days), and on Saturdays. We determined that itwas inappropriate to call respondents on Sun-days and on Monday evenings. Most activeLatter-Day Saints spend a large amount of timeon Sundays in church-related activities, whileMonday night is officially designated by theLDS Church as “Family Home Evening,” a timefor Latter-Day Saints to engage in family-oriented activities. Calling on either Sundays orMonday evenings would potentially result in abiased sample, since many active Latter-DaySaints would likely be unavailable or refuse toanswer a survey on these days. Potential respon-dents to our survey had to meet the followingscreening requirements: they had to be (i) themale or female head of the household, (ii) 18years of age or older, and (iii) a self-reportedmember of the LDS Church. Additionally,
18 For example, most researchers believe that self-serving biases are extremely prevalent in the general pop-ulation, even though clinically depressed individuals (Lau-ren Alloy and Anthony Ahrens, 1987) and, in selectiveinstances, women (Eleanor Maccoby and Carol Jacklin,1974) do not exhibit self-serving biases.
TABLE A1—SAMPLE DISPOSITION
Category Number
Eligible 2,787Completed 1,200Refused 1,541Respondent terminated 46
Not eligible 1,182Not LDS 1,051Self-reported: not active LDS 122Self-reported: non-tithing payer 9
Eligibility unknown at end of survey 3,803
Dialing attempts requiring a callback 12,027Respondent not available 4,255Phone line busy 819No answer/answering machine 6,953
Unusable 4,156Business 1,089Language barrier 122Disconnected 2,945
Average length of call: 10 min. 4 sec.Incidence (eligible/[eligible1 not eligible]): 70.2 percentResponse rate (completed/eligible): 43.1 percent
725VOL. 89 NO. 4 DAHL AND RANSOM: TITHING AND SELF-SERVING BELIEFS
during the initial screening of candidates, anypotential respondent who volunteered that he orshe was not an active member of the LDSChurch or did not tithe was not interviewed.
To ensure consistent and accurate interview-ing, we supplemented the general training ofinterviewers provided by Western Wats withinstructions specific to our survey. We devel-oped two documents for the survey company: ashort interviewer instruction manual and aprimer on concept definitions. The interviewerinstructions provided specific responses to com-mon questions respondents might have aboutthe survey, alerted interviewers to the fact thattithing can be a sensitive issue for some, anddiscussed questions requiring special attention.The concept-definitions manual provided moredetailed definitions for the variables embeddedin our survey questions. Most of the demo-graphic questions asked in our survey weremodeled after the Current Population Survey(CPS); for example, the education categoriesmatch current CPS definitions. Indeed, many ofthe demographic questions were copied verba-tim from the CPS, as were many of the writteninstructions provided to interviewers. These twotraining documents are available from the au-thors upon request.
To monitor and assist the training of inter-viewers, Ransom attended the two training ses-sions provided to interviewers on the first twonights of calling and remained to observe actualcalls. Dahl monitored survey calls via a three-way phone line on three of the other interview-ing evenings. In the months preceding thesurvey administration, the authors and five vol-unteers pretested early and final versions of thesurvey instrument on a total of 40 randomlyselected Utah residents. Additional pretesting ofthe final version was performed by the WesternWats Research Center.
REFERENCES
Alloy, Lauren and Ahrens, Anthony. “Depressionand Pessimism for the Future—Biased Use ofStatistically Relevant Information and Pre-dictions for Self versus Others.”Journal ofPersonality and Social Psychology, February1987,52(2), pp. 366–78.
Babcock, Linda C. and Loewenstein, George.“Ex-plaining Bargaining Impasse: The Role of Self-
Serving Biases.” Journal of EconomicPerspectives, Winter 1997,11(1), pp. 109–26.
Bradley, Martin B.; Green, Norman M., Jr.;Jones, Dale E.; Lynn, Mac and McNeil, Lou.Churches and church membership in theUnited States, 1990: An enumeration by re-gion, state, and county based on data re-ported for 133 church groupings. Atlanta,GA: Glenmary Research Center, 1992.
Dahl, Gordon B. and Ransom, Michael R.“TheTen Percent Flat Tax: Tithing and the Defi-nition of Income.” Center for Economic Pol-icy Studies Working Paper No. 44, PrincetonUniversity, 1997.
Doctrine and Covenants of the Church of JesusChrist of Latter-Day Saints. Salt Lake City,UT: The Church of Jesus Christ of Latter-Day Saints, 1981 [Sec. 119 originally pub-lished in 1838].
Dunning, David; Meyerowitz, Judith A. and Hol-zberg, Amy D. “Ambiguity and Self-Evalua-tion: The Role of Idiosyncratic TraitDefinitions in Self-Serving Assessments ofAbility.” Journal of Personality and SocialPsychology, December 1989,57(6), pp.1082–90.
General Handbook of Instructions.Salt Lake City,UT: The Church of Jesus Christ of Latter-Day Saints, 1989.
Groves, Robert M. Survey errors and surveycosts. New York: Wiley, 1989.
Hastorf, Albert and Cantril, Hadley. “They Sawa Game: A Case Study.”Journal of Abnor-mal and Social Psychology, 1954,49(1), pp.129–34.
Kahneman, Daniel.“Reference Points, Anchors,Norms, and Mixed Feelings.”OrganizationalBehavior and Human Decision Processes,March 1992,51(2), pp. 296–312.
Lewellen, Wilbur G.; Park, Taewoo and Ro, ByungT. “Self-Serving Behavior in Managers’ Dis-cretionary Information Disclosure Decisions.”Journal of Accounting and Economics, April1996,21(2), pp. 227–51.
Maccoby, Eleanor and Jacklin, Carol. The psy-chology of sex differences. Stanford, CA:Stanford University Press, 1974.
McConkie, Bruce R. Mormon doctrine, 2nd Ed.Salt Lake City, UT: Bookcraft, 1966.
Moore, David W. “Public: Gingrich ShouldHave Been Replaced as Speaker of theHouse.”Gallup Poll Monthly, January 1997,
726 THE AMERICAN ECONOMIC REVIEW SEPTEMBER 1999
(376), pp. 2–5.Rabin, Matthew. “Moral Preferences, Moral
Constraints, and Self-Serving Biases.” Uni-versity of California–Berkeley Working Pa-per No. 95/241, 1995.
Richards, Stephen L. The law of tithing. SaltLake City, UT: The Church of Jesus Christ ofLatter-Day Saints, 1983.
Saad, Lydia. “Issues Referendum Reveals Pop-ulist Leanings.”Gallup Poll Monthly, May1996, (368), pp. 2–6.
Swainston, Howard D. “Tithing,” in Daniel H.Ludlow, ed., Encyclopedia of Mormonism,Vol. 4. New York: Macmillan, 1992, pp.1480–82.
Thaler, Richard H. “Mental Accounting andConsumer Choice.”Marketing Science, Sum-mer 1985,4(3), pp. 199–214.
Tversky, Amos and Kahneman, Daniel. “TheFraming of Decisions and the Rationality ofChoice.” Science, January 1981,211(4481),pp. 453–58.
727VOL. 89 NO. 4 DAHL AND RANSOM: TITHING AND SELF-SERVING BELIEFS