Embed Size (px)
Citation preview
7/27/2019 Does School Autonomy Make Sense Everywhere? Panel Estimates from PISA
http://slidepdf.com/reader/full/does-school-autonomy-make-sense-everywhere-panel-estimates-from-pisa 1/48
ADB Economics Working Paper Series
Does School Autonomy Make SenseEverywhere? Panel Estimates rom PISA
Eric A. Hanushek, Susanne Link, and Ludger Woessmann
No. 296 | January 2012

7/27/2019 Does School Autonomy Make Sense Everywhere? Panel Estimates from PISA
http://slidepdf.com/reader/full/does-school-autonomy-make-sense-everywhere-panel-estimates-from-pisa 2/48
7/27/2019 Does School Autonomy Make Sense Everywhere? Panel Estimates from PISA
http://slidepdf.com/reader/full/does-school-autonomy-make-sense-everywhere-panel-estimates-from-pisa 3/48
ADB Economics Working Paper Series No. 296
Does School Autonomy Make Sense
Everywhere? Panel Estimates rom PISA
Eric A. Hanushek, Susanne Link, and Ludger Woessmann
January 2012
ric A anushek is rofessor at oover nstitution, tanford niversity; usanne ink is a octoralCandidate at niversity of Munich; and udger oessmann is rofessor at niversity of Munich Thispaper was published under TA 714: stablishing lobal esearch Alliance of the conomics and
esearch epartment, Asian evelopment Bank (AB The authors thank participants at the ABorkshop on uman Capital and conomic evelopment at arvard niversity, in particular hilippe Aghion, obert Barro, and Mark osenzweig, for helpful comments and discussion ink gratefullyDFNQRZOHGJHV¿QDQFLDOVXSSRUWIURPWKH*HUPDQ6FLHQFH)RXQGDWLRQ')*WKURXJK*5.DQGoessmann from the act for esearch and nnovation of the eibniz Association The authors acceptresponsibility for any errors in the paper
7/27/2019 Does School Autonomy Make Sense Everywhere? Panel Estimates from PISA
http://slidepdf.com/reader/full/does-school-autonomy-make-sense-everywhere-panel-estimates-from-pisa 4/48
Asian evelopment Bank AB Avenue, Mandaluyong City0HWUR0DQLOD3KLOLSSLQHVwwwadborg/economics
E\$VLDQ'HYHORSPHQW%DQN-DQXDU\ 122ublication tock o 12444
The views expressed in this paper are those of the author(s and do notQHFHVVDULO\UHÀHFWWKHYLHZVRUSROLFLHVof the Asian evelopment Bank
The AB conomics orking aper eries is a forum for stimulating discussion and
eliciting feedback on ongoing and recently completed research and policy studies
undertaken by the Asian evelopment Bank (AB staff, consultants, or resource
persons The series deals with key economic and development problems, particularly
WKRVHIDFLQJWKH$VLDDQG3DFL¿FUHJLRQDVZHOODVFRQFHSWXDODQDO\WLFDORU
methodological issues relating to project/program economic analysis, and statistical data
and measurement The series aims to enhance the knowledge on Asia’s development
and policy challenges; strengthen analytical rigor and quality of AB’s country partnership
strategies, and its subregional and country operations; and improve the quality and
availability of statistical data and development indicators for monitoring development
effectiveness
The AB conomics orking aper eries is a quickdisseminating, informal publication
whose titles could subsequently be revised for publication as articles in professional
journals or chapters in books The series is maintained by the conomics and esearch
epartment
7/27/2019 Does School Autonomy Make Sense Everywhere? Panel Estimates from PISA
http://slidepdf.com/reader/full/does-school-autonomy-make-sense-everywhere-panel-estimates-from-pisa 5/48
Contents
Abstract v
ntroduction 1
&RQFHSWXDO)UDPHZRUN
nternational anel ata 7
A Building a A anel atabase 7
B Measuring chool Autonomy 11
C escriptive tatistics 14
mpirical Model 1
esults 17
A Main esults 17
B obustness Tests 22
& 6SHFL¿FDWLRQHVWV
' )XUWKHU5HVXOWV
Adding Accountability and ducational evelopment 29
Conclusions 2
Appendix 4
5HIHUHQFHV

7/27/2019 Does School Autonomy Make Sense Everywhere? Panel Estimates from PISA
http://slidepdf.com/reader/full/does-school-autonomy-make-sense-everywhere-panel-estimates-from-pisa 6/48
7/27/2019 Does School Autonomy Make Sense Everywhere? Panel Estimates from PISA
http://slidepdf.com/reader/full/does-school-autonomy-make-sense-everywhere-panel-estimates-from-pisa 7/48
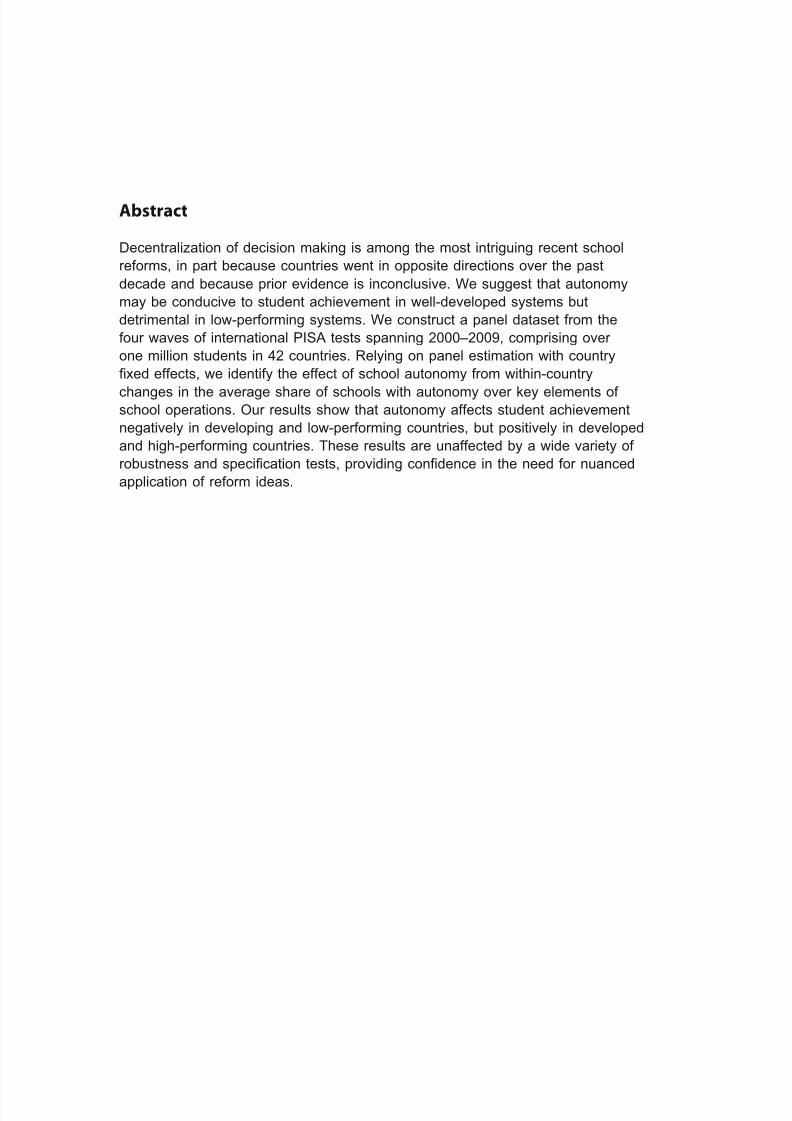
Abstract
ecentralization of decision making is among the most intriguing recent school
reforms, in part because countries went in opposite directions over the past
decade and because prior evidence is inconclusive e suggest that autonomy
may be conducive to student achievement in welldeveloped systems but
detrimental in lowperforming systems e construct a panel dataset from the
IRXUZDYHVRILQWHUQDWLRQDO36$WHVWVVSDQQLQJ±FRPSULVLQJRYHU
one million students in 42 countries elying on panel estimation with country
¿[HGHIIHFWVZHLGHQWLI\WKHHIIHFWRIVFKRRODXWRQRP\IURPZLWKLQFRXQWU\
changes in the average share of schools with autonomy over key elements of school operations ur results show that autonomy affects student achievement
negatively in developing and lowperforming countries, but positively in developed
and highperforming countries These results are unaffected by a wide variety of
UREXVWQHVVDQGVSHFL¿FDWLRQWHVWVSURYLGLQJFRQ¿GHQFHLQWKHQHHGIRUQXDQFHG
application of reform ideas

7/27/2019 Does School Autonomy Make Sense Everywhere? Panel Estimates from PISA
http://slidepdf.com/reader/full/does-school-autonomy-make-sense-everywhere-panel-estimates-from-pisa 8/48
7/27/2019 Does School Autonomy Make Sense Everywhere? Panel Estimates from PISA
http://slidepdf.com/reader/full/does-school-autonomy-make-sense-everywhere-panel-estimates-from-pisa 9/48
I. Introduction
irtually every country in the world accepts the importance of human capital investment
as an element of economic development, but this has introduced a set of important
policy questions about how best to pursue such investments ver time, attention has
shifted away from simply ensuring access to schooling to an interest in the quality of
learning1 But this shift has introduced new policy uncertainty since the process of
expanding school attainment is better understood than is the process of improving
achievement, leaving many countries with limited success after adopting a variety of
popular policies The uncertainty has perhaps been largest in the case of institutional
design questions, as the evidence in that area has been thinner and less reliable This
paper focuses on one popular institutional change—altering the degree of local school
autonomy in decisionmaking—and brings a new analytical approach to the analysis of
its impact2 By introducing crosscountry panel analysis, we can exploit the substantial
LQWHUQDWLRQDOYDULDWLRQLQSROLF\LQLWLDWLYHVIRFXVHGRQDXWRQRP\H¿QGWKDWDXWRQRP\
GRHVVLJQL¿FDQWO\DIIHFWWKHSHUIRUPDQFHRIDFRXQWU\¶VVFKRROVEXWWKHLPSDFWLVXLWH
heterogeneous across stages of development: the effect of school autonomy in decision
making is positive in developed countries, but in fact turns negative in developing
countries
ocal autonomy has been a policy discussed intensively in both developing and
developed countries hile many countries have moved toward more decentralization
in such areas as the hiring of teachers or the choice of curricular elements, others have
DFWXDOO\JRQHWRPRUHFHQWUDOL]HGGHFLVLRQPDNLQJKHRSSRVLQJPRYHPHQWVUHÀHFWD
fundamental tension The prime argument favoring decentralization is that local decision
makers have better understanding of the capacity of their schools and the demands that
are placed on them by varying student populations This knowledge in turn permits them
to make better resource decisions, improve the productivity of the schools, and meet the
varying demands of their local constituents et, countervailing arguments, centered on
ODFNRIGHFLVLRQPDNLQJFDSDFLW\DQGFRQÀLFWLQJLQFHQWLYHVSXVKLQWKHRSSRVLWHGLUHFWLRQ1 Hanushek and Woessmann (2008) show that cognitive skills can have substantial impacts on economic
development. At the same time, access and attainment goals dominate many policy discussions. The cleareststatement o school attainment goals can be ound in discussions o the Education or All Initiative o the WorldBank and UNESCO (see the description in en.wikipedia.org/wiki/Education_For_All, accessed 31 July 2011) and theMillennium Development Goals o the United Nations (see the description in en.wikipedia.org/wiki/ Millennium_Development_Goals, accessed 31 July 2011). In both instances, while there is some discussion o quality issues, themain objective has been seen as providing all children with at least a lower secondary education.
2 Local autonomy or decision making is reerred to in various ways including decentralized decision making andsite-based or school-based management. Here, we typically use the term local or school autonomy, although wethink o it as a synonym or these alternative names.
7/27/2019 Does School Autonomy Make Sense Everywhere? Panel Estimates from PISA
http://slidepdf.com/reader/full/does-school-autonomy-make-sense-everywhere-panel-estimates-from-pisa 10/48
ith local autonomy comes the possibility that individual schools pursue goals other
than achievement maximization and a potential threat to maintaining common standards
across the nation
%UXQV)LOPHUDQG3DWULQRVSURYLGHDWKRXJKWIXOUHYLHZRIWKHWRSLFLQGHYHORSLQJcountries, focusing on several evaluations of recent decentralization programs, mostly
conducted by the orld Bank Their review highlights how methodological approaches—
including the use of random control trials, various instrumentalvariable applications, and
PRUHVWDQGDUGFURVVVHFWLRQDOHYDOXDWLRQV²LQÀXHQFHWKHSURJUDPHYDOXDWLRQV imilarly,
UHYLHZVRIWKHH[SHULHQFHVRIWKH8QLWHG6WDWHV86WHQGWR¿QGPL[HGUHVXOWV6XPPHUV
and ohnson 1994 espite mixed evidence, there remains considerable policy support
IRUIXUWKHUORFDODXWRQRP\LQGHFLVLRQPDNLQJHJXFKLRUOG%DQN
*RYHUQRU¶V&RPPLWWHHRQGXFDWLRQDO[FHOOHQFH
)URPDQDQDO\WLFDOYLHZSRLQWIRXUVLJQL¿FDQWLVVXHVDULVH)LUVWWKHYHU\FRQFHSWRI
ORFDOGHFLVLRQPDNLQJDQGORFDODXWRQRP\LVPXOWLIDFHWHGDQGGLI¿FXOWWRPHDVXUHRQDconsistent basis t is possible, for example, for local schools to decide some things—
such as teacher hiring or facility upgrades—and not others such as the appropriate
outcome standards or the pay of teachers Conceptually, some decisions are more
appropriately made locally, eg, operational decisions like hiring and budget allocations
where local knowledge is needed and standardization is not crucial, than others where
standardization may be more desirable, eg, course offerings and requirements (see
%LVKRSDQGRHVVPDQQ
6HFRQGWKHLPSDFWRIDXWRQRP\PD\ZHOOYDU\ZLWKRWKHUHOHPHQWVRIWKHV\VWHP)RU
example, local autonomy permits using localized knowledge to improve performance, but
it also opens up the possibility for more opportunistic behavior on the part of local schoolpersonnel As a result, the impact on student outcomes may well interact with the level
of accountability, because centralized accountability provides a way of monitoring local
EHKDYLRURHVVPDQQ n a larger sense, the results of autonomy may depend on
WKHSHUIRUPDQFHOHYHO0RXUVKHG&KLLRNHDQG%DUEHUDQGDVDFRUROODU\RQWKH
overall development level of the country and the entire school system
3 For studies o autonomy in developing countries, see also, Galiani, Gertler, and Schargrodsky (2008) and thereerences therein, Behrman and King (2001), Jimenez and Sawada (1999), and Vegas (1999).
4 For urther evidence rom developed countries, see, e.g., Barankay and Lockwood (2007) and Clark (2009).5 In analyzing governance aspects at the level o tertiary education, Aghion et al. (2010) show that autonomy is
positively related to universities’ research output in the US and in Europe and argue or benefts rom combiningautonomy with accountability.
6 Such considerations have also entered into the interpretation o mixed results rom autonomy in the US (seeHanushek 1994), Loeb and Strunk 2007). A urther US example comes rom charter schools, which dependsignifcantly on the regulatory environment they ace. Charter schools are publicly fnanced and regulated schoolsthat are allowed to have considerable autonomy, requently being stand-alone schools. At least a portion o thevariation in the evaluations o charter schools probably reects interactions with other orces such as degree o parental choice, the quality o inormation, and constraints on school location. For estimates o the variation incharter outcomes, see CREDO (2009), Hanushek et al. (2007), Booker et al. (2007), and Biulco and Ladd (2006).
2 | ADB Economics Working Paper Series No. 296
7/27/2019 Does School Autonomy Make Sense Everywhere? Panel Estimates from PISA
http://slidepdf.com/reader/full/does-school-autonomy-make-sense-everywhere-panel-estimates-from-pisa 11/48
Third, much of the evidence on autonomy comes from crosssectional analyses where
DQ\HIIHFWVDUHQRWZHOOLGHQWL¿HG76SHFL¿FDOO\RQHPXVWRIWHQXHVWLRQZKHWKHU
observable characteristics adequately describe differences in schools that are and are not
JUDQWHGPRUHDXWRQRP\LQGHFLVLRQPDNLQJ)RUH[DPSOHLIPRUHG\QDPLFVFKRROVJHW
JUHDWHUDXWRQRP\RULIGHPDQGLQJSDUHQWVFKRRVHDXWRQRPRXVVFKRROVLWLVGLI¿FXOWWRextract the independent effect of local decisionmaking on student achievement
)RXUWKPDQ\DVSHFWVRIWKHORFXVRIGHFLVLRQPDNLQJDUHVHWDWWKHQDWLRQDOOHYHO)RU
example, many countries set national educational standards, national assessments
and accountability regimes, and various rules about what decisions are permissible at
the local level, leaving little to no withincountry variation in decision making authority
5HODWHGO\DQ\JHQHUDOHXLOLEULXPHIIHFWVDUHH[WUHPHO\GLI¿FXOWWRGLVHQWDQJOHLIIRU
example, the pattern of local decision making brings a competitive response from
schools without local decision making or if the nature of local decisions alters the
supply of teachers or administrators But dealing with these issues through international
FRPSDULVRQVZKHUHLQVWLWXWLRQDOYDULDWLRQFDQEHIRXQGEULQJVRWKHULGHQWL¿FDWLRQLVVXHVUHODWHGWRYDULDWLRQVLQFXOWXUHJRYHUQPHQWDOLQVWLWXWLRQVDQGRWKHUWKLQJVWKDWDUHGLI¿FXOW
to measure
This paper introduces new international panel data to address each of these issues e
develop a panel of international test results from the rogramme for nternational tudent
$VVHVVPHQW36$FRYHULQJFRXQWULHVDQGIRXUZDYHVWKDWVSDQDWLPHSHULRGRI
years hile we estimate our micro models with over 1 million student observations to
account for family and school inputs at the individual level, the panel character of the
analysis is at the country level The survey information that accompanies the student
DVVHVVPHQWVSURYLGHVULFKGHWDLODERXWLQGLYLGXDOVWXGHQWVDQGVFKRROVDORQJZLWKVSHFL¿F
descriptions of the decisions that are and are not permissible at the school level hilea variety of studies have looked at some of these institutional features across countries,
DOOSULRUZRUNKDVEHHQSXUHO\FURVVVHFWLRQDOVHH+DQXVKHNDQGRHVVPDQQ9
e identify autonomy effects by exploiting countrylevel variation over time after including
FRXQWU\DQG\HDU¿[HGHIIHFWVWKDWFRQWUROIRUV\VWHPDWLFWLPHLQYDULDQWFXOWXUDODQG
institutional differences at the country level This framework ensures that our estimates
are not affected by withincountry selection into autonomy and by unobserved country
VSHFL¿FKHWHURJHQHLW\LWKLQWKLVIUDPHZRUNZHFDQUHDGLO\WHVWWKHKHWHURJHQHRXV
HIIHFWVRIDXWRQRP\E\VSHFL¿FW\SHVRIGHFLVLRQVE\YDULDWLRQVLQGHYHORSPHQWOHYHOV
and educational performance levels; and by the existence of centralized accountability
7 Note that more recent investigations, particularly in developing countries, have relied on randomized controltrials—although these are dicult to implement and a number have not been well executed (Bruns, Filmer, andPatrinos (2011).
8 For a discussion o international assessments along with background material or this analysis, see Hanushek andWoessmann (2011).
9 For examples o existing investigations o institutions particularly o autonomy across countries, see Woessmann(2003 and 2005), Fuchs and Woessmann (2007), and Woessmann et al. (2009).
10 An early discussion o the underlying concept can be ound in Gustasson (2006).
Does School Autonomy Make Sense Everywhere? Panel Estimates from PISA | 3
7/27/2019 Does School Autonomy Make Sense Everywhere? Panel Estimates from PISA
http://slidepdf.com/reader/full/does-school-autonomy-make-sense-everywhere-panel-estimates-from-pisa 12/48
XUFHQWUDO¿QGLQJLVWKDWORFDODXWRQRP\KDVDQLPSRUWDQWLPSDFWRQVWXGHQW
achievement, but this impact varies systematically across countries, depending on
the level of economic and educational development n simplest terms, countries with
otherwise strong institutions gain considerably from decentralized decisionmaking in their
schools, while countries that lack such a strong existing structure may actually be hurtby decentralizing decisionmaking The negative effect in developing countries emerges
most clearly for autonomy in areas relating to academic content, but also appears for
autonomy in the areas of personnel and budgets An extensive series of robustness and
VSHFL¿FDWLRQWHVWVFRUURERUDWHWKHFHQWUDO¿QGLQJ
e use the income level of a country (gross domestic product per capita as an
indicator of overall skills and institutions igherincome countries tend to have better
societal and economic institutions that promote productivity, societal vision, and smooth
social interactions As such, this indicator is broad and multifaceted, leading us also to
LQYHVWLJDWHPRUHVSHFL¿FDQGQXDQFHGDVSHFWVRILQVWLWXWLRQVH¿QGLQGLFDWLRQVWKDWWKH
development of the educational system (measured by higher achievement adds another VLJQL¿FDQWGLPHQVLRQWRWKHVXFFHVVRIJUHDWHUORFDODXWRQRP\)XUWKHUFRQVLVWHQWZLWK
WKHXQGHUO\LQJPRWLYDWLRQIRUFRQVWUDLQLQJRSSRUWXQLVWLFEHKDYLRUWKHEHQH¿WVRIJUHDWHU
autonomy are enhanced by accountability through centralized examinations
At a methodological level, the results show the potential perils of crosscountry analyses
WKDWFDQQRWFRQWUROIRURWKHULQVWLWXWLRQDODQGGHYHORSPHQWIDFWRUVQRXUVSHFL¿FDQDO\VLV
ZH¿QGGLIIHUHQWDQGFRQÀLFWLQJUHVXOWVEHWZHHQVLPSOHFURVVVHFWLRQDODQDO\VLVDOEHLW
with extensive controls of measured family and schooling inputs and our new panel
HVWLPDWRUV)XUWKHUWKHKHWHURJHQHLW\RIUHVXOWVDFURVVGLIIHUHQWOHYHOVRIGHYHORSPHQW
suggests caution in attempting to generalize from developedcountry analyses to
developing countries (and vice versa
The next section discusses the underlying conceptual framework ection describes
the new database and key variation across countries in various kinds of local autonomy
ection develops our empirical model ection presents our estimation results
DQGH[WHQVLYHUREXVWQHVVDQGVSHFL¿FDWLRQWHVWV6HFWLRQH[SDQGVWKHLQYHVWLJDWLRQ
of interactions to centralized examinations and the performance level of the education
system ection concludes
II. Conceptual Framework ubstantial research has gone into understanding the determinants of educational
achievement This work, generally under the label of educational production functions,
has incorporated a wide range of studies designed to understand how such factors
4 | ADB Economics Working Paper Series No. 296
7/27/2019 Does School Autonomy Make Sense Everywhere? Panel Estimates from PISA
http://slidepdf.com/reader/full/does-school-autonomy-make-sense-everywhere-panel-estimates-from-pisa 13/48
as school resources and family background affect achievement11 ere we take an
expanded view of this approach that highlights the importance of institutions and, in
particular, of local autonomy
A typical formulation of an educational production function has student outcomes (T as afunction of family (F and schools (S:
T f F S = ( , ) (1
ere, however, we introduce the simple idea that the productivity of any input is directlyrelated to the institutional structure of country c (I c that determines the basic environmentand rules of schools, how decisions are made, the overall incentives in the system, and soforth:
T I f F S c
= ⋅ ( ), (2
)RUPDQ\DQDO\VHVRIHGXFDWLRQDOSURGXFWLRQZLWKLQFRXQWULHVWKHLQVWLWXWLRQDOVWUXFWXUHis constant, and analyses that ignore it provide accurate information about the impacts
of resources even if these might not transfer well to institutional structures in other
countries n many ways, I c is similar to total factor productivity in a macro context where
LWGHWHUPLQHVWKHHI¿FLHQF\ZLWKZKLFKDQ\JLYHQVHWRILQSXWVLVWUDQVODWHGLQWRVWXGHQW
DFKLHYHPHQWQWKLVIRUPXODWLRQZHDUHVSHFL¿FDOO\LQWHUHVWHGLQLQYHVWLJDWLQJWKH
decision making institutions of different countries
chool autonomy or the decentralization of decision making power can be understood as
the delegation of a task by a principal (in this case, the government agency in charge of
the school system, who wishes to facilitate the provision of knowledge, to agents, namely
WKHVFKRROVVHHRHVVPDQQQWKHDEVHQFHRIGLYHUJHQWLQWHUHVWVRUDV\PPHWULFinformation, agents can be expected to behave in conformity with system objectives
n fact, economic models of school governance often suggest that greater autonomy
FDQOHDGWRLQFUHDVHGHI¿FLHQF\RISXEOLFVFKRROVHJ+R[E\HFK\ED
because autonomy offers the possibility of using superior local knowledge, with positive
consequences for outcomes Additionally, by bringing decisions closer to the interested
local community, decentralization may improve the monitoring of teachers and schools
E\SDUHQWVDQGORFDOFRPPXQLWLHVVHH*DOLDQL*HUWOHUDQG6FKDUJURGVN\DQGWKH
references therein
owever, when divergent interests and asymmetric information are present in a decision
making area, agents have incentives and perhaps substantial opportunities to act in their own selfinterest with little risk that such behavior will be noticed and sanctioned n this
case, autonomy opens the scope for opportunistic behavior, with negative consequences
IRURXWFRPHVRHVVPDQQ$JHQWVPD\XVHWKHLUJUHDWHUDXWRQRP\WRIXUWKHUJRDOV
RWKHUWKDQDGYDQFLQJVWXGHQWDFKLHYHPHQW)XUWKHUPRUHWKHXDOLW\RIGHFLVLRQPDNLQJ11 See Hanushek (2002 and 2003) on the general ramework and US evidence; see Woessmann (2003) on
international evidence.
Does School Autonomy Make Sense Everywhere? Panel Estimates from PISA | 5
7/27/2019 Does School Autonomy Make Sense Everywhere? Panel Estimates from PISA
http://slidepdf.com/reader/full/does-school-autonomy-make-sense-everywhere-panel-estimates-from-pisa 14/48
may also be inferior at the local level when the technical capabilities of local decision
makers to provide highquality services are limited and when local communities lack the
DELOLW\WRHQVXUHKLJKXDOLW\VHUYLFHVVHH*DOLDQL*HUWOHUDQG6FKDUJURGVN\
Consequently, the success of autonomy reforms may depend on the general level of
human capital, which affects the quality of parental monitoring12
Against the background of these opposing sets of mechanisms of how autonomy affects
performance, we argue that the impact of autonomy likely depends on the level of
development n general terms, a country’s development level captures such aspects as
local capacity, abilities of local decision makers, governance effectiveness, state capacity,
SDUHQWDOKXPDQFDSLWDODQGPRQLWRULQJDELOLWLHVRIORFDOFRPPXQLWLHV$OVRVSHFL¿FDOO\
in the education system, systems that already work at a high performance level may
have such features as external evaluations and welltrained teachers that facilitate local
decision making by setting and ensuring high educational standards1 n particular,
accountability systems may limit the extent to which local decision makers can act
RSSRUWXQLVWLFDOO\ZLWKRXWJHWWLQJFDXJKWRHVVPDQQ
n sum, there are a number of channels through which a higher level of development,
both in the education system and in society more generally, strengthens the positive
mechanisms of autonomy and weakens the negative ones The impact of autonomy on
performance thus depends on the level of development, being positive in wellfunctioning
systems but possibly even negative in dysfunctional systems
)LQDOO\WKHLPSDFWRIORFDODXWRQRP\PD\GLIIHUE\DUHDRIGHFLVLRQPDNLQJKLOH
standardization may be important in decisions on academic content, it may not be as
important in decisions on process operations and personnel management (Bishop and
RHVVPDQQKXVORFDOGHFLVLRQPDNLQJRYHUEDVLFLVVXHVRIVWDQGDUGVVXFKDVcourse offerings or course content might have a negative effect of autonomy when the
whole system is dysfunctional But even in such a system, local decision making over
hiring teachers and budget allocations may not be as negative
12 While we ocus on issues o decision making, there may also be technological dierences. Centralization opens thepossibility to exploit economies o scale, or example in evaluation, teacher training systems, and the like.
13 For example, in diagnosing what leads to improved perormance at dierent stages o development, Mourshed,Chijioke, and Barber (2010, 26) observe that going rom “great to excellent” is such that “the interventions o thisstage move the locus o improvement rom the center to the schools themselves”.
6 | ADB Economics Working Paper Series No. 296
7/27/2019 Does School Autonomy Make Sense Everywhere? Panel Estimates from PISA
http://slidepdf.com/reader/full/does-school-autonomy-make-sense-everywhere-panel-estimates-from-pisa 15/48
III. International Panel Data
An essential component of our analytical strategy is the construction of a crosscountry
SDQHORIVWXGHQWDFKLHYHPHQWGDWD)RUWKLVZHFDQWDNHDGYDQWDJHRIWKHUHFHQW
H[SDQVLRQRI LQWHUQDWLRQDODVVHVVPHQWVFI+DQXVKHNDQGRHVVPDQQ
A. Building a PISA Panel Database
ur empirical analysis relies on the rogramme for nternational tudent Assessment, an
internationally standardized assessment conducted by the rganisation for conomic Co
RSHUDWLRQDQG'HYHORSPHQW&'KH36$VWXG\¿UVWFRQGXFWHGLQLVGHVLJQHG
to obtain internationally comparable data on the educational achievement of 1yearold
students in math, science, and reading
)RXUGLVWLQFWDVVHVVPHQWVKDYHEHHQFDUULHGRXWLQDQGQ
36$FRXQWULHVLQFOXGLQJ&'FRXQWULHVSDUWLFLSDWHGLQWKHDVVHVVPHQW
QDIXUWKHUQRQ&'FRXQWULHVDGPLQLVWHUHGWKH36$DVVHVVPHQW
%\36$WKHODWHVWDVVHVVPHQWWKHQXPEHURISDUWLFLSDWLQJFRXQWULHVUHDFKHG
countries including a range of emerging economies
A’s target population is the 1yearold students in each country, regardless of the
institution and grade they currently attend The A sampling procedure ensures that a
representative sample of the target population is tested in each country Most countries
HPSOR\DWZRVWDJHVDPSOLQJWHFKQLXHKH¿UVWVWDJHGUDZVDUDQGRPVDPSOHRI
schools in which 1yearold students are enrolled, where the probability of a school to be
selected is proportional to its size as measured by the estimated number of 1yearoldstudents attending The second stage randomly samples students of the 1year
old students in each of these schools, with each 1yearold student having the same
sampling probability
The performance tests are paper and pencil tests, lasting up to two hours for
each student The A tests are constructed to test a range of relevant skills and
competencies ach subject is tested using a broad sample of tasks with differing levels
RIGLI¿FXOW\WRUHSUHVHQWDFRPSUHKHQVLYHLQGLFDWRURIWKHFRQWLQXXPRIVWXGHQWV¶DELOLWLHV
KHSHUIRUPDQFHLQHDFKGRPDLQLVPDSSHGRQDVFDOHZLWKDPHDQRIWHVWVFRUH
SRLQWVDQGDVWDQGDUGGHYLDWLRQRIWHVWVFRUHSRLQWVDFURVVWKH&'FRXQWULHV14
n addition to the achievement data, A also provides a rich array of background
information on each student and her school tudents are asked to provide information
on personal characteristics and their family background chool principals provide
14 While the reading test has been psychometrically scaled on a uniorm scale since 2000, the math test was re-scaled in 2003 (and the science test in 2006) to have again mean 500 and standard deviation 100 across the OECDcountries and has a common psychometric scale since then. In our analyses below, year fxed eects take accounto this. Furthermore, we show that results are qualitatively the same when restricting the math analysis to thewaves since 2003 that have a common psychometric scale.
Does School Autonomy Make Sense Everywhere? Panel Estimates from PISA | 7
7/27/2019 Does School Autonomy Make Sense Everywhere? Panel Estimates from PISA
http://slidepdf.com/reader/full/does-school-autonomy-make-sense-everywhere-panel-estimates-from-pisa 16/48
information on the schools’ resource endowment and institutional settings hile some
questionnaire items, such as the questions on student gender and age, remain the same
in each assessment cycle, some information is not available or directly comparable
across all A waves
%\PHUJLQJWKHIRXU36$DVVHVVPHQWF\FOHVZHDUHIRUWKH¿UVWWLPHDEOHWRFRQVWUXFW
DSDQHOGDWDVHWDWWKHFRXQWU\OHYHOQD¿UVWVWHSZHFRPELQHVWXGHQWV¶WHVWVFRUHV
in math, science, and reading literacy with individual students’ characteristics, family
background information, and schoollevel data for each of the four A waves ince the
background questionnaires are not fully standardized, in a second step we select a set
of core variables that are available in each of the four A waves and merge the cross
VHFWLRQDOGDWDRIDQGLQWRRQHGDWDVHW
ur sample comprises all countries that participated in at least three of the four A
waves1&RPELQLQJWKHDYDLODEOHGDWDZHFRQVWUXFWDGDWDVHWFRQWDLQLQJ
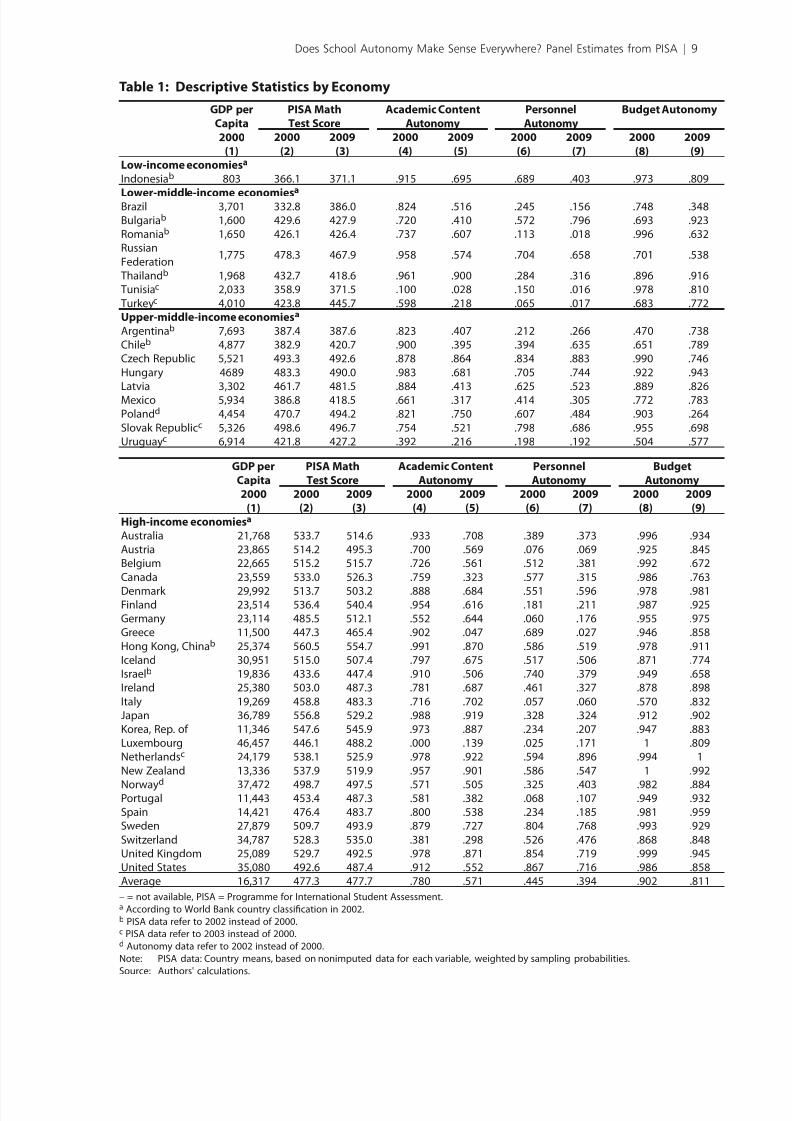
students in 42 countries As is evident from Table 1, the panel includes a broad sampleRIERWKKLJKLQFRPHDQGORZHULQFRPHFRXQWULHV)ROORZLQJWKHRUOG%DQNFODVVL¿FDWLRQ
FRXQWULHVLQRXUVDPSOHDUHFODVVL¿HGDVKLJKLQFRPHFRXQWULHV%XWWKHUHLVDOVR
one lowincome country, seven lowermiddleincome countries, and nine uppermiddle
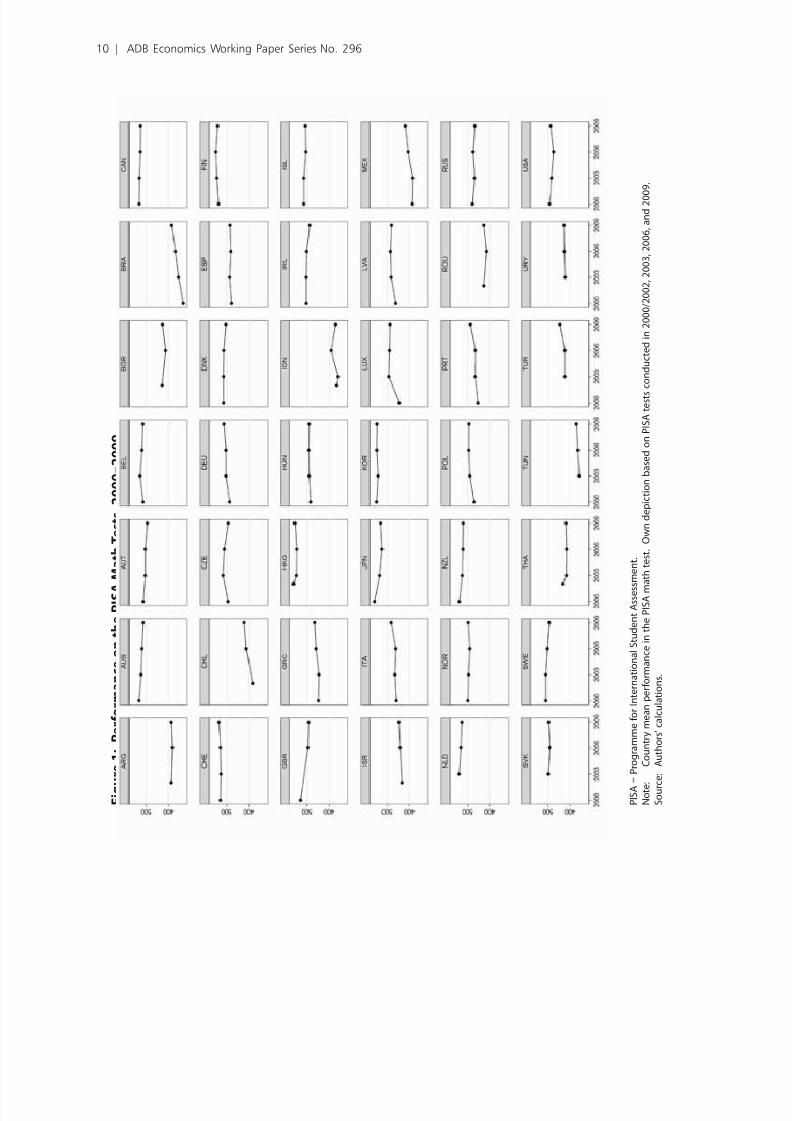
LQFRPHFRXQWULHVLQWKHVDPSOH)LJXUHGHSLFWVWKHDYDLODEOHDFKLHYHPHQWGDWDIRUWKH
42 countries in our sample The average test performance across all countries in the
VDPSOHKDUGO\FKDQJHGEHWZHHQDQGVHHDOVRDEOH%XWVRPHFRXQWULHV
saw substantial increases in average achievement (most notably Brazil, Chile, ermany,
uxembourg, Mexico, and ortugal, with increases surpassing one quarter of a standard
deviation, while others saw substantial decreases (mostly notably apan and the nited
.LQJGRPZLWKGHFUHDVHVVXUSDVVLQJRQHXDUWHURIDVWDQGDUGGHYLDWLRQ
To have a complete dataset of all students with performance data, we imputed country
bywave means for missing values of control variables ince we consider a large set of
explanatory variables and since a portion of these variables is missing for some students,
dropping all student observations with missing values would result in substantial sample
reduction To ensure that imputed data are not driving our results, all our regressions
include an indicator for each variable with missing data that equals one for imputed
values and zero otherwise
e combine the student and school data with additional countrylevel data per
capita, measured in current dollars, is provided by the orld Bank and C
QDWLRQDODFFRXQWVGDWD¿OHV'DWDRQDQQXDOH[SHQGLWXUHSHUVWXGHQWLQORZHUVHFRQGDU\HGXFDWLRQLQDQGDUHWDNHQIURPWKH&'GXFDWLRQDWD*ODQFH
LQGLFDWRUVVHHUJDQLVDWLRQIRUFRQRPLF&RRSHUDWLRQDQG'HYHORSPHQW'DWDRQ
the existence of curriculumbased external exit exams are an updated version of the data
XVHGE\%LVKRS
15 France had to be excluded rom the analysis because it provides no inormation on the school-level questionnaire.Due to their small size, Liechtenstein and Macao, China were also dropped.
8 | ADB Economics Working Paper Series No. 296
7/27/2019 Does School Autonomy Make Sense Everywhere? Panel Estimates from PISA
http://slidepdf.com/reader/full/does-school-autonomy-make-sense-everywhere-panel-estimates-from-pisa 17/48
Table 1: Descriptive Statistics by Economy
GDP per
Capita
2000(1)
PISA Math
Test Score
Academic Content
Autonomy
Personnel
Autonomy
Budget Autonomy
2000
(2)
2009
(3)
2000
(4)
2009
(5)
2000
(6)
2009
(7)
2000
(8)
2009
(9)Low-income economiesa
Indonesiab 803 366.1 371.1 .915 .695 .689 .403 .973 .809
Lower-middle-income economiesa
Brazil 3,701 332.8 386.0 .824 .516 .245 .156 .748 .348Bulgariab 1,600 429.6 427.9 .720 .410 .572 .796 .693 .923Romaniab 1,650 426.1 426.4 .737 .607 .113 .018 .996 .632RussianFederation
1,775 478.3 467.9 .958 .574 .704 .658 .701 .538
Thailandb 1,968 432.7 418.6 .961 .900 .284 .316 .896 .916 Tunisiac 2,033 358.9 371.5 .100 .028 .150 .016 .978 .810 Turkeyc 4,010 423.8 445.7 .598 .218 .065 .017 .683 .772Upper-middle-income economiesa
Argentinab 7,693 387.4 387.6 .823 .407 .212 .266 .470 .738Chileb 4,877 382.9 420.7 .900 .395 .394 .635 .651 .789Czech Republic 5,521 493.3 492.6 .878 .864 .834 .883 .990 .746Hungary 4689 483.3 490.0 .983 .681 .705 .744 .922 .943
Latvia 3,302 461.7 481.5 .884 .413 .625 .523 .889 .826Mexico 5,934 386.8 418.5 .661 .317 .414 .305 .772 .783Polandd 4,454 470.7 494.2 .821 .750 .607 .484 .903 .264Slovak Republicc 5,326 498.6 496.7 .754 .521 .798 .686 .955 .698Uruguayc 6,914 421.8 427.2 .392 .216 .198 .192 .504 .577
GDP per
Capita2000
(1)
PISA Math
Test Score
Academic Content
Autonomy
Personnel
Autonomy
Budget
Autonomy2000
(2)2009
(3)2000
(4)2009
(5)2000
(6)2009
(7)2000
(8)2009
(9)
High-income economiesa
Australia 21,768 533.7 514.6 .933 .708 .389 .373 .996 .934Austria 23,865 514.2 495.3 .700 .569 .076 .069 .925 .845Belgium 22,665 515.2 515.7 .726 .561 .512 .381 .992 .672Canada 23,559 533.0 526.3 .759 .323 .577 .315 .986 .763
Denmark 29,992 513.7 503.2 .888 .684 .551 .596 .978 .981Finland 23,514 536.4 540.4 .954 .616 .181 .211 .987 .925Germany 23,114 485.5 512.1 .552 .644 .060 .176 .955 .975Greece 11,500 447.3 465.4 .902 .047 .689 .027 .946 .858Hong Kong, Chinab 25,374 560.5 554.7 .991 .870 .586 .519 .978 .911Iceland 30,951 515.0 507.4 .797 .675 .517 .506 .871 .774Israelb 19,836 433.6 447.4 .910 .506 .740 .379 .949 .658Ireland 25,380 503.0 487.3 .781 .687 .461 .327 .878 .898Italy 19,269 458.8 483.3 .716 .702 .057 .060 .570 .832Japan 36,789 556.8 529.2 .988 .919 .328 .324 .912 .902Korea, Rep. o 11,346 547.6 545.9 .973 .887 .234 .207 .947 .883Luxembourg 46,457 446.1 488.2 .000 .139 .025 .171 1 .809Netherlandsc 24,179 538.1 525.9 .978 .922 .594 .896 .994 1New Zealand 13,336 537.9 519.9 .957 .901 .586 .547 1 .992
Norwayd 37,472 498.7 497.5 .571 .505 .325 .403 .982 .884Portugal 11,443 453.4 487.3 .581 .382 .068 .107 .949 .932Spain 14,421 476.4 483.7 .800 .538 .234 .185 .981 .959Sweden 27,879 509.7 493.9 .879 .727 .804 .768 .993 .929Switzerland 34,787 528.3 535.0 .381 .298 .526 .476 .868 .848United Kingdom 25,089 529.7 492.5 .978 .871 .854 .719 .999 .945United States 35,080 492.6 487.4 .912 .552 .867 .716 .986 .858Average 16,317 477.3 477.7 .780 .571 .445 .394 .902 .811
= not available, PISA = Programme or International Student Assessment.a According to World Bank country classifcation in 2002.b PISA data reer to 2002 instead o 2000.c PISA data reer to 2003 instead o 2000.d Autonomy data reer to 2002 instead o 2000.Note: PISA data: Country means, based on nonimputed data or each variable, weighted by sampling probabilities.Source: Authors' calculations.
Does School Autonomy Make Sense Everywhere? Panel Estimates from PISA | 9
7/27/2019 Does School Autonomy Make Sense Everywhere? Panel Estimates from PISA
http://slidepdf.com/reader/full/does-school-autonomy-make-sense-everywhere-panel-estimates-from-pisa 18/48
F i g u r e 1 : P e r f o r m a n c e o n t h e P I S A
M a t h T e s t s ,
2 0 0 0 – 2 0 0 9
P I S A
= P r o g r a m m e o r I n t e r n a t i o n a l S t u d e n t A s s e s
s m e n t .
N o t e :
C o u n t r y m e a n p e r o r m a n c e i n t h e P I S A m
a t h t e s t . O w n d e p i c t i o n b a s e d o n P I S A t e s t s
c o n d u c t e d i n 2 0 0 0 / 2 0 0 2 ,
2 0 0 3 ,
2 0 0 6 , a n d 2 0 0 9 .
S o u r c e : A u t h o r s ' c a l c u l a t i o n s .
10 | ADB Economics Working Paper Series No. 296
7/27/2019 Does School Autonomy Make Sense Everywhere? Panel Estimates from PISA
http://slidepdf.com/reader/full/does-school-autonomy-make-sense-everywhere-panel-estimates-from-pisa 19/48
B. Measuring School Autonomy
e construct our measures of school autonomy for each country from the background
questionnaires of the four A studies n all waves, principals were asked to report the
level of responsibility for different types of decisions regarding the management of their school e make use of six decision making types: (i deciding which courses are offered;
(ii determining course content; (iii choosing which textbooks are used; (iv selecting
teachers for hire; (v establishing teachers’ starting salaries; and (vi deciding on budget
allocations within the school
QDQGSULQFLSDOVZHUHDVNHG³Q\RXUVFKRROZKRKDVWKHPDLQUHVSRQVLELOLW\
IRU«´)RUHDFKRIWKHHQXPHUDWHGDUHDVSULQFLSDOVKDGWRWLFNZKHWKHUGHFLVLRQVZHUH
mainly a responsibility of the school’s governing board, the principal, department heads,
RUWHDFKHUVDVRSSRVHGWRQRWEHLQJDUHVSRQVLELOLW\RIWKHVFKRRO6LPLODUO\LQDQG
SULQFLSDOVZHUHDVNHGZKRKDVDFRQVLGHUDEOHUHVSRQVLELOLW\IRUWKHHQXPHUDWHG
tasks and had to choose whether the regional or national education authority asopposed to the principal or teachers had considerable responsibility1 n all four waves,
respondents were explicitly allowed to tick as many options as appropriate in each area
)RUHDFKDUHDZHEHJLQE\FRQVWUXFWLQJDYDULDEOHLQGLFDWLQJIXOODXWRQRP\DWWKHVFKRRO
level, which equals 1 if a school entity—the principal, the school’s board, department
heads, or teachers—is the only one to carry responsibility (and zero otherwise Thus, as
soon as responsibility is also carried by external education authorities, we do not classify
a school as autonomous (As part of the robustness checks below, for each area we
DOVRFRQVWUXFWDYDULDEOHLQGLFDWLQJZKHWKHUWKHVFKRROKDVDQ\LQÀXHQFHRQWKHGHFLVLRQ
making process as opposed to exercising full responsibility Then, because our interest is
focused on countries’ institutional structures, we aggregate across all schools in a countryto obtain the share of schools with full autonomy in each of the areas As will be made
explicit in the next section, we do not use the individual school measures of autonomy in
the modeling of achievement because of concerns about introducing selection bias and
because of the possibility of general equilibrium effects
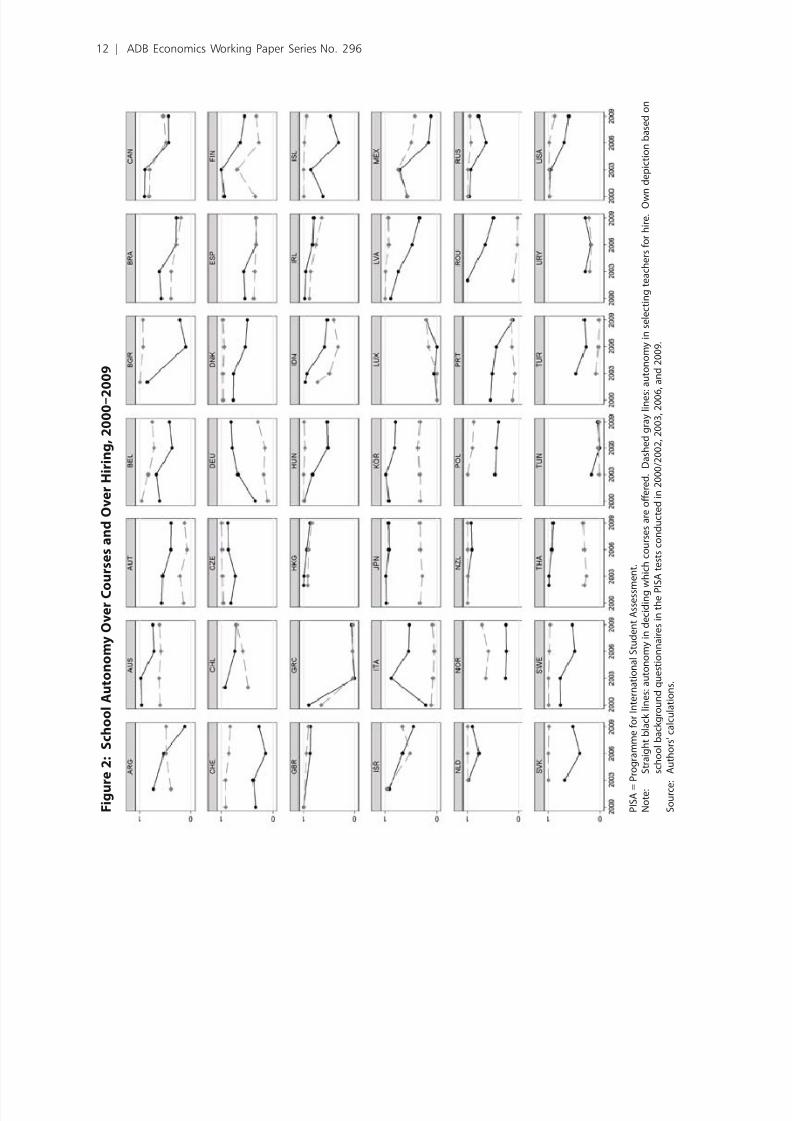
)LJXUHVKRZVH[HPSODU\JUDSKVDFURVVWKHIRXUZDYHVRIDJJUHJDWHDXWRQRP\IRU
determining courses offered and hiring in each country hile many countries have rather
ÀDWSUR¿OHVRIDXWRQRP\RYHUWLPHWKHUHDUHDOVRFOHDUPRYHPHQWVWKDWGLIIHUEHWZHHQ
WKHWZRDXWRQRP\DUHDV)RUH[DPSOHDPRQJORZDFKLHYLQJFRXQWULHV%UD]LO&KLOHDQG
Mexico have seen strong reductions in course autonomy, but smaller reductions (or even
increases in hiring autonomy imilarly, among mediumachieving countries, reece,ortugal, and to a lesser extent Turkey have reduced course autonomy, but this is not
the case for hiring autonomy in ortugal and Turkey At a higher level of achievement,
ermany has increased school autonomy, particularly in course offerings, whereas
countries such as Australia, enmark, reat Britain, reland, and weden have all seen
slight decreases in the autonomy measures
16 See Appendix Table 2 or an overview o the answer options and a discussion on their comparability across thePISA waves.
Does School Autonomy Make Sense Everywhere? Panel Estimates from PISA | 11
7/27/2019 Does School Autonomy Make Sense Everywhere? Panel Estimates from PISA
http://slidepdf.com/reader/full/does-school-autonomy-make-sense-everywhere-panel-estimates-from-pisa 20/48
F i g u r e 2 : S c h o o l A u t o n o m y O v e r C o
u r s e s a n d O v e r H i r i n g ,
2 0 0 0 – 2
0 0 9
P I S A =
P r o g r a m m e o r I n t e r n a t i o n a l S t u d e n t A s s e s s m
e n t .
N o t e :
S t r a i g h t b l a c k l i n e s : a u t o n o m y i n d e c i d i n g w h i c h c o u r s e s a r e o f e r e d .
D a s h e d g r a y l i n e s : a u t o n o m y i n s e l e c t i n g t e a c h e r s o r h i r e .
O w
n d e p i c t i o n b a s e d o n
s c h o o l b a c k g r o u n d q u e s t i o n n a i r e s i n t h e P I S A t e s t s c o n d u c t e d i n 2 0 0 0 / 2 0 0 2 ,
2 0 0 3 ,
2 0 0 6
, a n d 2 0 0 9 .
S o u r c e
: A u t h o r s ' c a l c u l a t i o n s .
12 | ADB Economics Working Paper Series No. 296
7/27/2019 Does School Autonomy Make Sense Everywhere? Panel Estimates from PISA
http://slidepdf.com/reader/full/does-school-autonomy-make-sense-everywhere-panel-estimates-from-pisa 21/48
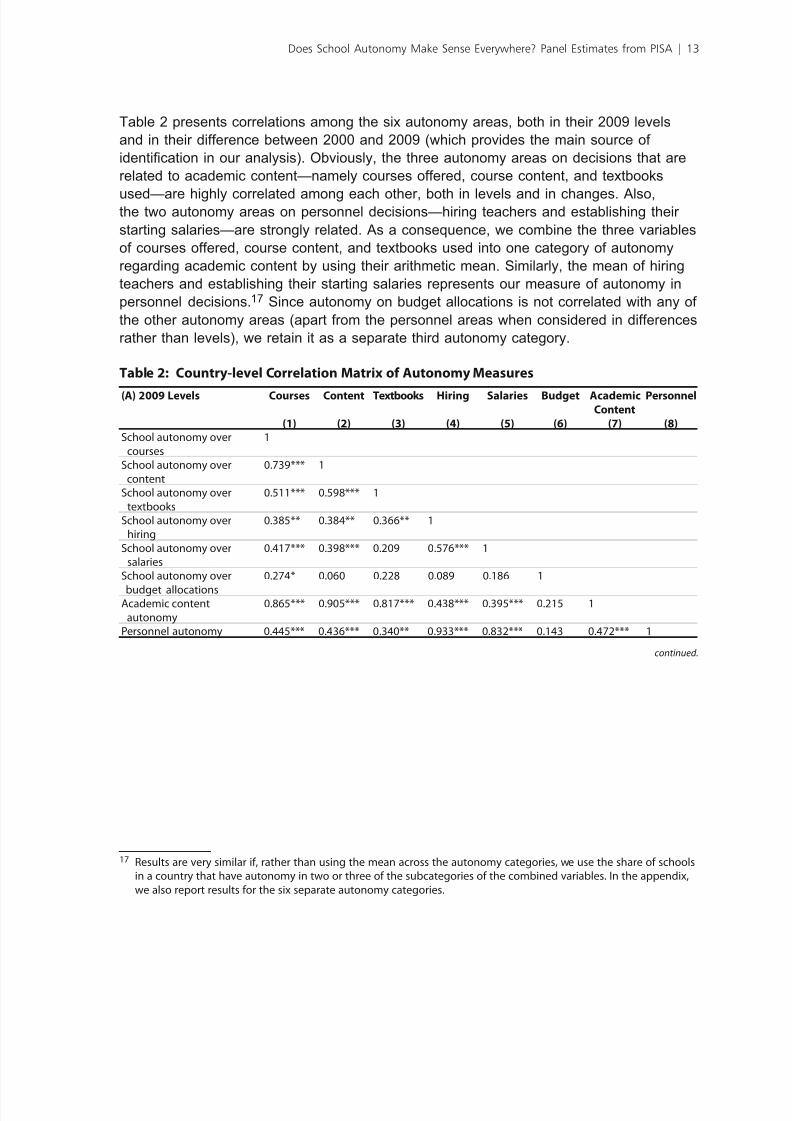
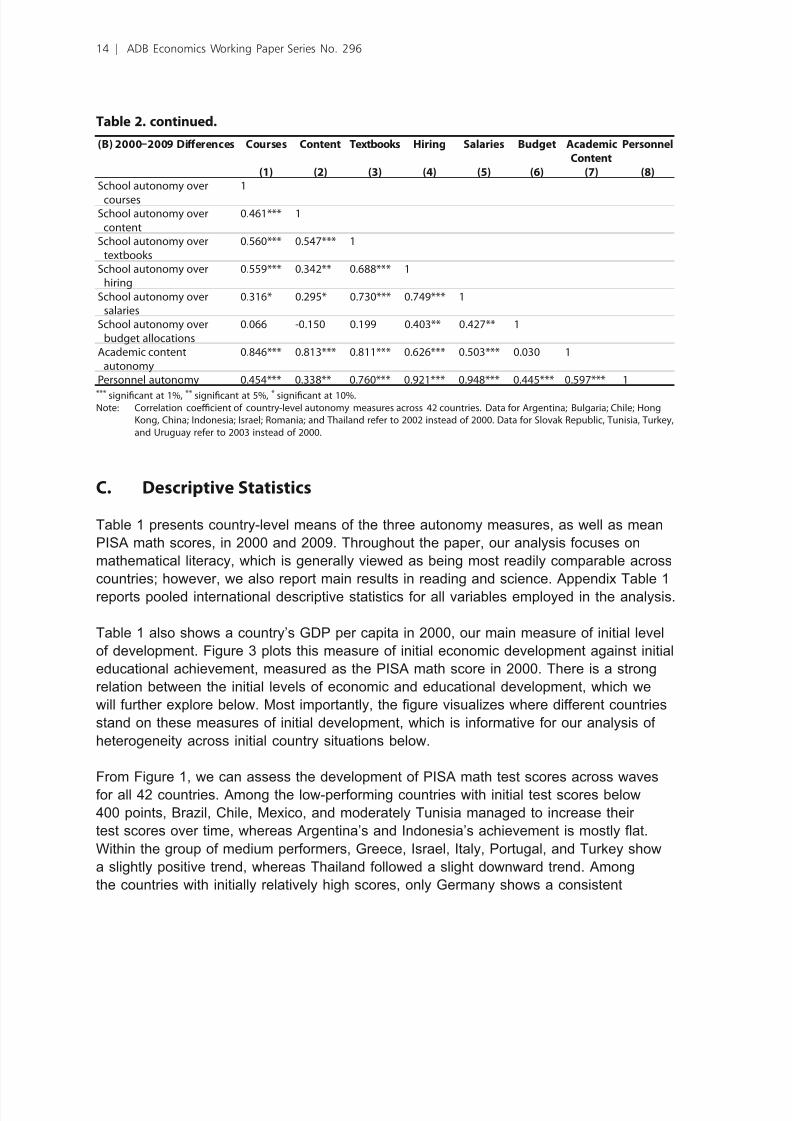
DEOHSUHVHQWVFRUUHODWLRQVDPRQJWKHVL[DXWRQRP\DUHDVERWKLQWKHLUOHYHOV
DQGLQWKHLUGLIIHUHQFHEHWZHHQDQGZKLFKSURYLGHVWKHPDLQVRXUFHRI
LGHQWL¿FDWLRQLQRXUDQDO\VLVEYLRXVO\WKHWKUHHDXWRQRP\DUHDVRQGHFLVLRQVWKDWDUH
related to academic content—namely courses offered, course content, and textbooks
used—are highly correlated among each other, both in levels and in changes Also,the two autonomy areas on personnel decisions—hiring teachers and establishing their
starting salaries—are strongly related As a consequence, we combine the three variables
of courses offered, course content, and textbooks used into one category of autonomy
regarding academic content by using their arithmetic mean imilarly, the mean of hiring
teachers and establishing their starting salaries represents our measure of autonomy in
personnel decisions17 ince autonomy on budget allocations is not correlated with any of
the other autonomy areas (apart from the personnel areas when considered in differences
rather than levels, we retain it as a separate third autonomy category
Table 2: Country-level Correlation Matrix o Autonomy Measures
(A) 2009 Levels Courses
(1)
Content
(2)
Textbooks
(3)
Hiring
(4)
Salaries
(5)
Budget
(6)
AcademicContent
(7)
Personnel
(8)School autonomy over
courses1
School autonomy overcontent
0.739*** 1
School autonomy overtextbooks
0.511*** 0.598*** 1
School autonomy overhiring
0.385** 0.384** 0.366** 1
School autonomy oversalaries
0.417*** 0.398*** 0.209 0.576*** 1
School autonomy over
budget allocations
0.274* 0.060 0.228 0.089 0.186 1
Academic contentautonomy
0.865*** 0.905*** 0.817*** 0.438*** 0.395*** 0.215 1
Personnel autonomy 0.445*** 0.436*** 0.340** 0.933*** 0.832*** 0.143 0.472*** 1
17 Results are very similar i, rather than using the mean across the autonomy categories, we use the share o schoolsin a country that have autonomy in two or three o the subcategories o the combined variables. In the appendix,we also report results or the six separate autonomy categories.
continued.
Does School Autonomy Make Sense Everywhere? Panel Estimates from PISA | 13
7/27/2019 Does School Autonomy Make Sense Everywhere? Panel Estimates from PISA
http://slidepdf.com/reader/full/does-school-autonomy-make-sense-everywhere-panel-estimates-from-pisa 22/48
Table 2. continued.
(B) 2000–2009 Diferences Courses
(1)
Content
(2)
Textbooks
(3)
Hiring
(4)
Salaries
(5)
Budget
(6)
Academic
Content
(7)
Personnel
(8)School autonomy over
courses
1
School autonomy overcontent
0.461*** 1
School autonomy overtextbooks
0.560*** 0.547*** 1
School autonomy overhiring
0.559*** 0.342** 0.688*** 1
School autonomy oversalaries
0.316* 0.295* 0.730*** 0.749*** 1
School autonomy overbudget allocations
0.066 -0.150 0.199 0.403** 0.427** 1
Academic contentautonomy
0.846*** 0.813*** 0.811*** 0.626*** 0.503*** 0.030 1
Personnel autonomy 0.454*** 0.338** 0.760*** 0.921*** 0.948*** 0.445*** 0.597*** 1
*** signifcant at 1%, ** signifcant at 5%, * signifcant at 10%.Note: Correlation coecient o country-level autonomy measures across 42 countries. Data or Argentina; Bulgaria; Chile; Hong
Kong, China; Indonesia; Israel; Romania; and Thailand reer to 2002 instead o 2000. Data or Slovak Republic, Tunisia, Turkey,and Uruguay reer to 2003 instead o 2000.
C. Descriptive Statistics
Table 1 presents countrylevel means of the three autonomy measures, as well as mean
36$PDWKVFRUHVLQDQGKURXJKRXWWKHSDSHURXUDQDO\VLVIRFXVHVRQ
mathematical literacy, which is generally viewed as being most readily comparable across
countries; however, we also report main results in reading and science Appendix Table 1
reports pooled international descriptive statistics for all variables employed in the analysis
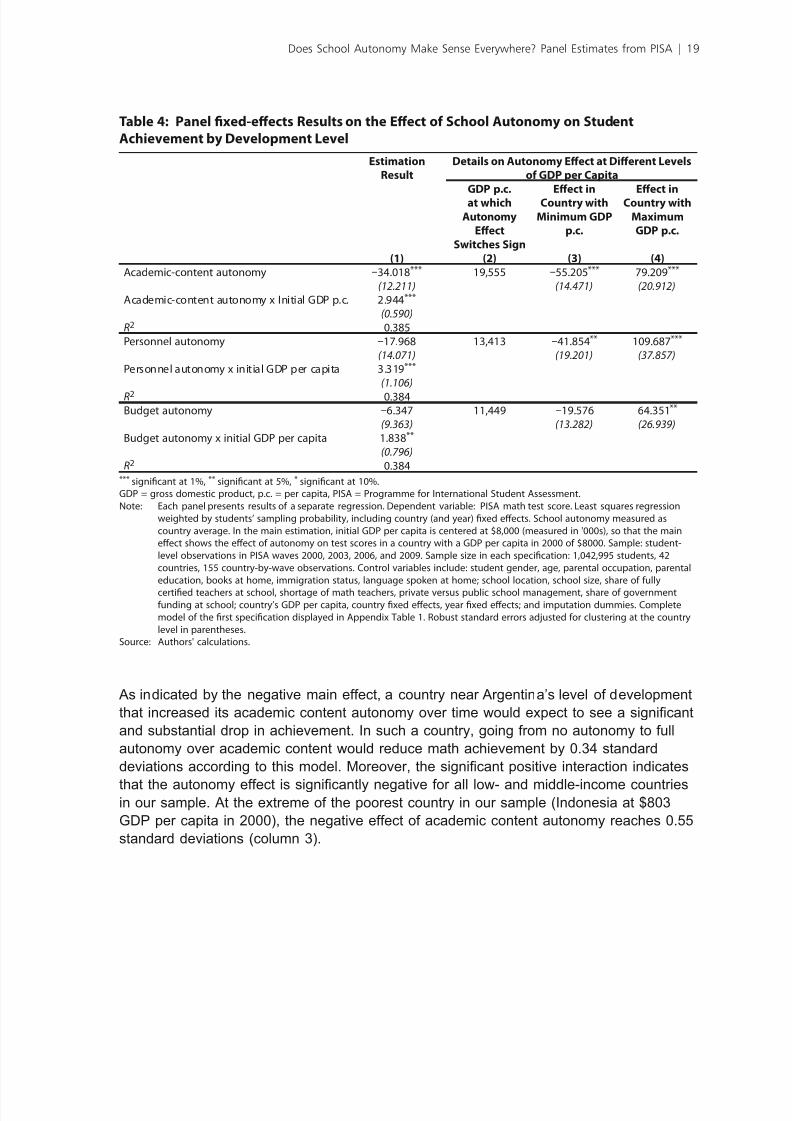
DEOHDOVRVKRZVDFRXQWU\¶V*'3SHUFDSLWDLQRXUPDLQPHDVXUHRILQLWLDOOHYHO
RIGHYHORSPHQW)LJXUHSORWVWKLVPHDVXUHRILQLWLDOHFRQRPLFGHYHORSPHQWDJDLQVWLQLWLDO
HGXFDWLRQDODFKLHYHPHQWPHDVXUHGDVWKH36$PDWKVFRUHLQKHUHLVDVWURQJ
relation between the initial levels of economic and educational development, which we
ZLOOIXUWKHUH[SORUHEHORZ0RVWLPSRUWDQWO\WKH¿JXUHYLVXDOL]HVZKHUHGLIIHUHQWFRXQWULHV
stand on these measures of initial development, which is informative for our analysis of
heterogeneity across initial country situations below
)URP)LJXUHZHFDQDVVHVVWKHGHYHORSPHQWRI36$PDWKWHVWVFRUHVDFURVVZDYHV
for all 42 countries Among the lowperforming countries with initial test scores below
SRLQWV%UD]LO&KLOH0H[LFRDQGPRGHUDWHO\XQLVLDPDQDJHGWRLQFUHDVHWKHLU
WHVWVFRUHVRYHUWLPHZKHUHDV$UJHQWLQD¶VDQGQGRQHVLD¶VDFKLHYHPHQWLVPRVWO\ÀDW
ithin the group of medium performers, reece, srael, taly, ortugal, and Turkey show
a slightly positive trend, whereas Thailand followed a slight downward trend Among
the countries with initially relatively high scores, only ermany shows a consistent
14 | ADB Economics Working Paper Series No. 296
7/27/2019 Does School Autonomy Make Sense Everywhere? Panel Estimates from PISA
http://slidepdf.com/reader/full/does-school-autonomy-make-sense-everywhere-panel-estimates-from-pisa 23/48
upward trend, whereas reat Britain and apan, and to a lesser extent Australia, Austria,
enmark, reland, ew ealand, and weden, show a downward trend The other
FRXQWULHVDUHPRVWO\ÀDW
&RPSDULQJWKHVHDFKLHYHPHQWWUHQGVWRWKHDXWRQRP\WUHQGVVHHQLQ)LJXUHWKHUHare many examples where the combined achievement and autonomy trends are
consistent with increased autonomy, particularly over academic content, being bad in
ORZSHUIRUPLQJEXWJRRGLQKLJKSHUIRUPLQJFRXQWULHV)RUH[DPSOHVWDUWLQJDWDORZ
level of achievement, the increasing achievement levels of Brazil, Chile, and Mexico
are accompanied by reductions in autonomy of their schools in particular over course
offerings imilarly, reece, ortugal, and Turkey have reduced their course autonomy
DQGVOLJKWO\LQFUHDVHGWKHLUDFKLHYHPHQW%\FRQWUDVWKDLODQG²ZKLFKKDGXLWHÀDW
DXWRQRP\²VDZPRVWO\ÀDWDFKLHYHPHQW)LQDOO\DWDKLJKHUOHYHORILQLWLDODFKLHYHPHQW
ermany’s increased autonomy, particularly over course offerings, goes along with
consistent increases in achievement Australia, enmark, reat Britain, reland, and
weden all slightly reduced their autonomy, which is mirrored by slightly decreasingachievement
IV. Empirical Model
To test the effect of autonomy on student achievement and its dependence on a country’s
development level more formally, we make use of the education production function
framework introduced above The empirical issues can be most easily seen from a simple
linear formulation, which now introduces a time dimension to the analysis:
T I F S cti ct F cti S cti cti
= + + +α β β ε (
where achievement T in country c at time t for student i is a function of a country’s
institutions I (here autonomy, the inputs from a student’s family (F and from schools
(S, and an error term, Hcti e start our exposition with a linearized and additive version
of the model, but our analyses below will test for rich multiplicative interactions of the
institutional effect with other input factors ur interest is estimating D = ∂ ∂T I / , the
LPSDFWRIORFDODXWRQRP\RQDFKLHYHPHQWKROGLQJFRQVWDQWRWKHULQSXWV)RUWKLVZHKDYH
the panel data from A that has individuallevel data about T, F, and S and data about
institutions I aggregated at the country level
ur approach to identify the impact of institutions is best seen by expanding the error
term:
ε η η ηcti c ct cti
= + + (4
Does School Autonomy Make Sense Everywhere? Panel Estimates from PISA | 15
7/27/2019 Does School Autonomy Make Sense Everywhere? Panel Estimates from PISA
http://slidepdf.com/reader/full/does-school-autonomy-make-sense-everywhere-panel-estimates-from-pisa 24/48
where Șc
is a timeinvariant set of cultural and educational factors for country c (such asawareness of the importance of education, the commitment of families to their children’seducation, or more generally the state of development of societal and economic institutions;Ș
ct is a timevarying set of aggregate educational factors for country c (such as changes in
spending levels or private involvement; and Șcti LVDQLQGLYLGXDOVSHFL¿FWLPHYDU\LQJHUURUKHNH\WRLGHQWL¿FDWLRQRIĮ , the parameter of interest, is that Hcti is orthogonal to the
included explanatory factors and, importantly, to the measure of local autonomy The
IRUPXODWLRQLQHXDWLRQVKRZVWKHPDLQHOHPHQWVRIRXUDSSURDFK)LUVWDWWKH
LQGLYLGXDOVWXGHQWDQGVFKRROOHYHOWKHUHDUHFRQFHUQVDERXWVHOHFWLRQELDVUHÀHFWLQJ
unmeasured attributes of schools or students in circumstances with varying local decision
making f, for example, particularly good students are attracted to schools with more
local autonomy, Șcti would tend to be correlated with I , leading to bias in the estimation
of Į But, by aggregating over all schools in the country and measuring autonomy by the
proportion of schools with local autonomy, we eliminate the selection bias from school
choice The aggregation also allows us to capture any general equilibrium effect whereby,
for example, autonomy of one school may elicit competitive responses from schools thatdo not have autonomy themselves
6HFRQGZLWKWKHSDQHOGDWDZHFDQLQFOXGHFRXQWU\¿[HGHIIHFWV ȝ c , which effectively
HOLPLQDWHDQ\VWDEOHFRXQWU\VSHFL¿FIDFWRUVFRQWDLQHGLQȘc ,19
T I F S cti ct F cti S cti c t cti
= + + + + +α β β μ μ ε (
By implication, the estimation of Įis based upon variations in autonomy over time, since
WLPHLQYDULDQWLQVWLWXWLRQDOIHDWXUHVDUHDEVRUEHGLQWRWKHFRXQWU\¿[HGHIIHFWKHUHOHYDQW
variation with which we estimate Į is withincountry changes for our sample of A
countries
KHPRVWVLJQL¿FDQWUHPDLQLQJLVVXHLVZKHWKHUWKHUHDUHWLPHYDU\LQJFRXQWU\IDFWRUV
(Șct that are correlated with the pattern of local autonomy in the country The underlying
identifying assumption is that there are no educationally important timevarying country
factors that are correlated with variation in the institutional input, I e will partially test
this by including several additional timevarying factors of countries’ education systems,
C ct
, in the analysis:
T I F S C cti ct F cti S cti C ct c t cti = + + + + + +α β β β μ μ ε (
ther details are also important n order to obtain the best estimates of Į , we attemptto eliminate as much other variation in test scores as possible by estimating the ȕ
parameters for family and school effects on a large set of individual measures and by
conducting the estimation at the individual student level Additionally, the limited variation
LQLQVWLWXWLRQDOIDFWRUV±ZKLFKRFFXUVDWWKHFRXQWU\OHYHO²PHDQVWKDWLWLVKDUGWR
18 These concerns are central to the interpretation o most within-country analyses o decentralization.19 The estimation also includes time fxed eects to allow or any common shocks across waves.
16 | ADB Economics Working Paper Series No. 296
7/27/2019 Does School Autonomy Make Sense Everywhere? Panel Estimates from PISA
http://slidepdf.com/reader/full/does-school-autonomy-make-sense-everywhere-panel-estimates-from-pisa 25/48
simultaneously estimate measures of alternative forms of local decision making As a
result, most of our analysis sequentially estimates models with combined autonomy
PHDVXUHVDOWKRXJKZHDOVRUHSRUWVSHFL¿FDWLRQVWKDWLQFOXGHVHYHUDODXWRQRP\PHDVXUHV
together
$FHQWUDOFRPSRQHQWRIWKHDQDO\VLVLVWKHSRVVLELOLW\RIVLJQL¿FDQW LQWHUDFWLRQVRI
LQVWLWXWLRQDOIDFWRUVZLWKRWKHULQVWLWXWLRQVRUFRXQWU\VSHFL¿FHOHPHQWVVXFKDVVFKRRO
accountability systems or level of capacity and stage of development e pursue this
parametrically by interacting I WKHVSHFL¿FPHDVXUHRIDXWRQRP\LQHDFKPRGHOZLWKWKH
initial level of development (of the country and/or educational system, Dc :
T I I D F S C cti ct ct c F cti S cti C ct c t cti
= + ×( ) + + + + + +α α β β β μ μ ε 1 2 (7
QWKLVPRGHOZKLFKUHSUHVHQWVRXUPDLQVSHFL¿FDWLRQWKHHIIHFWRIDXWRQRP\UHIRUPVLV
allowed to differ depending on the surrounding conditions captured by Dc e can then
WHVWRXUPDLQFRQFHSWXDOSURSRVLWLRQWKDWDXWRQRP\LVEHQH¿FLDOIRUVWXGHQWDFKLHYHPHQWin otherwise wellfunctioning systems but detrimental in dysfunctional systems
V. Results
A. Main Results
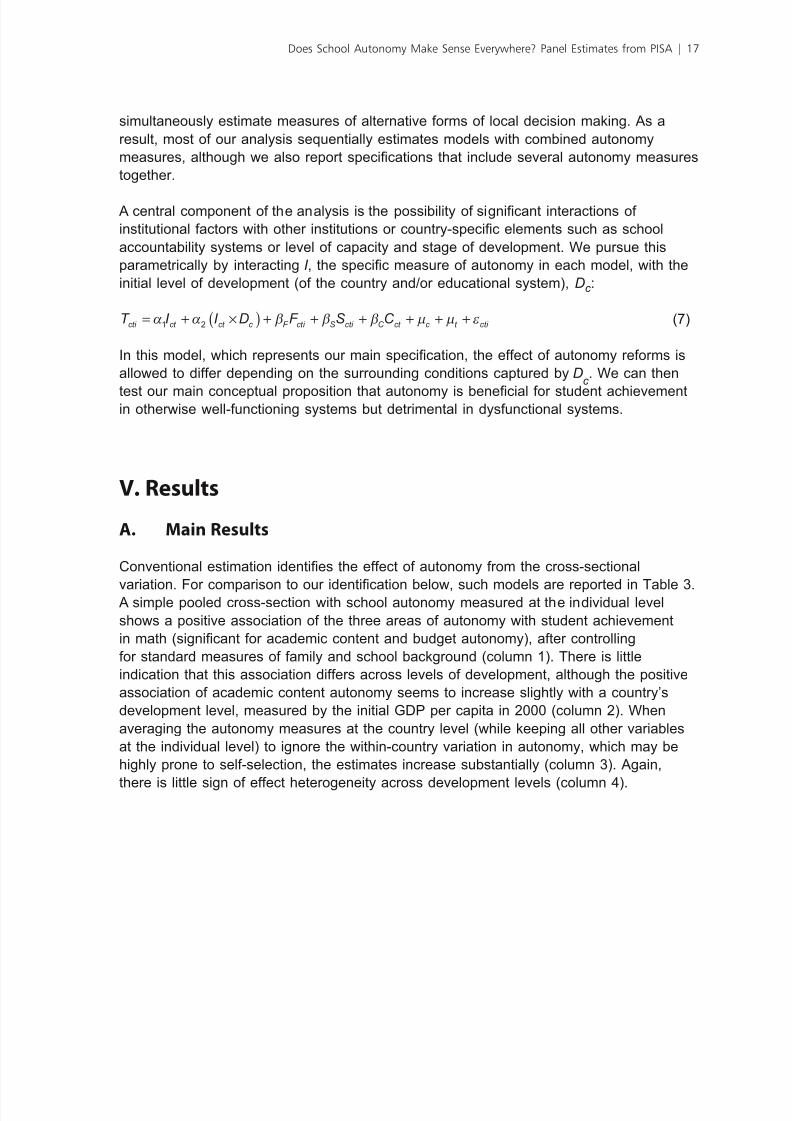
&RQYHQWLRQDOHVWLPDWLRQLGHQWL¿HVWKHHIIHFWRIDXWRQRP\IURPWKHFURVVVHFWLRQDO
YDULDWLRQ)RUFRPSDULVRQWRRXULGHQWL¿FDWLRQEHORZVXFKPRGHOVDUHUHSRUWHGLQDEOH A simple pooled crosssection with school autonomy measured at the individual level
shows a positive association of the three areas of autonomy with student achievement
LQPDWKVLJQL¿FDQWIRUDFDGHPLFFRQWHQWDQGEXGJHWDXWRQRP\DIWHUFRQWUROOLQJ
for standard measures of family and school background (column 1 There is little
indication that this association differs across levels of development, although the positive
association of academic content autonomy seems to increase slightly with a country’s
GHYHORSPHQWOHYHOPHDVXUHGE\WKHLQLWLDO*'3SHUFDSLWDLQFROXPQKHQ
averaging the autonomy measures at the country level (while keeping all other variables
at the individual level to ignore the withincountry variation in autonomy, which may be
highly prone to selfselection, the estimates increase substantially (column Again,
there is little sign of effect heterogeneity across development levels (column 4
Does School Autonomy Make Sense Everywhere? Panel Estimates from PISA | 17
7/27/2019 Does School Autonomy Make Sense Everywhere? Panel Estimates from PISA
http://slidepdf.com/reader/full/does-school-autonomy-make-sense-everywhere-panel-estimates-from-pisa 26/48
Table 3: Conventional Cross-sectional Estimation o the Efect o School Autonomy onStudent Achievement
Autonomy Measured at Level:
Country Fixed Efects:
School
No
Country
No
Country
Yes(1) (2) (3) (4) (5)
Academic content autonomy 20.713*** 13.539* 47.201*** 37.114** –20.556(6.181) (7.455) (11.257) (14.076) (12.627)
Academic content autonomy x initial GDP p.c. 0.771* 0.908(0.455) (0.616)
R2 0.312 0.315 0.319 0.321 0.384Personnel autonomy 9.640 10.479 24.701* 24.913* -0.180
(7.015) (7.586) (13.492) (13.313) (11.708)
Personnel autonomy x initial GDP per capita -0.103 –0.024(0.535) (1.055)
R2 0.310 0.310 0.312 0.312 0.384Budget autonomy 7.549* 5.411 32.987 31.239 –7.163
(4.248) (4.694) (25.976) (25.228) (10.162)
Budget autonomy x initial GDP per capita 0.493 1.127*(0.336) (0.631)
R2 0.310 0.310 0.311 0.313 0.384*** signifcant at 1%, ** signifcant at 5%, * signifcant at 10%.GDP = gross domestic product, p.c. = per capita, PISA = Programme or International Student Assessment.Note: Each column-by-panel presents results o a separate regression. Dependent variable: PISA math test score. Least squares
regression weighted by students’ sampling probability. In columns 2 and 4, initial GDP per capita is centered at $8,000(measured in '000s), so that the main eect shows the eect o autonomy on test scores in a country with a GDP percapita in 2000 o $8,000. Sample: student-level observations in PISA waves 2000, 2003, 2006, and 2009. Sample size ineach specifcation: 1,042,995 students, 42 countries, 155 country-by-wave observations. Control variables include: studentgender, age, parental occupation, parental education, books at home, immigration status, language spoken at home;school location, school size, share o ully certifed teachers at school, shortage o math teachers, private versus publicschool management, share o government unding at school; country’s GDP per capita, year fxed eects; and imputationdummies. Robust standard errors adjusted or clustering at the country level in parentheses.
Source: Authors' calculations.
+RZHYHUUHVXOWVFKDQJHGUDPDWLFDOO\ZKHQFRQVLVWHQWZLWKRXULGHQWL¿FDWLRQVWUDWHJ\ZH
focus on withincountry changes over time The crosssectional association vanishes, with
SRLQWHVWLPDWHVWXUQLQJQHJDWLYHRQFHFRXQWU\¿[HGHIIHFWVDUHDGGHGFROXPQZKHUH
WKHDXWRQRP\HIIHFWLVQRZLGHQWL¿HGIURPDJJUHJDWHZLWKLQFRXQWU\YDULDWLRQRYHUWLPH
till, this average effect may hide substantial heterogeneity of the autonomy effect across
countries
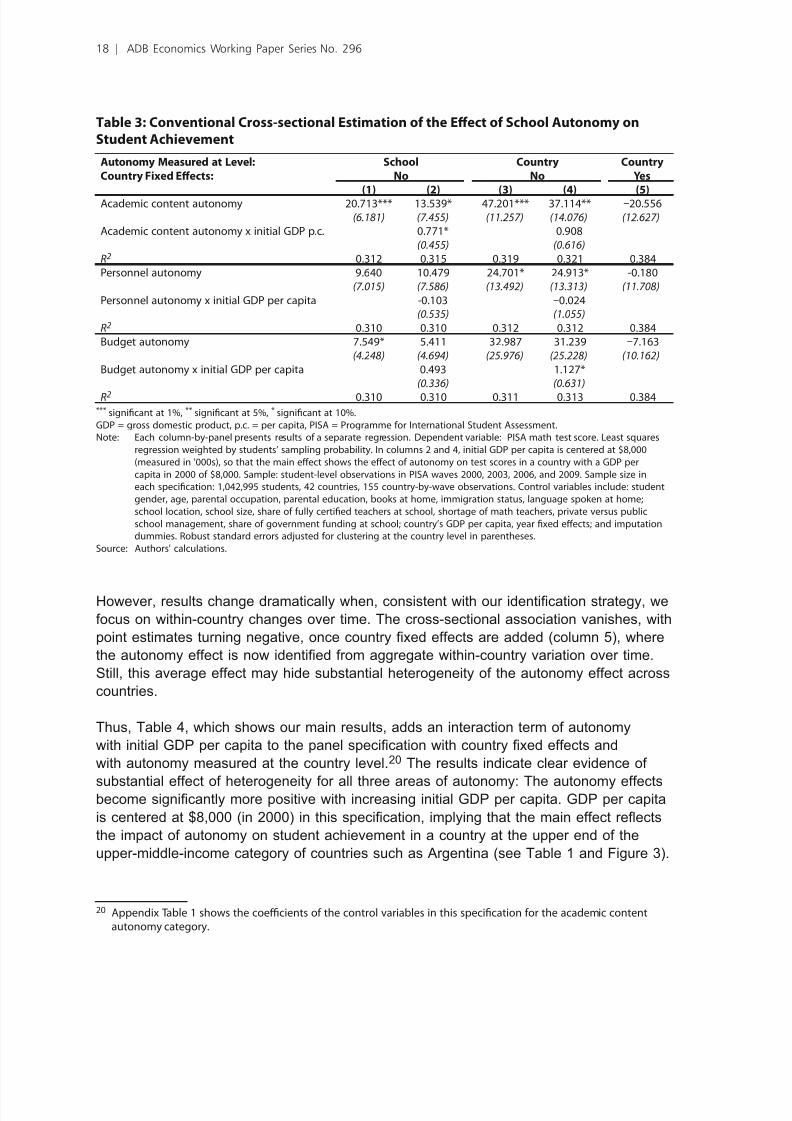
Thus, Table 4, which shows our main results, adds an interaction term of autonomy
ZLWKLQLWLDO*'3SHUFDSLWDWRWKHSDQHOVSHFL¿FDWLRQZLWKFRXQWU\¿[HGHIIHFWVDQG
with autonomy measured at the country level The results indicate clear evidence of
substantial effect of heterogeneity for all three areas of autonomy: The autonomy effectsEHFRPHVLJQL¿FDQWO\PRUHSRVLWLYHZLWKLQFUHDVLQJLQLWLDO*'3SHUFDSLWD*'3SHUFDSLWD
LVFHQWHUHGDWLQLQWKLVVSHFL¿FDWLRQLPSO\LQJWKDWWKHPDLQHIIHFWUHÀHFWV
the impact of autonomy on student achievement in a country at the upper end of the
XSSHUPLGGOHLQFRPHFDWHJRU\RIFRXQWULHVVXFKDV$UJHQWLQDVHHDEOHDQG)LJXUH
20 Appendix Table 1 shows the coecients o the control variables in this specifcation or the academic contentautonomy category.
18 | ADB Economics Working Paper Series No. 296
7/27/2019 Does School Autonomy Make Sense Everywhere? Panel Estimates from PISA
http://slidepdf.com/reader/full/does-school-autonomy-make-sense-everywhere-panel-estimates-from-pisa 27/48
Table 4: Panel xed-efects Results on the Efect o School Autonomy on Student
Achievement by Development Level
EstimationResult
(1)
Details on Autonomy Efect at Diferent Levelso GDP per Capita
GDP p.c.at which
AutonomyEfect
Switches Sign
Efect inCountry with
Minimum GDPp.c.
Efect inCountry with
MaximumGDP p.c.
(2) (3) (4)
Academic-content autonomy –34.018*** 19,555 –55.205*** 79.209***
(12.211) (14.471) (20.912)
Academic-content autonomy x Initial GDP p.c. 2.944***
(0.590)
R2 0.385Personnel autonomy –17.968 13,413 –41.854** 109.687***
(14.071) (19.201) (37.857)
Personnel autonomy x initial GDP per capita 3.319***
(1.106)
R2 0.384Budget autonomy –6.347 11,449 –19.576 64.351**
(9.363) (13.282) (26.939)
Budget autonomy x initial GDP per capita 1.838**
(0.796)
R2 0.384*** signifcant at 1%, ** signifcant at 5%, * signifcant at 10%.GDP = gross domestic product, p.c. = per capita, PISA = Programme or International Student Assessment.Note: Each panel presents results o a separate regression. Dependent variable: PISA math test score. Least squares regression
weighted by students’ sampling probability, including country (and year) fxed eects. School autonomy measured ascountry average. In the main estimation, initial GDP per capita is centered at $8,000 (measured in '000s), so that the maineect shows the eect o autonomy on test scores in a country with a GDP per capita in 2000 o $8000. Sample: student-level observations in PISA waves 2000, 2003, 2006, and 2009. Sample size in each specifcation: 1,042,995 students, 42countries, 155 country-by-wave observations. Control variables include: student gender, age, parental occupation, parentaleducation, books at home, immigration status, language spoken at home; school location, school size, share o ully
certifed teachers at school, shortage o math teachers, private versus public school management, share o governmentunding at school; country’s GDP per capita, country fxed eects, year fxed eects; and imputation dummies. Completemodel o the frst specifcation displayed in Appendix Table 1. Robust standard errors adjusted or clustering at the countrylevel in parentheses.
Source: Authors' calculations.
As indicated by the negative main effect, a country near Argentina’s level of development
WKDWLQFUHDVHGLWVDFDGHPLFFRQWHQWDXWRQRP\RYHUWLPHZRXOGH[SHFWWRVHHDVLJQL¿FDQW
and substantial drop in achievement n such a country, going from no autonomy to full
DXWRQRP\RYHUDFDGHPLFFRQWHQWZRXOGUHGXFHPDWKDFKLHYHPHQWE\VWDQGDUG
GHYLDWLRQVDFFRUGLQJWRWKLVPRGHO0RUHRYHUWKHVLJQL¿FDQWSRVLWLYHLQWHUDFWLRQLQGLFDWHV
WKDWWKHDXWRQRP\HIIHFWLVVLJQL¿FDQWO\QHJDWLYHIRUDOOORZDQGPLGGOHLQFRPHFRXQWULHVLQRXUVDPSOH$WWKHH[WUHPHRIWKHSRRUHVWFRXQWU\LQRXUVDPSOHQGRQHVLDDW
*'3SHUFDSLWDLQWKHQHJDWLYHHIIHFWRIDFDGHPLFFRQWHQWDXWRQRP\UHDFKHV
standard deviations (column
Does School Autonomy Make Sense Everywhere? Panel Estimates from PISA | 19
7/27/2019 Does School Autonomy Make Sense Everywhere? Panel Estimates from PISA
http://slidepdf.com/reader/full/does-school-autonomy-make-sense-everywhere-panel-estimates-from-pisa 28/48
Figure 3: Development Level and PISA Perormance, 2000
NZLKOR
CZESVK HUNPOLURY
ISR ITA
ESP
PRT
LVARUS
TUR THARO
ARGMEXCHL
TUNIDN
GRC
LUX
NORUSA CHE
JPN
HKGGBR
ISLDNK
SWE
IRLDEU BEL
AUT NLDCANFINAUS
BRA
PISA math test score
350 400 450 500 550
50,000
40,000
30,000
20,000
10,000
0
G D P p e r c a p i t a
EGR
PISA = Programme or International Student Assessment.Note: Test scores or Argentina; Bulgaria; Chile; Hong Kong, China; Indonesia; Israel; Romania; and Thailand reer to 2002. Test
scores or Slovak Republic, Tunisia, Turkey, and Uruguay reer to 2003.Source: Authors' calculations.
%\FRQWUDVWWKHHIIHFWRIDFDGHPLFFRQWHQWDXWRQRP\WXUQVVLJQL¿FDQWO\SRVLWLYHLQPRVW
RIWKHKLJKLQFRPHFRXQWULHV)RUWKHULFKHVWFRXQWU\LQRXUVDPSOHX[HPERXUJDW
*'3SHUFDSLWDLQWKHSRVLWLYHHIIHFWRIDFDGHPLFFRQWHQWDXWRQRP\LVDV
ODUJHDVVWDQGDUGGHYLDWLRQVFROXPQKHOHYHORI*'3SHUFDSLWDDWZKLFK
the autonomy effect switches its sign from negative to positive is 19, (column 2 As
is evident from Appendix Table , this pattern holds separately for all three categories of
autonomy—course offerings, course content, and textbooks—contained in the aggregated
measure of academic content autonomy in this table
As the lower two panels show, the basic pattern of results is quite similar in the other
two areas of autonomy, personnel and budget autonomy The autonomy effect increases
VLJQL¿FDQWO\ZLWKLQLWLDO*'3SHUFDSLWDDQGWKHUHLVDODUJHDQGVLJQL¿FDQWSRVLWLYH
autonomy effect for rich countries The only difference from the academic content
autonomy category is that the negative effect in the categories of personnel and budget
autonomy is smaller and not statistically distinguishable from zero at the upper end of the
XSSHUPLGGOHLQFRPHFRXQWULHV)RUEXGJHWDXWRQRP\WKHQHJDWLYHDXWRQRP\HIIHFWGRHV
QRWUHDFKVWDWLVWLFDOVLJQL¿FDQFHIRUHYHQWKHSRRUHVWFRXQWU\LQRXUVDPSOH
20 | ADB Economics Working Paper Series No. 296
7/27/2019 Does School Autonomy Make Sense Everywhere? Panel Estimates from PISA
http://slidepdf.com/reader/full/does-school-autonomy-make-sense-everywhere-panel-estimates-from-pisa 29/48
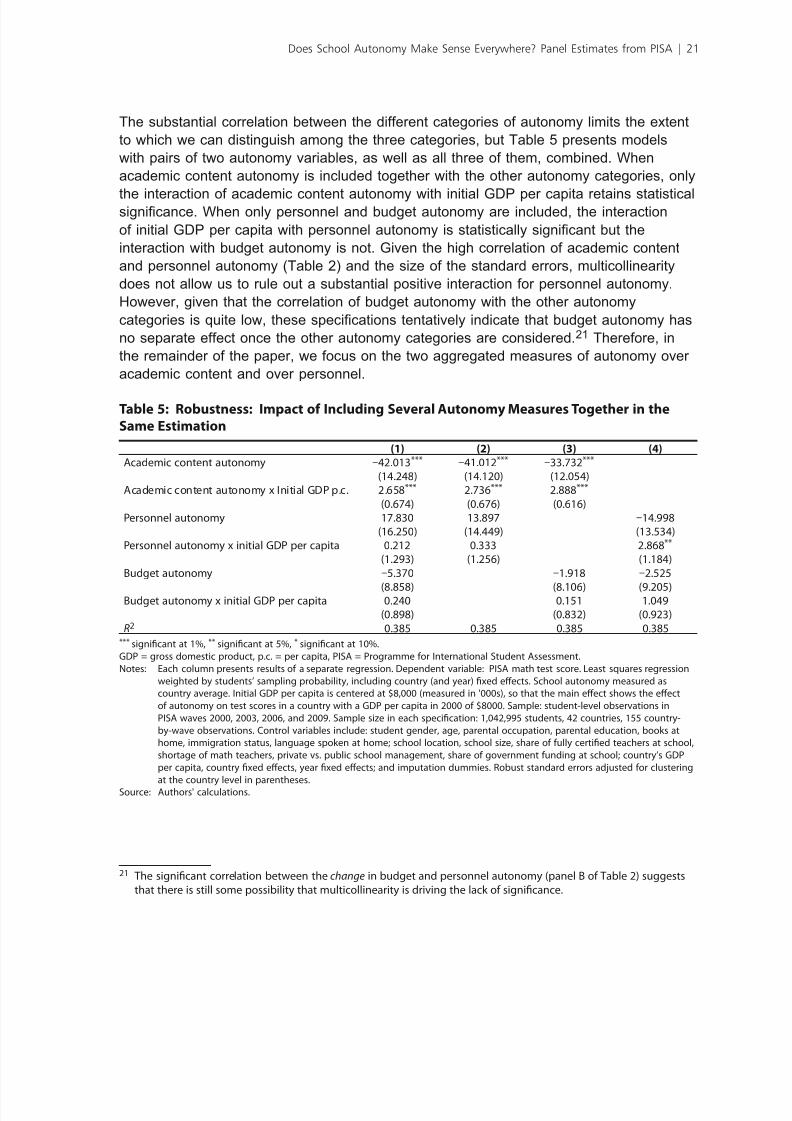
The substantial correlation between the different categories of autonomy limits the extent
to which we can distinguish among the three categories, but Table presents models
with pairs of two autonomy variables, as well as all three of them, combined hen
academic content autonomy is included together with the other autonomy categories, only
the interaction of academic content autonomy with initial per capita retains statisticalVLJQL¿FDQFHKHQRQO\SHUVRQQHODQGEXGJHWDXWRQRP\DUHLQFOXGHGWKHLQWHUDFWLRQ
RILQLWLDO*'3SHUFDSLWDZLWKSHUVRQQHODXWRQRP\LVVWDWLVWLFDOO\VLJQL¿FDQWEXWWKH
interaction with budget autonomy is not iven the high correlation of academic content
and personnel autonomy (Table 2 and the size of the standard errors, multicollinearity
does not allow us to rule out a substantial positive interaction for personnel autonomy
owever, given that the correlation of budget autonomy with the other autonomy
FDWHJRULHVLVXLWHORZWKHVHVSHFL¿FDWLRQVWHQWDWLYHO\LQGLFDWHWKDWEXGJHWDXWRQRP\KDV
no separate effect once the other autonomy categories are considered21 Therefore, in
the remainder of the paper, we focus on the two aggregated measures of autonomy over
academic content and over personnel
Table 5: Robustness: Impact o Including Several Autonomy Measures Together in theSame Estimation
(1) (2) (3) (4)Academic content autonomy –42.013*** –41.012*** –33.732***
(14.248) (14.120) (12.054)Academic content autonomy x Initial GDP p.c. 2.658*** 2.736*** 2.888***
(0.674) (0.676) (0.616)Personnel autonomy 17.830 13.897 –14.998
(16.250) (14.449) (13.534)Personnel autonomy x initial GDP per capita 0.212 0.333 2.868**
(1.293) (1.256) (1.184)Budget autonomy –5.370 –1.918 –2.525
(8.858) (8.106) (9.205)Budget autonomy x initial GDP per capita 0.240 0.151 1.049
(0.898) (0.832) (0.923)R2 0.385 0.385 0.385 0.385
*** signifcant at 1%, ** signifcant at 5%, * signifcant at 10%.GDP = gross domestic product, p.c. = per capita, PISA = Programme or International Student Assessment.Notes: Each column presents results o a separate regression. Dependent variable: PISA math test score. Least squares regression
weighted by students’ sampling probability, including country (and year) fxed eects. School autonomy measured ascountry average. Initial GDP per capita is centered at $8,000 (measured in '000s), so that the main eect shows the eecto autonomy on test scores in a country with a GDP per capita in 2000 o $8000. Sample: student-level observations inPISA waves 2000, 2003, 2006, and 2009. Sample size in each specifcation: 1,042,995 students, 42 countries, 155 country-by-wave observations. Control variables include: student gender, age, parental occupation, parental education, books athome, immigration status, language spoken at home; school location, school size, share o ully certifed teachers at school,shortage o math teachers, private vs. public school management, share o government unding at school; country’s GDPper capita, country fxed eects, year fxed eects; and imputation dummies. Robust standard errors adjusted or clusteringat the country level in parentheses.
Source: Authors' calculations.
21 The signifcant correlation between the change in budget and personnel autonomy (panel B o Table 2) suggeststhat there is still some possibility that multicollinearity is driving the lack o signifcance.
Does School Autonomy Make Sense Everywhere? Panel Estimates from PISA | 21
7/27/2019 Does School Autonomy Make Sense Everywhere? Panel Estimates from PISA
http://slidepdf.com/reader/full/does-school-autonomy-make-sense-everywhere-panel-estimates-from-pisa 30/48
B. Robustness Tests
6HYHUDOH[WHQGHGWHVWVFRQ¿UPWKHUREXVWQHVVRIRXUPDLQ¿QGLQJKHYDULRXV
PRGL¿FDWLRQVIRUPHDVXUHPHQWLVVXHVDQGHVWLPDWLRQVDPSOHVOHDYHRXUEDVLF¿QGLQJV
intact
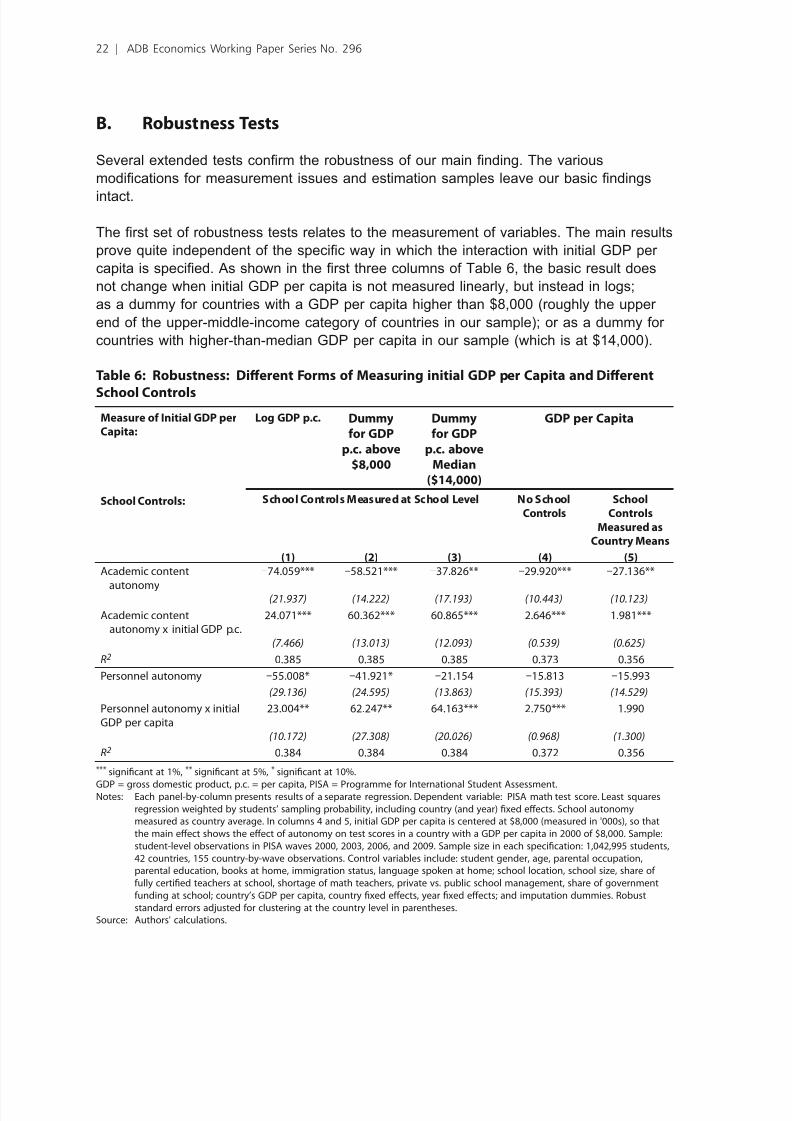
KH¿UVWVHWRIUREXVWQHVVWHVWVUHODWHVWRWKHPHDVXUHPHQWRIYDULDEOHVKHPDLQUHVXOWV
SURYHXLWHLQGHSHQGHQWRIWKHVSHFL¿FZD\LQZKLFKWKHLQWHUDFWLRQZLWKLQLWLDO*'3SHU
FDSLWDLVVSHFL¿HG$VVKRZQLQWKH¿UVWWKUHHFROXPQVRIDEOHWKHEDVLFUHVXOWGRHV
not change when initial per capita is not measured linearly, but instead in logs;
DVDGXPP\IRUFRXQWULHVZLWKD*'3SHUFDSLWDKLJKHUWKDQURXJKO\WKHXSSHU
end of the uppermiddleincome category of countries in our sample; or as a dummy for
FRXQWULHVZLWKKLJKHUWKDQPHGLDQ*'3SHUFDSLWDLQRXUVDPSOHZKLFKLVDW
Table 6: Robustness: Diferent Forms o Measuring initial GDP per Capita and Diferent
School Controls
Measure o Initial GDP perCapita:
School Controls:
Log GDP p.c. Dummyor GDP
p.c. above$8,000
Dummyor GDP
p.c. aboveMedian
($14,000)
GDP per Capita
School Controls Measured at School Level No School
Controls
School
Controls
Measured asCountry Means
(1) (2) (3) (4) (5)Academic content
autonomy
–74.059*** –58.521*** –37.826** –29.920*** –27.136**
(21.937) (14.222) (17.193) (10.443) (10.123)
Academic contentautonomy x initial GDP p.c.
24.071*** 60.362*** 60.865*** 2.646*** 1.981***
(7.466) (13.013) (12.093) (0.539) (0.625)
R2 0.385 0.385 0.385 0.373 0.356
Personnel autonomy –55.008* –41.921* –21.154 –15.813 –15.993
(29.136) (24.595) (13.863) (15.393) (14.529)
Personnel autonomy x initialGDP per capita
23.004** 62.247** 64.163*** 2.750*** 1.990
(10.172) (27.308) (20.026) (0.968) (1.300)
R2 0.384 0.384 0.384 0.372 0.356
*** signifcant at 1%, ** signifcant at 5%, * signifcant at 10%.
GDP = gross domestic product, p.c. = per capita, PISA = Programme or International Student Assessment.Notes: Each panel-by-column presents results o a separate regression. Dependent variable: PISA math test score. Least squares
regression weighted by students’ sampling probability, including country (and year) fxed eects. School autonomymeasured as country average. In columns 4 and 5, initial GDP per capita is centered at $8,000 (measured in '000s), so thatthe main eect shows the eect o autonomy on test scores in a country with a GDP per capita in 2000 o $8,000. Sample:student-level observations in PISA waves 2000, 2003, 2006, and 2009. Sample size in each specifcation: 1,042,995 students,42 countries, 155 country-by-wave observations. Control variables include: student gender, age, parental occupation,parental education, books at home, immigration status, language spoken at home; school location, school size, share o ully certifed teachers at school, shortage o math teachers, private vs. public school management, share o governmentunding at school; country’s GDP per capita, country fxed eects, year fxed eects; and imputation dummies. Robuststandard errors adjusted or clustering at the country level in parentheses.
Source: Authors' calculations.
22 | ADB Economics Working Paper Series No. 296
7/27/2019 Does School Autonomy Make Sense Everywhere? Panel Estimates from PISA
http://slidepdf.com/reader/full/does-school-autonomy-make-sense-everywhere-panel-estimates-from-pisa 31/48
XUPDLQPRGHOLQFOXGHVPHDVXUHVRIVFKRROFKDUDFWHULVWLFVEXWWKH¿QDOFROXPQVRI
DEOHVKRZWKDWUHVXOWVDUHUREXVWWRDOWHUQDWLYHWUHDWPHQWVRIVFKRROFRQWUROV)LUVW
giving autonomy to schools may mean that schools use their autonomy to alter other
school characteristics, such as reducing the school size or raising teacher education
requirements uch changes would thus be channels through which school autonomyaffects student outcomes n this perspective, these school measures should not be
controlled for in the estimation As is evident in column 4, leaving the schoollevel
variables out of our basic model does not affect our qualitative results
econd, there may be a concern that other school reforms may have coincided with the
autonomy reforms that identify our main result To capture such other reforms, column
includes all school variables measured as country averages, aggregating them to
the same level at which the autonomy variables are measured espite concerns with
statistical power with a large number of countrylevel variables, the qualitative results for
autonomy again remain the same
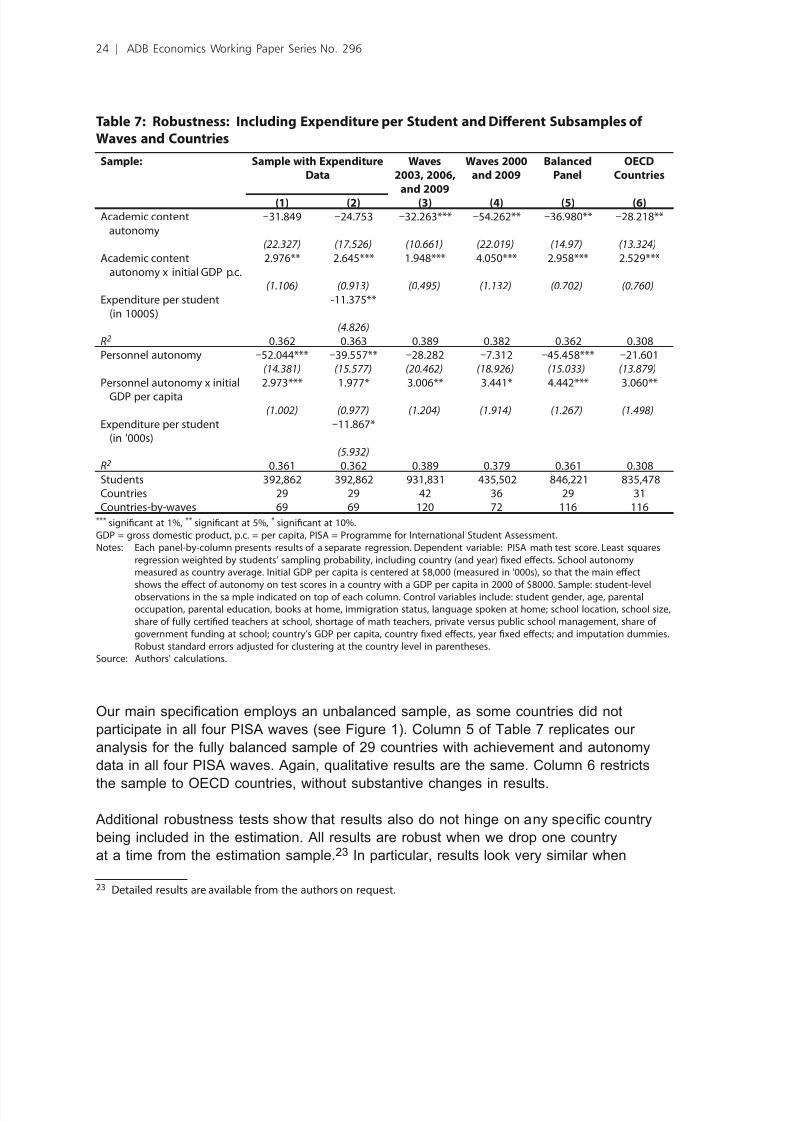
Autonomy reforms might also have coincided with expenditure reforms across countries
Because there is no consistent data on expenditure per student for all countries and
waves, our basic model does not control for expenditure per student But for the waves
±ZHKDYHFRQVLVWHQWGDWDRQDQQXDOH[SHQGLWXUHVSHUVWXGHQWLQORZHU
VHFRQGDU\HGXFDWLRQIRUDVXEVHWRIPRVWO\&'FRXQWULHVKH¿UVWFROXPQRI
Table 7 shows that our basic results hold similarly in this subset of countrybywave
observations Column 2 adds the expenditure variable to this model, and the qualitative
UHVXOWVDUHXQDIIHFWHG&KDQJHVLQH[SHQGLWXUHSHUVWXGHQWDUHDFWXDOO\VLJQL¿FDQWO\
negatively related to changes in student achievement, which dilutes concerns about the
ODFNRIH[SHQGLWXUHFRQWUROVLQRXUEDVLFVSHFL¿FDWLRQKHFRHI¿FLHQWRQH[SHQGLWXUHV
may capture forces that push for increased spending but that at the same time lower theHI¿FLHQF\RIWKHLUXVH22
The other four columns of Table 7 test for robustness in different subsamples The A
PDWKWHVWZDVVFDOHGWRKDYHPHDQDQGVWDQGDUGGHYLDWLRQDFURVVWKH&'
FRXQWULHVLQDQGLQHDFKDQGLWZDVGHVLJQHGSV\FKRPHWULFDOO\WRKDYHD
FRPPRQVFDOHVLQFH&ROXPQVKRZVWKDWUHVXOWVDUHXDOLWDWLYHO\XQDIIHFWHGZKHQ
GURSSLQJWKHZDYHDQGUHVWULFWLQJWKHDQDO\VLVWRWKHWKUHHZDYHVVLQFHLQ
which the tests are psychometrically scaled to be intertemporally comparable
QRUGHUWRHQVXUHWKDWWKHHIIHFWLVLGHQWL¿HGRQO\IURPORQJWHUPFKDQJHVDQGQRWGULYHQ
E\VKRUWWHUPRVFLOODWLRQVFROXPQUHVWULFWVWKHDQDO\VLVWRZDYHVDQGKHQLGHQWL¿HGIURPWKHQLQH\HDUGLIIHUHQFHVLQDXWRQRP\DQGWHVWVFRUHVUHVXOWVDUHHYHQ
PRUHSURQRXQFHGWKDQLQWKHIRXUZDYHVSHFL¿FDWLRQ
22 As reviewed in Hanushek and Woessmann (2011), international comparative studies o the impact o expendituresprovide mixed results but tend to indicate no consistent relationships between spending and international testscores.
Does School Autonomy Make Sense Everywhere? Panel Estimates from PISA | 23
7/27/2019 Does School Autonomy Make Sense Everywhere? Panel Estimates from PISA
http://slidepdf.com/reader/full/does-school-autonomy-make-sense-everywhere-panel-estimates-from-pisa 32/48
Table 7: Robustness: Including Expenditure per Student and Diferent Subsamples o
Waves and Countries
Sample: Sample with ExpenditureData
Waves2003, 2006,
and 2009
Waves 2000and 2009
BalancedPanel
OECDCountries
(1) (2) (3) (4) (5) (6)Academic content
autonomy–31.849 –24.753 –32.263*** –54.262** –36.980** –28.218**
(22.327) (17.526) (10.661) (22.019) (14.97) (13.324)
Academic contentautonomy x initial GDP p.c.
2.976** 2.645*** 1.948*** 4.050*** 2.958*** 2.529***
(1.106) (0.913) (0.495) (1.132) (0.702) (0.760)
Expenditure per student(in 1000$)
-11.375**
(4.826)
R2 0.362 0.363 0.389 0.382 0.362 0.308Personnel autonomy –52.044*** –39.557** –28.282 –7.312 –45.458*** –21.601
(14.381) (15.577) (20.462) (18.926) (15.033) (13.879)
Personnel autonomy x initial
GDP per capita
2.973*** 1.977* 3.006** 3.441* 4.442*** 3.060**
(1.002) (0.977) (1.204) (1.914) (1.267) (1.498)
Expenditure per student(in '000s)
–11.867*
(5.932)
R2 0.361 0.362 0.389 0.379 0.361 0.308Students 392,862 392,862 931,831 435,502 846,221 835,478Countries 29 29 42 36 29 31Countries-by-waves 69 69 120 72 116 116
*** signifcant at 1%, ** signifcant at 5%, * signifcant at 10%.GDP = gross domestic product, p.c. = per capita, PISA = Programme or International Student Assessment.Notes: Each panel-by-column presents results o a separate regression. Dependent variable: PISA math test score. Least squares
regression weighted by students’ sampling probability, including country (and year) fxed eects. School autonomymeasured as country average. Initial GDP per capita is centered at $8,000 (measured in '000s), so that the main eect
shows the eect o autonomy on test scores in a country with a GDP per capita in 2000 o $8000. Sample: student-levelobservations in the sa mple indicated on top o each column. Control variables include: student gender, age, parentaloccupation, parental education, books at home, immigration status, language spoken at home; school location, school size,share o ully certifed teachers at school, shortage o math teachers, private versus public school management, share o government unding at school; country’s GDP per capita, country fxed eects, year fxed eects; and imputation dummies.Robust standard errors adjusted or clustering at the country level in parentheses.
Source: Authors' calculations.
XUPDLQVSHFL¿FDWLRQHPSOR\VDQXQEDODQFHGVDPSOHDVVRPHFRXQWULHVGLGQRW
SDUWLFLSDWHLQDOOIRXU36$ZDYHVVHH)LJXUH&ROXPQRIDEOHUHSOLFDWHVRXU
analysis for the fully balanced sample of 29 countries with achievement and autonomy
data in all four A waves Again, qualitative results are the same Column restricts
the sample to C countries, without substantive changes in results
$GGLWLRQDO UREXVWQHVV WHVWVVKRZWKDW UHVXOWVDOVRGRQRWKLQJHRQDQ\VSHFL¿FFRXQWU\
being included in the estimation All results are robust when we drop one country
at a time from the estimation sample2 n particular, results look very similar when
23 Detailed results are available rom the authors on request.
24 | ADB Economics Working Paper Series No. 296
7/27/2019 Does School Autonomy Make Sense Everywhere? Panel Estimates from PISA
http://slidepdf.com/reader/full/does-school-autonomy-make-sense-everywhere-panel-estimates-from-pisa 33/48
X[HPERXUJ²DVOLJKWRXWOLHUZLWKWKHKLJKHVW*'3SHUFDSLWDVHH)LJXUH²LVH[FOXGHG
from the sample
)LQDOO\UHVXOWVDUHDOVRYHU\VLPLODUZKHQZHVHSDUDWHWKHVWXGHQWDQGFRXQWU\
HVWLPDWLRQVLQWRWZRVWHSVQWKHWZRVWHSPRGHOWHVWVFRUHVDUH³FOHDQHG´IURPLPSDFWVRIWKHVWXGHQWDQGVFKRROOHYHOFRQWUROVLQD¿UVWVWXGHQWOHYHOUHJUHVVLRQKHUHVLGXDOV
of this regression, which capture that part of the testscore variation that cannot be
attributed to the controls, are then collapsed to the countrybywave level n a second,
FRXQWU\OHYHOUHJUHVVLRQZHXVHWKHFRXQWU\OHYHOGDWDWRUXQD³FODVVLFDO´SDQHO¿[HG
HIIHFWVPRGHOZKHUHWKHOHYHORIREVHUYDWLRQFRLQFLGHVERWKZLWKWKHOHYHORIWKH¿[HG
effects and with the level at which the variables of interest are measured esults (shown
LQ$SSHQGL[DEOHDUHXDOLWDWLYHO\WKHVDPHDVLQRXUSUHIHUUHGRQHVWHSVSHFL¿FDWLRQ
and they do not differ depending on whether the model does or does not already include
FRXQWU\¿[HGHIIHFWVLQWKHHVWLPDWLRQRIWKH¿UVWVWHS
C. Specication Tests
XULGHQWL¿FDWLRQGHULYHVIURPFRXQWU\OHYHOYDULDWLRQLQDXWRQRP\RYHUWLPHDQGLWV
LQWHUDFWLRQZLWKLQLWLDOGHYHORSPHQWOHYHOVLQDSDQHOPRGHOZLWKFRXQWU\¿[HGHIIHFWV
RDQDO\]HWKHYDOLGLW\RIWKHVSHFL¿FDWLRQZHSUHVHQWDVHWRIVSHFL¿FDWLRQWHVWV
WKDWDGGUHVVVHYHUDOSRVVLEOHUHPDLQLQJFRQFHUQVZLWKWKHLGHQWL¿FDWLRQDQGWKDWDOVR
indicate possible channels and sources of heterogeneity in the impacts iven that the
WHVWVFRUURERUDWHRXUPDLQVSHFL¿FDWLRQPRVWO\E\SURGXFLQJWKHUHVXOWRILQVLJQL¿FDQW
DOWHUQDWLYHHIIHFWVZHVLPSO\VXPPDUL]HWKH¿QGLQJVKHUH'HWDLOHGUHVXOWVDUHDYDLODEOH
from the authors upon request
$¿UVWSRVVLEOHFRQFHUQZLWKLGHQWL¿FDWLRQ IURPSDQHOYDULDWLRQ LVWKDWYDULDWLRQLQDXWRQRP\RYHUWLPHPD\EHHQGRJHQRXVWRWKHLQLWLDOOHYHORIVWXGHQWDFKLHYHPHQW)RU
example, poor initial achievement might theoretically induce governments to implement
decentralization—or centralization—reforms n order to test for the empirical relevance
of this concern, we estimate several models where the changes in autonomy that identify
our results are regressed on initial A scores Thus, we test whether the A score in
SUHGLFWWKHFKDQJHLQDXWRQRP\IURPWRRUIURPWRHDOVR
test whether the A level in one cycle predicts the change in autonomy from this to
the subsequent cycle in a panel model of the four A waves n all tests, lagged A
VFRUHVGRQRWVLJQL¿FDQWO\SUHGLFWVXEVHXHQWFKDQJHVLQDXWRQRP\FRUURERUDWLQJWKH
identifying assumption of our panel model
A second possible concern is that the development level may interact not only with
autonomy reforms, but also with other education policy measures n other words, the
KHWHURJHQHLW\RILPSDFWPD\QRWEHVSHFL¿FWRWKHGLPHQVLRQRIVFKRRODXWRQRP\DV
other policies may also be more effective within a wellfunctioning surrounding To
investigate this, we included in the regression interactions of initial per capita with
Does School Autonomy Make Sense Everywhere? Panel Estimates from PISA | 25
7/27/2019 Does School Autonomy Make Sense Everywhere? Panel Estimates from PISA
http://slidepdf.com/reader/full/does-school-autonomy-make-sense-everywhere-panel-estimates-from-pisa 34/48
countrylevel measures of several other features of the school system: competition
(proxied by the share of privately operated schools; funding sources (share of public
funding in the school budget; school size (number of students per school; teacher
HGXFDWLRQVKDUHRIFHUWL¿HGWHDFKHUVDQGVKRUWDJHRIPDWKWHDFKHUVXUUHVXOWV
VKRZWKDWQRQHRIWKHVHYDULDEOHVLQWHUDFWVVLJQL¿FDQWO\ZLWKLQLWLDO*'3SHUFDSLWDLQdetermining student achievement, and the autonomy results remain robust when these
additional interactions are included in the model
KLUGWRLQYHVWLJDWHZKHWKHUWKHKHWHURJHQHLW\RIWKHDXWRQRP\HIIHFWLVVSHFL¿FWRWKH
development level and does not capture heterogeneity with respect to other country
FKDUDFWHULVWLFVZHDOVRHVWLPDWHGVSHFL¿FDWLRQVWKDWLQWHUDFWDXWRQRP\ZLWKDQXPEHU
RIRWKHUFRXQWU\PHDVXUHV)RULQWHUDFWLRQVVSHFL¿FDOO\ZLWKWKHRYHUDOOSHUIRUPDQFH
of the education system and with accountability, see the next section ome of these
measures may also be interpreted as possible channels through which the level of
economic development may matter for the impact of autonomy on student achievement
6SHFL¿FDOO\DXWRQRP\PD\LQWHUDFWZLWKWKHVL]HRIDFRXQWU\DVVFKRRODXWRQRP\may mean different things in small and large countries; with its ethnic homogeneity, as
autonomy may work better in homogenous societies; with a country’s political regime,
corruption level, or governance effectiveness, which may determine restraints on
how well autonomy can work; or with a country’s culture, which may be more or less
complementary to autonomous decision making n addition, parental human capital may
moderate the quality of local monitoring, their ability to pay for private schooling may
DIIHFWWKHLQFHQWLYHVRIDXWRQRPRXVVFKRROVDQGDXWRQRPRXVVFKRROVPD\XVHVSHFL¿F
local policies
KXVZHHVWLPDWHGVSHFL¿FDWLRQVWKDWLQWHUDFWDXWRQRP\ZLWKSRSXODWLRQVL]HZLWKWKH
$OHVLQDHWDOPHDVXUHRIHWKQLFIUDFWLRQDOL]DWLRQZLWK WKH3ROLW\LQGH[WKDWmeasures governing authority on a scale from institutionalized autocracies to consolidated
democracy; with the corruption perceptions index of Transparency nternational; with the
overnance ffectiveness ndex of the orld Bank’s orldwide overnance ndicators
project, which aims to capture the perceived quality of public services and of policy
formulation and implementation; and with the six ofstede dimensions of national culture,
in particular the measures of individualism versus collectivism (integration into groups
and of power distance (acceptance of power inequality e also interacted autonomy
with average measures of parents’ human capital available in the A dataset (white
collar occupations and books at home, with the share of private funding in the school
EXGJHWDQGZLWKVXFKVFKRRODVSHFWVDVWKHVKDUHRIFHUWL¿HGWHDFKHUVVKRUWDJHVRI
math teachers, school size, and share of private schools
n models that enter these interactions separately and do not include the interaction
of autonomy with initial per capita, there is an indication that autonomy interacts
positively with democracy, government effectiveness, individualism, the share of privately
RSHUDWHGVFKRROVDQGWKHVKDUHRIFHUWL¿HGWHDFKHUVDQGQHJDWLYHO\ZLWKSRSXODWLRQ
26 | ADB Economics Working Paper Series No. 296
7/27/2019 Does School Autonomy Make Sense Everywhere? Panel Estimates from PISA
http://slidepdf.com/reader/full/does-school-autonomy-make-sense-everywhere-panel-estimates-from-pisa 35/48
size, corruption, and acceptance of power inequality owever, in all these cases,
WKHVLJQL¿FDQFHRIWKHLQWHUDFWLRQYDQLVKHVRQFHWKHLQWHUDFWLRQRIDFDGHPLFFRQWHQW
autonomy with initial per capita is also entered, and the latter retains statistical
VLJQL¿FDQFHWKURXJKRXW24 Thus, while the interaction with the development level clearly
entails dimensions of democracy, governance effectiveness, cultural values, and effectiveschool environments, the overall measure of economic development in terms of per
capita dominates these other separate interactions ariations in these other measures
that are not correlated with the standard measure of economic development do not
LQWHUDFWVLJQL¿FDQWO\ZLWKWKHDXWRQRP\HIIHFW
)RXUWKZHWHVWZKHWKHUWKHDXWRQRP\HIIHFWLVKHWHURJHQHRXVIRUVWXGHQWVZLWKGLIIHUHQW
LQGLYLGXDOVRFLDOEDFNJURXQGV6XFKKHWHURJHQHLW\PD\UHÀHFWDQRWKHUFKDQQHORIWKH
autonomy effect, as decentralization may work better with sophisticated parents (aliani,
*HUWOHUDQG6FKDUJURGVN\WDOVRSURYLGHVHYLGHQFHRQWKHHIIHFWRIDXWRQRP\
on inequality, as differential impacts by social background would narrow or widen the
performance gap between welloff and disadvantaged families To test this, we addinteraction terms between autonomy and family background measures as well as the
triple interaction between autonomy, initial per capita, and the family measures to
RXUEDVLFVSHFL¿FDWLRQXUPHDVXUHVRILQGLYLGXDOIDPLO\EDFNJURXQGLQFOXGHSDUHQWDO
whitecollar occupation, parental university education, books at home, and immigration
EDFNJURXQG)RUDOOIRXUPHDVXUHVQHLWKHUWKHLQWHUDFWLRQZLWKWKHDXWRQRP\YDULDEOH
QRUWKHWULSOHLQWHUDFWLRQLVVWDWLVWLFDOO\VLJQL¿FDQWDQGSRLQWHVWLPDWHVVXJJHVWGLIIHUHQW
directions of effects Consequently, autonomy reforms do not seem to affect children from
different background differently and thus do not seem to magnify or lessen inequality,
either in developed or in developing countries2
D. Further Results
hile the results so far relate to math achievement, which is most readily tested
comparably across countries, A also tested students in reading and science As shown
LQFROXPQRIDEOHUHVXOWVDUHXDOLWDWLYHO\WKHVDPHLQUHDGLQJKLVLVSDUWLFXODUO\
interesting because reading scores have been psychometrically scaled to be comparable
over all four A waves esults on academic content autonomy are also found for
science achievement, where results on personnel autonomy are less pronounced and
ORVHVWDWLVWLFDOVLJQL¿FDQFHFROXPQ
24 Results or personnel and budget autonomy are similar, but sometimes less strong. While the negative interactiono autonomy with ethnic ractionalization is insignifcant in the separate model, it turns marginally signifcantin the model that also includes the interaction o autonomy with initial GDP per capita (which is ully robust),indicating that autonomy may work better in ethnically more homogeneous countries.
25 We also estimated a specifcation that adds an interaction o autonomy with the initial Gini coecient o incomeinequality provided by the World Bank. While the interaction o autonomy with the initial per capita GDP levelremains qualitatively unaected, there is also some indication that academic content autonomy is more benefcialin more equal societies. However, this pattern is not confrmed by distributional measures o amily backgroundtaken rom the PISA dataset that directly relate to the parents o the tested students.
Does School Autonomy Make Sense Everywhere? Panel Estimates from PISA | 27
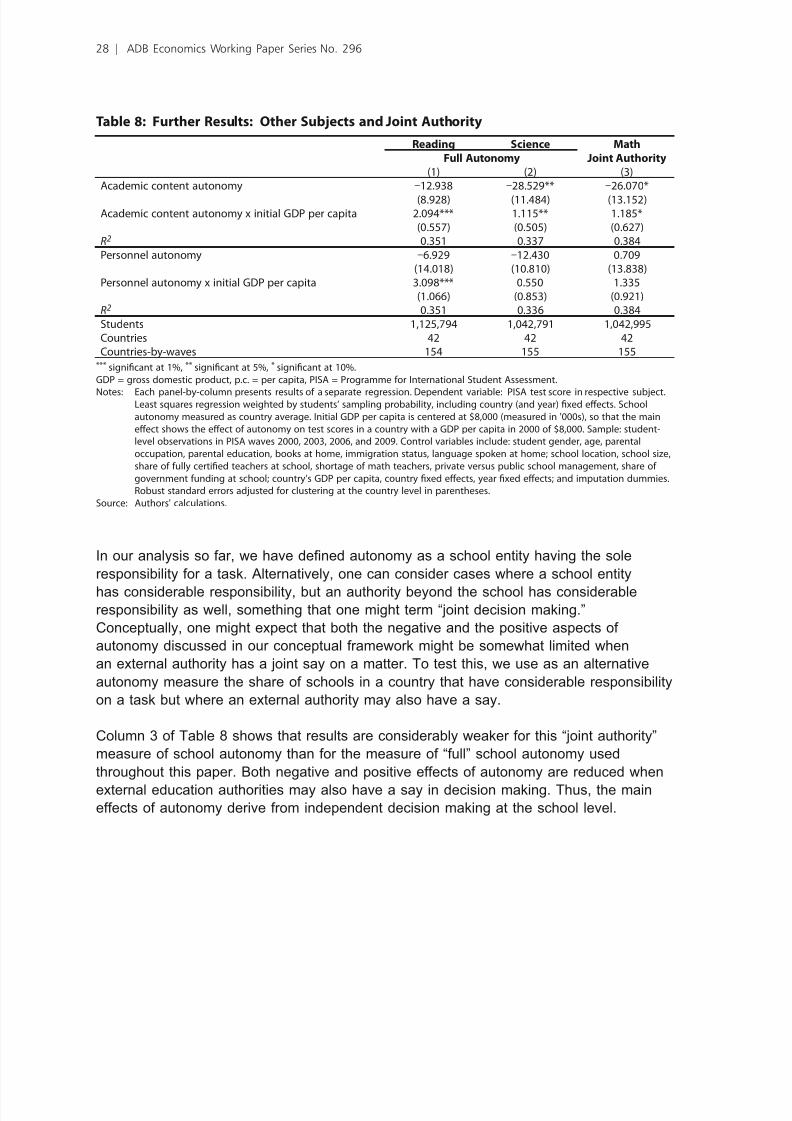
7/27/2019 Does School Autonomy Make Sense Everywhere? Panel Estimates from PISA
http://slidepdf.com/reader/full/does-school-autonomy-make-sense-everywhere-panel-estimates-from-pisa 36/48
Table 8: Further Results: Other Subjects and Joint Authority
Reading Science Math
Joint Authority(3)
Full Autonomy(1) (2)
Academic content autonomy –12.938 –28.529** –26.070*
(8.928) (11.484) (13.152)Academic content autonomy x initial GDP per capita 2.094*** 1.115** 1.185*
(0.557) (0.505) (0.627)R2 0.351 0.337 0.384Personnel autonomy –6.929 –12.430 0.709
(14.018) (10.810) (13.838)Personnel autonomy x initial GDP per capita 3.098*** 0.550 1.335
(1.066) (0.853) (0.921)R2 0.351 0.336 0.384Students 1,125,794 1,042,791 1,042,995Countries 42 42 42Countries-by-waves 154 155 155
*** signifcant at 1%, ** signifcant at 5%, * signifcant at 10%.GDP = gross domestic product, p.c. = per capita, PISA = Programme or International Student Assessment.
Notes: Each panel-by-column presents results o a separate regression. Dependent variable: PISA test score in respective subject.Least squares regression weighted by students’ sampling probability, including country (and year) fxed eects. Schoolautonomy measured as country average. Initial GDP per capita is centered at $8,000 (measured in '000s), so that the maineect shows the eect o autonomy on test scores in a country with a GDP per capita in 2000 o $8,000. Sample: student-level observations in PISA waves 2000, 2003, 2006, and 2009. Control variables include: student gender, age, parentaloccupation, parental education, books at home, immigration status, language spoken at home; school location, school size,share o ully certifed teachers at school, shortage o math teachers, private versus public school management, share o government unding at school; country’s GDP per capita, country fxed eects, year fxed eects; and imputation dummies.Robust standard errors adjusted or clustering at the country level in parentheses.
Source: Authors' calculations.
QRXUDQDO\VLVVRIDUZHKDYHGH¿QHGDXWRQRP\DVDVFKRROHQWLW\KDYLQJWKHVROH
responsibility for a task Alternatively, one can consider cases where a school entity
has considerable responsibility, but an authority beyond the school has considerableUHVSRQVLELOLW\DVZHOOVRPHWKLQJWKDWRQHPLJKWWHUP³RLQWGHFLVLRQPDNLQJ´
Conceptually, one might expect that both the negative and the positive aspects of
autonomy discussed in our conceptual framework might be somewhat limited when
an external authority has a joint say on a matter To test this, we use as an alternative
autonomy measure the share of schools in a country that have considerable responsibility
on a task but where an external authority may also have a say
&ROXPQRIDEOHVKRZVWKDWUHVXOWVDUHFRQVLGHUDEO\ZHDNHUIRUWKLV³RLQWDXWKRULW\´
PHDVXUHRIVFKRRODXWRQRP\WKDQIRUWKHPHDVXUHRI³IXOO´VFKRRODXWRQRP\XVHG
throughout this paper Both negative and positive effects of autonomy are reduced when
external education authorities may also have a say in decision making Thus, the maineffects of autonomy derive from independent decision making at the school level
28 | ADB Economics Working Paper Series No. 296
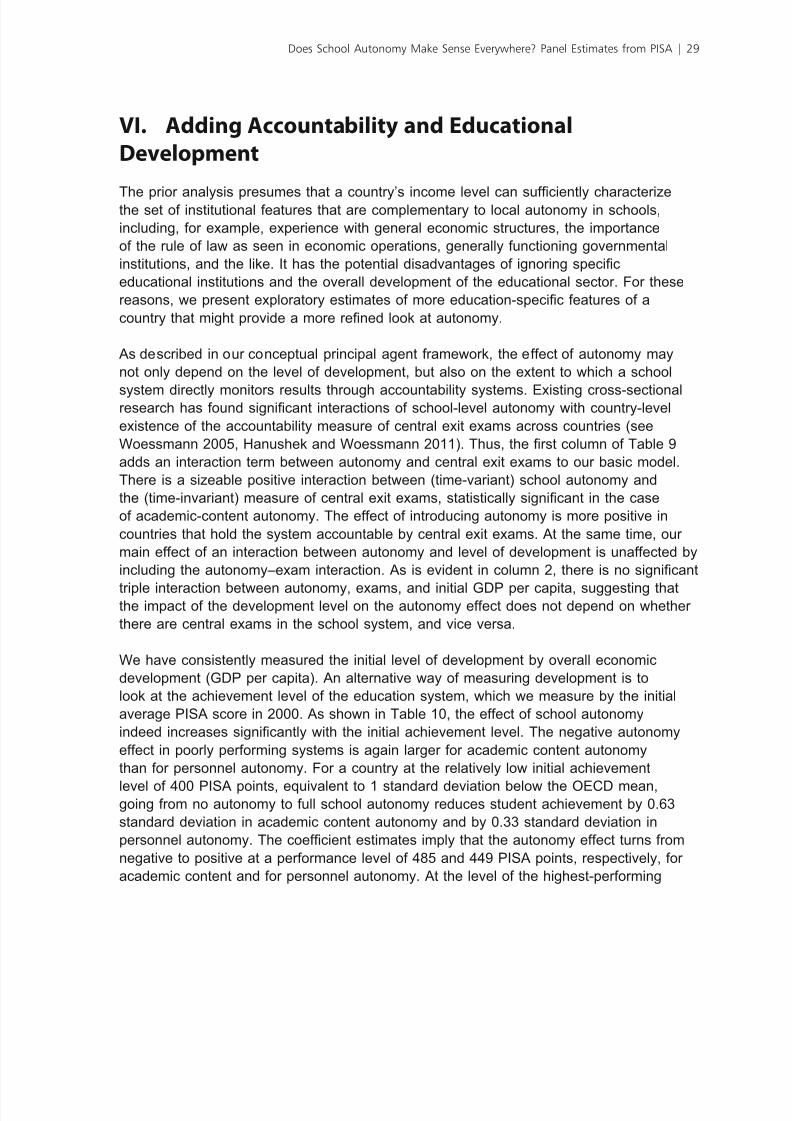
7/27/2019 Does School Autonomy Make Sense Everywhere? Panel Estimates from PISA
http://slidepdf.com/reader/full/does-school-autonomy-make-sense-everywhere-panel-estimates-from-pisa 37/48
VI. Adding Accountability and Educational
Development
KHSULRUDQDO\VLVSUHVXPHVWKDWDFRXQWU\¶VLQFRPHOHYHOFDQVXI¿FLHQWO\FKDUDFWHUL]Hthe set of institutional features that are complementary to local autonomy in schools,
including, for example, experience with general economic structures, the importance
of the rule of law as seen in economic operations, generally functioning governmental
LQVWLWXWLRQVDQGWKHOLNHWKDVWKHSRWHQWLDOGLVDGYDQWDJHVRILJQRULQJVSHFL¿F
HGXFDWLRQDOLQVWLWXWLRQVDQGWKHRYHUDOOGHYHORSPHQWRI WKHHGXFDWLRQDOVHFWRU)RUWKHVH
UHDVRQVZHSUHVHQWH[SORUDWRU\HVWLPDWHVRIPRUHHGXFDWLRQVSHFL¿FIHDWXUHVRID
FRXQWU\WKDWPLJKWSURYLGHDPRUHUH¿QHGORRNDWDXWRQRP\
As described in our conceptual principal agent framework, the effect of autonomy may
not only depend on the level of development, but also on the extent to which a school
system directly monitors results through accountability systems xisting crosssectionalUHVHDUFKKDVIRXQGVLJQL¿FDQWLQWHUDFWLRQVRIVFKRROOHYHODXWRQRP\ZLWKFRXQWU\OHYHO
existence of the accountability measure of central exit exams across countries (see
RHVVPDQQ+DQXVKHNDQGRHVVPDQQKXVWKH¿UVWFROXPQRIDEOH
adds an interaction term between autonomy and central exit exams to our basic model
There is a sizeable positive interaction between (timevariant school autonomy and
WKHWLPHLQYDULDQWPHDVXUHRIFHQWUDOH[LWH[DPVVWDWLVWLFDOO\VLJQL¿FDQWLQWKHFDVH
of academiccontent autonomy The effect of introducing autonomy is more positive in
countries that hold the system accountable by central exit exams At the same time, our
main effect of an interaction between autonomy and level of development is unaffected by
LQFOXGLQJWKHDXWRQRP\±H[DPLQWHUDFWLRQ$VLVHYLGHQWLQFROXPQWKHUHLVQRVLJQL¿FDQW
triple interaction between autonomy, exams, and initial per capita, suggesting thatthe impact of the development level on the autonomy effect does not depend on whether
there are central exams in the school system, and vice versa
e have consistently measured the initial level of development by overall economic
development ( per capita An alternative way of measuring development is to
look at the achievement level of the education system, which we measure by the initial
DYHUDJH36$VFRUHLQ$VVKRZQLQDEOHWKHHIIHFWRIVFKRRODXWRQRP\
LQGHHGLQFUHDVHVVLJQL¿FDQWO\ZLWKWKHLQLWLDODFKLHYHPHQWOHYHOKHQHJDWLYHDXWRQRP\
effect in poorly performing systems is again larger for academic content autonomy
WKDQIRUSHUVRQQHODXWRQRP\)RUDFRXQWU\DWWKHUHODWLYHO\ORZLQLWLDODFKLHYHPHQW
OHYHORI36$SRLQWVHXLYDOHQWWRVWDQGDUGGHYLDWLRQEHORZWKH&'PHDQJRLQJIURPQRDXWRQRP\WRIXOOVFKRRODXWRQRP\UHGXFHVVWXGHQWDFKLHYHPHQWE\
VWDQGDUGGHYLDWLRQLQDFDGHPLFFRQWHQWDXWRQRP\DQGE\VWDQGDUGGHYLDWLRQLQ
SHUVRQQHODXWRQRP\KHFRHI¿FLHQWHVWLPDWHVLPSO\WKDWWKHDXWRQRP\HIIHFWWXUQVIURP
QHJDWLYHWRSRVLWLYHDWDSHUIRUPDQFHOHYHORIDQG36$SRLQWVUHVSHFWLYHO\IRU
academic content and for personnel autonomy At the level of the highestperforming
Does School Autonomy Make Sense Everywhere? Panel Estimates from PISA | 29
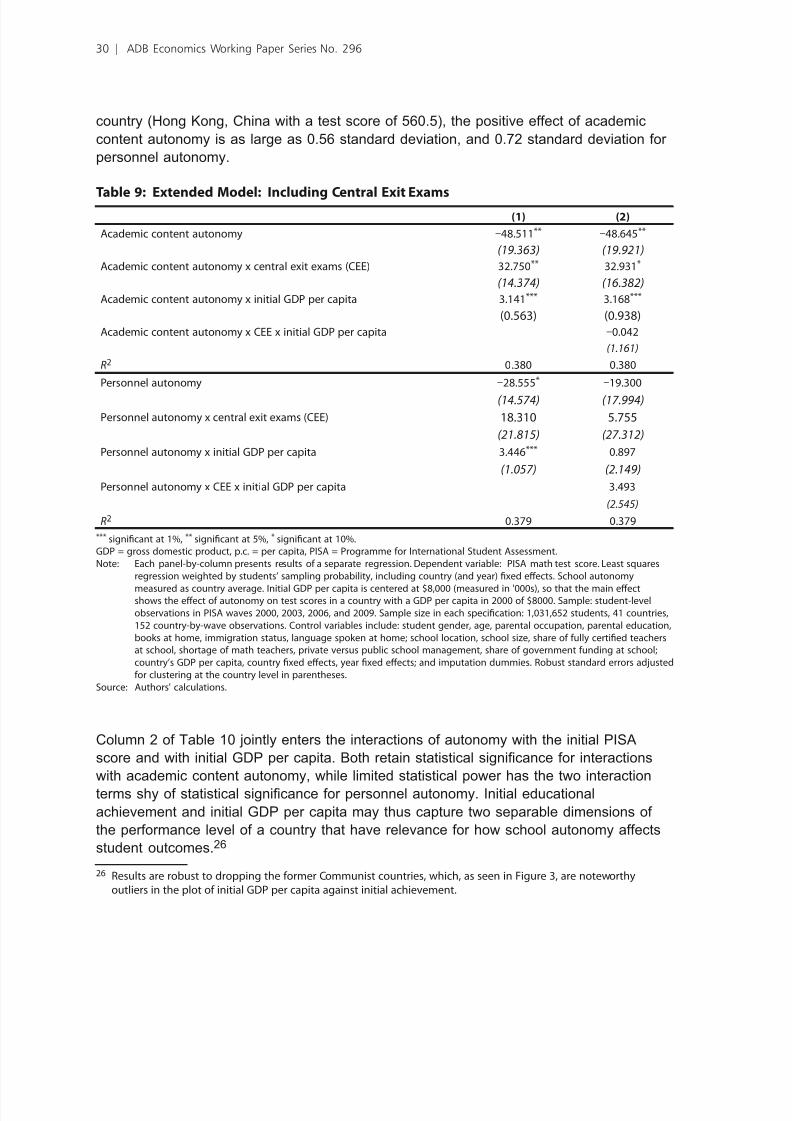
7/27/2019 Does School Autonomy Make Sense Everywhere? Panel Estimates from PISA
http://slidepdf.com/reader/full/does-school-autonomy-make-sense-everywhere-panel-estimates-from-pisa 38/48
FRXQWU\+RQJ.RQJ&KLQDZLWKDWHVWVFRUHRIWKHSRVLWLYHHIIHFWRIDFDGHPLF
FRQWHQWDXWRQRP\LVDVODUJHDVVWDQGDUGGHYLDWLRQDQGVWDQGDUGGHYLDWLRQIRU
personnel autonomy
Table 9: Extended Model: Including Central Exit Exams(1) (2)
Academic content autonomy –48.511** –48.645**
(19.363) (19.921)
Academic content autonomy x central exit exams (CEE) 32.750** 32.931*
(14.374) (16.382)
Academic content autonomy x initial GDP per capita 3.141*** 3.168***
(0.563) (0.938)Academic content autonomy x CEE x initial GDP per capita –0.042
(1.161)
R2 0.380 0.380
Personnel autonomy –28.555* –19.300
(14.574) (17.994)
Personnel autonomy x central exit exams (CEE) 18.310 5.755
(21.815) (27.312)
Personnel autonomy x initial GDP per capita 3.446*** 0.897
(1.057) (2.149)
Personnel autonomy x CEE x initial GDP per capita 3.493
(2.545)
R2 0.379 0.379*** signifcant at 1%, ** signifcant at 5%, * signifcant at 10%.GDP = gross domestic product, p.c. = per capita, PISA = Programme or International Student Assessment.Note: Each panel-by-column presents results o a separate regression. Dependent variable: PISA math test score. Least squares
regression weighted by students’ sampling probability, including country (and year) fxed eects. School autonomy
measured as country average. Initial GDP per capita is centered at $8,000 (measured in '000s), so that the main eectshows the eect o autonomy on test scores in a country with a GDP per capita in 2000 o $8000. Sample: student-levelobservations in PISA waves 2000, 2003, 2006, and 2009. Sample size in each specifcation: 1,031,652 students, 41 countries,152 country-by-wave observations. Control variables include: student gender, age, parental occupation, parental education,books at home, immigration status, language spoken at home; school location, school size, share o ully certifed teachersat school, shortage o math teachers, private versus public school management, share o government unding at school;country’s GDP per capita, country fxed eects, year fxed eects; and imputation dummies. Robust standard errors adjustedor clustering at the country level in parentheses.
Source: Authors' calculations.
&ROXPQRIDEOHRLQWO\HQWHUVWKHLQWHUDFWLRQVRIDXWRQRP\ZLWKWKHLQLWLDO36$
VFRUHDQGZLWKLQLWLDO*'3SHUFDSLWD%RWKUHWDLQVWDWLVWLFDOVLJQL¿FDQFHIRULQWHUDFWLRQV
with academic content autonomy, while limited statistical power has the two interaction
WHUPVVK\RIVWDWLVWLFDOVLJQL¿FDQFHIRUSHUVRQQHODXWRQRP\QLWLDOHGXFDWLRQDO
achievement and initial per capita may thus capture two separable dimensions of
the performance level of a country that have relevance for how school autonomy affects
student outcomes2
26 Results are robust to dropping the ormer Communist countries, which, as seen in Figure 3, are noteworthyoutliers in the plot o initial GDP per capita against initial achievement.
30 | ADB Economics Working Paper Series No. 296
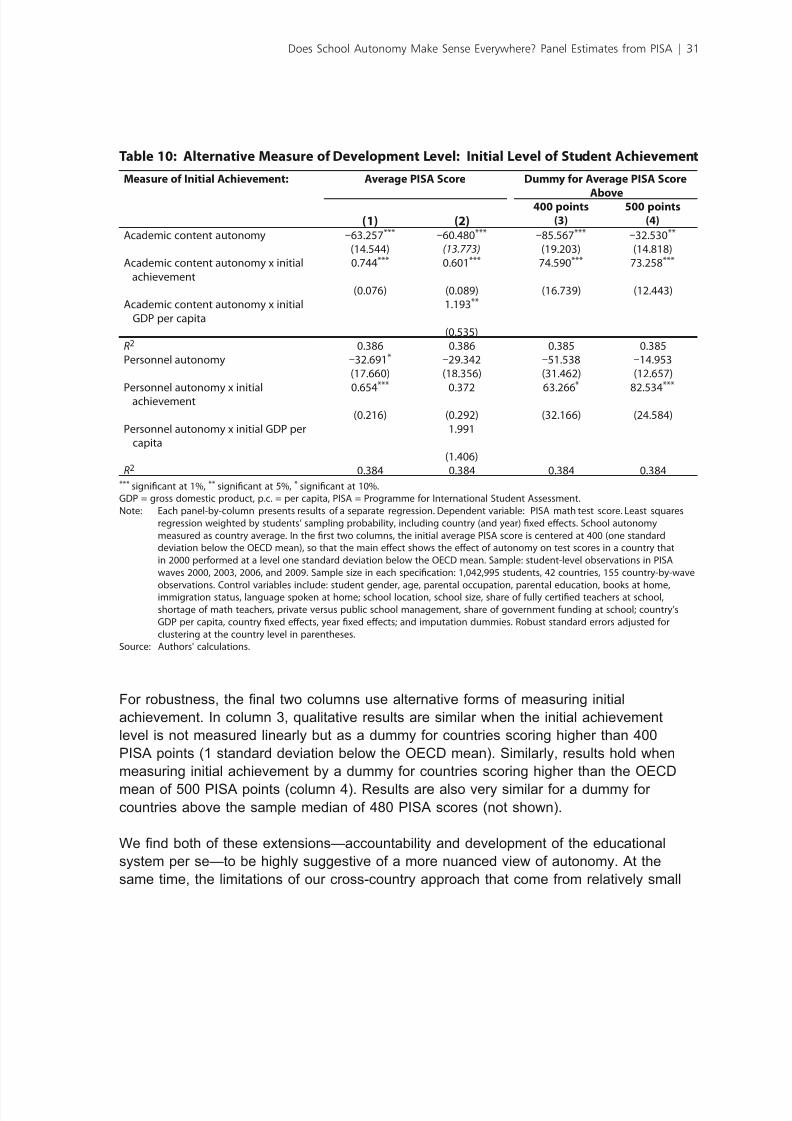
7/27/2019 Does School Autonomy Make Sense Everywhere? Panel Estimates from PISA
http://slidepdf.com/reader/full/does-school-autonomy-make-sense-everywhere-panel-estimates-from-pisa 39/48
Table 10: Alternative Measure o Development Level: Initial Level o Student Achievement
Measure o Initial Achievement: Average PISA Score Dummy or Average PISA Score
Above400 points 500 points
(1) (2) (3) (4)
Academic content autonomy –63.257*** –60.480*** –85.567*** –32.530**
(14.544) (13.773) (19.203) (14.818)Academic content autonomy x initial
achievement0.744*** 0.601*** 74.590*** 73.258***
(0.076) (0.089) (16.739) (12.443)Academic content autonomy x initial
GDP per capita1.193**
(0.535)R2 0.386 0.386 0.385 0.385Personnel autonomy –32.691* –29.342 –51.538 –14.953
(17.660) (18.356) (31.462) (12.657)
Personnel autonomy x initialachievement 0.654***
0.372 63.266*
82.534***
(0.216) (0.292) (32.166) (24.584)Personnel autonomy x initial GDP per
capita1.991
(1.406)R2 0.384 0.384 0.384 0.384
*** signifcant at 1%, ** signifcant at 5%, * signifcant at 10%.GDP = gross domestic product, p.c. = per capita, PISA = Programme or International Student Assessment.Note: Each panel-by-column presents results o a separate regression. Dependent variable: PISA math test score. Least squares
regression weighted by students’ sampling probability, including country (and year) fxed eects. School autonomymeasured as country average. In the frst two columns, the initial average PISA score is centered at 400 (one standarddeviation below the OECD mean), so that the main eect shows the eect o autonomy on test scores in a country thatin 2000 perormed at a level one standard deviation below the OECD mean. Sample: student-level observations in PISAwaves 2000, 2003, 2006, and 2009. Sample size in each specifcation: 1,042,995 students, 42 countries, 155 country-by-wave
observations. Control variables include: student gender, age, parental occupation, parental education, books at home,immigration status, language spoken at home; school location, school size, share o ully certifed teachers at school,shortage o math teachers, private versus public school management, share o government unding at school; country’sGDP per capita, country fxed eects, year fxed eects; and imputation dummies. Robust standard errors adjusted orclustering at the country level in parentheses.
Source: Authors' calculations.
)RUUREXVWQHVVWKH¿QDOWZRFROXPQVXVHDOWHUQDWLYHIRUPVRIPHDVXULQJLQLWLDO
achievement n column , qualitative results are similar when the initial achievement
OHYHOLVQRWPHDVXUHGOLQHDUO\EXWDVDGXPP\IRUFRXQWULHVVFRULQJKLJKHUWKDQ
A points (1 standard deviation below the C mean imilarly, results hold when
measuring initial achievement by a dummy for countries scoring higher than the C
PHDQRI36$SRLQWVFROXPQ5HVXOWVDUHDOVRYHU\VLPLODUIRUDGXPP\IRUFRXQWULHVDERYHWKHVDPSOHPHGLDQRI36$VFRUHVQRWVKRZQ
H¿QGERWKRIWKHVHH[WHQVLRQV²DFFRXQWDELOLW\DQGGHYHORSPHQWRIWKHHGXFDWLRQDO
system per se—to be highly suggestive of a more nuanced view of autonomy At the
same time, the limitations of our crosscountry approach that come from relatively small
Does School Autonomy Make Sense Everywhere? Panel Estimates from PISA | 31
7/27/2019 Does School Autonomy Make Sense Everywhere? Panel Estimates from PISA
http://slidepdf.com/reader/full/does-school-autonomy-make-sense-everywhere-panel-estimates-from-pisa 40/48
HIIHFWLYHVDPSOHVRIFRXQWULHVDQGIURPLPSHUIHFWPHDVXUHPHQWRIVSHFL¿FLQVWLWXWLRQV
lead us to be cautious in the interpretation e think there are conceptual reasons that
lend credence to these results, particularly about accountability, but there are many
details about the form and consequences of accountability that are ignored27
VII. Conclusions
ecentralization of decision making has been hotly debated in many countries of the
world, and prior research has left considerable uncertainty about the expected impact
of giving more autonomy to schools n the face of this uncertainty, many countries
have changed the locus of decision making within their countries over the past decade,
and interestingly some have decentralized while others have centralized e exploit
this crosscountry variation to investigate the impact of local autonomy on student
achievement e identify the effect of school autonomy from withincountry changes in
the share of autonomous schools over time in a panel analysis with country (and time
¿[HGHIIHFWV
XUFHQWUDO¿QGLQJLVWKDWDXWRQRP\UHIRUPVLPSURYHVWXGHQWDFKLHYHPHQWLQGHYHORSHG
countries, but undermine it in developing countries At low levels of economic
development, increased autonomy actually hurts student outcomes, in particular in
decision making areas related to academic content By contrast, in highincome countries,
increased autonomy over academic content, personnel, and budgets exerts positive
effects on student achievement n general, the autonomy effects are most pronounced
in decision making on academic content, with some additional relevance for personnel
autonomy and, less so, for budgetary autonomy
mpirically, the main result proves highly consistent across a series of robustness and
VSHFL¿FDWLRQFKHFNV$PRQJRWKHUVWKHDXWRQRP\HIIHFWVVKRZXSLQYDULRXVIRUPVRI
PHDVXULQJLQLWLDO*'3SHUFDSLWDDOWHUQDWLYHVSHFL¿FDWLRQVRIWKHFRQWUROPRGHODQG
GLIIHUHQWVXEVDPSOHVLQWHUPVRILQFOXGHGZDYHVDQGFRXQWULHVKHEDVLF¿QGLQJRI
heterogeneity of the impact of autonomy by development level shows up in students’
performance in math, in reading, and in science t is much more pronounced for full
schoollevel autonomy than for joint authority between schools and external authorities
QWHUPVRIWKHPRGHOVSHFL¿FDWLRQZHFRQ¿UPWKDWSROLF\GHFLVLRQVDERXWWKHLQWURGXFWLRQof autonomy reforms are not related to previous achievement levels, corroborating the
SDQHOLGHQWL¿FDWLRQQDGGLWLRQWKHUHDUHQRVLJQL¿FDQWLQWHUDFWLRQVRIWKHGHYHORSPHQW
OHYHOZLWKRWKHUHGXFDWLRQSROLF\PHDVXUHVVXJJHVWLQJWKDWWKHVSHFL¿FLQVWLWXWLRQDOHIIHFW
DQGLWVKHWHURJHQHLW\DUHSDUWLFXODUWRDXWRQRP\UHIRUPV$OVRWKHVLJQL¿FDQWLQWHUDFWLRQ
27 To illustrate the details on accountability, see the alternative estimates o its impact on student achievement in theUS (Figlio and Loeb 2011).
32 | ADB Economics Working Paper Series No. 296
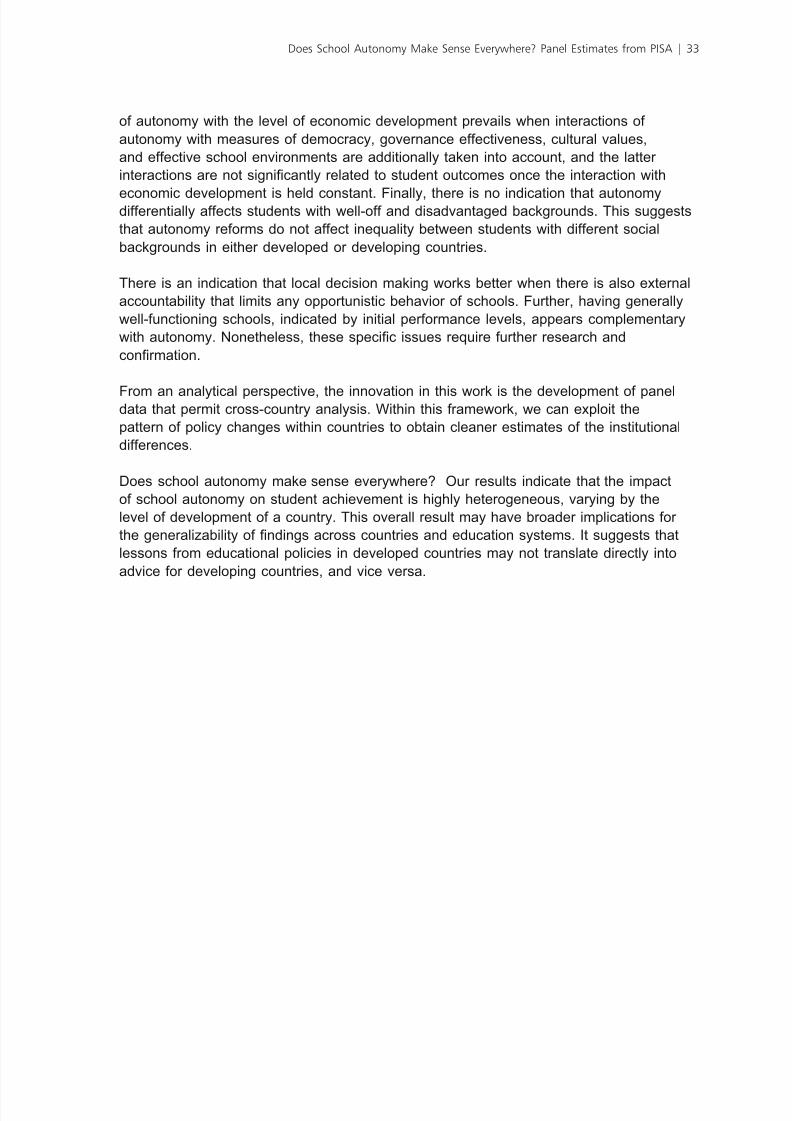
7/27/2019 Does School Autonomy Make Sense Everywhere? Panel Estimates from PISA
http://slidepdf.com/reader/full/does-school-autonomy-make-sense-everywhere-panel-estimates-from-pisa 41/48
of autonomy with the level of economic development prevails when interactions of
autonomy with measures of democracy, governance effectiveness, cultural values,
and effective school environments are additionally taken into account, and the latter
LQWHUDFWLRQVDUHQRWVLJQL¿FDQWO\UHODWHGWRVWXGHQWRXWFRPHVRQFHWKHLQWHUDFWLRQZLWK
HFRQRPLFGHYHORSPHQWLVKHOGFRQVWDQW)LQDOO\WKHUHLVQR LQGLFDWLRQWKDWDXWRQRP\differentially affects students with welloff and disadvantaged backgrounds This suggests
that autonomy reforms do not affect inequality between students with different social
backgrounds in either developed or developing countries
There is an indication that local decision making works better when there is also external
DFFRXQWDELOLW\WKDWOLPLWVDQ\RSSRUWXQLVWLFEHKDYLRURIVFKRROV)XUWKHUKDYLQJJHQHUDOO\
wellfunctioning schools, indicated by initial performance levels, appears complementary
ZLWKDXWRQRP\RQHWKHOHVVWKHVHVSHFL¿FLVVXHVUHXLUHIXUWKHUUHVHDUFKDQG
FRQ¿UPDWLRQ
)URPDQDQDO\WLFDOSHUVSHFWLYHWKHLQQRYDWLRQLQWKLVZRUNLVWKHGHYHORSPHQWRISDQHOdata that permit crosscountry analysis ithin this framework, we can exploit the
pattern of policy changes within countries to obtain cleaner estimates of the institutional
differences
oes school autonomy make sense everywhere? ur results indicate that the impact
of school autonomy on student achievement is highly heterogeneous, varying by the
level of development of a country This overall result may have broader implications for
WKHJHQHUDOL]DELOLW\RI¿QGLQJVDFURVVFRXQWULHVDQGHGXFDWLRQV\VWHPVWVXJJHVWVWKDW
lessons from educational policies in developed countries may not translate directly into
advice for developing countries, and vice versa
Does School Autonomy Make Sense Everywhere? Panel Estimates from PISA | 33
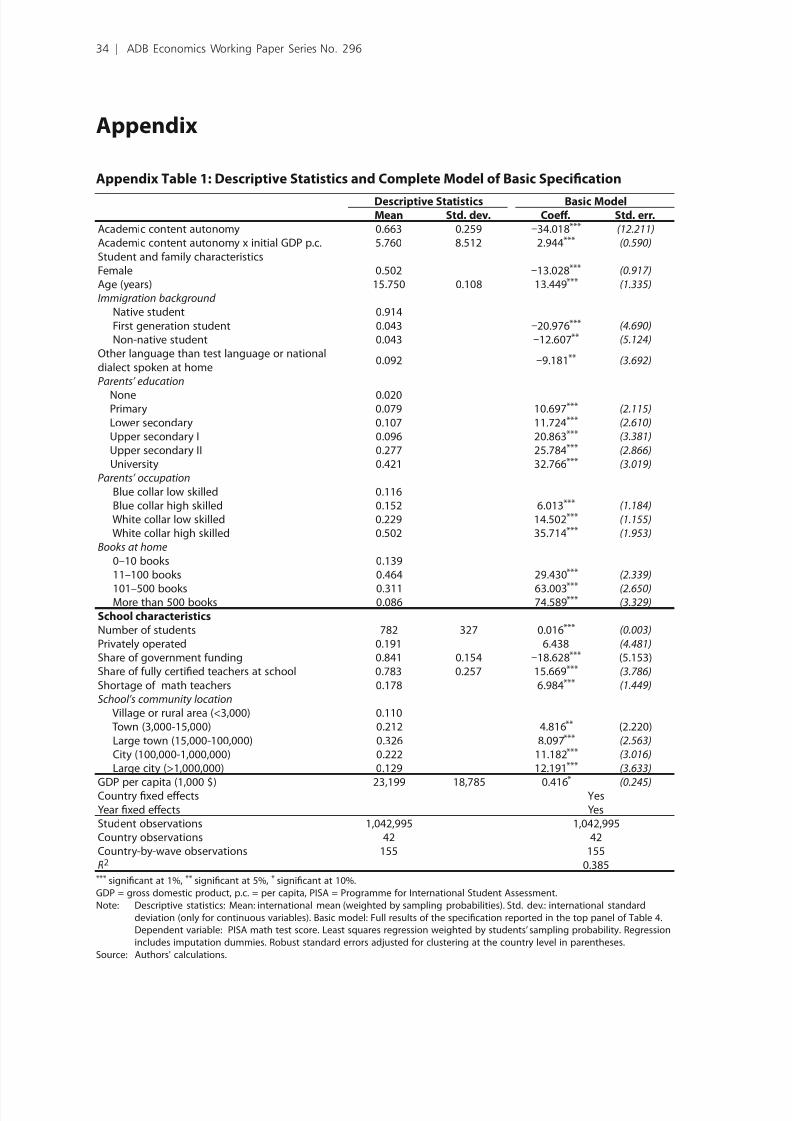
7/27/2019 Does School Autonomy Make Sense Everywhere? Panel Estimates from PISA
http://slidepdf.com/reader/full/does-school-autonomy-make-sense-everywhere-panel-estimates-from-pisa 42/48
Appendix
Appendix Table 1: Descriptive Statistics and Complete Model o Basic Specication
Descriptive Statistics Basic ModelMean Std. dev. Coef. Std. err.
Academic content autonomy 0.663 0.259 –34.018*** (12.211)
Academic content autonomy x initial GDP p.c. 5.760 8.512 2.944*** (0.590)
Student and amily characteristicsFemale 0.502 –13.028*** (0.917)
Age (years) 15.750 0.108 13.449*** (1.335)
Immigration background
Native student 0.914First generation student 0.043 –20.976*** (4.690)
Non-native student 0.043 –12.607** (5.124)
Other language than test language or nationaldialect spoken at home
0.092 –9.181** (3.692)
Parents’ education
None 0.020Primary 0.079 10.697*** (2.115)
Lower secondary 0.107 11.724*** (2.610)
Upper secondary I 0.096 20.863*** (3.381)
Upper secondary II 0.277 25.784*** (2.866)
University 0.421 32.766*** (3.019)
Parents’ occupation
Blue collar low skilled 0.116Blue collar high skilled 0.152 6.013*** (1.184)
White collar low skilled 0.229 14.502*** (1.155)
White collar high skilled 0.502 35.714*** (1.953)
Books at home
010 books 0.13911100 books 0.464 29.430*** (2.339)
101500 books 0.311 63.003*** (2.650)More than 500 books 0.086 74.589*** (3.329)
School characteristicsNumber o students 782 327 0.016*** (0.003)
Privately operated 0.191 6.438 (4.481)
Share o government unding 0.841 0.154 –18.628*** (5.153)Share o ully certifed teachers at school 0.783 0.257 15.669*** (3.786)
Shortage o math teachers 0.178 6.984*** (1.449)
School’s community location
Village or rural area (<3,000) 0.110Town (3,000-15,000) 0.212 4.816** (2.220)Large town (15,000-100,000) 0.326 8.097*** (2.563)
City (100,000-1,000,000) 0.222 11.182*** (3.016)
Large city (>1,000,000) 0.129 12.191*** (3.633)
GDP per capita (1,000 $) 23,199 18,785 0.416*
(0.245)Country fxed eects YesYear fxed eects YesStudent observations 1,042,995 1,042,995Country observations 42 42Country-by-wave observations 155 155R2 0.385*** signifcant at 1%, ** signifcant at 5%, * signifcant at 10%.GDP = gross domestic product, p.c. = per capita, PISA = Programme or International Student Assessment.Note: Descriptive statistics: Mean: international mean (weighted by sampling probabilities). Std. dev.: international standard
deviation (only or continuous variables). Basic model: Full results o the specifcation reported in the top panel o Table 4.Dependent variable: PISA math test score. Least squares regression weighted by students’ sampling probability. Regressionincludes imputation dummies. Robust standard errors adjusted or clustering at the country level in parentheses.
Source: Authors' calculations.
34 | ADB Economics Working Paper Series No. 296
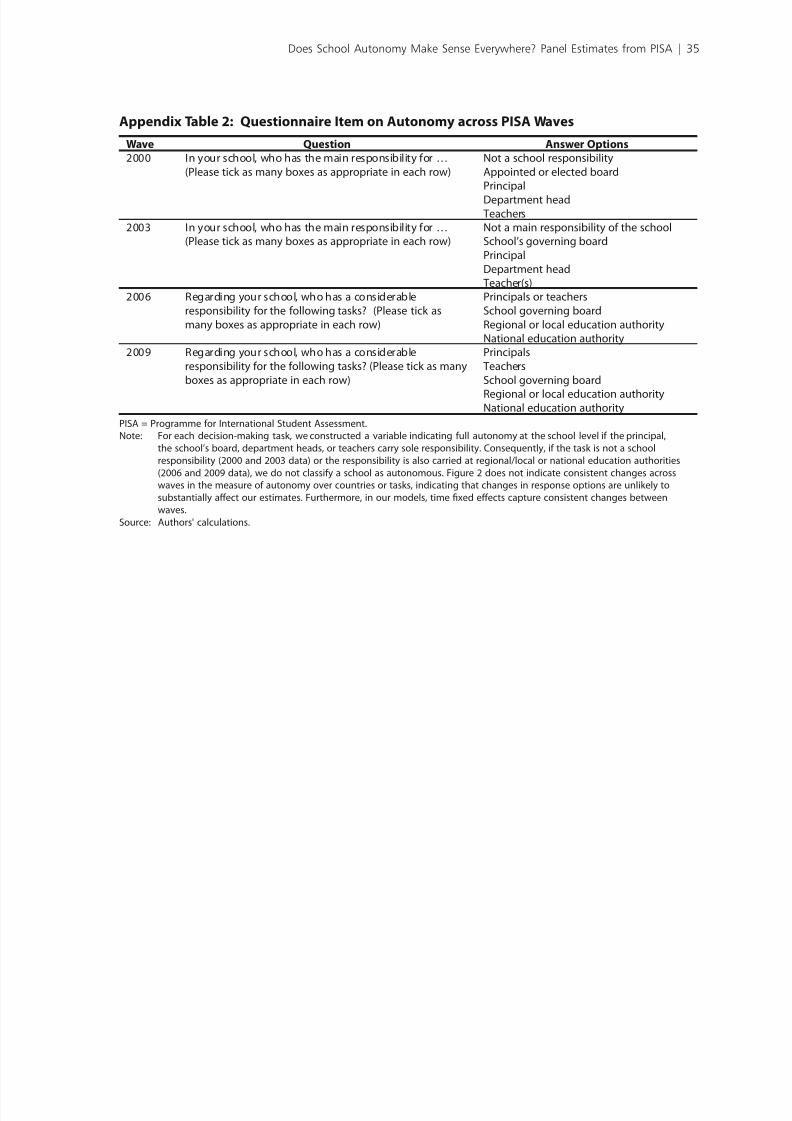
7/27/2019 Does School Autonomy Make Sense Everywhere? Panel Estimates from PISA
http://slidepdf.com/reader/full/does-school-autonomy-make-sense-everywhere-panel-estimates-from-pisa 43/48
Appendix Table 2: Questionnaire Item on Autonomy across PISA Waves
Wave Question Answer Options2000 In your school, who has the main responsibility or …
(Please tick as many boxes as appropriate in each row)Not a school responsibilityAppointed or elected boardPrincipal
Department head Teachers
2003 In your school, who has the main responsibility or …(Please tick as many boxes as appropriate in each row)
Not a main responsibility o the schoolSchool’s governing boardPrincipalDepartment head Teacher(s)
2006 Regarding your school, who has a considerableresponsibility or the ollowing tasks? (Please tick asmany boxes as appropriate in each row)
Principals or teachersSchool governing boardRegional or local education authorityNational education authority
2009 Regarding your school, who has a considerableresponsibility or the ollowing tasks? (Please tick as manyboxes as appropriate in each row)
Principals TeachersSchool governing board
Regional or local education authorityNational education authority
PISA = Programme or International Student Assessment.Note: For each decision-making task, we constructed a variable indicating ull autonomy at the school level i the principal,
the school’s board, department heads, or teachers carry sole responsibility. Consequently, i the task is not a schoolresponsibility (2000 and 2003 data) or the responsibility is also carried at regional/local or national education authorities(2006 and 2009 data), we do not classiy a school as autonomous. Figure 2 does not indicate consistent changes acrosswaves in the measure o autonomy over countries or tasks, indicating that changes in response options are unlikely tosubstantially aect our estimates. Furthermore, in our models, time fxed eects capture consistent changes betweenwaves.
Source: Authors' calculations.
Does School Autonomy Make Sense Everywhere? Panel Estimates from PISA | 35
7/27/2019 Does School Autonomy Make Sense Everywhere? Panel Estimates from PISA
http://slidepdf.com/reader/full/does-school-autonomy-make-sense-everywhere-panel-estimates-from-pisa 44/48
Appendix Table 3: Disaggregation o Basic Model: Results or Separate Autonomy
Categories
Estimation Result Details on Autonomy Efect at DiferentLevels o GDP per Capita
Main Efect(at initial
GDPp.c. o
$8000)(1)
Interactionwith Initial
GDP perCapita
(2)
GDP p.c.at which
AutonomyEfect
Switches Sign(3)
Efect inCountry with
MinimumGDP p.c.
(4)
Efect inCountry
withMaximum
GDP p.c.(5)
School autonomy over courses −21.973*** 2.380*** 17,232 −39.102*** 69.567***
(8.022) (0.481) (10.308) (15.723)R2 0.385 0.385 0.385School autonomy over content −27.604** 2.303*** 19,986 −44.174*** 60.952***
(10.283) (0.513) (12.826) (15.951)R2 0.385 0.385 0.385School autonomy over textbooks −23.635*** 2.762*** 16,557 −43.514*** 82.604***
(8.207) (0.779) (11.409) (28.213)R2 0.385 0.385 0.385
School autonomy over hiring −31.763* 3.266*** 17,725 −55.262** 93.826***
(16.369) (1.100) (22.920) (31.892)R2 0.384 0.384 0.384School autonomy over salaries −2.115 2.476** 8,854 −19.932 93.103**
(12.467) (1.156) (16.211) (43.917)R2 0.384 0.384 0.384School autonomy over budget
allocations−5.935 1.914** 11,101 −19.707 67.665***
(9.369) (0.730) (12.970) (24.346)R2 0.384 0.384 0.384
*** signifcant at 1%, ** signifcant at 5%, * signifcant at 10%.GDP = gross domestic product, p.c. = per capita, PISA = Programme or International Student Assessment.Notes: Each panel presents results o a separate regression. Dependent variable: PISA math test score. Least squares regression
weighted by students’ sampling probability, including country (and year) fxed eects. School autonomy measured ascountry average. In the main estimation, initial GDP per capita is centered at $8,000 (measured in '000s), so that the maineect shows the eect o autonomy on test scores in a country with a GDP per capita in 2000 o $8,000. Sample: student-level observations in PISA waves 2000, 2003, 2006, and 2009. Sample size in each specifcation: 1,042,995 students, 42countries, 155 country-by-wave observations. Control variables include: student gender, age, parental occupation, parentaleducation, books at home, immigration status, language spoken at home; school location, school size, share o ullycertifed teachers at school, shortage o math teachers, private versus public school management, share o governmentunding at school; country’s GDP per capita, country fxed eects, year fxed eects; and imputation dummies. Robuststandard errors adjusted or clustering at the country level in parentheses.
Source: Authors' calculations.
36 | ADB Economics Working Paper Series No. 296
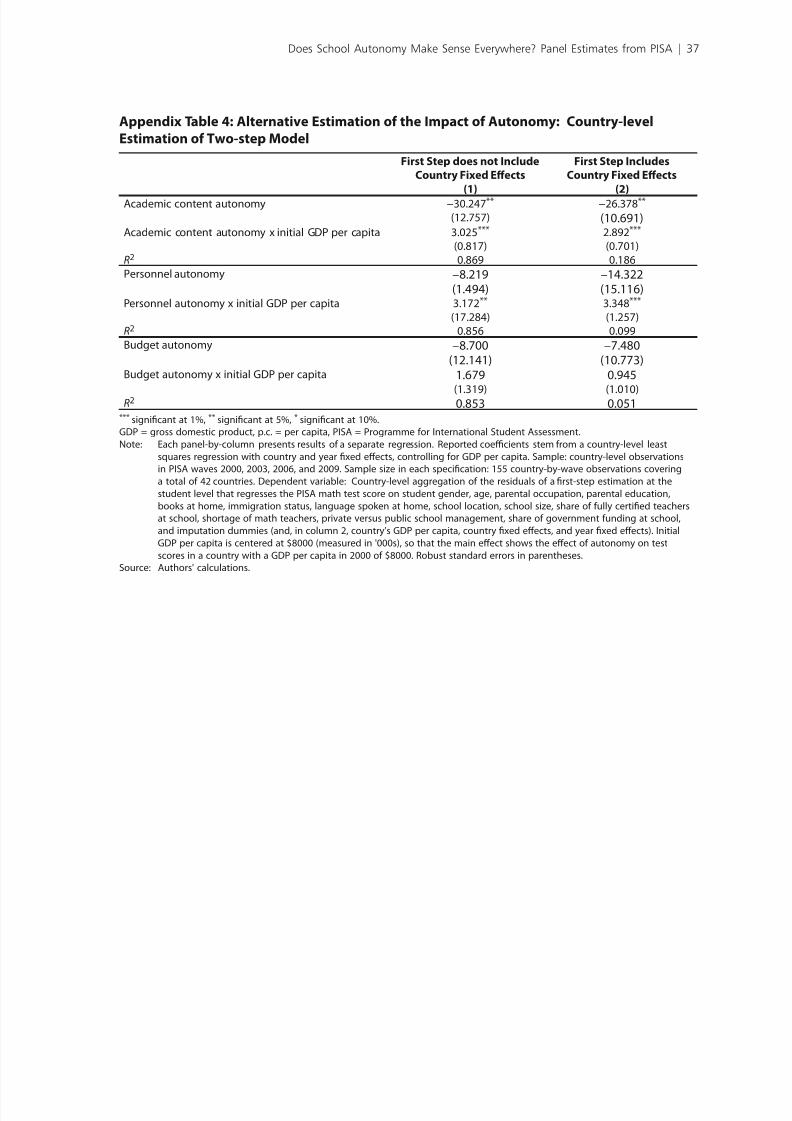
7/27/2019 Does School Autonomy Make Sense Everywhere? Panel Estimates from PISA
http://slidepdf.com/reader/full/does-school-autonomy-make-sense-everywhere-panel-estimates-from-pisa 45/48
Appendix Table 4: Alternative Estimation o the Impact o Autonomy: Country-level
Estimation o Two-step Model
First Step does not IncludeCountry Fixed Efects
First Step IncludesCountry Fixed Efects
(1) (2)
Academic content autonomy −30.247** −26.378**
(12.757) (10.691)Academic content autonomy x initial GDP per capita 3.025*** 2.892***
(0.817) (0.701)R2 0.869 0.186Personnel autonomy −8.219 −14.322
(1.494) (15.116)Personnel autonomy x initial GDP per capita 3.172** 3.348***
(17.284) (1.257)R2 0.856 0.099Budget autonomy −8.700 −7.480
(12.141) (10.773)Budget autonomy x initial GDP per capita 1.679 0.945
(1.319) (1.010)R2 0.853 0.051*** signifcant at 1%, ** signifcant at 5%, * signifcant at 10%.GDP = gross domestic product, p.c. = per capita, PISA = Programme or International Student Assessment.Note: Each panel-by-column presents results o a separate regression. Reported coecients stem rom a country-level least
squares regression with country and year fxed eects, controlling or GDP per capita. Sample: country-level observationsin PISA waves 2000, 2003, 2006, and 2009. Sample size in each specifcation: 155 country-by-wave observations coveringa total o 42 countries. Dependent variable: Country-level aggregation o the residuals o a frst-step estimation at thestudent level that regresses the PISA math test score on student gender, age, parental occupation, parental education,books at home, immigration status, language spoken at home, school location, school size, share o ully certifed teachersat school, shortage o math teachers, private versus public school management, share o government unding at school,and imputation dummies (and, in column 2, country’s GDP per capita, country fxed eects, and year fxed eects). InitialGDP per capita is centered at $8000 (measured in '000s), so that the main eect shows the eect o autonomy on testscores in a country with a GDP per capita in 2000 o $8000. Robust standard errors in parentheses.
Source: Authors' calculations.
Does School Autonomy Make Sense Everywhere? Panel Estimates from PISA | 37
7/27/2019 Does School Autonomy Make Sense Everywhere? Panel Estimates from PISA
http://slidepdf.com/reader/full/does-school-autonomy-make-sense-everywhere-panel-estimates-from-pisa 46/48
Reerences
$JKLRQ30'HZDWULSRQW&+R[E\$0DV&ROHOODQG$6DSLU³KH*RYHUQDQFHDQGerformance of niversities: vidence from urope and the ” Economic Policy ±
9 $OHVLQD$$'HYOHHVFKDXZHUDVWHUO\6.XUODWDQG5DF]LDUJ³)UDFWLRQDOL]DWLRQ´Journal of Economic Growth±
%DUDQND\DQG%RFNZRRG³'HFHQWUDOL]DWLRQDQGWKH3URGXFWLYHI¿FLHQF\RIovernment: vidence from wiss Cantons” Journal of Public Economics±
%HKUPDQ-5DQG0.LQJ³+RXVHKROG6FKRROLQJ%HKDYLRUVDQG'HFHQWUDOL]DWLRQ´Economics of Education Review ±
%LIXOFR5DQG+)DGG³KHPSDFWVRI&KDUWHU6FKRROVRQ6WXGHQW$FKLHYHPHQWvidence from orth Carolina” Education Finance and Policy ±
%LVKRS-+³'ULQNLQJIURPWKH)RXQWDLQRI.QRZOHGJH6WXGHQWQFHQWLYHWR6WXG\DQGHDUQ²[WHUQDOLWLHVQIRUPDWLRQ3UREOHPVDQG3HHU3UHVVXUH´QULF$+DQXVKHNDQG)elch, eds, Handbook of the Economics of Education, ol 2 Amsterdam: orth olland
%LVKRS-+DQGRHVVPDQQ³QVWLWXWLRQDOIIHFWVLQD6LPSOH0RGHORIGXFDWLRQDO
roduction” Education Economics±%RRNHU.60*LOSDWULF*URQEHUJDQG'-DQVHQ³KHPSDFWRI&KDUWHU6FKRRO
Attendance on tudent erformance” Journal of Public Economics±%UXQV%')LOPHUDQG+$3DWULQRV Making Schools Work: New Evidence on
Accountability Ref orms The orld Bank, ashington, C&ODUN'³KH3HUIRUPDQFHDQG&RPSHWLWLYHIIHFWVRI6FKRRO$XWRQRP\´ Journal of
Political Economy ±&5'Multiple Choice: Charter School Per f ormance in 16 States Center for esearch on
ducation utcomes, tanford niversity, tanford)LJOLR'DQG6RHE³6FKRRO$FFRXQWDELOLW\´Q$+DQXVKHN60DFKLQDQG
oessmann, eds, Handbook of the Economics of Education, ol Amsterdam: ortholland
)XFKVDQGRHVVPDQQ³KDW$FFRXQWVIRUQWHUQDWLRQDO'LIIHUHQFHVLQ6WXGHQW
erformance? A eexamination sing A ata” Empirical Economics±*DOLDQL63*HUWOHUDQG6FKDUJURGVN\³6FKRRO'HFHQWUDOL]DWLRQ+HOSLQJWKH*RRG*HW
Better, but eaving the oor Behind” Journal of Public Economics±*RYHUQRU¶V&RPPLWWHHRQGXFDWLRQDO[FHOOHQFHStudents First: Renewing Hope f or
Cali f ornia’s Future acramento: overnor’s Committee on ducational xcellence*XVWDIVVRQ-³8QGHUVWDQGLQJ&DXVDOQÀXHQFHVRQGXFDWLRQDO$FKLHYHPHQWWKURXJK
Analysis of ithincountry ifferences over Time” aper presented at the 2nd A esearch&RQIHUHQFH±RYHPEHUDVKLQJWRQ'&$YDLODEOHZZZLHDQO¿OHDGPLQXVHUXSORDG5&%URRNLQJVQVWLWXWLRQ3URJUDP*XVWDIVVRQSGI
anushek, A 1994 Making Schools Work: Improving Per f ormance and Controlling Costs TheBrookings nstitution, ashington, C
²²²³3XEOLFO\3URYLGHGGXFDWLRQ ́Q$-$XHUEDFKDQG0)HOGVWHLQHGV Handbook
of
Public Economics, ol 4 Amsterdam: orth olland²²²³KH)DLOXUHRIQSXW%DVHG6FKRROLQJ3ROLFLHV´Economic Journal )±)
+DQXVKHN$DQGRHVVPDQQ³KH5ROHRI&RJQLWLYH6NLOOVLQFRQRPLFevelopment” Journal of Economic Literature±
²²²³KHFRQRPLFVRIQWHUQDWLRQDO'LIIHUHQFHVLQGXFDWLRQDO$FKLHYHPHQW´Q$anushek, Machin, and oessmann, eds, Handbook of the Economics of Education,
Vol. 3 Amsterdam: orth olland
38 | ADB Economics Working Paper Series No. 296
7/27/2019 Does School Autonomy Make Sense Everywhere? Panel Estimates from PISA
http://slidepdf.com/reader/full/does-school-autonomy-make-sense-everywhere-panel-estimates-from-pisa 47/48
+DQXVKHN$-).DLQ6*5LYNLQDQG*)%UDQFK³&KDUWHU6FKRROXDOLW\DQGarental ecision Making with chool Choice” Journal of Public Economics±
+R[E\&0³KH3URGXFWLYLW\RI6FKRROVDQGWKHURFDO3XEOLF*RRGV3URGXFHUV´Journal of Public Economics±
-LPHQH]DQG<6DZDGD³'R&RPPXQLW\0DQDJHG6FKRROVRUN"$QYDOXDWLRQRIO
alvador’s C rogram” World Bank Economic Review ±RHE6DQG.6WUXQN³$FFRXQWDELOLW\DQGRFDO&RQWURO5HVSRQVHWRQFHQWLYHVZLWKDQG
without Authority over esource eneration and Allocation” Education Finance and Policy ±
0RXUVKHG0&&KLLRNHDQG0%DUEHUHow the World’s Most Improved School Systems
Keep Getting Better 0F.LQVH\DQG&RPSDQ\$YDLODEOHZZZPFNLQVH\FRP&OLHQW6HUYLFH6RFLDO6HFWRUDWHVWWKLQNLQJPHGLD0F.LQVH\GRWFRPFOLHQWVHUYLFH6RFLDO6HFWRU3')V+RZWKHRUOGV0RVWPSURYHG6FKRRO6\VWHPV.HHS*HWWLQJ%HWWHU'RZQORDGYHUVLRQ)LQDODVK[
HFK\ED-³&HQWUDOL]DWLRQ)LVFDO)HGHUDOLVPDQG3ULYDWH6FKRRO$WWHQGDQFH´International Economic Review ±
UJDQLVDWLRQIRUFRQRPLF&RRSHUDWLRQDQG'HYHORSPHQWEducation at a Glance 2010:
OECD Indicators rganisation for conomic Cooperation and evelopment, arisXFKL*Making Schools Work: A Revolutionary Plan to Get Your Children the
Education They Need ew ork: imon chuster6XPPHUV$$DQG$-RKQVRQ³KHIIHFWVRI6FKRRO%DVHG0DQDJHPHQW3ODQV´
n A anushek and orgenson, eds, Improving America’s Schools: The Role of
Incentives ashington, C: ational Academy ressegas, 1999 chool Choice, tudent erformance, and Teacher and chool Characteristics:
KH&KLOHDQ&DVHRUOG%DQN3ROLF\5HVHDUFKRUNLQJ3DSHURKHRUOG%DQNashington, C
RHVVPDQQ³6FKRROLQJ5HVRXUFHVGXFDWLRQDOQVWLWXWLRQVDQG6WXGHQW3HUIRUPDQFHKHnternational vidence” Ox f ord Bulletin of Economics and Statistics±
²²²³KHIIHFW+HWHURJHQHLW\RI&HQWUDO[DPVYLGHQFHIURP0660665HSHDWand A” Education Economics±
RHVVPDQQXHGHPDQQ*6FKXHW]DQG05HVWSchool Accountability, Autonomy, and Choice around the World Cheltenham: dward lgarRUOG%DQNWorld Development Report 2004: Making Services Work f or Poor People The
orld Bank, ashington, C
Does School Autonomy Make Sense Everywhere? Panel Estimates from PISA | 39
7/27/2019 Does School Autonomy Make Sense Everywhere? Panel Estimates from PISA
http://slidepdf.com/reader/full/does-school-autonomy-make-sense-everywhere-panel-estimates-from-pisa 48/48
About the PaperEric A. Hanushek, Susanne Link, and Ludger Woessmann write that decentralization ofdecision making is among the most intriguing recent school reforms, in part becausecountries went in opposite directions over the past decade and because prior evidenceis inconclusive. The new panel estimation with country fixed effects identifies the effectof school autonomy from within-country changes in the average share of schools with
autonomy over key elements of school operations, based on a panel dataset of the fourwaves of international Programme for International Student Assessment tests spanning2000–2009 and comprising over 1 million students in 42 countries. The results show thatautonomy affects student achievement negatively in developing and low-performingcountries, but positively in developed and high-performing countries.
About the Asian Development Bank ADB’s vision is an Asia and Pacific region free of poverty. Its mission is to help itsdeveloping member countries reduce poverty and improve the quality of life of theirpeople. Despite the region’s many successes, it remains home to two-thirds of theworld’s poor: 1.8 billion people who live on less than $2 a day, with 903 million
struggling on less than $1.25 a day. ADB is committed to reducing poverty throughinclusive economic growth, environmentally sustainable growth, and regionalintegration.
Based in Manila, ADB is owned by 67 members, including 48 from the region. Itsmain instruments for helping its developing member countries are policy dialogue, loans,equity investments, guarantees, grants, and technical assistance.
Asian Development Bank 6 ADB Avenue, Mandaluyong City1550 Metro Manila, Philippineswww.adb.org/economicsISSN: 1655-5252