Embed Size (px)
Citation preview
PREDICTING ENVIRONMENTALLY-FRIENDLY BEHAVIOR:
DOES POLITICAL IDEOLOGY AFFECT WILLINGNESS TO CHANGE BEHAVIOR
TO HELP IMPROVE THE ENVIRONMENT?
A Thesis
Presented to the faculty of the Department of Public Policy and Administration
California State University, Sacramento
Submitted in partial satisfaction of the requirements for the degree of
MASTER OF PUBLIC POLICY AND ADMINISTRATION
by
Sabrina A. Bradbury
SPRING 2012

ii
© 2012
Sabrina A. Bradbury
ALL RIGHTS RESERVED
iii
PREDICTING ENVIRONMENTALLY-FRIENDLY BEHAVIOR:
DOES POLITICAL IDEOLOGY AFFECT WILLINGNESS TO CHANGE BEHAVIOR
TO HELP IMPROVE THE ENVIRONMENT?
A Thesis
by
Sabrina A. Bradbury Approved by: __________________________________, Committee Chair Su Jin Gatlin Jez, Ph. D. __________________________________, Second Reader Mary Kirlin, D.P.A. ____________________________ Date
iv
Student: Sabrina A. Bradbury
I certify that this student has met the requirements for format contained in the University format
manual, and that this thesis is suitable for shelving in the Library and credit is to be awarded for
the thesis.
__________________________, Department Chair ___________________ Robert Wassmer, Ph. D. Date Department of Public Policy and Administration
v
Abstract
of
PREDICTING ENVIRONMENTALLY-FRIENDLY BEHAVIOR:
DOES POLITICAL IDEOLOGY AFFECT WILLINGNESS TO CHANGE BEHAVIOR
TO HELP IMPROVE THE ENVIRONMENT?
by
Sabrina A. Bradbury
Statement of Problem
Scientists and researchers argue that overconsumption of resources and continued
pollution from human activities have created a variety of environmental problems
including deforestation, loss of biodiversity, changes in climate, loss of open space, poor
water quality, and poor air quality (Vitousek, 1993, Gershon, 2009). Solving these
problems is going to require that people practice environmentally-friendly behaviors such
as recycling, driving less, conserving water and conserving land. I use regression analysis
to examine people’s willingness to change some of the things they do to help improve the
environment with a focus on the influence of political ideology.
Sources of Data
The data used in this thesis is from the ABC News/Stanford University/Washington
Post Survey on Global Warming conducted in April of 2007. ABC News, Stanford
vi
University, and Washington Post conducted the survey of 1,002 United States residents
via phone interviews through random-digit dialing.
Conclusions Reached
After controlling for knowledge and attitudes about the environment, demographic
characteristics, support for environmental policy, and recycling law being required in the
community, multiple regression analysis results show that political ideology is not a
significant predictor of how willing people are to change some of the things they do to
help improve the environment. Instead, I found that the more people think something can
be done to reduce future global warming the more wiling people are to change their
behavior to help improve the environment. The other variables that turned out to be
significant predictors of willingness to change behavior include being Hispanic, having
kids under the age of 18 living at home, and favoring a gas tax as a way to reduce future
global warming.
_______________________, Committee Chair Su Jin Gatlin Jez, Ph. D. _______________________ Date
vii
ACKNOWLEDGEMENTS
First, I sincerely thank my husband Eric for his continuous encouragement and
patience throughout my educational pursuits. His humor and support helped me
immensely in writing this thesis. Without him, I would have lost my sanity long ago.
I would also like to thank Dr. Su Jin Gatlin Jez and Dr. Mary Kirlin, my thesis
advisors, for always being available and responsive to my many questions throughout this
process. Their excellent comments, questions and feedback helped me write a stronger
thesis. The Public Policy and Administration Department is full of amazing faculty and
students who have all helped me greatly during my three-year journey of pursuing this
Master’s degree, and I will always be thankful for the relationships I have made over
these years.
Last, but certainly not least, I am grateful for the support my parents and sister
have given me over the past few years. I have not been able to visit them as much as I
would have liked to in recent years, but they were always understanding and continued to
encourage me to focus on school. Thank you all for everything you have done to make
this thesis possible.
viii
TABLE OF CONTENTS
Page
Acknowledgments ................................................................................................................. vii
List of Tables ............................................................................................................................ x
List of Figures .......................................................................................................................... xi
Chapter
1. INTRODUCTION ........................ ……………………………………………………….. 1
Environmental Issues and the Role of Government… ................................................. 3
Encouraging Environmentally-Friendly Behavior… ................................................... 5
Outline of Thesis Chapters… ........................................................................................ 8
2. LITERATURE REVIEW ................................................................................................. 10
Knowledge and Attitudes About the Environment… ................................................ 11
Demographic Characteristics… ................................................................................. 15
Influences of Economic and Environmental Policy on Individual Behavior .............. 19
Conclusion… .............................................................................................................. 21
3. METHODOLOGY ........................................................................................................... 23
Dependent Variable and Theoretical Model… ........................................................... 23
Key Explanatory and Independent Variables….......................................................... 28
Data….. ....................................................................................................................... 34
4. RESULTS ......................................................................................................................... 38
Heteroskedasticity… ................................................................................................... 38
Multicollinearity… ..................................................................................................... 38
ix
Regression Results… .................................................................................................. 41
5. CONCLUSION ................................................................................................................. 46
Significant Predictors of Environmentally-Friendly Behavior… ............................... 47
Recommendations for Encouraging Environmentally-Friendly Behavior… ............. 49
Limitations of This Research ...................................................................................... 51
Final Thoughts… ........................................................................................................ 53
References ............................................................................................................................... 54
x
LIST OF TABLES
Tables Page
1. Variable Descriptions and Expected Signs…………….…………….. ............ 26
2. Descriptive Statistics ............................................................... ………………. 35
3. Simple Correlation Coefficients ................ ……….…………………………. 40
4. Variance Inflation Factors ............................................... ……………………. 41
5. Regression Coefficients .................................................. ……………………. 45
xi
LIST OF FIGURES
Figures Page
1. Ecological Behavior as a Function of Environmental Attitude Extended by Responsibility Feelings .............. ………….…………………………………. 15
1
CHAPTER 1 INTRODUCTION
People have discussed and debated environmental issues and the solutions to them
for decades. Scientists and researchers argue that overconsumption of resources and
continued pollution from human activities have created a variety of environmental
problems including deforestation, loss of biodiversity, changes in climate, loss of open
space, poor water quality, and poor air quality (Vitousek, 1993, Gershon, 2009).
Scientists predict that sea level rises, reductions in crop yields, increased floods, loss of
land, and reductions in fresh water resources will be just a few of the side effects of
climate change (IPCC, 2007). With scientific evidence continuing to show that human
behavior affects water quality, water supply, land use, air quality, and climate change
(IPCC, 2007; Vitousek, 1993), policy makers are beginning to take more interest in the
subject of environmentally-friendly behavior change (Barr, Glig & Shaw, 2010;
Crompton, 2008; Darnton et al., 2006; Gershon, 2009; Stern, 2000).
The United States Environmental Protection Agency (2012) encourages a plethora
of environmentally-friendly behaviors such as conserving water, keeping soap out of the
gutters, conserving energy, using fewer pesticides and reducing vehicle use. Policy
makers and public organizations continue to consider what government can do to
encourage people to practice these environmentally-friendly behaviors. Should
government do anything, or will we find technological solutions to environmental
problems through the free market? Which factors motivate people to act in
environmentally-friendly fashions, and are those factors something that government can
2
influence? These are just a few of the questions that social scientists from many
disciplines have attempted to answer in the past four decades.
I am interested in determining if there is a significant relationship between
political ideology and willingness to change behavior to improve the environment. Are
people who are ideologically liberal more willing to change some of the things they do to
improve the environment than people who are ideologically conservative? Researchers
have examined the relationship between political ideology and environmentally-friendly
attitudes assuming that attitudes will lead to environmentally-friendly behavior
(Kollmuss & Agyeman, 2002), but few have examined the direct relationship between
political ideology and environmentally-friendly behavior.
While not quite the same as examining the affect of political ideology on
environmentally-friendly behavior, Borek & Bohon (2008) examined the impact of
“policy climates” on people’s frequency in reducing vehicle use for environmental
reasons. The researchers measured policy climates in the European Union by the number
and type of federally enacted environmentally-friendly policies, a government’s
participation in international cooperative efforts at reducing global climate change, and
national provisions or subsidies for energy and material use. Governments with the
highest frequency in reducing vehicle use for environmental reasons were the countries
that had more environmentally-friendly policies, participated in cooperative efforts at
reducing climate change, and had more subsidies for energy and material use.
Similar to Borek & Bohon (2008), I am interested in examining the impacts of
politics on practicing environmentally-friendly behavior. Specifically, I examine whether
3
or not political ideology affects willingness to change behavior to help improve the
environment. To do this, I use survey data from the April 2007 ABC News/Washington
Post/Stanford University Global Warming Poll to examine the impact of ideology on
people’s willingness to change some of the things they do to help improve the
environment. I use regression analysis to examine this relationship, controlling for
variables including age, education, gender, income and a variety of other demographic
characteristics, attitudes and knowledge about the environment, as well as political and
economic influences on individuals’ willingness to change behavior for the environment.
In the following sections of this chapter, I discuss environmental issues and the role of
government, the significance of willingness to change behavior as it relates to
environmental policy objectives, and I describe how this thesis is organized.
Environmental Issues and the Role of Government
Economists consider environmental problems such as air pollution, water
pollution, and rapid changes in climate, negative externalities that are a result of the
market’s failure to incorporate these costs into the economy (Munger, 2001). In the case
of climate change, the market has failed to account for the ecological and social costs of
emitting greenhouse gases into the air. Since the market has failed to account for these
costs and the sources of pollution and overconsumption are so diverse, public policy can
be an appropriate tool to address climate change, air quality, water quality and other
environmental issues.
The challenge is that environment problems are often very complex and difficult
to address especially when using one specific policy. Using climate change as one
4
example, activities such as driving, using energy (home and office), consuming food,
purchasing products, and traveling, all add to greenhouse gas emissions. States such as
California have passed legislation to address poor air quality, poor water quality and most
recently, climate change. California’s Assembly Bill 32 (AB 32), the Global Warming
Solutions Act, was passed in 2006, and requires that California reduce its greenhouse gas
emissions to 1990 levels by the year 2020 (ARB, 2011). CalEPA’s Air Resources Board
(ARB) is the organization charged with identifying strategies to reduce greenhouse gas
emissions (ARB, 2011) and one aspect of implementing this law will involve getting
individuals to modify their behaviors in ways that will reduce greenhouse gas emissions.
The California Air Resources Board (ARB) has identified potential reductions in
greenhouse gas emissions through the development of a cap-and-trade program, clean
energy projects and vehicle-emission target setting. While ARB does not explicitly
mention “environmentally-friendly behavior” in its scoping plan’s recommended
measures to reduce greenhouse gas emissions, one can read that programs such as Million
Solar Roofs and Advanced Clean Cars aim to encourage businesses and consumers to
install solar roofs and produce/drive advanced clean cars (ARB, 2008). Through ARB’s
Cap-and-Trade Program, refineries, power plants, transportation fuels, and industrial
facilities will need to operate under a greenhouse gas emissions cap that will decline over
time in an effort to encourage ever-increasing efficient use of energy (ARB, 2008).
Not all economists agree that government should create environmental protection
policies, especially since these policies could stifle economic growth and may not
succeed in efficiently reducing emissions (Brady, 2011). Economist Bjorn Lomborg
5
(2005) argues that innovation and economic prosperity will allow future generations to
address climate change through the creation of new technologies. If we stifle economic
growth, he argues, we might end up leaving future generations with less wealth than they
might otherwise have had. While these concerns are understandable, climate scientists at
IPCC (2007) argue that mitigation actions could result in near-term co-benefits (such as
improved health from reduced air pollution and increased water reserves from
conservation efforts), and that these benefits will off-set other mitigation costs.
Additionally, mitigation actions could help us reduce, delay or avoid some of the future
impacts of climate change (IPCC, 2007) which could further reduce future mitigation
costs.
Encouraging Environmentally-Friendly Behavior
Ecologists, political scientists, economists, sociologists, psychologists and experts
from other disciplines continue to debate the best approach to encouraging behavior
changes that will improve the environment. Until recently, most research related to
environmentally-friendly behavior change focused on behavior at the individual level.
Researchers sought to understand why people practiced environmentally-friendly
behaviors and what specific factors influenced their behavior choices (De Young, 1986;
Klineberg, McKeever, & Rothenbach, 1998; Kollmuss & Ageyman, 2002).
Acknowledging the realities of economic decisions, many behavior theories argue that
people make rational choices based on the information available to them at the time
(Kollmuss & Ageyman, 2002; Welsch & Kuhling, 2010). Researchers therefore argued
that getting people to reduce water or to conserve energy was as simple as educating
6
people that overconsumption of these resources is happening and tell them what they can
do to help improve the situation.
As such, many of the strategies for encouraging environmentally-friendly
behaviors have focused on information intensive campaigns and economic incentives
aimed at individual consumers (Crompton, 2008; McKenzie-Mohr, 2002). Environmental
organizations use education intensive campaigns to inform people about environmental
problems and make them aware of actions they can take to address the problems
(Crompton, 2008; McKenzie-Mohr, 2002). Companies encourage people to buy green
products by highlighting the financial benefits of purchasing energy efficient products
(Crompton, 2008) such as air conditioning units and light bulbs. The California Air
Resources Board’s Million Solar Roof program uses financial incentives such as rebates
to encourage the installation of solar products on rooftops (CARB, 2008).
Researchers have often found, however, that getting people to change behaviors is
much more difficult than simply providing information or financial incentives (Blake,
1999; Crompton, 2008; Gershon, 2009; Kollmuss & Ageyman, 2002; Oskamp, 2010;
Stern, 2005). Crompton (2008) and Gershon (2009) argue that the limitation of these
targeted marketing techniques is that they do not focus on individuals’ underlying values
regarding the environment. Crompton (2008) points to evidence that promoting
environmentally-friendly behaviors might be more effective if campaigns focus on
intrinsic motivators such as environmental values, as opposed to the extrinsic motivators
of financial incentives. This focus on intrinsic values will create longer-lasting and more
widespread environmentally-friendly behavior change (Crompton, 2008; Gershon, 2009).
7
Given this information, I am curious to know if people are motivated by political
ideology to practice environmentally-friendly behaviors. Perhaps people would be willing
to change more of their behaviors in order to improve the environment if it is something
with which they philosophically and ideologically agree. For example, is it possible that
people who are more politically liberal and tend to support environmental policies are
more willing to change some of their own personal behaviors in order to improve the
environment? Alternatively, are politically conservative people more willing than their
liberal counterparts are to change some of their behaviors to improve the environment?
Theodori & Luloff (2002) found that liberals were more likely than conservatives were to
maintain pro-active positions on the environment and that the people who held these
positive pro-active positions on the environment were more likely to engage in
environmentally-friendly behaviors. In this thesis, I test the direct relationship between
political ideology and willingness to engage in environmentally-friendly behaviors.
Since it is becoming increasingly clear that solutions to environmental issues will
require individuals to modify their behavior, I focus my research on examining the ways
in which political ideology affects people’s willingness to practice environmentally-
friendly behaviors and how we might be able to use this information to encourage
behaviors that reduce negative environmental impacts. My hypothesis is that politically
liberal people are going to be more willing than politically conservative people are to
change some of the things they do to improve the environment since other researchers
have found that liberals are more likely to hold pro-active positions on environmental
8
issues and support environmental policies (Klineberg et al., 1998; Theodori & Luloff,
2002).
Outline of Thesis Chapters
For this thesis, I conduct a regression analysis to examine the relationship
between political ideology and people’s willingness to change some of the things they do
to help improve the environment. I also examine the relationship between willingness to
change behavior to help improve the environment and other indicators including age,
education, income, homeownership, environmental attitudes, and race. This analysis,
along with a review of relevant literature on the topic of environmentally-friendly
behavior change will allow me to provide some recommendations to policy makers,
public officials and non-profit leaders regarding the role of political ideology in
promoting environmental behavior change. This thesis provides insight into the question
of whether changing behavior to improve the environment is a purely partisan issue or
whether people of all ideologies are willing to modify their behavior to benefit the
environment.
In the following chapter, I provide an overview of literature that examines many
variables found to be significant predictors of environmentally-friendly behavior. In
Chapter 3, I outline the methodology I use to analyze the survey data including an
overview of regression analysis, data coding, and the limitations of regression analysis. I
report and analyze the results from the regression analysis in Chapter 4 beginning to form
initial recommendations for elected officials and staff who are writing and implementing
policy as well as for public managers implementing environmental programs and non-
9
profit organizations seeking to encourage environmentally-friendly behavior. Finally, I
will conclude with major findings and recommendations regarding the influence of
political ideology on willingness to change behavior to help improve the environment in
Chapter 5.
10
CHAPTER 2 LITERATURE REVIEW
The amount of research that examines the factors that influence environmentally-
friendly behavior is vast and diverse, branching into many different disciplines (e.g.,
Barr, Gilg, & Shaw, 2010; Corbett, 2005; Darnton, 2008; Darnton, Elster-Jones, Lucas, &
Brooks, 2006; Gershon, 2009; Hargreaves, 2011; Kaiser, Ranney, Hartig & Bowler,
1999; Klineberg, McKeever & Rothenbach, 1998; Kollmuss & Agyeman, 2002; Oskamp,
2000; Stern, 2000; Quimby & Angelique, 2011). Psychologists, sociologists, economists
and political scientists have used and developed a variety of models and theories in an
effort to explain what motivates people, organizations and societies to change behavior,
and in recent years have focused on applying these models and theories to promoting
environmentally-friendly behavior change (Darnton et al., 2008). In this thesis, I do not
synthesize all the literature on behavior change as it stretches from individuals, to
organizations, and to society as a whole. Instead, I focus on the individual socio-
psychological research partly to keep the thesis to a reasonable scope, but also because
individuals are often agents of changes that can affect change within organizations and
governments. While I do provide a brief overview of the influence that support for
environmental policy has on individual behavior, I recommend that researchers continue
to examine the ways in which individual, organizational, and societal factors interconnect
and influence one another.
In this chapter, I summarize what variables researchers have found to influence
individuals to practice environmentally-friendly behaviors into three categories;
knowledge and attitudes about the environment, demographic characteristics, and the
11
influence of economic and environmental policy on individual behavior. The
environmentally-friendly behaviors examined in the studies below include:
Driving less (Borek & Bohon, 2008; Corbett, 2005; Kaiser et al., 1999),
Recycling and reusing materials (Klineberg et al., 1998; Hopper & Neilsen, 1991)
Purchasing “green” products such as those that are recycled, made using fewer resources (Scott & Willits, 1994)
Joining clean-up drives (Scott & Willits, 1994)
Attending environmental organization meetings (Scott & Willits, 1994)
Avoiding environmentally-damaging products (Klineberg et al., 1998)
Giving time or money to an environmental group (Klineberg et al., 1998)
Supporting taxes on gas or electricity (Kaiser et al, 1999)
The studies I review in this section examine the relationship between these
environmentally-friendly behaviors and variables related to knowledge and attitudes
about the environment, demographic characteristics, and the influences of economic and
environmental policy on individual behavior. Researchers have explored variables such
as altruism, political ideology, age, gender, income, education level and environmental
regulations. I use this research to inform the regression equation used in this thesis.
Knowledge and Attitudes About the Environment
Researchers in the mid to late 20th century examined the impact of environmental
knowledge and attitudes on promoting environmentally-friendly behavior (DeYoung,
1986; Hines, Hungerford, & Tomera, 1986–87). After being educated about the problems
and possible solutions surrounding environmental issues, researchers predicted that
12
people would begin to modify their behaviors to benefit the environment. Some
researchers have shown that environmental knowledge can have a positive effect on
environmentally-friendly attitudes, which can then translate into a positive impact on
environmentally-friendly behaviors (Borick & Rabe, 2010; Kollmuss & Ageyman, 2002).
For example, Borick & Rabe (2010) conducted national and state level surveys to analyze
which factors shape beliefs and attitudes about climate change and found that a
combination of personal observations, meteorological events, and physical changes in the
planet all influenced people’s attitudes and beliefs about climate change, with partisan
leaning playing a significant role.
While the influence of political ideology on environmentally-friendly attitudes
and beliefs is clear, the relationship between political ideology and environmentally-
friendly behavior is less certain. Researchers have found some evidence that people who
hold environmentally-friendly attitudes are more likely to practice environmentally-
friendly behaviors but this relationship is often modest at best (Blake; 1999; Scott &
Willits, 1994). Knowing that attitudes are shaped by knowledge can be useful
information in gaining support for climate change policies, but critics argue that it does
little to predict environmentally-friendly behaviors (Kaiser et al., 1999; Lubell, Zahran, &
Vedlitz, 2007).
Researchers refer to this gap between environmentally-friendly attitudes and
environmentally-friendly behavior as the Value-Action Gap (Blake, 1999) or the
Attitude-Behavior Gap (Darnton, 2006; Kollmuss & Agyeman, 2002). On one hand, it
might make sense to hypothesize that people who have knowledge about environmental
13
problems and express environmentally-friendly attitudes would practice environmentally-
friendly behaviors. Kollmuss & Agyeman (2000) argue that it does not make sense to
assume environmental knowledge or attitudes will increase the likelihood one will
practice environmentally-friendly behaviors after one considers how difficult it really is
to change existing habits. One reason why attitudes may not lead to changes in behavior
is that there is often a weak link between attitudes and behaviors. Behaviors such as
driving or flying are not always closely linked to attitudes such as being concerned about
air quality, land conservation or climate change (Darnton, 2006; Kollmuss & Agyeman,
2000; Quimby & Angelique, 2011).
Altruism
A variety of studies have been conducted to assess the impact of people’s morals,
values and feelings of altruism on environmentally-friendly behaviors (e.g. Corbett,
2005; De Young, 1985; Hopper & McCarl Nielsen, 1991; Kaiser et al., 1999; Lubell et
al., 2007). According to Schwartz’s norm-activation (or altruism) theory, behavior is
informed by social norms and personal norms that can be activated by ascription to
responsibility and awareness of consequences of the given situation or issue. From this
perspective, people will practice environmentally-friendly behaviors when norms are
activated by feelings of responsibility related to environmental problems and/or
awareness of consequences of the environmental problems (Hopper & McCarl Nielsen,
1991). This involves thinking about other people and the larger social consequences of
one’s actions as opposed to only considering one’s individual concerns or comfort.
14
An early example of research relating environmentally-friendly behaviors to
altruism can be found in De Young’s (1985-86) survey data, which shows that people are
intrinsically motivated to recycle and reuse materials. De Young argues that the extrinsic
motivators such as being paid to recycle had little impact on motivating people to recycle,
while intrinsic factors such as finding personal satisfaction in recycling proved to be
strongly correlated with behavior. Researchers seeking to explain environmentally-
friendly behavior, according to De Young (1985-86), should focus on investigating the
personal satisfactions that result from practicing recycling or conservation activities and
helping people experience those satisfactions.
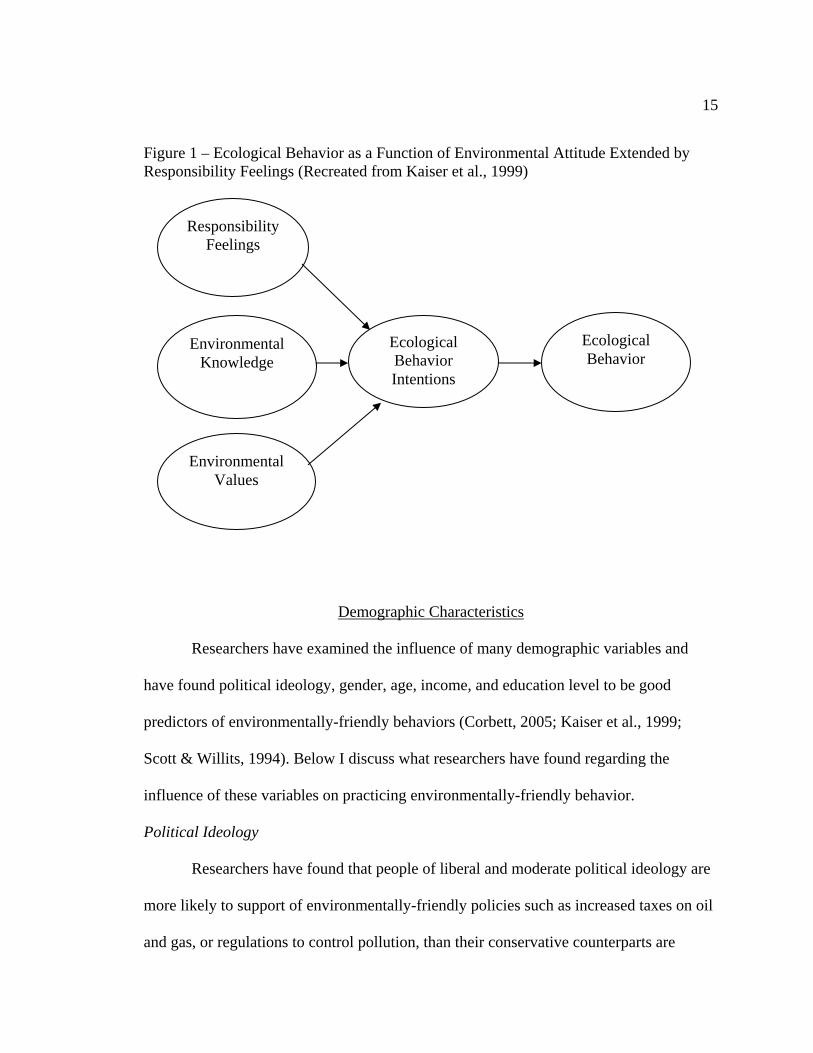
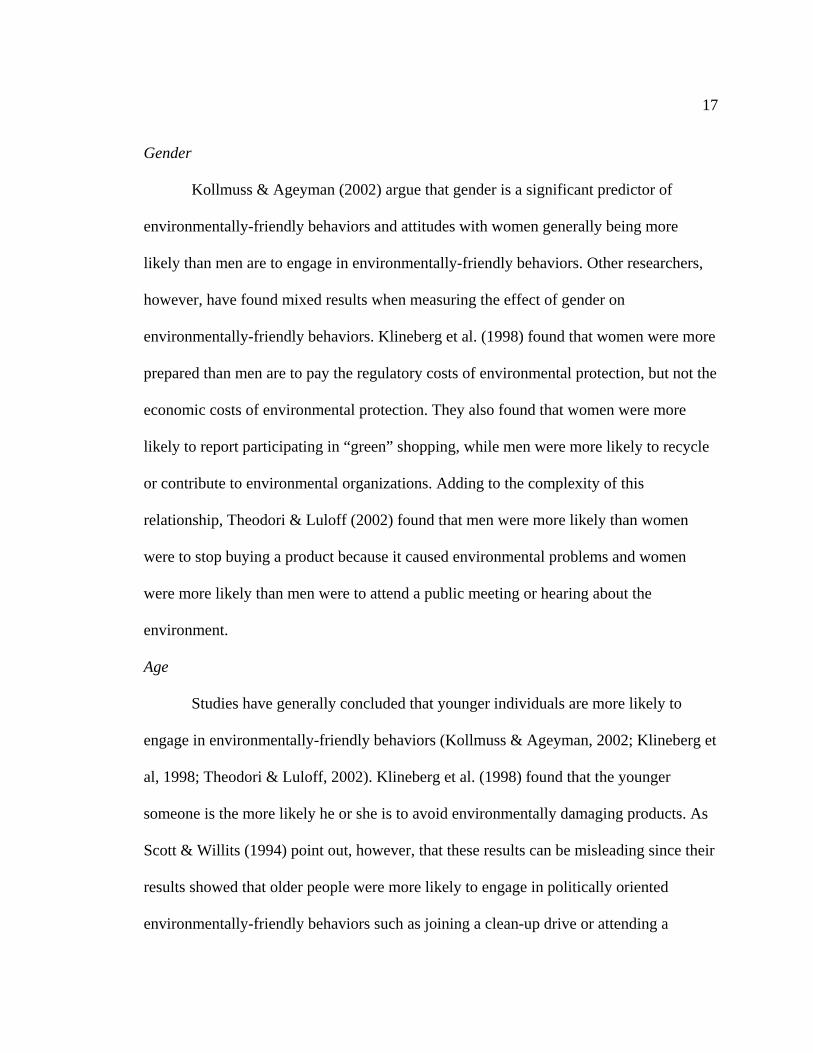
Kaiser et al. (1999) also argue that ecological or environmentally-friendly
behavior is at least partially in the moral realm. After analyzing survey data from two
different studies conducted on the same topic, the researchers explained that rational
choice models were not sufficient in predicting environmentally-friendly behavior largely
because they exclude variables related to social norms. Feelings of responsibility,
environmental knowledge, and values all influence ecological behavior intention which
influences environmentally-friendly behavior as shown in Figure 1 below (Kaiser et al.,
1999).
15
Figure 1 – Ecological Behavior as a Function of Environmental Attitude Extended by Responsibility Feelings (Recreated from Kaiser et al., 1999)
Demographic Characteristics
Researchers have examined the influence of many demographic variables and
have found political ideology, gender, age, income, and education level to be good
predictors of environmentally-friendly behaviors (Corbett, 2005; Kaiser et al., 1999;
Scott & Willits, 1994). Below I discuss what researchers have found regarding the
influence of these variables on practicing environmentally-friendly behavior.
Political Ideology
Researchers have found that people of liberal and moderate political ideology are
more likely to support of environmentally-friendly policies such as increased taxes on oil
and gas, or regulations to control pollution, than their conservative counterparts are
Responsibility Feelings
Environmental Knowledge
Environmental Values
Ecological Behavior Intentions
Ecological Behavior

16
(Klineberg et al., 1998). Supporting environmentally-friendly policies, however, is not
the same as being more likely to practice environmentally-friendly behaviors. Klineberg
et al. (1998) argue that the positive correlation between being liberal and supporting
environmentally-friendly policies may be in part due to the way in which questions about
environmental concern and behavior are presented. Survey questions often ask
respondents to make tradeoffs between economic growth and environmental regulation.
People who fall on the conservative side of the political spectrum tend to want less
government regulation in general so it may be misleading to assume they do not have
concern for environmental issues or are unwilling to practice environmentally-friendly
behaviors. It may be that they just do not want environmental regulation at the expense of
business interests and the economy.
Theodori & Luloff (2002) found that liberals were more likely than conservatives
were to maintain pro-active positions on the environment. They also found a positive
relationship between maintaining proactive positions on the environment and engaging in
environmentally-friendly behaviors. Scott & Willits (1994) found that people who were
politically liberal were more likely to practice consumer related environmentally-friendly
behaviors, but not necessarily more likely to participate in political environmentally-
friendly behaviors such as attending meetings at an environmental organization or joining
clean-up drives. Since there is some inconsistency in the findings that liberals are more
likely to practice environmentally-friendly behaviors I use regression analysis to test this
relationship in this thesis.
17
Gender
Kollmuss & Ageyman (2002) argue that gender is a significant predictor of
environmentally-friendly behaviors and attitudes with women generally being more
likely than men are to engage in environmentally-friendly behaviors. Other researchers,
however, have found mixed results when measuring the effect of gender on
environmentally-friendly behaviors. Klineberg et al. (1998) found that women were more
prepared than men are to pay the regulatory costs of environmental protection, but not the
economic costs of environmental protection. They also found that women were more
likely to report participating in “green” shopping, while men were more likely to recycle
or contribute to environmental organizations. Adding to the complexity of this
relationship, Theodori & Luloff (2002) found that men were more likely than women
were to stop buying a product because it caused environmental problems and women
were more likely than men were to attend a public meeting or hearing about the
environment.
Age
Studies have generally concluded that younger individuals are more likely to
engage in environmentally-friendly behaviors (Kollmuss & Ageyman, 2002; Klineberg et
al, 1998; Theodori & Luloff, 2002). Klineberg et al. (1998) found that the younger
someone is the more likely he or she is to avoid environmentally damaging products. As
Scott & Willits (1994) point out, however, that these results can be misleading since their
results showed that older people were more likely to engage in politically oriented
environmentally-friendly behaviors such as joining a clean-up drive or attending a

18
meeting related to ecology but younger people were more likely to engage in consumer
related environmentally-friendly behaviors.
Income
People with higher levels of income are usually more likely to express concern for
environmental issues and practice environmentally-friendly behaviors (Klineberg et al.,
1998; Scott & Willits, 1994; Theodori & Luloff, 2002). Scott & Willits found that people
with higher levels of income were indeed more likely to engage in both consumer and
political environmental behaviors, but the associations were weak making it difficult to
draw any strong conclusions about the relationship. In contrast, Borek & Bohon (2008)
found that people with a family income at or above the national average were actually 13
percent less likely to reduce driving for environmental reasons. This is one example in
which the specific behavior being examined by the researcher can greatly affect the
results of the research. Scott & Willits (1994) examined consumer behaviors such as
purchasing a product for environmental reasons and buying products made of recyclable
material; these activities are likely easier to accomplish than trying to take transit instead
of drive a car.
Education Level
Level of education is another variable that researchers show is positively
correlated to environmentally-friendly behavior (Klineberg, 1998; Scott & Willits, 1994;
Theodori & Luloff, 2002). Klineberg et al. (1998) argue that environmental supporters
tend to be younger, better educated and politically moderate or liberal, but note that these
results are occasionally contradicted by other studies. Scotts & Willits (1994) found
19
education to be the strongest predictor of environmental behaviors with higher levels of
education being positively correlated to both consumer and political environmentally-
friendly behaviors such as switching products for environmental reasons, joining clean-
up drives, and writing congressional representatives concerning pollution problems.
Influences of Economic and Environmental Policy on Individual Behavior
While much of the research about predicting environmentally-friendly behaviors
focuses on individual demographic characteristics, many researchers at least note the
influence of the economic and environmental policies in promoting environmentally-
friendly behaviors. Below I discuss what researchers have found regarding the influence
of economic and environmental policies in predicting environmentally-friendly
behaviors.
Economics
Many researchers have examined the impact of the economy and financial
calculations on people’s likelihood to practice environmentally-friendly behaviors, and
most have found that economics are usually not the deciding factor in people’s decisions
to carry out an environmentally-friendly behavior (Crompton, 2008; De Young, 1986;
Gershon, 2009; Hopper & Nielsen, 1991; Kaiser et al., 1999). These researchers do not
argue that people do not consider gas prices when deciding to take the bus or drive to
work. Instead, they argue that this decision has more to do with whether or not it is
possible, convenient, and/or important for that person to take the bus, and the savings
from not buying gas are an added benefit (Gershon, 2009). Researchers are increasingly
seeing environmentally-friendly behaviors as pro-social and altruistic behaviors
20
stretching into the moral realm where the drivers of behavior are not extrinsic but
intrinsic (De Young, 1986; Kaiser et al., 1999).
Environmental Policies
When environmentally-friendly policies and laws do not exist, it allows other
forces such as free-market economies to shape people’s actions (Borek & Bohon, 2008).
In some cases that might encourage environmentally-friendly behaviors, while in other
cases it might discourage environmentally-friendly behaviors. For example, consuming
less energy can save on electricity costs creating a win-win situation in which people save
money and less pollution is released into the air. However, a behavior such as purchasing
a product made from recycled materials might cost more than its non-recyclable based
substitute creating a situation in which people have to spend extra money in order to
practice an environmentally-friendly behavior.
To measure the effect of national-level environmentally-friendly policies on
engaging in environmentally-friendly behaviors Borek & Bohon (2008) used a variety of
factors including environmentally-friendly policies (stringency and consistency of
environmental regulations, the percentage of land under protected status), cooperative
participation in environmentally-friendly activities (number of memberships in
environmental intergovernmental organizations) and subsidies offered for energy and
materials. In their research, Borek & Bohon (2008) found that a one-point increase in the
policy score of a county resulted in a 20 percent increase in the likelihood a resident
would drive less. The authors admit that they are not able to draw conclusions about the

21
causal relationships between reduced car driving and these policy scores but this is still
interesting information to consider and may be worth further investigation.
Few studies have examined the impact of national environmental policies and
practices on environmentally-friendly behavior with the exception of land use studies
(Borek & Bohon, 2008). Land use research has shown that the way in which a
community is built can make a significant difference in the transportation choices people
who live in those communities make (Borek & Bohon, 2008). Further research focused
on examining examine the ways in which individual, organizational, and societal factors
interconnect and influence one another is needed.
Conclusion
Given the depth and breadth of information available on environmentally-friendly
behavior it is clear that no conclusions will be reached in the immediate future regarding
the most significant variable in predicting or encouraging environmentally-friendly
behavior. Stern (2000) argues that there may not be a need for an overarching
environmentally-friendly behavior model asserting that researchers need empirical
analysis to understand any specific environmentally-friendly behavior because “the role
of environmentalist predispositions can vary greatly with the behavior, the actor, and the
context.” Increasingly researchers are arguing that different behaviors have different
barriers to action that need to be addressed and therefore require unique models or
programs designed to change those specific behaviors (Barr et al., 2010; Darnton et al.,
2006; McKenzie-Mohr, 2000; Stern, 2000). For example, encouraging people to recycle
may prove to have different and fewer barriers to action than encouraging people to drive
22
less especially in areas where curbside recycling is an established program. The barriers
to driving less can include time, convenience, and weather, while the barriers to recycling
might only be remembering to put materials in a separate can.
While it may be true that each behavior should to be examined closely in order to
determine the best way to encourage it, I also argue that there is value in identifying the
best combination of variables to predict environmentally-friendly behavior.
Understanding why people practice environmentally-friendly behaviors can help public
officials, non-profit professionals and business leaders understand how to encourage
these behaviors by focusing efforts on reinforcing the motives that already exist. In the
following chapter, I outline the variables I use to examine the relationship between
ideology and people’s willingness to change some of the things they do to help improve
the environment.
23
CHAPTER 3 METHODOLOGY
In this chapter, I discuss the theoretical model and data I use to examine the
relationship between political ideology and willingness to change behavior to improve
the environment. Below I outline the functional form of the equation and follow with a
description of the variables including how I have coded them. I conclude with a summary
of the data and a brief discussion regarding the descriptive statistics of the variables.
Dependent Variable and Theoretical Model
Regression analysis allows researchers to measure the effect specific variables
have on a dependent variable while controlling for a variety of independent variables that
also influence the dependent variable (Studenmund, 2011). For example, researchers use
regression analysis to try to explain housing prices as a function of a series of
independent variables such as size, age, neighborhood, and other characteristics. A
researcher could ask what effect a one-square-foot increase in the size of a house would
have on the price of the home while holding all other variables constant.
I examine the amount of influence political ideology has on people’s willingness
to change their behavior to improve the environment. Regression analysis is an
appropriate method for this question because it allows the researcher to examine the
relationship between two variables while controlling for a variety of other variables.
Since many variables influence willingness to change behavior to improve the
environment, regression analysis will help identify which variables are the best predictors
of willingness to change behavior. Consistent with the literature in the previous chapter,
24
the model outlined below includes a variety of variables that researchers have found to
have a significant relationship with people practicing environmentally-friendly behavior.
Dependent Variable
The data used for this thesis is from a regular monthly poll series conducted by
ABC News, Washington Post, and Stanford University in April 2007 that focused on
global warming and other environmental issues. The dependent variable is a question
from this survey that asks Respondents how willing they are personally to change some
of the things they do in order to improve the environment. Respondents are able to select
one of four answers: 1) very willing, 2) somewhat willing, 3) not so willing, and 4) not
willing at all. I have recoded this variable with one being equal to “not willing at all” and
four being equal to “very willing.” Respondents could also give the answer of “depends”
but since only 12 out of 997 respondents gave this answer, I dropped those entries in
order to get a better measure of the dependent variable.
Theoretical Model
In this theoretical model, I include measures for all the variables that I discussed
in the previous chapter as well as variables for race, being a parent and being a
homeowner. Klineberg et al. (1998) included race as a variable but none of the
researchers included variables for being a parent or being a homeowner. All of these
variables are included to ensure that I have a variety of control variables and to decrease
the possibility of committing omitted variable bias. From a theoretical perspective, these
variables could influence willingness to change behavior to improve the environment,
25
therefore, it is better to include them and find out what the relationship is than to exclude
them and risk omitting variables from the equation (Studenmund, 2011).
Functional Form
Regression equations can take a series of different forms depending upon the data
and the theory behind the question at hand. Choosing the functional form that best
explains the relationship between the independent and dependent variables is important
as it can influence the regression results (Studenmund, 2011). The standard regression
functional form is a linear equation known as the Ordinary Least Squares (OLS) and this
is the form that should be used unless theory indicates that another form is more
appropriate. In an OLS functional form the coefficients are left in their original linear
form and will produce a straight line when data points are graphed. If the equation of
interest consisted of home price as a function of house age a standard linear form may not
theoretically make sense. While housing prices do tend to appreciate over the life of the
home, the relationship might take more of a curved shape since housing prices fluctuate
with the economy and very old homes that are not well-maintained may begin to lose
value some one point. Therefore, it would be appropriate to consider using a double-log
(taking the natural log of both dependent and independent variables) or quadratic (an
equation using squared terms) functional form. Only in rare circumstances should a
functional form be selected based solely on which form fits the data best (Studenmund,
2011).
In this thesis, I use a log-linear functional form (also known as left-side semilog
functional form) because it will allow me to easily interpret what the effect of political
26
ideology is on environmentally-friendly behavior in percentage terms. This form is
particularly useful to political scientists and other researchers wanting to quickly analyze
regression results because a one-unit change in the independent variable will result in a
change in percentage terms on the dependent variable. In a log-linear functional form the
natural log of the dependent variable is used but all variables on the right-hand side of the
equation (the independent variables) are left in their original linear form.
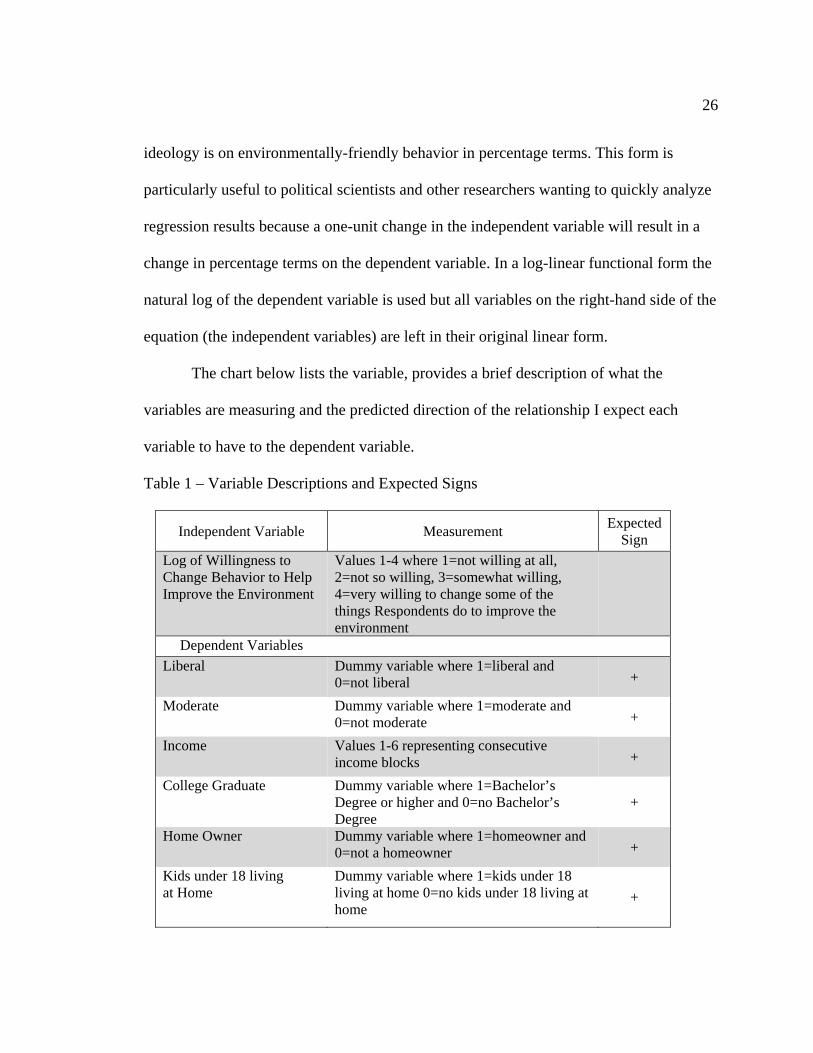
The chart below lists the variable, provides a brief description of what the
variables are measuring and the predicted direction of the relationship I expect each
variable to have to the dependent variable.
Table 1 – Variable Descriptions and Expected Signs
Independent Variable Measurement Expected
Sign
Log of Willingness to Change Behavior to Help Improve the Environment
Values 1-4 where 1=not willing at all, 2=not so willing, 3=somewhat willing, 4=very willing to change some of the things Respondents do to improve the environment
Dependent Variables
Liberal Dummy variable where 1=liberal and 0=not liberal +
Moderate Dummy variable where 1=moderate and 0=not moderate +
Income Values 1-6 representing consecutive income blocks +
College Graduate Dummy variable where 1=Bachelor’s Degree or higher and 0=no Bachelor’s Degree
+
Home Owner Dummy variable where 1=homeowner and 0=not a homeowner +
Kids under 18 living at Home
Dummy variable where 1=kids under 18 living at home 0=no kids under 18 living at home
+

27
Table 1 (continued)
Independent Variable Measurement Expected
Sign
Self-Rating of Global Warming Knowledge
1-4 self-rating of how much respondents know about global warming where 1=nothing, 2=a little, 3=a moderate amount, 4=a lot
+
Rating for How Much Can be Done to Reduce Future Global Warming
1-5 rating where 1=nothing, 2=hardly anything, 3=just some, 4=a good amount, 5=a great deal
+
Rating of the Condition of Environment
1-5 rating of the condition of the environment where 1=very poor, 2=poor, 3=fair, 4=good, 5=excellent
-
Female Dummy variable where 1=female and 0=male +
Age Values 18-98 representing the age of the Respondent -
Black Dummy variable where 1=Black and 0=not Black +/-
Hispanic Dummy variable where 1=Hispanic and 0=not Hispanic +/-
Asian Dummy variable where 1=Asian and 0=not Asian +/-
Other (race) Dummy variable where 1=other race and 0=not other race +/-
Recycling Law In Area Dummy variable where 1=a recycling law exists in area and 0=recycling law does not exist in area
+
Rating of How Much Fed Government Should do to Deal with Global Warming
1-5 rating of how much government should do to address global warming where 1=much less, 2=somewhat less, 3=doing about the right amount, 4=somewhat more, 5=much more
+
Favors Gas Tax as Strategy to Reduce Future Global Warming
Dummy variable where 1=Respondent favors a gas tax a way to address global warming and 0=Respondent does not favor a gas tax
+
Favors Electricity Tax as Strategy to Reduce Future Global Warming
Dummy variable where 1=Respondent favors a tax on electricity as a way to address global warming and 0=Respondent does not favor electricity tax
+
28
Key Explanatory and Independent Variables
Based on the research outlined in the literature review I have included the
independent variables listed above to serve as controls in order to gain a more accurate
measure of the effect of the key explanatory variable, political ideology, on an
individual’s willingness to change behavior to improve the environment.
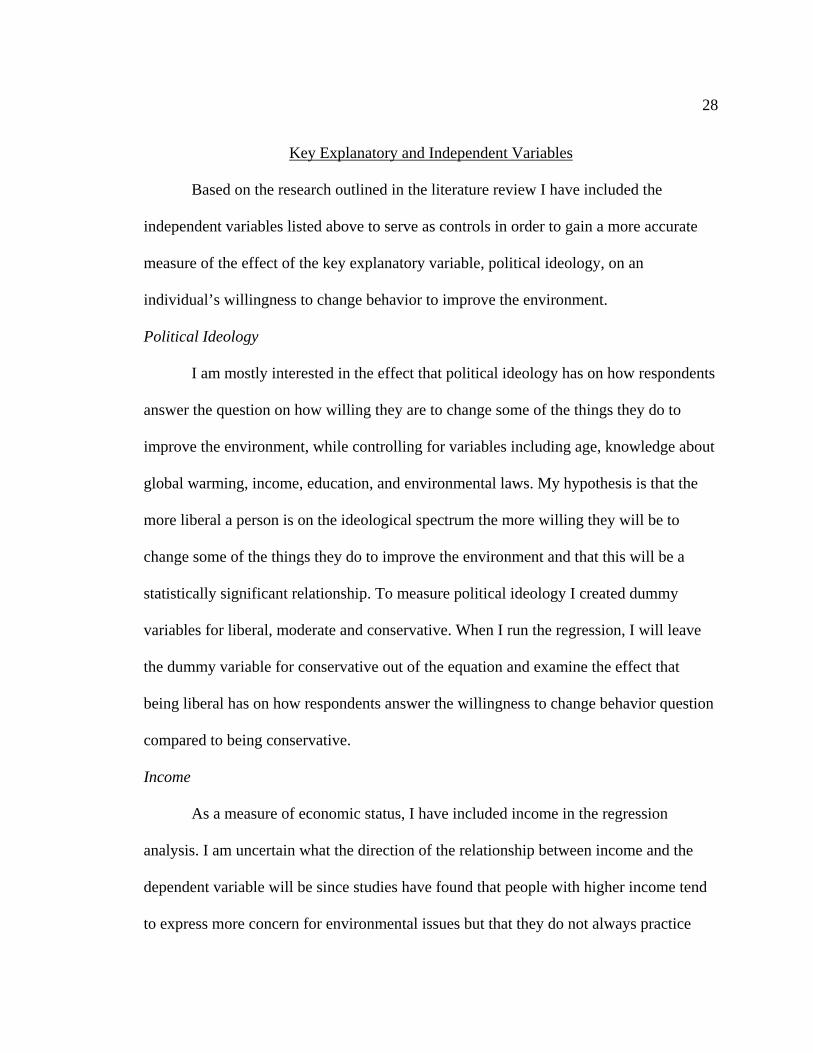
Political Ideology
I am mostly interested in the effect that political ideology has on how respondents
answer the question on how willing they are to change some of the things they do to
improve the environment, while controlling for variables including age, knowledge about
global warming, income, education, and environmental laws. My hypothesis is that the
more liberal a person is on the ideological spectrum the more willing they will be to
change some of the things they do to improve the environment and that this will be a
statistically significant relationship. To measure political ideology I created dummy
variables for liberal, moderate and conservative. When I run the regression, I will leave
the dummy variable for conservative out of the equation and examine the effect that
being liberal has on how respondents answer the willingness to change behavior question
compared to being conservative.
Income
As a measure of economic status, I have included income in the regression
analysis. I am uncertain what the direction of the relationship between income and the
dependent variable will be since studies have found that people with higher income tend
to express more concern for environmental issues but that they do not always practice
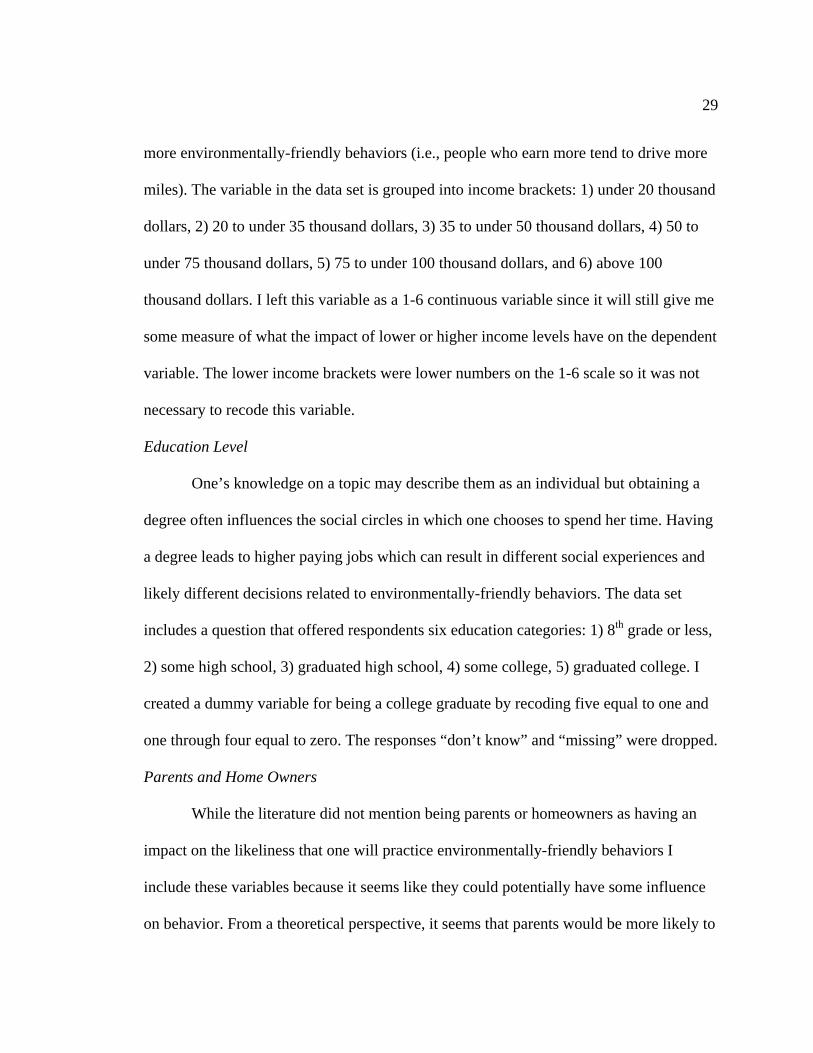
29
more environmentally-friendly behaviors (i.e., people who earn more tend to drive more
miles). The variable in the data set is grouped into income brackets: 1) under 20 thousand
dollars, 2) 20 to under 35 thousand dollars, 3) 35 to under 50 thousand dollars, 4) 50 to
under 75 thousand dollars, 5) 75 to under 100 thousand dollars, and 6) above 100
thousand dollars. I left this variable as a 1-6 continuous variable since it will still give me
some measure of what the impact of lower or higher income levels have on the dependent
variable. The lower income brackets were lower numbers on the 1-6 scale so it was not
necessary to recode this variable.
Education Level
One’s knowledge on a topic may describe them as an individual but obtaining a
degree often influences the social circles in which one chooses to spend her time. Having
a degree leads to higher paying jobs which can result in different social experiences and
likely different decisions related to environmentally-friendly behaviors. The data set
includes a question that offered respondents six education categories: 1) 8th grade or less,
2) some high school, 3) graduated high school, 4) some college, 5) graduated college. I
created a dummy variable for being a college graduate by recoding five equal to one and
one through four equal to zero. The responses “don’t know” and “missing” were dropped.
Parents and Home Owners
While the literature did not mention being parents or homeowners as having an
impact on the likeliness that one will practice environmentally-friendly behaviors I
include these variables because it seems like they could potentially have some influence
on behavior. From a theoretical perspective, it seems that parents would be more likely to
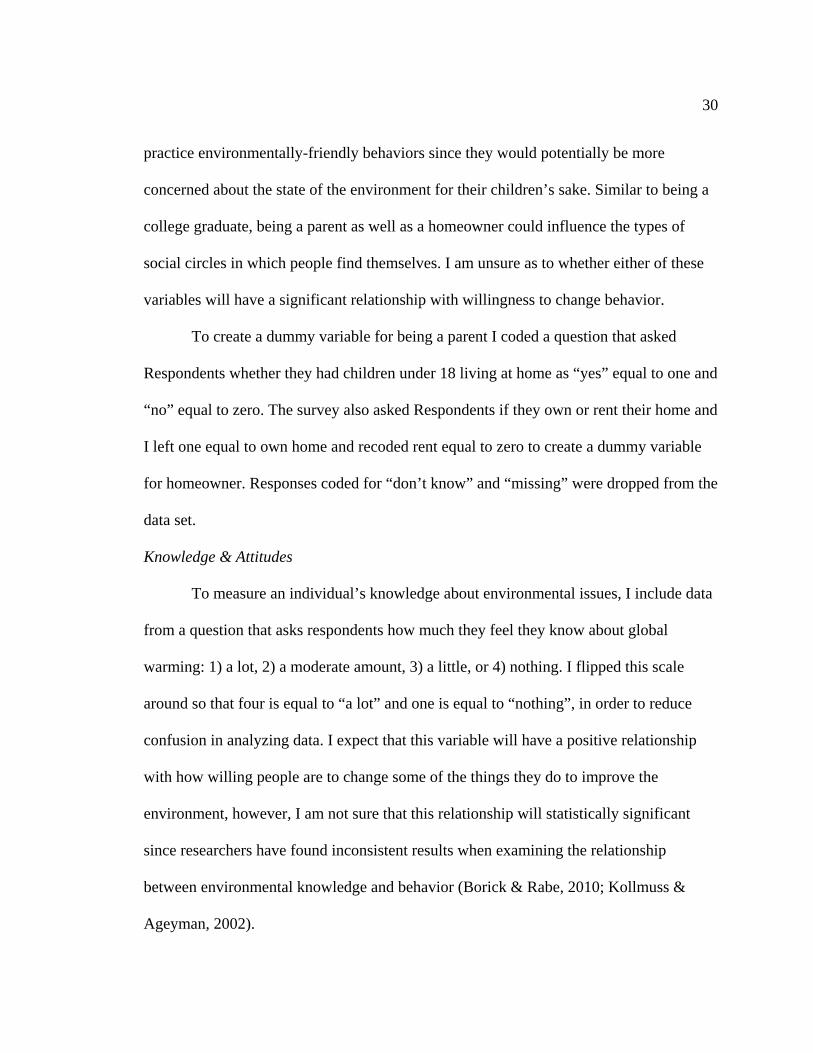
30
practice environmentally-friendly behaviors since they would potentially be more
concerned about the state of the environment for their children’s sake. Similar to being a
college graduate, being a parent as well as a homeowner could influence the types of
social circles in which people find themselves. I am unsure as to whether either of these
variables will have a significant relationship with willingness to change behavior.
To create a dummy variable for being a parent I coded a question that asked
Respondents whether they had children under 18 living at home as “yes” equal to one and
“no” equal to zero. The survey also asked Respondents if they own or rent their home and
I left one equal to own home and recoded rent equal to zero to create a dummy variable
for homeowner. Responses coded for “don’t know” and “missing” were dropped from the
data set.
Knowledge & Attitudes
To measure an individual’s knowledge about environmental issues, I include data
from a question that asks respondents how much they feel they know about global
warming: 1) a lot, 2) a moderate amount, 3) a little, or 4) nothing. I flipped this scale
around so that four is equal to “a lot” and one is equal to “nothing”, in order to reduce
confusion in analyzing data. I expect that this variable will have a positive relationship
with how willing people are to change some of the things they do to improve the
environment, however, I am not sure that this relationship will statistically significant
since researchers have found inconsistent results when examining the relationship
between environmental knowledge and behavior (Borick & Rabe, 2010; Kollmuss &
Ageyman, 2002).
31
To measure attitudes about environmental issues I created a dummy variable with
one signifying that the respondent believes that something can be done to address global
warming and zero signifying that the respondent doesn’t believe that anything can be
done to address global warming. I anticipate that this variable will be significantly and
positively related to willingness to change behavior. If people think that something can be
done to address global warming it seems like they would be more willing to change some
of the things they do for environmental reasons.
Another variable I use to measure attitudes about the environment is 1-5 rating of
the condition of the natural environment: 1) excellent, 2) good, 3) fair, 4) poor, and 5)
very poor. I recoded this variable so that one is equal to “very poor” and five is equal to
“excellent” since it was coded in the opposite direction like the other scaled variables in
this data set. I expect to find that this attitude variable has a negative relationship to the
dependent variable in that people who give the natural environment a lower rating will be
more likely to say that they are willing to change some of the things they do to improve
the environment. It seems reasonable that people who think the natural environment is in
excellent condition may think that there is no need to change some of the things they do
to improve the environment.
Gender
As mentioned in the previous chapter, researchers have found that being female
can have a positive relationship to practicing environmentally-friendly behaviors. To
measure gender I have created a dummy variable for which being female is equal to 1 and
being male is equal to zero. Given the conflicting results that Scott & Willits (1994)
32
found concerning females (that they are somewhat more likely to engage in consumer-
oriented environmentally-friendly behaviors while males were more likely to engage in
politically-oriented environmentally-friendly behaviors) I am uncertain whether being
female will negatively or positively impact one’s willingness to change behavior to
improve the environment.
Age
Consistent with other studies, I have included age as one of the independent
variables that may have a significant effect on predicting how willing one might be to
change behavior to improve the environment. I expect to find an inverse relationship
between age and willingness to change behavior to help improve the environment since
other studies have shown that younger people tend to be more likely to practice
environmentally-friendly behaviors (Klineberg et al., 1998; Theodori & Luloff, 2002). I
left this variable as a continuous integer as it was not necessary to recode it.
Race
While other studies have not made note of a significant relationship between race
and environmentally-friendly behaviors, I include it to avoid omitted variable bias.
According to Studenmund (2001) it is a violation of classical principles to omit variables
that could potentially influence the dependent variable. Using STATA’s tab command I
created five race dummy variables for White, Black, Asian, Hispanic and Other. In the
analysis I will leave the dummy for White out of the regression in order to measure the
other dummy variables against it. The data will show the impact that being Asian or
Black has on people’s willingness to change their behaviors relative to being White.
33
Recycling Law Required in Community
The survey includes a question that asks respondents whether recycling is
required by law in the area. It will be interesting to see how much the existence of a
recycling law affects willingness to change behavior to improve the environment. This
variable was already coded with one equal to “yes”, but I recoded “no” to be equal to
zero instead of two. I dropped the “missing” and “don’t know” answers from the data set.
Support for Environmental Policy
The final three variables are attitudes or opinions about supporting environmental
policy: a 1-5 rating of how much federal government should do about global warming,
favoring an increase in gas tax, and favoring an increase in electricity tax (with the taxes
being a strategy to reduce the impacts of global warming). The first variable regarding
how much the federal government should do to address global warming had to be
recoded like the other scale variables in the data set and is now coded as follows: 1) much
less, 2) somewhat less, 3) doing about the right amount, 4) somewhat more, and 5) much
more. I expect to find that the more people think government should do about global
warming the more willing they will be to do to improve the environment. However, if
they think government should do much more to address environmental issues people
might assume that they do not need to do anything on their own, making this a negatively
correlated relationship.
The dummy variables for favoring increased gas and electricity taxes as a way to
address global warming were both coded as one equal to favoring the tax and zero equal
to not favoring the tax. I predict that the relationship will be significantly and positively
34
related to the dependent variable in that if people are in favor of a gas or electricity tax
they will be more willing to change their behavior to improve the environment.
Data
The data used in this thesis is from the ABC News/Stanford
University/Washington Post Survey on Global Warming conducted in April of 2007. The
survey of 1,002 United States residents was conducted via phone interviews through
random-digit dialing. To select respondents within households the interviewer asked for
the adult living in the household who last had a birthday and was home at the time of the
call. I obtained the data by downloading it from the Interuniversity Consortium for
Political and Social Research (ICPSR) website. As discussed earlier, many of the
variables were coded into dummy variables and scales were reversed in order to prepare
the data for analysis. All entries coded as “missing” or “don’t know” were dropped from
the sample since it was usually only 2 or 3 percent of the entries and still left over 700
responses for each question included in the model. The descriptive statistics are listed
below.
35
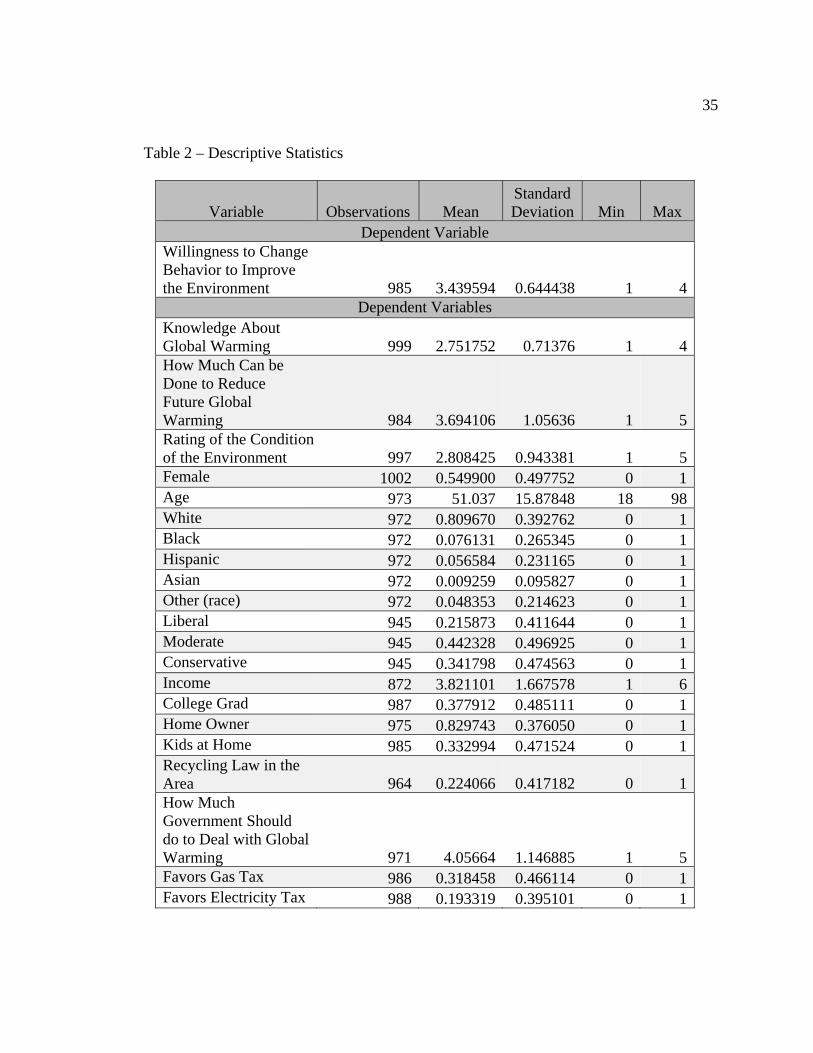
Table 2 – Descriptive Statistics
Variable Observations Mean Standard Deviation Min Max
Dependent Variable Willingness to Change Behavior to Improve the Environment 985 3.439594 0.644438 1 4
Dependent Variables Knowledge About Global Warming 999 2.751752 0.71376 1 4How Much Can be Done to Reduce Future Global Warming 984 3.694106 1.05636 1 5Rating of the Condition of the Environment 997 2.808425 0.943381 1 5Female 1002 0.549900 0.497752 0 1Age 973 51.037 15.87848 18 98White 972 0.809670 0.392762 0 1Black 972 0.076131 0.265345 0 1Hispanic 972 0.056584 0.231165 0 1Asian 972 0.009259 0.095827 0 1Other (race) 972 0.048353 0.214623 0 1Liberal 945 0.215873 0.411644 0 1Moderate 945 0.442328 0.496925 0 1Conservative 945 0.341798 0.474563 0 1Income 872 3.821101 1.667578 1 6College Grad 987 0.377912 0.485111 0 1Home Owner 975 0.829743 0.376050 0 1Kids at Home 985 0.332994 0.471524 0 1Recycling Law in the Area 964 0.224066 0.417182 0 1How Much Government Should do to Deal with Global Warming 971 4.05664 1.146885 1 5Favors Gas Tax 986 0.318458 0.466114 0 1Favors Electricity Tax 988 0.193319 0.395101 0 1
36
One interesting, but perhaps not entirely surprising number in the descriptive
statistics is that on average people claim to be between “somewhat willing” and “very
willing” to change some of the things they do to improve the environment. However, as I
will discuss in the following chapters, this does not necessarily mean that people will
necessarily follow through on changing behaviors, given that many researchers have
shown that a gap known as the Value-Action Gap or Attitude-Behavior Gap exists
(Darton et al., 2006; Klineberg, et al, 1998; Kollmuss & Agyeman; Scott & Willits, 1994)
We can also see that the average age of the respondents is 51 years old and a few
more than half are female. Approximately 38 percent of the respondents have a
Bachelor’s degree or higher and nearly 83 percent of them are homeowners. These
numbers are slightly higher than national Census numbers as approximately 30 percent of
the population has a Bachelor’s degree or higher and only about 68 percent of people
owned homes in 2007. The statistics above show that 22 percent of respondents are
liberal, 42 percent are moderate and 34 percent are conservative. According to a series of
2010 Gallup and USA Today/Gallup polls (Saad, 2012), 22 percent of the population was
liberal, 37 percent was moderate and 37 percent was republican in the year 2007 (the
same year this survey took place). The data set includes a weight, which I use in the
regression equation to correct these discrepancies and align them with U.S. Census
numbers. Another interesting observation from the descriptive statistics is that on average
people think that government should be doing more to address global warming but few of
them favor taxes on gas or electricity as policies to address the issue. In the following
chapter, using the data and functional form outlined above, I will run the log-lin

37
regression, report the initial findings, and discuss potential issues to consider when
conducting a regression analysis.
38
CHAPTER 4 RESULTS
To address the question of whether or not political ideology affects people’s
willingness to change behavior to improve the environment, I use a log-linear functional
form of the regression model as outlined in the previous chapter. In this chapter, I discuss
how I tested for issues with heteroskedasticity and multicollinearity. In the second part of
the chapter, I report the regression coefficients at the 99% confidence level and discuss
the initial implications of the regression results.
Heteroskedasticity
Heteroskedasticity occurs when there is variance in the error term across the
observations, which can lead to misestimates of variables and make hypothesis testing
unreliable. To test for heteroskedasticity I use the Breusch-Pagan/Cook-Weisberg Test
that tests the null hypothesis that homoskedasticity exists. The report gives a chi-square
value that should be a small number when homoskedasticity is present. The results the
Breusch-Pagan/Cook-Weisberg test show that heteroskedasticity is a problem in this
model since the chi-square value is above 20 making it a high number for this test.
Therefore, I report the regression with a correction for robust standard errors as
recommended by Studenmund (2011). I report the Breusch-Pagan/Cook-Weisberg test
and regression with robust standard errors in the following section.
Multicollinearity
Another potential issue that can arise when using regression analysis is
multicollinearity, which occurs when two variables run closely together sharing a linear
relationship. When multicollinearity exists between variables it becomes difficult for

39
researchers to distinguish the separate effects of multicollinear variables and will even
cause the statistical software program to omit variables if they run too closely together.
Multicollinearity does not create bias in the coefficient estimates but it will cause
standard errors and variances of the estimates to increase which can in turn increase the
chances of getting an unexpected sign for a coefficient (Studenmund, 2011). To test for
multicollinearity I examine simple correlation coefficients. Any simple correlation
coefficient that has an absolute value of 0.80 or more may be an indication of severe
multicollinearity. I removed the dummy and categorical variables before running the
correlation coefficients. According to this test, correlation coefficients in this data do not
show any signs of severe multicollinearity as all of the values are much lower than 0.80.
The simple correlation coefficients are listed in Table 3 below.
40
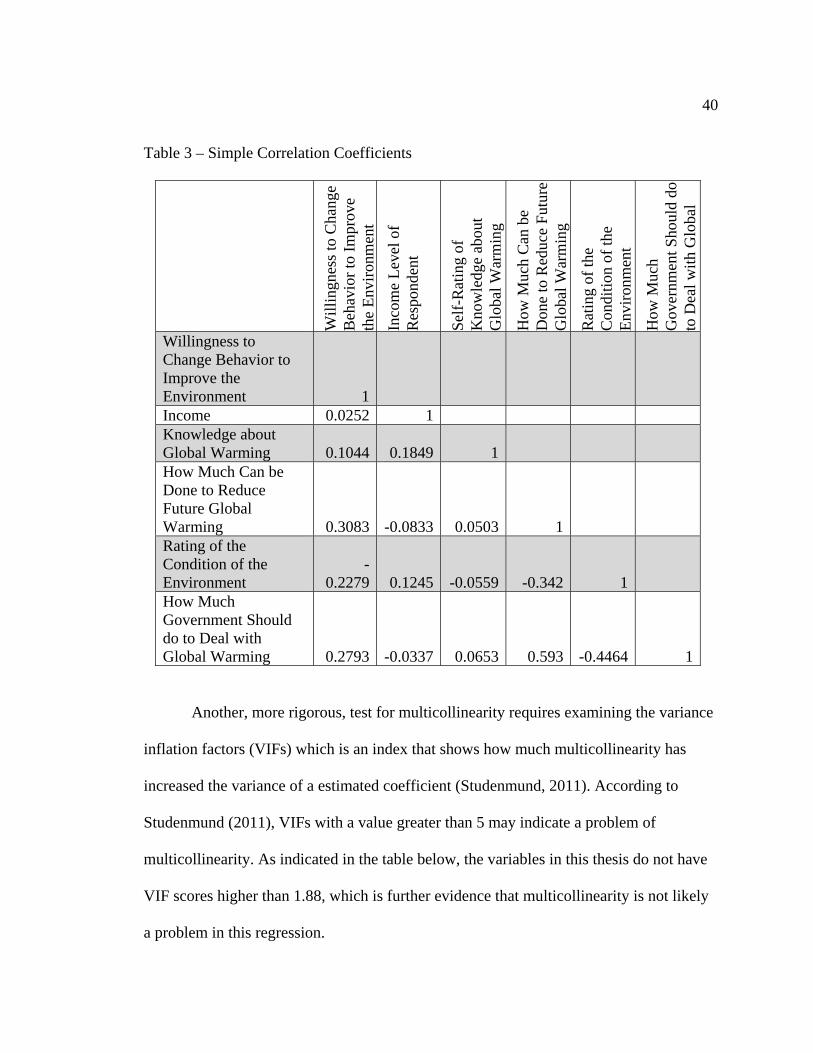
Table 3 – Simple Correlation Coefficients
Wil
ling
ness
to C
hang
e B
ehav
ior
to I
mpr
ove
the
Env
iron
men
t
Inco
me
Lev
el o
f R
espo
nden
t
Sel
f-R
atin
g of
K
now
ledg
e ab
out
Glo
bal W
arm
ing
How
Muc
h C
an b
e D
one
to R
educ
e F
utur
e G
loba
l War
min
g
Rat
ing
of th
e C
ondi
tion
of
the
Env
iron
men
t
How
Muc
h G
over
nmen
t Sho
uld
do
to D
eal w
ith
Glo
bal
Willingness to Change Behavior to Improve the Environment 1Income 0.0252 1Knowledge about Global Warming 0.1044 0.1849 1How Much Can be Done to Reduce Future Global Warming 0.3083 -0.0833 0.0503 1Rating of the Condition of the Environment
-0.2279 0.1245 -0.0559 -0.342 1
How Much Government Should do to Deal with Global Warming 0.2793 -0.0337 0.0653 0.593 -0.4464 1
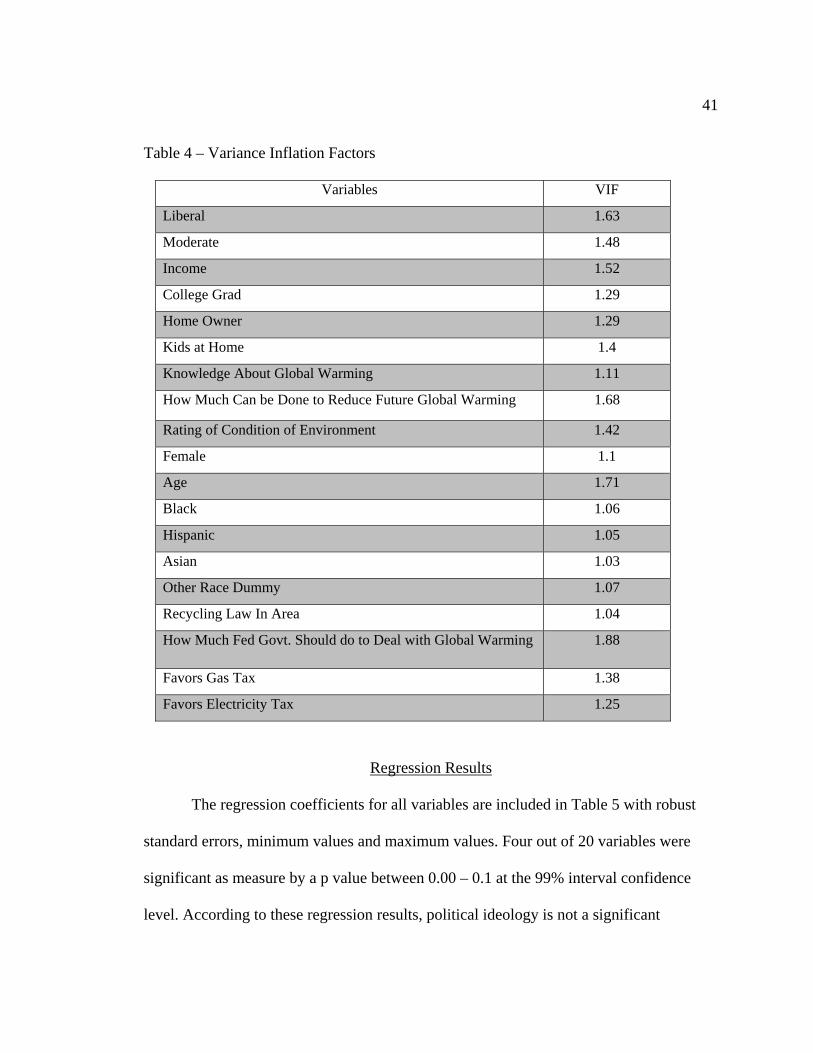
Another, more rigorous, test for multicollinearity requires examining the variance
inflation factors (VIFs) which is an index that shows how much multicollinearity has
increased the variance of a estimated coefficient (Studenmund, 2011). According to
Studenmund (2011), VIFs with a value greater than 5 may indicate a problem of
multicollinearity. As indicated in the table below, the variables in this thesis do not have
VIF scores higher than 1.88, which is further evidence that multicollinearity is not likely
a problem in this regression.
41
Table 4 – Variance Inflation Factors
Variables VIF
Liberal 1.63
Moderate 1.48
Income 1.52
College Grad 1.29
Home Owner 1.29
Kids at Home 1.4
Knowledge About Global Warming 1.11
How Much Can be Done to Reduce Future Global Warming 1.68
Rating of Condition of Environment 1.42
Female 1.1
Age 1.71
Black 1.06
Hispanic 1.05
Asian 1.03
Other Race Dummy 1.07
Recycling Law In Area 1.04
How Much Fed Govt. Should do to Deal with Global Warming 1.88
Favors Gas Tax 1.38
Favors Electricity Tax 1.25
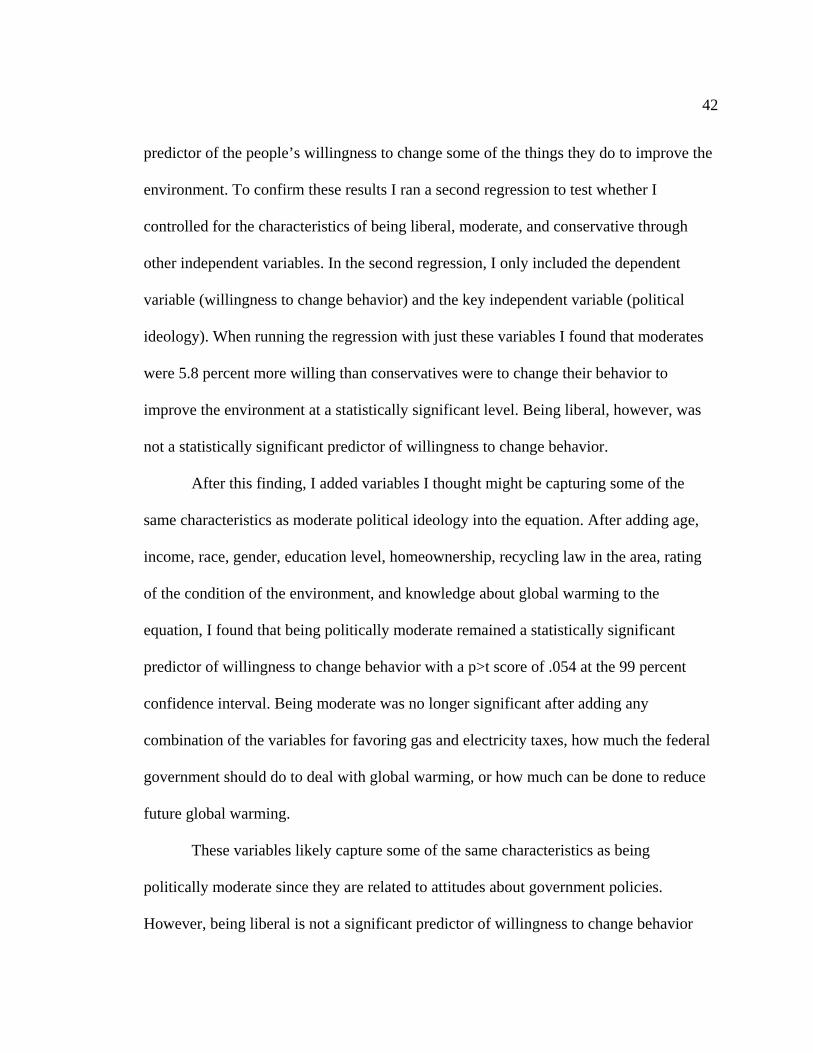
Regression Results
The regression coefficients for all variables are included in Table 5 with robust
standard errors, minimum values and maximum values. Four out of 20 variables were
significant as measure by a p value between 0.00 – 0.1 at the 99% interval confidence
level. According to these regression results, political ideology is not a significant
42
predictor of the people’s willingness to change some of the things they do to improve the
environment. To confirm these results I ran a second regression to test whether I
controlled for the characteristics of being liberal, moderate, and conservative through
other independent variables. In the second regression, I only included the dependent
variable (willingness to change behavior) and the key independent variable (political
ideology). When running the regression with just these variables I found that moderates
were 5.8 percent more willing than conservatives were to change their behavior to
improve the environment at a statistically significant level. Being liberal, however, was
not a statistically significant predictor of willingness to change behavior.
After this finding, I added variables I thought might be capturing some of the
same characteristics as moderate political ideology into the equation. After adding age,
income, race, gender, education level, homeownership, recycling law in the area, rating
of the condition of the environment, and knowledge about global warming to the
equation, I found that being politically moderate remained a statistically significant
predictor of willingness to change behavior with a p>t score of .054 at the 99 percent
confidence interval. Being moderate was no longer significant after adding any
combination of the variables for favoring gas and electricity taxes, how much the federal
government should do to deal with global warming, or how much can be done to reduce
future global warming.
These variables likely capture some of the same characteristics as being
politically moderate since they are related to attitudes about government policies.
However, being liberal is not a significant predictor of willingness to change behavior
43
even without adding any additional variables to the equation;, therefore, I can conclude
with some certainty that political ideology is not a significant predictor of willingness to
change behavior for the environment in this regression. Ultimately, I report the findings
from the multiple regression with all variables included because from a theoretical
perspective all the variables have some influence on willingness to change behavior to
help improve the environment and therefore should be included. Each of these variables
has some influence on willingness to change behavior to improve the environment and if
I remove them from the equation, then the reliability of the regression results would
suffer from omitted variable bias. As such, it is clear that political ideology does not have
a statistically significant relationship to willingness to change behavior to improve the
environment.
The variable that proved to be the best predictor of willingness to change behavior
to help improve the environment was the rating of how much one thinks can be done to
reduce future global warming. For every one-unit increase in the amount one thinks can
be done to reduce future global warming she is 5 percent more willing to change some of
the things she does to help improve the environment. In the following chapter, I will
discuss these results in more detail.
Being Hispanic, having kids under 18 living at home and favoring a gas tax as a
policy to reduce future warming, also proved to be good predictors of willingness to
change behavior for the environment. I am somewhat surprised that being Hispanic as
opposed to White is a significant predictor of willingness to change behavior to improve
the environment. Being Hispanic was the second most significant predictor of willingness

44
to change behavior even though the four other race categories are not statistically
significant, and the literature I reviewed for this thesis did not mention race or ethnicity
as a significant indicator of environmentally-friendly behavior. Further research should
be conducted in order to investigate this particular relationship.
In the next chapter, I will further discuss how my hypothesis turned out to be
incorrect and that the most significant predictor of willingness to change behavior to help
improve the environment turned out to be the 1-5 rating of how much people thing can be
done to reduce future global warming. I will also offer some recommendations regarding
strategies to use when encouraging environmentally-friendly behaviors, areas of future
research, and the limitations of this study.
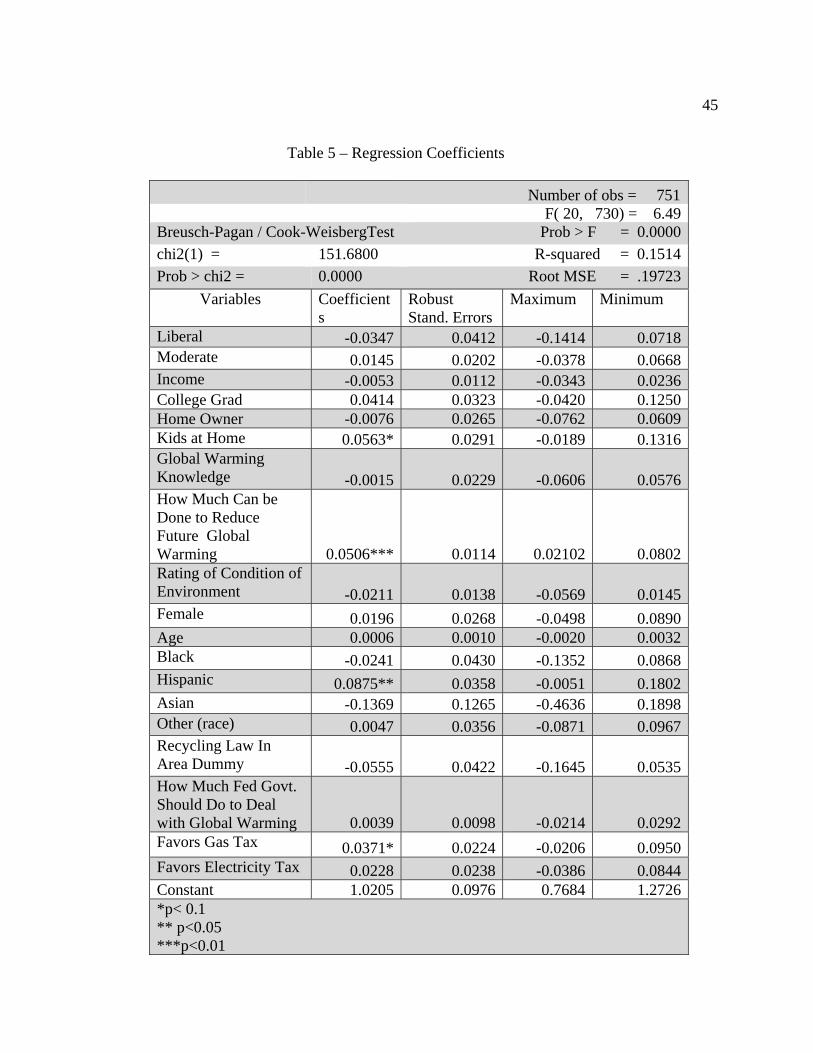
45
Table 5 – Regression Coefficients
Number of obs = 751 F( 20, 730) = 6.49Breusch-Pagan / Cook-WeisbergTest Prob > F = 0.0000
chi2(1) = 151.6800 R-squared = 0.1514
Prob > chi2 = 0.0000 Root MSE = .19723
Variables Coefficients
Robust Stand. Errors
Maximum Minimum
Liberal -0.0347 0.0412 -0.1414 0.0718Moderate 0.0145 0.0202 -0.0378 0.0668Income -0.0053 0.0112 -0.0343 0.0236College Grad 0.0414 0.0323 -0.0420 0.1250Home Owner -0.0076 0.0265 -0.0762 0.0609Kids at Home 0.0563* 0.0291 -0.0189 0.1316Global Warming Knowledge -0.0015 0.0229 -0.0606 0.0576How Much Can be Done to Reduce Future Global Warming 0.0506*** 0.0114 0.02102 0.0802Rating of Condition of Environment -0.0211 0.0138 -0.0569 0.0145Female 0.0196 0.0268 -0.0498 0.0890Age 0.0006 0.0010 -0.0020 0.0032Black -0.0241 0.0430 -0.1352 0.0868Hispanic 0.0875** 0.0358 -0.0051 0.1802Asian -0.1369 0.1265 -0.4636 0.1898Other (race) 0.0047 0.0356 -0.0871 0.0967Recycling Law In Area Dummy -0.0555 0.0422 -0.1645 0.0535How Much Fed Govt. Should Do to Deal with Global Warming 0.0039 0.0098 -0.0214 0.0292Favors Gas Tax 0.0371* 0.0224 -0.0206 0.0950Favors Electricity Tax 0.0228 0.0238 -0.0386 0.0844Constant 1.0205 0.0976 0.7684 1.2726*p< 0.1 ** p<0.05 ***p<0.01
46
CHAPTER 5 CONCLUSION
As elected officials, the public, business owners, non-profit leaders, and other
stakeholders continue to discuss mitigation and adaptation measures to address problems
related to air quality, water quality, climate change, and environmental resource
management, it is increasingly important to understand what motivates people to practice
environmentally-friendly behaviors. Americans waste up to 75 percent of the resources
they consume because of lack of awareness and efficiency, so it is important to
understand how we might be able to change individual behavior, not just organizational
and corporate behavior (Gershon, 2009). To better understand the factors that influence
people’s willingness to change behavior to improve the environment (specifically, the
influence of political ideology), I used nationally-representative survey data to complete a
multiple regression analysis. My hypothesis was that liberals would be more willing than
conservations to change some of the things they do to help improve the environment
since previous research pointed to a positive relationship between being liberal and
possessing pro-active positions on environmental policies and environmentally-friendly
attitudes, which have been linked to environmentally-friendly behaviors (Klineberg et al.,
1998; Theodori & Luloff, 2002).
Multiple regression analysis results showed, however, that political ideology was
not a significant predictor of how willing people are to change some of the things they do
to improve the environment after controlling for knowledge and attitudes about the
environment, demographic characteristics, support for environmental policy, and
recycling law required in the community. In this chapter, I discuss the significant
47
predictors of environmentally-friendly behavior, make recommendations to policy
makers, public and non-profit managers, business owners and program coordinators
regarding how to promote these behaviors, and review the limitations of this research.
Significant Predictors of Environmentally-Friendly Behavior
Multiple regression analysis shows political ideology is not a significant predictor
of willingness to change behavior to help improve the environment. Instead, I found that
the more people think something can be done to reduce future global warming, the more
willing they are to change some of the things they do to help improve the environment,
regardless of political ideology. For each one-unit point increase on the 1-5 scale rating
of how much people think can be done to reduce future global warming (with 1 equaling
“nothing” and 5 equaling “a great deal”), people are 5 percent more willing to change
their behavior in order to help improve the environment. It seems that people generally
just want to believe that their actions will make a difference if they are going to go to the
trouble of changing their behavior.
Three additional variables proved to be significant predictors of willingness to
change behavior after controlling for knowledge and attitudes about the environment,
demographic characteristics, support for environmental policy, and recycling law
required in community. The variables were: being Hispanic, having kids under the age of
18 living at home, and favoring a gas tax as a way to reduce future global warming.
Hispanics were 8.7 percent more willing than Whites were to change some of things they
do to improve the environment, all else held constant. It is not clear why being Hispanic
as opposed to being White was a statistically significant predictor of willingness to
48
change behavior while the other race variables were not; therefore, I recommend further
research to examine this relationship more closely. It is possible that Hispanics could be a
future target audience for public organizations when promoting environmentally-friendly
behaviors.
People who have kids under the age of 18 living at home are 5.6 percent more
willing than those who do not have kids living at home to change some of the things they
do to help improve the environment. This could be pointing to the importance of altruism
in willingness to change behavior since parents are likely concerned about the welfare of
their children and future generations that may have to deal with environmental issues.
Given these results, policy makers, public managers and non-profit leaders should
consider targeting parents when promoting environmentally-friendly behaviors.
Finally, people who favor a gas tax as a way for the federal government to try to
reduce future global warming are 3.7 percent more willing to change behavior to help
improve the environment than those who oppose a gas tax. Interestingly, favoring an
electricity tax as a way for the federal government to try to reduce future global warming
is not a significant predictor of willingness to change behavior. Perhaps this is because
people understand how driving affects the environment but do not clearly understand how
electricity use affects the environment. If both of these variables regarding tax policies
had proven to be significant predictors of environmentally-friendly behavior it would be
easier to argue that support for environmental policy is a good predictor of
environmentally-friendly behavior. Given these mixed results I suggest further research
49
to better examine the relationship between support for environmental policy and
encouraging environmentally-friendly behaviors.
Recommendations for Encouraging Environmentally-Friendly Behavior
Given the regression results outlined above, policy makers, business owners, non-
profit and public managers should focus on showing people how their actions can and do
make a difference in helping to improve the environment. Organizations that want to
encourage people to practice environmentally-friendly behaviors such as conserve water
and energy, recycle, drive less, or use fewer pesticides should be sure to explain the
positive environmental impact that will result from those actions. For example, to
encourage people to use less water, public officials may want to consider offering data
that explains the impact that reducing water consumption has on water supply. For
example, public officials could offer specific information about the impact that saving a
gallon of water a week has on the water supply. Such a pitch to conserve water might
look something like “If you join your neighbors in reducing your water consumption by 1
gallon every week, Sacramento would save over 73 million gallons of water in a year.
This could be as easy as shaving one minute off your shower time each day.” Through
decades of research, David Gershon (2006 & 2009) has found that it is this type of
information that will help people understand which actions to take and that their actions
can and do have an impact on improving the environmental health of the planet.
We know that people are not always motivated to act purely based on the
information that there is an environmental problem, since the variable for how much
knowledge people have about global warming was not a significant predictor of
50
willingness to change behavior, rather people have to believe that something can be done
to reduce global warming. As other researchers have shown, the Value-Action Gap (also
known as the Attitude-Behavior Gap) is a significant factor limiting researchers’ ability
to predict environmentally-friendly behavior. This research supports the idea that simply
offering people information about environmental problems and possible behavior
changes is not enough.
To go beyond producing traditional educational materials and information that
focus on what the problem is and what people should do about it, I recommend producing
materials and information that also show people specifically how their actions make a
difference. Since multiple regression analysis shows that the more someone thinks
something can done to reduce future global warming the more willing they are to change
some of the things they do to improve the environment, I can concluded that people are
interested in seeing and understanding how their actions make a difference. David
Gershon (2009) has found that what really helps people translate the knowledge they
have about the environment into new behaviors comes in answering four important
questions:
Where do I start?
Which are the important actions?
How do I implement these actions?
Does what I do actually make a difference?
To help answer the last question in the list, Gershon and his team created a survey
and computer program that allowed participants of his “sustainable lifestyles program” to
51
enter a variety of information regarding their behaviors and then receive a report showing
them how much energy, money, water, CO2 emissions, etcetera, they had saved. By
offering this type of information to people, Gershon and his team were able to show
participants exactly how their actions made a difference which the participants found
“fascinating and relevant for deciding which actions they would take” (Gershon, 2009).
Policy makers, public managers, and business leaders who are motivated to encourage
environmentally-friendly behavior should consider this when designing their program or
campaign.
Limitations of This Research
All research methods come with some limitations that should be considered when
analyzing and interpreting data. One major issue with using survey data is that it can be
difficult to draw causal inferences since respondents answer survey questions at a single
point in time (Singleton & Straits, 2010). In an experiment, the researcher has the ability
to make changes to an independent variable and watch for changes in the dependent
variable. In survey research, the independent and dependent variables are reported at the
same time and statistical analysis is used to find a relationship. Despite this issue, surveys
are still an appropriate tool for examining environmentally-friendly behavior given
appropriate statistical methods and careful interpretation. Additionally, it can be very
expensive and time intensive to conduct experiments which makes using survey data a
more feasible research method (Singleton & Straits, 2010).
Another limitation of using survey data is the potential for reactivity, which
causes systematic biased responses (Singleton & Straits, 2010). The dependent variable is
52
susceptible to biased responses because survey participants may have given a response
that they feel was socially acceptable as opposed to what they would actually do. For
example, respondents may have stated that they were “somewhat willing” to change
some of the things they do to improve the environment simply because they felt that it
was a more socially acceptable response than options such as “not very willing” or “not
willing at all” to change behavior. This survey aims to minimize this bias by phrasing
questions in such a way to imply a socially acceptable response and allow respondents to
answer as confidentially (or even anonymously) as possible.
Finally, the question used for the dependent variable is vague. The survey asks
respondents how willing they are to change some of the things they do to improve the
environment. The question does not ask about a specific behavior making it difficult to
draw strong conclusions about what causes people to practice environmentally-friendly
behaviors. Respondents likely imagined different behaviors when they considered
whether they were willing to change some of the things they do to help improve the
environment. One person might be very willing to recycle while she might not be willing
at all to drive less. Many of the studies in the literature review examined a specific
environmentally-friendly behavior such as recycling (Kleinberg et al, 1998), signing a
petition for an environmental cause or purchasing environmentally-friendly products
(Scott & Willits, 1994). Respondents might answer this question very differently
depending on the behavior they were thinking about when considering the question.
53
Final Thoughts
While multiple regression analysis shows that political ideology is not a
significant predictor of willingness to change behavior to help improve the environment,
this analysis offers other insights into promoting environmentally-friendly behaviors and
helps identify areas for future research. This data and analysis show that people who are
Hispanic (as opposed to White), think something can be done to reduce future global
warming, have children under 18 living at home, and support gas tax increases to reduce
future global warming are people who are more willing to change their behavior to
improve the environment. These are important factors for policy makers, elected officials,
public managers and business owners to keep in mind when they are looking to
encourage environmentally-friendly behavior change. They should continue to look for
opportunities to show people how their individual actions can and do make a difference
in tackling environmental problems.
54
REFERENCES
Barr, S.; Glig, A.; & Shaw, G. (2010). ‘Helping people make better choices’: Exploring
the behavior change agenda for environmental sustainability. Applied Geography.
31, pp. 712-720.
Borek, E. & Bohon, S.A. (2008). Policy climate and reductions in automobile use. Social
Science Quarterly. 89 (5), pp. 1293-1311.
Borick, C.P. & Rabe, B.G. (2010). A reason to believe: examining the factors that
determine individual views on global warming. Social Science Quarterly. 91(3),
pp. 777-800.
California Air Resources Board (CARB). (2011). Climate change program. Retrieved on
September 5, 2011 from http://www.arb.ca.gov/cc/cc.htm.
Corbett, J.B. (2005). Altruism, self-interest, and the reasonable person model of
environmentally responsible behavior. Science Communication. 26(4), pp. 368-
389.
Crompton, T. (2008). Weathercocks and signposts. World Wildlife Foundation – United
Kingdom. Retrieved on September 5, 2011 from
http://wwf.org.uk/research_centre/research_centre_results.cfm?uNewsID=2224.
Darnton, A. (2008). Practical guide: an overview of behaviour change models and their
uses. Government Social Research Unit, United Kingdom. Retrieved on April 2,
2012 from http://www.slideshare.net/mfredactie/behaviour-change-practical-
guidetcm69696.
55
Darnton, A., Elster-Jones, J., Lucas, K., & Brooks, M. (2006). Promoting pro-
environmental behaviour: existing evidence to inform better policy making. A
Study for the Department of Environment, Food and Rural Affairs. Retrieved on
April 2, 2012 from
http://www.thepep.org/ClearingHouse/docfiles/Promoting.Pro-
environmental.Behaviour.pdf.
De Young, R. (1986). Encouraging environmentally appropriate behavior: The role of
intrinsic motivation. Journal of Environmental Systems. 15(5), pp. 281-292.
Gershon, D. (2006). Low carbon diet: a 30 day program to lose 5000 pounds.
Woodstock: Empowerment Institute.
Gershon, D. (2009). Social change 2.0.: a blueprint for reinventing our world. West
Hurley: High Point.
Hargreaves, T. (2011). Practice-ing behavior change: Applying social practice theory to
pro-environmental behaviour change. Journal of Consumer Culture. 11 (1), pp.
79-99.
Hines, J.M., Hungerford, H.R. & Tomera, A.N. (1986–87). Analysis and synthesis of
research on responsible environmentally-friendly behavior: a meta-analysis. The
Journal of Environmental Education. 18(2), pp. 1–8.
Hopper, J.R. & Nielsen, J.M. (1991). Recycling as altruistic behavior: Normative and
behavioral strategies to expand participation in a community recycling program.
Environment and Behavior. 23(2), pp. 195-220.
56
Intergovernmental Panel on Climate Change (IPCC, 2007). The fourth annual assessment
report synthesis report. Retrieved on February 13, 2012 from
http://www.ipcc.ch/publications_and_data/ar4/syr/en/contents.html.
Kaiser, F.G.; Ranney, M.; Hartig, T.; & Bowler, P.A. (1999). Ecological behavior,
environmental attitude, and feelings of responsibility for the environment.
European Psychologist. 4(2), pp. 59-74.
Karp, D.G. (1996). Values and their effect on pro-environmental behavior. Environment
and Behavior. 28(1), pp. 111-133.
Klineberg, S.L., McKeever, M. & Rothenbach, B. (1998). Demographic predictors of
environmental concern: It does make a difference how it’s measured. Social
Science Quarterly. 79(4), pp. 734-753.
Kollmuss, A. & Agyeman, J. (2002). Mind the gap: why people act environmentally and
what are the barriers to environmentally-friendly behavior. Environmental
Education Research. 8(3), pp. 239-260.
Lubell, M., Zahran, S., and Vedlitz, A. (2007). Collective action and citizen responses to
global warming. Political Behavior. 29, pp. 391-413.
Munger, M.C. (2001). Analyzing policy: choices, conflicts, and practices. New York:
W.W. Norton & Company, Inc.
Neumayer, E. (2004). The environment, left-wing political orientation and ecological
economics. Ecological Economics. 51. Pp. 167-175.
Oskamp, S. (2000). Psychological contributions to achieving an ecologically sustainable
future for humanity. Journal of Social Issues. 56(3), pp. 373-390.
57
Saad, L. (2012). Conservatives Remain the Largest Ideological Group in U.S. Retrieved
on April 15, 2012 from http://www.gallup.com/poll/152021/conservatives-
remain-largest-ideological-group.aspx.
Scott, D. & Willits, F.K. (1994). Environmental attitudes and behavior: A Pennsylvania
survey. Environment and Behavior. 26(2), pp. 239-260.
Singleton, R.A. & Straights, B.C. (2009). Approaches to social research. Oxford
University Press.
Studenmund, A.H. (2011). Using econometrics: a practical guide. Boston: Pearson
Education.
Theodori, G.L. & Luloff, A.E. (2002). Position on environmental issues and engagement
in proenvironmental behaviors. Society and Natural Resources. 15, pp. 471-482.
United States Environmental Protection Agency. (2011). Learn the issues. Retrieved on
April 2, 2012 from http://epa.gov/.
Vitousek, P.M. (1993). Beyond global warming: Ecology and global change. Ecology.
75(7), pp. 1961-1976
Welsch, H. & Kuhling, J. (2010). Pro-environmental behavior and rational consumer
choice: Evidence from surveys of life satisfaction. Journal of Economic
Psychology. 31, pp. 405-420.