Embed Size (px)
Citation preview
DOCUMENT RESUME
ED 305 384 TM 012 914
AUTHOR Zimowski, Michele F.; Wothke, WernerTITLE The Measurement of Structural Visualization: An
Evaluation of Spatial and Nonspatial Sources ofVariation in the Wiggly Block and Paper Folding TestScores. Technical Report No. 1988-5.
7NSTITUT1ON Johnson O'Connor Research Foundation, Chicago, IL.Human Engineering Lab.
PUB DATE Aug 88NOTE 82p.
PUB TYPE Reports - Research/Technical (143)
EDRS PRICE MF01/PC04 Plus Postage.DESCRIPTORS Adults; *Aptitude Tests; Cognitive Ability; Latent
Trait Theory; *Perception Tests; Scores; *SpatialAbility; Test Reliability; *Test Validity;*Visualization; Visual Measures; Visual Perception
IDENTIFIERS Johnson 0 Connor Aptitude Tests; Paper Folding;Reasoning Tests; *Spatial Tests; *StructuralVisualization; Test Batteries; Wiggly Block Test
ABSTRACTThis report presents the results of a study designed
to evaluate the Johnson O'Connor Research Foundation's (JOCRF's)measurement of structural visualization. Three experimentaltesta--tile Incomplete Open Cubes Test, the Guilford-Zimmerman SpatialVisualization Test, and Ra7en's Advanced Progressive Matrices--wereadded to the JOCRF's test battery and administered to between 2,199and 2,814 clients using the JOCRF's aptitude testing services.Complete measurements were available for 917 males and 801 females.Tests from the regular battery also analyzed were: (1) measures ofstructural visualization, the Wiggly Block and Paper Folding Tests;(2) Analytical Reasoning; and (3) Inductive Reasoning. Scores fromitem response theory methods were measured for the tests. Resultssuggest that: the Wiggly Block Test contains a small non-spatialcomponent, attributable to the use of a distinctivefeaL_:e-extraction strategy; and the Paper Folding Test contains alarge non-spatial component, attributable to the use of a distinctivefeature-extraction strategy and general reasoning ability. Overall,the results show that the relative independence of spatial measuresfrom verbal and reasoning measures is no longer characteristic ofmany spatial tests currently in use. Ten figures and 17 tablessummarize study data. A 65-item list of references is included.(SLD)
***********************************************************************
Reproductions supplied by EDRS are the best that can be madefrom the original document.
***********************************************************************
THE MEASUREMENT OF STRUCTURAL VISUALIZATION:AN EVALUATION OF SPATIAL AND NONSPATIALSOURCES OF VARIATION IN THE WIGGLY BLOCK
AND PAPER FOLDING TEST SCORES
U.S. DEPARTMENT OF EDUCATIONOffice of Educatonal Research and Improvement
EDUCATIONAL RESOURCES INFORMATIONCENTER (ERIC)
Trus document has ta an reproduced asreceived horn the person or orgaruzabonoriginating it
O Minor changes nave been made to Improvereproduchon Quality
Points of yrew or opinions slated this doctrment do not necessarily represent officialOERI Position or poky
"PERMISSION TO REPRODUCE THISMATERIAL HAS BEEN GRANTED BY
Ro8E-4-r F 161Le
TO THE EDUCATIONAL RESOURCESINFORMATION CENTER (ERIC)."
Michele F. Zimowski and Werner Wothke
JOHNSON O'CONNOR RESEARCH FOUNDATIONHUMAN ENGINEERING LABORATORY
Technical Report 1988-5August, 1988
2
COPYRIGHT ©1988 BY JOHNSON O'CONNOR. RESEARCH FOUNDATION, INCORPORATEDALL RIGHTS RESERVED
The Measurement of Structural Visualization:An Evaluation of Spatial and NonspatialSources of Variation in the Wiggly Block
and Paper Folding Test Scores
Michele F. Zimowski and Weiner Wothke
Abstract
This report presents the results from a study designed to evaluate the Foun-dation's measurement of structural visualization. Three experimental tests,the Incomplete Open Cubes test, the Guilford-Zimmerman Spatial Visual-ization test, and Raven's Advanced Progressive Matrices, were added to theFoundation's test battery for the study and administered to clients in twelveof the laboratories. Several tests from the regular battery were also selectedfor analysis. They include the Foundation's measures of structural visual-ization, Wiggly Block and Paper Folding, and two measures of reasoningability, Analytical Reasoning and Inductive Reasoning. In all, the resultsof the study suggest that the Wiggly Block test contains a small nonspa-tial component, attributable to the use of a distinctive feature-extractionstrategy, while the Paper Folding test contains a large nonspatial compo-nent, attributable to the use of a distinctive feature-extraction strategy andgeneral reasoning ability.
i
Table of Contents
Introduction 1
Sample and Test Selection 3
Description of the Spatial and Experimental Tests 4
The Incomplete Open Cubes Test (IOC) 5
The Guilford-Zimmerman Spatial Visualization Test (GZ) 8
The Wiggly Block Test (WB) 8
The Paper Folding Test (PF) 10
Raven's Advanced Progressive Matrices-s II (PM) 10
Item Facilities 11
The Incomplete Open Cubes Test 11
The Guilford-Zimmerman Test 14
Raven's Advanced Progressive Matrices-Set II 17
Item Factor Analyses 20Methodology 20Results 21
The Incomplete Open Cubes Test 21
The Guilford-Zimmerman Test 26Raven's Advanced Matrices 28
Test Re liabilities and Information Functions 31
Test Re liabilities 31
Test Information Functions 32
Correlational and Factor Analyses of the Test Scores 37
Correlations 38
Factor Analysis 39
ii
rI)
Sex Differences 43
Distributional Analyses 46
Discussion 52
Summary 56
References 59
Appendix 66
iii
6
List of Tables
Table :Page
1 Item facilities for the Incomplete Open Cubes test 12
2 Item facilities for the Guilford-Zimmerman test 15
3 Item facilities for Raven's Progressive Matrices. 18
4 Full information factor analysis tests of fit for theIncomplete Open Cubes test 22
5 IOC factor loadings from the two-factor varimax solution. 23
6 Full information factor analysis tests of fit for theGuilford-Zimmerman test 26
7 GZ factor loadings from the two-factor varimax solution. 27
8 Full information factor analysis tests of fit for theAdvanced Progressive Matrices test 28
9 PM factor loadings from the two-factor varimax solution 29
10 Test reliabilities 31
11 Correlations among the test scores 38
12 Factor loadings from the analysis of test scores. 40
iv
'7
13 Communalities. 41
14 Percentage of true score variance accounted forby the four factors 42
15 Percentage of true score variance accounted forby each factor 43
16 Effect sizes for the male-female contrast 44
17 Effect sizes for the male-female contrast controllingfor age. 45
v
8
List of Figures
Figure Page1
1 Two items from the Incomplete Open Cubes test. 6
2 Facet design on the IOC items 1 7
3 Examples of items from the Guilford-Zimmerman SpatialVisualization test (a), the Wiggly Block test (b),
11
and the Paper Folding test (c) 9
4 Raw score distribution for the Guilford-Zimmerman Spatial /iVisualization test 16
5 Test information function for IOC-1 / 35
6 Test information function for the Guilford-ZimmermanSpatial Visualization test l 36
48
7 Gaussian decomposition of the male scale score distributionfrom IOC-1.
8 Gaussian decomposition of the female scale score distributionfrom IOC-1. 49
9 Gaussian decomposition of the male scale score distributionfrom IOC -2. 50
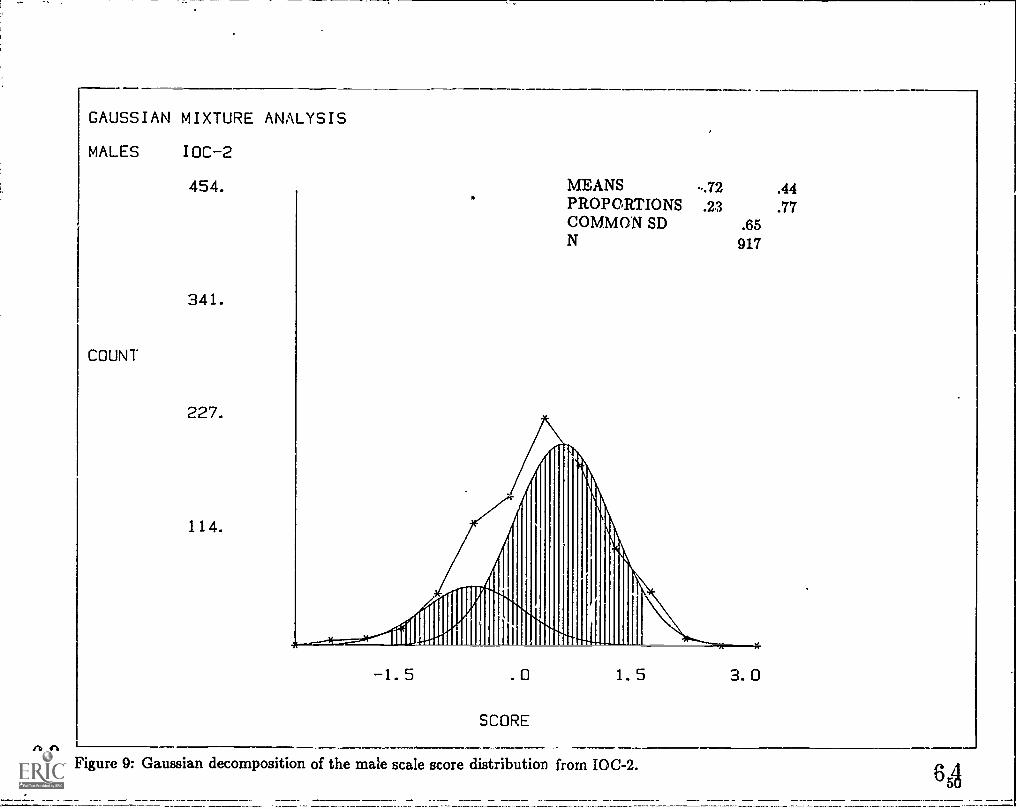
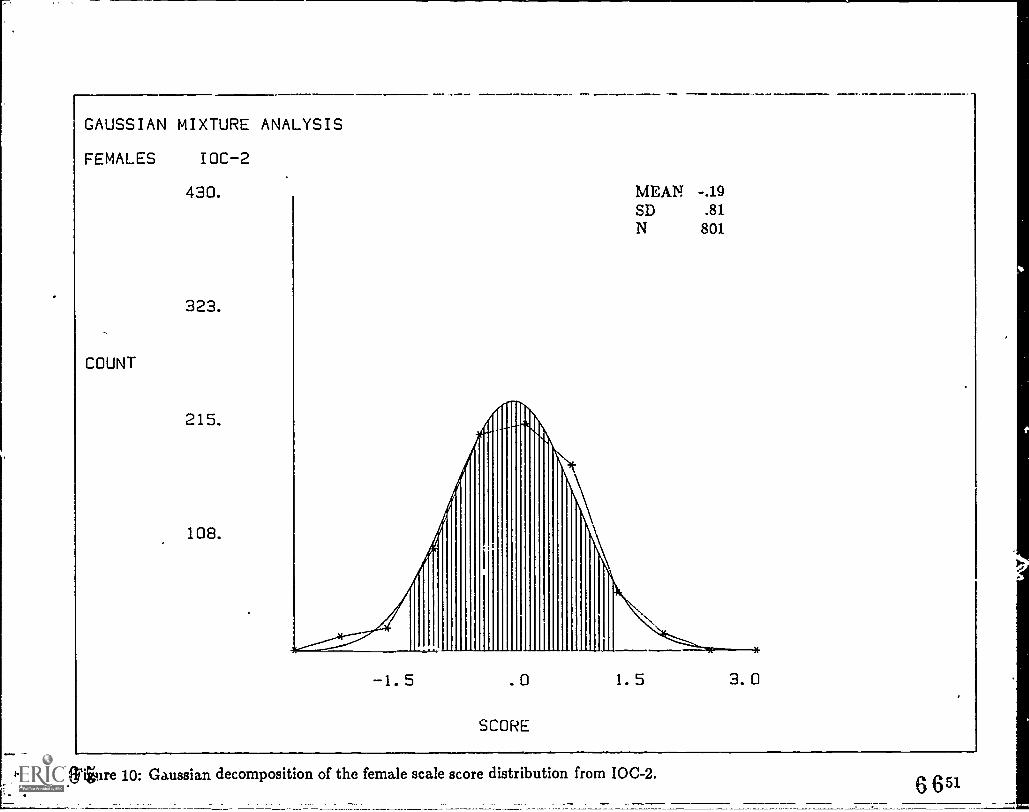
10 Gaussian decomposition of the female scale score distributionfrom IOC -2. 51
vi
9
Introduction
Structural visualization (a.k.a. spatial ability), measured by tests thatrequire. the mental manipulation of configural information, has been ofconsiderable interest since Thorndike (1921) and McFarlane (1925) firstdemonstrated that it was relativeiy independent of Spea.rman's General In-telligence factor (g). Spatial measures were then routinely included in themultiple factor work of the 1920s and 30s (e.g., Kelley, 1928). In the studiesreviewed by Wolfe (1940), the Spatial factor was second only to the Verbalfactor in its frequency of occurrence. Additional support for the relativeindependence of these abilities soon appeared in the validation work of the1930s, 40s, and 50s. Much of this work was conducted by the JohnsonO'Connor Research Foundation (Statistical Bulletins 438, 706; TechnicalReports 90, 97, 102, 113; Validation Bulletins 11, 22, 74). In this work,measures of spatial and verbal abilities exhibited distinct patterns of corre-lations with technical proficiences and academic success in various subjectareas (See McGee, 1979, and Technical Report 1986-1 for reviews). In the1940s and 50s this growing evidence in favor of a distinct Spatial factor ledto examinations of the factorial structure of the spatial domain (French,1951; Guilford Sc Lacey, 1947; Thurstone, 1950). It was during this periodand for these purposes that many of the spatial tests currently in use wereoriginally developed.
Although these tests all required the processing of visuospatial stimuli,not all measured an ability that was relatively distinct from verbal andgeneral reasoning skills. As early as 1950, Spearman and Jones noted thatitems of visuospatial content could:
be readily solved in two distinct manners. One may be calledanalytic, in the sense that attention wanders from one elementof the figures to another. The other mode of operation is com-paratively synthetic, in that the figures (or their constituents)are mentally grasped in much larger units (sometimes called"wholes"). The former procedure, not the latter, tends to loadnoegenetic [i.e., congeneric] processes with g (p.70).
1
10
Similar distinctions among "spatial" tests and processing modes have sinceappeared not only in the individual differences literature, but in the infor-mation processing literature as well (e.g., analytic versus holistic [analog]processing of visuospatial informatior: Cooper, 1976, Metzler & Shepard,1974; analytic versus nonanalytic spatial ability, Maccoby & Ja.cklin, 1974;propositional versus spatial/imagery models of visuospatial representationand processing, Kosslyn & Shwartz, 1977, Paivio, 1977; nonanalog versusanalog visuospatial tests, Technical Report 1986-1, Zimowski, 1985).
Despite this growing body of evidence suggesting that many spatial mea-sures contain verbal analytic components, the term "spatial" is still usedrather indiscriminately in the individual differences literature to refer to anytest that requires the processing of visuospatial information (e.g., Eliot &Smith, 1983; Caplan, MacPherson, & Tobin, 1985). As a result, conclusionsdrawn in this literature tend to be test-dependent. This is especially trueof studie& that have focused on identifying the biological and socioculturaldeterminants of individual and sex differences in spatial ability. Progressin this and other areas now depends on a better understanding of the itemfeatures that promote or require verbal reasoning solution strategies and ameans for identifying relatively pure measures of spatial (analog) ability.
The work of Zimowski (1985) and Zimowski and Wothke (Technical Re-port 1986-1) is a step in this direction. In their review of item-feature ef-fects, they identify item attributes associated with analog (spatial, holistic)and nonanalog (verbal or general reasoning) solution strategies. They findthat analog items share a number of properties. First, they involve judg-ments among rotated stimuli. Other transformation tasks are less resistantto solution by nonanalog processes. Second, the stimuli differ by orienta-tions other than 180 degrees. Because simple verbal rules such as "the right'ide now becomes the left side" can be used to solve 180-degree items, theseitems tend to have a nonanalog component. Third, when the items con-tain distractors, the distractors are mirror images of the reference stimulior structurally equivalent forms. When mirror-image distractors are notused, the problems are readily solved through "feature-extraction" strate-gies, e.g., identification of incongruent portions of the figures. Fourth, a
2
items require whole-whole rather than part-whole or part part comparisons.Subjects report using serial comparison and other nonanalog strategies onitems that involve the latter two types of comparisons. Items requiringthese types of comparisons also produce effects consistent with a nonana-log model of information processing (see Pylyshyn, 1979). Fifth, analogitems require the rotation of an entire object as a rigid whole rather thanthe rotation of only one or several pieces of '.. Thject relative to the whole.Finally, solution time restrictions are imposed on the items to inhibit solu-tion through other than analog means. Almost any spatial item, even onewith properties that resist nonanalog solution, can be solved through thesemeans if enough time is allowed for their applirat:on. Zimowski and Wothke(Technical Report 1986-1) use this list of item features to classify existinginstruments as relatively pure (analog) or impure (nonanakg) measures ofspatial ability. Their classification suggests the Llany of the spatial testscurrently in use contain verbal analytic and reasoning components.
In view of this and earlier work, a study was designed to evaluate theFoundation's measurement of structural visualization. Previous research atthe Foundation indicates that the two tests used to measure spatial abil-ity, Wiggly Block and Paper Folding, may contain reasoning components.Scores on these tests correlate .35..38 and .39-.47, respectively, with scoreson the Analytical Reasoning test in the battery and intercorrelate to onlya slightly higher degree (.51-.65) (Technical Report 1983-2). Thus, it isunclear wl.Ather these tests even measure a common spatial component;their intercorrelation could be entirely due to a shared analytic component(Statistical Bulletin 1985-6). The study was designed to examine this mea-surement problem in greater detail in a general evaluation of the spatialtests in use at the Foundation. This report presents the results from thestudy.
Sample and Test Selection
Two spatial tests (the Incomplete Open Cubes test, Zimowski, 1985; amodification of the Guilford-Zimmerman Spatial Visualization test, Bock& Kolakowski, 1973) and one measure designed to assess Spearman's g in
3
12
a culture-Lee manner (the Advanced Progressive Matrices, Raven, 1962)were added to the Foundation's test battery for the study. They were ad-ministered along with the regular test battery under standard conditionsby Foundation staff to a sample of clients employing the Foundation's ap-titude services ;,1 twelve of the testing centers. The Foundation's clientsare self-selected; they elect, for various reasons, to secure the Foundation'saptitude services and, as a whole, are not representative of the generalpopulation. In particular, they tend to be more educated and of a highersocioeconomic level than the general population.
Several tests from the regular battery were selected for analysis. Theyinclude the Foundation's measures of structural visualization, Wiggly Block(O'Connor, 1928) and Paper Folding (French, Ekstrom, & Price, 1963), andtwo measures of reasoning ability, Analytical Reasoning (AR) and Induc-tive Reasoning (IR).
Not all participants were administered all of the tests; sample sizesfor the individual tests ranged between 2,199 and 2,814. The IRT (itemresponse theoretic) analyses were based on all available responses, whilecomparative analyses of the measures (i.e., correlational and factor analy-ses of the test scores, distributional analyses, and effect sizes) were basedon the subsample of participants who completed all tests. Complete mea-surements were available for 917 males and 801 females. These subgroupsare comparable with respect to average age (26.3 and 27.6 years old, formales and females, respectively) and years of education (14.1 and 14.4, re-spectively).
Description of the Spatial and Experimental Tests
The spatial tests of the study are described below with reference to theclassification scheme of Zimowski and Wothke (Technical Report 1986-1).A description of Raven's Progressive Matrices test is also included.
4
13
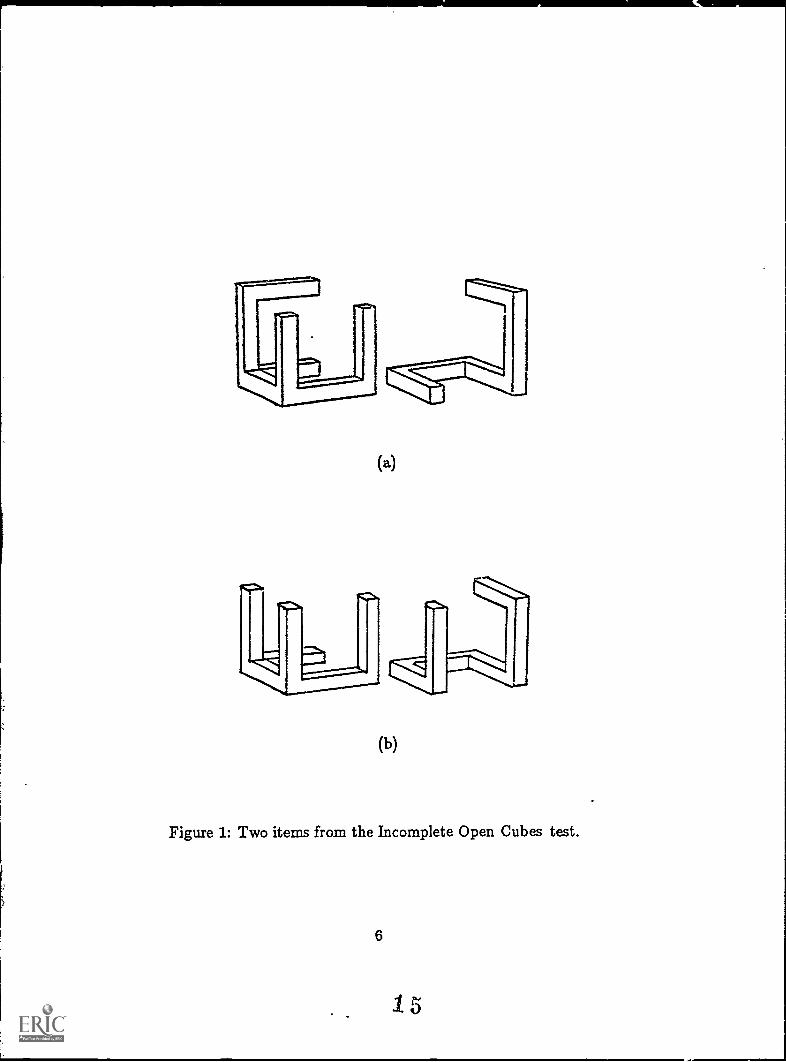
The Incomplete Open Cubes Test (IOC)
The Incomplete Open Cubes test (Zimowski, 1985) was especially con-structed to measure spatial (analog) ability and nonspatial (nonanalog)ability in perceptually equivalent but cognitively distinct subsets of items.The version used in this study consists of 47 pairs of incomplete (parts of)cubes. The first three pairs are practice items, the remainder test items.The items are presented on slides, and their exposure times are individu-ally controlled. Each item is displayed for 14 seconds. The examinees aregiven a few moments between slides to record their answers. In the test,examinees are asked to determine whether two incomplete parts of cubesfit together to form a complete open cube. Sample items from the test areshown in Figure 1.
The test was constructed according to a facet design of item featuresthought to affect the processing of visuospatial information. The facets andtheir conditions are shown in Figure 2. The first facet in the flow diagramis the "partition" facet. It refers to the distribution between parts of cubesof 12 segments. Each item in the 4:8 condition, for example, consists ofan incomplete open cube with 4 segments and another with 8 segments.The item shown in Figure la belongs to this condition, while that shownin Figure lb belongs to the 6:6 condition.
In the second facet, cubes that fit together to form a complete cube arereferred to as "compatible" cubes, those that cannot be joined together as"incompatible" cubes. Compatible cubes are further distinguished by thenumber of degrees (i.e., 45 or 90) that one, either one, of the compatibleparts must be rotated in order to be joined with the other part. The itemshown in Figure la contains compatible parts that must be rotated 90 de-grees to form a complete open cube. The item shown in Figure lb containsincompatible parts.
As shown in the diagram, incompatible cubes may be mirror images(MI) or nonmirror images (NMI). If either incomplete cube of a mirror im-age pair is replaced by its mirror image, the other left as is, the two cubes
5
14
(a)
(b)
Figure 1: Two items from the Incomplete Open Cubes test.
6
15
Partition Compatibility Rotation/MI-NMI
Incompatible
Compatible45°
90°
Figure 2: Facet design on the IOC Items
7
become compatible. The NMI condition. refers to the absence of this rela-tionship. Items in this condition were especially constructed to encouragenonanalog processing of the stimuli. They contain distinctive features thatreadily permit solution without rotation.
The item shown in Figure lb is an example of an item in the NMIcondition that may be quickly solved through nonanalog reasoning. It isobvious that the cube on the left requires a sauare side with four segmentsfor its completion and that the cube on the right does not contain a sidewith these features.
The Guilford- Zimmerman Spatial Visualization Test (GZ)
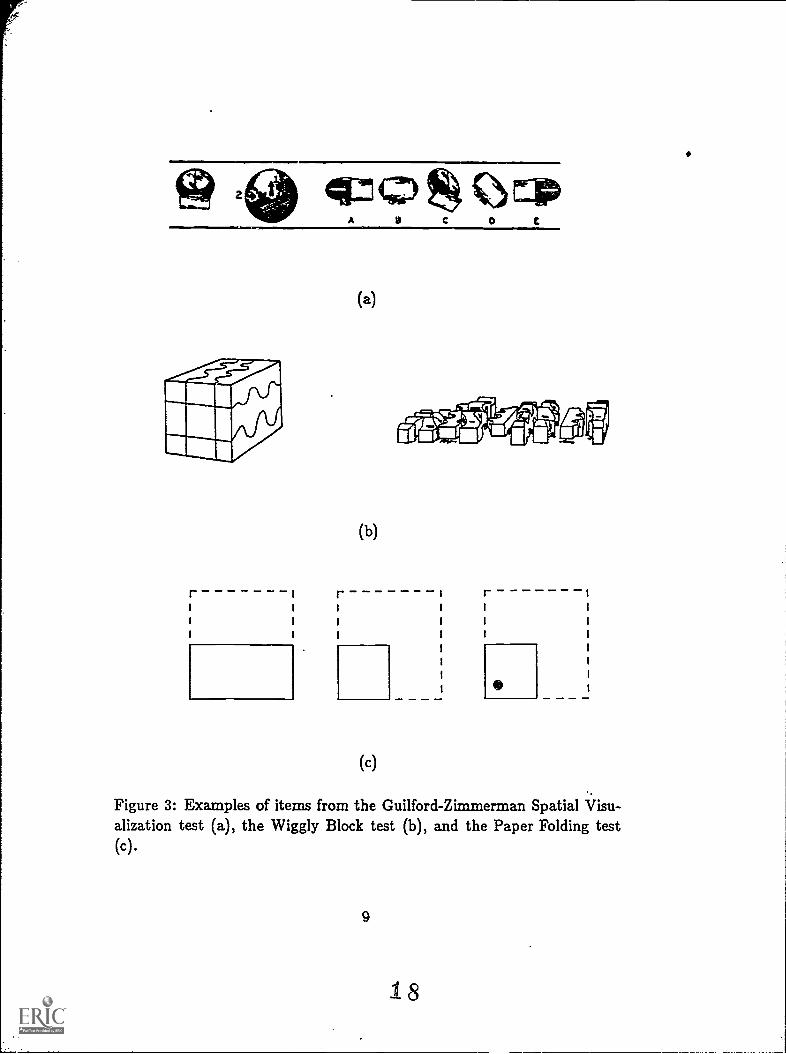
In the Guilford-Zimmerman Spatial Visualization test (Guilford & Zim-merman, 1947), subjects are asked to mentally rotate a picture of a clockin a specified direction and select the alternative that shows the clock inits final position (see Figure 3a). Each alternative is a picture of the clockas viewed from a different perspective. As a result, the alternatives do notcontain distinctive features that allow for rapid elimination of incorrect al-ternatives. The Bock-Kolakowski (1973) modification of the test was usedin this study. It consists of 36 items; six of these items are practice items.The 30 test items are roughly ordered according to level of difficulty. Thetest begins with five practice items followed by six items that require onlyone rotation of the clock. After one additional practice item, the next 17items require two turns of the clock, while the last seven require three turnsof the clock. All of the items are presented on tape-cued slides, each slideis individually displayed for a fixed amount of time. The test is assumedto be a relatively pure measure of spatial ability.
The Wiggly Block Test (WB)
The Wiggly Block test (O'Connor, 1928) differs from most other spa-tial tests because it is a performance measure. The test consists of wooden
8
17
r ri
1
t
(a)
(b)
(c)
r
Figure 3: Examples of items from the Guilford-Zimmerman Spatial Visu-alization test (a), the Wiggly Block test (b), and the Paper Folding test(c).
9
18
blocks that have been sawn into 4, 6, 9, or 12 pieces. The cuts are wavyor wiggly rather than plane. All of the pieces are approximately equal involume and weight, but no two are identical. Subjects are presented witha random arrangement of the pieces and asked to assemble the block azquickly as possible (see Figure 3b for a sample item). Scores on the testare based on the amount of time it takes to assemble each block.
The test is thought to have a small nonanalog component because thepieces of the blocks have distinctive features that provide information abouttheir global location. Corner, outer-edge and inside-center pieces are read-ily distinguished by their number of flat surfaces. This information can beused to reduce the number of potentially compatible pieces that must berotated for fit to any other piece. Its use should reduce the amount of timerequired to assemble the blocks and, thus, improve performance on the test.
The Paper Folding Test (PF)
In each item of the paper-folding test (Free Ekstrom, & Price, 1963)the subject is shown a series of figures obtained from folding a square sheetof paper and punching a hole in the folded form. Each step of this foldingand punching process is depicted in a separate figure of the series. Thesubject is asked to determine the position of the holes if the paper wereunfolded. In the version in use at Johnson O'Connor the subject indicatesthe position of the holes on a square grid of paper.
Many of the items in the test can be readily solved through verbalpropositional rules. The item shown in Figure 3c, for example, can besolved through application of a symmetry principle.
Raven's Advanced Progressive MatricesSet II (PM)
Raven's Progressive Matrices test was designed to measure Spearman'sg factor in a culture-free manner. The version used in this study was espe-
10
19
cially constructed to provide reliable estimates of intellectual efficiency insamples with higher than average ability. It consists of 36 items that areroughly ordered according to their level of difficulty.
Each item of the test contains an arrangement of visuospatial stimulithat differ on qualitative and/or quantitative dimensions. A segment ofthe arrangement is missing in each item. Examinees are asked to select thealternative that completes the arrangement.
The items of this test do not require analog processing for their solution.They do not contain any of the properties shown to inhibit nonanalog pro-cessing nor any that promote or require analog processing. Instead, some ofthe items require perceptual accuracy while others require an understand-ing of the logic of the spatial structure (see Raven, 1938). Even so, thetest is often mistakenly considered to be a measure of spatial aptitude (seeCaplan, MacPherson, & Tobin, 1985).
Item Facilities
The item facilities (proportions of correct responses) were computed foreach of the experimental tests that were -,z.dded to the Foundation's testbattery for the study. These percents correct serve as rough indices of thedifficulties of the items.
The Incomplete Open Cubes Test
The item facilities for the IOC items are presented in Table 1. As awhole, the items cover a wide range of difficulty. The item facility of themost difficult item (.31) is well below chance level (.5), while that of theeasiest item is almost 1 (.95). The facilities of the other items are, for themost part, evenly distributed between these extremes of the difficulty range.
11
20
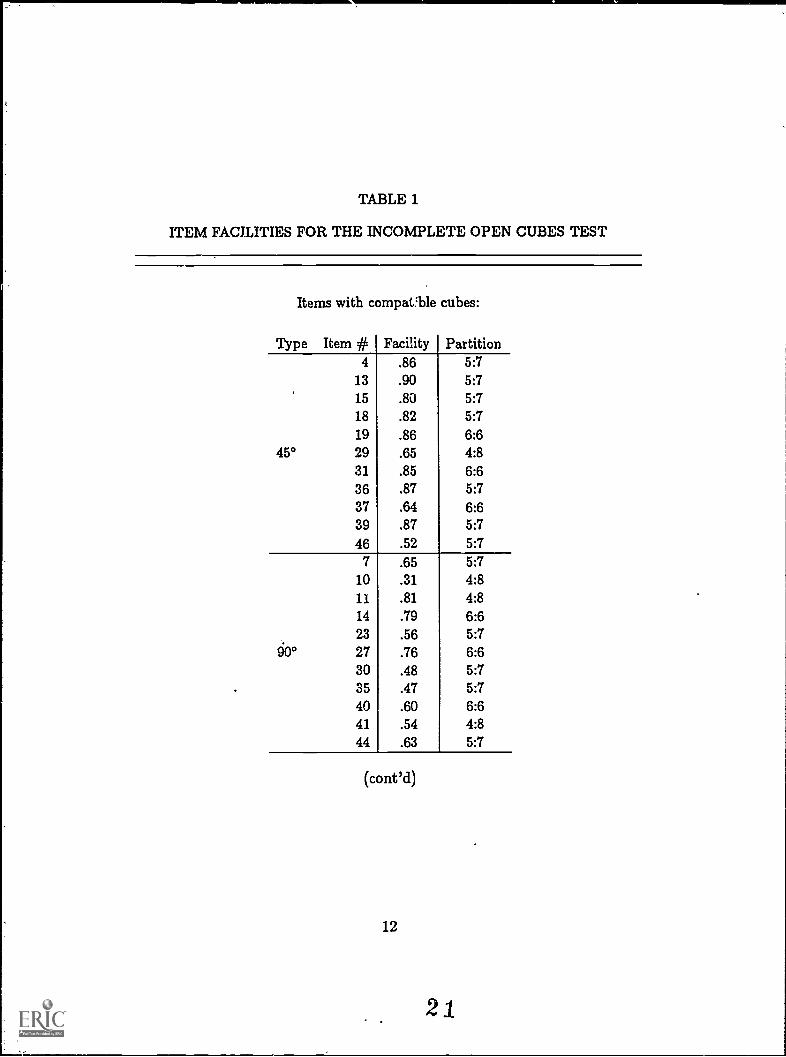
TABLE 1
ITEM FACILITIES FOR THE INCOMPLETE OPEN CUBES TEST
Items with compatible cubes:
Type Item #4
13
15
18
19
45° 2931
36373946
7
10
1114
23600 27
3035404144
Facility.86.90.80.82.86.65.85.87.64.87.52
.65
.31
.81
.79
.56
.76
.48
.47
.60
.54
.63
Partition5:75:75:75:76:64:86:65:76:65:7
5:75:74:84:86:65:76:65:75:76:64:85:7
(cont 'd)
12
21
Table 1 (cont'd)
Items with incompatible cubes:
Type Item #8
9162122
MI 242628323842
Pac;iity Partition^P..,. 3:9
.54 4:8
.66 3:9
.61 3:9
.74 5:7.57 6:6.64 7:5.54 6A.77 4:8.76 4:8.75 5:7
5 .66 4:86 .93 3:9
12 .72 4:817 .95 3:920 .88 6:6
NMI 25 .79 4:833 .55 5:734 .47 6:643 .44 6:645 .66 5:747 .70 5:7
13
22

Inspection of the item facilities with respect to the facet design revealsthat the items in the 90 degree condition of the rotation facet tend to bemore difficult that those in the 45 degree condition. This result is in accordwith the earlier work of Zimowski (1985). It is also in accord with the workof Shepard and colleagues (e.g., Cooper & Shepard, 1973; Shepard & Met-zler, 1971). They show that reaction times for correct judgments increaseas a function of the angular difference between orientations of the same fig-ure and that these reaction times are positively correlated with error rates.In other words, items that require larger rotations tend to be more difficult.In contrast, there appears to be no relationship between item facility andthe conditions of the'MI/NMI facet.
The Guilford-Zimmerman Test
The item facilities for the Guilford-Zimmerman Spatial Visualizationtest are shown in Table 2. In comparison with the IOC, the items of thistest cover a restricted range of difficulty. Twenty-one of the 30 item faciltiesfall between .70 and .88. The facility of the most difficult item (.49) is wellabove chance level, .25, while that of the easiest item is almost 1 (.97). Ingeneral, items that require more turns or rotations of the clock tend to bemore difficult.
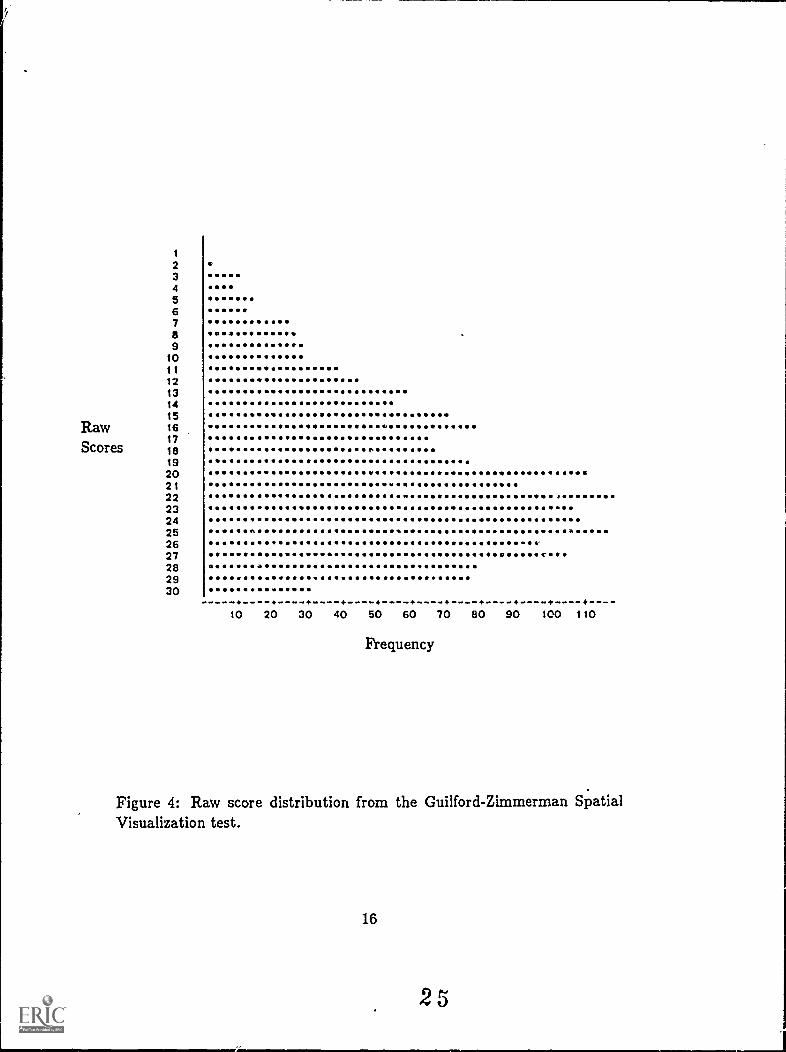
Inspection of Table 2 also reveals that 25 of the 30 test items wereanswered correctly by at least seventy percent of the respondents. Appar-ently, the test was too easy for the sample. The raw score distributionshown in Figure 4 is in accord with this observation. It shows that manyof the examinees were able to answer correctly all, or nearly all, of the 30items in the test. That the distribution is distorted and without an uppertail further reflects the poor discrimination the test provides in the upperrange of abiliQy in this sample.
14
23
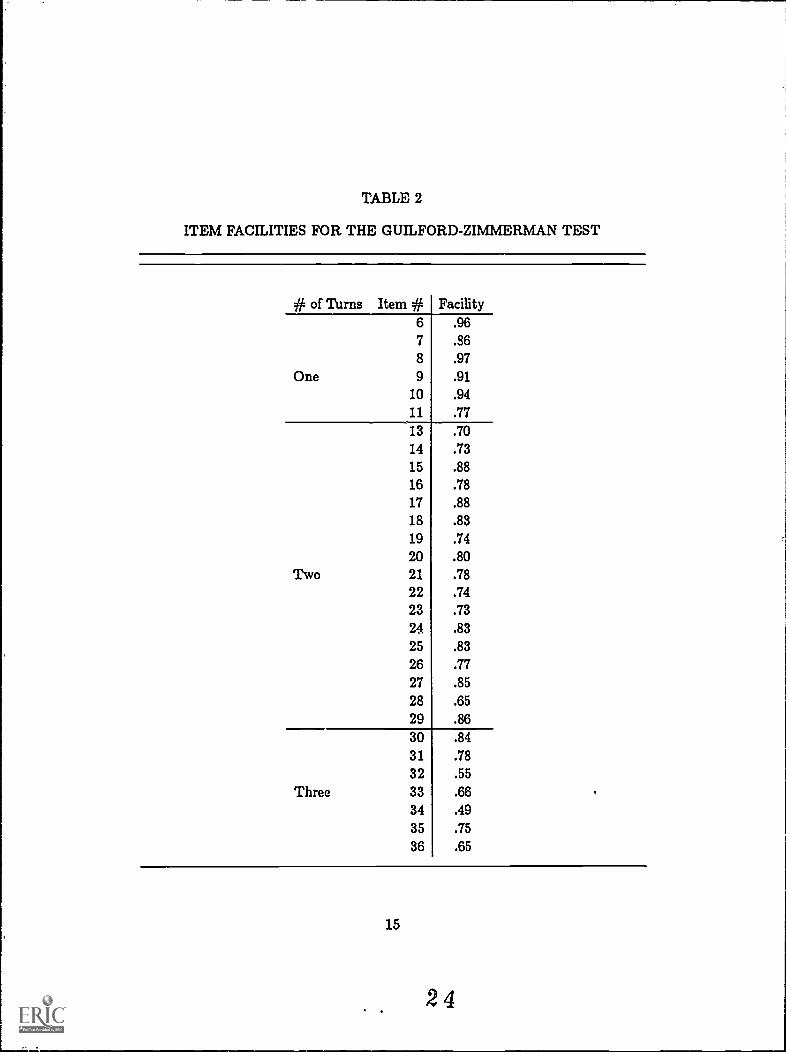
TABLE 2
ITEM FACILITIES FOR THE GUILFORD-ZIMMERMAN TEST
# of Turns Item # Facility6 .967 .368 .97
One 9 .91
10 .94
11 .77
13 .7014 .73
15 .88
16 .78
17 .88
18 .83
19 .7420 .80
Two 21 .7822 .7423 .7324 .83
25 .83
26 .77
27 .85
28 .65
29 .8630 .84
31 .78
32 .55
Three 33 .6634 .49
35 .75
36 .65
15
24
1
2 e
34 0 *
56789
101112131415
Raw 16
Scores171819202122 II )
2324252627282930
+----+----+----+----+----+----+----+----+----+----+----10 20 30 40 50 60 70 80 90 100 110
Frequency
Figure 4: Raw score distribution from the Guilford-Zimmerman SpatialVisualization test.
16
25
These results were unexpected. The test has Evirformed quite satisfac-torily in other samples (see Bock & Kolakowski, 1973, for example). Itspoor performance in thiz. study may be due to the nonrandom nature ofthe sample (see the Discussion section for a treatment of this issue).
Raven's Advanced Progressive MatricesSet II
The item facilities for Raven's Advanced Progressive Matrices are shown.in Table 3. They are based on the number of examinees who tompletedeach item. Table 3 shows that the items of this test cover a wide range ofdifficulty. The facility of the easiest problem in tie test is .81. At .12, thatof the most difficult problem is slightly below chance level, .125. The facili-ties of the other items are fairly evenly distributed between these extremesof the difficulty range.
Table 3 also shows that the items in this test are roughly ordered ac-cording to their level of difficulty; overall, the items of the test becoweprogressively more difficult. This result is in accord with the design of thetest. It was constructed to begin with the easiest items and end with themost difficult ones (Raven, 1965).
In this administration of the test, presentation of the items was termi-nated after an examinee answered four consecutive items incorrectly. Thismethod of administration tends to inflate the item facilities, especially thosenear the end of a test. It may account for the reversals in the ordering ofitem facilities that appear throughout the test (see Table 3). Nonetheless,this method of administration does not affect the results of the IRT anal-yses discussed in the iiext section. IRT methodology is designed to handlecases whe.e examinees are presented different subsets of items. Moreover,because the items of the PM test are ordered in accord with their levelof difficulty, this method of administration could be viewed as a form oftailored testing (Lord, 1980) in the upper range of ability.
17
26
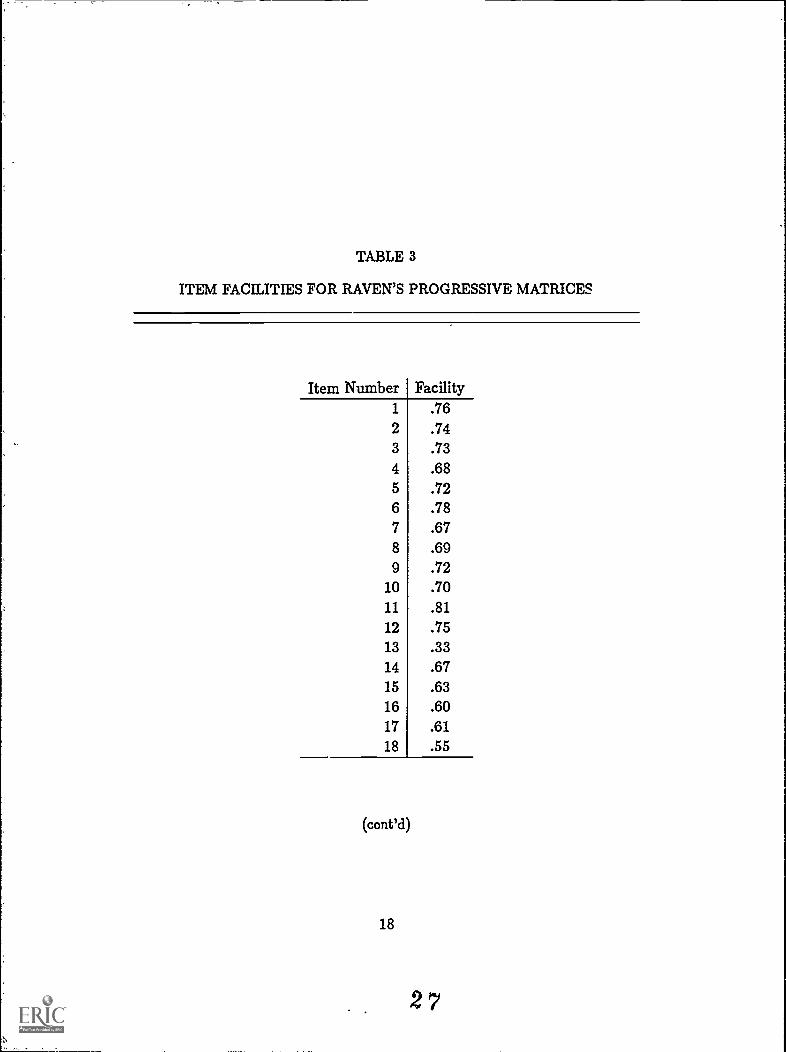
TABLE 3
ITEM FACILITIES FOR RAVEN'S PROGRESSIVE MATRICES
Item Number Facility1 .762 .743 .734 .685 .726 .787 .678 .699 .72
10 .7011 .8112 .7513 .3314 .6715 .6316 .6017 .6118 .55
(cont'd)
18
27
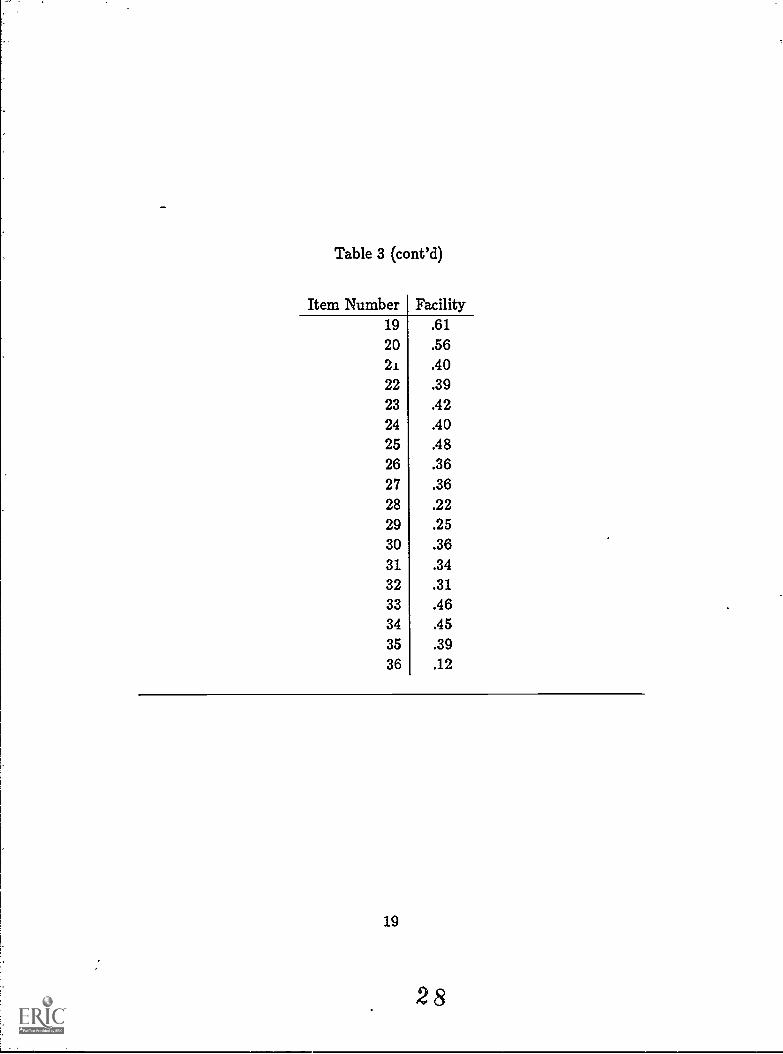
Table 3 (cont'd)
Item Number Facility19 .6120 .5621. .4022 .3923 .4224 .4025 .4826 .3627 .3628 .2229 .2530 .3631 .3432 .3133 .4634 .4535 .3936 .12
19
28
item 3:actor _Analyses
Methodology
The TESTFACT implementation (Wilson, Wood, & Gibbons, 1984) ofa full-information method for dichotomous item factor analysis (see Bock,Gibbons, & Muraki, 1985, for a detailed treatment of the method) was -usedto examine the factorial composition of the exTerimental tests in the bat-tery and to identify item-feature effects- -The-model is a multidimensionalextension of a univariate ogive model to more than one dimension and isbased on Thurstone's (1947)-multiple factor fuiinulation. -The-method-pro-vides estimates of the slopes,-intercepts, standard difficulties, and factorloadings of the items.
A test of fit of the assumed factor.model against a general xemitinnrni21alternative is provided by the chi-square approximation for the likelihoodratio test (G2 ). This test .is inaccurate in applications where the countof possible score patterns is much larger than the sample. size (as in thisapplication), but the difference G2's from alternative models is nonethe-less distributed as a chi-square variable in large samples with degrees offreedom equal to the difference between those of the models (Haberman,1977). This change in G2 as a.dditionallactors are added provides a testfor the number of factors.
Once the appropriate model has been determined in this manner,-ex-pected a posteriori (EAP) estimates of a subject's ability on each factormay be computed on the basis of his or her item score pattern and theestimates of the factor loadings and standard difficulties.
20
29
Results
Separate full-information factor analyses were performed on the itemr.3apo-se data from the IOC, GZ, PM tests with the TESTFACT pro-gram. Preliminary one-dimensional item response analyses of these testswere performed with the BILOG program of Mislevy and Bock (1984) todetermine whether a guessing model should be used in the factor analy-ses. Only the IOC showed evidence of guessing with a common asymptotevalue of .31. The average asyniptote values for the GZ and PM were .03and .04, respectively, too small to be of practical importance. Using theasymptote value obtained from BILOG, a guessing model was substitutedfor the normal response model in the TESTFACT analysis of the IOC.
In these applications of TESTFACT, there is some uncertainty associ-ated with the statistical tests of the number of factors because the sample isself-selected into testing centers located in twelve metropolitan areas acrossthe country. The effect is probably similar to that of cluster sampling whichtends to inflate the values of the likelihood ratio chi-square statistics (seeZimowski & Bock, 1987). For this reason, the values of these statisticswere adjusted to reflect an assumed design effect of 2.5. Because this isan approximation of the size of the effect, the p-values associated with theadjusted chi-squares are only rough indicators of statistical significance.
The Incomplete Open Cubes Test. The tests of fit for the IOC arepresented in Table 4. As shown in this table, the chi-square value associ-ated with the addition of the third factor is not significant, but the changein chi-square upon addition of the second factor is quite large. This changeis roughly five times the corresponding change in degrees of freedom andclearly supports a two-factor model.
21
30
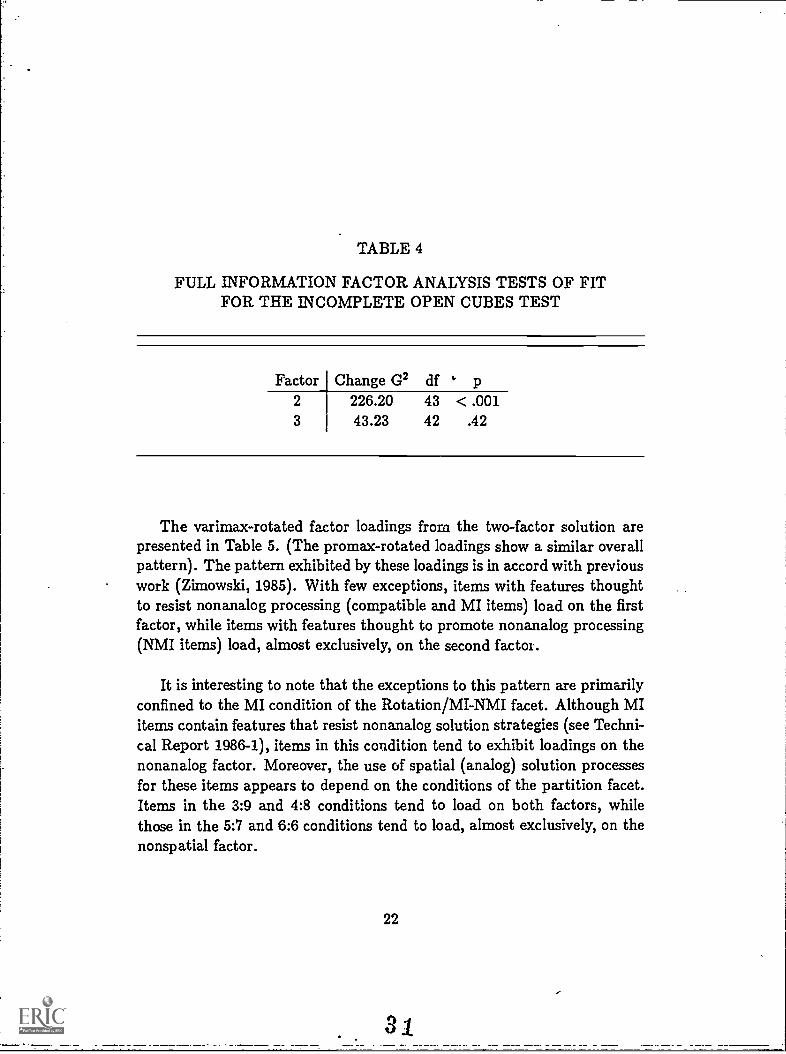
TABLE 4
FULL INFORMATION FACTOR ANALYSIS TESTS OF FITFOR THE INCOMPLETE OPEN CUBES TEST
Factor Change G2 df t. p2 226.20 43 < .0013 43.23 42 .42
The varimax-rotated factor loadings from the two-factor solution arepresented in Table 5. (The promax-rotated loadings show a similar overallpattern). The pattern exhibited by these loadings is in accord with previouswork (Zimowski, 1985). With few exceptions, items with features thoughtto resist nonanalog processing (compatible and MI items) load on the firstfactor, while items with features thought to promote nonanalog processing(NMI items) load, almost exclusively, on the second factor.
It is interesting to note that the exceptions to this pattern are primarilyconfined to the MI condition of the Rotation/MI-NMI facet. Although MIitems contain features that resist nonanalog solution strategies (see Techni-cal Report 1986-1), items in this condition tend to exhibit loadings on thenonanalog factor. Moreover, the use of spatial (analog) solution processesfor these items appears to depend on the conditions of the partition facet.Items in the 3:9 and 4:8 conditions tend to load on both factors, whilethose in the 5:7 and 6:6 conditions tend to load, almost exclusively, on thenonspatial factor.
22
31
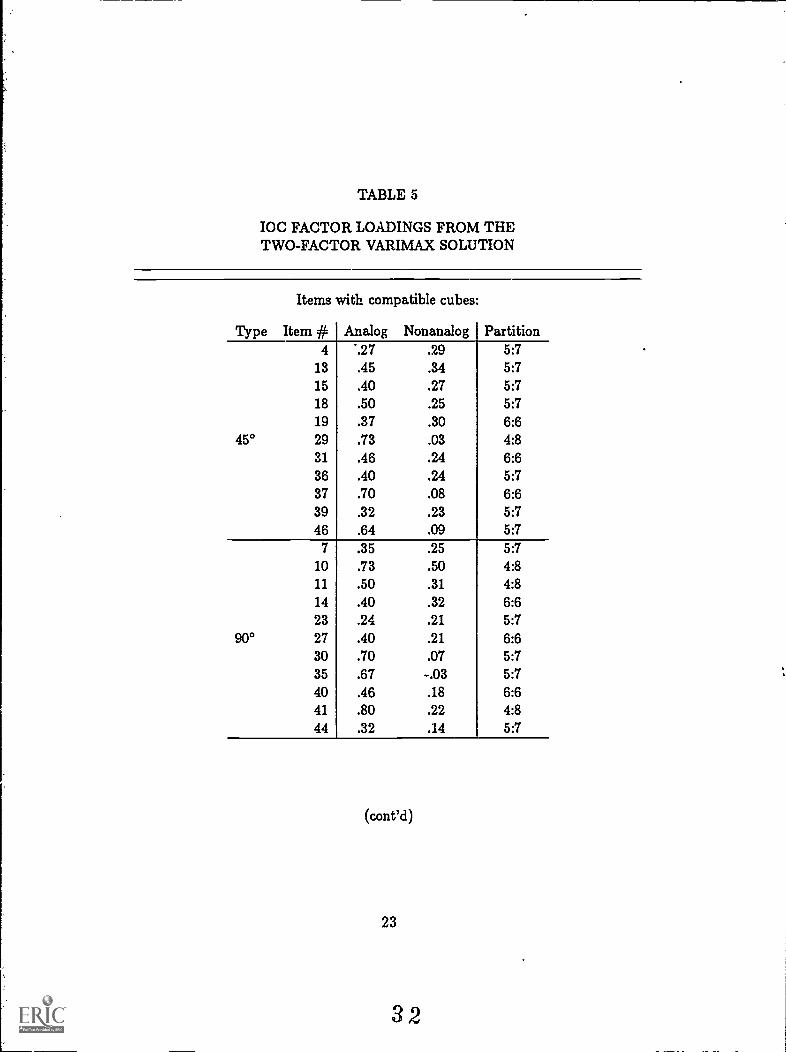
TABLE 5
IOC FACTOR LOADINGS FROM THETWO-FACTOR VARIMAX SOLUTION
Items with compatible cubes:
Type Item # Analog Nonanalog Partition4 -.27 .29 5:7
13 .45 .34 5:715 .40 .27 5:718 .50 .25 5:719 .37 .30 6:6
45° 29 .73 .03 4:831 .46 .24 6:636 .40 .24 5:737 .70 .08 6:639 .32 .23 5:746 .64 .09 5:7
7 .35 .25 5:710 .73 .50 4:811 .50 .31 4:814 .40 .32 6:623 .24 .21 5:7
900 27 .40 .21 6:630 .70 .07 5:735 .67 -.03 5:740 .46 .18 6:641 .80 .22 4:844 .32 .14 5:7
(cont'd)
23
32

Table 5 (cont'd)
Items with incompatible cubes:
Type Item #8
9
16
21
22MI 24
2628323842
Analog Nonanalog.55 .63.56 .66.45 .64.44 .70.26 .52.07 .44.04 .39. 20 .50.23 .55.19 .54.13 .51
5
6
12
17
20NMI 25
3334434547
. 20 .47
.17 .67
.10 .37
.16 .75
.13 .40
.03 .46
. 26 .38
.20 .43
.31 .50
.12 .51
.19 .45
Partition3:94:83:93:95:76:67:56:64:84:85:74:83:94:83:96:64:85:76:66:65:75:7
24
33
An explanation for this result lies in the demands on analog processingthat can plausibly be associated with the conditions of the partition facet(Zimowski, 1985). The number of ways in which one may attempt to mergethe two incompatible cubes of an MI item in an analog fashion increasesas the distribution between parts of a cube in an MI item equalizes. Ifspatially adept subjects respond "no" by default, as suggested in the workof Cooper (1976), they may have to manipulate these cubes in a variety ofways and directions before determining their incompatibility with some de-gree of certainty. If so, items in the higher conditions of the partition facetmay be most effec+ively solved through nonanalog processes, even by spa-tially proficient individuals. This interpretation is supported by the studiesof Barratt (1953) and Myers (1957, 1958), where subjects report switchingto more analytic methods as the difficulty of the problem increases.
That the two IOC factors represent more than a distinction between"yes" and "no" responses or response biases is supported by several re-sults. First, even though the correct answer to MI items is "no", items inthis condition that are also in the lower conditions of the partition facettend to load on both factors in this study and in earlier work (Zimowski,1985). Second, in a different version of the test (Zimowski, 1985), com-patible cubes, "yes" items, with 180 degree rotations exhibited loadings onboth of the factors. Third, the scores from the two factors correlate withmultiple choice and reaction-time based measures and also load on factorsdefined, in part, by these measures (see the Correlational and Factor Anal-ysis section of this report). In all, these results suggest that the IOC factorsrepresent a distinction between the cognitive content of the items.
EAP estimates of the examinees' abilities on both factors were com-puted on the basis of the varimax-rotated factor loadings and the standarddifficulties for use in subsequent analyses.
25
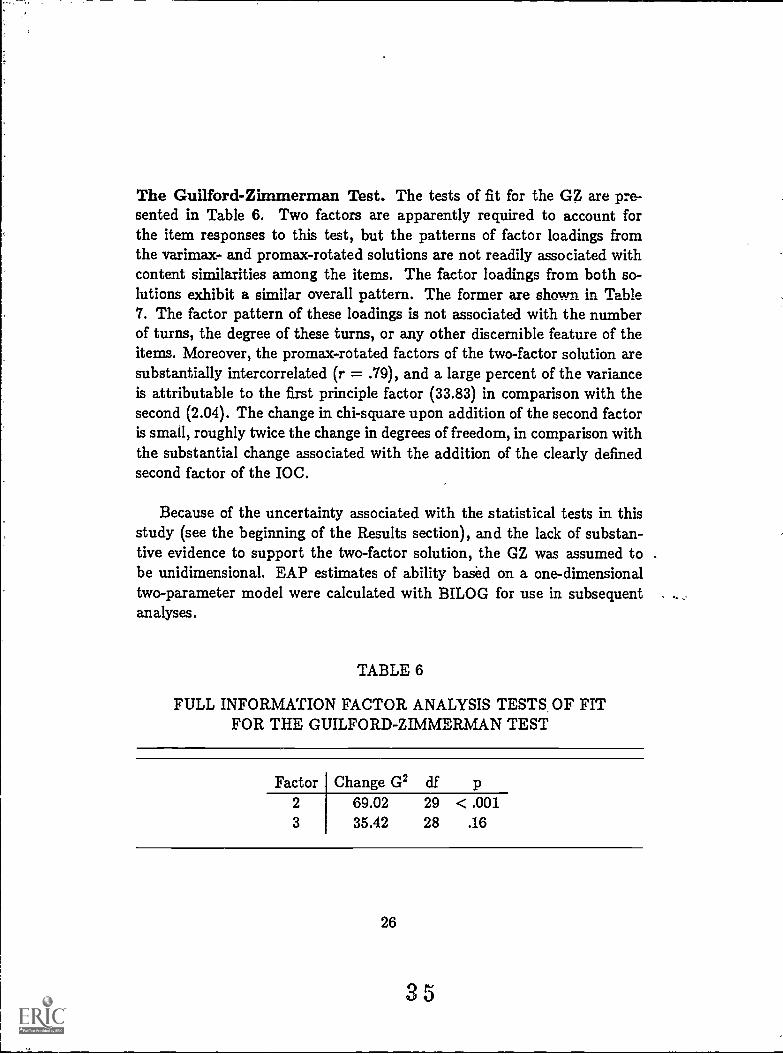
The Guilford-Zimmerman Test. The tests of fit for the GZ are pre-sented in Table 6. Two factors are apparently required to account forthe item responses to this test, but the patterns of factor loadings fromthe varimax- and promax-rotated solutions are not readily associated withcontent similarities among the items. The factor loadings from both so-lutions exhibit a similar overall pattern. The former are shown in Table7. The factor pattern of these loadings is not associated with the numberof turns, the degree of these turns, or any other discernible feature of theitems. Moreover, the promax-rotated factors of the two-factor solution aresubstantially intercorrelated (r = .79), and a large percent of the varianceis attributable to the first principle factor (33.83) in comparison with thesecond (2.04). The change in chi-square upon addition of the second factoris small, roughly twice the change in degrees of freedom, in comparison withthe substantial change associated with the addition of the clearly definedsecond factor of the IOC.
Because of the uncertainty associated with the statistical tests in thisstudy (see the beginning of the Results section), and the lack of substan-tive evidence to support the two-factor solution, the GZ was assumed tobe unidimensional. EAP estimates of ability based on a one-dimensionaltwo-parameter model were calculated with BILOG for use in subsequentanalyses.
TABLE 6
FULL INFORMATION FACTOR ANALYSIS TESTS OF FITFOR THE GUILFORD-ZIMMERMAN TEST
Factor Change G2 df p2 69.02 29 < .0013 35.42 28 .16
26
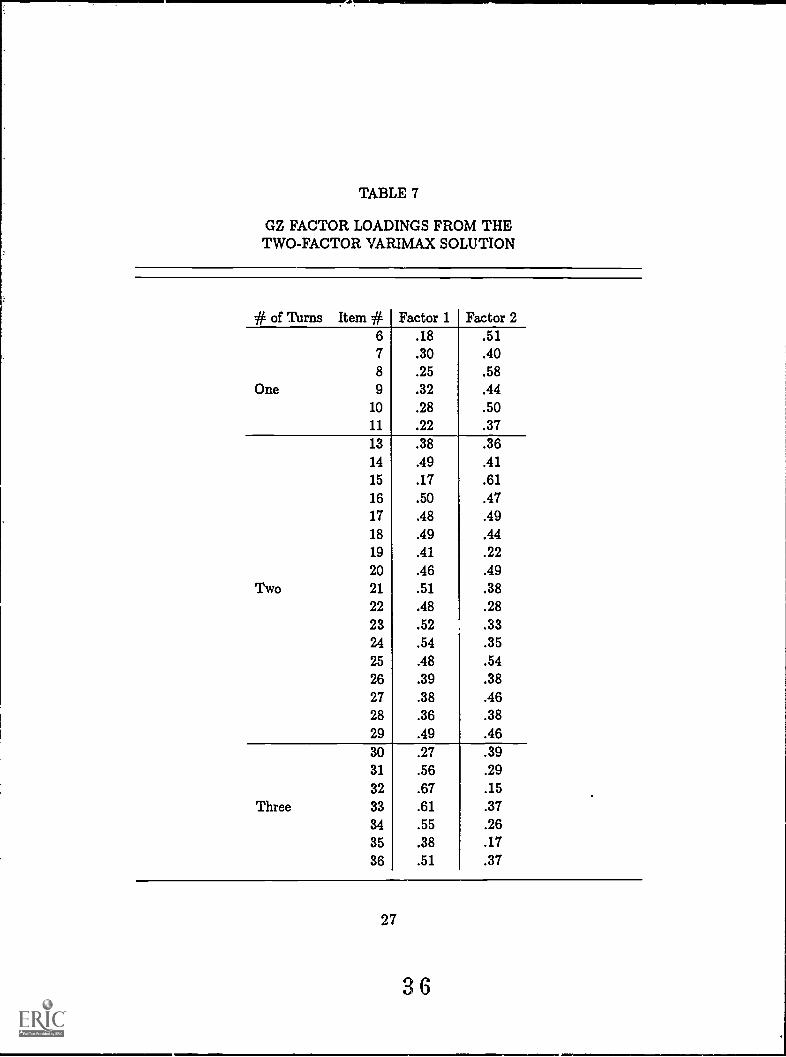
TABLE 7
GZ FACTOR LOADINGS FROM THETWO-FACTOR VARIMAX SOLUTION
# of Turns Item # Factor 1 Factor 26 .18 .517 .30 .408 .25 .58
One 9 .32 .4410 .28 .5011 .22 .3713 .38 .3614 .49 .4115 .17 .6116 .50 .4717 .48 .4918 .49 .4419 .41 .2220 .46 .49
Two 21 .51 .3822 .48 .2823 .52 .3324 .54 .3525 .48 .5426 .39 .3827 .38 .4628 .36 .3829 .49 .4630 .27 .3931 .56 .2932 .67 .15
Three 33 .61 .3734 .55 .2635 .38 .1736 .51 .37
27
36
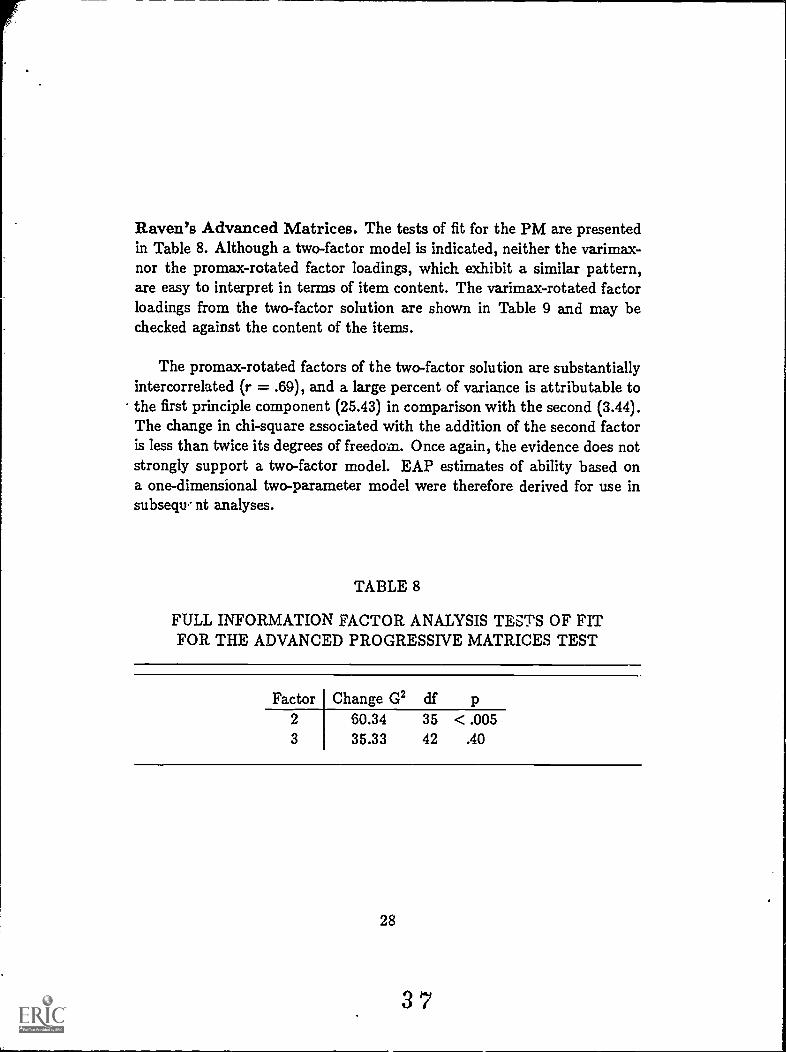
Raven's Advanced Matrices. The tests of fit for the PM are presentedin Table 8. Although a two-factor model is indicated, neither the varimax-nor the promax-rotated factor loadings, which exhibit a similar pattern,are easy to interpret in terms of item content. The varimax-rotated factorloadings from the two-factor solution are shown in Table 9 and may bechecked against the content of the items.
The promax-rotated factors of the two-factor solution are substantiallyintercorrelated (r = .69), and a large percent of variance is attributable tothe first principle component (25.43) in comparison with the second (3.44).The change in chi-square associated with the addition of the second factoris less than twice its degrees of freedom. Once again, the evidence does notstrongly support a two-factor model. EAP estimates of ability based ona one-dimensional two-parameter model were therefore derived for use insubsequ- nt analyses.
TABLE 8
FULL INFORMATION FACTOR ANALYSIS TESTS OF FITFOR THE ADVANCED PROGRESSIVE MATRICES TEST
Factor Change G2 df p2 60.34 35 < .0053 35.33 42 .40
28
37

TABLE 9
PM FACTOR LOADINGS FROM THETWO-FACTOR VARIMAX SOLUTION
Item Number Factor 1 Factor 2.08.23.17.33.21.19.25.22.36.43.34.26.19.17.21.29.02.13
1
2
3
4
5
67
8
910
11
12
13
14
15
16
17
18
.33
.51
.42
.51
.34
.43
.39
.47
.51
.62
.60
.59
.23
.58
.48
.52
.45
.48
(cont'd)
29
38
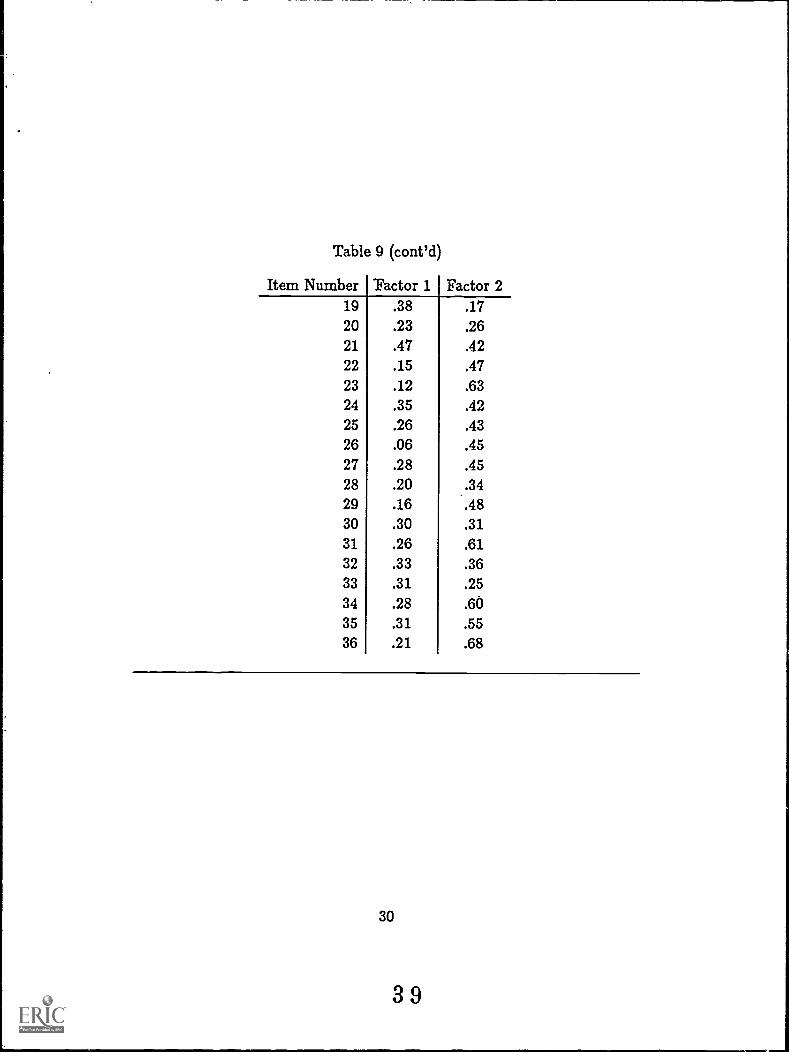
Table 9 (cont'd)
Item Number192021
2223
2425
26272829303132
33
343536
Factor 1.38.23. 47.15.12.35.26.06.28.20. 16
.30
.26
.33
.31
.28
.31
.21
Factor 2.17.26.42.47.63.42. 43.45.45.34.48.31.61. 36.25.60.55. 68
30
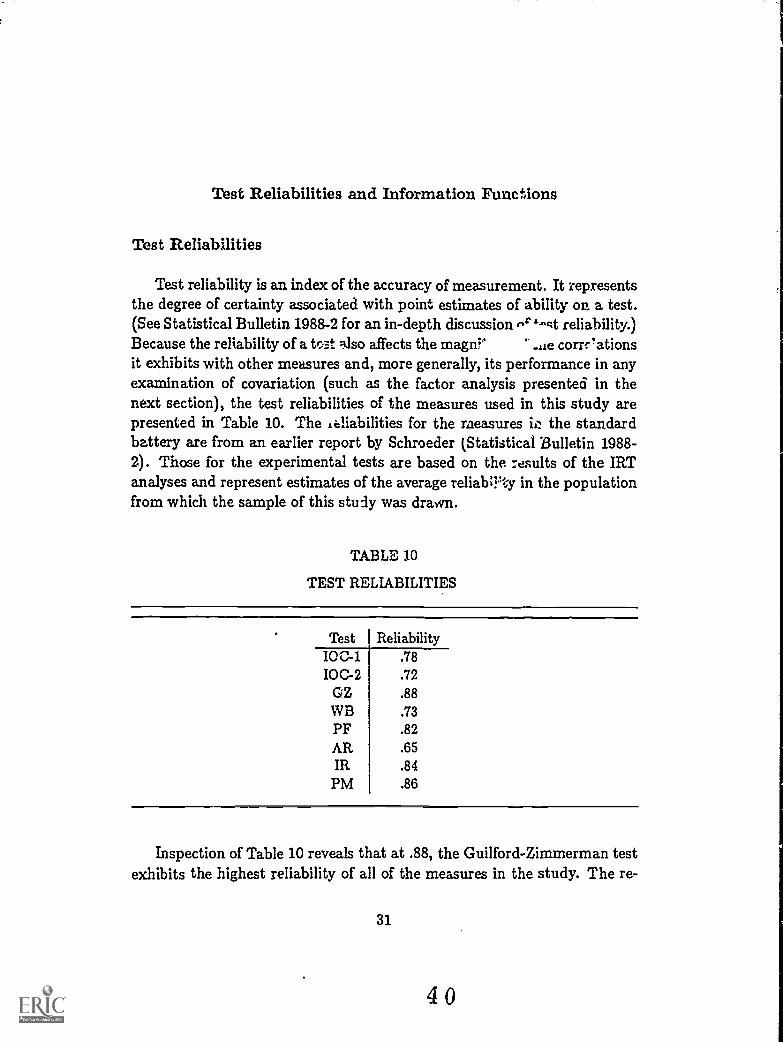
Test Re liabilities and Information Functions
Test Re liabilities
Test reliability is an index of the accuracy of measurement. It representsthe degree of certainty associated with point estimates of ability on a test.(See Statistical Bulletin 1988-2 for an in-depth discussion n"-at reliability.)Because the reliability of a tc-E.-t also affects the mage correiationsit exhibits with other measures and, more generally, its performance in anyexamination of covariation (such as the factor analysis presented in thenext section), the test reliabilities of the measures used in this study arepresented in Table 10. The ,liabilities for the measures the standardbattery are from an earlier report by Schroeder (Statistical Bulletin 1988-2). Those for the experimental tests are based on the results of the IRTanalyses and represent estimates of the average reliab;l'ty in the populationfrom which the sample of this study was drawn.
TABLE 10
TEST RELIABILITIES
Test Reliability10C-1 .78
IOC-2 .72GZ .88
WB .73
PF .82
AR .65IR .84
PM .86
Inspection of Table 10 reveals that at .88, the Guilford-Zimmerman testexhibits the highest reliability of all of the measures in the study. The re-
31
40
liabilities of Raven's Advanced Progressive Matrices, Inductive Reasoning,and Paper Folding closely follow in magnitude and all exceed .80. Thoseassociated with Wiggly Block, IOC-1, and IOC -2 all exceed .70 and fallin the middle of the range, while Analytical Reasoning exhibits the lowestreliability of all of the measures in this -study.
Overall, the experimental tests provide relatively accurate estimates ofability. With the exception of the IOC measures, their reliabilities exceedthose of the tests from the standard JOCRF battery. Even the reliabilitiesof the IOC measures are relatively high considering the test measures twodistinct abilities with a total of 44 items, each with only two response al-ternatives (yes and no), and there is evidence of guessing in the responsepatterns. Nonetheless, the reliability of the IOC scores could be improvedby lengthening the test. Additional items are available for these purposes.In fact, because of limitations on the amount of time allocated for the ad-ministration of experimental tests, the version used in this study was ashortened form of the test.
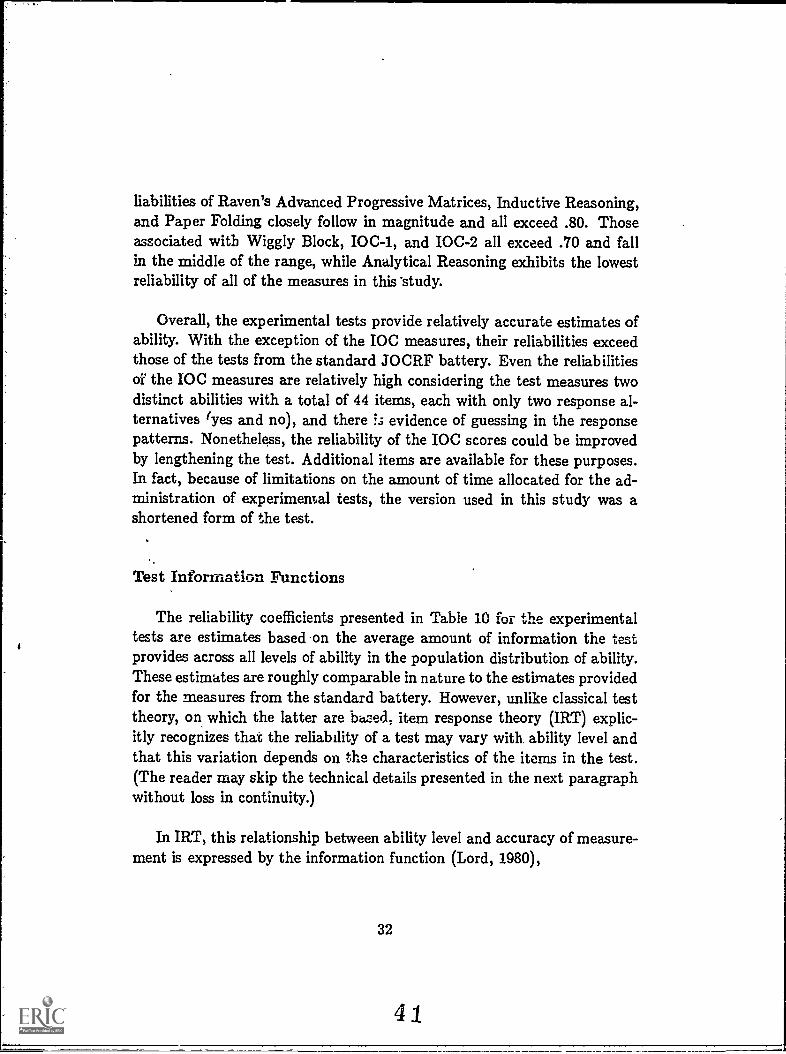
Test Information Functions
The reliability coefficients presented in Table 10 for the experimentaltests are estimates based on the average amount of information the testprovides across all levels of ability in the population distribution of ability.These estimates are roughly comparable in nature to the estimates providedfor the measures from the standard battery. However, unlike classical testtheory, on which the latter are bazied, item response theory (IRT) explic-itly recognizes that the reliability of a test may vary with. ability level andthat this variation depends on the characteristics of the items in the test.(The reader may skip the technical details presented in the next paragraphwithout loss in continuity.)
In IRT, this relationship between ability level and accuracy of measure-ment is expressed by the information function (Lord, 1980),
32
41
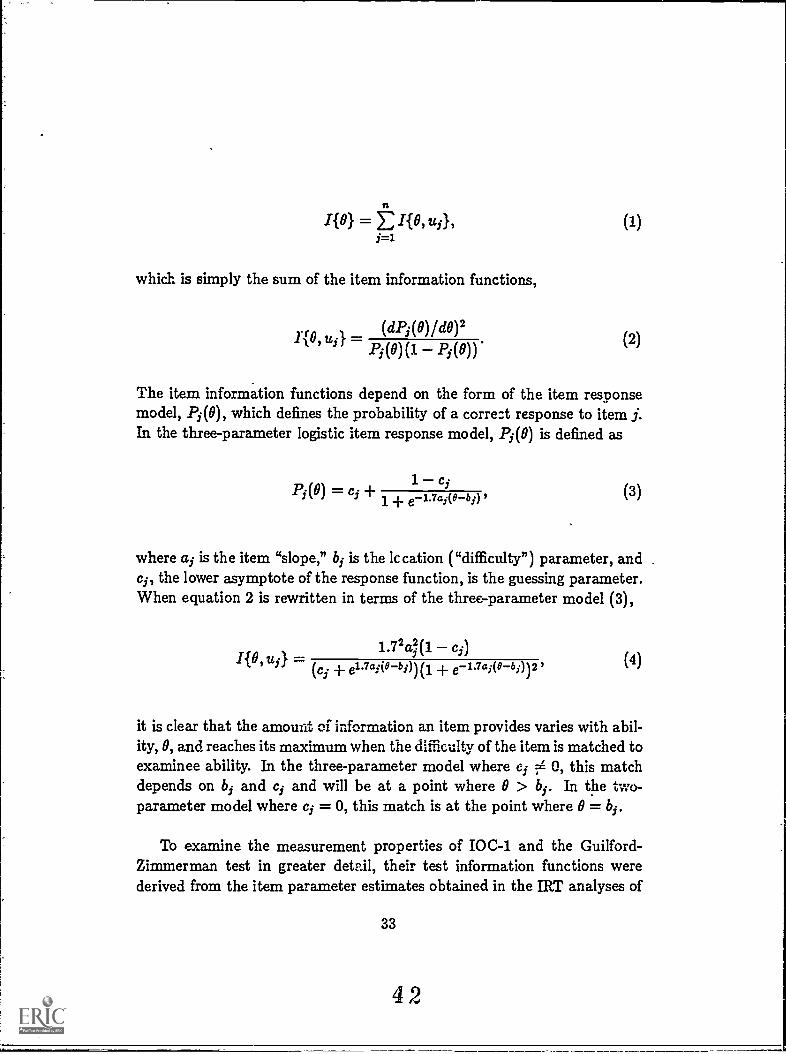
I{O} = rtI{0,t0, (1)i=i
which is simply the sum of the item information functions,
(d.1);(0)1d0)2
11°2 Uil Pi(8)(1 Pin (2)
The item information functions depend on the form of the item responsemodel, Pi (8), which defines the probability of a corre :t response to item 5.In the three-parameter logistic item response model, Pi(0) is defined as
1- CjPi 8 == Cl + 1+ e-1.7a5(8-bi) (3)
where ai is the item "slope," bi is the lc cation ("difficulty") parameter, and .
ci, the lower asymptote of the response function, is the guessing parameter.When equation 2 is rewritten in terms of the three-parameter model (3),
/{0 u } . 1.72q(1 ci),,
(c . + eilai(0bi)) (1 + eilai(obi))23
(4)
it is clear that the amount of information an item provides varies with abil-ity, 0, and reaches its maximum when the difficulty of the item is matched toexaminee ability. In the three-parameter model where ci 4 0, this matchdepends on bi and ci and will be at a point where 0 > bp In the two-parameter model where ci = 0, this match is at the point where 0 = bp
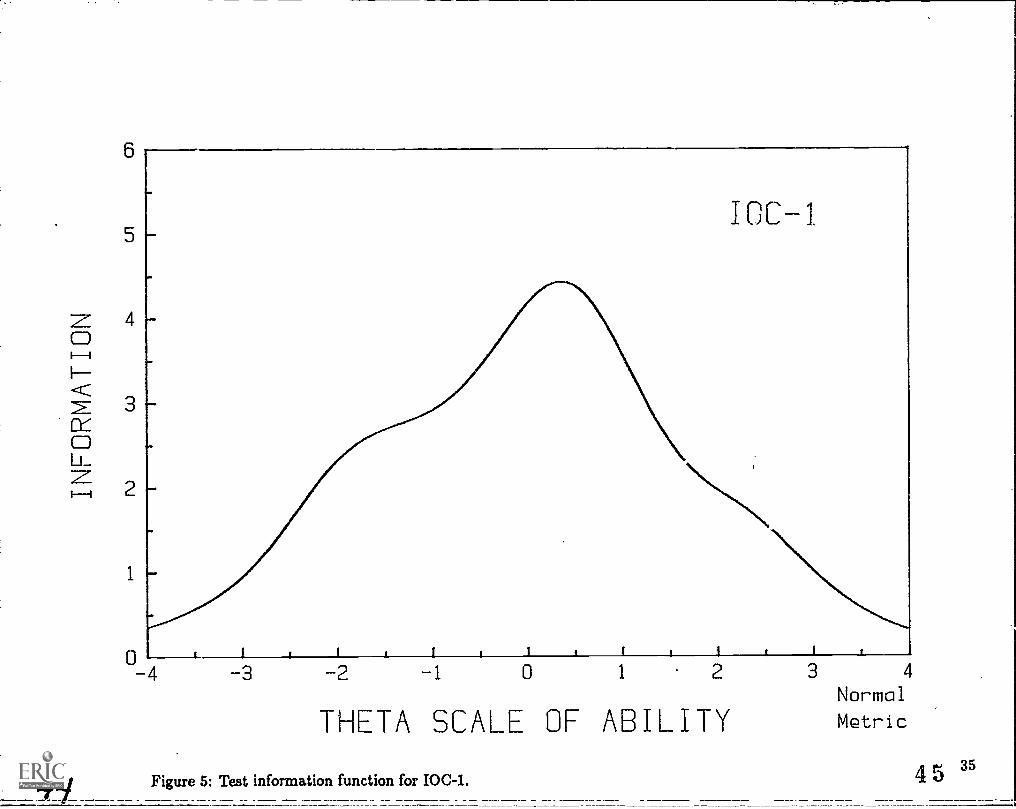
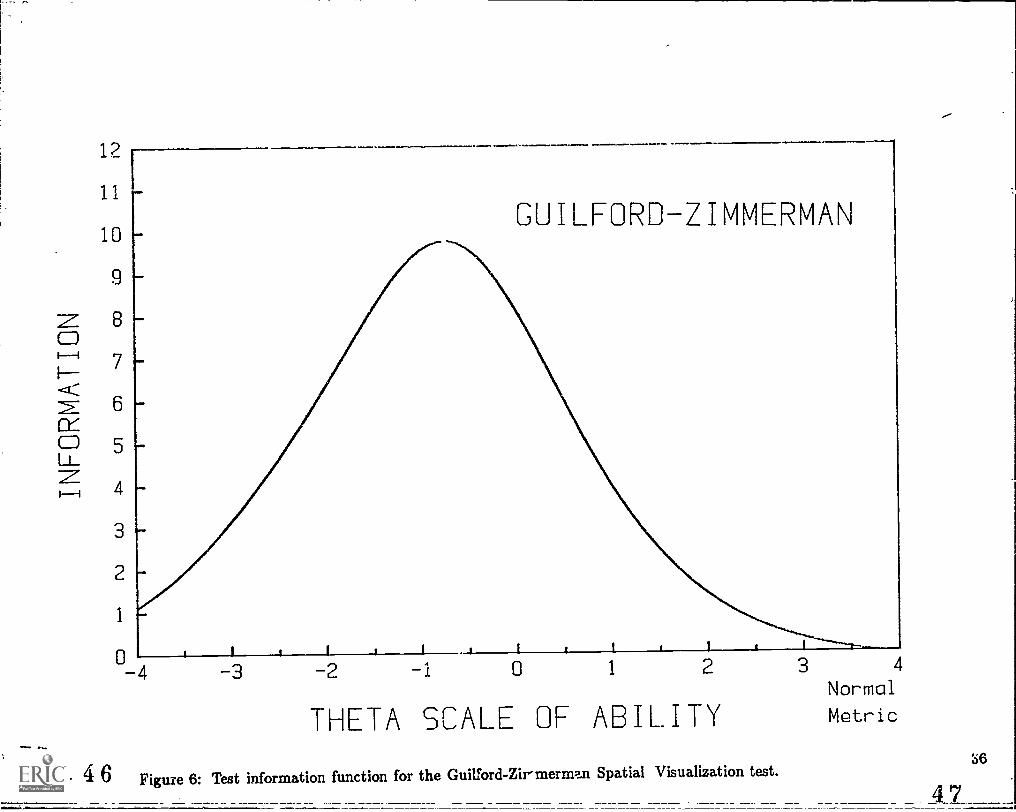
To examine the measurement properties of IOC -1 and the Guilford-Zimmerman test in greater detail, their test information functions werederived from the item parameter estimates obtained in the IRT analyses of
33
42

the tests. The results are found in Figures 5 and 6. The curves in thesefigures were drawn with ICC Plot (Wothke, 1988) on a Hewlett Packardplotter. They show the relationship between information (which is thereciprocal of the squared error of measurement) and ability level. At anylevel i of ability 0 shown in these curves, the information, I,, provided bythe test can be converted to a reliability coefficent, p, with the formula
(5)
For the examples presented here, al is 1.00 because the theta scale of latentability is represented in the (0,1) metric. Equation 5 is the familiar ravio oftrue-score variance to total-score variance described in Statistical Bulletin1988-2 by Schroeder and may be rewritten as
ry2Pi =
e
'a(6)
where al is the variance of the estimates of 0. Equation 5 also shows thatas 00, pi 1.
Inspection of Figure 5 reveals that the test information curve for IOC-1reaches its maximum neAr .50 on the theta scale of ability. It also showsthat the test provides the most information (has the highest reliability) inthe middle range of ability and performs less well at the extremes of theability continuum. This pattern is typical of most tests. This is becauseeasy and diffic tit items bot h. provide information about ability in the middlerange, but the former provide very little information in the upper range,the latter very little in the lower range. The result is a bell-shaped curvelike the one shown in Figure 6. or a curve that is roughly bell-shaped likethe one shown in Figure 5. That the curve in Figure 5 reaches it maximumnear 0.00, the population mean of ability, shows that the overall difficulty
34
43
IDC-I
,
-3 -2 -1 0 1 2 3 4
Normal
THETA SCALE OF ABILITY Metric
Figure 5: Test information function for IOC-1. 4 5 35
12
11
10
9
8
7
6
5
4
3
2
1
GUILFORD-ZIMMERMAN
THETA SCALE OF ABILITY
4 6 Figure 6: Test information function for the Guilford- Zimmerman Spatial Visualization test.
4
Normal
Metric
47
level of IOC-1 is well-matched to the ability level of the Foundation's clients.Nonetheless, accuracy of measurement at the extremes of the ability rangecould be improved by adding more easy and difficult items to the test.
In contrast with these results for the IOC -1, the test information curvefor the Guilford Zimmerman test (see Figure 6) reaches its maximum atabout -1.00 on the theta scale of ability, a point that is well below (onestandard deviation unit below) the mean of ability in the population. Thisresult indicates that the test, in its present form, is too easy for the Foun-dation's clients and would benefit fr im the addition of more difficult items.This fact is further illustrated by the relatively small amount of informationthe test provides throughout the upper range of ability. These results arein accord with the ceiling effect found on the test.
Correlational and Factor Analyses of the Test Scores
A maximum likelihood factor analysis was performed on the test scoresfrom the three experimental measures and selected tests from the Founda-tion's battery to examine the factorial composition of the Wiggly Block andPaper Folding test scores. Along with these measures of structural visual-ization, two measures of reasoning ability, Analytical Reasoning (AR) andInductive Reasoning (IR), were included in the analysis. This particularsubset of tests was selected for the factor analysis because it provides thetype of balance between spatial and reasoning tests required to properlyinvestigate the presence of nonspatial components in spatial tests. TheAnalytical Reasoning test was especially selected because the correlationof this test with the Wiggly Block and Paper Folding tests is a source ofconcern at the Foundation (Statistical Bulletin 1985-6).
EAP estimates of ability derived in the TRT analyses served as the testscores for the IOC, GZ, and PM in the factor analysis. The scores usedby the Foundation in their evaluation of aptitude profiles served as themeasures for the tests from their battery. The correlations among thesemeasures were also computed.
37
48
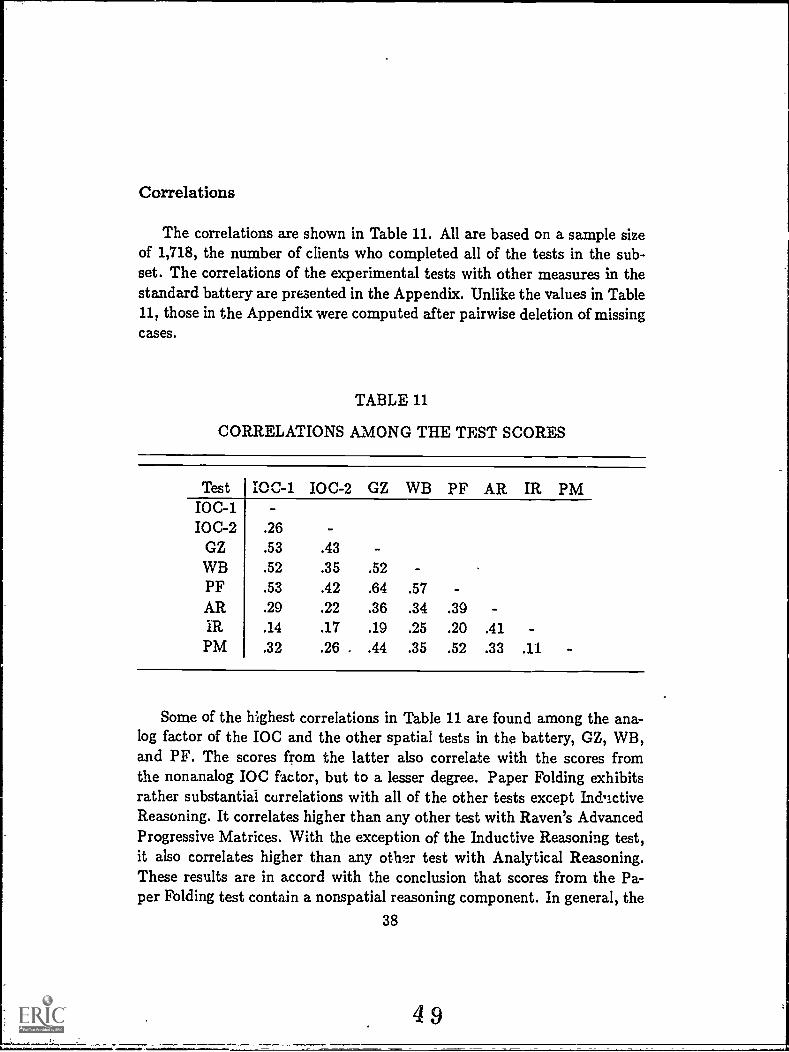
Correlations
The correlations are shown in Table 11. All are based on a sample sizeof 1,718, the number of clients who completed all of the tests in the sub-set. The correlations of the experimental tests with other measures in thestandard battery are presented in the Appendix. Unlike the values in Table11, those in the Appendix were computed after pairwise deletion of missingcases.
TABLE 11
CORRELATIONS AMONG THE TEST SCORES
Test IOC-1 IOC -2 GZ WB PF AR IR PMIOC -1IOC -2 .26
GZ .53 .43WB .52 .35 .52 -PF .53 .42 .64 .57 -AR .29 .22 .36 .34 .39 -IR .14 .17 .19 .25 .20 .41PM .32 .26 . .44 .35 .52 .33 .11
Some of the highest correlations in Table 11 are found among the ana-log factor of the IOC and the other spatial tests in the battery, GZ, WB,and PF. The scores from the latter also correlate with the scores fromthe nonanalog IOC factor, but to a lesser degree. Paper Folding exhibitsrather substantial correlations with all of the other tests except InductiveReasoning. It correlates higher than any other test with Raven's AdvancedProgressive Matrices. With the exception of the Inductive Reasoning test,it also correlates higher than any other test with Analytical Reasoning.These results are in accord with the conclusion that scores from the Pa-per Folding test contain a nonspatial reasoning component. In general, the
38
49

size of the correlations among Wiggly Block, Paper Folding, and AnalyticalReasoning is in accord with earlier results (Technical Report 1983-2). Therelatively poor reliability of Analytical Reasoning (see Table 10) probablyaccounts, in part, for the comparatively low correlations it exhibits withthe other measures in the battery.
Factor Analysis
The results from the factor analysis are shown in Tables 12 an 1 13. Afour-factor model provides a reasonable fit to the data (G2 = 3.56, df =2,p = .17, design effect = 2.5). The varimax- rotated factor loadings fromthe four-factor model are presented in Table 12. (The promax loadingsexhibit a similar pattern.) The first factor is primarily de, 3d by the ana-log factor of the IOC and the three other spatial tests. That this factorrepresents analog spatial ability is further supported by the small, almostnegligible, contribution cf the reasoning measures (AR, IR, and PM) to itsdefinition. In contrast with these results, the second factor is defined byboth reasoning and spatial tests. Raven's Advanced Progressive Matricesexhibits the lard -.,,` )cading on the factor, followed by Paper Folding. TheGuilford-Zimmerman and the Analytical Reasoning tests also tend to loadon the second factor, but to a lesser degree. That it represents a generalreasoning ability is supported by the almost exclusive loading of PM on thefactor; PM was designed to measure Spearman's g in a culture-free man-ner. The loatiig of the spatial tests nn this factor is in accord with theconclusion that the reasoning ability it represents is used to solve spatialproblems. The third factor, on the other hand, appears to represent a rea-soning ability that is independent of the nonspatial strategies used to solvespatial items. It is largely defined by the inductive Reasoning test from theFoundation's battery. Analytical Reasoning also loads c" the factor,but to a lesser degree. The fourth and final factor ;1-..c1u,'Is the nonanalogfactor of the IOC, and the Guilford-Ziramere,..r. ar taper Folding tests.Wiggly Block also defines this factor, but ' ;xtent. The fourthfactor appears to represent a relatively _ . 3111V to extract relevantdistinctive features in spatial test items
39
50
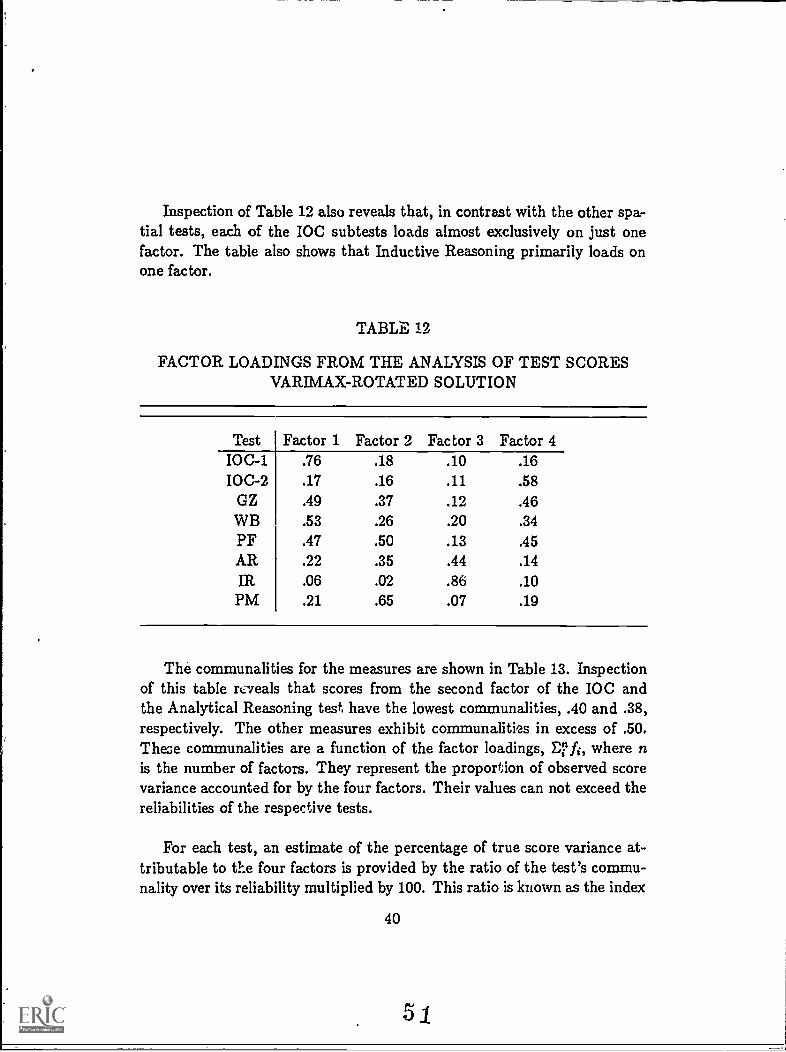
Inspection of Table 12 also reveals that, in contrast with the other spa-tial tests, each of the IOC subtests loads almost exclusively on just onefactor. The table also shows that Inductive Reasoning primarily loads onone factor.
TABLE 12
FACTOR LOADINGS FROM THE ANALYSIS OF TEST SCORESVARIMAX- ROTATED SOLUTION
Test Factor 1 Factor 2 Factor 3 Factor 4IOC-1 .76 .18 .10 .16IOC -2 .17 .16 .11 .58
GZ .49 .37 .12 .46WB .53 .26 .20 .34PF .47 .50 .13 .45AR .22 .35 .44 .14IR .06 .02 .86 .10PM .21 .65 .07 .19
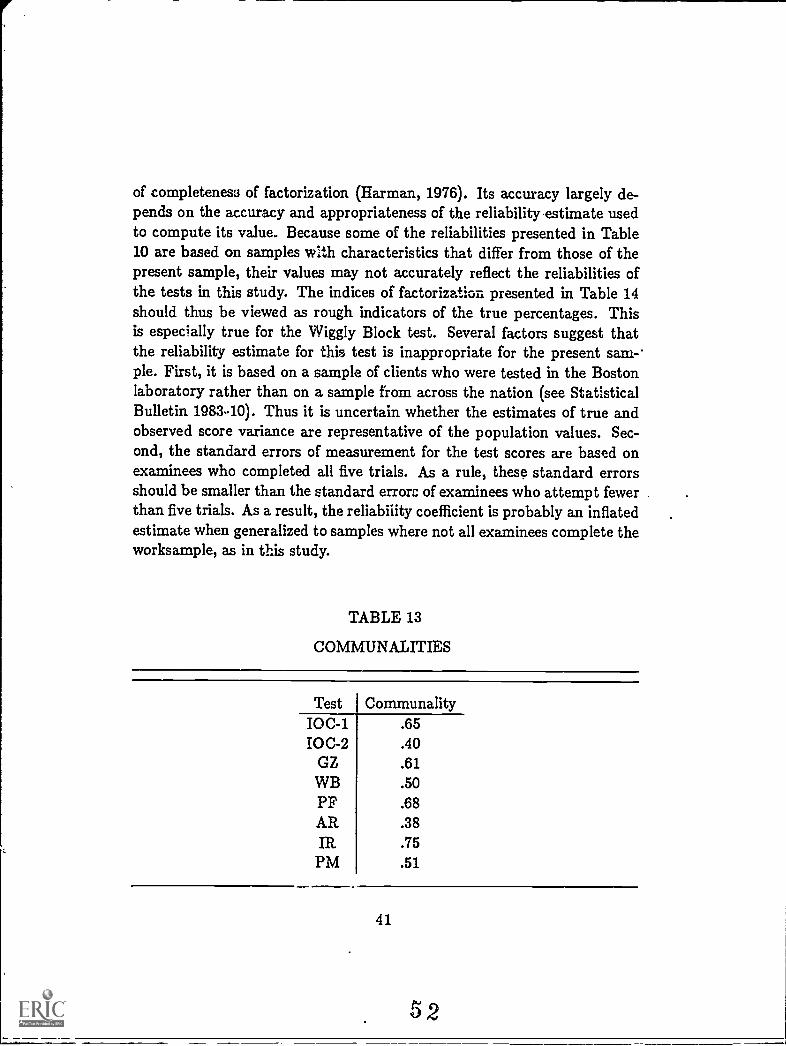
The communalities for the measures are shown in Table 13. Inspectionof this table reveals that scores from the second factor of the IOC andthe Analytical Reasoning test have the lowest communalities, .40 and .38,respectively. The other measures exhibit communalities in excess of .50.These communalities are a function of the factor loadings, E7fi, where nis the number of factors. They represent the proportion of observed scorevariance accounted for by the four factors. Their values can not exceed thereliabilities of the respective tests.
For each test, an estimate of the percentage of true score variance at-tributable to the four factors is provided by the ratio of the test's commu-nality over its reliability multiplied by 100. This ratio is known as the index
40
5j
of completeness of factorization (Harman, 1976). Its accuracy largely de-pends on the accuracy and appropriateness of the reliability estimate usedto compute its value. Because some of the reliabilities presented in Table10 are based on samples with characteristics that differ from those of thepresent sample, their values may not accurately reflect the reliabilities ofthe tests in this study. The indices of factorization presented in Table 14should thus be viewed as rough indicators of the true percentages. Thisis especially true for the Wiggly Block test. Several factors suggest thatthe reliability estimate for this test is inappropriate for the present sam -'ple. First, it is based on a sample of clients who were tested in the Bostonlaboratory rather than on a sample from across the nation (see StatisticalBulletin 198340). Thus it is uncertain whether the estimates of true andobserved score variance are representative of the population values. Sec-ond, the standard errors of measurement for the test scores are based onexaminees who completed all five trials. As a rule, these standard errorsshould be smaller than the standard errorc of examinees who attempt fewer .
than five trials. As a result, the reliability coefficient is probably an inflatedestimate when generalized to samples where not all examinees complete theworksample, as in this study.
TABLE 13
COMMUNALITIES
TestIOC -1IOC -2
GZWBPPARIRPM
Communality.65.40.61.50.68.38.75.51
41
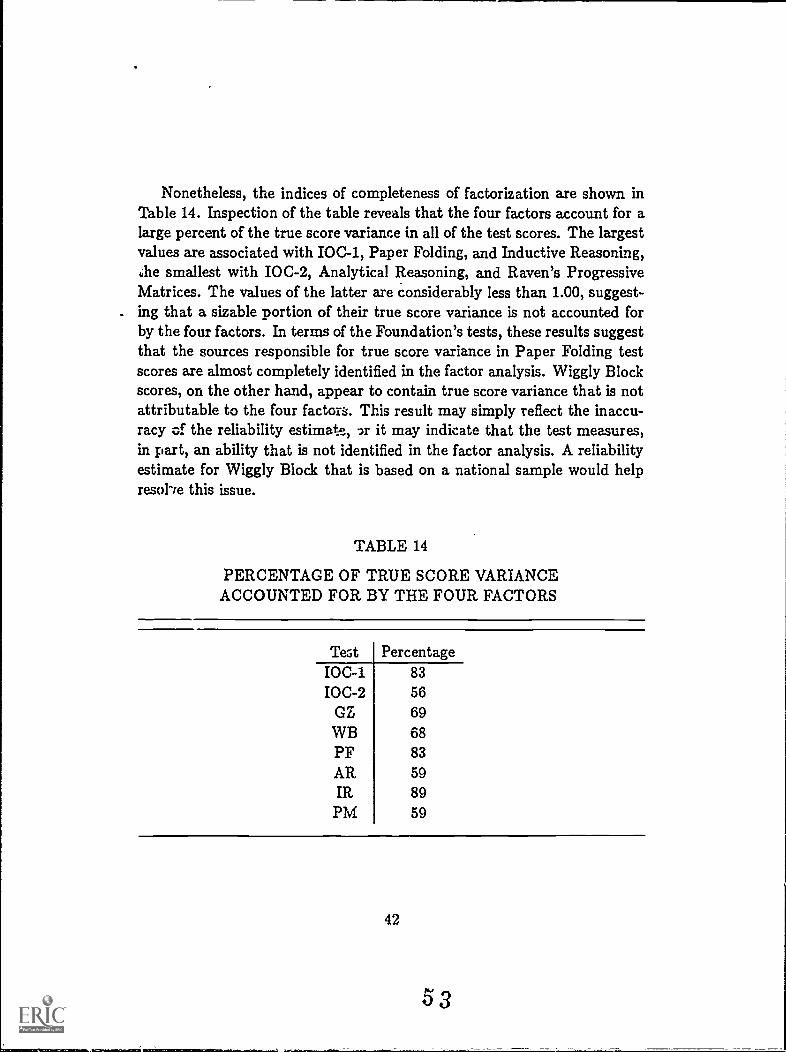
Nonetheless, the indices of completeness of factorization are shown inTable 14. Inspection of the table reveals that the four factors account for alarge percent of the true score variance in all of the test scores. The largestvalues are associated with IOC-1, Paper Folding, and Inductive Reasoning,4,he smallest with IOC -2, Analytical Reasoning, and Raven's ProgressiveMatrices. The values of the latter are considerably less than 1.00, suggest-ing that a sizable portion of their true score variance is not accounted forby the four factors. In terms of the Foundation's tests, these results suggestthat the sources responsible for true score variance in Paper Folding testscores are almost completely identified in the factor analysis. Wiggly Blockscores, on the other hand, appear to contain true score variance that is notattributable to the four factors. This result may simply reflect the inaccu-racy of the reliability estimate, -3r it may indicate that the test measures,in part, an ability that is not identified in the factor analysis. A reliabilityestimate for Wiggly Block that is based on a national sample would helpresol-re this issue.
TABLE 14
PERCENTAGE OF TRUE SCORE VARIANCEACCOUNTED FOR BY THE FOUR FACTORS
TestIOC-1IOC -2
GZWBPFAR,
IRPM
Percentage83
56696883
598959
42
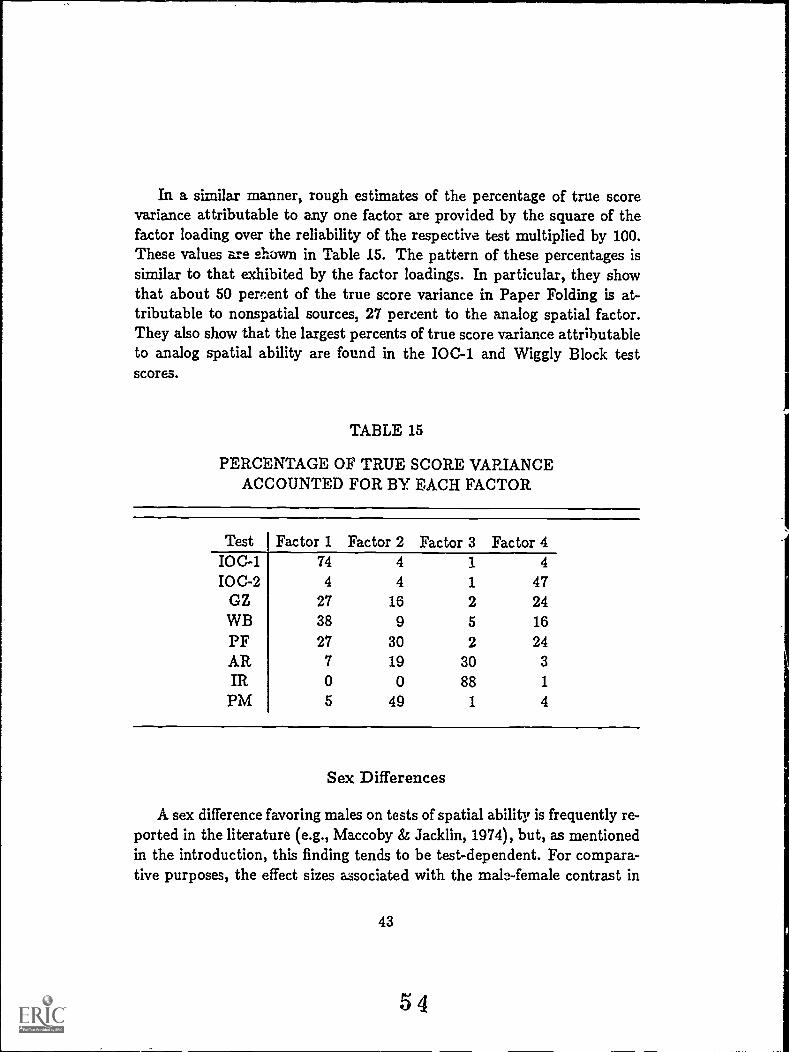
In a similar manner, rough estimates of the percentage of true scorevariance attributable to any one factor are provided by the square of thefactor loading over the reliability of the respective test multiplied by 100.These values are shown in Table 15. The pattern of these percentages issimilar to that exhibited by the factor loadings. In particular, they showthat about 50 percent of the true score variance in Paper Folding is at-tributable to nonspatial sources, 27 percent to the analog spatial factor.They also show that the largest percents of true score variance attributableto analog spatial ability are found in the IOC-1 and Wiggly Block testscores.
TABLE 15
PERCENTAGE OF TRUE SCORE VARIANCEACCOUNTED FOR BY EACH FACTOR
Test Factor 1 Factor 2 Factor 3 Factor 4IOC-1 74 4 1 4IOC -2 4 4 1 47
GZ 27 16 2 24WB 38 9 5 16PF 27 30 2 24AR 7 19 30 3
IR 0 0 88 1
PM 5 49 1 4
Sex Differences
A sex difference favoring males on tests of spatial ability is frequently re-ported in the literature (e.g., Maccoby & Jack lin, 1974), but, as mentionedin the introduction, this finding tends to be test-dependent. For compara-tive purposes, the effect sizes associated with the male-female contrast in
43
54
performance were computed for all of the tests in the selected subset withthe formula:
(Atm Atf)/eft (7)
where Atm is the estimate of the mean for males, m, on test t, Ay, the esti-mate for females, f, and Qt, the estimate of the pooled within-sex standarddeviation for test t. These effect sizes thus represent the magnitude of thesex differences in standard deviation units. They are shown in Table 16 inorder of size.
TABLE i6
EFFECT SIZES FOR THE MALE-FEMALE CONTRAST
TestEffect
SizeGZ .65
IOC-1 .48WB .44
IOC -2 .43PF .31PM .04AR -.05IR -.23
Of the spatial tests, the Guilford-Zimmerman exhibits the largest dif-ference favoring males, while Paper Folding shows the smallest difference.The effect sizes for the Incomplete Open Cubes test (Factors 1 and 2) andWiggly Block are similar in magnitude. Two of the tests in the subset,Analytical Reasoning and Inductive Reasoning, exhibit a small difference
44
55
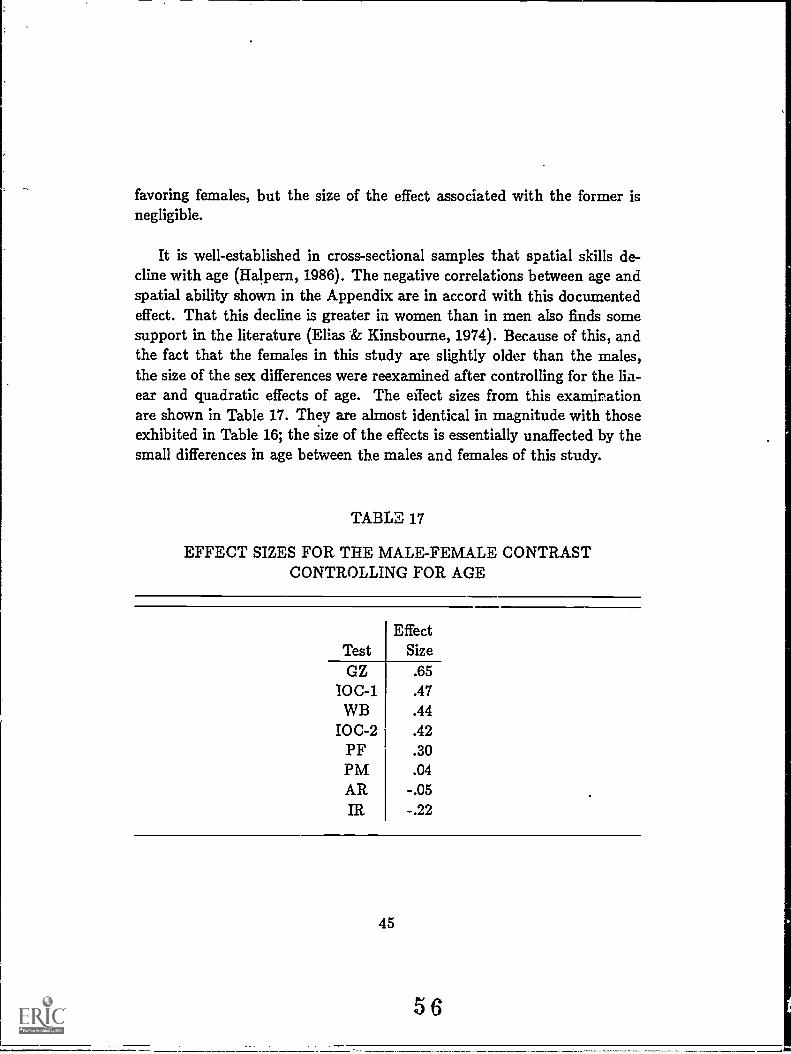
favoring females, but the size of the effect associated with the former isnegligible.
It is well-established in cross-sectional samples that spatial skills de-cline with age (Halpern, 1986). The negative correlations between age andspatial ability shown in the Appendix are in accord with this documentedeffect. That this decline is greater in women than in men also finds somesupport in the literature (Elias & Kinsbourne, 1974). Because of this, andthe fact that the females in this study are slightly older than the males,the size of the sex differences were reexamined after controlling for the lin-ear and quadratic effects of age. The effect sizes from this examinationare shown in Table 17. They are almost identical in magnitude with thoseexhibited in Table 16; the size of the effects is essentially unaffected by thesmall differences in age between the males and females of this study.
TABLE 17
EFFECT SIZES FOR THE MALE-FEMALE CONTRASTCONTROLLING FOR AGE
TestEffect
SizeGZ .65
IOC-1 .47WB .44
IOC -2 .42PF .30PM .04AR -.05IR -.22
45

Distributional Analyses
Bimodality is often but not always observed in the within-sex score dis-tributions of spatial measures (e.g., Bock & Kolakowski, 1973; Zimowski,1985). In earlier work, Zimowski (1985) reconciled some of the inconsisten-cies in the literature by demonstrating that resolvability was related to theitem features of spatial tests. She found that the score distributions frommeasures with item ati ibutes that appear to require analog processing, theanalog factor of the IOC ar..1 the Vandenberg-Shepard Mental Rotationstest, exhibit bimodality in a consistent manner, while those from measureswith item features that promote nonanalog processing, the Space RelationsSubtest of the Differential Aptitude test and the nonanalog factor of theIOC, tend to be normally distributed. Her results suggest that the analogcomponent of spatial tests is responsible for the bimodality that is com-monly observed in spatial score distributions.
Her study also shows that when bimodality is observed, the proportionsfound are typically in accord with the theory of X-linkage first proposed byJohnson O'Connor (1943) to explain the male advantage on spatial tests.This theory predicts (with the assumptions of random mating and a genefrequency of .5) that one-half of the males but only one-fourth of the fe-males will possess the trait (see Mc Clearn & De Fries, 1973, for a discussionof X-linkage).
For comparative purposes, the within-sex score distributions obtainedin this study wera examined for bimodality with the maximum likelihoodprocedure of Day (1969). The procedure provides estimates of the commonstandard deviation (4 the means of the components and pro-portion of the sample in each component (f)i). The difference between thechi-squares from the one- and two-component models is distributed as achi-square variable in large samples on two degress of freedom, the numberof additional parameters estimated in the two-component model. The testdetermines the improvement in fit provided by these additional parameters.
Only the factor scores from the Incomplete Open Cubes were exam-ined with this method. This is because examinations of bimodality are
46
517
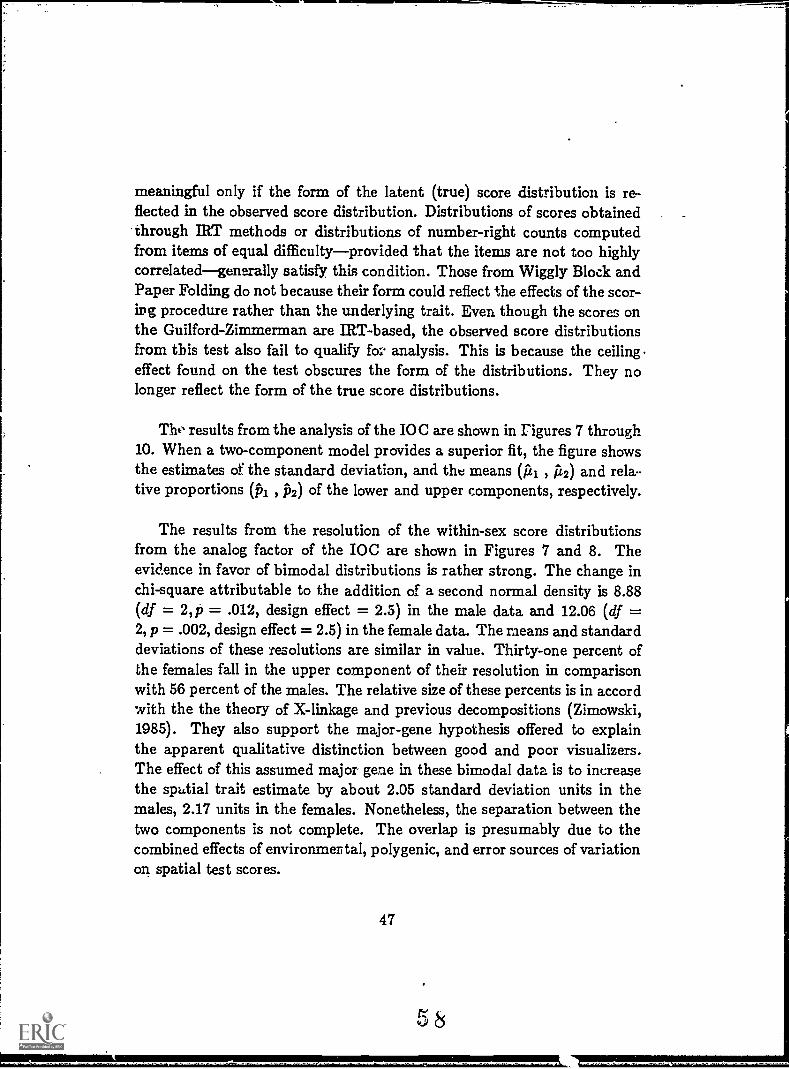
meaningful only if the form of the latent (true) score distribution is re-flected in the observed score distribution. Distributions of scores obtainedthrough IRT methods or distributions of number-right counts computedfrom items of equal difficultyprovided that the items are not too highlycorrelatedgenerally satisfy, this condition. Those from Wiggly Block andPaper Folding do not because their form could reflect the effects of thescor-ing procedure rather than the underlying trait. Even though the scores onthe Guilford-Zimmerman are IRT-based, the observed score distributionsfrom this test also fail to qualify fol. analysis. This is because the ceilingeffect found on the test obscures the form of the distributions. They nolonger reflect the form of the true score distributions.
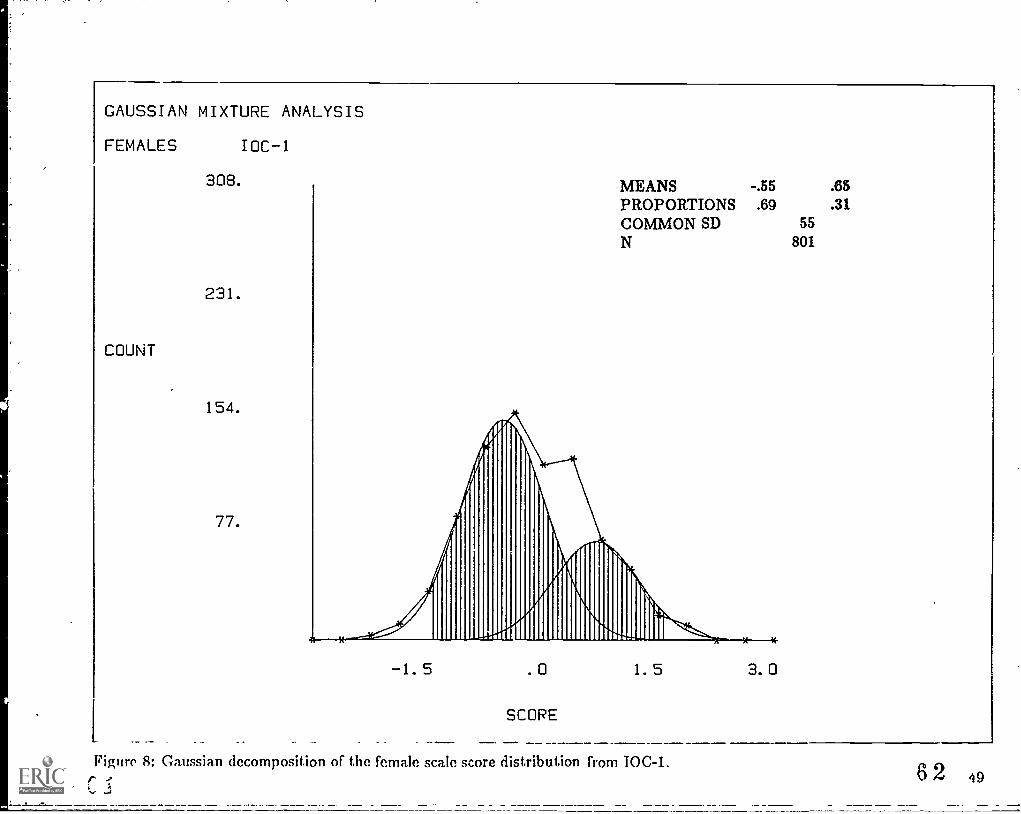
The" results from the analysis of the IOC are shown in Figures 7 through10. When a two-component model provides a superior fit, the figure showsthe estimates or the standard deviation, and the means Vir A2) and rela-tive proportions (P1 , f)2) of the lower and upper components, respectively.
The results from the resolution of the within-sex score distributionsfrom the analog factor of the IOC are shown in Figures 7 and 8. Theevidence in favor of bimodal distributions is rather strong. The change inchi-square attributable to the addition of a second normal density is 8.88(df = 2,p = .012, design effect = 2.5) in the male data and 12.06 (df =2, p = .002, design effect = 2.5) in the female data. The means and standarddeviations of these resolutions are similar in value. Thirty-one percent ofthe females fall in the upper component of their resolution in comparisonwith 56 percent of the males. The relative size of these percents is in accordwith the the theory of X-linkage and previous decompositions (Zimowski,1985). They also support the major-gene hypothesis offered to explainthe apparent qualitative distinction between good and poor visualizers.The effect of this assumed major gene in these bimodal data is to increasethe spatial trait estimate by about 2.05 standard deviation units in themales, 2.17 units in the females. Nonetheless, the separation between thetwo components is not complete. The overlap is presumably due to thecombined effects of environmental, polygenic, and error sources of variationon spatial test scores.
47

GAUSSIAN MIXTURE ANALYSIS
MALES I 0C-1
384.
COUNT
288.
192.
96.
MEANS -.42 .74PROPORTIONS .44 .56COMMON SD .56N 917
1. 5 .0
SCORE
1. 5 3. 0
r_Yigure 7: Gaussian decomposition of the male scale score distribution from IOC-1.,ITI, V
6 0 48
GAUSSIAN MIXTURE ANALYSIS
FEMALES IOC-1
308.
COUNT
231.
154.
77.
MEANS -.55 .65PROPORTIONS .69 .31COMMON SD 55N 801
1. 5 .0
SCORE
Figure 8: Gaussian decomposition of the female scale score distribution from IOC -1.
1.5 3. 0
6 2 49
GAUSSIAN MIXTURE ANALYSIS
MALES IOC -2
454.
COUNT
341.
227.
114.
MEANS. -.72 .44
PROPORTIONS .23 .77COMMON SD .65N 917
1. 5 .0
SCORE
1. 5
6 3 Figure 9: Gaussian decomposition of the male scale score distribution from IOC -2.
3. 0
65'
GAUSSIAN MIXTURE ANALYSIS
FEMALES IOC -2
430.
COUNT
323.
215.
108. /
MEAN -.19SD .81N 801
x
1.5 .0 1.5 3.0
SCORE
'fire 10: Gaussian decomposition of the female scale score distribution from IOC -2.6 651
The results from the analysis of the within-sex score distributions fromtile second factor of the IOC are shown in Figures 9 and 10. The im-provement in fit provided by the addition of a second component is clearlysignificant (x2 = 7.78, df = 2,p = .021, design effect = 2.5) in the maledata. The change in chi-square for the female data, on the other hand,is almost negligible (x2 = .18, df = 2,p = .914, design effect = 2.5). Thelatter is in accord with a previous decomposition of the nonanalog IOCfactor (Zimowski, 1985) and is similar to the results commonly obtainedfor verbal and general reasoning measures. The resolution of the male data,on the other hand, is not in accord with earlier endings (Zimowski, 1985),nor with resolutions typically obtained for analog spatial measures. In con-trast with the equally sized proportions of the latter, about three-fourthsof the males fall in the upper component, one-fourth in the lower compo-nent. These results are quite unusual. With the exception of analog spatialability, most cognitive abilities tend to be normally distributed in randomsamples drawn from a population. That this sample is nonrandom andfrom a self-selected population of higher socioeconomic and educationallevels than the general population may account for the nonnormal distri-bution of nonanalog scores found in this study, Socioeconomic factors havebeen shown to influence verbal ability scores in behavior genetic studies ofcognitive abilities (McGee, 1977; Vandenberg, 1971). That the analog scoredistributions from this self -- elected sample nonetheless exhibit bimodalitythat is in accord with earlier results is explained by the fact that analogspatial ability is less influenced by socioeconomic factors than verbal ability(McGee, 1977; Vandenberg, 1971).
Discussion
The item factor decomposition of the Incomplete Open Cubes obtainedin this study is in accord with the earlier findings of Zimowski (1985)and supports the distinction between item features and solution strategiesfirst proposed by Zimowski (1985) and later developed by Zimowski andWothke (Technical Report 1986-1). With few exceptions, items with fea-tures thought to resist nonanalog processing load on the first factor, while
52
items with features thought to promote nonanalog processing load. almostexclusively, on the second factor.
These two factors are only slightly distinguished by the tendency oftheir factor scores to exhibit a sex difference favoring males. While theeffect size observed for the analog factor of the IOC is .4:3, that for thenonanalog factor is .43. This result does not agree with the earlier workof Zimowski (1985), who found a large difference in these effect sizes. Thisfailure to replicate is probably due to the effects of the nonrandom sample..TESTFACT provides varLiax-rotated factors that are uncorrelated in thepopulation, but in this nonrando' _ sample the separation of the two factorsis not complete. The scores from these factors correlate .26.
The pattern of effect sizes found for the other spatial tests in the studyis, however, consistent with their classification as relatively pure (analog)or relatively impure (nonanalog) measures of spatial ability. The Guilford-Zimmerman test, which is assumed to be a relatively pure measure of spatialability, shows the largest sex effect of all the measures in the study. TheWiggly Block test exhibits a sex difference, but to a lesser degree. ThePaper Folding test, the least pure measure in the study, also displays thesmallest sex difference. These results are in accord with the observation ofZimowski (1985) that the analog component of spatial tests is responsiblefor the sex difference favoring males.
That this analog component is also re.ponsible for the bimodality com-monly observed in spatial score distributions is supported by the resultsfrom the distributional analyses. Only the within-sex score distributionsfrom the analog factor of the IOC exhibit bimodality in a consistent man-ner. The size of the components from these resolutions is in accord withthe theory of X-linkage and previous decompositions (Zimowski, 1985).
The results from the factor analysis of the test scores are less clear.While the two sj, ,al tests thought to have nonanalog components, theWiggly Block and Paper Folding tests, load on the factors largely defined
53
68
by the PM test and IOC -2, the Guilford-Zimmerman, which is classified as arelatively pure measure of spatial ability, also tends to load on.these factors.
A possible explanation for the performance of the Guilford-Zimmermanlies in the ceiling effect observed on this test (see Figure 4) . It indicatesthat the test was too easy for our Self-selected sample. It is possible thatthe standard time limit imposed on each item of the GZ was too generousfor this group of verbally proficient individuals and allowed the successfulapplication of nonanalog strategies. This interpretation explains the ceil-ing effect and the pattern of factor loadings, but it fails to account for thesubstantial sex effect found for this measure.
Another interpretation that is consistent with the analog classificationof the Guilford-Zimmerman is that the ceiling effect obscured the factorpattern that would have otherwise been observed. The ceiling effect proba-bly attentuated the sex difference as well, but apparently the effect was notlarge enough to produce a substantial reduction in the size of the P.Terence.
In all, the emergence of two nonanalog factors in the factor analysissuggests that at least two relatively distinct types of nonanalog strategic)or abilities are used to solve spatial items. One of these abilities is rep-resemed by the Advanced Progressive Matrices and Analytical Reasoningtests. While both present stimuli in configural form, ne elements of the for-mer are visuospatial stimuli, those of the latter, verbal terms. Even so, bothtests require an understanding of the logical relationships among elements,and both presumably measure logical reasoning. The second nonanalogfactor, largely .defined by the IOC -2, appears to represent a more specificability to extract relevant distinctive features in spatial test items. Thisinterpretation is supported by the moderate loading of Wiggly Block onthis factor. The items of this test also contain distinctive features that canbe used to bypass the rotation process (see the earlier description of WigglyBlock). That the use of this strategy introduces only a small amount ofnonspatial variance into the Wiggly Block test scores is supported by itscomparatively stronger loading on the analog spatial factor.
54
69

TAE Paper Folding test exhibits rather substantial loadings of similarmagnitude on the nonanalog and analog factorsi.suggesting that all threeabilities are involved in the solution of the items from this test. More specif-ically, the relative size of the loadings suggests that at least 50 percent ofthe true score variance in the Paper Folding test scores is attributable tononspatial sources, 27 percent to analog spatial ability. This result is in ac-cord with previous research (Kyllonen, Lohman & Snow, 1984; Snow, 1978,1980), suggesting that this test contains a substantial nonspatial compo-nent. As illustrated earlier, verbal rules and logic can be used to solvemany of the items in this test. The role of feature-extraction strategies isless clear. It is possible that the ability to identify the features of theseitems that permit solution through propositional rules is different from theability to apply these rules.
In all, the results of this study suppu.t the classification scheme of Zi-mowski and Wothke (Technical Report 1986-1). The inconsistencies foundin this study are most likely due to the effects of nonrandom samplingfrom a self-selected population. More generally, the . iy shows that thevery feature that first distinguished spatial measures, their relative inde-pendence from verbal and reasoning measures, is no longer characteristic ofmany of the "spatial" tests currently in use. If consensus is to be reached insubstantive studies of spatial ability, researchers must be aware of this factwhen they select tests for their studies. If the predictive power of spatialscores is to b3 maximized, workers must be aware of this fact when theyselect tests for evaluative purposes. The classification scheme of Zimowskiand Wothke provides s,pie useful guidelines for the selection process.
In this connection, Limowski and Wothke provide some examples ofrelatively pure measures of spatial ability. Their examples include theanalog subtest of the Incomplete Open Cubes test (Zimowski, 1985), theBock-Kolakowski (1973) modification of the Guilford-Zimmerman SpatialVisualization test, and the Vandenberg-Shepard Mental Rotations test (seeTechnical Report 1986-1 for a description of this test). While the GZ didnot perform entirely as expected in this study, the test can be readily mod-ified to accommodate a sample with characteristics similar to those of the
55
`7 0

sample in this study. By reducing the exposure time of the items, the diffi-culty of the items can be increased, the use of verbal and reasoning solutionstrategies inhibited.
Summary
This report discusses the results from a study conducted to evaluate theFoundation's measurement of structural visualization. Three expel'imentaltests, the Incomplete Open Cubes test, the Guilford-Zimmerman SpatialVisualization test, and Raven's Advanced Progressive Matrices, were addedto the Foundation's test battery for the study and administered to clientsin twelve of the laboratories. Several tests from the regular battery werealso selected for analysis. They include the Foundation's measures of struc-tural visualization, Wiggly Block and Paper Folding, and two measures ofreasoning abilhy, Analytical and Inductive Reasoning. Scores computedthrough IRT methoc's served as the measures for the experimental tests.Scores used by the Foundation in their evaluation of aptitude profiles servedas the measures for the tests from their battery.
Several analyses were performed on the scores of respondents who com-pleted all of the tests in the study. ( ,omplete measurements were availablefor 801 females and 917 males.) Correlational and factor analyses were con-du ,,ed to determine the relationships among the test scores. Effect sizesfor the male-female contrast were computed to determine the relative, mag-nitudes of sex differences in performance. Finally, distributional analyseswere performed to test for bimodality in the within-sex score distributions.
In all, the results from these analyses are in accord with the classificationscheme of Zimowski and Wothke (Technical Report 1985-1). Except for afew inconsistencies that are Probably due to nonrandom sampling from aself-selected population and a ceiling effect, the results tend to agree withthe a priori classification of the spatial tests as relatively pure or impuremeasures.
56
The results for the Foundation's tests suggest that Paper Folding con-tains a large nonspatial component attributable to the use of a distinc-tive feature-extraction strategy and general reasoning ability, while WigglyBlock contains a small nonspatial component attributable to the use of adistinctive feature strategy. In particular, Paper Folding exhibits rathersubstantial loadings on both of the nonanalog factors that emerge in thefactor analysis. These nonspatial loadings are similes .? in magnitude to theloading of the test on the analog factor. More speclf.cally, the relative sizeof these loadings suggests that at least 50 percent of the true score variancein the Paper Folding scores is attributable to nonspatiC sources, while only27 percent is attributable to analog spatial ability. The test also correlateshigher than any other measure with an instrument designed to measureSpearman's g in a culture-free manner, Raven's Advanced Progressive Ma-trices. With the exception of the Inductive Reasoning test, Paper Foldingalso correlates higher than any other measure with Analytical Reasoning.Moreover, it exhibits a smaller sex difference than those typically reportedfor relatively pure measures of spatial ability (Zimowski, 1985). In all, theseresults suggest that Paper Folding is a relatively impure measure of analogspatial ability.
Evidence in support of a small nonspatial component for the WigglyBlock, on the other is found in its moderate loading on the nonspa-till factor defined by the IOC-2 in the factor analysis. But because thisloading is considerably smaller than its loading on the analog spatial factor,the test appears to contain a relatively large analog component. Additionalsupport for this interpretation is found in the magnitude of the sex effectassociated with the test. Its size is in the range typically reported for rela-tively pure measures. In all, these results suggest that only a small percentof the variance in the Wiggly Block scores is attributable to nonspatialsources and that the test is a relatively pure measure of structural visual-ization.
Little support vas found for the hypothesis that tho correlation betweenthe Wiggly Block and Pape, Folding tests is entirely due to a shared ana-lytical component (see the Introduction). Bo'h of these tests exhibit rzther
57
72
large correlations with the analog factor scores of the IOC, and both load,rather strongly, on the factor that is primarily defined by the analog subtestof t'...a IOC. These results are in accord with the conclusion that both testscontain an analog spatial component and that their intercorrelation is due,in part, to this common component.
58
73

References
Barratt, E.S. (1953). An analysis of verbal reports of solving spatial problemsas an aid in defining spatial factors. Journal of Psychology, 36, 17-25.
Bock, R.D., Gibbons, R.D., & Muraki, E. (1985). Full-informaC,n factor anal-ysis. Chicago: National Opinion Research Center.
Bock, R.D., & Kolakowski, D. (1973). Further f---idence of sex-linked major-gene insluence on human spatial visualizing at. --. The American Journalof Human Genetics, 25, 144.
Caplan, P.J., MacPherson, G.M., & Tobin, P. (1985). Do sex-related differencesin spatial abilities exist? A multilevel critique with new data. AmericanPsychologist, 40, 786-799.
Cooper, L.A. (1976). Individual differences in visual comparison processes. Per-ception and Psychophysics, 19, 433-444.
Cooper, L.A., & Shepard, R.N. (1973). The time required to prepare for a ro-tated stimulus. Memory and Cognition, 1, 246-250.
Day, N.E. (1969). Estimating the components of a mixture of two normal dis-tributions. Biometrika, 56, 463-474.
Elias, M.F., & Khisbourne, M. (197_'. Age and sex differences in the processingof verbal and nonverbal stimuli. Journal of Gerontology, 29, 162-171.
Eliot, J.C., kz Smith, .1.M. (1983). An international directory of spatial te;Windsor, England: NFER-Nelson.
French, J.W. (1951). The description of aptitude and achievement tests in termsof rotated factors. Psychometi in Monographs (No. 5). London: Macmillan.
59
74
French, J.W., Ekstrom R.B., & Price, L.A. (1963). Kit of reference tests forcognitive factors. Princeton, NJ: Educational Testing Service.
Guilford, J.P., & Lacey, J.I. [Eds.] (1947). Pr!nted classification tests. ArmyAir Forces Aviation Psychology Program Aesearch Report No. 5. Wash-ington, DC: U.S.. Go-;erament Printing Office.
Guilford, J.P., & Zimmerman, W.S. (1947). The Guilford-Zimmerman aptitudesurvey spatial visualization, form B. Beverly Hills, CA: Sheridan SupplyCompany.
Haberman, S.J. (1977). Maximum likelihood estimates in experimental responsemodels. Annals of Statistics, 5, 815-841.
Halpern, D.F. (1986). Sex differences in cognitive ability. Hillsdale, NJ: Erl-baum Associates.
Harman, H.H. (1976) Modern factor analysis. Chicago: The U 'rersity ofChicago Press.
Kelley, T.L (1928). Crossroads in the mind of rnan. Stanford, CA: StanfordUniversity Press.
Kosslyn, S. M., & Shwartz, S.?. (1977). A simulation of visual imagery. Cogni-tive Science, 1, 265-295.
Kyllonen, P.C., Lohman, D.F., & Snow, R.E. (1984). Effects of aptitudes,strategy training, and task facets on spatial task performance. Journal ofEducational Psychology, 76, 130-145.
Lord, F.M. (1980). ApplicAtions of item response theory to practical testingproblems. Hillsdale, NJ: Erlbaum Associates.
Maccoby, E.E., & Jack lin, C.N. (1974). The psychology of sex differences. Stan-ford, CA: Stanford University Press.
60
McClearn, C. E., & De Fries, J.C. (1973). Introduction to behavioral genetics.San Francisco: W.H. Freeman.
McFarlane, M. (1925). A st'idy of practical ability. British Journal of Psychol-ogy, Monograph Supplement No. 8.
McGee, M.G. (1977). A family study of human spatial abilities. DissertationAbstracts Internatioszal, 37, 6396.
McGee, M.G. (1975i. Human spatial abilities. New York: Holt, Rinehart, andWinston.
Metzler, J., & Shepard, R.N. (1974). Transformational studies of the internalrepresentation of three-dimensional structures. In Sn lso, R.L. (Ed.) The-ories in cognitive psychology: The Loyola symposium (pp.147-201). NewYork: Wiley.
Mislevy, R.J., & Bock, R.D. (1984). BILOG: Maximum likelihood item analysisand test scoring logistic model. Mooresville, IN: Scientific Software.
Myers, C.T. (1957). Some observations and Dpinions concerning spatial rela-tions tests. ETS RB 58-16. Princeton, NJ: Educational Testing SerAce.
Myers, C.T. (1958). Some observations of problem solving in spatial relationstests. ETS RB 58-16. Princeton, NJ: Educational 'testing Service.
O'Connor, J. (1928). Born that way. Baltimore: Williams & Wilkins.
O'Connor, J. (1943). Structural visualization. Boston: Human EngineeringLaboratory.
Paivio, A. (1977). Images, propositions, and knowledge. in J.M. Nicholas ("Sd.),Images, perception and knowledge. Dordrecht, Holland: Reidel.
61
76
Pylyshyn, Z.W. (1979). The rate of mental rotation of images: A test of aholistic analogue hypothesis. Memory and Cognition, 7, 19-28.
Raven, J.C. (1962). Advanced Progessive Matrices, Set 11(1962 Revision). Lon-don: E.T. Heron & Co.
Raven, J.C. (1965). Advanced Progressive Matrices Sets I and II: Plan and useof the scale with a report of experimental work. London: H.K. Lewis andCo. Ltd.
Shepard, R.N., & Metzler, J. (1971). Mental rotation of three-dimensional ob-jects. Science, 171, 701-703.
Snow, R.E. (1978). Eye fixation and strategy analyses of individual differencesin cognitive abilities. In A.M. Lesgold, J.W. Pellegrino, S.D. Fokkeman, &W.E. Montague (Eds.), Aptitude, learning ant intruction. (Vol. 1). Hills-dale, NJ: Erlbaum Associates.
Snow, R.E. (1980). Aptitude processes. In R.E. Snow, P.A. Federico, & W.E.Mcntague (Eds.), Aptitude, learning, and instruction (Vol. 1). Hillsdale,NJ: Erlbaum.
Spearman, C., & Jones, L.W. (1950). Human ability. London: Macmillan.
Statistical Bulletin 438. (1940). Validation study of elementary school teachers.L. Seeley. Boston: Johnson O'Connor Research Foundation.
Statistical Bulletin 706. (1941). Validation study of 35 magazine editorial staffmembers. L. Seeley. Boston: Johnson O'Connor Research Foundation.
Statistical Bulletin 1983-10. "Look-away" Wiggly Block, Worksample 3, 4, 5, 64 0: Validity, reliability, and new scoring system. M. Daniel. Fort Worth.,
'1 -: Johnson O'r.innor Research Foundation.
62
Statistical Bulletin 1985-6. Research proposal: Analysis of structural visualiza-tion tests. W. Wothke, M.F. Zimowski, & R. Smith: -Chicago: JohnsonO'Connor Research Foundation.
Statistical Bulletin 1988-2. JCCRF test reliabilities and interpretation of testscores. D. Schroeder, Chicago: Johnson O'Connor Research Foundation.
Technical Report 90. (1941). Analysis of the worksc,mple results of 101 highschool teachers. L. Seeley. Boston: Johnson O'Connor Research Founda-tion.
Technical Report 97. (1941). A follow-up of the careers of tested engineeringstudents: Part I. S. Horton. Boston: Johnson O'Connor Research Founda-tion.
Technical Report 97. (1942). A follow-up of the careers of tested engineeringstudents: Part II. S. Horton. Boston: Johnson O'Connor Research Foun-dation.
Technical Report 102. (1942). Preliminary -4-tly of the relationship of testscores to success and failure in school. M. Luqueer. Boston: JohnsonO'Connor Research Foundation.
Techn:al Report 113. (1943). A study of the correlations between worksamples1, 4, and 5, 16, 18, and 35 and subjects given a senior high school A. K.Rippere. Boston: Johnson O'Connor Research Foundation.
Technical Report 1981.2. Construct validity of the Wiggly Block and PaperFolding tests: A factor ljerenced multivariate study. U.S. Trafton. Boston:Johnson O'Connor Research Foundation.
Technical Report 1982-6. A factorial study of reasoning tests. M. Daniel.Boston: Johnson O'Connor Research Foundation.
63
78
Technical Report 1983-2. Large-sample test intercorrelations. M. Daniel. NewYork: Johnson O'Connor Research Foundation.
Technical Report 1986-1. The measurement of human variation in spatial vi-sualizing ability: A process-oriented perspective. M.F. Zimowski and W.Wothke. Chicago: The Johnson O'Connor Research foundation.
Thorndike, E.L. (1921). On the organization of intellect. Psychological Review,28, 141-151.
Thurstone, L.L. 1947). Multiple factor analysis. Chicago. The University ofChicago Press.
Thurstone, L.L. (1950). Some primary abilities in visual thinking. Chicago:The University of Chicago Psychometric Laboratory Report No. 59.
Validation Bulletin 11. (1941). Confidential report to Company 13. C. Wilks.Boston: Johnson O'Conncr, Research Foundation.
Validation Bulletin 22. (1942). Analyst.; of the worksample results of twentyaviation mechanics. J. Ricks. Boston Johnson O'Connor Research Foun-dation.
Validation Bulletin V.. (1947). A study of Company 11. M.H. Licht. Boston:Johnson O'Connor Research Foundation.
Vandenberg, S.G. (1971). The genetics of i illigence. In L.C. Deighton (Ed.),Encyclopedia of Education. New York: MacMillan.
Wilson, D., Wood, R., & Gibbons, R.D. (] 984). TESTFACT: Test scoring andfill-illormation item factor analysis. Mooresville, IN: Scientific Sof'ware,Inc
Wolfie, D. (1940). Factor analysis to ".940. Psychometric Monograph No. 3.
64
79
Wothke, W.W. (1988). ICC Plot. Mooresville, IN: Scientific Software, Inc.
Zimowski, M.P. (1985). Attributes of spatial test items that influence cognitiveprocessing. Unpublished doctoral dissertation, The University of Chicago,Department of Behavioral Sciences.
Zimowski, M.F., & Bock, R.D. (1987). Full-information item factor analysisof test forms from the ASVAB CAT pool. Chicago: National Opinion Re-search Center.
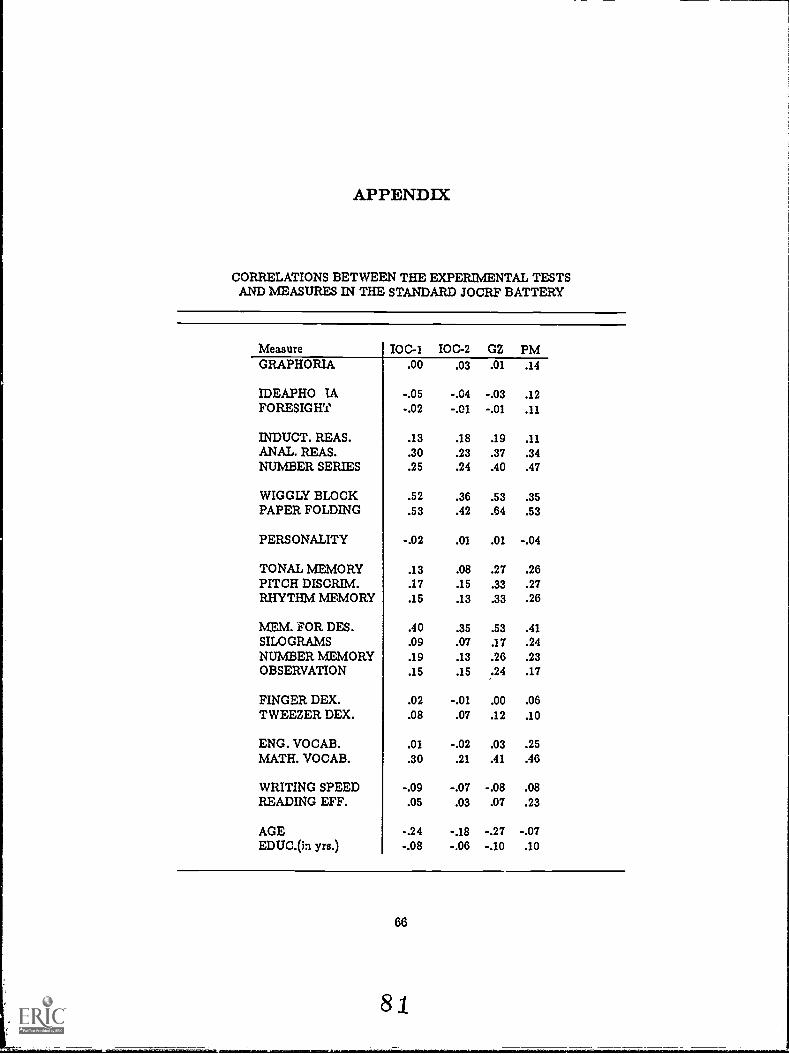
APPENDIX
CORRELATIONS BETWEEN THE EXPERD4ENTAL TESTSAND MEASURES IN THE STANDARD JOCRF BATTERY
Measure IOC-1 10C-2 GZ PMGRAPHORIA .00 .03 .01 .14
IDEAPHO IA -.05 -.04 -.03 .12FORESIGHT -.02 -.01 -.01 .11
INDUCT. REAS. .13 .18 .19 .11ANAL. REAS. .30 .23 .37 .34NUMBER SERIES .25 .24 .40 .47
WIGGLY BLOCK .52 .36 .53 .35PAPER FOLDING .53 .42 .64 .53
PERSONALITY -.02 .01 .01 -.04
TONAL MEMORY .13 .08 .27 .26PITCH DISCRIM. .17 .15 .33 .27RHYTHM MEMORY .15 .13 .33 .26
MEM. FOR DES. .40 .35 .53 .41SILOGRAMS .09 .07 .17 .24NUMBER MEMORY .19 .13 .26 .23OBSERVATION .15 .15 :24 .17
FINGER DEX. .02 -.01 .00 .06TWEEZER DEX. .08 .07 .12 .10
ENG. VOCAB. .01 -.02 .03 .25MATH. VOCAB. .30 .21 .41 .46
WRITING SPEED -.09 -.07 -.08 .08READING EFF. .05 .03 .07 .23
AGE -.24 -.18 -.27 -.07EDUC.(in yrs.) -.08 -.06 -.10 .10
66
81