Embed Size (px)
Citation preview
DOCUMENT RESUME
ED 197 503 EA 013 552
AUTHOR Coleman, James: And OthersTITLE Public and Private Schools- (Draft].TNSTITUTTON National Opinion Research Center, Chicago, Ill.SPONS AGENCY National Center for Education Statistics (DREW;,
Washington, D.C.PUB DATE tar 91CONTRACT 300-78-0209NOTE 340p.: This preliminary draft is being made avFdlable
to accommodate public demand. A final report, to bepublished later, will reflect comments received fromsources of review.
EDRS PRICEDESCRIPTORS
IDENTT.FTEPS
MF011PC14 Plus Postage.Academic Achievement: *Catholic Schools: Discipline:Educational Assessmeint: Educational Environment:*Educational Resources: Educational StatusComparison; Family Income; InstitutionalCharacteristics: Longitudinal Studies: NationalSurveys: *Outcomes of Education: *Private Schools:*Public Schools: Questionnaires; Racial Distribution:Secondary Education: Statistical Analysis: StudentBehavior: *Student Characteristics; StudentEducational Obiectives: Student School Relationship:Tables (Bata)High School and Beyond (NCES1: *Public and PrivateSchools (Coleman et al)
ABSTRACTThis report is one of a set of five that constitutes
baseline descriptions and initial analyses of a very rich dataset."'he report covers four major areas of interest in the comparison ofpublic and private schools: student composition within the public andPrivate sectors, resources available in these schools, thefunctioning of these schools, and the outcomes for students in theschools. The data and the analyses presented in this report are fromthe first (1980) wave of a longitudinal study. The responses are fromquestionnaires completed by representative samples of approximately59,000 students in 1,015 public and private secondary schools, aswell as their respective school officials. Catholic schools, whichconstitute about two-thirds of the total private sector, and otherprivate schools are separately compared to public schools in thereport. For some analyses, two additional sets of schools areincluded in the comparison. These are 11 high - performance privateschools and a set of 12 high-performance public schools. FindingsIndicate that important factors in bringing about higher scholasticachievement in private and Catholic schools than in public schoolsare the greater academic demands and mere ordered environment. Theoverall conclusion is made that the factual premises underlyingpolicies that would facilitate use of private schools are much bettersupported on the whole than those underlying policies that wouldconstrain their use. (Author/ELF)
DRAFTPUBLIC AND PRIVATE SCHOOLS
James Coleman, Thomas Hoffer, and Sally KilgoreNational Opinion Research CenterChicago, Illinois
David SweetProject OfficerNational Center for Education Statistics
U.B. DEPARTMENT OF EDUCATIONNATIONAL INSTITUTE OF EDUCATION
EDUCATIONAL RESOURCES INFORMATIONCENTER (ERIC)
r This dc;ument has been reproduced asreceived from the person or organizationoriginating it
; Minor changes have been made to Improvereproduction quality.
Points of view or opinions stated in this document do not necessarily represent official MEposition or policy.
This document is a draft report produced by National Opinion ResearchCenter under contract OE 300-78-0208, awarded by the National Centerfor Education Statistics, U.S. Education Department, dated July 7,1978. The draft report was made available to the public at a nationalconference on April 7, 1981.
To accommodate many requests for copies since then, the report is beingmade available through ERIC in its draft form, pending a final reportwhich will reflect comments from the conference and other sources ofreview. This distribution through ERIC should not be construed eitheras endorsement by the U.S. Education Department of the opinions expressedtherein or as acceptance by the contracting officer of the draft reportas a deliverable under the contract.
April 1981
TABLE OF CONTENTS
PREFACExii
ACKNOWLEDGMENTSxvii
SUMMARY OF MAJOR FINDINGSxix
1. INTRODUCTION1
2. THE SIZE AND GEOGRAPHIC DISTRIBUTION OFPUBLIC AND PRIVATE SECONDARY SCHOOLS 9
2.1. Enrollment and Geographic Comparisonsof Public and Private Secondary Education 11
2.2. Selected Attributes of Private Secondary Schools 20
3. THE STUDENT COMPOSITION OF PUBLIC AND PRIVATE SCHOOLS ..... 26
3.1. The Racial and Ethnic Backgrounds ofPublic and Private School Students 28
3.2. The Economic Backgrounds ofPublic and Private School Students 51
3.3. The Religious Backgrounds ofPublic and Private School Students 59
3.4. Handicapped Students in Publicand Private Schools
643.5. The Predicted Impact of a Policy Change
Facilitating Enrollment :;.n Private Schools 67
4. SCHOOL RESOURCES76
4.1. Course Offerings78
4.2. Staffing Patterns85
4.3. Special Programs89
4.4. Physical Facilities92
4.5. Federal Programs94
4.6. Corclusion96
iii
5. THE FUNCTIONING OF PUBLIC AND PRIVATE SCHOOLS 100
5.1. Student Coursework 101
5.2. Extracurricular Activities 111
5.3. Disciplinary Standards 114
5.4. Student Behavior 125
5.5. Students' Attitudes 139
5.6. Conclusion145
6. OUTCOMES OF EDUCATION148
6.1. Descriptive Differences in OutcomesBetween Public and Private Schools 150
6.2. Effects of Private Schools onOutcomes of Schooling 165
6.3. Factors Affecting Cognitive Achievementin the Schools
1976.4. Summary of Educational Outcomes
219
7. CONCLUSION224
APPENDIXES
A. Statistical References
B. Items from the Student and School QuestionnairesUsed in the Analysis
REFERENCES
iv
I
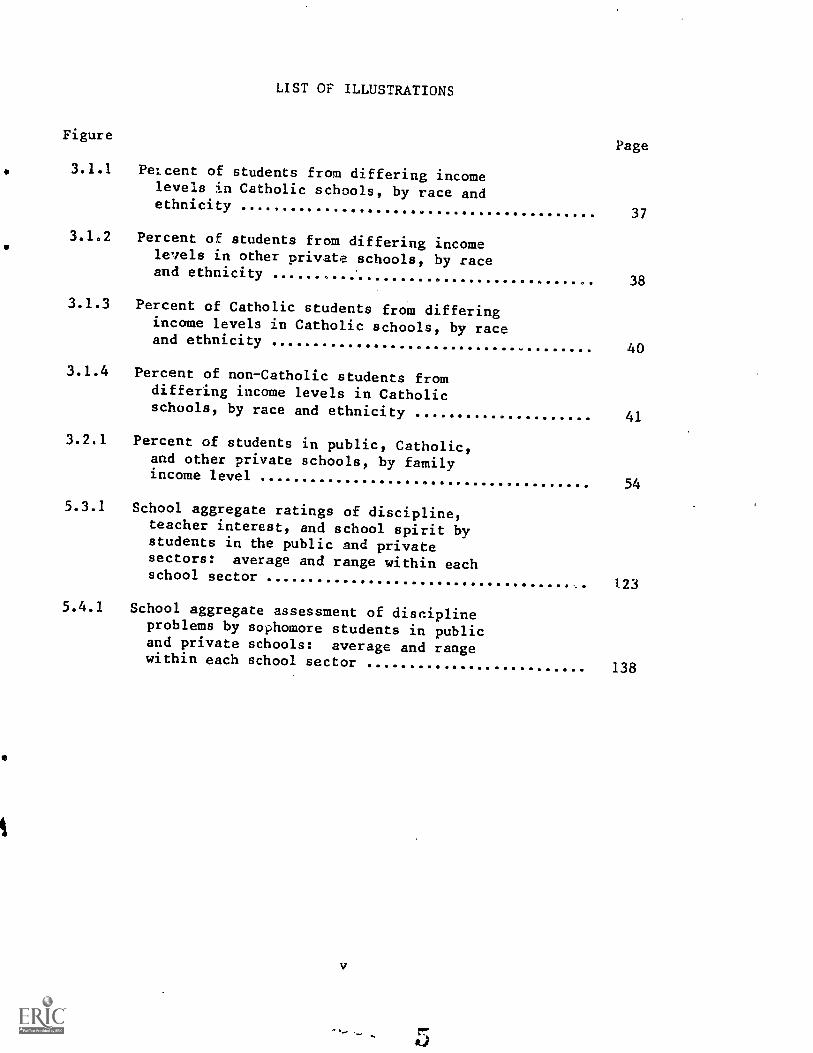
LIST OF ILLUSTRATIONS
FigurePage
3.1.1 Percent of students from differing incomelevels in Catholic schools, by race andethnicity
37
3.1.2 Percent of students from differing incomelevels in other private schools, by raceand ethnicity
38
3.1.3 Percent of Catholic students from differingincome levels in Catholic schools, by raceand ethnicity
40
3.1.4 Percent of non-Catholic students fromdiffering income levels in Catholicschools, by race and ethnicity
41
3.2.1 Percent of students in public, Catholic,and other private schools, by familyincome level
54
5.3.1 School aggregate ratings of discipline,teacher interest, and school spirit bystudents in the public and privatesectors: average and range within eachschool sector
123
5.4.1 School aggregate assessment of disciplineproblems by sophomore students in publicand private schools: average and rangewithin each school sector 138
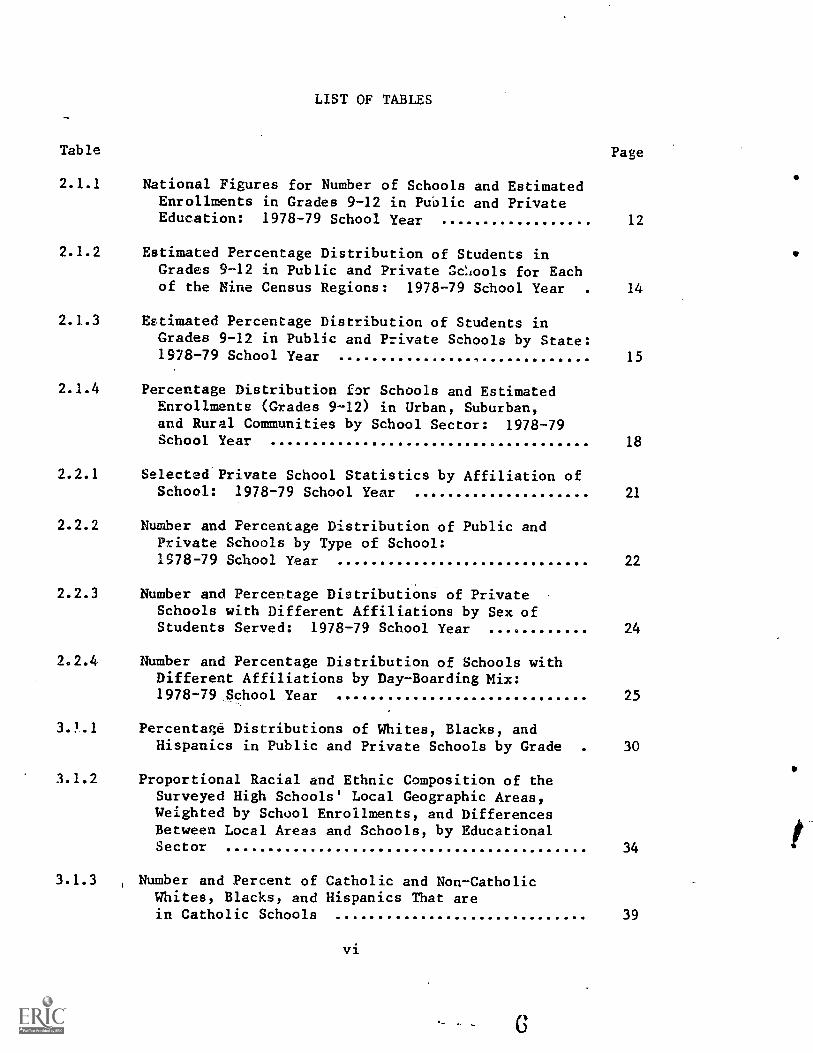
LIST OF TABLES
Table Page
2.1.1 National Figures for Number of Schools and EstimatedEnrollments in Grades 9-12 in Public and PrivateEducation: 1978-79 School Year 12
2.1.2 Estimated Percentage Distribution of Students inGrades 9-12 in Public and Private Scliools for Eachof the Nine Census Regions: 1978-79 School Year . 14
2.1.3 Estimated Percentage Distribution of Students inGrades 9-12 in Public and Private Schools by State:1978-79 School Year
2.1.4 Percentage Distribution for Schools and EstimatedEnrollments (Grades 9-12) in Urban, Suburban,and Rural Communities by School Sector: 1978-79School Year
15
18
2.2.1 Selected Private School Statistics by Affiliation ofSchool: 1978-79 School Year 21
2.2.2 Number and Percentage Distribution of Public andPrivate Schools by Type of School:1978-79 School Year
2.2.3 Number and Percentage Distributions of PrivateSchools with Different Affiliations by Sex ofStudents Served: 1978-79 School Year
2.2.4 Number and Percentage Distribution of Schools withDifferent Affiliations by Day-Boarding Mix:1978-79 School Year
22
24
25
3.?.1 Percentage Distributions of Whites, Blacks, andHispanics in Public and Private Schools by Grade 30
3.1.2 Proportional Racial and Ethnic Composition of theSurveyed High Schools' Local Geographic Areas,Weighted by School Enrollments, and DifferencesBetween Local Areas and Schools, by EducationalSector
3.1.3 , Number and Percent of Catholic and Non-CatholicWhites, Blacks, and Hispanics That arein Catholic Schools
vi
34
39
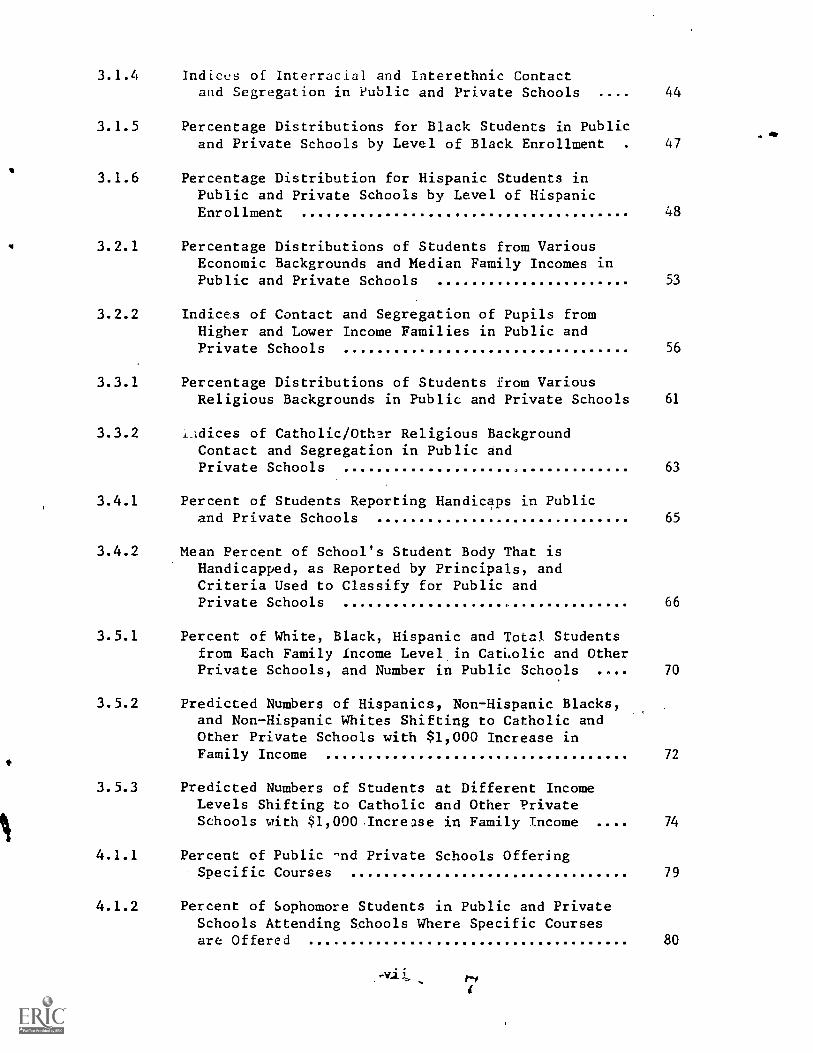
Indices of Interracial and Interethnic Contactand Segregation in Public and Private Schools 44
Percentage Distributions for Black Students in Publicand Private Schools by Level of Black Enrollment . 47
Percentage Distribution for Hispanic Students inPublic and Private Schools by Level of HispanicEnrollment
3.2.1 Percentage Distributions of Students from VariousEconomic Backgrounds and Median Family Incomes inPublic and Private Schools
48
53
3.2.2 Indices of Contact and Segregation of Pupils fromHigher and Lower Income Families in Public andPrivate Schools 56
3.3.1 Percentage Distributions of Students from VariousReligious Backgrounds in Public and Private Schools 61
3.3.2 1_Idices of Catholic /Other Religious BackgroundContact and Segregation in Public andPrivate Schools 63
3.4.1 Percent of Students Reporting Handicaps in Publicand Private Schools 65
3.4.2 Mean Percent of School's Student Body That isHandicapped, as Reported by Principals, andCriteria Used to Classify for Public andPrivate Schools 66
3.5.1 Percent of White, Black, Hispanic and Total Studentsfrom Each Family Income Level in Catholic and OtherPrivate Schools, and Number in Public Schools 70
3.5.2 Predicted Numbers of Hispanics, Non-Hispanic Blacks,and Non-Hispanic Whites Shifting to Catholic andOther Private Schools with $1,000 Increase inFamily Income 72
3.5.3 Predicted Numbers of Students at Different IncomeLevels Shifting to Catholic and Other PrivateSchools with $1,000 Increase in Family Income 74
4.1.1 Percent of Public ^nd Private Schools OfferingSpecific Courses 79
4.1.2 Percent of Sophomore Students in Public and PrivateSchools Attending Schools Where Specific Coursesare Offered 80
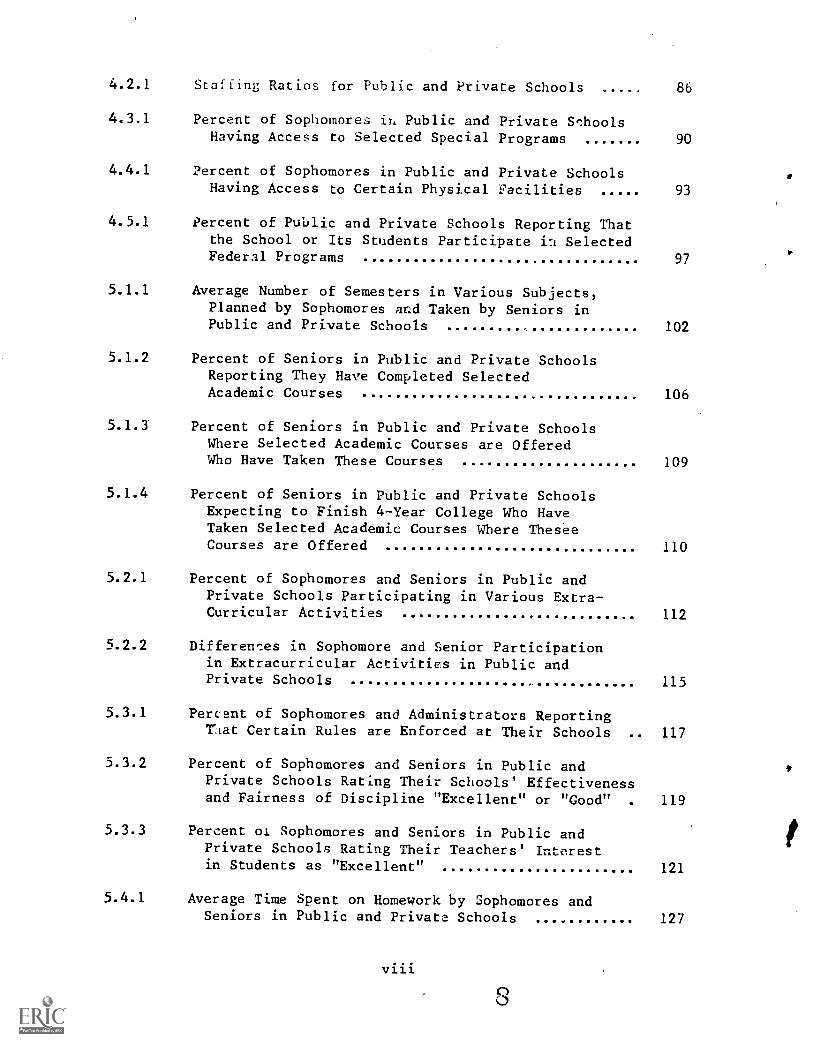
4.2.1
4.3.1
Staffing Ratios for Public and Private Schools
Percent of Sophomores in Public and Private StoolsHaving Access to Selected Special Programs
4.4.1 Percent of Sophomores in Public and Private SchoolsHaving Access to Certain Physical Facilities
4.5.1 Percent of Public and Private Schools Reporting Thatthe School or Its Students Participate in SelectedFederal Programs
5.1.1 Average Number of Semesters in Various Subjects,Planned by Sophomores and Taken by Seniors inPublic and Private Schools
5.1.2 Percent of Seniors in Public and Private SchoolsReporting They Have Completed SelectedAcademic Courses
5.1.3 Percent of Seniors in Public and Private SchoolsWhere Selected Academic Courses are OfferedWho Have Taken These Courses
5.1.4 Percent of Seniors in Public and Private SchoolsExpecting to Finish 4-Year College Who HaveTaken Selected Academic Courses Where TheseeCourses are Offered
5.2.1 Percent of Sophomores and Seniors in Public andPrivate Schools Participating in Various Extra-Curricular Activities
5.2.2 Differences in Sophomore and Senior Participationin Extracurricular Activities in Public andPrivate Schools
86
90
93
97
102
106
109
110
112
115
5.3.1 Percent of Sophomores and Administrators ReportingThat Certain Rules are Enforced at Their Schools .. 117
5.3.2 Percent of Sophomores and Seniors in Public andPrivate Schools Rating Their Schools' Effectivenessand Fairness of Discipline "Excellent" or "Good" . 119
5.3.3 Percent of Sophomores and Seniors in Public andPrivate Schools Rating Their Teachers' Interestin Students as "Excellent" 121
5.4.1 Average Time Spent on Homework by Sophomores andSeniors in Public and Private Schools 127
viii
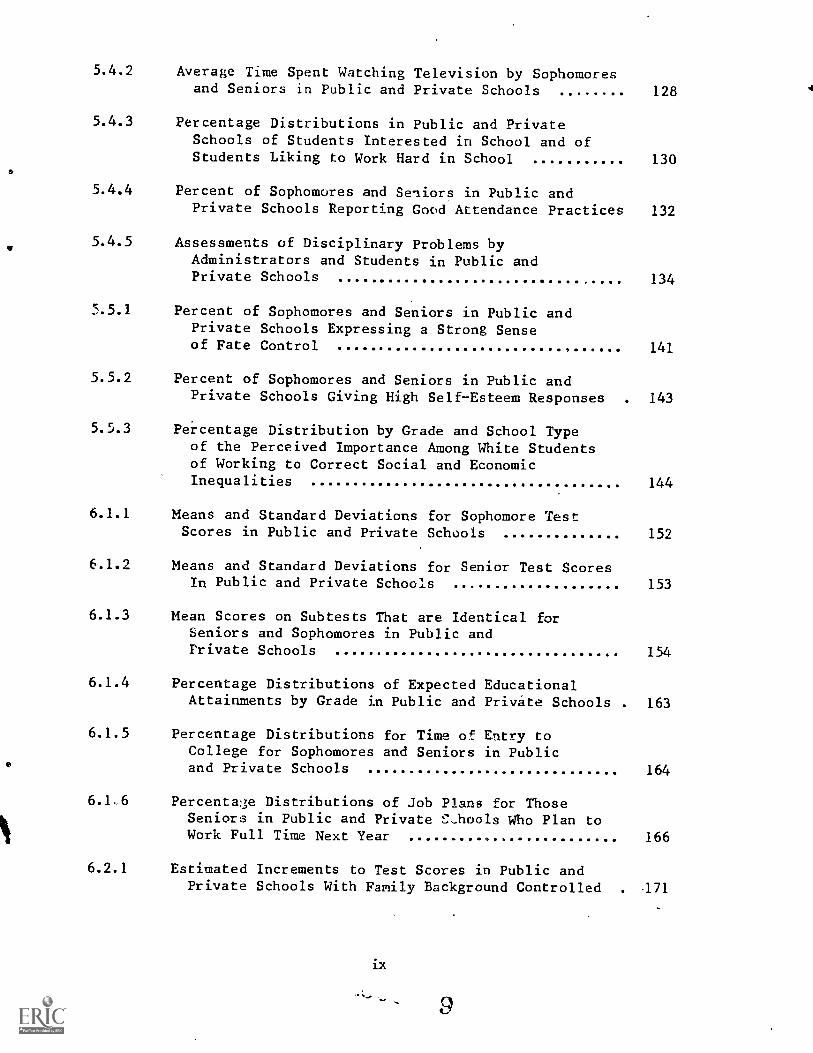
5.4.2 Average Time Spent Watching Television by Sophomoresand Seniors in Public and Private Schools 128
5.4.3 Percentage Distributions in Public and PrivateSchools of Students Interested in School and ofStudents Liking to Work Hard in School 130
5.4.4 Percent of Sophomores and Seniors in Public andPrivate Schools Reporting Good Attendance Practices 132
5.4.5 Assessments of Disciplinary Problems byAdministrators and Students in Public andPrivate Schools 134
5.5.1 Percent of Sophomores and Seniors in Public andPrivate Schools Expressing a Strong Senseof Fate Control 141
5.5.2 Percent of Sophomores and Seniors in Public andPrivate Schools Giving High Self-Esteem Responses . 143
5.5.3 Percentage Distribution by Grade and School Typeof the Perceived Importance Among White Studentsof Working to Correct Social and EconomicInequalities 144
Means and Standard Deviations for Sophomore TestScores in Public and Private Schools 152
Means and Standard Deviations for Senior Test ScoresIn Public and Private Schools 153
Mean Scores on Subtests That are Identical forSeniors and Sophomores in Public andPrivate Schools 154
6.1.4 Percentage Distributions of Expected EducationalAttainments by Grade in Public and Private Schools . 163
6.1.5 Percentage Distributions for Time of Entry toCollege for Sophomores and Seniors in Publicand Private Schools
6.16 Percentage Distributions of Job Plans for ThoseSeniors in Public and Private C-hools Who Plan toWork Full Time Next Year
164
166
6.2.1 Estimated Increments to Test Scores in Public andPrivate Schools With Family Background Controlled . -171
ix
9
4
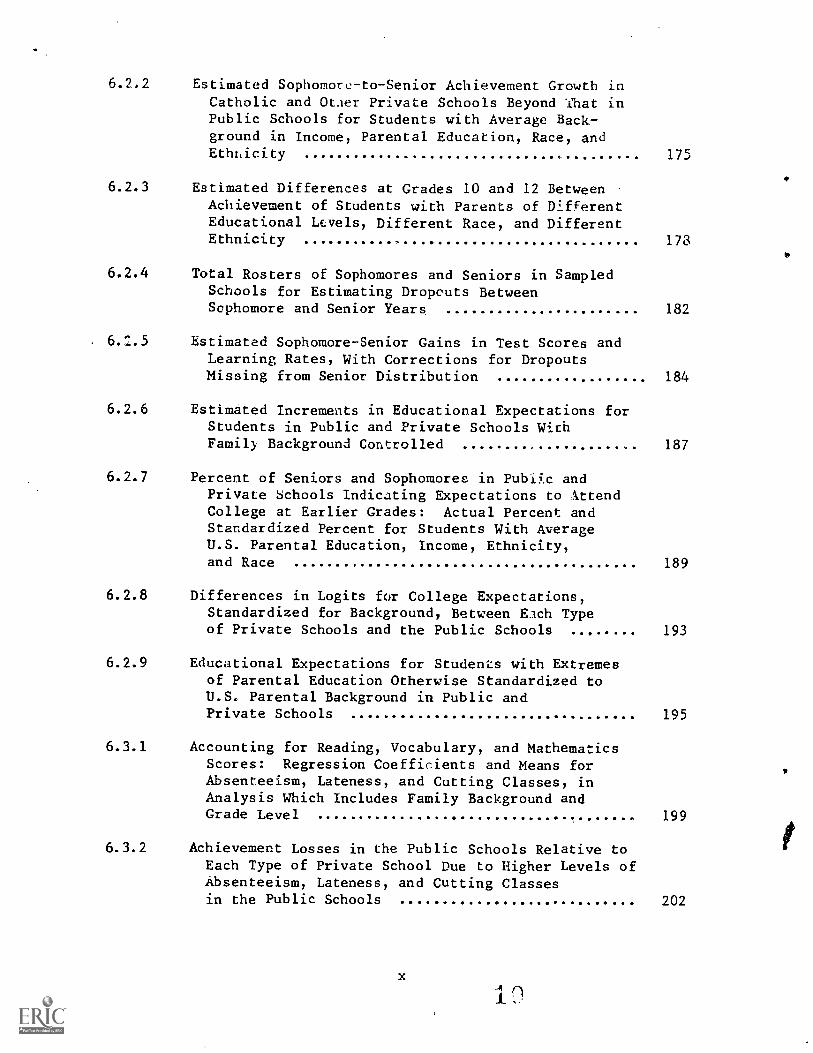
6.2,2 Estimated Sophomore-to-Senior Achievement Growth inCatholic and Otaer Private Schools Beyond That inPublic Schools for Students with Average Back-ground in Income, Parental Education, Race, andEthnicity
6.2.3 Estimated Differences at Grades 10 and 12 BetweenAchievement of Students with Parents of DifferentEducational Levels, Different Race, and DifferentEthnicity
6.2.4 Total Rosters of Sophomores and Seniors in SampledSchools for Estimating Dropouts BetweenSophomore and Senior Years
6.:.5 Estimated Sophomore-Senior Gains in Test Scores andLearning Rates, With Corrections for DropoutsMissing from Senior Distribution
6.2.6 Estimated Increments in Educational Expectations forStudents in Public and Private Schools WithFamily Background Controlled
6.2.7 Percent of Seniors and Sophomores in Public andPrivate Schools Indicating Expectations to AttendCollege at Earlier Grades: Actual Percent andStandardized Percent for Students With AverageU.S. Parental Education, Income, Ethnicity,and Race
6.2.8 Differences in Logits for College Expectations,Standardized for Background, Between alch Typeof Private Schools and the Public Schools
6.2.9 Educational Expectations for Students with Extremesof Parental Education Otherwise Standardized toU.S. Parental Background in Public andPrivate Schools
6.3.1 Accounting for Reading, Vocabulary, and MathematicsScores: Regression Coefficients and Means forAbsenteeism, Lateness, and Cutting Classes, inAnalysis Which Includes Family Background andGrade Level
6.3.2 Achievement Losses in the Public Schools Relative toEach Type of Private School Due to Higher Levels ofAbsenteeism, Lateness, and Cutting Classesin the Public Schools
x
1 I)
1.75
178
182
184
187
189
193
195
199
202
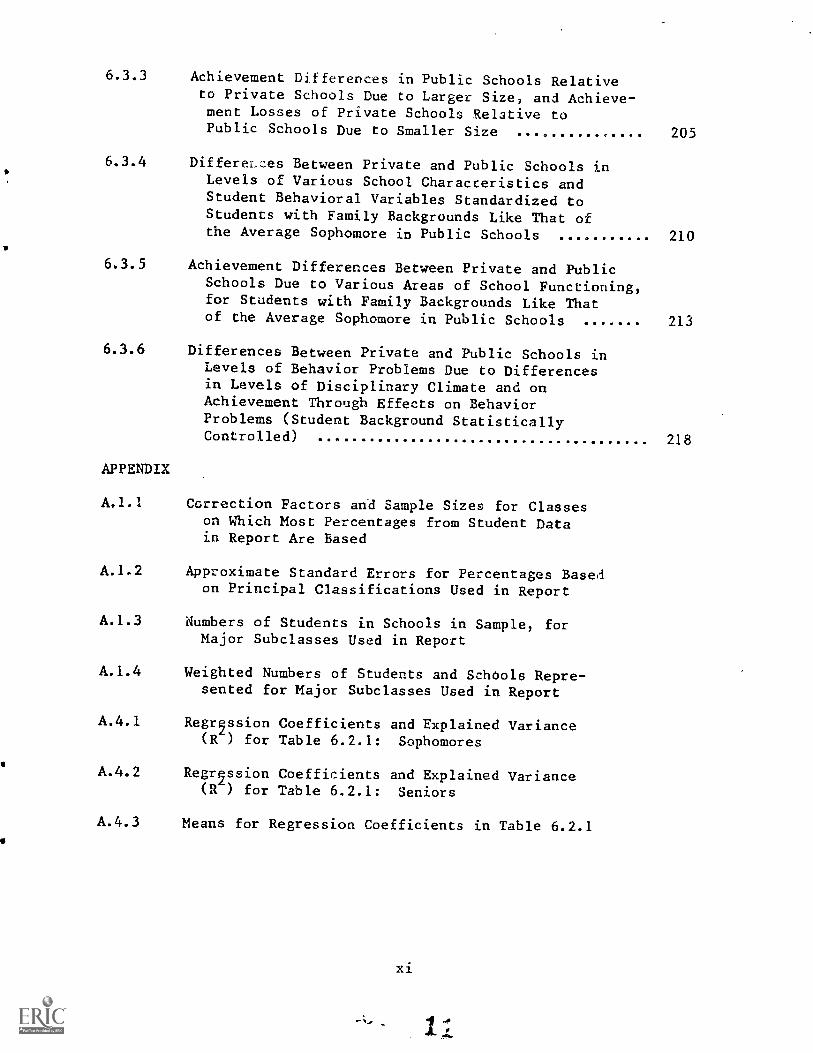
6.3.3 Achievement Differences in Public Schools Relativeto Private Schools Due to Larger Size, and Achieve-ment Losses of Private Schools Relative toPublic Schools Due to Smaller Size
6.3.4 Differences Between Private and Public Schools inLevels of Various School Characteristics andStudent Behavioral Variables Standardized toStudents with Family Backgrounds Like That ofthe Average Sophomore in Public Schools
6.3.5 Achievement Differences Between Private and PublicSchools Due to Various Areas of School Functioning,for Students with Family Backgrounds Like Thatof the Average Sophomore in Public Schools
6.3.6 Differences Between Private and Public Schools inLevels of Behavior Problems Due to Differencesin Levels of Disciplinary Climate and onAchievement Through Effects on BehaviorProblems (Student Background StatisticallyControlled)
APPENDIX
A.1.I
A.1.2
A.1.3
A.I.4
A.4.I
A.4.2
A.4.3
Correction Factors and Sample Sizes for Classeson Which Most Percentages from Student Datain Report Are Based
Approximate Standard Errors for Percentages Basedon Principal Classifications Used in Report
Numbers of Students in Schools in Sample, forMajor Subclasses Used in Report
Weighted Numbers of Students and Schools Repre-sented for Major Subclasses Used in Report
Regr2ssion Coefficients and Explained Variance(R ) for Table 6.2.1: Sophomores
Regr2ssion Coefficients and Explained Variance(R ) for Table 6.2.1: Seniors
Means for Regression Coefficients in Table 6.2.1
205
210
213
218
PREFACE
The data and analyses presented in this report are from th. first
(1980) wave of the National Center for Education Statistics study, HIGH
SCHOOL AND BEYOND, i longitudinal study of U.S. high school seniors and
sophomores. This study was conducted for NCES by the National Opinion
Research Center at the University of Chicago.
There are 1,016 high schools in the sample, and a target number
of 36 seniors and 36 sophomores in each of the schools. In many schools,
however, the actual numbers of seniors and sophomores was less than the
target number for two reasons. First, some students (or in some cases,
their parents) declined to participate, exercising this right in a vol-
untary survey. Second, some schools had class sizes smaller than 36
seniors or sophomores. Thus the total number of students participating
in the survey is 58,728.
A detailed report on sample design and sampling errors will be
published at a later date. Briefly, the sample was a two-stage strati-
fied probability sample with schocls drawn proportional to their size
and 36 sophomores and seniors drawn randomly from each selected school.
Substitutions were made for noncooperating schools in those strata where
it was possible, but not for students. Refusals, absences, and parental
refusals at the student stage resulted in an 84 percent completion rate
for students.
Several special strata were included in the sample with probabil-
ities higher than their occurrence in the population, to allow for special
study of certain types of schools or students. These included:
. Hispanic strata, with probabilities of selection to insure suf-ficient numbers of Cuban, Puerto Rican, and Mexican studentsfor separate analysis
. A stratum of Catholic schools with high proportions of blackstudents
. A stratum of non-Catholic private schools, oversampled to insureenough schools for analysis
. A stratum of public alternative schools
. A stratum of private schools with high-achieving students
For analyses that do not separate out these strata, the strata are down-
weighted to their proper population weights, so that the weighted sample
is representative of high school seniors and high school sophomores in
the United States and in each of the nine Census regions (subject to
the points mentioned above, substitution of schools and completion rates).
Information of several sorts was obtained in the survey. Students
completed questionnaires, about one hour in length, and took a battery
of tests with a total testing time of about one and one-half hours.
School officials completed questionnaires covering items of information
about the schools. Finally, teachers completed checklists concerning
students in the sample whom they had had in class to provide information
beyond the students' own reports about themselves.
This report is one of a set of five that constitutes baseline
descriptions and initial analyses of a very rich dataset. The study
was designed to be relevant both to many policy issues and to many fundam,,ntel
questions concerning youth development and educational institutions.
It is intended to be analyzed by a wide range of users, from those with
xiv
13
immediate policy concerns to those with interests in more fundamental
or long-range questions. The data are available at a nominal fee from
the National Center for Education Statistics.
As succeeding waves of data on a subsample of these students
become available (at approximately two-year intervals), the richness
of the dataset, and the scope of questions that,can be studied through
it, will expand. In addition, use of the data in conjunction with NCES's
study of the cohort of 1972 seniors (also available from NCES), for which
data at five time points are now available, will enrich the set of ques-
tions that can be studied.
ACKNOWLEDGMENTS
The initial design of HIGH SCHOOL AND BEYOND was created by
the Longitudinal Studies Branch of the National Center for Education
Statistics. Edith Huddleston, NCES project officer for ES&B, and'William
Fetters, mathematical statistician, haVe guided this project since its
inception, and have been responsible for many aspects of the research
design.
A study of this scope and magnitude would not have been possible
without the active cooperation of many persons at various levels of
educational administration: Chief State School Officers, Catholic
Archdioceses and other private school organizations, principals and
teachers in the schools, and of course, the students and their parents.
The expertise, support, and persuasiveness of numerous study coordinators
at participating schools was especially critical to the successful
conduct of the study. Those who will use these data for the study of
American e..ucaticn are deeply indebted to all these people.
A second debt is owed to all those people on the field and
project staff of HIGH SCHOOL AND BEYOND, whose efforts brought into
being the data that will make possible the study of issues involving
young people and their schools, data on which the present report is
based.
The design of HIGH SCHOOL AND BEYOND by the National Center
for Education Statistics and its modifications by NORC, were greatly
aided by consultations with many groups interested in American education
and by continuing guidance from the project's National Planning Committee.
xvii
Of the support services at NORC that, by efforts beyond the call of
duty, made possible the completion of this report at this time two
deserve special mention: Data Processing and Word Processing, both
of which have our deep gratitude.
xviii
16
SL MARY OF MAJOR FINDINGS
One of the emergirg policy questions in American education in
recent years has been the question of the role that private schools
should play. Although and answer to this question depends in part on
values, it also depends on facts. First, how well do public and private
schools work for children? Are private schools divisive, and, if so,
along what lines? Are private schools more easily managed than public
schools, and, if so, why?
Recent policy discussions concerning private schools in the
United States have included both proposals that would increase their
role in American education and proposals that would decrease their role.
As an example of the latter, it has been proposed that private schools
meet a racial composition criterion in order to maintain tax-exempt status.
On the other side, there have been proposals for tuition tax credits
for private schools, and, at the state level, proposals for educational
vouchers.
These policy proposals are based in part on assumptions about
the current roles and current functioning of public and private schools
in America. The report is intended to provide evidence relevant to
such proposals.
Using data collected in the first wave of the National Centel:
for Education Statistics study, HIGH SCHOOL AND BEYOND, the report_ covers
four major areas of interest in the public and private schooling issue:
student composition within the public and private sectors (chapter 3),
resources available in these schools (chapter 4), the functioning of
xix
these schools (chapter 5), and the outcomes for students in the schools
(chapter 6). The responses in 1980 from representative samples of approxi-
mately 58,000 sophomore and senior students in 1,015 public and private
secondary schools, as well as their respective school officials, are
used in the analysis. Catholic schools, which constitute about two-
thirds of the total private sector, and other private schools are separate]y
compared to public schools in the report.
Listed below are a number of the premises underlying policy
proposals that would increase or decrease the role of private education
in the United States. Following each of these assumptions is a brief
summary of our relevant findings.1
Premises underlying policies that would increase the role of
private schools:
1. Private schools produce better cognitive outcomes than dopublic schools (chapter 6).
The evidence from chapter 6 is that private schools do produce
better cognitive outcomes than public schools. When family background
factors that predict achievement are controlled students in both Catholic
and other private schools are shown to achieve at a higher level than
students in public schools. The difference at the sophomore level,
which was greater for Catholic schools than for cther private schools,
ranged from about a r'f the suphomore-senior gain to about two-
thirds the size of that gain (i.e., from a little less than half a year's
difference to something more than one year's difference). Tnis evidence
is subject to a caveat: despite extensive statistical controls on parental
background, there may -ery well be other unmeasured factors in the self-
selection into the private sector that are associated with higher a
achievement.
The points lister! below constitute the body of the concluding chapter (7).xx
13
When we examined gains from the sophomore to the senior year
in the three sectors, the first evidence was that students from comparable
backgrounds make greater gains in other private schools than in public
schools, but that students in Catholic schools do not. However, the
much greater sophomore-senior dropout in public schools than in either
the Catholic or other private schools shows that the apparent public
school gains have a considerable upward bias, leading to the conclusion
that greater cognitive growth occurs between the sophomore and sen:.or
years in both private sectors than in the public sector.
A caveat to all these results is shown by the high-performance
public and private schools. Performance was much higher in both of
these sets of schools, than in any of the three sectors (section 6.1),
although these schools could not be separately studied in the extended
analysis of section 6.2 because of ceiling effects in achievement scores.
2. Private schools provide better character and personality develop-ment than do public schools (chapter 5).
Little evidence on character and personality development was
provided in this report. However, students in other private schools
show both higher levels of self-esteem and fate control than sophomores
and higher gains from the sophomore to senior year than students in
public or Catholic schools. The inference that there is greater growth
on these dimensions in other private schools is strengthened by the
fact that students in high-performance private schools showed even
higher levels as sophomores, and similarly high sophomore-senior gains,
while students in high-performance public schools did not, despite the
fact that the parental backgrounds of students in the latter schools
are higher than those in other private schools. The fact that the other
r
xxi
private and high-performance private schools have less than half the
student-teacher ratio than s-hools in the other sectors suggests that
the difference might be due to this.
3. Private schools provide. a safer, more disciplined, and moreordered environment than do public schools.(chapter 5).
The evidence is strong that this premise is true. The greatest
difference found in any aspect of school functioning between public
and private schools was in the degree of discipline and order in the
schools (sections 5.3, 5.4). The Catholic and other private schools
appear somewhat different in their discipline and behavior profiles,
with students in other private schools reporting more absences and class
cutting but also more homework, fewer fights among students, and greater
teacher interest in students. However, in all these respects, both
sectors showed greater discipline and order than the public schools.
4. Private schools are more successful in creating an interestin learning than are public schools (chapter 5)..
There is little evidence to confirm or disconfirm this premise
in the report. The sectors differ only slightly in student responses
to the two direct questions concerning interest in school, and there
is not much to be inferred from indirect evidence presented in the
report.
5. Private schools encourage interest in higher education andlead more of their students to attend college than do publicschools with comparable students (chapter 6).
The evidence on this premise is toward a posi-;ive answer, but
it is not extremely strong evidence. There is some evidence that students
have higher college aspirations and expectations in private schools
than do students from comparable backgrounds in public schools (Table 6.2.).
The report contains no evidence on this premise.
6. Private schools are smaller and thus bring about greater degreesof participation in sports and other activities than do publicschools (chapter 5).
The evidence shows that this premise is true for other private
schools, but not for Catholic schools (though Catholic school students
report highest school spirit, and other private school students lowest);
The fact that Catholic schools are smaller in size than public schools
does not result in increased participation in extracurricular activities.
In addition, participation grows between the sophomore and senior years
in other private schools, while it declines slightly in Catholic and
public schools.
7. Private schools have smaller class size, and thus allow teachersand students to have greater contact (chapter 4).
The other private schools have sharply lower studentteacher
ratios than the public schools, while the Catholic schools have slightly
higher ratios. There are fewer than half the students per teacher in
other private schools than in public or Catholic schools (Table 4.2.1).
No direct evidence on contact between students and teachers is presented.
8. Private schools are more efficient than public schools, accomplishing their task at a lower cost.
The report contains no evidence on this premise.
Premises underlying policies that would decrease the role of
private schools:
1. Privat schools are socially divisive along income lines, creamingthe stu nts from higher income backgrounds, and segregatingthem into elite schools (chapter 3).
The evidence on this premise works in two directions. First,
among the three major sectors, the other private schools contain students
from somewhat higher income backgrounds and the Catholic schools contain
students from slightly higher income backgrounds than the public schools.
The differences are primarily at the highest and lowest income levels,
with all three sectors having a majority of students in a broad middle
income category ranging from $12,000 to $33,000 a year, and similar
proportions at different levels within this range. Second, the internal
segregation by income within each sector goes in the opposite direction,
with the public sector showing slightly higher income segregation than
either the Catholic or other private sectors. However, income segrega-
tion is not high within any sector. The end result of these two forces
acting in opposite directions is that U.S. schools as a whole show
slightly greater segregation by income than would be the case if private
school students of differing income leveAS were absorbed into the public
schools in the same way that public school students of differing income
levels are currently distributed among schools.
2. Private schools are divisive along religious lines, segregatingdifferent religious groups into different schools (chapter 3).
The evidence is strong that this is true. Besides the 30 percent
of private schools that are Catholic, enrolling 66 percent of all private
school students, 25 percent of private schools, enrolling 12 percent
of private school students, are affiliated with other religious denominations.
Examining religious segregation solely in the Catholic/non-Catholic
dimension, the report shows thatthe great majority of Catholics are
in public schools, but that over 90 percent of the students in Catholic
schools are Catholic. Within each sector, the Catholic/non-Catholic
segregation is least in the Catholic schools themselves, greatest in
the other private schools. The overall impact of the between-sector
segregation and the differing segregation within sectors is, as might
xxiv
be expected, thar schools in the United States are more segregated along
Catholic/non-Catholic lines than they would be if private school students
were absorbed into the public schools.
3. Private schools are divisive along racial lines, in two ways:they contain few blacks or other minorities, and thus segregatewhites in private schools from blacks in public schools; and theprivate sector itself is more racially segregated than the publicsector (chapter 3).
The evidence shows that the first of these premises is true
with respect to blacks but not with respect to Hispanics and that the
second is not true with respect to blacks or Hispanics. The end result
with respect to Hispanics is that the segregation of U.S. schools is
little different from what it would be if there were no private schools.
Catholic schools enroll about half as high a proportion of blacks
as the public schools, and other private school_ only about a quarter
as high a proportion. Internally, however, the other private sector
is least racially segregated and the public sector by far the most
segregated. The end result of these two opposing forces, between-sector
and within-sector, is that the segregation of black and white students
in U.S. schools is no greater and no less than it would be if there
were no private schools, and their students were absorbed into the publi.:
sector, distributed among schools as public sector black and white students
are now distributed.
4. Private schools do not provide the educational range that publicschools do, part;.cularly in vocational and other nontraditionalcourses or programs (chapter 4).
The evidence on this premise is that it is correct. Schools
in both the Catholic and other private sectors provide primarily academic
programs and have few vocational or technical courses. Even in academic
areas, however, some of the smaller schools in the other private sector
have a limited range of subjects, as evidenced by the fact that 44 percent
of students in the other private sector are in schools with no third-
year foreign language courses. The lesser educational range of the
private sector is also shown by the more comprehensive character of
the high-performance public schools compared to the high-performance
private schools.
5. Private schools have a narrower range of extracurricularactivites, and thus deprive their students of participationin school activities outside the classroom (chapter 5).
This premise is almost the direct opposite of premise 7 on the
other side, so the answer is the same as was given there. Students
in Catholic and public schools show about the same amount of participation
in extracurricular activities, while students in other private schools
show more, and participation is higher for seniors than for sophomores
Thus this premise is not correct.
6. Private schools are unhealthily competitive, and thus publicschools provide a healthier affective development (chapter 5).
The report provides no direct evidence on this premise, but
the indirect evidence suggests that somethin3 like he reverse is true
for the comparison between the other private and public schools. Self-
esteem and fate control are both higher in other private schools than
in public schools, and the sophomore-senior gain is greater.
7. Facilltating the use of private schools aids whites more thanblacks and those better off financially at the expense of thoseworse off; as a result, it increases racial and economic segrega-tion (chapter 3).
An examination of the predicted effect of a $1,000 increase
in income for a7.1 income groups shows that this would increase the
proportion of blacks and Hispanics in the private sector, as well as
the proportion of students from lower income families. Because a tuition
tax credit or a school voucher would even more greatly facilitate private
xxvi
school enrollment for students from lower income families relative to
students from higher income families, we can expect that either of those
policies would even more greatly increase the proportion of blacks or
students from low-income backgrounds in the private sector (primarily
in the Catholic sector). If either of these policies failed to increase
the proportion of blacks or students from low-incomc: farolies in private
schools relative to that in the public schools, then overall, either
of these policies would provide greater financial benefit to whites
than to blacks, or to higher income than to lower income families, because
of the tuition reductions for parents of those students currettly enrolled
in the private sector. If one considers only new entrants into the
private sector, the evidence from the hypothetical experiment, together
with the fact that a tuition tax credit or voucher plan would likely
be more progressive in its effect than a $1,000 increase in income,
indicates that blacks, Hispanics, and low-income families would differen-
tially benefit. To consider the educational rather than the financial
benefits means to consider only the new entrants into the private sector,
for it is only their education that would be changed; thus blacks and
Hispanics would differentially benefit educationally.
The evidence indicates that facilitating use of private schools
through policies of the sort described above would not increase segregation
along racial or economic lines but would decrease it (though the evidence
indicates that religious segregation would increase). Such policies
would bring more blacks, Hispanics, and students from lower income back -4
grounds into the private schools, thus reducing the between-sector,sEgrega-
tion, and these students would be moving from a sector of high racial
segregation to a sector of low racial segregation, as well as from a
sector slightly higher in economic segregation to one slightly lower.
Additional results relevant to the olic question of facilitatin
or constraining use of public schools:
1 At middle and higher income levels, the increase in probability
of enrollment of blacks with increase in income is higher than that
of whites. At virtually all income levels, both the probability of
enrollment of Hispanic's and the increase in that probability with income
are higher than for non-Hispanic whites. Comparing Catholics with Catholics
and non-Catholics with non-Catholics shows that blacks have the highest
absolute rate of enrollment in Catholic schools, at low as well as high
income levels and ariong both Catholics and non-Catholics, while Hispanics
have the lowest rate. In other private schools, black enrollment is
low at all income levels except the very highest.
2. Catholic schools more nearly approximate the "common school"
ideal of American education than do public schools, in that the achieve-
ment levels of students from different parental educational backgrounds,
of black and white students, and of Hispanic and non-Hispanic white
students are more nearly alike in Catholic schools than in public schools.
In addition, the educational aspirations of students from different
parental educational backgrounds are more alike in Catholic than in
public schools. Comparing public and other private schools shows that
students in other private schools with parents of differing education
have greater differences in scholastic achievement, while public school
students with differing parental education have greater differences
in educational aspirations.
3. Important factors in bringing about higher scholastic achievement
in private schools than in public schools are the greater academic demands
and more ordered environment in the private schools (section 6.3).
The evidence shows not only that the sectors differ greatly on these
dimensions, but also that within the public schools students who are
better disciplined and are in schools with more ordered environments
achieve more highly.
It may or may not be useful to attempt to sum up the overall implica-
tions for the premises underlying policy arguments to facilitate or
constrain the use of private schools. Some of the premises on each
side are confirmed, some on each side are disconfirmed. It is hare',
however, to avoid the overall conclusion that the factual premises under-
lying policies that would facilitate use of private schools are much
better supported on the whole than those underlying policies that would
constrain their use. Or, to put it another way, the constraints imposed
on schools in the public sector (and there is no evidence that those
constraints are financial, compared with the private sector) seem to
impair their functiOning as educational institutions, without providing
the more egalitarian outcomes that are one of the goals of public schooling.
4
CHAPTER 1
INTRODUCTION
American elementary and secondary education has been overwhelmingly
education in public schools, supported by taxes and governed by local
school boards. There have been changes recently in the structure of
support and control, with state and Federal governments playing increasingly
important roles in both respects. But the overwhelmingly public-school
character of elementary and secondary education has remained largely
unchanged. For many years, the percentage of American children in private
schools has been in the neighborhood of 10 percent, as it is currently.
However, the role of private schools in American education has
emerged as an important policy question in recent years. Although any
answer to this question depends in part on values, it also depends on
facts - -facts that address such questions as: How well do public and
private schools work for children? Do they work differentially well
for different types of children? Are private schools divisive, and,
if so, along what lines? Are private schools more efficiently managed
than public schools, and, if so, why?
Recent policy discussions concerning private schools in the
United States have included, both proposals that would increase their
role in American education and proposals that would decrease their role.
On the increase side, there have been proposals for tuition tax credits
for private schools, and a bill to provide such credits was narrowly
defeated in Congress. At the state level, proposals for educational
vouchers have been discussed, and in California an attempt to get such
-2-
a proposal on the ballot for referendum was made recently. On the de-
crease side, the Internal Revenue Service recently proposed that a
racial composition requirement, more restrictive than that imposed on
most public schools, be a criterion for maintaining tax-exempt status.
This is one of a series of attempted policy interventions to constrain
the use of private schools by whites escaping a mandatory integration
program in the public schools.
These conflicting policy efforts are all based on certain as-
sumptions about the role of private and public schools in the United
States. Examining the assumptions, and showing the falsity of those
that are not correct, will not in itself resolve the policy questions
concerning the roles of public and private education in America. Those
policy questions include certain value premises as well, such as the
relative roles of the state and the family in controlling a child's
education. This examination will, however, strengthen the factual base
on which the policy conflicts are fought. To aid in doing this is the
aim of this report.
It is useful to begin the process by examining some of the most
widely held premises underlying policy proposals that would affect the
role of private education in the United States. It is these premises,
not the policy proposals, for which research like this can provide
information.
Premises underlying policies that would increase the role of
private schools:
1. Private schools produce better cognitive outcomes than do publicschools with comparable students.
2. Private schools provide better character and personality de-velopment than do public schools.
-3-
3. Private schools provide a safer, more disciplined, and moreordered environment than do public schools.
4. Private schools are more successful in creating an interestin learning than are public schools.
5. Private schools encourage interest in higher education and leadmore of their students to attend college than du public schoolswith comparable students.
1
6. Private schools are smaller, and thus bring about greater de-grees of participation in sports and other activities thando public schools.
7. Private schools have smaller class sizes, and thus allow teachersand students to have greater contact.
8. Private schools are more efficient than public schools, ac-complishing their educational task at lower cost.
Premises underlying policies that would decrease the role of
private schools:
1. Private schools are socially divisive along income lines, cream-ing the students from higher income backgrounds and segregatingthem in elite schools.
2. Private schools are divisive along religious lines, segregatingreligious groups in separate schools.
3. Private schools are divisive along racial lines, in two ways:they contain few blacks or other minorities, and thus segre-gate whites in private schools from blacks in public schools;and the private sector itself is more racially segre -.gated than the public sector.
4. Priv..ite schools do not provide the educational range that pub-lic schools do, especially in vocational and other nontradi-tional courses or programs.
5. Private schools have a narrower range of extracurricularactivities, and thus deprive their students of participationin school activities outside the classroom.
6. Private schools are unhealthily competitive, and thuspublic schools provide a healthier affective development.
7. Facilitating the use of private schools aids whites more thanblacks and those better off financially at the expense of thoseworse off; as a result, it increases racial and economic segregation.
1Some authors go so far as to argue that private schools reduce
crime, through reducing either in-school crime (a significant portionof teen-age crime) or out-of-school crime (see West 1980 and Lottand Fremling 1980).
0
-4-
tome of these premises underlying school policies are held by
policy-makers whose decisions affect the relative roles of private and
public schools in America, and some are held by parents who choose
between private and public schools for their children. Thus information
on the correctness of these premises is useful not only for educational
policy-making in a nation, state, or city, but also for parental choice..
Parents have a good deal of direct information on some of the questions
implicit in these premises (such as the level of discipline imposed in
the public and private schools in their locale), but almost no information
on others.
The current study, at its present stage, can provide better
information on some of these questions than on others, because different
questions require information about different aspects of schools. Some
of the questions concern the effects of schools on students within them.
Premises 1, 2, 4, and 5 from the first list and number 6 from the second
list raise questions of this sort. These questions are the most difficult
to answer, because the experimental design implicit in most of these
questions (the same child in a public school or a private school would
develop differently) is not possible in practice. Consequently, statistical
analyses must be substituted for an experimental design, and such analyses
are always subject to problems of inference. If data from more than
one point in a child's school career are available, the statistical
analysis is more powerful, and some of the problems of inference are
eliminated. Such data do not now exist in this study, although they
will be available for the sophomores in two years. For the present,
substitute statistical techniques are used, some of which make use of
the fact that information is available on two cohorts. These statistic:-
techniques will be discussed at appropriate points.

-5-
A second set of the questions requires information on the dis-
tribution of students among schools. Premises 1, 2, and 3 from the
second list are of this sort. Obtaining such information is much less
problematic than obtaining information on effects of schools. It is
directly available for the sample of schools and sample of students
in the study. The only inferential problem is estimation of the character-
istics of all U.S. schools from those of the sample. Because these
samples were drawn with known probabilities from the universe of U.S.
schools of different types, this estimation can be carried out without
difficulty.
There is, however, sometimes a question of another type lurking
behind those of simple student distribution: What effect would a policy
that increased or decreased the number of students in private schools
have on the distribution of students? For example, the question might
be raised: What would be the effect of tuition tax credits on racial
segregation in the schools? Premise number 7 in the second list raises
a question of this sort.
The'answers to this kind of underlying question are not so
directly accessible as the answer to the simple question of the current
distribution of students. There are additional problems of inference
involved, which means that these questions can be answered with less
certainty than the questions about current distribution.1
A third type of question involves comparing characteristics
of the public and private schools themselves. These characteristics
1An illustration of the difficulty of answering such questions
conclusively is provided by recent and continuing conflicts over theanticipated effect of particular types Of court desegregation decisionson white flight, and thus on the resulting degree of racial segregationin the schools.
3.,
-6-
include both the resources of public and private schools and what goes
on in the schools. Premises 3, 6, 7, and 8 from the first list and
4 and 5 from the second are related to such questions. Information
about school resources .1 ...)out what goes on in the schools was reported
at various points in the school and student questionnaires, and, like
the information on distribution of students among the schools, is inferred
for U.S. schools as a whole simply by the inference from sample to universe.
These distinct sets of questions lend themselves nicely to
structuring a report designed to provide a broad overview of public
and private schools. Answers to these questions can be grouped into
four major divisions: the student composition of public and private
schools, the resources that go into public and private schools, the
functioning of public and private schools, and the outcomes of public
and private schooling. Or, put more simply, Who is in the schools?
What resources go into them? What goes on? and What comes out? These
four divisions, prefaced by a section on the geographic and size distribution
of public and private schools, constitute the four analytic chapters
of this report. A concluding chapter examines the premises outlined
here in light of the findings of the analyses.
A word is necessary on the classification of schools used in
the report. For much of the analysis, schools are classified not into
two sectors, but into three--public, Catholic, and other private schools.
This is done because Catholic schools constitute by far the largest
single group of private schools, and constitute a less diverse array
of schools than all pritrate schools taken together. It would be useful
to make various subdivisions among the other private schools, separating.
out the differeht religious subgroups and distinguishing the nonreligious
3
-7--
schools according to some criterion, but that is outside the scope of
this report. In further work with these data, carried out either by
us or by other analysts, some such distinctions will be possible, in
part because two special samples of schools were drawn: Cai.1-olic schools
that had high proportions (30 percent or more) of black students in
them, selected in addition to the representative sample of Catholic
schools; and a special sample of "high-performance" private schools-
the 11 private schools with the highest proportions of their graduating
student bodies listed as semi-finalists in the 1978 National Merit
Scholarship competition.1
In chapter 3 and parts of chapter 6 only the three sectors,
public, Catholic, and other private, are compared. However, in chapters
4, 5, and 6 (section 6.1), two additional sets of schools are included
in the comparison. These are the eleven high-performance private schools
mentioned above, and a set of twelve high-performance public schools?
These schools are included to provide extremes that can better illuminate
some of the research questions posed in the report. Because of the
way they were drawn, these schools do not represent any other than them-
selves; thus they are not "sectors" like the public, Catholic, and other
1A second criterion in selecting these schools was that no two
schools would be drawn from the same state. Only one school was eliminatedby this criterion. There is a submerged stratification in this modeof selection, since different norms for the National Merit Scholarshiptests are used in different states. The eleven schocils selecgpd bythis procedure do show broad geographic distribution. One of the elevenschools is Catholic, the other ten are non-Catholic.
2 The twelve high-performance public schools were selected inexactly the same way as the eleven high-performance private schools,except that they were chosen from the sample of 894 public schools afterthe sample was drawn and data collected. Because they were not drawnfrom the total population of U.S. public schools, whereas the high-performance private schools were drawn from the more than 6,000 privateschools in the country, the high-performance public schools are a some-what less select set.
-8-
private sectors.1
Further, the results reported for these high-performance
private and public schools cannot be generalized to a larger population
of schools or students, but they do suggest something about the character
of schools that produces high-achieving students.2
Note on statistical inference: Standard errors or other measures
that show sampling variation are not presented in the text of this report.
Information necessary for calculating approximate standard errors is given
in the appendix A, p. A-1.
1
When the high-performance private schools are separated outfrom the two major private sectors, the results for those sectors, whichare always reported in weighted form, are hardly affected by the loss,since the weights of the high-performance private schools, when part of'the'private school sample, are very small. Throughout this report, thetabulations and analyses for the Catholic and other private sectors donot include the specially sampled high-performance private schools,which, as explained above, affects the results for those sectors verylittle. The high-performance public schools are, however, included aspart of the public sector in all tabulations and analyses, since theywere drawn in the sample to represent particular strata including otherhigh schools. To be perfectly consistent the private school sectorsshould have included the high-performance private schools; and the separatetabulations for the high-performance public schools should not includein their weights any weight for schools other than themselves. As pointedout above, however, that would hardly affect results obtained in thisreport.
This probably constitutes a deficiency in the sample design inselection of the high-performance private schools. If the sample werebeing drawn again, we would prefer to see two subgroups like these,but representative of some identifiable segments of American privateand public schools.
CHAPTER 2
THE SIZE AND GEOGRAPHIC DISTRIBUTIONS OF PUBLIC AND
PRIVATE SECONDARY SCHOOLS
This chapter provides an overview.of the distribution of public
and private education in the United States, emphasizing how private
education is distributed geographically and a few general characteristics
of interest. These tabulations, unlike those in the remaining chapters
of the report, are based on data for all schools in the United States.
The data are from the UJRC 1978 school universe tape, which was develop.d
and compiled from several different sources.1
As observers have often noted, the diversity within the domain of
private education is in many respects greater than the differences between
1The NORC school universe file was created from the following
sources:a) A school universe file for fall 1978, prepared by the Curriculum
Information Center, Denver, Colorado, a private organizationb) A public school universe file for Fall 1978 constructed by the
National Center for Education Statistics from the Fall 1978Survey of Public Schools
c) A private school universe file for fall 1978 prepared undercontract to the National Center for Education Statistics
d) A supplementary U.S. Civil Rights Commission file of a largesample of public schools in the United States, fall 1976
Bec.nuse file (a) was the most complete file, grade spans and enrollmentswere used from that file if the school was on that file. Files b, c,and d were used to augment thii file.
Because of the different source material, total numbers of schoolsand total enrollment differ slightly from those published in the 1978Fall Enrollment Survey for public schools, and from the NCES Bulletin80-B01 for private schools. No correction has been made for the changein cohort size between 1978 and 1979.
The Curriculum Information Center file contained no informationon type of private school beyond the Catholic vs. non-Catholic classifi-cation. Consequently, iu some tables of this chapter, a "private, non-Catholic unclassified category will be shown, consisting of the non-Catholic schools that did not appear in tre NCES private school universefile.
-10-
public and private education in general. This diversity should of course
not be lost sight of, but neither should it obscure the fact that for
some purposes it is necessary to consider the private sector of American
secondary education as a whole. This is particularly the case as private
schools become increasingly implicated in government policies in education.
Policies at the Federal and state levels that explicitly relate to private
education are a relatively recent phenomenon, and information that can
aid these policies is only slowly coming into existence.
To provide a general understanding of private schools while
retaining a part of the diversity that is present among them, most of
the analyses in this report treat private education in two broad sectors- -
Catholic and non-Catholic (or "other private," as the latter are termed).
(These two are augmented by a third set, a group of specially selected
high-performance schools referred to in chapter 1.) In this chapter,
however, there is an effort to present some of the diversity that is
lost with this dichotomization of private schools. In the next section,
the classification of school types is expanded to include a breakdown
of the "other private" category into "religious-affiliated" and "non-
religious-affiliated" for comparision of public and private schools
along geographic and enrollment lines. Then, in the second part of
this chapter, where the focus shifts to selected characteristics of
private secondary schools, additional distihctions within the religious-
affiliated category are introduced to indicate some of the variability
to be found there.
3
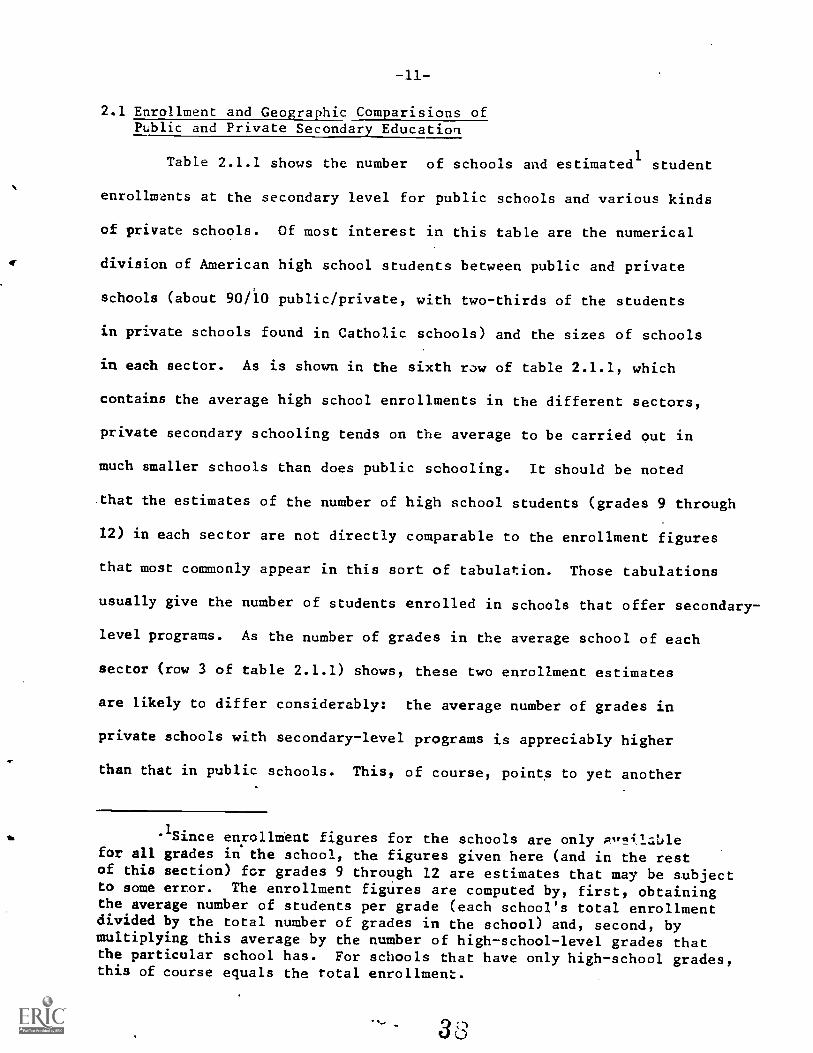
2.1 Enrollment and Geographic Comparisions ofPLblic and Private Secondary Education
Table 2.1.1 shows the number of schools and estimated1
student
enrollments at the secondary level for public schools and various kinds
of private schools. Of most interest in this table are the numerical
division of American high school students between public and private
schools (about 90/10 public/private, with two-thirds of the students
in private schools found in Catholic schools) and the sizes of schools
in each sector. As is shown in the sixth row of table 2.1.1, which
contains the average high school enrollments in the different sectors,
private secondary schooling tends on the average to be carried out in
much smaller schools than does public schooling. It should be noted
that the estimates of the number of high school students (grades 9 through
12) in each sector are not directly comparable to the enrollment figures
that most commonly appear in this sort of tabulation. Those tabulations
usually give the number of students enrolled in schools that offer secondary-
level programs. As the number of grades in the average school of each
sector (row 3 of table 2.1.1) shows, these two enrollment estimates
are likely to differ considerably: the average number of grades in
private schools with secondary-level programs is appreciably higher
than that in public schools. This, of course, points to yet another
1Since enrollment figures for the schools are only P,n4lablefor all grades in the school, the figures given here (and in the restof this section) for grades 9 through 12 are estimates that may be subjectto some error. The enrollment figures are computed by, first, obtainingthe average number of students per grade (each school's total enrollmentdivided by the total number of grades in the school) and, second, bymultiplying this average by the number of high-school-level grades thatthe particular school has. For schools that have only high-school grades,this of course equals the total enrollment.
33
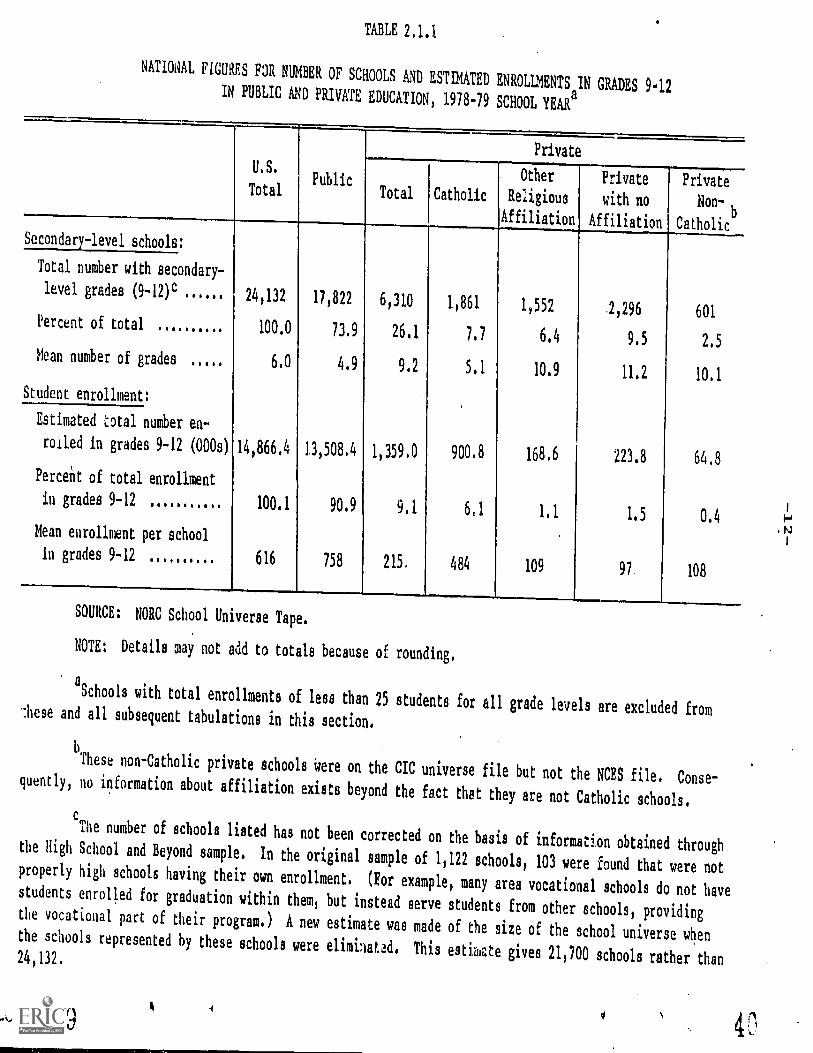
TABLE 2.1.1
NATIONAL FIGURES FOR NUMBER OF SCHOOLS AND ESTIMATED ENROLLMENTS IN GRADES 9.12IN PUBLIC AND PRIVATE EDUCATION, 1978-79 SCHOOL YEARa
U.S.
Total
Private
PublicTotal Catholic
Other
Religious
Affiliation
Private
with no
Affiliation
Private
Non-b
Catholic
Secondary-level schools:
Total number with secondary-
level grades (9-12) c 24,132 17,822 6,310 1,861 1,552 1,296 601Percent of total 100.0 73.9 26.1 7.7 6.4 9,5 2.5
Mean number of grades 6.0 4.9 9,2 5.1 10.9 11,2 10.1
Student enrollment:
Estimated total number en-
rolled in grades 9-12 (000s) 14,866,4 13 508.4 1,359.0 900.8 168.6 223.8 64,8
Percent of total enrollment
in grades 9-12 ....... 100.1 90.9 9,1 6.1 1,1 1.5 0,4
Mean enrollment per school
in grades 9-12 616 758 215, 484 109 97 108
SOURCE: NORC School Universe Tape.
NOTE: Details may not add to totals because of rounding.
a
Schools with total enrollments of less than 25 students for all grade levels are excluded from'these and all subsequent
tabulations in this section.
b
These non-Catholic private schools were on the CIC universe file but not the NCES file, Conse-quently, no informationabout affiliation exists beyond the fact that they are not Catholic schools,
:The number of schools listed has not been corrected on the basis of information obtainedthroughthe High School and Beyond sample. In the original sample of 1,122 schools, 103 were found that were not
properly high schools having their own enrollment. (For example, many area vocational schools do not havestudents enrolled for graduation within them, but instead serve students from other schools, providingthe vocational part of their program.) A new estimate was made of the size of theschool universe whenthe schools represented by these schools were eliminatad. This estivate gives 21,700 schools rather than24,132.
31
-13-
sort of divers.Ity, not discussed here, that research might examine-
the differences in the age ranges of the average public and private
school student's schoolmates.
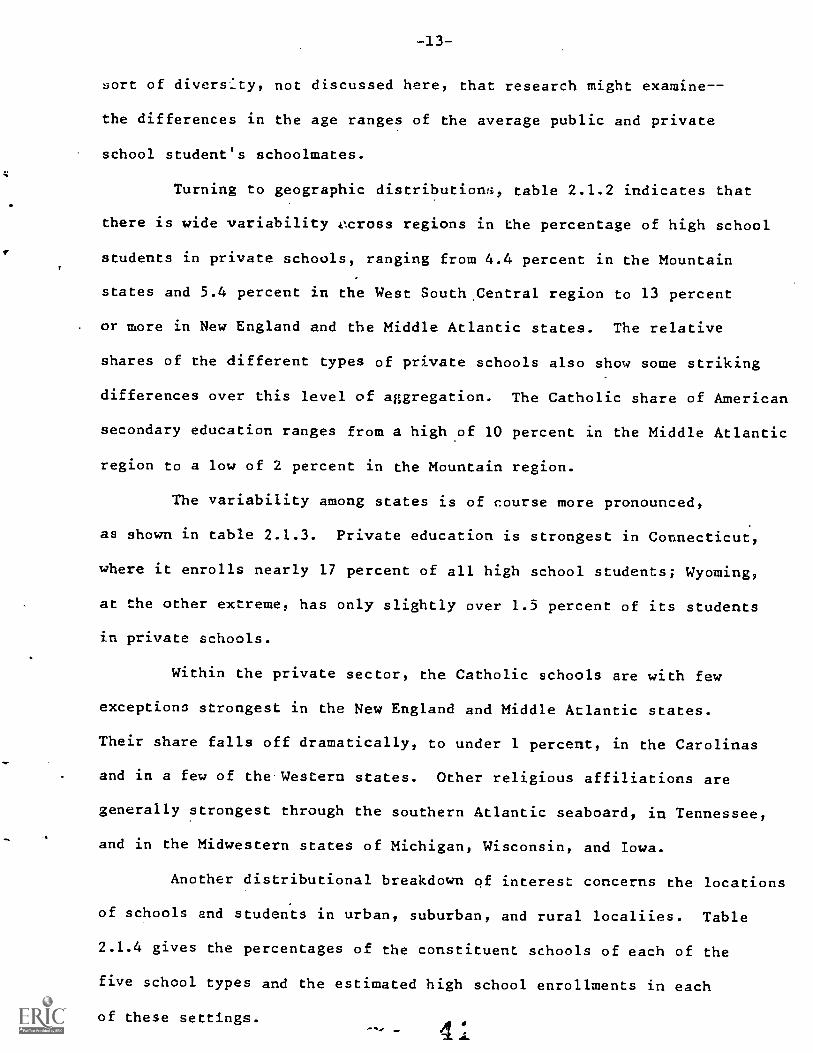
Turning to geographic distributions, table 2.1.2 indicates that
there is wide variability ecross regions in the percentage of high school
students in private schools, ranging from 4.4 percent in the Mountain
states and 5.4 percent in the West South.Central region to 13 percent
or more in New England and the Middle Atlantic states. The relative
shares of the different types of private schools also show some striking
differences over this level of aggregation. The Catholic share of American
secondary education ranges from a high of 10 percent in the Middle Atlantic
region to a low of 2 percent in the Mountain region.
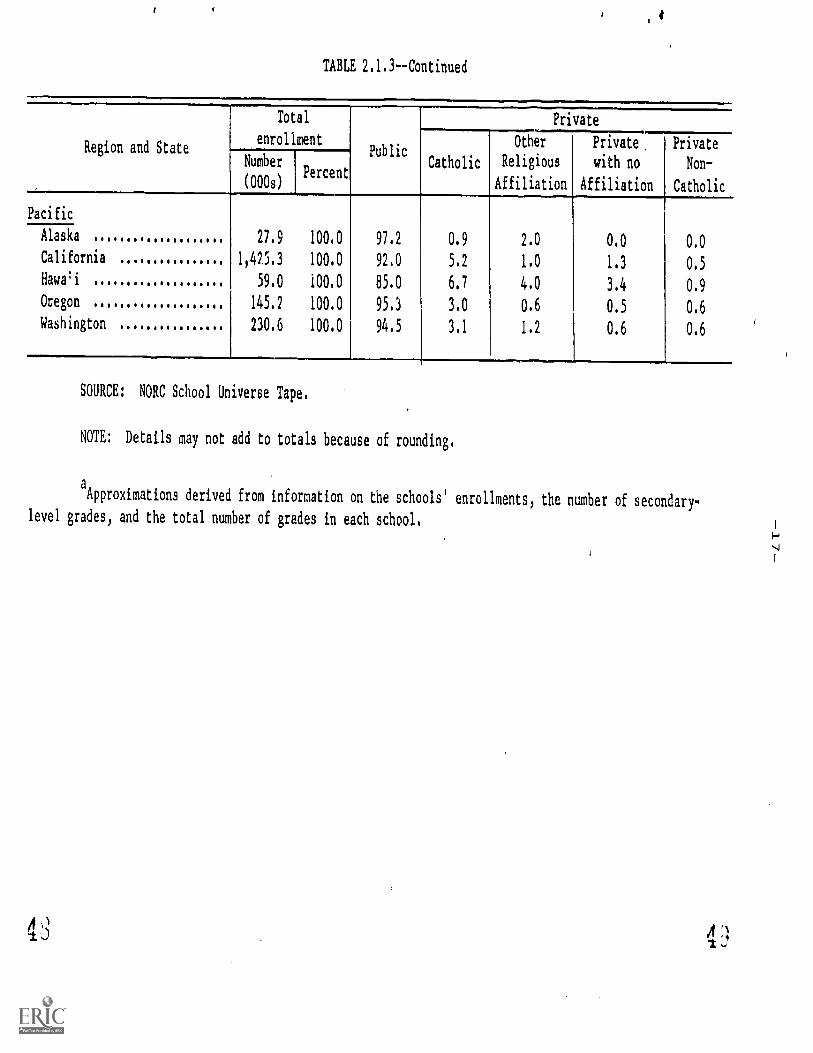
The variability among states is of course more pronounced,
as shown in table 2.1.3. Private education is strongest in Connecticut,
where it enrolls nearly 17 percent of all high school students; Wyoming,
at the other extreme, has only slightly over 1.5 percent of its students
in private schools.
Within the private sector, the Catholic schools are with few
exceptions strongest in the New England and Middle Atlantic states.
Their share falls off dramatically, to under 1 percent, in the Carolinas
and in a few of the Western states. Other religious affiliations are
generally strongest through the southern Atlantic seaboard, in Tennessee,
and in the Midwestern states of Michigan, Wisconsin, and Iowa.
Another distributional breakdown of interest concerns the locations
of schools and students in urban, suburban, and rural localiies. Table
2.1.4 gives the percentages of the constituent schools of each of the
five school types and the estimated high school enrollments in each
of these settings._ 4
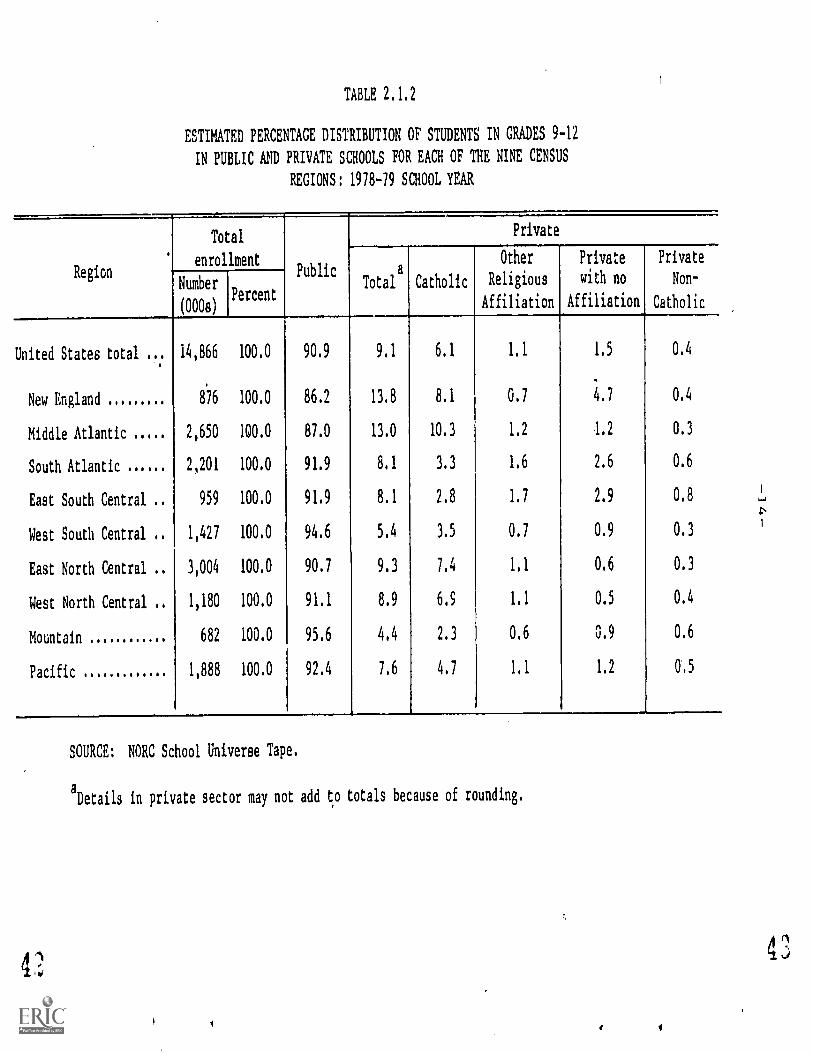
TABLE 2.1.2
ESTIMATED PERCENTAGE DISTRIBUTION OF STUDENTS IN GRADES 9-12
IN PUBLIC AND PRIVATE SCHOOLS FOR EACH OF THE NINE CENSUS
REGIONS: 1918 -79 SCHOOL YEAR
Region
Total
enrollmentPublic
Private
Total CatholicCatholic
Other
Religious
Affiliation
Private
with no
Affiliation
Private
Non
Catholic
Number
(000s)
United States total ..: 14,866 100.0 90.9 9.1 6,1 1.1 1.5 0.4
New England 876 100.0 86.2 13.8 8.1 0.7 4.7 0.4
Middle Atlantic 2,650 100.0 87.0 13.0 10.3 1.2 1.2 0.3
South Atlantic 2,201 100.0 91.9 8.1 3,3 1.6 2.6 0.6
East South Central 959 100.0 91.9 8.1 2.8 1.7 2.9 0.8
West South Central 1,427 100.0 94.6 5.4 3.5 0.7 0.9 0.3
East North Central 3,004 100.0 90.7 9.3 7.4 1,1 0.6 0.3
West North Central 1,180 100.0 91.1 8.9 6.3 1.1 0.5 0.4
Mountain 682 100.0 95.6 4.4 2.3 0.6 0.9 0.6
Pacific 1,888 100.0 92.4 7.6 4.7 1.1 1.2 0.5
SOURCE: NORC School Universe Tape.
aDetails in private sector may not add to totals because of rounding.
4'
0
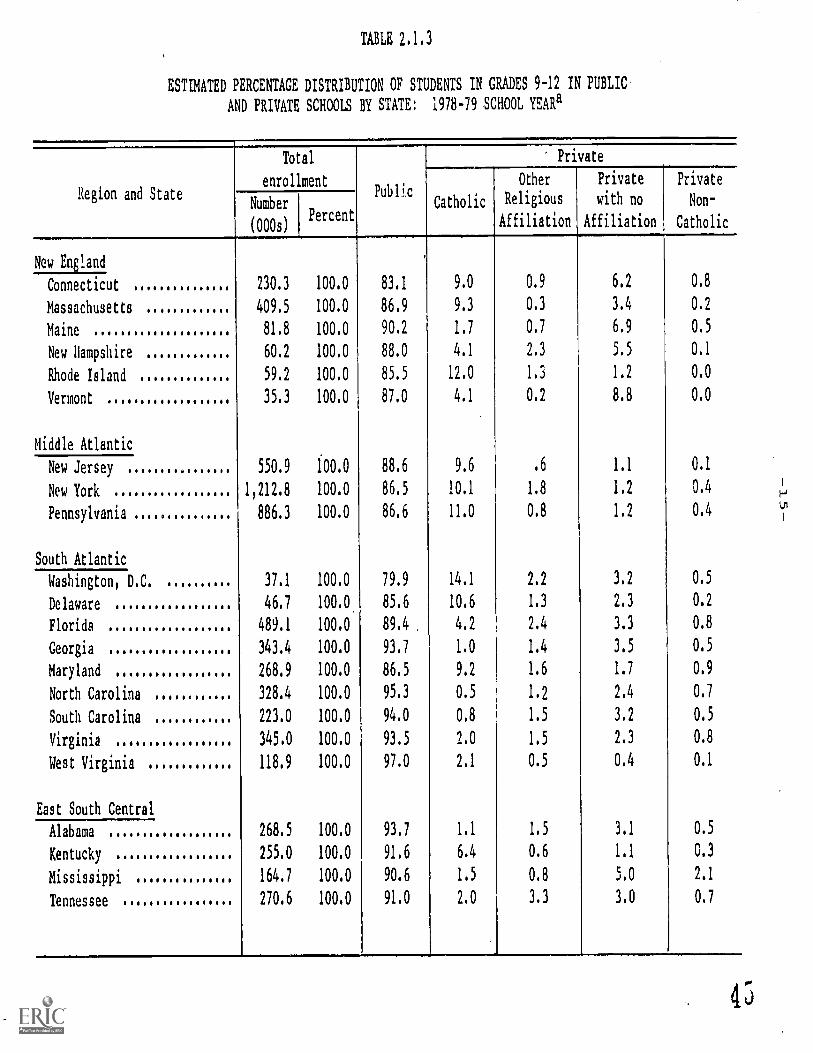
TABLE 2.1.3
ESTIMATED PERCENTAGE DISTRIBUTION OF STUDENTS IN GRADES 9-12 IN PUBLIC
AND PRIVATE SCHOOLS BY STATE: 1978-79 SCHOOL YEARa
Region and State
Total
enrollmentPubl.c
Private
Catholic
Other
Religious
Affiliation
Private
with no
Affiliation
Private
Non
Catholic
Number
(000s)Percent
New England
Connecticut 230.3 100.0 83.1 9.0 0.9 6.2 0.8
Massachusetts 409.5 100.0 86.9 9.3 0.3 3.4 0,2
Maine 81.8 100.0 90.2 1.7 0.7 6.9 0.5
New Hampshire 60.2 100.0 88.0 4.1 2.3 5.5 0.1
Rhode Island 59.2 100.0 85.5 12.0 1.3 1.2 0.0
Vermont 35.3 100.0 87.0 4.1 0.2 8.8 0.0
Middle Atlantic
New Jersey 550.9 100.0 88.6 9.6 .6 1.1 0.1
New York 1,212.8 100.0 86.5 10.1 1.8 1.2 0.4
Pennsylvania 886.3 100.0 86.6 11.0 0.8 1.2 0.4
South Atlantic
Washington, D.C. 37.1 100.0 79.9 14.1 2.2 3.2 0.5
Delaware 46.7 100.0 85.6 10,6 1.3 2,3 0.2
Florida 489.1 100.0 89.4 4.2 2.4 3.3 0.8
Georgia 343.4 100.0 93.7 1.0 1.4 3.5 0.5
Maryland 268.9 100.0 86.5 9.2 1.6 1.7 0.9
North Carolina 328.4 100.0 95.3 0.5 1.2 2.4 0.7
South Carolina 223.0 100.0 94.0 0.8 1.5 3.2 0.5
Virginia 345.0 100.0 93.5 2.0 1.5 2.3 0.8
West Virginia 118,9 100.0 97.0 2.1 0.5 0.4 0.1
East South Central
Alabama 268.5 100.0 93.7 1,1 1.5 3.1 0.5
Kentucky 255.0 100.0 91.6 6.4 0.6 1.1 0.3
Mississippi 164.7 100.0 90.6 1.5 0.8 5.0 2.1
Tennessee 270.6 100.0 91.0 2.0 3.3 3.0 0.7
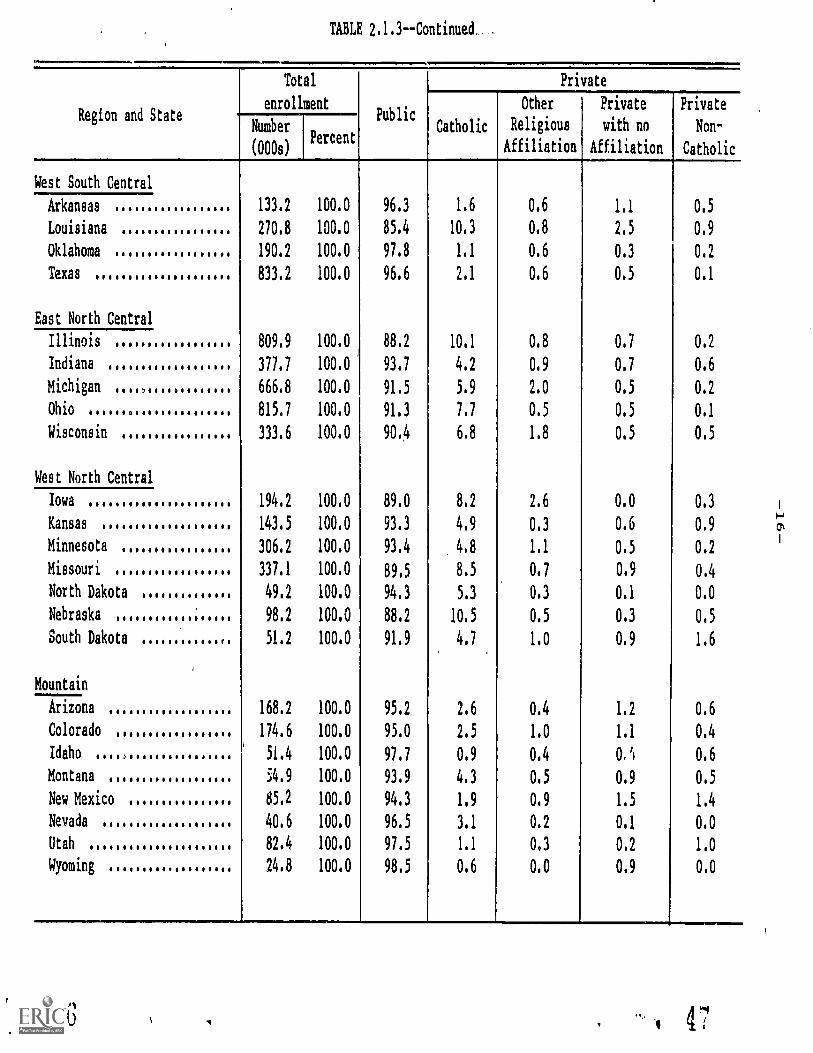
TABLE 2.1.3-Continued
Region and State
Total
enrollment
NumberPercent
(000s)
Public
Private
Other Private Private
Catholic Religious with no Non-
Affiliation Affiliation Catholic
West South Central
Arkansas
Louisiana
Oklahoma
Texas
East North Central
Illinois
Indiana
Michigan
Ohio
Wisconsin
West North Central
Iowa
Kansas
Minnesota
Missouri
North Dakota
Nebraska
South Dakota
Mountain
Arizona
Colorado
Idaho
Montana
New Mexico
Nevada
Utah
Wyoming
133.2 100.0 96.3
270.8 100.0 85.4
190.2 100.0 97.8
833.2 100.0 96.6
1.6
10.3
1.1
2.1
809.9 100,0 88.2 10.1
377.7 100.0 93.7 4.2
666.8 100.0 91.5 5.9
815.7 100.0 91.3 7.7
333.6 100.0 90.4 6.8
194.2 100.0 89.0 8.2
143.5 100.0 93.3 4.9
306.2 100.0 93.4 4.8
337.1 100.0 89,5 8.5
49.2 100.0 94.3 5.3
98.2 100.0 88.2 10.5
51.2 100.0 91.9 4.7
168.2 100.0 95.2 2.6
174.6 100.0 95.0 2.5
51.4 100.0 97.7 0.9
54.9 100.0 93.9 4.3
85.2 100.0 94.3 1.9
40.6 100.0 96.5 3.1
82.4 100.0 97.5 1.1
24.8 100.0 98.5 0.6
0.6
0.8
0.6
0.6
0.8
0.9
2.0
0.5
1.8
2.6
0.3
1.1
0.7
0.3
0.5
1.0
0.4
1.0
0.4
0.5
0.9
0.2
0.3
0.0
1.1
2.5
0.3
0.5
0.7
0.7
0.5
0.5
0.5
0.0
0.6
0.5
0.9
0.1
0.3
0.9
1.2
1.1
0.9
1.5
0.1
0.2
0.9
0.5
0.9
0.2
0.1
0.2
0.6
0.2
0.1
0.5
0.3
0.9 0
0.2
0.4
0.0
0.5
1.6
0.6
0.4
0.6
0.5
1.4
0.0
1,0
0.0
i
TABLE 2.1,3-Continued
0
Region and State
Total
enrollmentPublic
Private
Catholic
Other
Religious
Private,
with no
Private
Non -Number
(000s) Affiliation Affiliation Catholic
Pacific
Alaska 27.9 100.0 97.2 0.9 2.0 0.0 0.0
California 11475.3 100.0 92.0 5.2 1.0 1.3 0.5
Hawa'i 59.0 100.0 85.0 6.7 4.0 3.4 0.9
Oregon 145.2 100.0 95.3 3.0 0.6 0.5 0.6
Washington 230.6 100.0 94.5 3.1 1.2 0.6 0.6
SOURCE: NORC School Universe Tape.
NOTE; Details may not add to totals because of rounding.
a
Approximations derived from information on the schools' enrollments, the number of secondary-
level grades, and the total number of grades in each school,
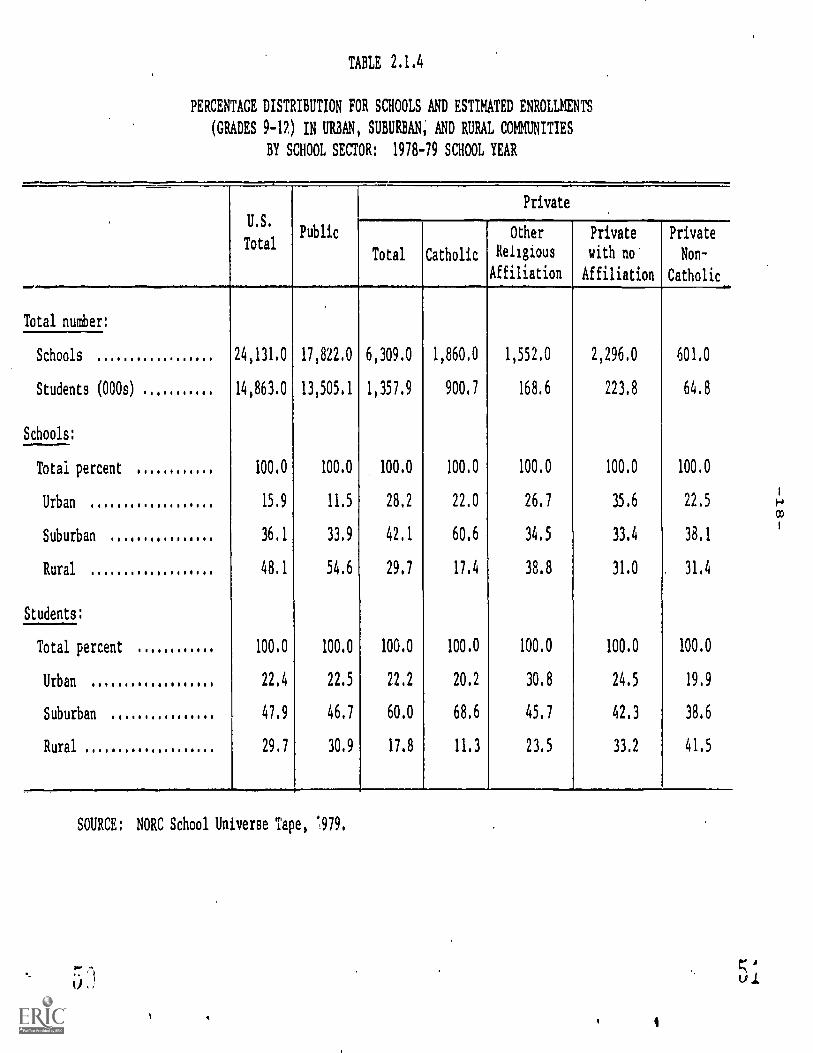
TABLE 2.1.4
PERCENTAGE DISTRIBUTION FOR SCHOOLS AND ESTIMATED ENROLLMENTS
(GRADES 9-12) IN URBAN, SUBURBAN, AND RURAL COMMUNITIES
BY SCHOOL SECTOR: 1978-79 SCHOOL YEAR
Private
U.S.Public Other Private Private
TotalTotal Catholic Religious with no Non-
Affiliation Affiliation Catholic- .
Total number:
Schools 24,131.0 17,822.0 6,309.0 1,860.0 1,552.0 2,296.0 601.0
Students (000s) 14,863.0 13,505.1 1,357.9 900.7 168.6 223.8 64.8
Schools:
Total percent 100.0 100.0 100.0 100.0 100.0 100.0 100.0
Urban 15.9 11.5 28.2 22.0 26,7 35.6 22,5
Suburban 36.1 33.9 42.1 60,6 34.5 33.4 38.1
Rural 48.1 54.6 29.7 17.4 38.8 31.0 31.4
Students:
Total percent 100.0 100.0 100.0 100.0 100.0 100.0 100.0
Urban 22,4 22.5 22.2 20.2 30.8 24.5 19.9
Suburban 47.9 46.7 60.0 68.6 45.7 42.3 38.6
Rural 29.7 30.9 17.8 11.3 23.5 33.2 41.5
SOURCE: NORC School Universe Tape, '979.
4
-
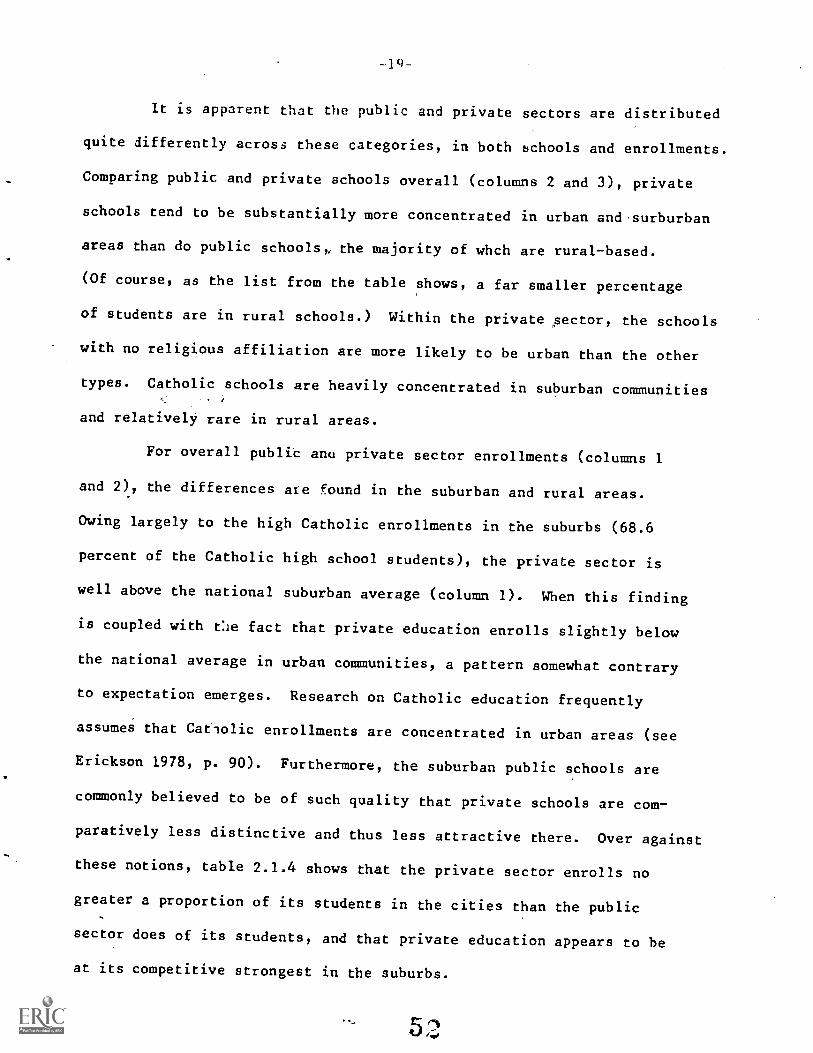
It is is apparent that the public and private sectors are distributed
quite differently across these categories, in both schools and enrollments.
Comparing public and private schools overall (columns 2 and 3), private
schools tend to be substantially more concentrated in urban and surburban
areas than do public schools, the majority of whch are rural-based.
(Of course, as the list from the table shows, a far smaller percentage
of students are in rural schools.) Within the private sector, the schools
with no religious affiliation are more likely to be urban than the other
types. Catholic schools are heavily concentrated in suburban communities
and relatively rare in rural areas.
For overall public anu private sector enrollments (columns 1
and 2), the differences are found in the suburban and rural areas.
Owing largely to the high Catholic enrollments in the suburbs (68.6
percent of the Catholic high school students), the private sector is
well above the national suburban average (column 1). When this finding
is coupled with Cie fact that private education enrolls slightly below
the national average in urban communities, a pattern somewhat contrary
to expectation emerges. Research on Catholic education frequently
assumes that Catiolic enrollments are concentrated in urban areas (see
Erickson 1978, p. 90). Furthermore, the suburban public schools are
commonly believed to be of such quality that private schools are com-
paratively less distinctive and thus less attractive there. Over against
these notions, table 2.1.4 shows that the private sector enrolls no
greater a proportion of its students in the cities than the public
sector does of its students, and that private education appears to he
at its competitive strongest in the suburbs.
-20-
2.2 Selected Attributes of Private Secondary Schools
While the analyses presented in this report are carried out
on private secondary education as a relatively undifferentiated whole
vis.4-vis public secondary education, further research is clearly needed
on the numerous lines of diversity within the private sector. The most
important distinctions that can be drawn here appear to be between the
religious- and not-religious-affiliated categories and, within the
religious-affiliated category, among the schools of the various faiths.
This section briefly examines a few of the more striking differences
found in the structural arrangements of some of these principal divisions
within private education.
Table 2.2.1 gives the numbers of schools and secondary enrollments
for the not-religious-affiliated and.the five largest religious-affiliated
categories. Although the numbers of schools in the two categories are
not greatly different, over 83 percent of the students are in religiously
affiliated schools. (For discussions of the historical and doctrinal
backgrounds of the various types of schools given in table 2.2.1, as
well as others not included here, see Kraushaar 1972 and Erickson 1978).
Table 2.2.2 shows the distribution of various types of schools,
classified by grade levels covered and curriculum. In general, the
table shows, for types of curriculum, that there are few vocational-
technical schools outside the public school system, but there are com-
parable percentages of special education schools and alternative schools,
with some of each to be found in all types of schools.
Finally, table 2.2.3 shows the percentage of male, female, and
coeducati)nal schools among private schools of all affiliations, and
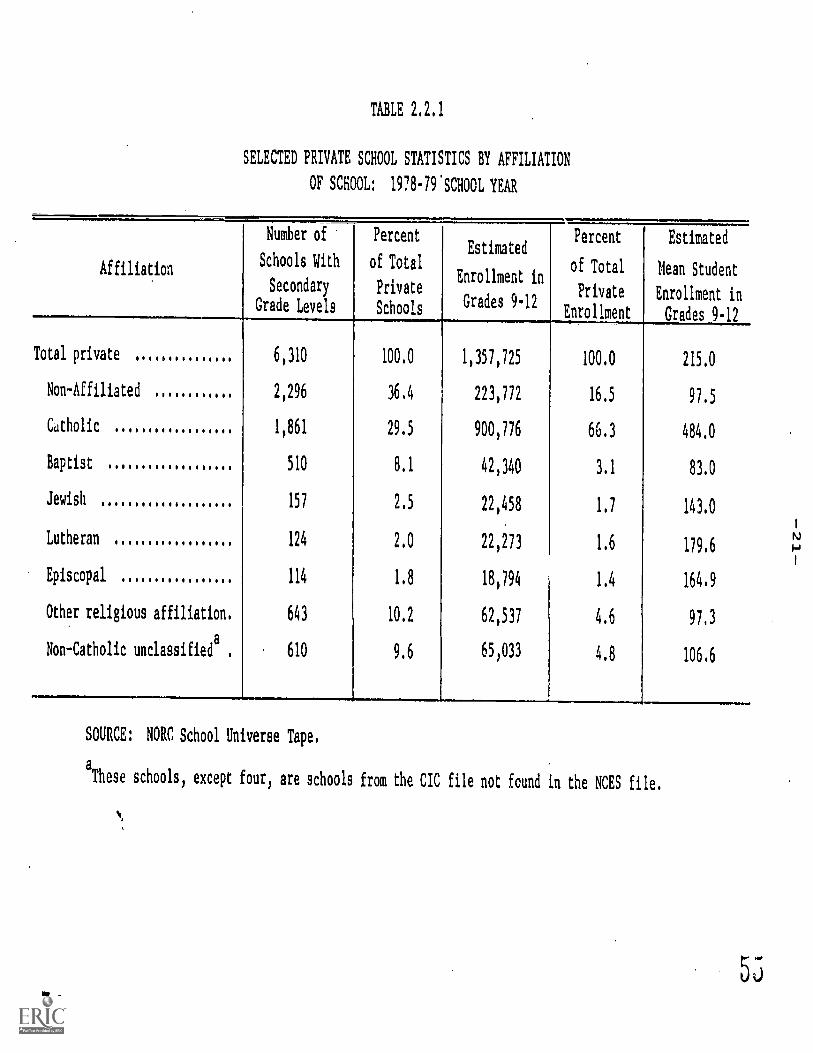
TABLE 2.2.1
SELECTED PRIVATE SCHOOL STATISTICS BY AFFILIATION
OF SCHOOL: 1978-79'SCHOOL YEAR
Affiliation
Number of
Schools With
SecoLevelndary
Grade s
Percent
of Total
Private
Schools
Estimated
Enrollment in
Grades 9-12
Percent
of Total
Private
Enrollment
Estimated
Mean Student
EnrEnrollment in
Grades 9-12
Total private 6,310 100.0 1,357,725 100.0 215.0
Non-Affiliated 2,296 36.4 223,772 16.5 97.5
Catholic 1,861 29.5 900,776 66.3 484.0
Baptist 510 8.1 42,340 3.1 83.0
Jewish 157 2.5 22,458 1.7 143.0
Lutheran 124 2.0 22,273 1.6 179.6
Episcopal 114 1.8 18,194 1.4 164.9
Other religious affiliation. 643 10.2 62,531 4.6 97,3
Non-Catholic unclassifieda . 610 9.6 65,033 4.8 106.6
SOURCE: NORC School Universe Tape.
a
These schools, except four, are schools from the CIC file not fcund in the NCES file.
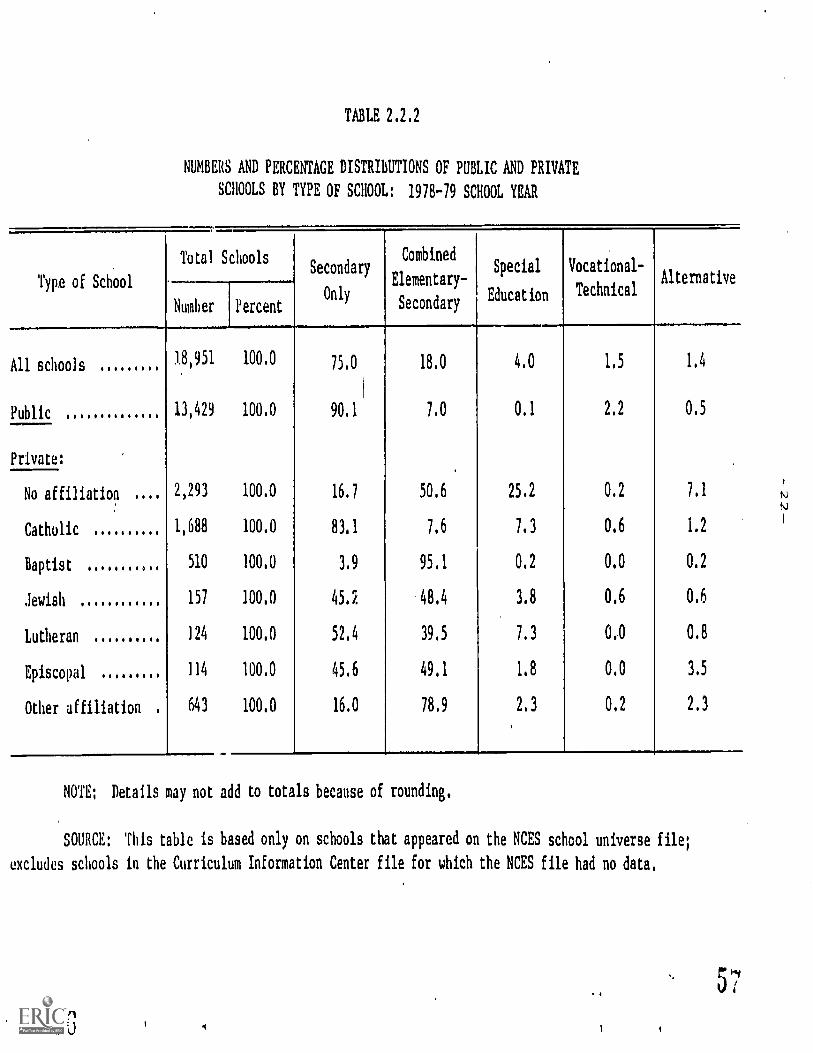
TABLE 2.2.2
NUMBERS AND PERCENTAGE DISTRIBUTIONS OF PUBLIC AND PRIVATE
SCHOOLS BY TYPE OF SCHOOL: 1978-79 SCHOOL YEAR
Type of School
Total SchoolsSecondary
Only
Combined
Elementary-
Secondary
Special
Education
Vocational-
TechnicalAlternative
Number Percent
All schools18,951 100.0 75.0 18.0 4.0 1.5 1.4
1
Public 13,429 100.0 90.1 7.0 0.1 2.2 0.5
Private:
No affiliation 2,293 100.0 16.7 50.6 25.2 0.2 7.1
Catholic 1,688 100.0 83.1 7.6 7.3 0.6 1.2
Baptist 510 100.0 3.9 95.1 0.2 0,0 0.2
Jewish 157 100.0 45.2 48.4 3.8 0.6 0,6
Lutheran ..... 124 100.0 52,4 39.5 7.3 0.0 0.8
Episcopal 114 100.0 45.6 49.1 1.8 0.0 3.5
Other affiliation . 643 100.0 16.0 78.9 2.3 0.2 2.3
NOTE; Details may not add to totals because of rounding.
SOURCE: This table is based only on schools that appeared on the NCES school universe file;
excludes schools in the Curriculum Information Center file for which the NCES file had no data.
57
53
-23-
table 2.2.4 the percentage of boarding schools among them. As indicated
earlier, the affiliation breakdowns used here are not used in later
chapters, which are based on the Nigh School and Beyond sample of schools
and students. These tables thus serve to give some sense of the kind
of schools contained within the private sector, especially the non-Catholic
private sector (or, as it is called later, the "other private" sector).'
1L)ata from NCES on private school enrollments for the 1978-79school ye-1r show that about 80 percent of all students who .attend private"secondary only" schools are in Catholic schools. The figure of 66percent given in table 2.2.1 reflects the fact that a great number ofprivate, non-Catholic high school students attend schools that areclassified as "combined elementary and secondary."
We are indebted to Roy Nehrts from NCES for the tabulationson private schools, and to the technical report of the Sage group(McLaughlin and Wise 1980).
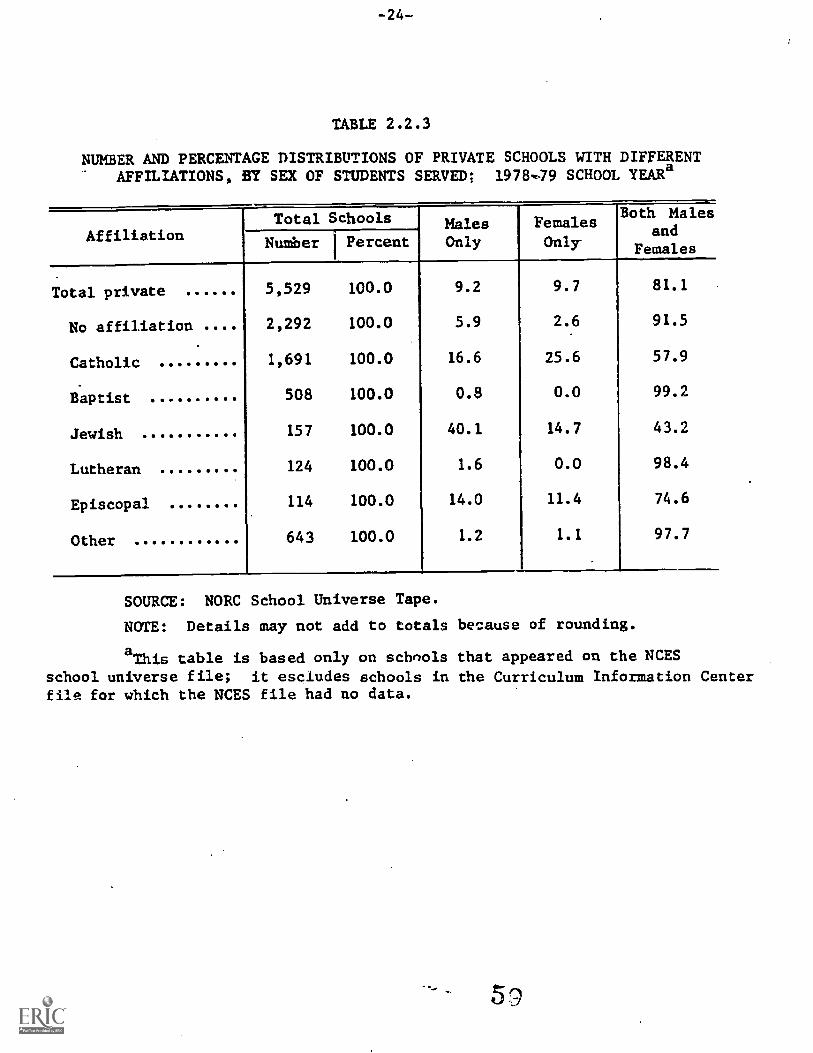
TABLE 2.2.3
NUMBER AND PERCENTAGE DISTRIBUTIONS OF PRIVATE SCHOOLS WITH DIFFERENTAFFILIATIONS, BY SEX OF STUDENTS SERVED; 1978.79 SCHOOL YEARa
AffiliationTotal Schools Males
OnlyFemalesOnly
Both Malesand
FemalesNumber 1 Percent
Total private 5,529 100.0 9.2 9.7 81.1
No affiliation 2,292 100.0 5.9 2.6 91.5
Catholic 1,691 100.0 16.6 25.6 57.9
Baptist 508 100.0 0.8 0.0 99.2
Jewish 157 100.0 40.1 14.7 43.2
Lutheran 124 100.0 1.6 0.0 98.4
Episcopal 114 100.0 14.0 11.4 74.6
Other 643 100.0 1.2 1.1 97.7
SOURCE: NORC School Universe Tape.
NOTE: Details may not add to totals because of rounding.
aThis table is based only on schools that appeared on the NCES
school universe file; it escludes schools in the Curriculum Information Centerfile for which the NCES file had no data.
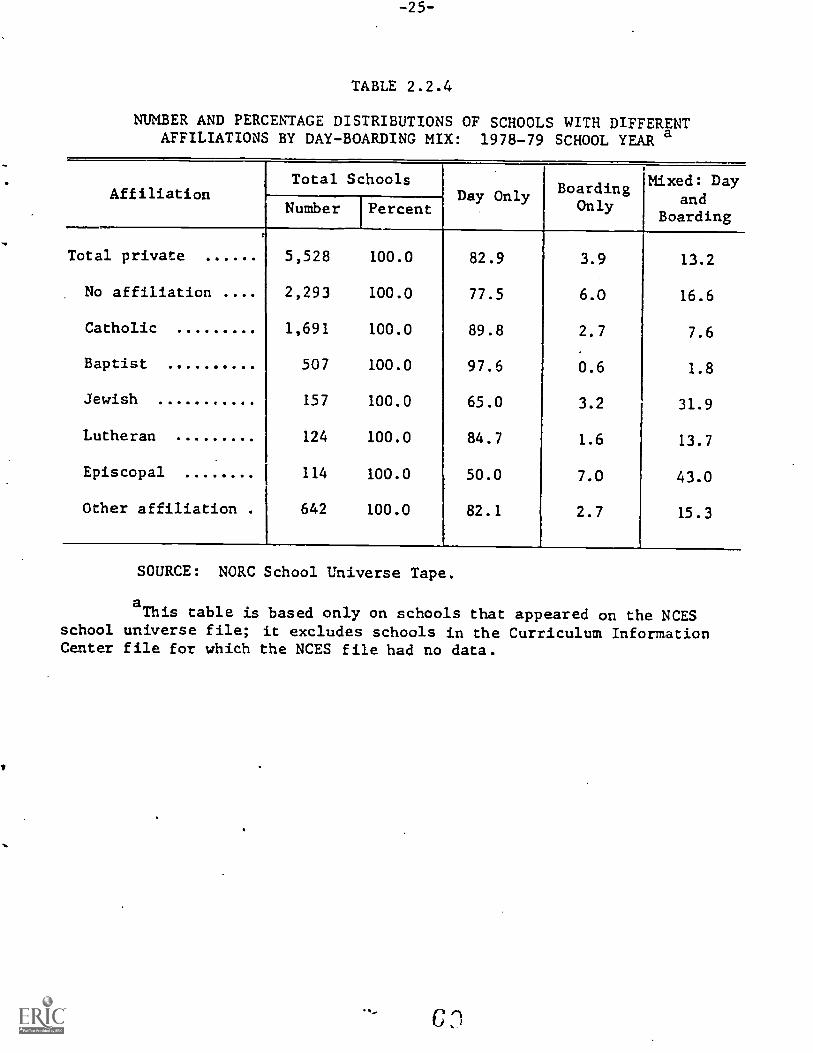
TABLE 2.2.4
NUMBER AND PERCENTAGE DISTRIBUTIONS OF SCHOOLS WITH DIFFERENTAFFILIATIONS BY DAY-BOARDING MIX: 1978-79 SCHOOL YEAR a
AffiliationTotal Schools
Day Only BoardingOnly
Mixed: Dayand
BoardingNumber Percent
r
Total private 5,528 100.0 82.9 3.9 13.2
No affiliation 2,293 100.0 77.5 6.0 16.6
Catholic 1,691 100.0 89.8 2.7 7.6
Baptist 507 100.0 97.6 0.6 1.8
Jewish 157 100.0 65.0 3.2 31.9
Lutheran 124 100.0 84.7 1.6 13.7
Episcopal 114 100.0 50.0 7.0 43.0
Other affiliation . 642 100.0 82.1 2.7 15.3
SOURCE: NORC School Universe Tape.
aThis table is based only on schools that appeared on the NCES
school universe file; it excludes schools in the Curriculum InformationCenter file for which the NCES file had no data.
CHAPTER 3
THE STUDENT COMPOSITION OF PUBLIC AND PRIVATE SCHOOLS
This chapter addresses a series of questions about the student
composition of public and private schools. A major criticism of poli-
cies designed to aid private education has been that private schools
tend to be divisive along economic, religious, and racial lines. This
has been perhaps the principal argument against such aid.
There are two wholly different issues of economic, religious,
and racial segregation raised by the existence of private schools.
The first, and the one to which most attention has been given, is the
segregation between the public sector and the private sector. The
second is the segregation that exists among schools within each sector.
Although these issues are different, they are related, for the
criticism that private schools are divisive along economic, religious,
or racial lines is a criticism that points to both forms of segregation.
First, the existence of a private school alternative allows those with
financial resources to segregate themselves from the remainder in public
school; second, the existence of choice among private schools facili-
tates segregation along these lines within the private sector itself.
If, for example, minorities who do attend private schools are concen-
trated in schools enrolling a small proportion of whites, then even
a large proportion of minority students in the private schools is hardly
a rebuttal to the charge that private education functions to increase
social divisiveness along racial lines.
-2 7-
Yet matters are not so clear as the criticism would suggest,
because choice exists within the public sector as well. Residential
mobility, the principal way in which such choice is exercised, has
increased over the years, and along with it the potential for families
with sufficient resources to segregate their children from others,
wholly within the public sector. Thus an examination of these issues
is not merely to, document the obvious. It is rather to examine segre-
gating tendencies as they are manifested both within and between the
sectors of education. For each issue area, then, the analysis begins
with a comparison of segregation between sectors and moves on to a
comparison of within-sector segregation. The basic method used for
assessing the extent of within-sector segregation is described in
appendix A.
In addition to the issues related to the racial and ethnic,
economic, and religious compositions of private and public schools,
a fourth substantive area, one that has been growing in importance in
recent years, is addressed in this chapter: the education of handi-
capped children. Following the presentation on the other three issue
areas are summary tables and a brief discussion of the role of the
private sector in the education of the handicapped.
Finally, it is possible to make some predictions about the
impact on segregation of potential policy changes that would draw stu-
dents from the public sector into the private sector, or, conversely,
changes that would draw more students into the public sector. Such
predictions are made for racial and ethnic segregation and for economic
segregation.
3.1 The Racial and Ethnic Backgrounds ofPublic and Private School Students
Issues related to the racial and ethnic compositions of the
private schools constitute a major component of the controversy surrounding
private education. Opposition to policies designed to facilitate private
education is frequently based on the assumption that the private schools
function as a means for whites to escape the racial integration that
has been imposed in the public sector. As evidence of the segregating
role that private education plays, critics assert that private schools
on the whole enroll proportionately smaller numbers of minority students,
particularly blacks and Hispanics.
Past research supports this claim. Kraushaar's (1972) survey
of 251 private secondary schools found that, overall, less than 5 percent
of the total enrollment was of racial or ethnic minority status. None-
theless, supporters of private education assert that serious efforts
have been made in recent years throughout a large segment of the private
sector to reduce the underenrollment of minorities.
The High School and Beyond survey was designed to provide accu-
rate representation of the black and Hispanic student population in
American secondary education. The two-stage probability sample that
was employed drew schools as the first-stage unit and a random sample
of students within the selected schools as the second stage. Oversam-
piing was carried out on seven types of schools, four of which were
included to facilitate analyses concerned with black or Hispanic stu-
dents. The normally sampled public schools Lncluded school racial
composition as one of the stratification criteria.
-29-
Table 3.1.1 shows the distribution of white, ',lack, and Hispanic
students among the three school types, as well as the distributions
for the sophomore and senior classes.1
As prior research and public
opinion lead us Zlo expect, blacks are proportionately overrepresented
in the public sector and underrepresented in the private sector. Aver-
aging over grades 10 and 12 shows that the percentage of blacks in Catholic
schools is a little under half that in .,:he public schools, while the
percentage of blacks in the other priviite schools is only about a fourth
that in the public schools. The percentage of Hispanics in the private
schools is much closer to that in the public schools than is the case
for blacks. The percentage in the Catholic schools is as great as that
in the public schools, and the percentage in the other private.schools
is about two-thirds that in the public schools.2
The presentation of these distributions does not, of course,
address the question of why they take the form they do. Three factors
in particular are worth noting as hypotheses amenable to empirical test.
First, the geographic location of private schools may account for some
1The race/ethnicity variable is constructed from items BB089
and BB090 in the codebook. Students are classified here as Hispanicif they gave as their origin or descent any one of the four classesunder the heading of "Hispanic or Spanish" on BB090, regardless of howthey responded to BB089. Students are classified as white if theylisted themselves as "white" on BB089 and did not describe themselvesas of Hispanic or Spanish origin on BB090. Similarly; students areidentified as black if they listed themselves as "black" on BB089 anddid not mark Hispanic or Spanish origin on BB090. Thus constructed,this variable includes over 95 percent of the students surveyed. (Nearlyall the remainder consists of persons who classified themselves ina racial category other than black or white.)
2The sampling error on the proportion of Hispanics in other
private schools is especially high because over half of the Hispanicstudents in this sector were in a single school.
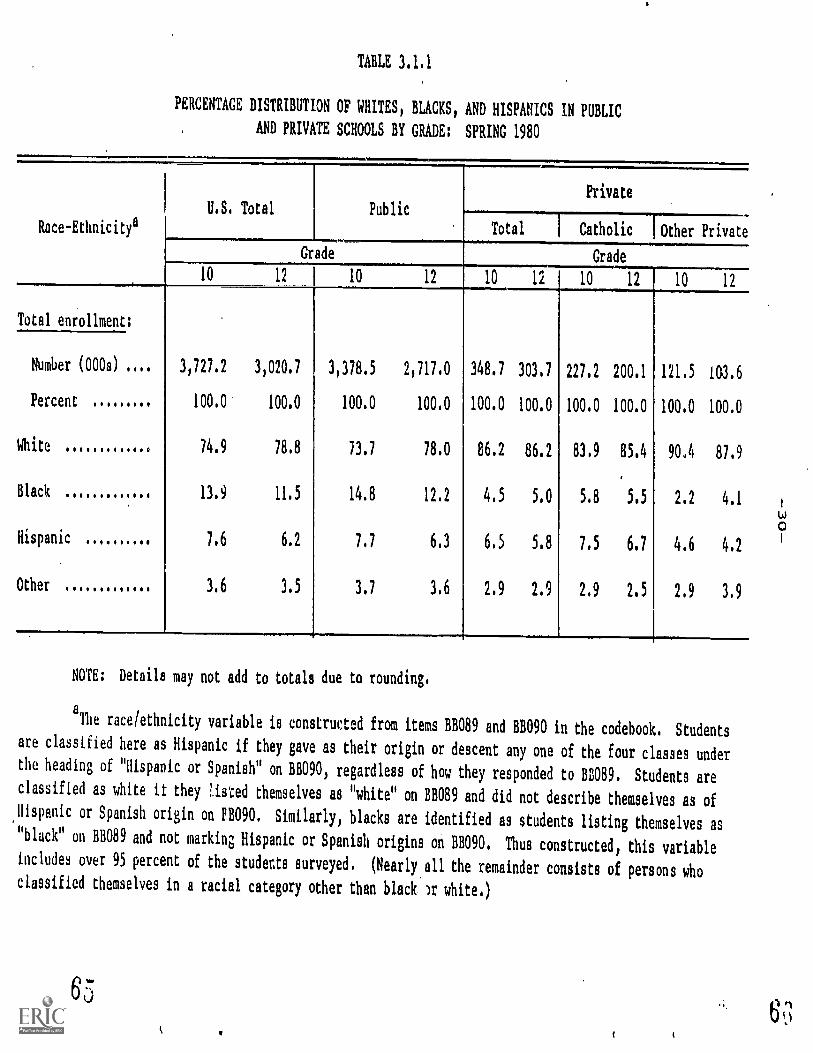
TABLE 3.1:1
PERCENTAGE DISTRIBUTION OF WHITES, BLACKS, AND HISPANICS IN PUBLIC
AND PRIVATE SCHOOLS BY GRADE: SPRING 1980
Race-Ethnicitya
U.S. Total Public
Private
Total Catholic Other Private
Grade Grade
10 12 10 12 10 12 10 12 10 12
Total enrollment;
Number (000s) 3,727.2 3,020.7 3,378.5 2,717.0 348.7 303.7 227.2 200.1 121.5 1(13.6
Percent 100.0 100.0 100.0 100.0 100.0 100.0 100.0 100.0 100.0 100.0
White 74.9 18.8 73.7 18.0 86.2 86.2 83.9 85.4 90.4 81.9
Black 13.9 11.5 14.8 12.2 4.5 5.0 5.8 5.5 2.2 4.1
11.4
Hispanic 1.6 6.2 1.7 6.3 6.5 5.8 7.5 6.7 4.6 4.2
Other 3.6 3.5 3.1 3.6 2.9 2.9 2,9 2.5 2.9 3.9
NOTE; Details may not add to totals due to rounding.
aThe race/ethnicity variable is constructed from items BB089 and BB090 in the codebook. Students
are classified here as Hispanic if they gave as their origin or descent any one of the four classes underthe heading of "Hispanic or Spanish" on BB090, regardless of how they responded to BB089. Students areclassified as white it they listed themselves as "white" on BB089 and did not describe themselves as ofhispanic or Spanish origin on EB090. Similarly, blacks are identified as students listing themselves as"black" on BB089 and not marking Hispanic or Spanish origins on 118090. Thus constructed, this variableincludes over 95 percent of the students surveyed. (Nearly all the remainder consists of persons whoclassified themselves in a racial category other than black, )r white.)
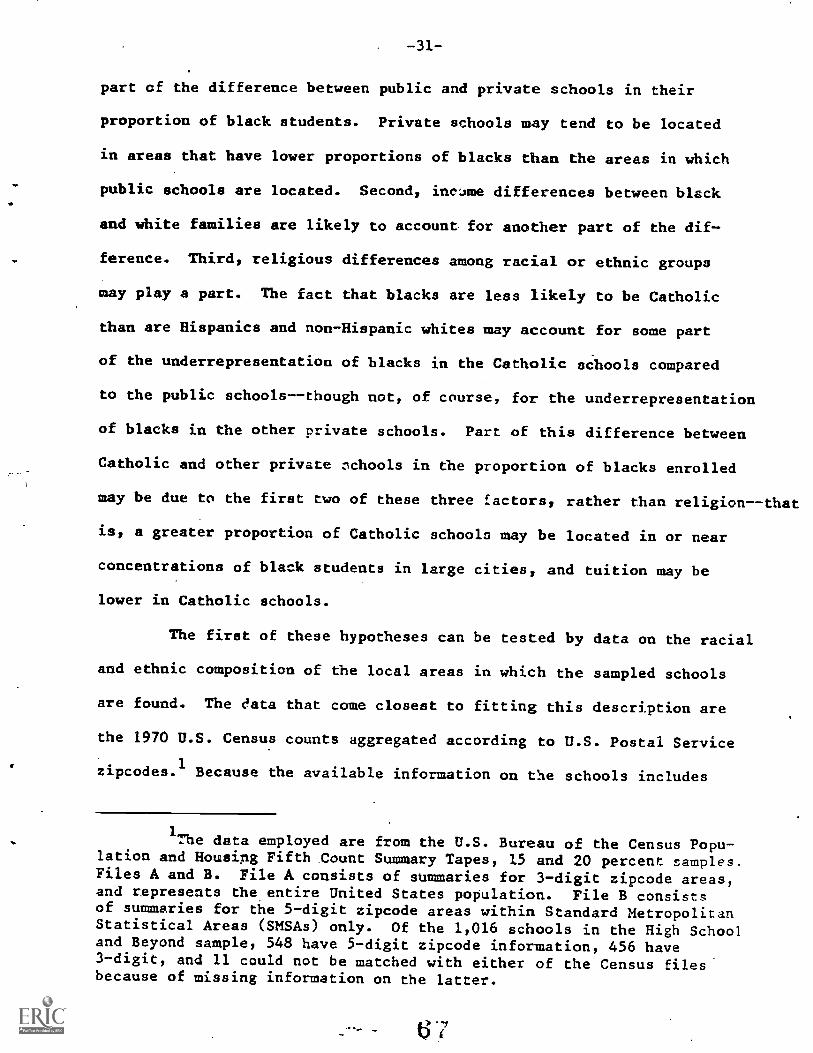
-31-
part of the difference between public and private schools in their
proportion of black students. Private schools may tend to be located
in areas that have lower proportions of blacks than the areas in which
public schools are located. Second, inc-Jme differences between black
and white families are likely to account for another part of the dif-
ference. Third, religious differences among racial or ethnic groups
may play a part. The fact that blacks are less likely to be Catholic
than are Hispanics and non-Hispanic whites may account for some part
of the underrepresentation of blacks in the Catholic schools compared
to the public schools--though not, of course, for the underrepresentation
of blacks in the other private schools. Part of this difference between
Catholic and other private zchools in the proportion of blacks enrolled
may be due to the first two of these three factors, rather than religion--that
is, a greater proportion of Catholic schools may be located in or near
concentrations of black students in large cities, and tuition may be
lower in Catholic schools.
The first of these hypotheses can be tested by data on the racial
and ethnic composition of the local areas in which the sampled schools
are found. The c!ata that come closest to fitting this description are
the 1970 U.S. Census counts aggregated according to U.S. Postal Service
zipcodes.1Because the available information on the schools includes
1The data employed are from the U.S. Bureau of the Census Popu-
lation and Housing Fifth Count Summary Tapes, 15 and 20 percent samples.Files A and B. File A consists of summaries for 3-digit zipcode areas,and represents the entire United States population. File B consistsof summaries for the 5-digit zipcode areas within Standard MetropolitanStatistical Areas (SMSAs) only. Of the 1,016 schools in the High Schooland Beyond sample, 548 have 5-digit zipcode information, 456 have3-digit, and 11 could not be matched with either of the Census filesbecause of missing information on the latter.
e
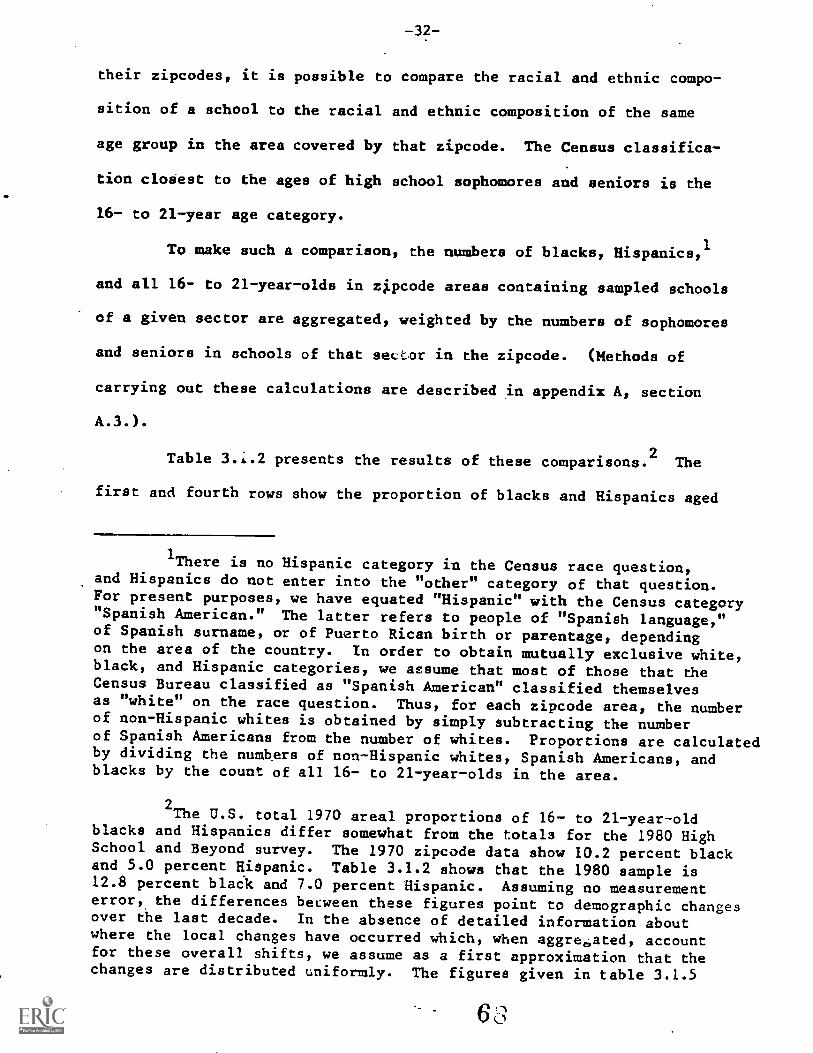
-32-
their zipcodes, it is possible to compare the racial and ethnic compo-
sition of a school to the racial and ethnic composition of the same
age group in the area covered by that zipcode. The Census classifica-
tion closest to the ages of high school sophomores and seniors is the
16- to 21-year age category.
To make such a comparison, the numbers of blacks, Hispanics,'
and all 16- to 21-year-olds in zi.pcode areas containing sampled schools
of a given sector are aggregated, weighted by the numbers of sophomores
and seniors in schools of that se(tor in the zipcode. (Methods of
carrying out these calculations are described in appendix A, section
A.3.).
Table 3.A.2 presents the results of these comparisons. 2The
first and fourth rows show the proportion of blacks and Hispanics aged
1There is no Hispanic category in the Census race question,
and Hispanics do not enter into the "other" category of that question.For present purposes, we have equated "Hispanic" with the Census category"Spanish American." The latter refers to people of "Spanish language,"of Spanish surname, or of Puerto Rican birth or parentage, dependingon the area of the country. In order to obtain mutually exclusive white,black, and Hispanic categories, we assume that most of those that theCensus Bureau classified as "Spanish American" classified themselvesas "white" on the race question. Thus, for each zipcode area, the numberof non-Hispanic whites is obtained by simply subtracting the numberof Spanish Americans from the number of whites. Proportions are calculatedby dividing the numbers of non-Hispanic whites, Spanish Americans, andblacks by the count of all 16- to 21-year -olds in the area.
2The U.S. total 1970 areal proportions of 16- to 21-year-old
blacks and Hispanics differ somewhat from the totals for the 1980 HighSchool and Beyond survey. The 1970 zipcode data show 10.2 percent blackand 5.0 percent Hispanic. Table 3.1.2 shows that the 1980 sample is12.8 percent black and 7.0 percent Hispanic. Assuming no measurementerror, the differences between these figures point to demographic changesover the last decade. In the absence of detailed information aboutwhere the local changes have occurred which, when aggregated, accountfor these overall shifts, we assume as a first approximation that thechanges are distributed uniformly. The figures given in table 3.1.5
6 3
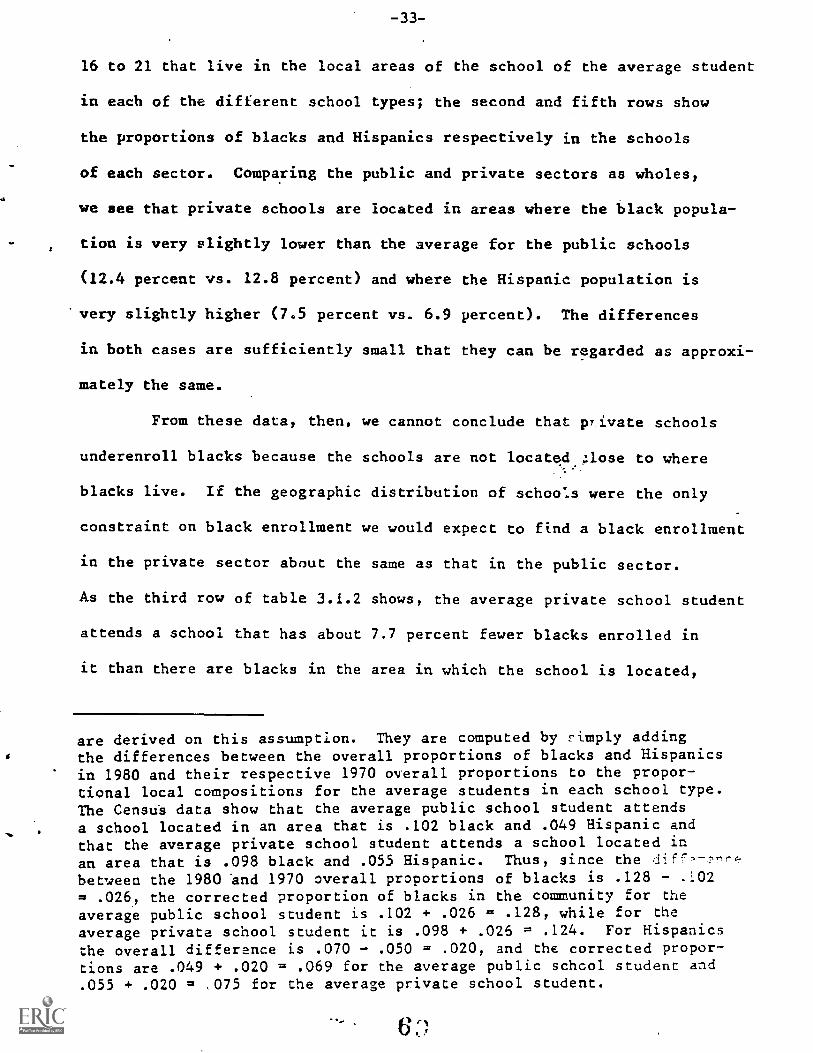
-33-
16 to 21 that live in the local areas of the school of the average student
in each of the different school types; the second and fifth rows show
the proportions of blacks and Hispanics respectively in the schools
of each sector. Comparing the public and private sectors as wholes,
we see that private schools are located in areas where the black popula-
tion is very slightly lower than the average for the public schools
(12.4 percent vs. 12.8 percent) and where the Hispanic population is
very slightly higher (7.5 percent vs. 6.9 percent). The differences
in both cases are sufficiently small that they can be regarded as approxi-
mately the same.
From these data, then, we cannot conclude that private schools
underenroll blacks because the schools are not located :lose to where
blacks live. If the geographic distribution of schools were the only
constraint on black enrollment we would expect to find a black enrollment
in the private sector about the same as that in the public sector.
As the third row of table 3.1.2 shows, the average private school student
attends a school that has about 7.7 percent fewer blacks enrolled in
it than there are blacks in the area in which the school is located,
are derived on this assumption. They are computed by simply addingthe differences between the overall proportions of blacks and Hispanicsin 1980 and their respective 1970 overall proportions to the propor-tional local compositions for the average students in each school type.The Census data show that the average public school student attendsa school located in an area that is .102 black and .049 Hispanic andthat the average private school student attends a school located in
an area that is .098 black and .055 Hispanic. Thus, since thebetveen the 1980 and 1970 overall proportions of blacks is .128 - .102= .026, the corrected proportion of blacks in the community for theaverage public school student is .102 + .026 = .128, while for theaverage private school student it is .098 + .026 = .124. For Hispanicsthe overall difference is .070 - .050 = .020, and the corrected propor-tions are .049 + .020 = .069 for the average public schcol student and.055 + .020 = ,075 for the average private school student.
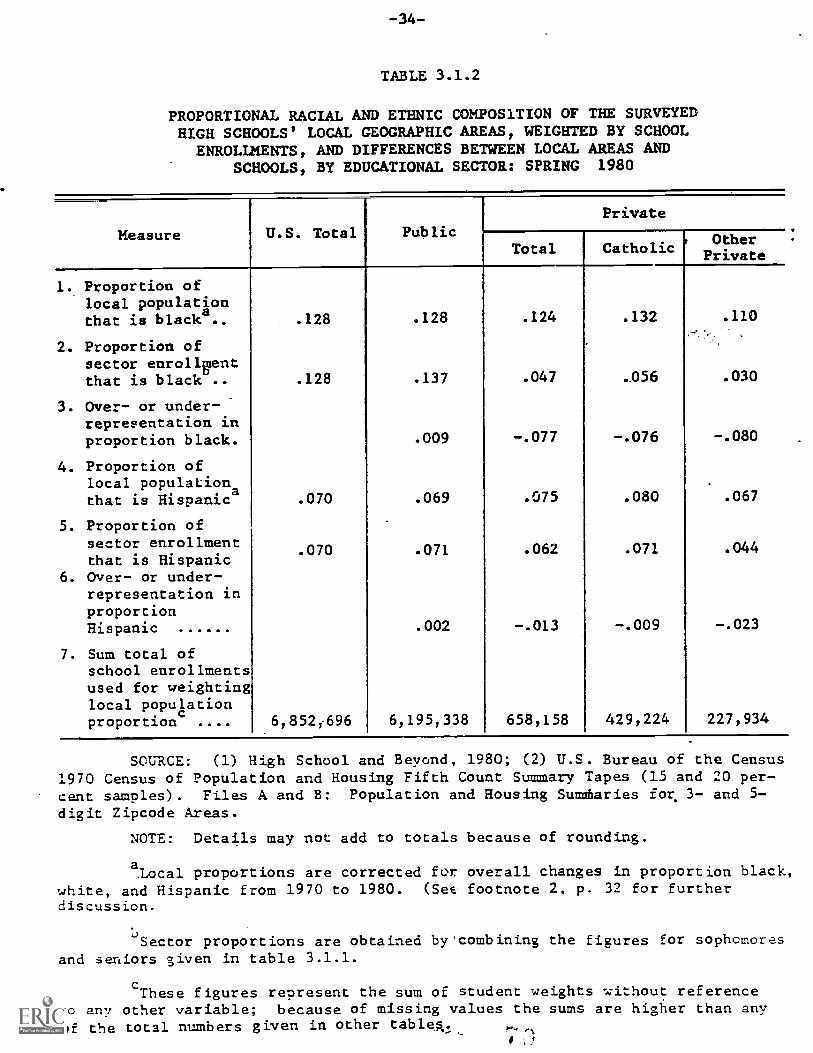
TABLE 3.1.2
PROPORTIONAL RACIAL AND ETHNIC COMPOSITION OF THE SURVEYEDHIGH SCHOOLS' LOCAL GEOGRAPHIC AREAS, WEIGHTED BY SCHOOL
ENROLLMENTS, AND DIFFERENCES BETWEEN LOCAL AREAS ANDSCHOOLS, BY EDUCATIONAL SECTOR: SPRING 1980
Measure U.S. Total PublicPrivate
Total CatholicOther
Private
1. Proportion oflocal populationthat is black ..,
2. Proportion ofsector enrollgientthat is black
3. Over- or under-representation inproportion black.
4. Proportion oflocal populationthat is Hispanics
5. Proportion ofsector enrollmentthat is Hispanic
6. Over- or under-representation inproportionHispanic
7. Sum total ofschool enrollmentsused for weightinglocal populationproportion
.128
.128
.070
.070
6,852;696
.128
.137
.009
.069
.071
.002
6,195,338
.124
.047
-.077
.075
.062
-.013
658,158
.132
.056
-.076
.080
.071
-.009
429,224
.110
.030
-.080
.067
.044
-.023
227,934
SOURCE: (1) High School and Beyond, 1980; (2) U.S. Bureau of the Census1970 Census of Population and Housing Fifth Count Summary Tapes (15 and 20 per-cent samples). Files A and B: Population and Housing Sumtaries for 3- and 5-digit Zipcode Areas.
NOTE: Details may not add to totals because of rounding.
aLocal proportions are corrected for overall changes in proportion black,white, and Hispanic from 1970 to 1980. (See footnote 2. p. 32 for furtherdiscussion.
''Sector proportions are obtained by'combining the figures for sophomoresand seniors given in table 3.1.1.
cThese figures represent the sum of student weights without referenceto any other variable; because of missing values the sums are higher than anyof the total numbers given in other tablek,,,_
-35-
while the average public school student attends a school with 0.9 percent
more blacks in it than in the surrounding area.
For. Hispanics, we would again expect to find about the same
proportions in the public and private sectors. Line 6 shows that there
is only a small underrepresentation of Hispanic students, 1.3 percent,
in the private sector.
Looking at Catholic and other private schools separately, there
are more blacks in the areas surrounding Catholic schools (13.2 percent
on average) than in the areas surrounding other private schools (11.0 per-
cent). This partially accounts for the greater numbers of blacks in
Catholic schools (5.6 percent compared to 3.0 percent). Similarly,
Catholic schools are located in areas with greater concentrations of
Hispanics; but line 6 shows that the Catholic schools contain approximately
thr. same proportion of Hispanics as reside in those areas (7.1 percent
to 8.0 percent), while the other private schools have 2.3 percent fewer
Hispanics than are found in the local areas.
Altogether, although other private schools are located in areas
with somewhat fewer black residents, which partly accounts for their
lower black enrollments, the low enrollment of blacks in private schools
as a whole cannot be accounted for by the geographic distribution of
black residence. For Hispanics, the enrollment in Catholic schools
is slightly above the national average; the lower enrollment in other
private schools again cannot be accounted for by geographic distribu-
tion, though, as before, these schools are located in areas with some
what fewer Hispanic residents.
The second hypothesis, that income differences are responsible
for the lower enrollments of blacks and Hispanics in Catholic and other
.
-36-
private schools, can be examined by looking at the proportion of Hispanics,
blacks, and non-Hispanic whites in each of these sectors at each income
level.1
Figures 3.1.1 and 3.1.2 show this for Catholic and other private
schools respectively.
Figure 3.1.1 shows that income differences do account for a
large part of the lower enrollments of blacks in Catholic schools.- _ -
At the lower- and middle-income levels, the difference in enrollments
of blacks and whites in Catholic schools is 2 to 3 percent; it is 1
percent at the highest level. This compares with a difference of 4.2
percent when income is not taken into account. (Percentaging table
3.1.1 across the 'rows instead of down the columns, we find that 7.0
percent of all non-Hispanic whites are in Catholic schools, while 2.8
percent of blacks are in Catholic schools.) These data indicate that
the public-Catholic difference in proportions of blacks would be reduced
to less than half its size if blacks had the same income distribution
as whites.
There is a higher percentage of Hispanics than of non-Hispanic
whites in Catholic schools at nearly every income level, increasingly
so at higher income levels. Thus, if the incomes of Hispanics and non-
Hispanic whites were the same, Hispanics would be somewhat overrepresented
in Catholic schools.
Figure 3.1.2 shows that the increase in percent enrolled with
increase in income is much less for all three groups in other private
1lnformation on the family income level of students was obtainedfrom variable BB101, which asked which one of seven different annualincome ranges the respondent's family income was in: (1) less than$7,000, (2) $7,000 to $11,999, (3) $12,000 to $15,999, (4) $16,000 to$19,999, (5) $20,000 to $24,999, (6) $25,000 to $37,999, and (7) $38,000or more. The seven levels on figures 3.1.1., 3.1.2, 3.1.3, and 3.1.4correspond to these ranges. The numbers and percentages on which figures3.1.1 and 3.1.2 are based are given in table 3.5.1.
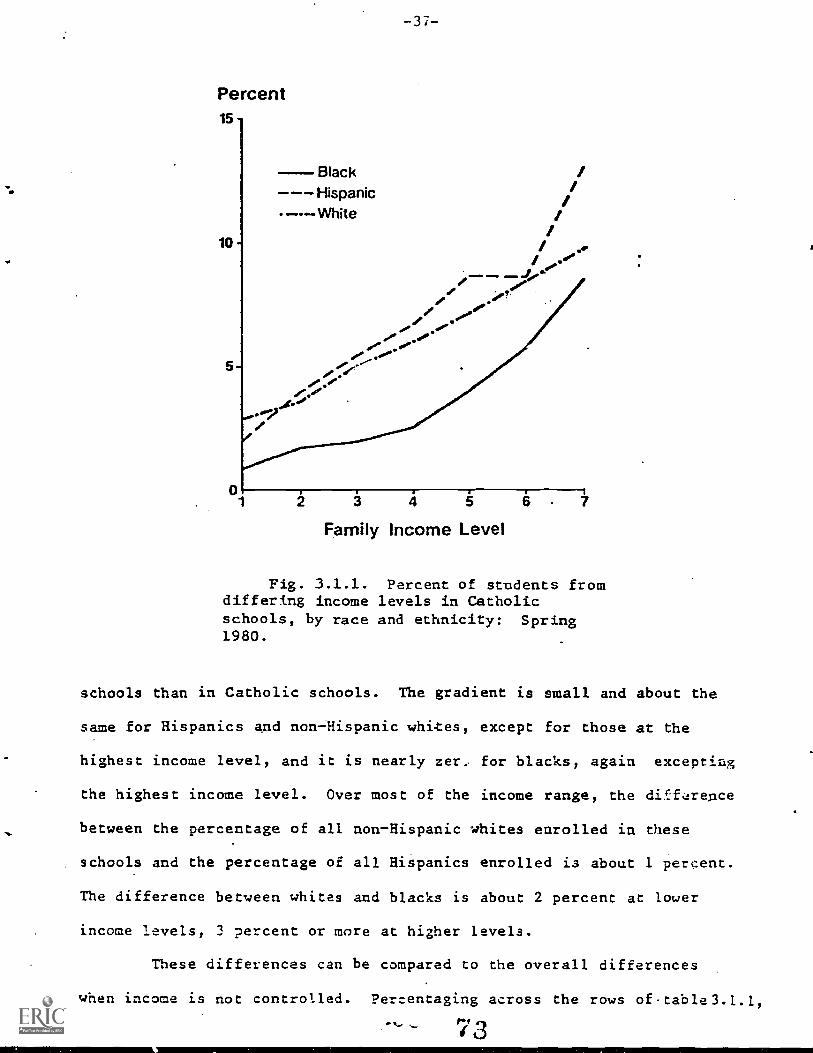
Percent15
Black--- Hispanic---White
10
.;097.
/ ./.0 .4/
***.
.0 1.0**
3 4 5
Family Income Level
Fig. 3.1.1. Percent of students fromdiffering income levels in Catholicschools, by race and ethnicity: Spring1980.
schools than in Catholic schools. The gradient is small and about the
same for Hispanics and nonHispanic whites, except for those at the
highest income level, and it is nearly zer.. for blacks, again excepting
the highest income level. Over most of the income range, the difference
between the percentage of all nonHispanic whites enrolled in these
schools and the percentage of all Hispanics enrolled is about 1 percent.
The difference between whites and blacks is about 2 percent at lower
income levels, 3 percent or more at higher levels.
These differences can be compared to the overall differences
when income is not controlled. Percentaging across the rows oftable3.1.1,
73
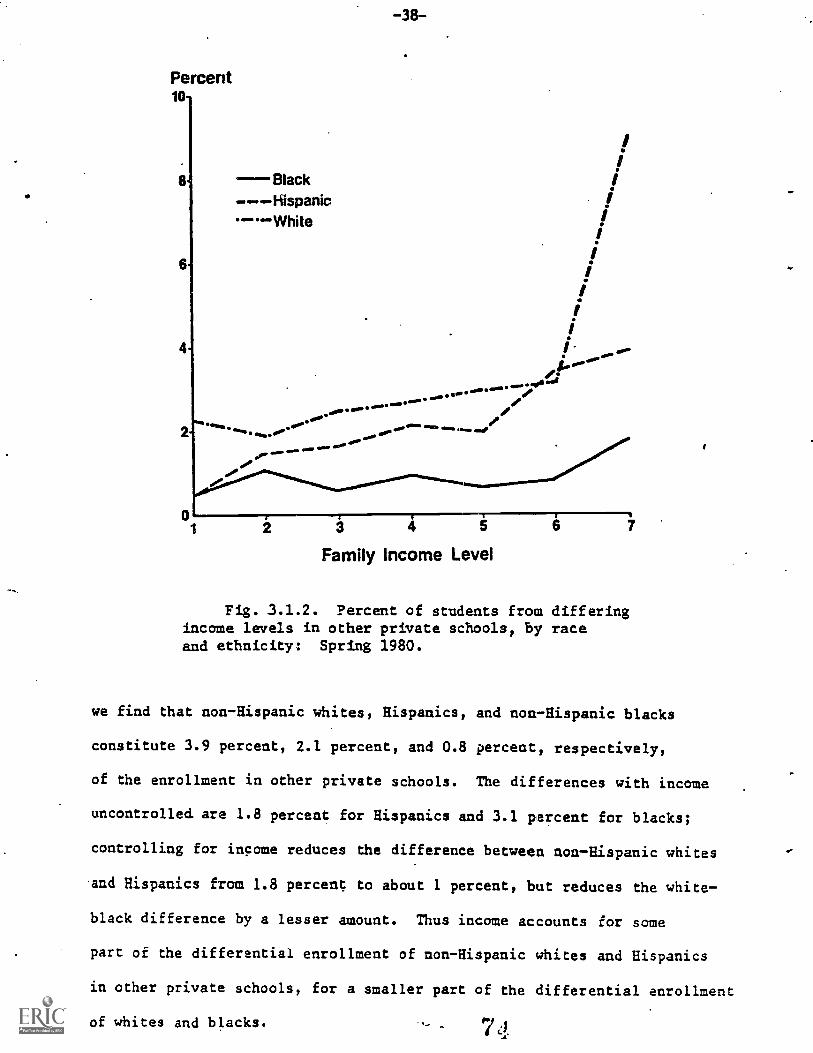
Percent10
I
Black. Hispanic
/
---70../
so.
3 4 5
Family income Level
Fig. 3.1.2. Percent of students from differingincome levels in other private schools, by raceand ethnicity: Spring 1980.
we find that non-Hispanic whites, Hispanics, and non-Hispanic blacks
constitute 3.9 percent, 2.1 percent, and 0.8 percent, respectively,
of the enrollment in other private schools. The differences with income
uncontrolled are 1.8 percent for Hispanics and 3.1 percent for blacks;
controlling for income reduces the difference between non-Hispanic whites
and Hispanics from 1.8 percent to about 1 percent, but reduces the white-
black difference by a lesser amount. Thus income accounts for some
part of the differential enrollment of non-Hispanic whites and Hispanics
in other private schools, for a smaller part of the differential enrollment
of whites and blacks. rc
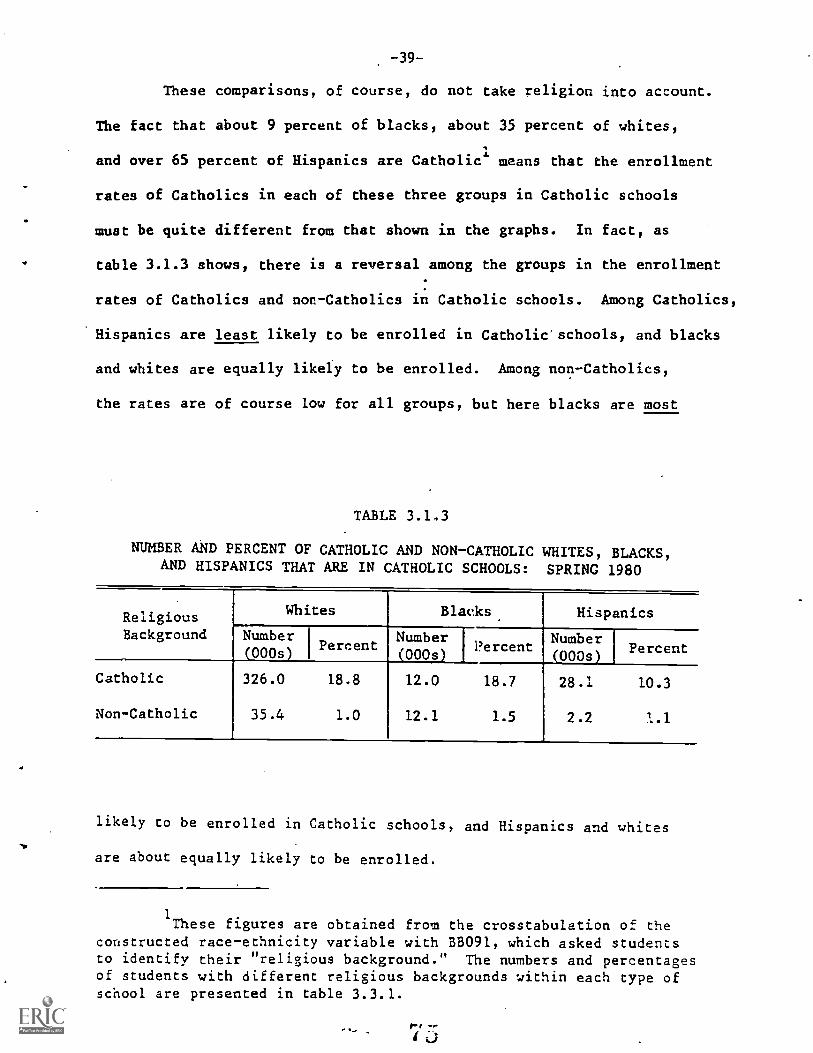
-39-
These comparisons, of course, do not take religion into account.
The fact that about 9 percent of blacks, about 35 percent of whites,
and over 65 percent of Hispanics are Catholic1means that the enrollment
rates of Catholics in each of these three groups in Catholic schools
must be quite different from that shown in the graphs. In fact, as
table 3.1.3 shows, there is a reversal among the groups in the enrollment
rates of Catholics and non-Catholics in Catholic schools. Among Catholics,
Hispanics are least likely to be enrolled in Catholic' schools, and blacks
and whites are equally likely to be enrolled. Among non-Catholics,
the rates are of course low for all groups, but here blacks are most
TABLE 3.1.3
NUMBER AND PERCENT OF CATHOLIC AND NON-CATHOLIC WHITES, BLACKS,AND HISPANICS THAT ARE IN CATHOLIC SCHOOLS: SPRING 1980
ReligiousBackground
Whites Blacks Hispanics
Number(000s)
PercentNumber(000s)
?ercentNumber(000s)
28.1
2.2
Percent
10.3
1.1
Catholic
Non-Catholic
326.0 18.8
35.4 1.0
12.0 18.7
12.1 1.5
likely to be enrolled in Catholic schools, and Hispanics and whites
are about equally likely to be enrolled.
1These figures are obtained from the crosstabulation of the
constructed race-ethnicity variable with BB091, which asked studentsto identify their "religious background." The numbers and percentagesof students with different religious backgrounds within each type ofschool are presented in table 3.3.1.
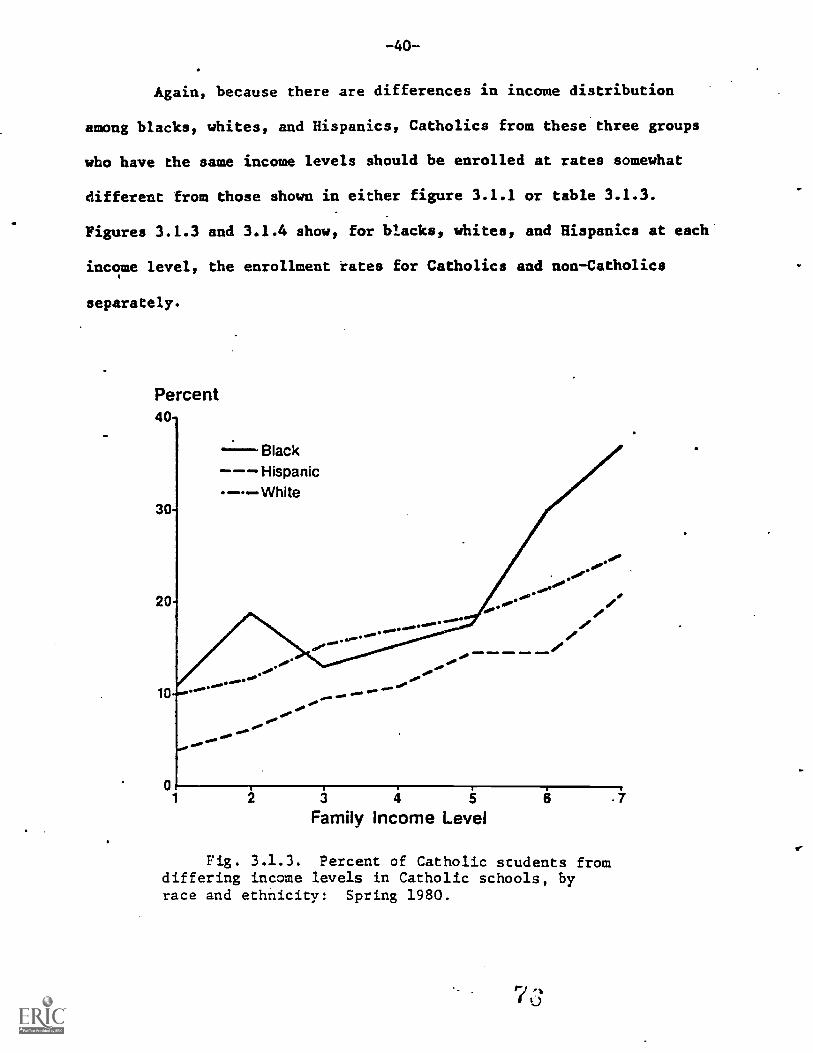
-40--
Again, because there are differences in income distribution
among blacks, whites, and Hispanics, Catholics from these three groups
who have the same income levels should be enrolled at rates somewhat
different from those shown in either figure 3.1.1 or table 3.1.3.
Figures 3.1.3 and 3.1.4 show, for blacks, whites, and Hispanics at each
income level, the enrollment rates for Catholics and non-Catholics
separately.
Percent
40
30
20
10
Black--- Hispanic---White
40'
.00
3 4 5
Family Income Level
0'=IM. al
Fig. 3.1.3. Percent of Catholic students fromdiffering income levels in Catholic schools, byrace and ethnicity: Spring 1980.
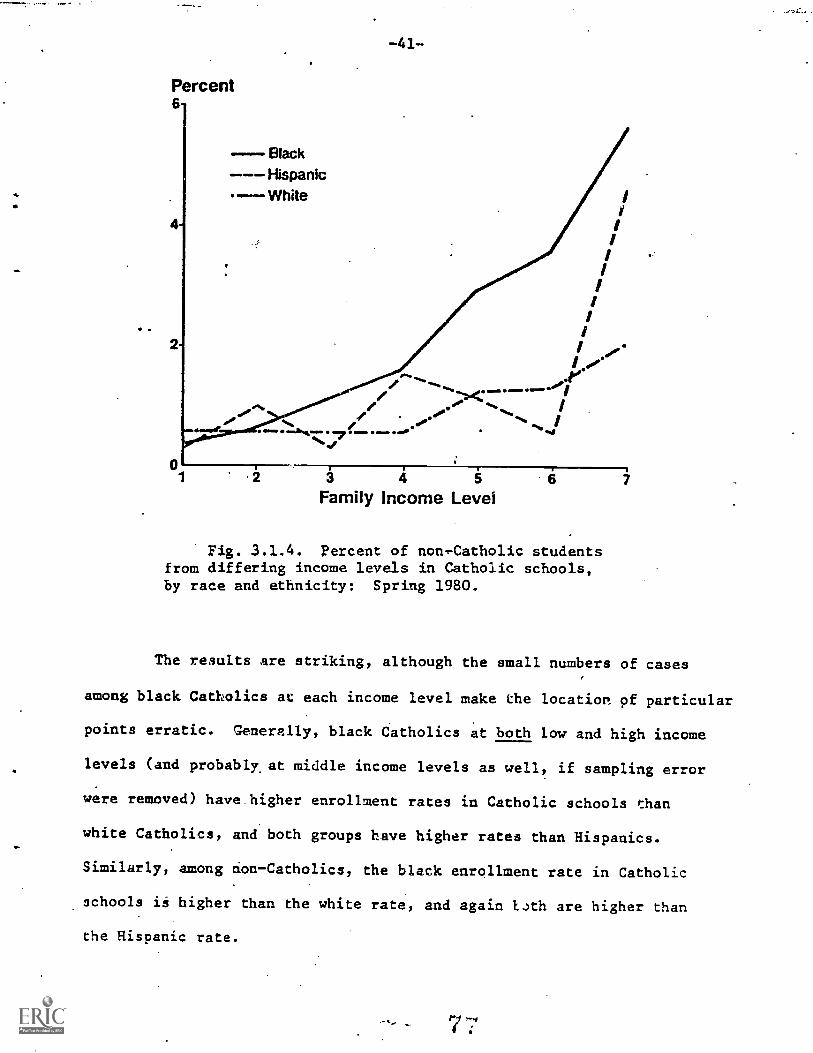
Percent6
-41-
-- Black--- Hispanic
White
/Ww
"4. .de/
40°
3 4Family Income Level
Fig. 3.1.4. percent of non-Catholic studentsfrom differing income levels in Catholic schools,by race and ethnicity: Spring 1980.
7
The results are striking, although the small numbers of cases
among black Catholics at each income level make the location pf particular
points erratic. Generally, black Catholics at both low and high income
levels (and probably. at middle income levels as well, if sampling error
were removed) have higher enrollment rates in Catholic schools than
white Catholics, and both groups have higher rates than Hispanics.
Similarly, among non- Catholics, the black enrollment rate in Catholic
schools is higher than the white rate, and again bath are higher than
the Hispanic rate.
-42-
Among both Catholics and non-Catholics the Catholic school enroll-
ment rate rises considerably more sharply at high income rates for
blacks than for whites, a result that is strengthened by consistency
across the two religious groups. Although the 38 percent rate among
black Catholics at the highest income level is subject to sampling
error, the evidence is strong that high-income blacks have considerably
higher enrollment rates in Catholic schools than do whites of the same
religious group.
Thus, controlling for the effects of both income and religious
background, it is clear that blacks are enrolled in Catholic schools
in higher proportions than are whites and Hispanics. The significance
of this fact is heightened when one considers the relative absence of
tradition for this pattern, except in the South. The data presented
here strongly suggest that such a tradition is developing rapidly;
blacks with the means to do so enroll in Catholic schools at rates that
are generally higher than rates for other groups, and this is true
regardless of religious background.
These comparisons in the Catholic and other private schools
indicate not only the degree to which income and religious differences
can account for enrollment differences, but also what might be the
consequences of decreasing the economic barriers to private schools
for lower income families, or of increasing those barriers. A more
explicit examination of this policy question is carried out later in
this chapter.
The examination to this point has been confined to the question
of just how the proportions of minority students in the private sector
compare to those in the public sector. An equally important question
43--
however, is, just how the sectors compare in the segregation among
different schools within each sector. On the one hand, even if there
were a high proportion of minorities in private schools, a high degree
of internal segregation among these schools would have the same segre
gating consequences as if the proportion of minorities were low. On
the other hand, even if the public schools contain a high proportion
of minorities, a high degree of internal segregation within the public
schools would have the same segregating consequences as if the whites
were segregated in private schools.
Measures of intergroup contact and of intergroup segregation
have been constructed (-.o examine internal segregation. (See the
Appendix for methods of calculation.) The measure of contact is a
measure of the average proportion of a student's schoolmates who are
from another group. It is affected both by the proportion of students
of the other group in that sector and by their distribution among the
schools of that sector. The measure of segregation was constructed
by standardizing the measure of contact by the proportion of students
of the other group in the sector. Thus it reflects only the distribu
tion of students among the schools in the sector, given their overall
numbers.1
Tabic 3.1.4 presents the indices of intergroup contact and segr,!--
gation as applied to racial and ethnic groups. The measure of interracial
1Mese measures are taken from Coleman, Kelly, and Moore (1975,
p. 22), where they were developed and use: to measure interracial zon:ac:and interracial segregation. Since their development they have beenused by a number of. investigators, and the:y now constitute one of thestandard ways of measuring segregation in schools. See Zoloth 1973,Cortese et al. 1976, Becker et al. 1978, Thomas et al. 1978.
7^
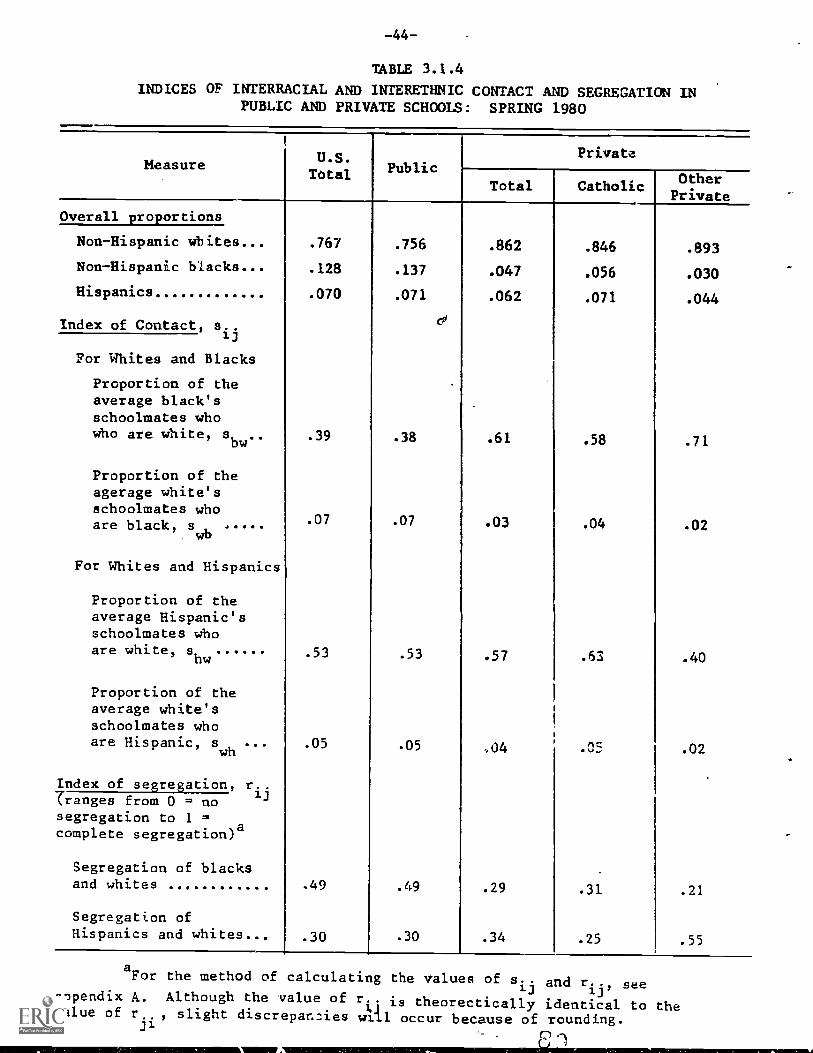
-44-
TABLE 3.1.4
INDICES OF INTERRACIAL AND INTERETHNIC CONTACT AND SEGREGATION INPUBLIC AND PRIVATE SCHOOLS: SPRING 1980
Measure
Overall proportions
Non-Hispanic wbites
Non-Hispanic blacks
Hispanics
Index of Contact, 8..1.3
For Whites and Blacks
Proportion of theaverage black'sschoolmates whowho are white s
Proportion of theagerage white'sschoolmates whoare black, sw
b
For Whites and Hispanics
Proportion of theaverage Hispanic'sschoolmates whoare white, s
hw
Proportion of theaverage white'sschoolmates whoare Hispanic, s
wh
Index of segregation, r..ranges from 0 = no
13
segregation to 1
complete segregation)
Segregation of blacksand whites
Segregation ofHispanics and whites..,
U.S.Total Public
Private
Total Catholic OtherPrivate
.767 .756 .862 .846 .893
.128 .137 .047 .056 .030
.070 .071 .062 .071 .044
.39 .38 I .61 .58 .71
.07 .07 I .03 .04 .02
.53 .53I .57 .53 .40
.05 .05 I 04 vAC .02
-49 .49 I .29 .31 .21
.30 .30 I .34 .25 .55
aFor the method of calculating the values of s.. and r.., seeij ljappendix A. Although the value of r.. is theorectically identical to thevalue of r.. , slight discrepancies will occur because of rounding.31
-45-
contact of blacks with whites is a measure of the proportion of the
average black students' schoolmates who are white; the measure works
in reverse for the contact of whites with blacks. The values of .38
and .07 in column 1 of table 3.1.4, for example, mean that about 38
percent of the average black child's classmates in public schools are
white, and that about 7 percent of the average white student's class-
mates are black.
The results tell something about the racial distribution within
the school sectors. Looking first at the measures of contact, we see
that the proportions are generally consistent with what we would expect,
given the overall proportions at the top of the table. That is, since
the public sector has about 11 percent fewer whitee than the private
sector, we would expect. that the proportion of the average black's and
the average Hispanic's schoolmates who are white would be lower in the
public thaa in the private sector. Comparison of the second and third
columns of table 3.1.2 makes it clear that this is in fact the case;
but, for the average black student, the difference is much greater than
11 percent. About 60 percent of the classmates of the average black
student in the private sector'are white, as compared with about 38 percent
for the average black student in the public schools, a difference of
22 percent. For Hispanics, the figures are much closer: the average
Hispanic student has 53 percent white classmates in the public sector
and 57 percent in the private sector. The pattern generally holds when
the Catholic and other private schools are considered separately, the
only exception being the low proporiton of white schoolmates for the
average Hispanic in the other .vate schools (.40). This exception,
however, is more likely the result of sampling error than of a general
-46--
pattern: the Hispanic enrollment in just one of the 27 other private
schools in the sample accounts far 64 percent of the total Hispanic
enrollment in the other private sector.
Following the same logic, we would expect that the proportions
of the average white student's classmates who are black and Hispanic
would be higher in the public schools (except in the public-Catholic
comparison for Hispanics, where the proportions should be about equal).
The measures of contact are consistent with expectation on this point
as well.
The measures of intergroup segregation within each sector are
given in the bottom two rows of table 3.1.4. Comparing columns 1 and
2, we see that blacks and whites are substantially less segregated in
the private sector than in the public sector: the black-white segre-
gation index takes on a value of .49 in the public sector versus only
.29 in the private. For Hispanics, the sectors are much closer, with
the private sector index (.34) indicating slightly greater segregation
than is found in the public sector (.30).
Examining black-white segregation within the two private sectors
separately reveals that segregation within each is much lower than that
in the public sector and that segregation in the other private schools
is lower than that in the Catholic schools. Measures of segregation
between non-Hispanic whites and Hispanics shows that segregation in
the Catholic schools (.25) is lower than that in the public schools,
while that in the other private schools (.55) is substantially higher.1
1This high measure of segregation is the result of the samplingproblem mentioned above, that is, the effect of a single school. Theexceptionally high Hispanic enrollment in this school also accountsfor why the private sector as a whole has a degree of Hispanic-nonE;spanicsegregation (.34) slightly higher than that in the public sector (.30),as noted in the pre.eding paragraph.
r-)
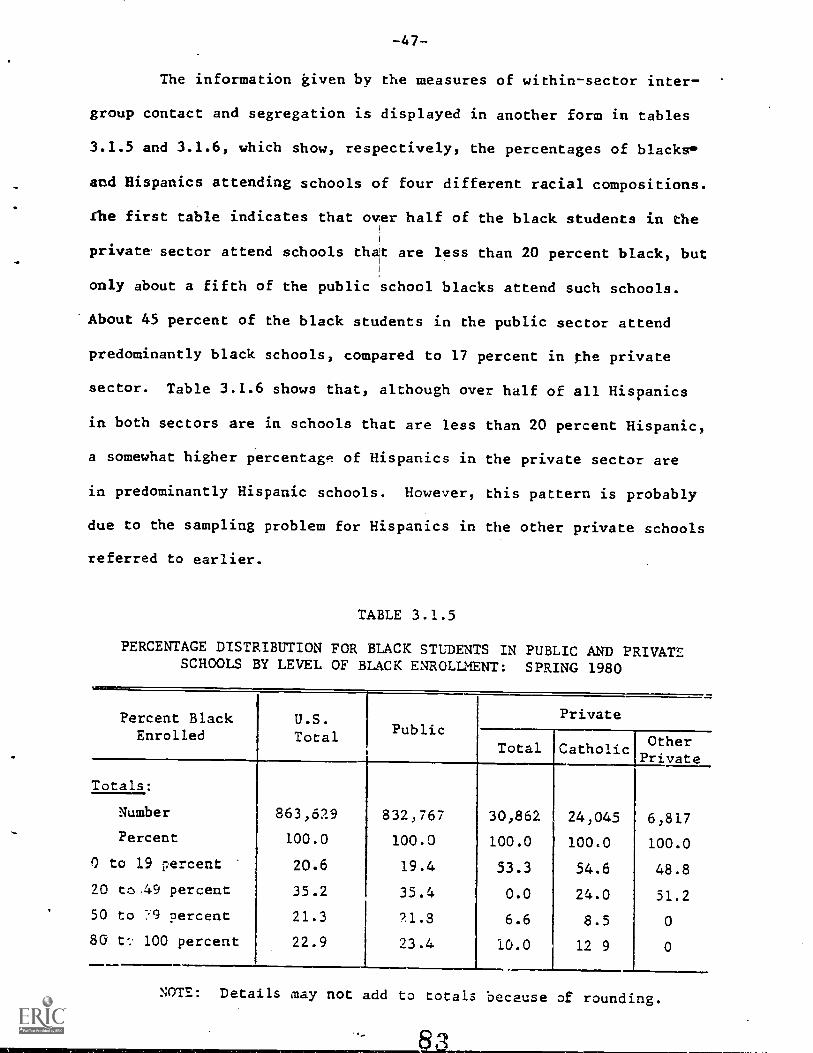
-47-
The information kiven by the measures of within-sector inter-
group contact and segregation is displayed in another form in tables
3.1.5 and 3.1.6, which show, respectively, the percentages of blacks'',
and Hispanics attending schools of four different racial compositions.
the first table indicates that over half of the black students in the
private. sector attend schools that are less than 20 percent black, but
only about a fifth of the public school blacks attend such schools.
About 45 percent of the black students in the public sector attend
predominantly black schools, compared to 17 percent in the private
sector. Table 3.1.6 shows that, although over half of all Hispanics
in both sectors are in schools that are less than 20 percent Hispanic,
a somewhat higher percentage of Hispanics in the private sector are
in predominantly Hispanic schools. However, this pattern is probably
due to the sampling problem for Hispanics in the other private schools
referred to earlier.
TABLE 3.1.5
PERCENTAGE DISTRIBUTION FOR BLACK STUDENTS IN PUBLIC AND PRIVATESCHOOLS BY LEVEL OF BLACK ENROLLMENT: SPRING 1980
Percent BlackEnrolled
U.S.Total Public
Private
Total CatholicOtherPrivate
Totals:
Number 863,629 832,767 30,862 24,045 6,817Percent 100.0 100.0 100.0 100.0 100.0
0 to 19 percent 20.6 19.4 53.3 54.6 48.8
20 to 49 percent 35.2 35.4 0.0 24.0 51.2
50 to "v9 percent 21.3 9.1.8 6.6 8.5 0
80 t.: 100 percent 22.9 23.4 10.0 12 9 0
NOTE: Details may not add to totals because of rounding.
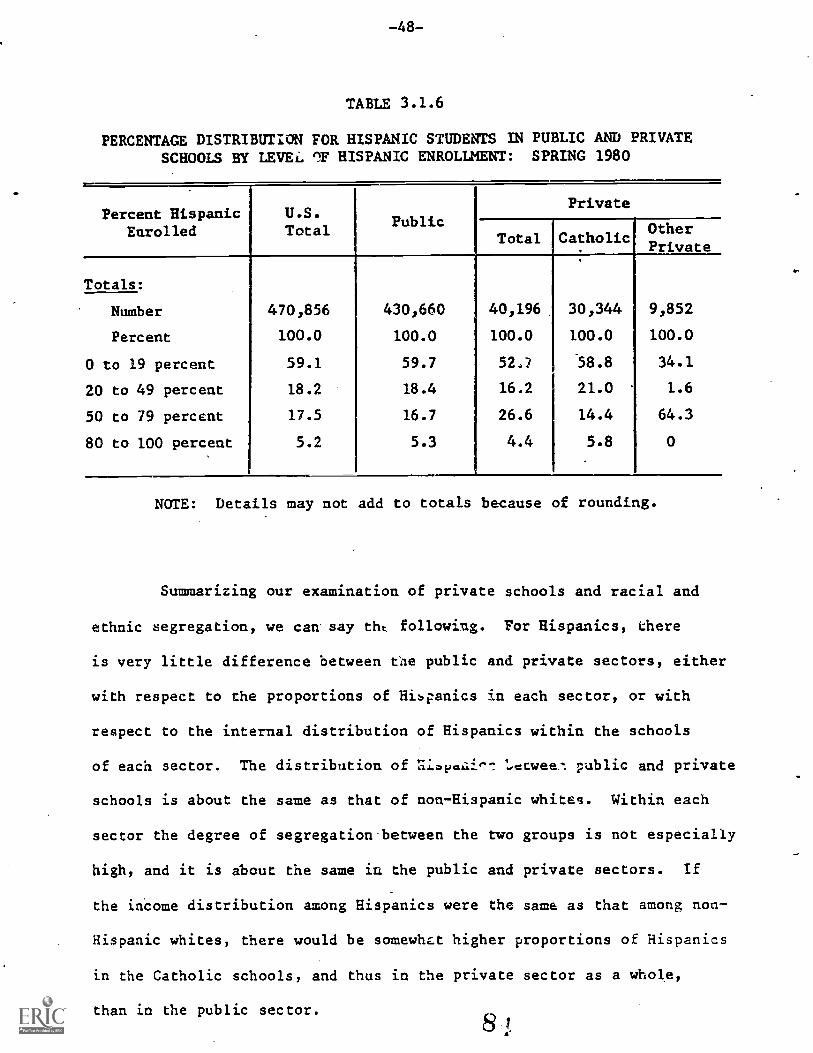
TABLE 3.1.6
PERCENTAGE DISTRIBUTION FOR HISPANIC STUDENTS IN PUBLIC AND PRIVATESCHOOLS BY LEVEL rIF HISPANIC ENROLLMENT: SPRING 1980
Percent HispanicEnrolled
U.S.Total
PublicPrivate
Total
,
CatholicOtherPrivate
Totals:
Number 470,856 430,660 40,196 30,344 9,852
Percent 100.0 100.0 100.0 100.0 100.0
0 to 19 percent 59.1 59.7 527 58.8 34.1
20 to 49 percent 18.2 18.4 16.2 21.0 1.6
50 to 79 percent 17.5 16.7 26.6 14.4 64.3
80 to 100 percent 5.2 5.3 4.4 5.8 0
NOTE: Details may not add to totals because of rounding.
Summarizing our examination of private schools and racial and
ethnic segregation, we can say tht following. For Hispanics, there
is very little difference between the public and private sectors, either
with respect to the proportions of Hispanics in each sector, or with
respect to the internal distribution of Hispanics within the schools
of each sector. The distribution of 1.ccwees. public and private
schools is about the same as that of non-Hispanic whites. Within each
sector the degree of segregation between the two groups is not especially
high, and it is about the same in the public and private sectors. If
the income distribution among Hispanics were the same as that among non
Hispanic whites, there would be somewhLt higher proportions of Hispanics
in the Catholic schools, and thus in the private sector as a whole,
than in the public sector.
-49-
The results for black-white segregation are considerably more
complex. There is a substantially smaller proportion of blacks in the
private sector than in the public sector--less than half as high a propor-
tion in the Catholic schools, and less than a quarter as high in the
other private schools. The geographic location of private schools
accounts for only a small part of this difference between the public
and private sectors, though it accounts for a somewhat larger part of
the difference between Catholic and other private schools, which are
less often found in areas with high numbers of blacks. The income
difference between blacks and whites does account for a substantial
part of the public-Catholic difference in proportion of blacks enrolled,
though little of the public-other private difference.
The effect of religious background on school selection was also
examined for the Catholic sector. The percentage of blacks who are
Catholic is much smaller than the percentage of whites and Hispanics
who are Catholic, and, when this factor is taken into account, the
differences between blacks and whites in chances of attending Catholic
high schools disappear. Finally, when the effects of income and reli-
gious background are considered simultaneously, blacks are generally
found to be enrolled at higher rates than whites (and Hispanics) who
are similar in income and religious background.
Despite the fact that controlling for the effects of income
and religion introduces important qualifications to any discussion about
the causes of racial segregation in public and private education, it
remains the case that the proportion of black students in private schools
is substantially lower than that in public schools. But information
on the internal segregation between blacks and whites tells a different
-50-
story: the public sector has a substantially higher degree of segre-
gation than the private sector (or either of its two components separately).
Thus, the integrating impact of the lesser degree of segregation within
the private sector counteracts the segregating impact of the lower
proportion of blacks in that sector.
What is the end result of these conflicting tendencies, the
overall impact of private schooling on black-white segregation? An
answer can be obtained by comparing the overall black-white segregation
among all high schools, public and private considered together, as it
currently stands, to the segregation we would expect if the students
currently in private schools were absorbed into the public system.
We assume that they would be distributed among schools within the public
sector in exactly the way whites and blacks are currently distributed
in the public sector.1
Any differences found in such a comparison would
of course be quite small, since only ln percent of the student population
would change schools; but the direction is important.
1This assumption nay be questioned on two grounds: these students may
live in areas that are closer to or further from blacks than is truefor whites currently in public schools; and their family incomes mayallow them more resources to move to higher i7,come areas with smallerproportions of blacks. Table 3.1.2 shows that private schools are locatedin areas with slightly smaller proportions of blacks than is true fo:the average public school. And in the next section, table 3.2.1 showsthat the incomes of parents of private school students are somewhathigher than those of parents of public school students. Thus, on boththese grounds, both black and white students currently in private schoolswould tend to enter public schools that were more white than the publicschools attended by,black and white students in the public sector.Since the proportion of white students in private schools is higherthan in the public sector, we would expect that absorption of privateschool students into public schools would result in a slightly moresegregated public sector than found at present. Thus the comparisonin the text may slightly understate the degree of segregation to beexpected if private schools were absent.
-51-
If we assumed that no private schools existed, and that blacks
and whites currently in private schools were absorbed into the public
schools with exactly the same distribution among schools as is currently
found in the public schools, the degree of segregation for the total
U.S. student population would be that given by the segregation index
for the public sector, .49. Comparing this zo the current segregation
index for all U.S. students, also .49, suggests that the two tendencies
exactly cancel each other out. But, carried to three decimals, these
indices are .493 and .489, which means that the private schools have
a small effect in the direction of less segregation.
3.2 The Economic Backgrounds of Public and. Private School Students
Although much attention has been directed to the possible divisive-
ness of private schools along racial lines in recent years, the first
such concern was with economic divisiveness. This is the most natural
form that public-private stratification would take, since private schools
are costly to the user, and public schools are free to the user. And
it is the stratification that naturally comes to mind when the elite
private schools are discussed.
We know, however, that a large number of private schools do
not fit this image. The Catholic schools were not designed for an upper
class elite, and many of the other private schools are also based on
religious rather than social class homogeneity. Consequently, despite
the fact that sending a child to a private school costs parents money
while sending a'child to a public school does not, the diverse origins
and affiliations of private schools suggest that private schools as
8
-52-
a whole may serve students with economic backgrounds not greatly dif-
ferent from those of students served by public schools.
But even if this is true, it addresses only the question of
economic segregation between the public and private sectors, not eco-
nomic segregation within the private sector. And, if there are elite
schools and nonelite schools in the private sector, there must be a
considerable degree of economic segregation among schools within that
sector.
Yet the questions of economic segregation between the private
and public school sectors and within the private sector do not exist
in a vacuum. They exist, rather, within the framework of some degree
of economic stratification among schools in the public sector itself.
The geographic mobility by residence that facilitates a degree of racial
homogeneity in public schools, as shown in the preceding section, also
facilitates a degree of economic homogeneity. Thus the tendencies of
private schools to lead to economic stratification between the private
and public sectors or within the private sector must be seen in a con-
text of economic stratification within the public school sector.
The task, then, is first to examine the degree of economic
stratification between the : ivate and public sectors of education,
then to examine the degree of stratification within the private sector
as compared to that within the public sector, and, finally, as ia the
case of race and ethnicity, to ask what the overall contribution of
the private sector is to economic segregation.
Looking first at the distributions of students between sectors,
table 3.2.1 and figure 3.2.1 show that the dir.:ctions cf the economic
differences among students in the public and private sectors are consistent
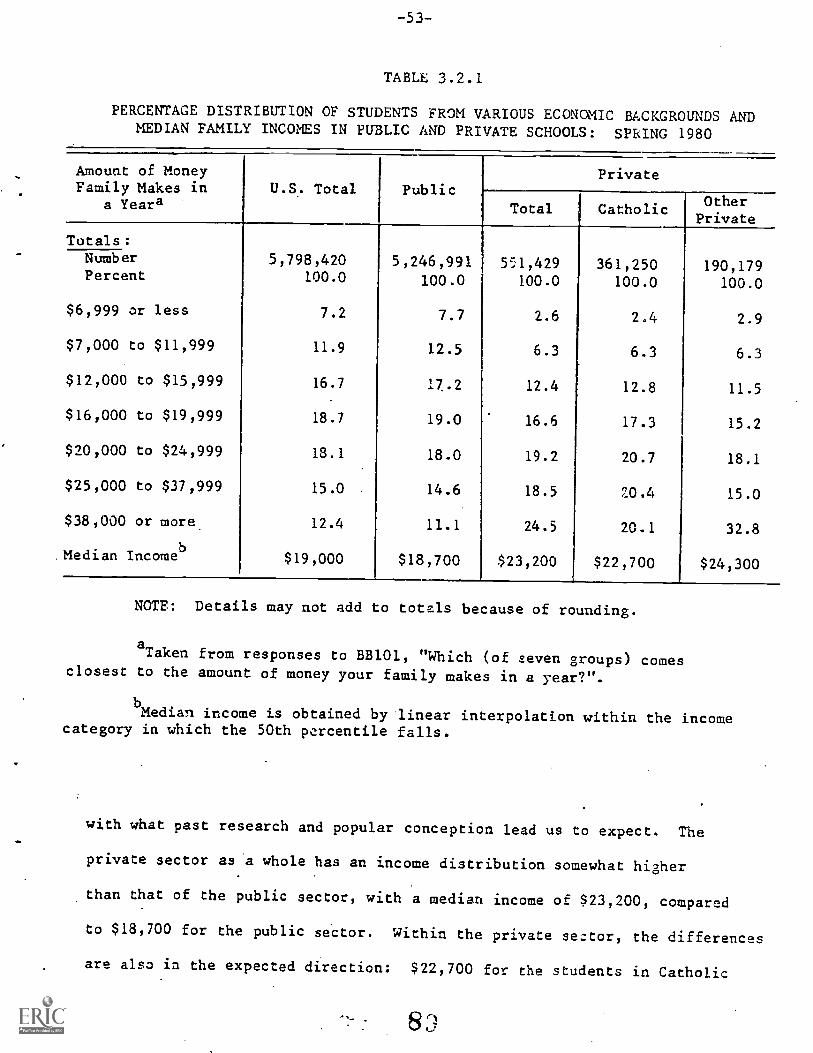
TABU. 3.2.1
PERCENTAGE DISTRIBUTION OF STUDENTS FROM VARIOUS ECONOMIC BACKGROUNDS ANDMEDIAN FAMILY INCOMES IN PUBLIC AND PRIVATE SCHOOLS: SPRING 1980
Amount of MoneyFamily Makes in
a YearaU.S. Total Public
Private
Total CatholicOtherPrivate
Totals:Number 5,798,420 5,246,991 551,429 361,250 190,179Percent 100.0 100.0 100.0 100.0 100.0
$6,999 or less 7.2 7.7 2.6 2.4 2.9
$7,000 to $11,999 11.9 12.5 6.3 6.3 6.3
$12,000 to $15,999 16.7 17.2 12.4 12.8 11.5
$16,000 to $19,999 18.7 19.0 16.6 17.3 15.2
$20,000 to $24,999 18.1 18.0 19.2 20.7 18.1
$25,000 to $37,999 15.0 14.6 18.5 Z0.4 15.0
$38,000 or more 12.4 11.1 24.5 20.1 32.8
Median Incomeb
$19,000 $18,700 $23,200 $22,700 $24,300
NOTE: Details may not add to totals because of rounding.
aTaken from responses to BB101, "Which (of seven groups) comes
closest to the amount of money your family makes in a year?".
bMedian income is obtained by linear interpolation within the income
category in which the 50th percentile falls.
with what past research and popular conception lead us to expect. The
private sector as a whole has an income distribution somewhat higher
than that of the public sector, with a median income of $23,200, compared
to $18,700 for the public sector. Within the private sector, the differences
are also is the expected direction: $22,700 for the students in Catholic
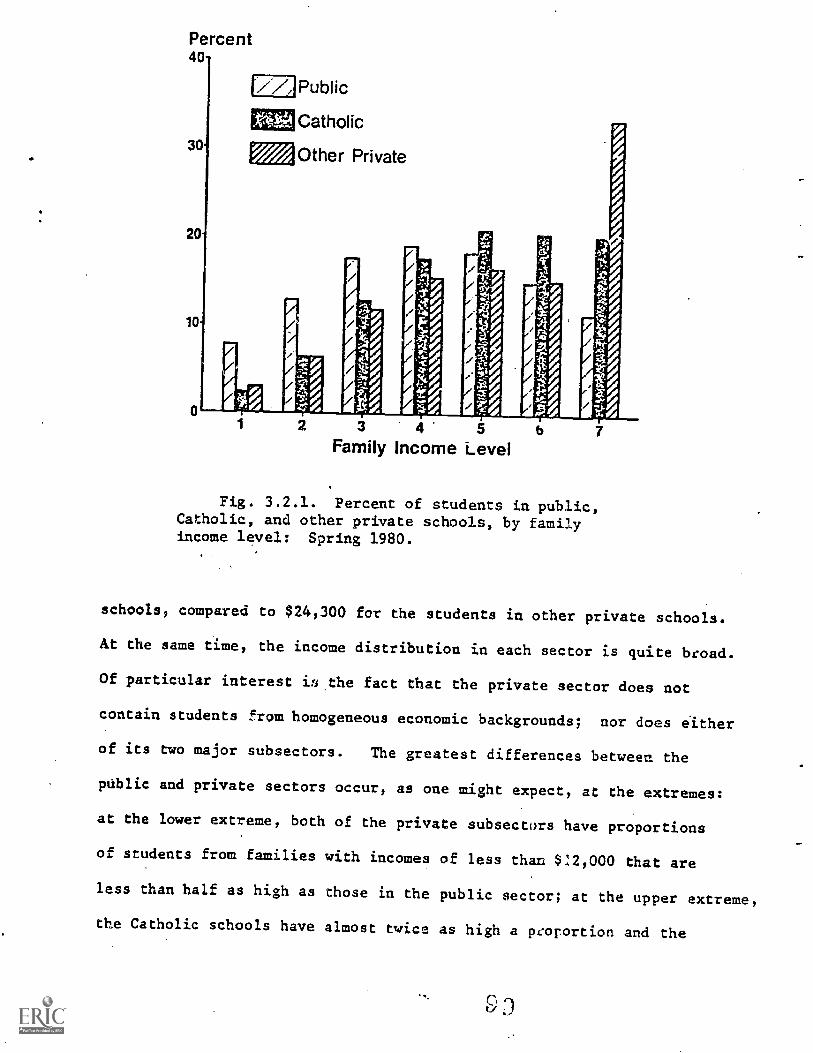
17/,Public
Catholic
Other Private
3 4 5
Family Income Level
Fig. 3.2.1. Percent of students in public,Catholic, and other private schools, by familyincome level: Spring 1980.
schools, compared to $24,300 for the students in other private schools.
At the same time, the income distribution in each sector is quite broad.
Of particular interest is the fact that the private sector does not
contain students from homogeneous economic backgrounds; nor does either
of its two major subsectors. The greatest differences between the
public and private sectors occur, as one might expect, at the extremes:
at the lower extreme, both of the private subsectors have proportions
of students from families with incomes of less than $12,000 that are
less than half as high as those in the public sector; at the upper extreme,
the Catholic schools have almost twice as high a prorortion and the
-55-
other private schools have almost three times as high a proportion of
students from families with incomes of $38,000 or more.
These differences suggest that there are a number of possible
factors at work functioning to reduce the accessibility of lower income
students to private education. Foremost among these, of course, is
simply the cost of private education. But it may also be that private
schools tend to be located at some distance from residential concentrations
of lower income families, thus further reducing their accessibility.
While an analysis comparable to that carried out or the, local distribu-
tions of racial and ethnic groups cannot be included in this report,
further research in this direction would be useful.
The second question relevant to an examination of the contribu-
tion of private schools to economic stratification concerns the distribu-
tions of students from different income levels within the lectors and
school types. While we have seen that poorer students are underrepresented
and wealthier students overrepresented in the private sector taken as
a whole, it is quite another question to ask whether students from
different economic backgrounds who are enrolled in each sector attend .
the same schools or different ones. To address this question, we can
use the measures of contact and segregation that were used for race
and ethnicity. The variable identifying student economic backgrounds
is BB100, which asked the respondent's family income in three categories:
below $12,000, between $12,000 and $20,000, and above $20,000. The
segregation examined is that between those below $12,000, about 18 percent
of the total, and those above $20,000, about 43 percent of the total.
Table 3.2.2 gives the results of the computations. As the overall
proportions (given at the top of the table) would lead us to expect,
9
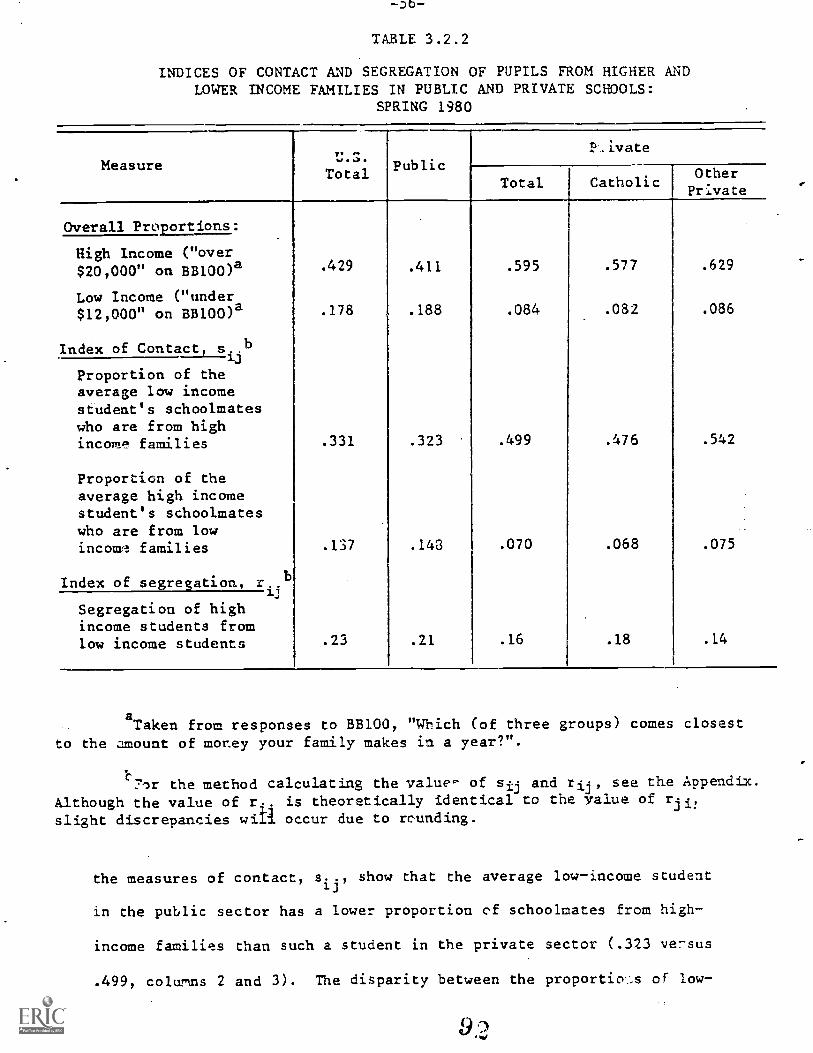
TABLE 3.2.2
INDICES OF CONTACT AND SEGREGATION OF PUPILS FROM HIGHER ANDLOWER INCOME FAMILIES IN PUBLIC AND PRIVATE SCHOOLS:
SPRING 1980
MeasureIr. -.....,.
TotalPublic
P.ivate
Total CatholicOtherprivate
Overall Proportions:
High Income ("over$20,000" on BB100)a .429 .411 .595 .577 .629
Low Income ("under$12,000" on BB100)a .178 .188 .084 .082 .086
Index of Contact, sib
ProportionProportion of theaverage low incomestudent's schoolmateswho are from highincome families .331 .323 .499 .476 .542
Proportion of theaverage high incomestudent's schoolmateswho are from lowincome families .137 .143 .070 .068 .075
Index of segregation, r bij
Segregation of highincome students fromlow income students .23 .21 .16 .18 .14
aTaken from responses to BB100, "Which (of three groups) comes closest
to the amount of money your family makes in a year?".
21r the method calculating the value-- of sly and rij, see the Appendix.
Although the value of r.. is theoretically identical to the value of rji,
slight discrepancies will occur due to rounding.
the measures of contact, s..ij , show that the average low-income student
in the public sector has a lower proportion cf schoolmates from high-
income families than such a student in the private sector (.323 ve7sus
.499, columns 2 and 3). The disparity between the proportios of low-
-57-
income schoolmates for the average high-income student in the two sectors
is even more pronounced--the high-income student in the private sector
has less than half as high a proportion of lower income schoolmates
as the high-income student in the public sector (.070 versus .148).
These values of the measure of contact reflect both the propor-
tions of high- and low-income students in the sector as a whole and
the distribution of these students within each sector. The values on
the index of segregation given at the bottom of the tale, which standardize
on the proportion of each group in the sector, show the economic segrega-
tion within each sector of students from the two different income back-
grounds. As in the case of race and ethnicity, the degree of economic
segregation is lower in the private sector as a whole, and in the Catholic
and other private sectors separately, than in the public sector. But
ei-,e differences between the public and private sectors in internal segre-
gation are much less here than in the case of black-white segregation.
With economic segregation, then, there is the same counterbalancing
tendency as found in t'Ae case of racial segregation: higher economic
backgrounds are overrepresented in the private sector, but the private
sector is less internally segregated than is the public. The overall
levels of economic segregation are considerably lower than those of
black white segregation (e.g., it 'e public sector, .21 versus .49),
but a similar counterbalancing pa ,rn holds.
We can ask, then. as in the case of black-white segregation,
what the overall'impact is of these two counterbalancing tendencies.
Again; this is done by comparing the economic segregaidon among schools
for all sectors together (the U.S. tccal in the table) tc than for the
public sector. This comparison shows the economic sevegation among
-58--
U.S. schools as a whole that would result from private school students
being absorbed into the public schools and distributed among public
schools as current public school students are. Here the comparison
f .23 to .21 shows that the overall impact of the private sector is
to increase slightly the degree of economic segregation, not, as in
the case of black-white segregation, to effect an exact counterbalancing.
The similarity of pattern in the cases of racial and economic
segregation raises a question about whether there might be a common
cause. That is, in both areas, the segregation within the private sector
is less than that within the public sector, while in both areas the
private sector has higher proportions of the population group with greater
resources (in the black-white comparison, whites; in the economic com-
parison, higher-income groups).
Two related explanations seem plausible, both based on the assump-
tion that parents will attempt to have their children in schools with
others TJho are likely to do well in school, and that those parents with
greater resources (higher incomes, or whites) will be better able to
do thy.. The explanations are:
1. The proportion of lowest income studenLs and the proportionof ,lack students in the private sector are lower in the privateschools than in the publi: schools. Thus the parent who haschosen the private sector will be less concerned that the normsof the school and the standards of ins ruction will be broughtdown by students that the parent a priori assumes are more likelyto have such an impact, that is, students from low-income familiesand black students (who of course are often from low- incomebackgrounds). Public school parents will have the same generalconcerns, but, with a higher proportion of low-income or black(or both) students ill the sector as a whole, will ma.lifest thoseconcerns *)y r.)ving their children to schools where the proportionsare lower, if tley hrve the resources to do so. It is white,higher income iamilies who more often have such resources, andthe end result is a higher degree of internal segregation..
2. Private schools, as will be evident in the subsequent chapters,have greater control of their students and exercise strongerdiscipline than do public schools. This is, of course, based
-59-
to a considerable degree on the fact that private schools canexpel students or use other disciplinary measures with muchless legal constraint, and much more parental acquiescence,than the public schools. This stronger discipline means thata parent concerned about the norms and standards in the schoolwill be more assured in the private sector that those normsand standards are maintained by the staff, rather than beingshaped by the type of student body. Consequently, the privateschool parent will be less concernei about the student bodycomposition, since that student body is "kept in hand" by thestaff. Public school parents with the same general concerns,but seeing the norms and standards more shaped by the compositionof the student body, will exert greater effort to have theirchildren in schools where they see that composition favorableto school achievement. Parents with greater resources willbe more successful in this, thus leading to greater racial andeconomic segregation in the public than in the private sector.
3.3 The Religious Backgrounds of Public and Private School Students
Historically, issues of religious divisiveness have been central
to debates concerning private education. Although -conomic differences
are an important factor in private school enrollment, religious concerns
have been, and continue to be, probably the strongest motivating force
in parents' decis'ons to send their children to private schools. This
motivation can be seen Setter, perhaps, in other countries. For a
number of countries have state-supported schools operated by religious
groups, along with secular schools; and, in some countries, the major
sectors of publicly supported education are those operated by different
religions denominations.
As pointed out earlier (chapter 1), about 80 percent of private
sector students are enrolled in schools affiliated with some specific
religious denomination, and it is probably safe to assume tnat an inter-
est in affirming basic religious values within the contex.: of formal
education is a major determinant of private school enrollment. This
choice usually presents no problem. But 1,,nen the question of public
-60-
aid to private education is raised many see a conflict with the commitment
of the United States to the separation of church and state. In addition
to the constitutional question, there is a social issue in the potential
divisiveness of the orientations cf religiously affiliate(' schools.
Specifically, it is sometimes argued that the existence of religiously
affiliated schools isolates youth of different faiths and generates
intolerance of other religious perspectives. Traditionally, this argument
has been applied primarily to Catholic schools, and, because only the
numbers of Catholic schools in the sample are sufficient to allow analysis
in this area, the analyses conducted here will focus on Catholic schools.
In particular, we will examine the extent to which Catholic and non-
Catholic students are segregated from each other as a result of private
education.
Table 3.3.1 gives a picture of the proportions of students from
each of the major religious groups in each school sector. With the
exception of Episcopalians, Catholics, and Jews, the public and the
non-Catholic private sectors tend to be quite similar. While Catholics
make up the overwhelming majority of the student enrollment in the Catholic
school sector, the Catholic contingent in the public schools (30.7 percent)
means that, given the numerical bases, most Catholics are in the public
schools. Also, perhaps contrary to general assumptions, the relative
percentages of Baptists and Lutherans are smaller in the non-Catholic
private sector than they are in the public sector, despite the traditionally
strong Lutheran schools and the increasing numbers of Baptist schools.
Table 3.3.1 shows that there are sharply different proporticns
of Catholic students in the public, Catholic, and other private sectors.
The next question concerns the distribution of Catholic students within
-I
I-, 0
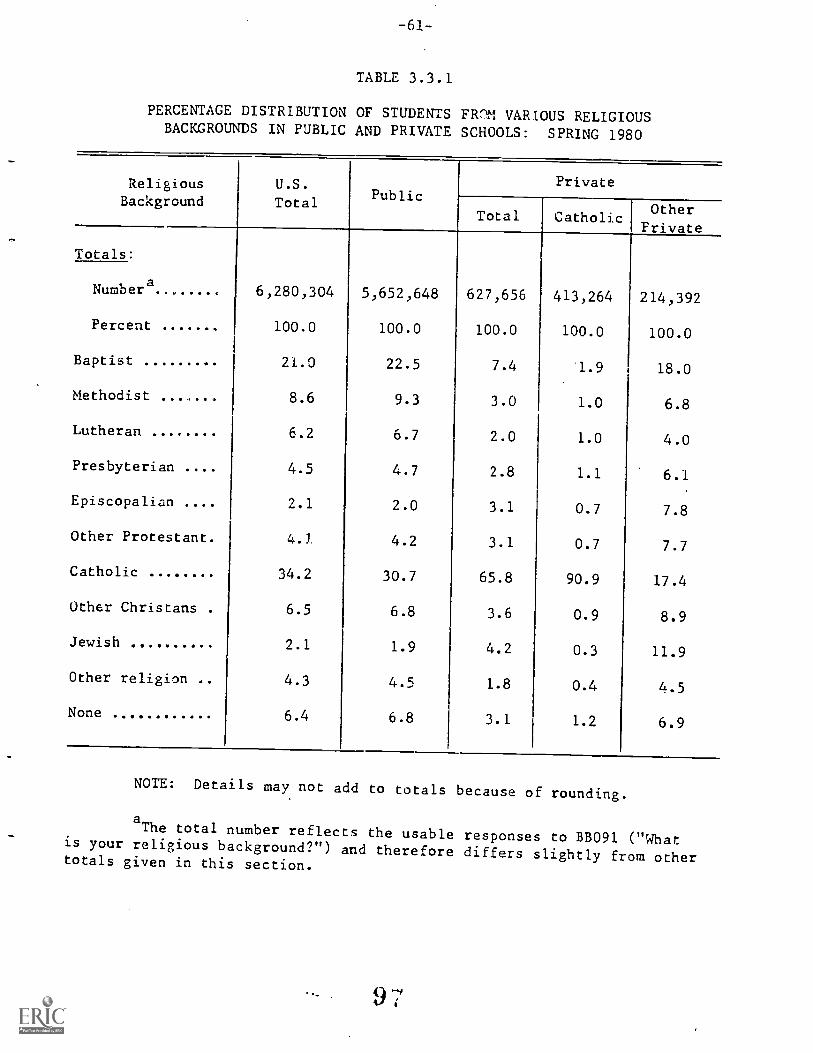
-61-
TABLE 3.3.1
PERCENTAGE DISTRIBUTION OF STUDENTS FR(M VARIOUS RELIGIOUSBACKGROUNDS IN PUBLIC AND PRIVATE SCHOOLS: SPRING 1980
ReligiousBackground
U.S.
TotalPublic
Private
Total CatholicOther
Private
Totals:
Numbera 6,280,304 5,652,648 627,656 413,264 214,392
Percent 100.0 100.0 100.0 100.0 100.0
Baptist 21.0 22.5 7.4 "1.9 18.0
Methodist 8.6 9.3 3.0 1.0 6.8
Lutheran 6.2 6.7 2.0 1.0 4.0
Presbyterian 4.5 4.7 2.8 1.1 6.1
Episcopalian 2.1 2.0 3.1 0.7 7.8
Other Protestant. 4.3 4.2 3.1 0.7 7.7
Catholic 34.2 30.7 65.8 90.9 17.4
Other Christans . 6.5 6.8 3.6 0.9 8.9
Jewish 2.1 1.9 4.2 0.3 11.9
Other religion 4.3 4.5 1.8 0.4 4.5
None 6.4 6.8 3.1 1.2 6.9
NOTE: Details may not add to totals because of rounding.
aThe total number reflects the usable responses to BB091 ("Whatis your religious background?") and therefore differs slightly from othertotals given in this section.
97
-6,-
each of the sectors (and, if the sample of other private schools were
much larger, would also include the distribution of students of other
religious backgrounds among the schools in that sector). Information
on this distribution is given in table 3.3.2. This table shows that
the average Catholic student in the Catholic school sector indeed has
a very low proportion of schoolmates who are non-Catholic (.081), and
that the average non-Catholic student in the public and other private
sectors has a much smaller proportion of Catholic schoolmates (.240
and .125 compared to .805). Turning to the index of segregation, which
standardizes on the differing proportions in each sector, the results
are given in the last row of the table. It is not the case that non-
Catholics and Catholics are more segregated within the Catholic sector
than are non-Catholics and Catholics in public and other private schools.
The opposite is true: non-Catholic and Catholic students are the least
segregated from one another in the Catholic schools (.115). Somewhat
surprisingly, Catholic students are the most segregated in the non-
Catholic private schools, though in no case is the extent of segregation
very high.
The overall religious segregation in U.S. schools as a whOle
is higher than that in any single sector, because of the concentration
of Catholics in Catholic schools. However, it is lower than black-white
segregation and about the same as Hispanic-Ang'o segregation (.30 compared
.49 or .30).
We would expect the Catholic/non-Catholic segregation within
the private sector as a whole to 1.e higher than that in the public sector
or either of the private sectors separately, and it is (63). This means
that, in contrast to the case of black-white segregation, policies that
ci
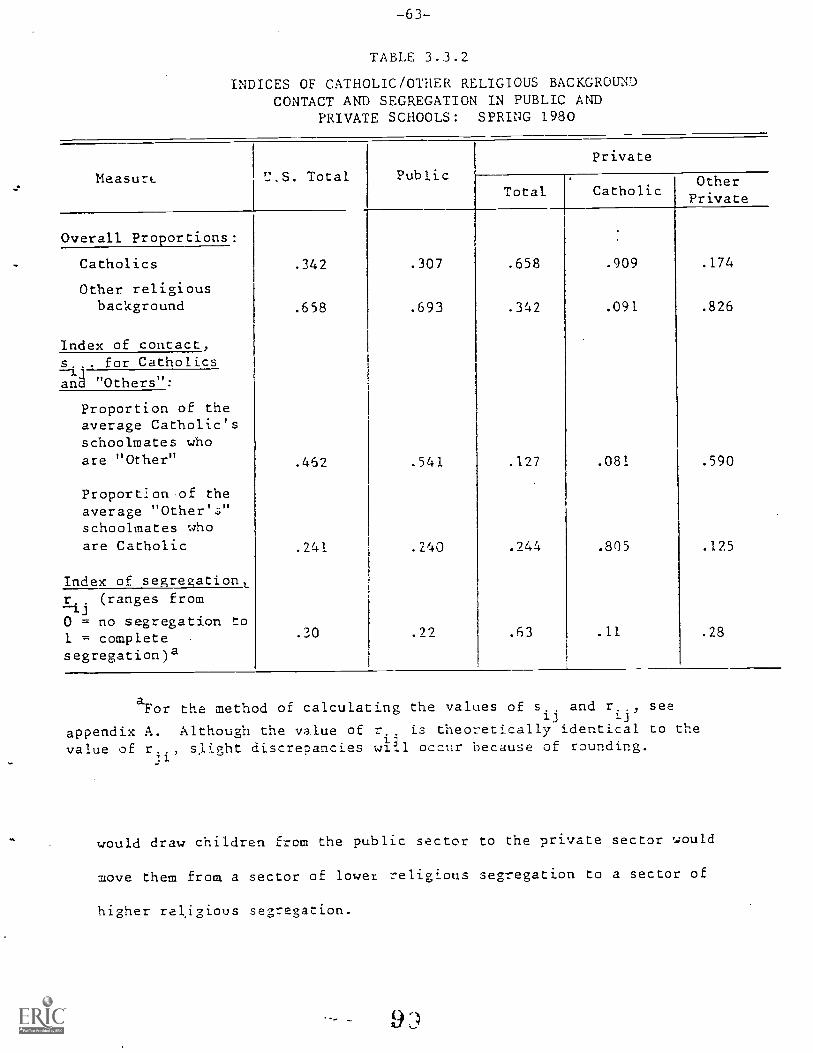
TABLE 3.3.2
INDICES OF CATHOLIC/OTHER RELIGIOUS BACKGROUNDCONTACT AND SEGREGATION IN PUBLIC AND
PRIVATE SCHOOLS: SPRING 1980
MeasurL U.S. Total Public
Private
Total CatholicOtherPrivate
Overall Proportions:
Catholics .342 .307 .658 .909 .174
Other religiousbackground .658 .693 .342 .091 .826
Index of contact,s.., for Catholics
ang "Others":
Proportion of theaverage Catholic'sschoolmates whoare "Other" .462 .541 .127 .081 .590
Proportion of theaverage "Other's"schoolmates whoare Catholic .241 .240 .244 .805 .125
Index of segregation,r. (ranges from1.j0 = no segregation to1 = complete .
segregation)a
.30 .22 .63 .11 .28
aFor the method of calculating the values of sij
and rij
, see
appendixA.Althoughthevalueofris theoretically identical to thevalue of r.., slight discrepancies occur because of rounding.
would draw children from the public sector to the private sector would
move them from a sector of lower religious segregation to a sector of
higher religious segregation.
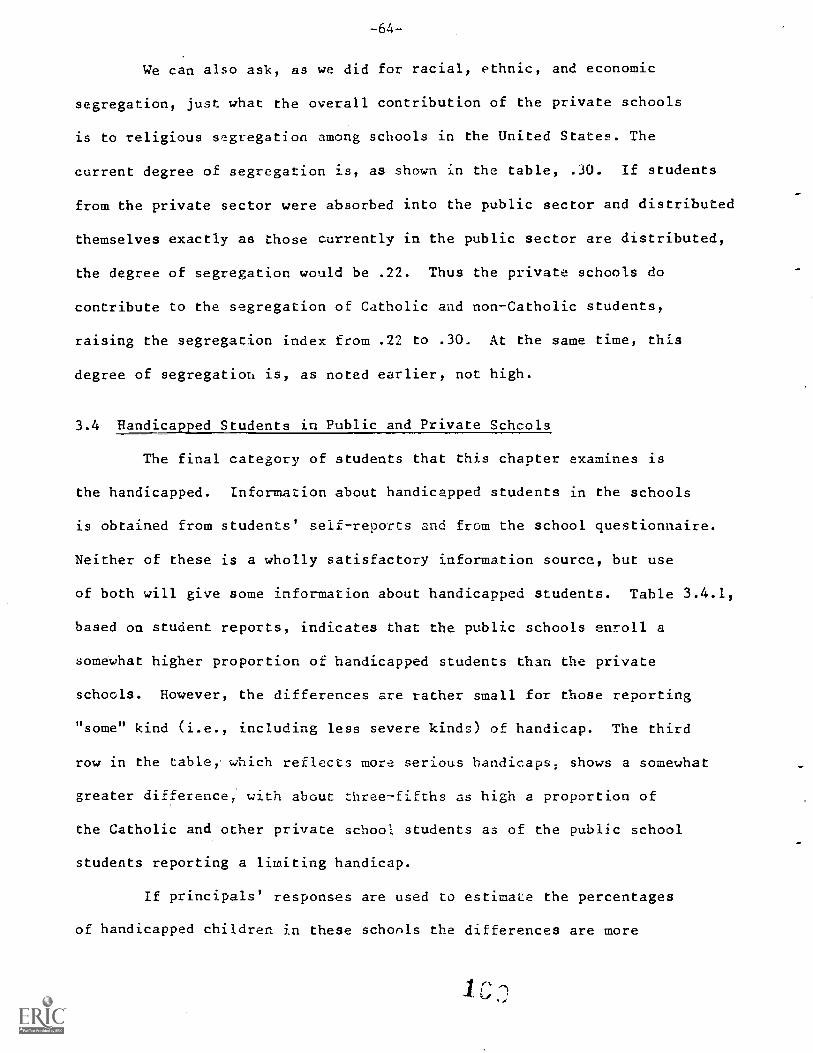
-64-
We can also ask, as we did for racial, ethnic, and economic
segregation, just what the overall contribution of the private schools
is to religious segregation among schools in the United States. The
current degree of segregation is, as shown in the table, .30. If students
from the private sector were absorbed into the public sector and distributed
themselves exactly as those currently in the public sector are distributed,
the degree of segregation would be .22. Thus the private schools do
contribute to the segregation of Catholic avid non-Catholic students,
raising the segregation index from .22 to .30. At the same time, this
degree of segregation is, as noted earlier, not high.
3.4 Handicapped Students in Public and Private Schools
The final category of students that this chapter examines is
the handicapped. Information about handicapped students in the schools
is obtained from students' self-reports and from the school questionnaire.
Neither of these is a wholly satisfactory information source, but use
of both will give some information about handicapped students. Table 3.4.1,
based on student reports, indicates that the public schools enroll a
somewhat higher proportion of handicapped students than the private
schools. However, the differences are rather small for those reporting
"some" kind (i.e., including less severe kinds) of handicap. The third
row in the table, which reflects more serious handicaps, shows a somewhat
greater difference, with about three-fifths as high a proportion of
the Catholic and other private school students as of the public school
students reporting a limiting handicap.
If principals' responses are used to estimate the percentages
of handicapped children in these schools the differences are more
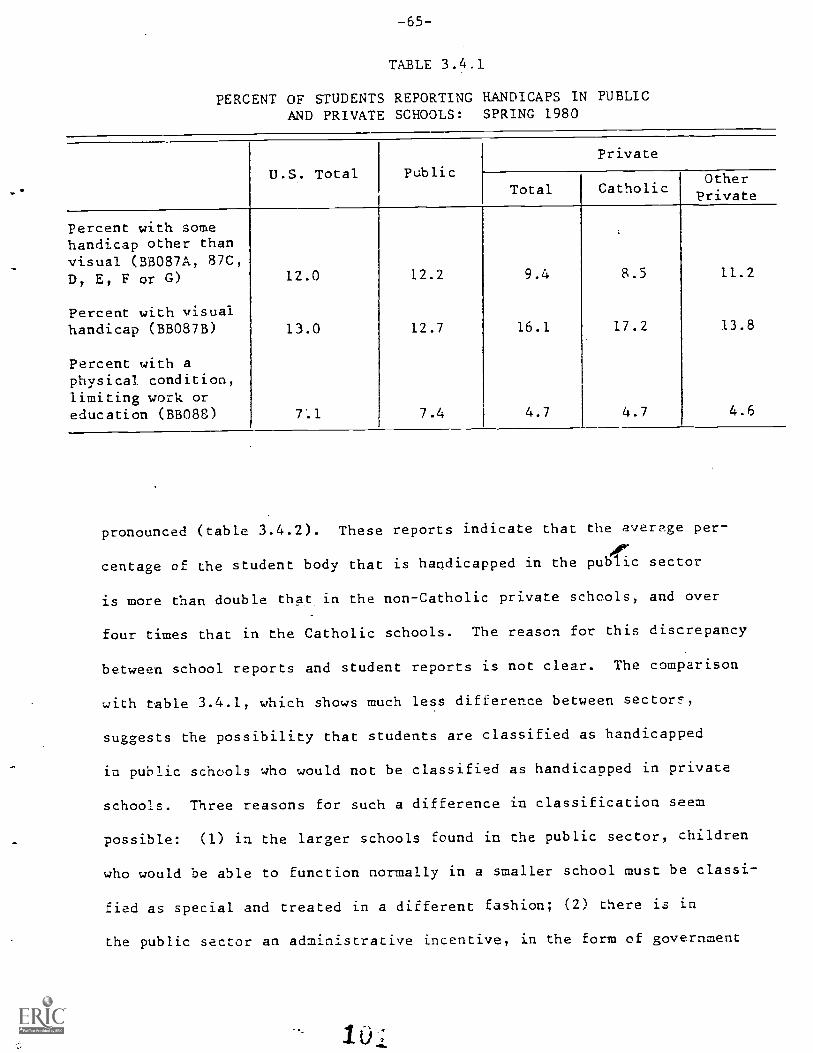
-65-
TABLE 3.4.1
PERCENT OF STUDENTS REPORTING HANDICAPS IN PUBLICAND PRIVATE SCHOOLS: SPRING 1980
U.S. Total Public
private
Total CatholicOtherPrivate
Percent with somehandicap other thanvisual (BB087A, 87C,D, E, F or G) 12.0 12.2 9.4 8.5 11.2
Percent with visualhandicap (BB087B) 13.0 12.7 16.1 17.2 13.8
Percent with aphysical condition,Limiting work oreducation (BMW 7'.1 7.4 4.7 4.7 4.6
pronounced (table 3.4.2). These reports indicate that the average per-
centage of the student body that is handicapped in the public sector
is more than double that in the non-Catholic private schools, and over
four times that in the Catholic schools. The reason for this discrepancy
between school reports and student reports is not clear. The comparison
with table 3.4.1, which shows much less difference between sector!,
suggests the possibility that students are classified as handicapped
in public schools who would not be classified as handicapped in private
schools. Three reasons for such a difference in classification seem
possible: (1) in the larger schools found in the public sector, children
who would be able to function normally in a smaller school must be classi-
fied as special and treated in a different fashion; (2) there is in
the public sector an administrative incentive, in the form of government
-66-
TABLE 3.4.2
MEAN PERCENT OF SCHOOL'S STUDENT BODY THAT IS HANDICAPPED,AS REPORTED BY PRINCIPALS, AND CRITERIA USED TO
CLASSIFY FOR PUBLIC AND PRIVATE SCHOOLS:SPRING 1980
U.S. Total PublicPrivate
Total CatholicOtherPrivate
Mean percentage ofstudents classifiedas handicapped(SB034 t SBOO2A)
percent of schoolsusing variouscriteria toclassify students
standard test
4.2
74.9
4.9
90.1
1.5
28.1
1.1
33.0
2.3
18.2
Federalguidelines 74.6 91.7 18.0 23.4 7.1
Stateguidelines 79.6 96.6 23.0 28.0 12.9
Counselor'sjudgment 90.8 94.5 85.4 94.2 85.4
aid, for classifying children as handicapped, an incentive that does
not exist or less often exists in the private sector; and (3) the more
severely handicapped students, who would not respond to the survey,
may be more numerous in the public sector. In any case, the data are
clearly not sufficient for making inferences about the relative propor-
tions of handicapped children in public and private schools.
Altogether, the information from the survey about handicapped
children in public and private schools is not highly conclusive. It
does show in broad outlines that public schools do serve proportionately
10 2
-67-
more handicapped students, but that there are nonnegligible proportions
of handicapped children in private schools--both Catholic and non- Catholic--
as well.
3.5 The Predicted Impact of a Policy Change
Facilitating Enrollment in Private Schools
It is possible to go a step further than we have gone thus far.
There has been much discussion recently about the effects in various
quarters of reducing the financial burden of private education. One
proposal, which came near passage in Congress, was to provide tax credits
for a portion of school tuition. Another widely discussed proposal
urged the use of educational vouchers to allow'all children to chooses
freely among private and public schools.
It has been have argued that such changes as this would differen-
tially benefit the white upper-middle class, who use private schools
more. Such changes would, in this view, extend still further the creaming
process which leaves the poor and minorities in the public schools.
Others argue that such measures would place private schooling in the
reach of those who cannot now afford it, and thus differentially benefit
minorities and those less well off financially.
It is possible with these data to predict what students would
be recruited into private schools by a reduction in the financial burden,
although a less direct reduction than that in either of these policy
proposals. In particular, we know for each income level the proportions
of students from-a given group (say, Catholics, or blacks) in private
schools (figures 3.1.1, 3.1.2, 3.1.3, and 3.1.4). This tells us the
income elasticity of private schooling for each of these groups. Thus
we can predict the recruitment ilto private schools from each group
768-
that would take place if there were a change that increased income by
a fixed amount for all, as well as the defection from private 'schools
that would take place if income were reduced by a fixed -vnount fcr all.
We ask the former question, first with respect to whites, blacks, and
Hispanics and second with respect to students from families with differ-
ent income levels. Suppose income were increased by $1,000 for all,
for example by a tax rebate or by a general increase in the standard
of living. Would this mean that racial and economic segregation between
public and private schools would be increased, by increasing the flow
of white and middle- and upper-middle-class children into the private
schools? Or would it mean that racial and economic segregation between
these sectors would be decreased, as more blacks and Hispanics and lower
income children in general came into the private schools?
This question can be answered by use of two items of information:
the number of Hispanics, blacks, and non-Hispanic whites and the number
of all children in the public school sector at each income level; and
the increment in the proportion of students in private schools per $1,000
income increase at each income level for each group. Following the
order of presentation of the earlier parts of this section, we will
first examine the effects of this hypothetical policy change on the
distribution of blacks, Hispanics, and whites among the school sectors.
Figure 3.1.1 (presented earlier) shows that the increase in
the proportion of students attending Catholic schools with increase
in income (the slope of the curse) is greatest for Hispanics. It is
greater for whites than for blacks at low income levels, but, somewhat
surprisingly, greater for blacks than for whites at high income levels.
Figure 3.1.2 shows that for all three racial and ethnic groups the increase
-69--
in the proportion attending other private schools is lower than that
for Catholic schools, except at the highest income levels for non-
Hispanic whites. The curve is especially fat for blacks, except at
the upper extreme of income.
Table S.5.1 gives the numbers on which figures a.1.1 and 3.1.2
are based. For example, the figure of 3.0 percent in the upper left
corner means that 3.0 percent of all the non-Hispanic whites from families
earning below $7,000 in the United States are enrolled in Catholic schools.
These numbers make it possible to calculate the frequencies at which
whites, blacks, and Hispanics currently within the public sector could
be expected to shift into the private sector, given an increase in
income of $1,000. The upward elopes in figure 3.5.1 for each of the
three racial or ethnic groups are reflected in the steady increments
in the percentages of each of these three groups enrolled in the Catholic
schools at increasIng levels of income. Similarly, the relative flatness
of the curves for blacks and Hispanics in other private schools are
reflected in the small changes in percentages in rows 5 and 6 of table
3.5.1
To estimate the numbers of whites, blacks, and Hispanics currently
in the public schools who world shift to the private schools if their
families had incomes greater by $1,000, we calculate the enrollments
of each group in each sector from figures 3.1.1 and 3.1.2. and table
3.5.1 with income shifted upward by $1,000. This assumes that the families
at the new income levels would have the same rates of private school
enrollment as families currently at that level.
To illustrate how such a calculation is made, let us suppose
that 3 percent of the students Irma-families earning between $7,0004-,10
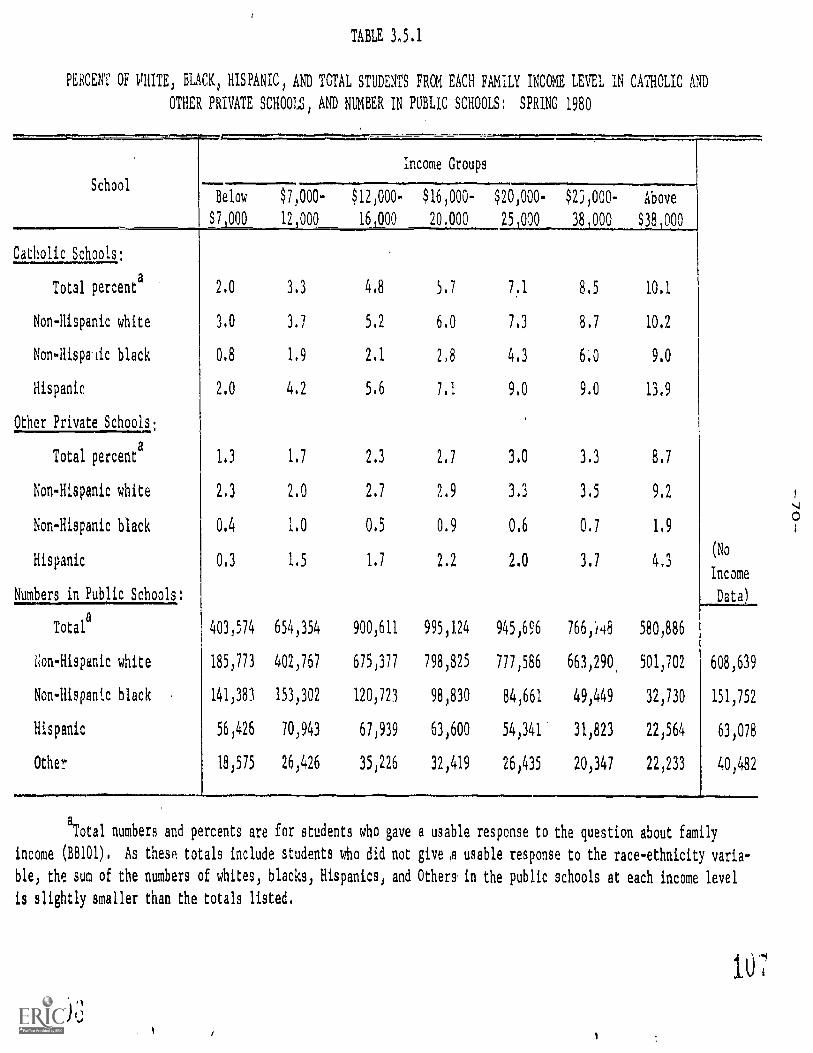
TABLE 3,5.1
PERCENT OF VETE, BLACK, HISPANIC, AND TOTAL STUDENTS FROM EACH FAMILY INCOME LEVEL IN CATHOLIC AND
OTHER PRIVATE SCHOOLS, AND NUMBER IN PUBLIC SCHOOLS: SPRING 1980
Income Groups
SchoolBelow $7,000- $12,000- $16,000-
7,000 12,000 16,000 20,000
Catholic Schools:
Total percenta 2.0 3.3 4.8 5.7
Non-Hispanic white 3.0 3.7 5.2 6.0
Non - Hispanic black 0.8 1.9 2.1 2,8
Hispanic 2.0 4.2 5.6 7.1
Other Private Schools:
Total percenta 1.3 1.7 2.3 2.7
Non-Hispanic white 2,3 2.0 2.7 2.9
Non-Hispanic black 0.4 1.0 0.5 0.9
Hispanic 0.3 1.5 1.7 2.2
Numbers in Public Schools:
Total 403,574 654,354 900,611 995,124
on-Hispanic white 185,773 402,767 675,377 798,825
Non-Hispanic black 141,383 153,302 120,723 98,830
Hispanic 56,426 70,943 67,939 63,600
Other 18,575 26,426 35,226 32,419.M.MM*1
,.rwo-....n-mor.,....m.m
$20,000- $25,000- Above
25 000 38 000 38 000
7.1
7.3
4.3
9,0
3.0
3.3
0.6
2.0
945,656
777,586
84,661
54,341
26,435
8.5 10.1
8.7 10.2
6;0 9.0
9.0 13.9
3.3
3.5
0.7
3.7
766;48
663,290,
49,449
31,823
20,347
8.7
9.2
1.9
4.3
580,886
501,702
32,730
22,564
22,233
(No
Income
Data)
608,639
151,752
63,078
40,482
a
Total numbers and percents are for students who gave a usable response to the question about family
income (88101). As these totals include students who did not give A usable response to the race-ethnicity varia-
ble, the sum of the numbers of whites, blacks, Hispanics, and Others. in the public schools at each income level
is slightly smaller than the totals listed,
tu
-71-
and $8,000 and 5 percent cf the students from families earning between
$8,000 and $9,000 are enrolled in private schools. Then, if income
is increased by $1,000, the rates of private-school enrollment for
students from the families who had had income levels of $7,000 to $8,000
would increase from 3 percent to 5 percent. If there are 100,000 students
from families at that income level, the increase in the number of students
in private schools would be 100,000 x .02, or 2,000. As the seven income
categories that our data provide have intervals larger than $1,000 adjus
ments must be made to carry out the calculations. This procedure is
described in the note to table 3.5.2.
Table 3.5.2 gives the results of the calculations: the expected
numbers of whites, blacks, and Hispanics who would shift from the public
schools to private schools with an increase of $1,000 in family income,
and the racial and ethnic compositions of the group shifting. The
results of this hypothetical experiment are interesting. First, only
a very small proportion of public school students would less
than half of 1 percent of any of the three groups. Second, and somewhat
surprising, the greatest shift would come among the Hispanics. Third,
in both of the private sectors, the racial and ethnic composition of
the group shifting (column 3) includes more minorities than does the
current composition of these schools. Fourth, among those shifting
into the Catholic sector, there is. a higher proportion of minorities
(column 3, .12 + .11 = .23) than. in U.S. schools as a whole (column
5, .13 + .07 = .20); but this is not true in the other priva.:a sector
(.03 + .06 = .09).
Altogether, what can be said in response to the questions posed
is that the racial segregation between the public and the private schools
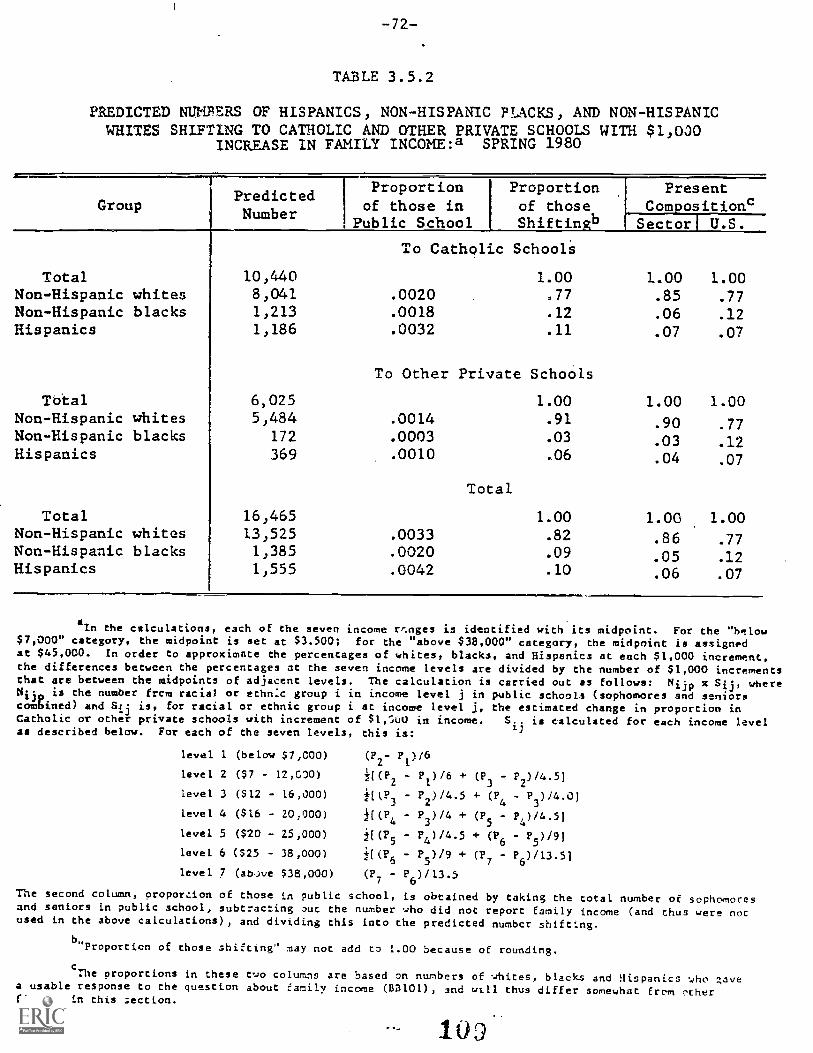
-72-
TABLE 3.5.2
PREDICTED NUMBERS OF HISPANICS, NON-HISPANIC BLACKS, AND NON-HISPANICWHITES SHIFTING TO CATHOLIC AND OTHER PRIVATE SCHOOLS WITH $1,030
INCREASE IN FAMILY INCOME:a SPRING 1980
Group
TotalNon-Hispanic whitesNon-Hispanic blacksHispanics
TotalNon-Hispanic whitesNon-Hispanic blacksHispanics
TotalNon-Hispanic whitesNon-Hispanic blacksHispanics
PredictedNumber
Proportionof those in
Public School
Proportionof thoseShiftinstb
PresentCompositions
Sector U.S.
10,4408,0411,2131,186
To Catholic School's
1.00.0020 .77
.0018 .12
.0032 .11
1.00.85
.06
.07
1.00.77
.12
.07
To Other Private Schools
6,025 1.00 1.00 1.005,484 .0014 .91 .90 .77
172 .0003 .03 .03 .12369 .0010 .06 .04 .07
Total
16,465 1.00 1.00 1.0013,525 .0033 .82 .86 .771,385 .0020 .09 .05 .121,555 .0042 .10 .06 .07
dln the calculations, each of the seven income ranges is identified with its midpoint. For the "below$7,000" category, the midpoint is set at $3.500; for the "above $38,000" category, the midpoint is assignedat $45,000. In order to approximate the percentages of whites, blacks, and Hispanics at each $1,000 increment,the differences between the percentages at the seven income levels are divided by the number of $1,000 incrementsthat are between the midpoints of adjacent levels. The calculation is carried out as follows: Nyjp x Sij, whereN--13P is the number frcm racial or ethnic group i in income level j in public schools (sophomores and seniors
combined) and Sij is, for racial or ethnic group i at income level j, the estimated change in proportion inCatholic or other private schools with increment of $1,";u0 in income. Si. is calculated for each income level
7.1as described below. For each of the seven levels, this is:
level 1 (below $7,C00) (Pz- P1)/6
level 2 ($7 - 12,00) 1[(P2 - P1)/6 + (P3 - P2)/4.5J
level 3 (S12 - 16,000) i(kP3 P2)14.5 4- (P4 - P3)/4.0)
level 4 ($16 - 20,000) if(P4 P3)/4 + (P5 - P4)/4.51
level 5 ($20 - 25,000) i[(P5 P4)14.5 + (P6 - P5) /9J
level 6 ($25 - 38,000) it(P6 P5)/9 + (P7 - P6)/13.5]
level 7 (abwe $38,000) (P7 - P6)/13.5
The second column, oroporcion of those in public school, is obtained by taking the total number of sophomoresand seniors in public school, subtracting out the number who did not report family income (and thus were notused in the above calculations), and dividing this into the predicted number shifting.
bProportion of those shifting" may not add to 1.00 because of rounding.
cThe proportions in these two columns are based on numbers of whites, blacks and Hispanics who qave
a usable response to the question about family income (B3101), snd will thus differ somewhat from otherfigures in this section.
10
-73-
as a whole would be reduced by such a change, because the proportion
of minorities among those coming into the private schools would be some-
what greater than the proportion already in these schools--and that
this would come about primarily through the shifts of minorities (especially
Hispanics and higher income blacks) into the Catholic schools. Thus
the rommon belief that policies encouraging attendance at private schools
would increase racial and ethnic segregation is not at all supported
by these data, since the data indicate that for Catholic schools, which
constitute two-thirds of the private sector, both blacks and Hispanics
would respond to financial incentives to as great an,extent as, or to
a greater extent than, whites, and that both parts of the private sector
would come to have higher proportions of minorities than they now do.
Using the same hypothetical policy change, we can calculate
the number of students from each income level that could be expected
to shift from the public to the private schools as a result of such
4 change. The figures needed for this calculation are given in table
3.5.1 in the rows labeled "Total," and the method is the same as that
described in the note to table 3.5.2.
Table 3.5.3 gives the results of this exercise. In order to
simplify the presentation, the seven-category income variable (BB101)
is collapsed into three categories. The figures under the "Total" heading
show the combined shifts into both private sectors. Column 2 shows
that this policy change would lead about equal proportions of students
from the three income levels to shift. This would mean, as shown in
column 3, that the income composition of those shifting would be .191
in the lowest income category, .370 in the middle category, and .440
in the highest category. This distribution is much less skewed than
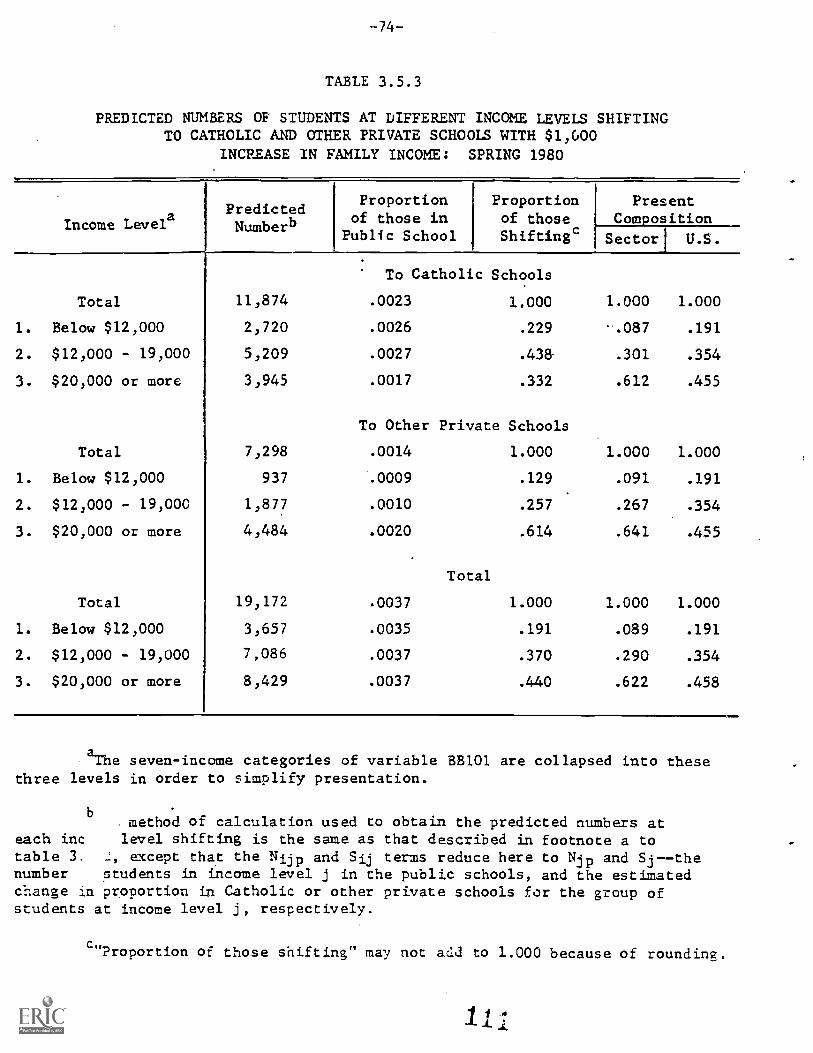
TABLE 3.5.3
PREDICTED NUMBERS OE STUDENTS AT DIFFERENT INCOME LEVELS SHIFTINGTO CATHOLIC AND OTHER PRIVATE SCHOOLS WITH $1,600
INCREASE IN FAMILY INCOME: SPRING 1980
Income LevelaPredictedNumberb
Proportion Proportion Presentof those in of those Com osition
Public School Shiftingc Sector U.S.
To Catholic Schools
Total 11,874 .0023 1,000 1.000 1.000
1. Below $12,000 2,720 .0026 .229 -.087 .191
2. $12,000 - 19,000 5,209 .0027 .43& .301 .354
3. $20,000 or more 3,945 .0017 .332 .612 .455
To Other Private Schools
Total 7,298 .0014 1.000 1.000 1.000
1. Below $12,000 937 .0009 .129 .091 .191
2. $12,000 - 19,000 1,877 .0010 .257 .267 .354
3. $20,000 or more 4,484 .0020 .614 .641 .455
Total
Total 19,172 .0037 1.000 1.000 1.000
1. Below $12,000 3,657 .0035 .191 .089 .191
2. $12,000 - 19,000 7,086 .0037 .370 .290 .354
3. $20,000 or more 8,429 .0037 .440 .622 .458
aThe seven-income categories of variable BB101 are collapsed into thesethree levels in order to simplify presentation.
bmethod of calculation used to obtain the predicted numbers at
each inc level shifting is the same as that described in footnote a totable 3. except that the Nijp and Sij terms reduce here to Njp and Si--thenumber students in income level j in the public schools, and the estimatedchange in proportion in Catholic or other private schools for the group ofstudents at income level j, respectively.
"Proportion of those shifting" may not acld to 1.000 because of rounding.
-75-
that currently in the private schools, and is approximately the same
as the overall U.S. distribution. The conclusion, tben, is that a
policy change of this sort would function to decrease the between-sector
economic segregation.
The patterns for Catholic schools and the other private schools
reveal some interesting differences. Studeats from lower- and middle-.
income families would constitute a far larger proportion of the incoming
students in the Catholic schools then in the other private schools (.229
+ .438 = .667 versus .129 + .257 = .386). Nonetheless, when the propor-
tions shifting are compared to the proportions currently enrolled, it
is clear that in both private school sectors the income distribution
would move in the direction of the overall U.c distribution.
Though this hypothetical experiment is suggestive, it would
be better if we were able to predict the results of a different policy,
such as a tuition tax credit, say of $500. Such a credit would have
the effect of reducing the tuition for private schools by $500 divided
by the number of children a family has in school. To make such a predic-
tion, however, we would need information on the price elasticity of
private schooling for each of these groups, rather than on income elasticity.
By making some heroic assumptions, one might be able to use these data
to estimate something about the effect of such a policy; but we will
not do so here because we are unwilling to make such assumptions.
CHAPTER 4
SCHOOL RESOURCES
The physical and human resources available in a school constitute
the boundaries of opportunity for students within that school. Only,
for insance, if calculus is taught at a school should one anticipate
that students at that school may master certain mathematical principles.
Sy school resources, then, we refer to course offeringsprGrided to
students, physical facilities available to students, special and federally
tended programs, and t1-3 quantity, quality and breadth of teaching
and professional support personnel.
The debate concerning the relative merits of private and public
sec/..-Ldary schools incorporates some presumed resource differences between
these two sectors. For example, some argue that public schools, because
of their size and school district linkages, can provide a wider range
of course offerings to students. And, insofar as size continues to
distinguish puYlic schools from other types, they will provide a broader
range more efficiently. Others have argued that the limitations of
private schools is this area are more than compensated for by the greater
attention that students receive in the private sector. This chapter
provides information relevant to this aspect of the public-versus-private
debate.
In comparing school resources, we include the two special subgroups
of schools referred to in chapter 1, high-performance public schools
and high-performance private schools. Although the selection of these
schools was based not on representativeness but on the proportion of
high-performing seniors, the resources available tc students in them
-77-
show something about what exists in public and private schools where
academic performance is especially high. For simplicity of exposition,
we sometimes refer to these subgroups of schools as "sectors," but when
we speak of the "three school sectors," the reference is always to the
public, Catholic, and other private sectors.
The school questionnaire provides informaticn on a number of
resources provided by the school, but our analysis will be limitd in
certain areas. The most important omission is the general level of
expenditure at schools. Principals were informed that they need not
respond to an item about per-pupil expenditure if they had recently
provided this information in an NCES survey. Since this information
had been provided by many schools in the preceding year, the item remained
unanswered for a large number of schools. Until the data from these
earlier surveys are added, per-pupil expenditure is unavailable for
analysis.
For certain resources (those that varied according to school
enrollment), two tables will be presented: one that reports the percentage
of schools within each sector having a particular resource and one that
reports the percentage of sophomore students'within each sector attending
a school where a particular resource exists (referred to as student
accessibility).1
This manner of presentation allows examination of
1To determine the percentage of sophomores in each sector having
access to the course the response on each item was weighted by the sumof sophomore weights attached to that school. These weighted responseswere then summed for each sector to determine the percentage of sophomoreshaving access to each resource. The proportion of sophomores in thetotal student population represented by a given school is slightly differentfrom the proportion of seniors, primarily because of differential dropoutbetween the sophomore and senior years. However, in the analysis weassume that this weighted sophomore estimate is sufficiently close tothat for the high school student body as a whole that we can simplymake reference to "students" within various sectors.
Obviously, our term "access" cannot be strictly correct forthose courses with prerequisites. A student must 'nave had second-year
114
. -78-
both the resource variability among sectors and, through a comparison
of the two tables, the extent to which certain resources are disproportionately
found at larger schools. Most of the analysis, however, focuses on
the accessibility of various resources within each sector.
4.1 Course Offerings
Table 4.1.1 shows the percentage of schools within each sector
offering a selected sample of academic, technical, and vocational courses.
The items were taken from a larger list in the school questionnaire
(see appendix B). The percentage of students within each type of school
having access to these courses is reported in table 4.1.2. Our analysis
will begin with mathematics and science, those courses presumed to be
the most demanding, as well as especially important to the successful
pursuit of many branches of postsecondary education.
4.1.1 Mathematics and science courses
Nationally, nearly all schools offer algebra 2 and geometry
(95 to 100 percent). A smaller percentage of schools offer trigonometry
(76 percent) and calculus (47 percent), but table 4.1.2 shows that
student access to these subjects is better than these percentages suggest:
84 percent of students have access to trigonometry and 62 percent to
calculus. However, variations do exist among sectors for some mathematics
and science course offerings. For example, nearly all students in high
performance public and private schools have access to a calculus course,
as compared with 63 percent in public schools, 71 percent in Catholic
schools, and 61 percent in other private schools. For the country as
a whole, nearly all students have access to physics and chemistry (96
French to be eligible for (and therefore have access to) third-yearFrench. The use of the term "access" has been chosen, then, to reducethe degree of convolution necessary to communicate the variation amongsectors from the student's perspective.
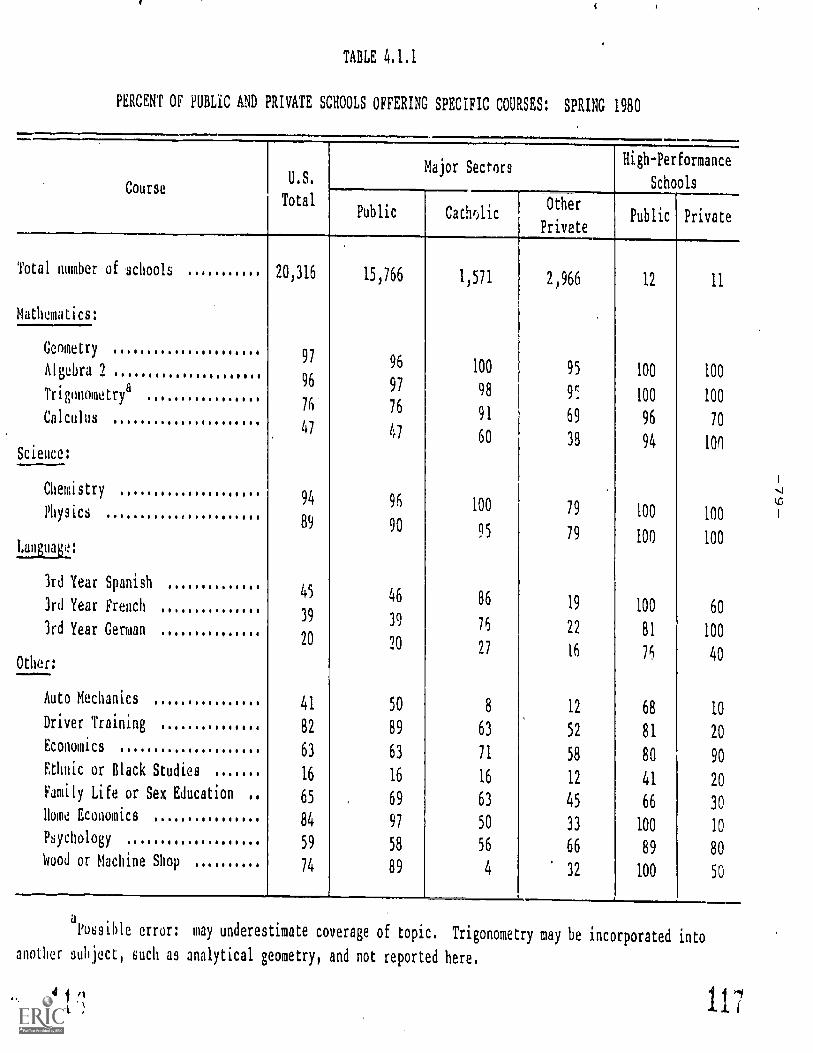
TABLE 4.1.1
PERCENT OF PUBLIC AND PRIVATE SCHOOLS OFFERING SPECIFIC COURSES: SPRING 1980
EN 04....
CourseU.S.
Major SectorsHigh-Performance
Schools
TotalPublic Catholic
Other
PrivatePublic Private
Total number of schools 20,316. 15,766 1,571 2,966 12 11
Mathematics:
Geometry
Algebra 997 96 100 95 100 100
Trigonometrya
Calculus
96
76'
97
76
98
91
')
69
100
96
100
7047 47 60 38 94 100
Science:
Chemistry
Physics94 96 100 79 100 10089 90
95 79 100 100Language:
3rd Year Spanish
3rd Year French45 46 86
19 100 60
3rd Year German39 39 76 22 81 10020 20 27 16 76 40
Other:
Auto Mechanics41 50 8 12 68 10
Driver Training 82 89 63 52 81 20Economics 63 63 71 58 80 90Ethnic or Black Studies
16 16 16 12 41 20Family Life or Sex Education . 65
. 69 63 45 66 30Home Economics
84 97 50 33 100 10Psychology 59 58 56 66 89 80Wood or Machine Shop
74 89 4 32 100 50
`Possible error: may underestimate coverage of topic, Trigonometry may be incorporated into
another subject, such as analytical geometry, and not reported here.
k 117
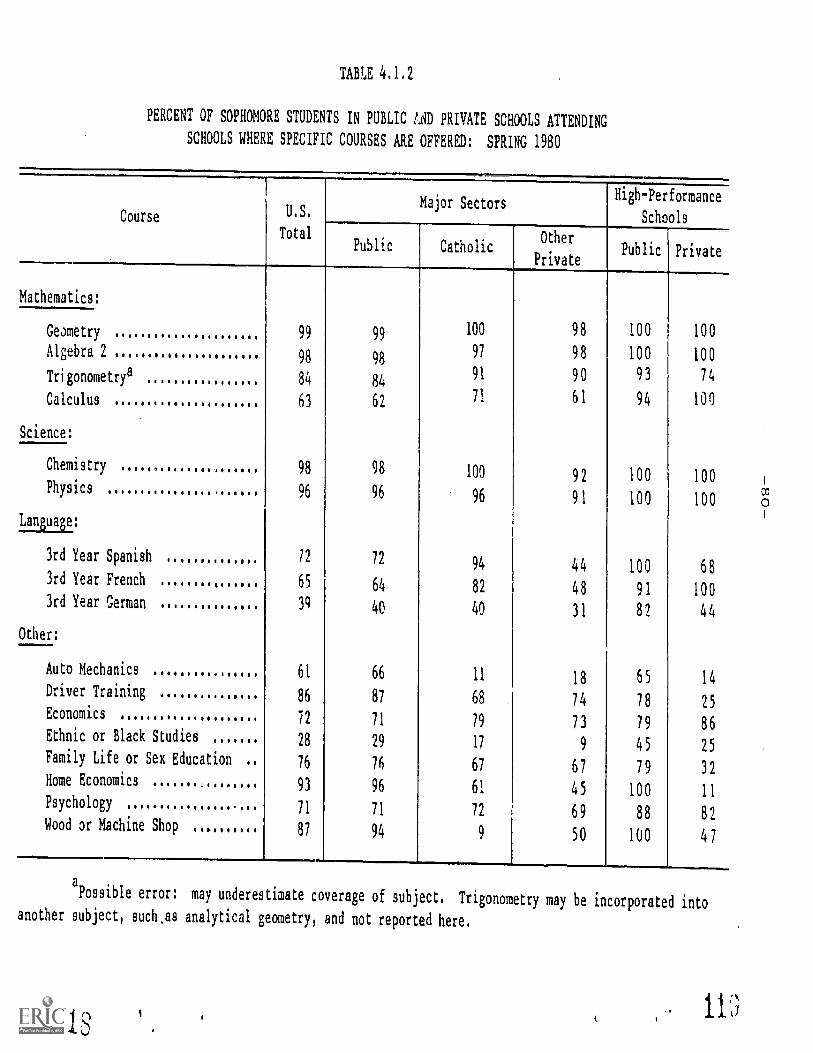
TABLE 4.1.2
PERCENT OF SOPHOMORE STUDENTS IN PUBLIC LAD PRIVATE SCHOOLS ATTENDING
SCHOOLS WHERE SPECIFIC COURSES ARE OFFERED: SPRING 1980
Course U.S.Major Sectors
High-Performance
Schools
TotalPublic Catholic
PrivatePrivatPublic Private
Mathematics:
Geometry 99 99100 98 100 100
Algebra 298 98
97 98 100 100
Trigonometrya 84 8491 90 93 74
Calculus 63 62 71 61 94 100
Science:
Chemistry 98 98 100 92 100 100Physics 96 96
' 96 91 100 10 0
Language:
3rd Year Spanish 72 7294 44 100 68
3rd Year French 65 64 82 48 91 1003rd Year German 39 40 40 31 82 44
Other:
Auto Mechanics 61 66 11 18 65 14Driver Training 86 81 68 14 78 25Economics 72 71 79 73 79 86Ethnic or Black Studies 28 29 17 9 45 25Family Life or Sex Education 76 76 61 67 79 32Home Economics
93 96 61 45 100 11Psychology
71 71 72 69 88 82Wood or Machine Shop
87 94 9 50 100 47
a
Posslble error: may underestimate coverage of subject. Trigonometry may be incorporated intoanother subject, such,as analytical geometry, and not reported here.
11 s
-82--
But the different sectors vary considerably in their offerings.
Among the three sectors, Catholic schools show the most extensive language
offerings: more than three quarters offer third-year French and even
more offer third-year Spanish; less than half of the public schools
and less than a quarter of the other priva:c schools offer these courses.
In all three sectors, only about a quarter or less of schools offer
third-year German. Both public and private high-performance schools
have more extensive language offerings than the schools in any of the
Three major sectors, but German is available less often than the other
two languages even in these schools.
Student access to these courses provides a different view on
the question, revealing more clearly the differences in opportunities
among the sectors. The other private and public sectors show' the largest
shift, indicating the great variation in language course offerings between
large and small schools in these two sectors. In general, it is in
the smaller schools Lhat these courses are not offered, so that the
?ercentage of students having access to the courses is greater than
the percentage of schools offering them.
In addition to the variation in language course offerings with
school size in the public and other private sectors, patterns not shown
in the tables appear noteworthy. Third-year courses in one language
appear to be offered at the expense of similarly advanced courses in
other languages in both the public and other private sectors. Moreover,
73 percent of the- other private schc)ls offer no third-year language
courses, leaving 44 percent of the students without access to any third-
year language. In contrast, the majority of Catholic schools offer
third-year courses for at least two languages.
-81-
percent and 98 percent, respectively) and there are only slight differences
among sectors. In every sector, over 90 percent of the students have
access to these basic science courses.
Thus, there is only one substantial difference in science and
mathematics course accessibility among these sectors--calculus--and
it arises in the high-performance schools, in both the public and private
sectors. Among the three sectors, Catholic schools show slightly higher
accessibility rates for science and mathematics courses than do public
or other private schools.
4.1.2 Language courses
Language course offerings, in addition to their presumed value
in augmenting one's mastery of English, provide the skills relevant
to several dimensions of adult life. For instance, German has traditionally
been considered the second language of serious academic pursuits, French
the language of culture, and Spanish the practical language of American
citizens. Although one should be quite cautious in making inferences
from such a typology, it may provide some orientation to the differences
in language learning opportunities among public, Catholic, and other
private schools.
In order to assess the degree to which students have an opportunity
to acquire mastery of these languages, school administrators were asked
to report whether their schools offered third-year Spanish, French,
and German. Nationally, 45 percent of the schools offer third-year
Spanish, 39 percent third-year French, and 20 percent third-year German.
Overall, this shows very little attention to foreign languages in an
era in which there is more international mobility and communication
than ever before.
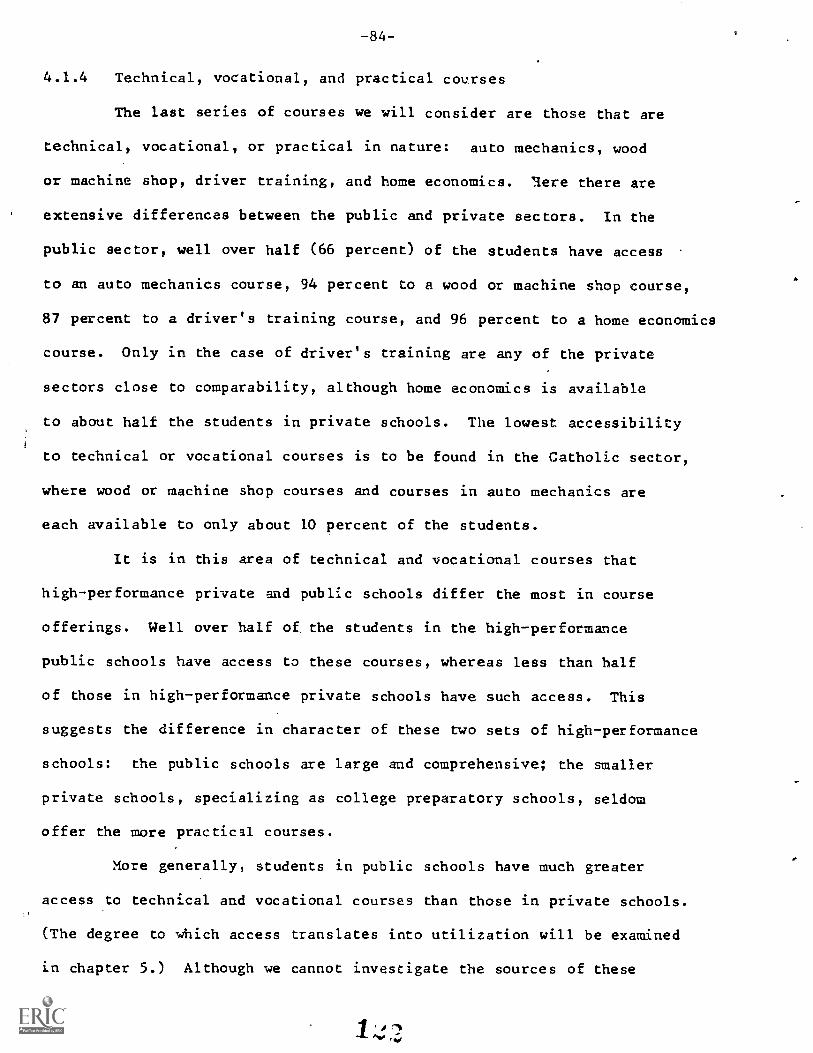
-84-
4.1.4 Technical, vocational, and practical courses
The last series of courses we will consider are those that are
technical, vocational, or practical in nature: auto mechanics, wood
or machine shop, driver training, and home economics. Mere there are
extensive differences between the public and private sectors. In the
public sector, well over half (66 percent) of the students have access
to an auto mechanics course, 94 percent to a wood or machine shop course,
87 percent to a driver's training course, and 96 percent to a home economics
course. Only in the case of driver's training are any of the private
sectors close to comparability, although home economics is available
to about half the students in private schools. The lowest accessibility
to technical or vocational courses is to be found in the Catholic sector,
where wood or machine shop courses and courses in auto mechanics are
each available to only about 10 percent of the students.
It is in this area of technical and vocational courses that
high-performance private and public schools differ the most in course
offerings. Well over half of the students in the high-performance
public schools have access to these courses, whereas less than half
of those in high-performance private schools have such access. This
suggests the difference in character of these two sets of high-performance
schools: the public schools are large and comprehensive; the smaller
private schools, specializing as college preparatory schools, seldom
offer the more practical courses.
More generally, students in public schools have much greater
access to technical and vocational courses than those in private schools.
(The degree to which access translates into utilization will be examined
in chapter 5.) Although we cannot investigate the sources of these
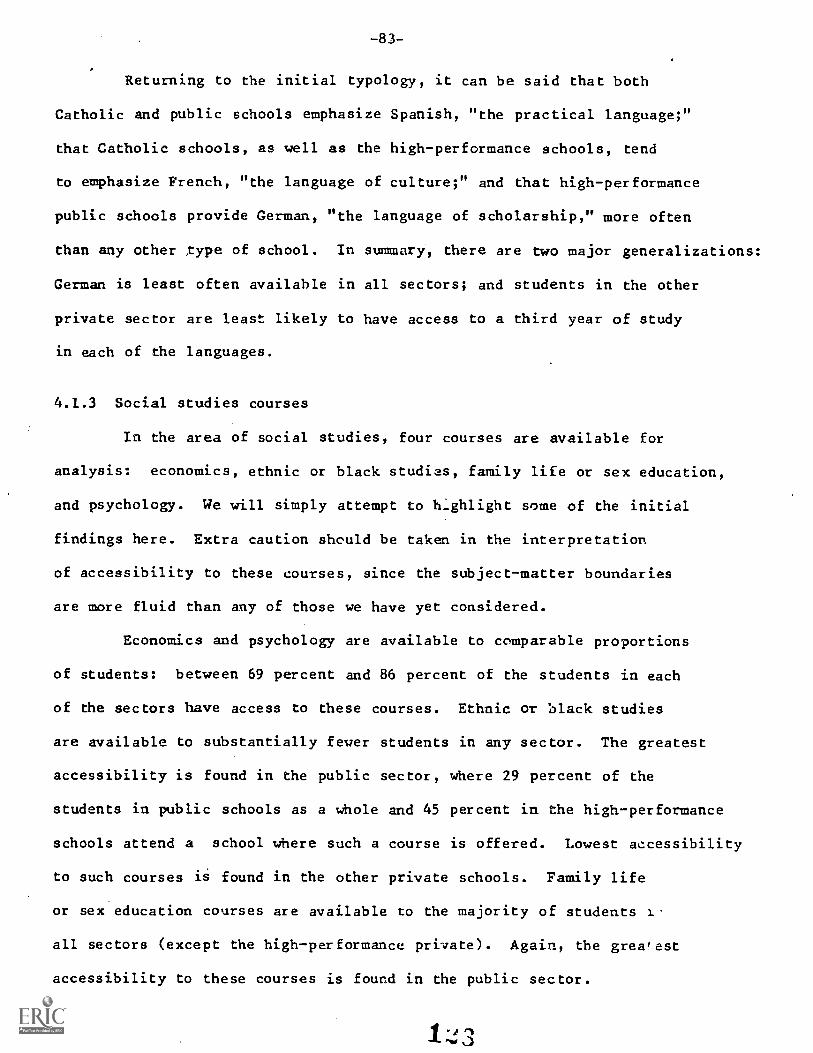
-83-
Returning to the initial typology, it can be said that both
Catholic and public schools emphasize Spanish, "the practical language;"
that Catholic schools, as well as the high-performance schools, tend
to emphasize French, "the language of culture;" and that high-performance
public schools provide German, "the language of scholarship," more often
than any other ,type of school. In summary, there are two major generalizations:
German is least often available in all sectors; and students in the other
private sector are least likely to have access to a third year of study
in each of the languages.
4.1.3 Social studies courses
In the area of social studies, four courses are available for
analysis: economics, ethnic or black studies, family life or sex education,
and psychology. We will simply attempt to highlight some of the initial
findings here. Extra caution should be taken in the interpretation
of accessibility to these courses, since the subject-matter boundaries
are more fluid than any of those we have yet considered.
Economics and psychology are available to comparable proportions
of students: between 69 percent and 86 percent of the students in each
of the sectors have access to these courses. Ethnic or black studies
are available to substantially fewer students in any sector. The greatest
accessibility is found in the public sector, where 29 percent of the
students in public schools as a whole and 45 percent in the high-performance
schools attend a school where such a course is offered. Lowest accessibility
to such courses is found in the other private schools. Family life
or sex education courses are available to the majority of students c-
all sectors (except the high-performance private). Again, the greatest
accessibility to these courses is found in the public sector.
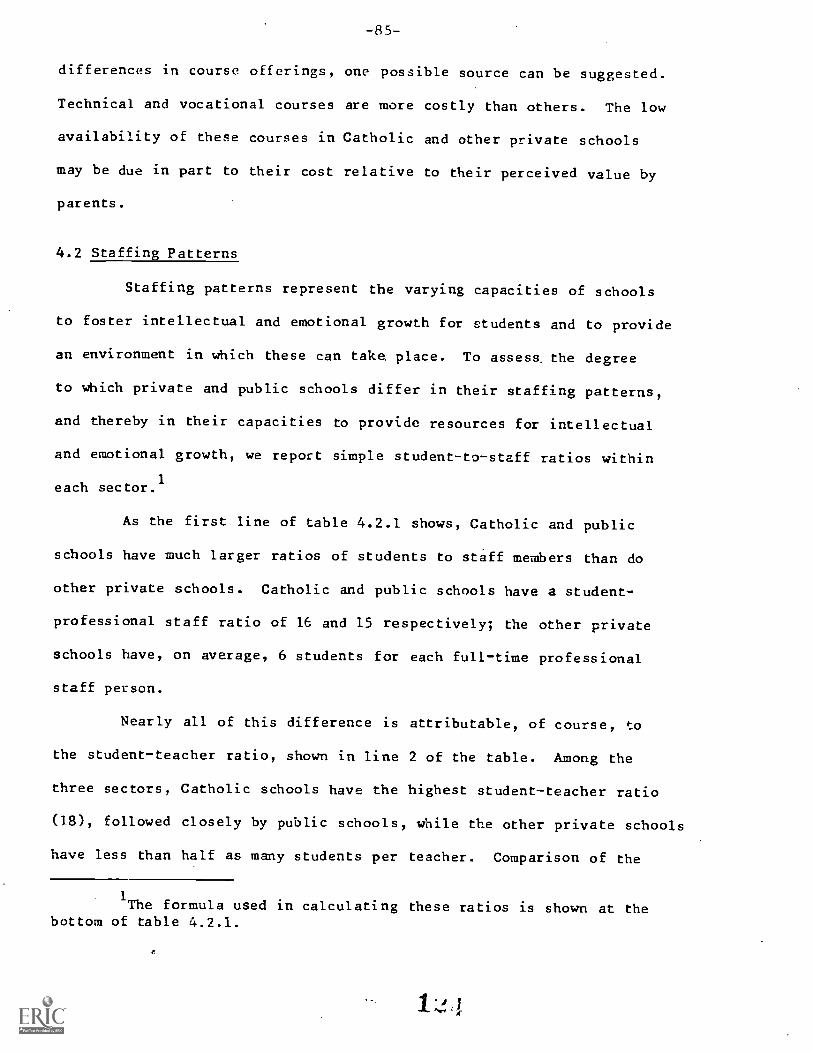
-85-
differences in course offerings, one possible source can be suggested.
Technical and vocational courses are more costly than others. The low
availability of these courses in Catholic and other private schools
may be due in part to their cost relative to their perceived value by
parents.
4.2 Staffing Patterns
Staffing patterns represent the varying capacities of schools
to foster intellectual and emotional growth for students and to provide
an environment in which these can take place. To assess, the degree
to which private and public schools differ in their staffing patterns,
and thereby in their capacities to provide resources for intellectual
and emotional growth, we report simple student-to-staff ratios within
each sector.1
As the first line of table 4.2.1 shows, Catholic and public
schools have much larger ratios of students to staff members than do
other private schools. Catholic and public schools have a student-
professional staff ratio of 16 and 15 respectively; the other private
schools have, on average, 6 students for each full-time professional
staff person.
Nearly all of this difference is attributable, of course, to
the student-teacher ratio, shown in line 2 of the table. Among the
three sectors, Catholic schools have the highest student-teacher ratio
(18), followed closely by public schools, while the other private schools
have less than half as many students per teacher. Comparison of the
1The formula used in calculating these ratios is shown at the
bottom of table 4.2.1.
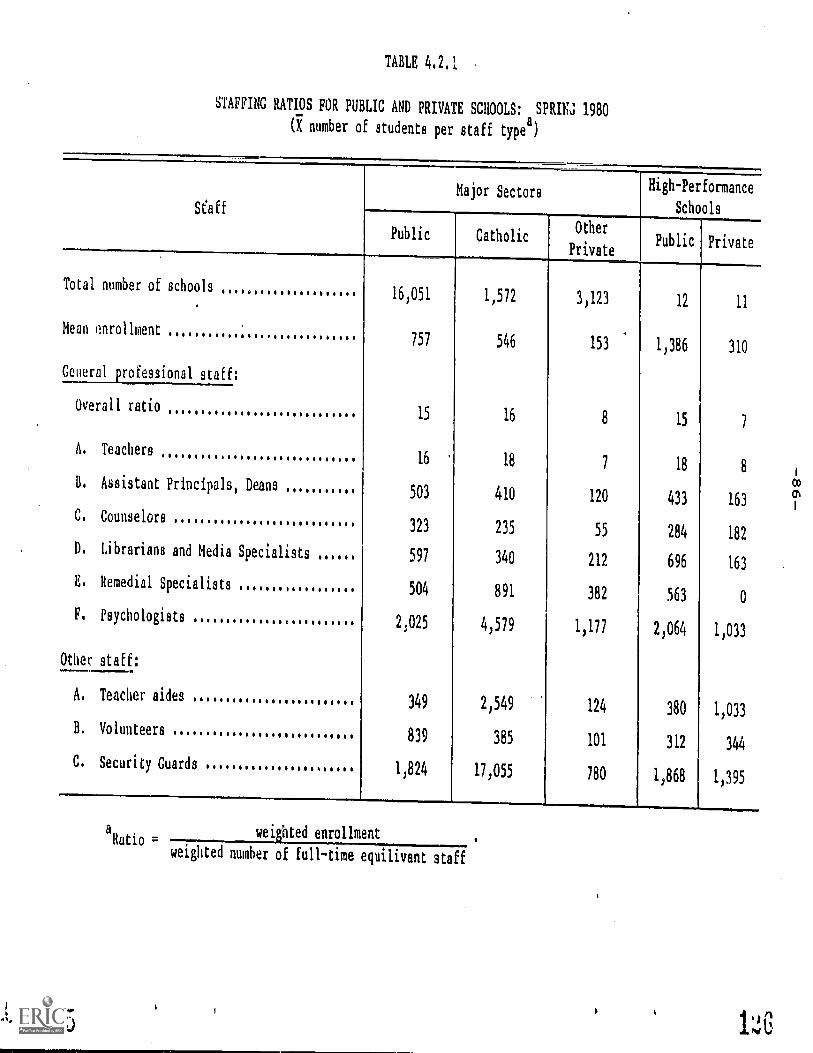
TABLE 4.2.1
STAFFING RATIOS FOR PUBLIC AND PRIVATE SCHOOLS: SPRIN 1980
(X number of students per staff typea)
Major Sectors High-Performance
SchoolsStaff
Public CatholicOther
PrivatePublic Private
Total number of schools16,051 1,572 3,123 12 11
Mean enrollment757 546 153 1,386 310
General professional staff:
Overall ratio15 16 8 15
A. Teachers16 18 7 18 8
B. Assistant Principals, Deans503 410 120 433 163
C. Counselors323 235 55 284 182
D. Librarians and Media Specialists597 340 212 696 163
E. Remedial Specialists504 891 382 563 0
F. Psychologists2,025 4,579 1,177 2,064 1,033
Other staff:
A. Teacher aides349 2,549 124 380 1,033
B. Volunteers839 385 101 312 344
C. Security Guards1,824 11,055 780 1,868 1,395
aRatio =
weighted enrollment
weighted number of full-time equilivant staff
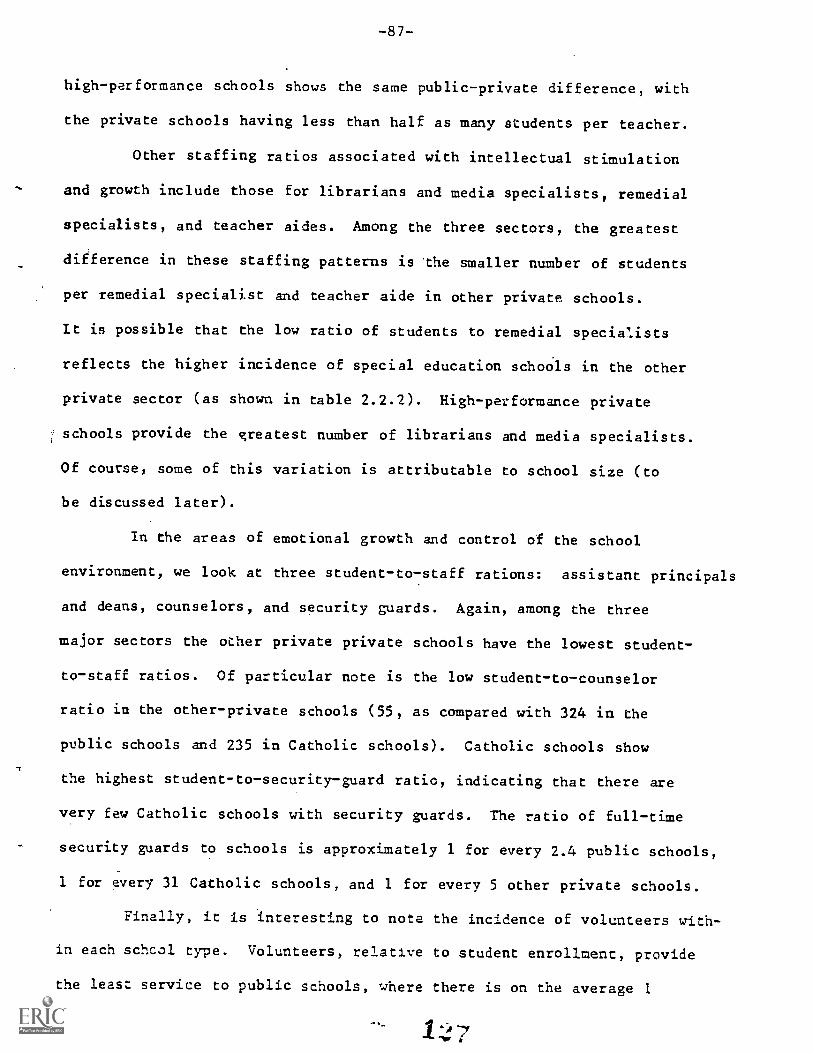
-87--
high-performance schools shows the same public-private difference, with
the private schools having less than half as many students per teacher.
Other staffing ratios associated with intellectual stimulation
and growth include those for librarians and media specialists, remedial
specialists, and teacher aides. Among the three sectors, the greatest
difference in these staffing patterns is the smaller number of students
per remedial specialist and teacher aide in other private schools.
It is possible that the low ratio of students to remedial specialists
reflects the higher incidence of special education schools in the other
private sector (as shown in table 2.2.2). High-performance private
schools provide the greatest number of librarians and media specialists.
Of course, some of this variation is attributable to school size (to
be discussed later).
In the areas of emotional growth and control of the school
environment, we look at three student-to-staff rations: assistant principals
and deans, counselors, and security guards. Again, among the three
major sectors the other private private schools have the lowest student-
to-staff ratios. Of particular note is the low student-to-counselor
ratio in the other-private schools (55, as compared with 324 in the
public schools and 235 in Catholic schools). Catholic schools show
the highest student-to-security-guard ratio, indicating that there are
very few Catholic schools with security guards. The ratio of full-time
security guards to schools is approximately 1 for every 2.4 public schools,
1 for every 31 Catholic schools, and 1 for every 5 other private schools.
Finally, it is interesting to note the incidence of volunteers with-
in each school type. Volunteers, relative to student enrollment, provide
the least service to public schools, where there is on the average 1
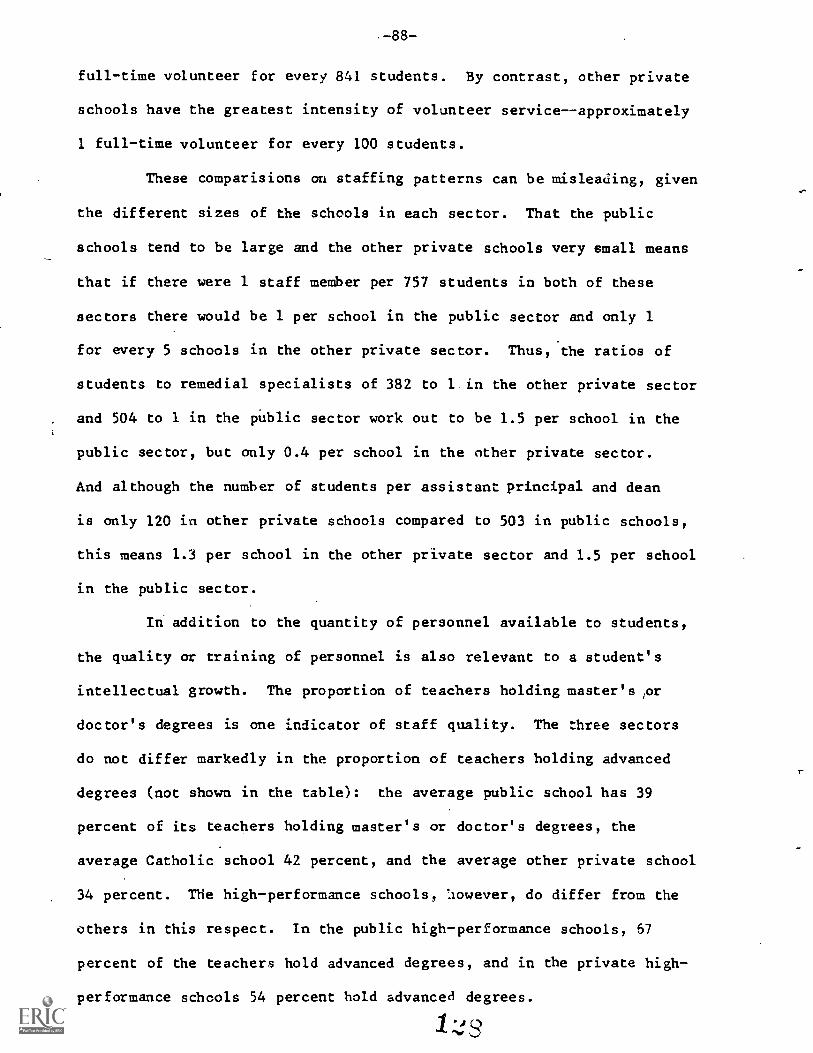
-88-
full -time volunteer for every 841 students. By contrast, other private
schools have the greatest intensity of volunteer service--approximately
1 full-time volunteer for every 100 students.
These comparisions on staffing patterns can be misleading, given
the different sizes of the schools in each sector. That the public
schools tend to be large and the other private schools very small means
that if there were 1 staff member per 757 students in both of these
sectors there would be 1 per school in the public sector and only 1
for every 5 schools in the other private sector. Thus, the ratios of
students to remedial specialists of 382 to 1 in the other private sector
and 504 to 1 in the pUblic sector work out to be 1.5 per school in the
public sector, but only 0.4 per school in the other private sector.
And although the number of students per assistant principal and dean
is only 120 in other private schools compared to 503 in public schools,
this means 1.3 per school in the other private sector and 1.5 per school
in the public sector.
In addition to the quantity of personnel available to students,
the quality or training of personnel is also relevant to a student's
intellectual growth. The proportion of teachers holding master's ICT
doctor's degrees is one indicator of staff quality. The three sectors
do not differ markedly in the proportion of teachers holding advanced
degrees (not shown in the table): the average public school has 39
percent of its teachers holding master's or doctor's degrees, the
average Catholic school 42 percent, and the average other private school
34 percent. THe high-performance schools, Ilowever, do differ from the
others in this respect. In the public high-performance schools, 57
percent of the teachers hold advanced degrees, and in the private high-
performance schools 54 percent hold advanced degrees.
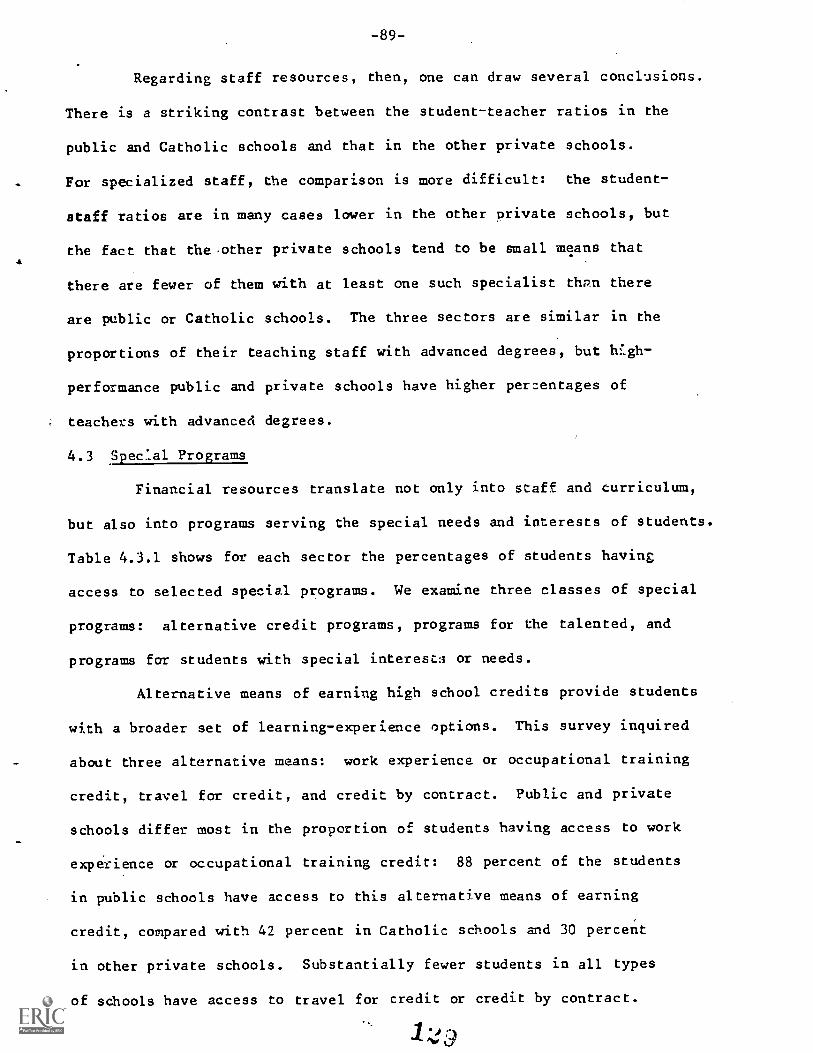
-89-
Regarding staff resources, then, one can draw several conclusions.
There is a striking contrast between the student-teacher ratios in the
public and Catholic schools and that in the other private schools.
For specialized staff, the comparison is more difficult: the student-
staff ratios are in many cases lower in the other private schools, but
the fact that the other private schools tend to be small means that4
there are fewer of them with at least one such specialist than there
are public or Catholic schools. The three sectors are similar in the
proportions of their teaching staff with advanced degrees, but W.gh-
performance public and private schools have higher percentages of
teachers with advanced degrees.
4.3 Spec:al Programs
Financial resources translate not only into staff and curriculum,
but also into programs serving the special needs and interests of students.
Table 4.3.1 shows for each sector the percentages of students having
access to selected special programs. We examine three classes of special
programs: alternative credit programs, programs for the talented, and
programs for students with special interests or needs.
Alternative means of earning high school credits provide students
with a broader set of learning-experience options. This survey inquired
about three alternative means: work experience or occupational training
credit, travel for credit, and credit by contract. Public and private
schools differ most in the proportion of students having access to work
experience or occupational training credit: 88 percent of the students
in public schools have access to this alternative means of earning
credit, compared with 42 percent in Catholic schools and 30 percent
in other private schools. Substantially fewer students in all types
of schools have access to travel for credit or credit by contract.
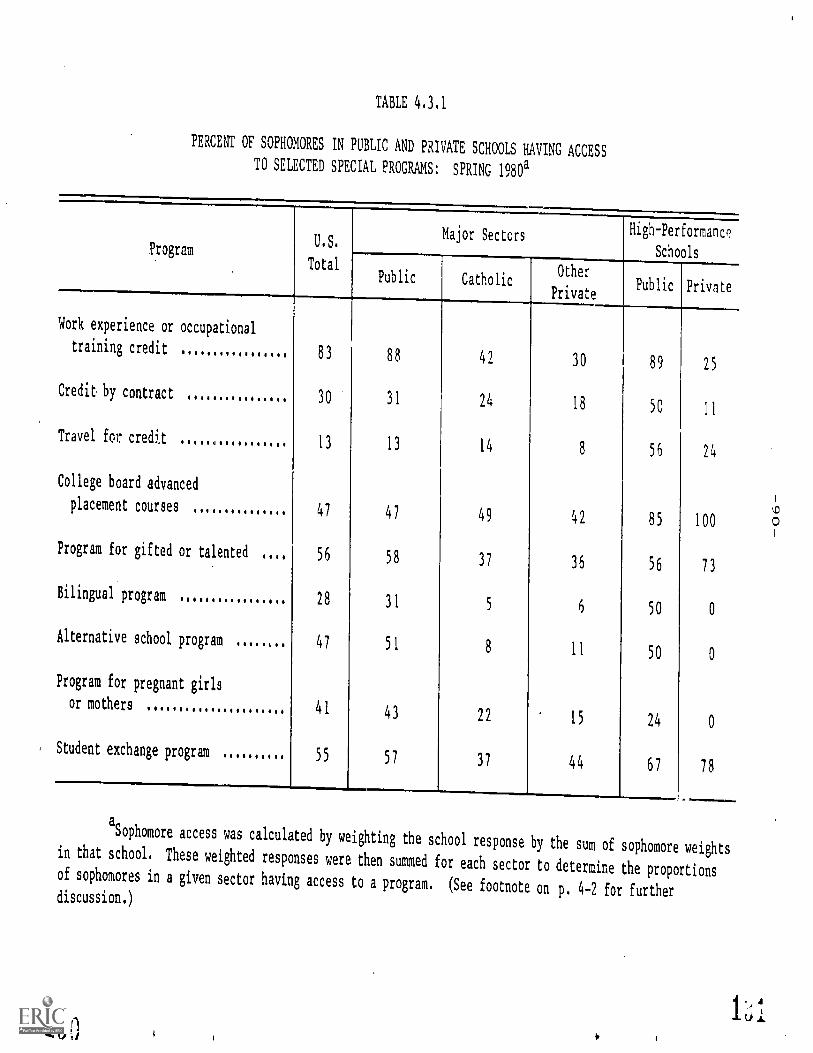
TABLE 4.3.1
PERCENT OF SOPHOMORES IN PUBLIC AND PRIVATE SCHOOLS HAVING ACCESS
TO SELECTED SPECIAL PROGRAMS: SPRING 1980a
ProgramU.S.
Major Secters High-Performance
SchoolsTotal
Public CatholicPrOtherivate
Public Private
Work experience or occupational
training credit83 88 42 30 89 25
Credit by contract 30 31 24 18 5C 11
Travel for, credit13 13 14 8 56 24
College board advanced
placement courses 47 47 49 42 85 100
Program for gifted or talented .... 56 58 37 36 56 73
Bilingual program 28 31 5 6 50 0
Alternative school program ..... , 47 51 8 11 50 0
Program for pregnant girls
or mothers 41 43 22 15 24 0
Student exchange program 55 57 37 44 67 78
aSophomore access was calculated by weighting the
school response by the sum of sophomore weightsin that school. These weighted responses were then summed for each sector to determine the proportionsof sophomores in a given sector having access to a program. (See footnote on p. 4-2 for furtherdiscussion.)
-91--
Nationally, 13 percent of all schools have travel for credit, and 30 per-
cent have credit-by-contract programs. Travel for credit is more often
found in high-performance schools, both public and private. Credit by
contract, while in evidence within all school types, is more often avail-
able to public school students.
Programs oriented toward high-achieving students are available
in all types of schools with a few substantial, but not surprising,
differences. Programs for the gifted or talented appear in relatively
low proportions in all but the high-performance schools.. The similarity
among the public, Catholic, and other private sectors is greatest in
the area of college board advanced placement courses (between 42 and
49 percent of the students in each of these sectors have access to such
courses) and this similarity is in sharp contrast to the high-performance
public and private schools, where nearly all students have access.
Programs for students with special needs or interests include
bilingual programs, alternative-school programs, programs for pregnant
girls, and student-exchange programs. Generally, more public schools
than private schools have these programs. In particular, bilingual programs
&re offered with substantially greater frequency in public schools. Ap-
proximately a third of the students in all public schools have access to
such a program, as do half the students in high-performance public schools.
Alternative-school programs and those for pregnant girls appear
most frequently in public schools. Alternative schools began in the 1960s
outside the public school system, and table 2.2.2 showed that in the total
universe of schools there is a higher percentage of alternative schools in
some types of private schools than in the public sector. However, this
question asked about alternative programs in the school. Although very few
, -92-
public schools are alternative schools (1.4 percent; table 2.2.2), many
have alternative-school program for a subset of students within the school.
It is this which accounts for the relatively high percentages for public
schools in table 4.3.1.
The major differences among the three sectors in the availability
of special programs appear to be two: first, public schools have more
programs emphasizing concrete career preparatory experience; second,
public schools have on the whole more of the special programs discussed
than does either of the private sectors.
4.4 Physical Facilities
The physical facilities of a school do more than provide space
for traditional classroom activity. For instance, subject-area resource
centers may provide a way for students to pursuelthe activity of learning
more informally, student lounges and cafeterias provide arenas for student
culture to emerge, and areas allocated for remedial assistance provide
space for specialized equipment and resources.
Table 4.4.1 shows the frequency with which various facilities
are available to students in each sector. The accessibility of career-
related facilities in the public sector points again to its stronger
orientation toward career preparation: 85 percent of the public school
students attend a school where there is a career information center,
and 30 percent attend a school where there is an occupational training
center. Only Catholic schools exceed public schools in the availability
of career information centers.
The provision of special laboratories for remedial reading and
mathematics work are most in evidence in public schoo,s: about two-
thirds of the students in this sector are in schools with at least ane
of these acilities. In the Catholic sector, about half of the students
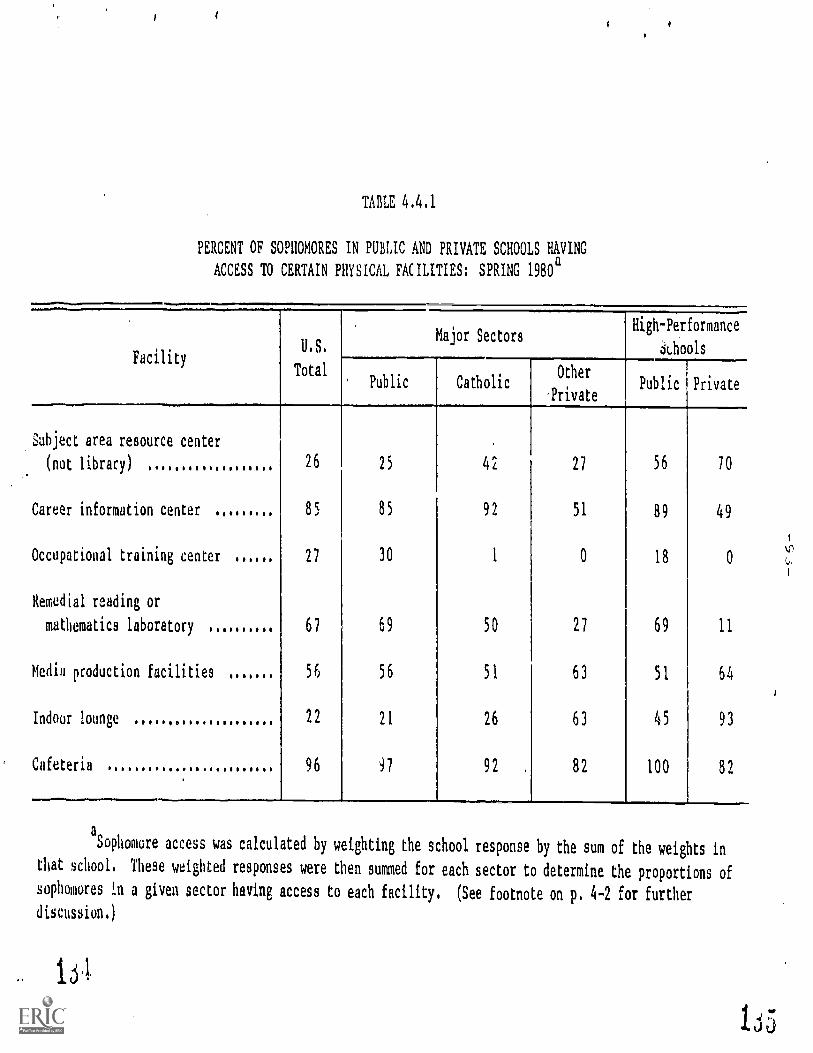
TABLE 4.4.1
PERCENT OF SOPHOMORES IN PUBLIC AND PRIVATE SCHOOLS HAVING
ACCESS TO CERTAIN PHYSICAL FACILITIES: SPRING 190
FacilityU.S.
Total
Major SectorsHigh-Performance
dLhools
Public Catholic Public Private
Subject area resource center
(not library) 26 25 42 27 56 70
Career information center 85 85 92 51 89 49
Occupational training center 27 30 1 0 18 0
Remedial reading or
mathematics laboratory 67 69 50 27 69 11
Media production facilities 56 56 51 63 51 64
Indoor lounge 22 21 26 63 45 93
Cafeteria 96 97 92 82 100 82
a
Sophomore access was calculated by weighting the school response by the sum of the weights in
that school. These weighted responses were then summed for each sector to determine the proportions of
sophomores in a given sector having access to each facility. (See footnote on p. 4-2 for further
discussion.)
-94-
are in schools with such a laboratory, while only 11 percent of the
students in the other private sector are in schools with suci a laboratory.
Over half of the students in every school type attend schools
with media production facilities. Without greater detail on their
utilization and capacities, few inferences can be made. One can assume
at minimum, however, that these facilities make a wider variety of
instructional materials available, including both educational video
programs and educational programs originally prepared for commercial
or public television.
Among the three major sectors, student lounges appear most
frequently in other private schools, and almost all high-performance-
private schools have student lounges. It is possible that the small
enrollments of other private schools makes it more feasible to provide
this facility. Nearly all schools of all types have student cafeterias.
This comparison of facilities points again to the general
similarities between Catholic and public schools as compared to the
other private schools. These measures of physical facilities are of
course superficial; a comprehensive comparison of physical facilities
in different sectors would require a different sort of survey.
4.5 Fedetal Programs
One set of resources for which we expect to find differences
between public and private schools is federally financed programs.
For instance, given that many of the federal funds under the Elementary
and Secondary Education Act (ESEA) are targeted to groups with special
needs, we might expect private schools to participate less frequently.
Yet private schools are eligible for Federal funds, and some participate
in Federal programs. It is instructive, in this context, to review
the current participation in Federal programs of public and private
schools.
Federal programs for education maintain certain eligibility
criteria for schools, usually compensatory or vocational in nature,
which may limit the number of schools eligible for funding.1
Also,
in some areas funding is not automatic, but depends on proposals from
the school or school district, and schools differ in their initiative
5n obtaining Federal, funds. The differences in federally funded programs
at different schools are a result of both of these factors. 2
ESEA provides a broad range of resources and program opportunities
to school districts and schools. While eligibility varies among programs,
private schools participate in most of the ESEA programs that the survey
Eligibility for funding under these Federal programs differssomewhat for public and private schools. ESEA Title I lunds are allocatedthrough state education agencies to local educational agencies (LEAs).Although private schools that meet the Title I criteria are eligible,participation depends upon arrangements with the LEA. Probably in partas a result of the method of allocation, private secondary institutionsseldom participate in Title I programs. For this and some of the otherFederal programs, some of the positive responses by school administratorsmay be in error. Funds authorized by Titles IVB, IVC, IVD, VII, andIX in ESEA explicitly permit funding to private secondary schools, provided,of course, that other eligibility and use criteria ii met. Federallegislatim also permits Vocational Education Act (VEA) funds to begiven to private secondary schools, but it appears that most state plansflr VEA funds do not include private secondary schf)ols. (See The Conditionof Vocational Education 1980 or Galladay and Wulfsberg 1980.)
Guidelines for Talent Search and Upward Bound programs indicatethat this money goes aimost exclusively to higher education institutions,with high school students participating individually in the programs.Comprehensive Employment and Training Act (CETA) programs are administeredby the Department of Labor, and the prime sponsor is ordinarily notan educational institution. Thus, high school students participatein these three programs, while high schools themselves do not.
2For discussion of the status of Federal programs in private
schools, see Summary and Evaluation Report and How to Service Studentswith Federal Education Program Benefits, both published in 1980 urderthe auspices of the Technical Assistance Institutes at the NationalCatholic Educational Association.
-96-
covers. (In not all cases does a positive response by a school administrator
mean that a school participates as a school. The question was worded
so that a positive response could mean participation in the program
by some students in tie school.) The participation rate of private
schools is highest in the library program (Title IVB), in which nearly
all of the Catholic schools, 43 percent of the other private schools,
and 50 percent of the high-performance private schools participate (see
table 4.5.1). Catholic schools participate in this program at a higher
rate than public schools. In other ESEA programs, considered all together,
. Catholic schools generally participate less than public schools, but
their participation is not neglible; other private schools participate
hardly at all.
Among vocationally oriented programs, the differential participation
of public schools is even more evidant. P-xticipation in the programs
associated with CETA and VEA is almost exclusively in public schools.
Catholic schools show low participation rates, and other private schools
participate almost not at all. At the other extreme, high-performance
public schools show almost universal participation in Federal work
programs (Cooperative Education and Work Study).
In general, federally funded vocationally arienteC programs
are largely the domain of public schools. In ESEA programs, Catholic
schools participate at levelS comparable to schools in the public sector
for some titles, while other private schools seldom participate, except
in the library program.
4.6 Conclusion
A number of patterns distinguishing the school resources of
the different sectors can be seen in the variations shown in this chapter.
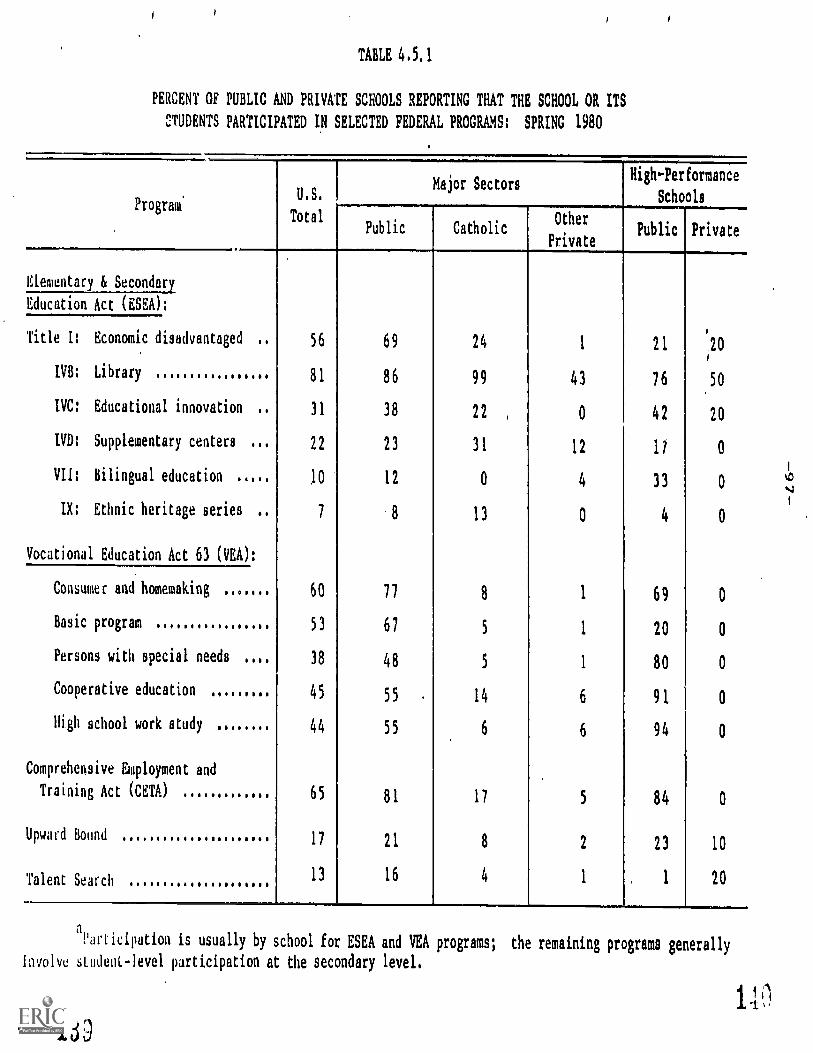
TABLE 4.5.1
PERCENT OF PUBLIC AND PRIVATE SCHOOLS REPORTING THAT THE SCHOOL OR ITS
STUDENTS PARTICIPATED IN SELECTED FEDERAL PROGRAMS: SPRING 1980
Program'U.S.
Major SectorsHigh-Performance
Schools
TotalPublic Catholic
Other
PrivatePublic Private
Elementary & Secondary
Education Act (ESEA):
Title I: Economic disadvantaged 56 69 24 1 21 20
IVB: Library 81 86 99 43 76 50
IVC: Educational innovation 31 38 22 0 42 20
IVD: Supplementary centers ISO 22 23 31 12 11 0
VII: Bilingual education 10 12 0 4 33 0
IX: Ethnic heritage series 7 8 13 0 4 0
Vocational Education Act 63 (VEA):
Consumer and homemaking 60 77 8 1 69 0
Basic program 53 67 5 1 20 0
Persons with special needs 38 48 5 1 80 0
Cooperative education 45 55 14 6 91 0
High school work study 44 55 6 6 94 0
Comprehensive Employment and
Training Act (CETA) 65 81 17 5 84 0
Upward Bound 17 21 8 2 23 10
Talent Search 13 16 4 1 1 20
a
Participation is usually by school for ESEA and VEA programs; the remaining programs generally
involve student -level participation at the secondary level,
-98-
First, there is the effect of size differences, which lead the
other private schools, smallest in size on the average, and, to a lesser
extent, the Catholic schools to have a narrower range of courses than
do the public schools, to have special programs less often, and to have
fewer physical facilities (such as remedial reading laboratories).
Second, there is a difference in orientation, which means that
the courses and programs less frequently found in private schools are
of certain types: vocational and technical courses, work-related programs,
and, in general, nonacademic courses and programs. The one traditional
academic area in which courses are least often found in other private
schools is foreign languages. Other differences in orientation are
found in the high-performance schools. These schools, public and private,
differ from other schools in more uniformly providing advanced academic
resources. The high-performance private schools differ from one another,
however, in the context in which these resources are offered: the high-
performance private schools are more narrowly specialized in academic
directions, while their public-sector counterparts superimpose more
advanced academic courses and programs an an even more comprehensive
range of courses and programs than is found in the public sector as
a whole.
Third, the other private schools ha.e a much lower student-teacher
ratio than th: public and Catholic schools. The other private schools
operate with many fewer students per teacher than do the public or
Catholic schools--a difference so strong that the low student-teacher
ratio might be considered a hallmark characteristic of non-Catholic
private schools. The low ratio probably arises in part from the small
size of the other private schools and in part from conscious policy.
1.1 4
-99-
Fourth, private schools overall show lower participation in
federally funded programs, but this is selective, with Catholic schools
participating as frequently as public schools in a few of the programs.
-100-
CHAPTER 5
THE FUNCTIONING OF PUBLIC AND PRIVATE SCHOOLS
The functioning of a school depends both on its student resources
and on its own resources (of the sort examined in the preceding chapter).
In ways that neither educators nor sociologists understand perfectly,
and in which the accident of specific personalities plays some role,
the various components result in a school that functions in a particular
way. In this chapter we examine that functioning, in sufficient depth
to see some of the similarities and differences between the way schools
in the different sectors function.
The functioning of these types of schools will be exaoined in
five areas:
1. Student coursework
2. Levels of participation in extracurricttlar activities
3. The standards of discipline set by the school
4. Student behavior, including involvement in schoolwork anddiscipline-related behavior
5. Student attitudes
The last two aspects of the functioning of these schools, behavior
and attitudes on the part of students, could be treated equally well
as outcomes of schooling in the next chapter. Student responses about
their interest and involvement in school, the behavior that causes dis-
ciplinary problems in the school, and the attitudes they hold all play
a part in the functioning of the school, but they are in part shaped by
the school as well. Thus their inclusion in this chapter rather than
the next is somewhat arbitrary. Because we examine these behaviors
lA1j
-101 -
and attitudes solely descriptively, as aspects of the functioning of
each type of school, the question of just how much the type of school
is responsible for these differences in behavior and aLtitudes remains
unanswered. In section 6.3 of the next chapter, we return to differences
in behavior and discipline and provide some answers to this question.
5.1 Student Coursework
Chapter 4 reported the courses and programs offered in each
school sector, but it showed only student access, not exposure to course-
work of different kinds. This section examines what courses students
say they will take or 'have taken. Several items in the student question-
naire provide information about this.
One question asked sophomores the number of semesters In major
subject-matter areas they had taken in the 10th grade (YBOO6); another
item asked them to report the number of semesters in these same areas
they planned to take in grades 11 and 12 (YB009). A similar question
asked seniors about the semesters of coursework they had taken in grades
10, 11, and 12 in the same subjects. By combining sophomores' responses
to the two questions, the plans of sophomores can be compared to the
actions of seniors. This is done in table 5.1.1, which shows the average
number of semesters planned by sophomores and taken by seniors in grades
10, 11, and 12. These three years translate into six semesters of course-
work, and the table shows two semesters for each year of coursework,
four semesters for two years, and six semesters for three years. The
total number of semesters taken in a subject can exceed six, however,
because students can enroll in more than one course in a subject per
semester.
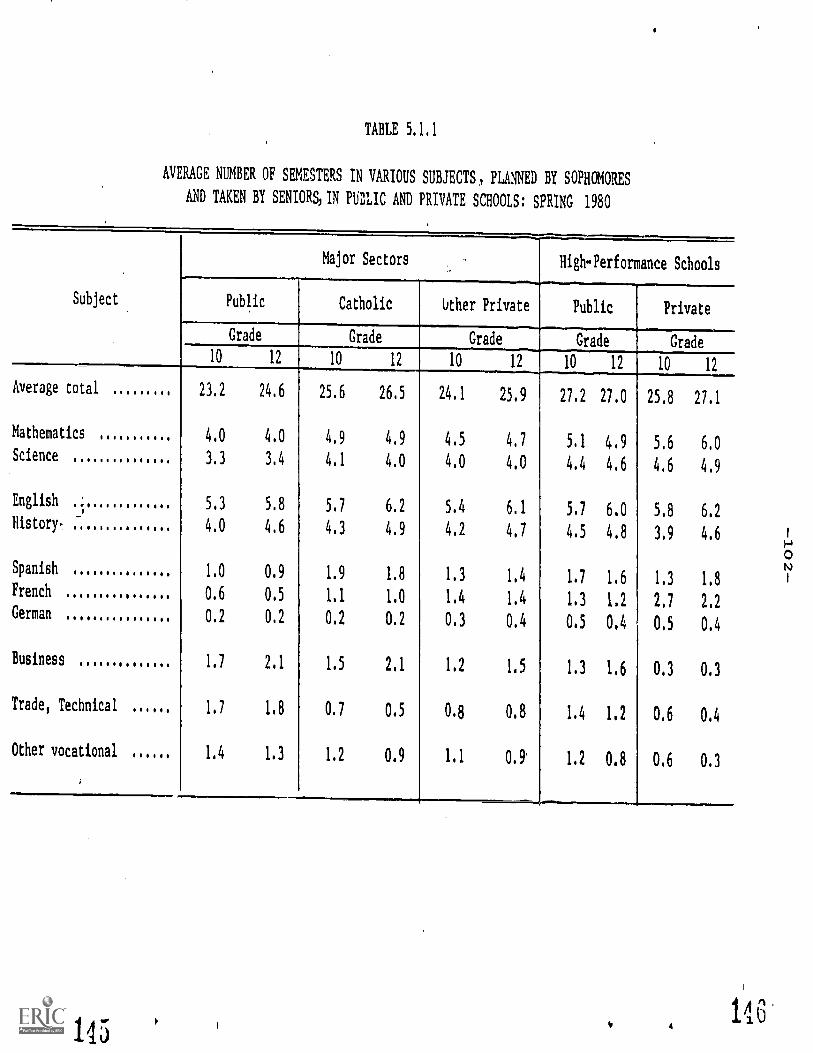
TABLE 5,1,1
AVERAGE NUMBER OF SEMESTERS IN VARIOUS SUBJECTS, PLANNED BY SOPHOMORES
AND TAKEN BY SENIORS, IN PUBLIC AND PRIVATE SCHOOLS: SPRING 1980
Major Sectors High-Performance Schools
Subject Public Catholic Uther Private Public Private
Grade Grade Grade Grade Grade
10 12 10 12 10 12 10 12 10 12
Average total 23.2 24.6 25.6 26.5 24.1 25.9 27.2 27.0 25,8 27,1
Mathematics 4.0 4.0 4.9 4.9 4.5 4.7 5.1 4,9 5.6 6.0Science 3,3 3.4 4.1 4.0 4,0 4,0 4,4 4.6 4.6 4.9
English 5,3 5.8 5,7 6.2 5,4 6.1 5.7 6.0 5.8 6.2History, 4.0 4.6 4.3 4.9 4,2 4,7 4.5 4.8 3.9 4,6
Spanish 1,0 0.9 1.9 1.8 1,3 1.4 1.7 1.6 1.3 1,8French 0,6 0.5 1.1 1.0 1,4 1.4 1.3 1.2 2.1 2.2German 0.2 0.2 0.2 0.2 0.3 0.4 0.5 0,4 0,5 0.4
Business 1,7 2,1 1,5 2,1 1,2 1,5 1.3 1.6 0.3 0.3
Trade, Technical 1.7 1.8 0.7 0.5 0.8 0,8 1.4 1,2 0.6 0.4
Other vocational 1.4 1,3 1,2 0.9 1.1 0,9 1.2 0.8 0.6 0.3
145
-103 -
The table shows interesting comparisons among types of schools,
among subjects, and between sophomores' plans and seniors' actions.
What is perhaps most striking is the similarity of the sophomores' plans
to what the seniors have actually taken. Overall, there are small differ-
ences between the two in both directions, but the only uniform increases
among all sectors are in English, history, and business courses, and
the only uniform decrease is in "other vocational" courses. Thus sopho-
mores seem to know with reasonable accuracy what they will take in the
next two years--assuming, of course, that the sophomores will in two
years show a profile similar to that of 1980 seniors.
Not shown in the table are the variabilities in sophomore expecta-
tions ana senior realizations. For the academic subjects, the variation
among seniors in what they have actually taken is less than the variation
among sophomores in what they think they will take. That is, while
sophomores, on the average, have accurate expectations about the number
of semesters of each of these academic subjects they will take, there
are more extremes in the expectations of sophomores than in the actions
of seniors. The reverse is true for the nonacademic subjects (business
courses, trade, technical, and other vocational courses). For these
courses, in the public schools (and to a lesser extent in the private
schools) the seniors are more extreme in the amount of coursework they
have completed than are the sophomores in their expectations. This,
of course, has to do with the way high schools are structured, with
academic subjects more or less standard fare for all students (though
at differing levels of difficulty), and vocational courses taken primarily
by those students who go into (or are directei toward) a vocational
program. Some students who will never take a technical or vocational
-104-
course expect to take a few such courses, while others who will end
up taking many of these courses underestimate that number as sophomores.
Table 5.1.1 also allows comparison of sectors according to the
average amount of coursework completed in academic and nonacademic courses.
The average amount of academic coursework completed by public school
seniors provides a basis for comparing students in other sectors. On
the average, these students complete two years of mathematics, one and
a half years of science, two and a half years of history, three yeais
of English, and one and a half years in all foreign languages taken
together. Of course, this list does not include all academic coursework,
but it does sketch out the exposure of U.S. public high school students
to basic academic courses.
Students in the private sector vary somewhat from this modal
picture. On the average, students in Catholic schools and other private
schools take three more semesters of academic coursework (the first
three groups of courses in table 5.1.1) than do students in public schools.
A similar difference is found between high-performance private and public
schools (although students in the latter schools take slightly more
academic coursework than do students in the Catholic or other private
sectors). Considering each academic subject separately, the differences
among the public, Catholic, and other private sectors are rather small.
The students in high-performance private schools stand out sharply in
mathematics and French: the average senior completes more than a semester
of mathematics and of French beyond that completed by students in other
sectors.
The differences between the public and private sectors are re
versed for business, trade, technical, and other vocational courses.
-105-
These courses are less frequently taken by private school students,
with the differences especially gieat for the high-performance private
schools.
Among the foreign languages, German has nearly vanished as a
subject studied by students in all types of schools. French is also
infrequently taken in the public schools, but it remaina the dominant
language in the high-performance private schools, and occupies an equal
position with Spanish in the non-Catholic private schools.
Altogether, the comparison of specific subjects taken in public
and private schools indicates no sharp divergence between the two.
Perhaps the greatest areas of divergence are foreign languages, of which
the private school students take more, and nonacademic occupational,
courses, of which the public school students take more. Other than
this, one can say only that the private school students take, on the
average, slightly more courses, and that these are generally in academic
subjects.
Looking at specific academic courses, such as calculus or physics,
however, there are some great differences between the types of schools.
Seniors were asked about each of nine academic courses: four mathematics
courses, two science courses, and third-year courses in each of three
foreign languages. Table 5.1.2 shows the percentage of seniors in each
school type taking these courses. Within each area, the courses are
ordered by the percentage of students taking each.
In mathematics courses, ranging from geometry to calculus, about
half to two-thirds as many public school students take these courses
as do Catholic or other private school students. Comparing Catholic
schools with other private schools in each cf the mathematics courses,
a slightly higher percentage of Catholic school students than of other
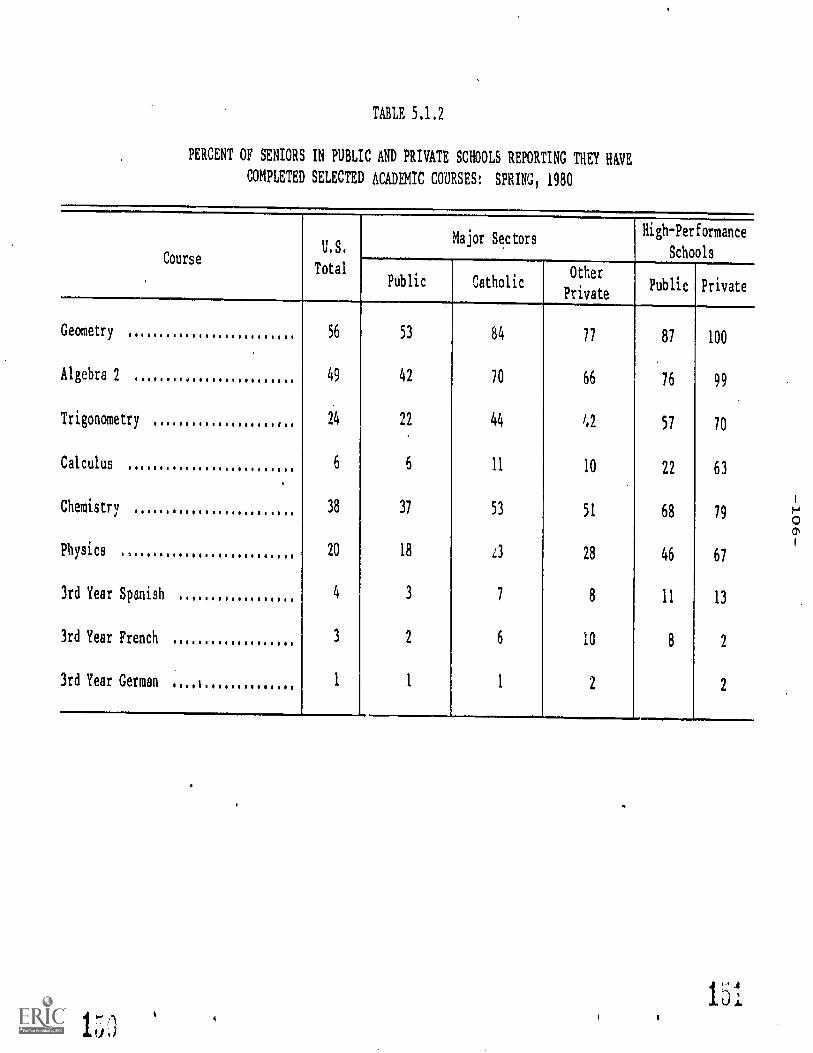
TABLE 5.1.2
PERCENT OF SENIORS IN PUBLIC AND PRIVATE SCHOOLS REPORTING THEY HAVE
COMPLETED SELECTED ACADEMIC COURSESt SPRING, 1980
CourseU.S.
Major SectorsHigh-Performance
Schools
TotalPublic Catholic
Other
PrivatePublic Private
Geometry 56 53 84 77 81 100
Algebra 2 49 42 70 66 16 99
Trigonometry 24 22 44 42 51 10
Calculus 6 6 11 10 22 63
Chemistry 38 31 53 51 68 19
Physics 20 18 z3 28 46 67
3rd Year Spanish 4 3 7 8 11 13
3rd Year French 3 2 6 10 8 2
3rd Year German. is 1 1 1 2 2
1 U4

-107-
private school students take these courses. An exceptionally high propor-
tion of students in high-performance private schools take these advanced
mathematics courses, with 63 percent taking calculus, the most advanced.
The percentages for the high-performance public schools lie between
those of the private sector as a whole and those of the high-performance
private schools. Generally, the more advanced the course, the smaller
the ratio of public school enrollment to private school enrollment.
Neither of the two science courses, chemistry and physics, is
taken by a large proportion of students, except in the high-performance
schools. Chemistry is taken less often in all types of schools than
algebra 2, but more often than trigonometry. Physics is taken less,
only about half as often as chemistry (except in the high-performance
schools). It is taken by fewer students than take trigonometry, but by
more than take calculus. In these sciences, the public schools are
somewhat closer to the private schools than is true for mathematics.
The third year of a foreign language is taken by only a small
minority in 12riz type of school. We have no direct ...,--mparisons with
earlier cohorts or other developed countries, but bo.11 of these compar-
isons would undoubtedly emphasize the relative lack of advanced foreign
language training among contemporary American high school students,
in public and private schools. In the public schools, attended by about
90 percent of the students, the highest enrollment for a third-year
language course is 3 percent, in Spanish. The percentage of students
in public schools enrolled in any third year language course is 6 percent,
compared with 14 percent in Catholic schools, and 20 percent in other
private schools. It is not the case that the lower percentage of students
taking each of these courses in the public schools is due to lack of
1 2
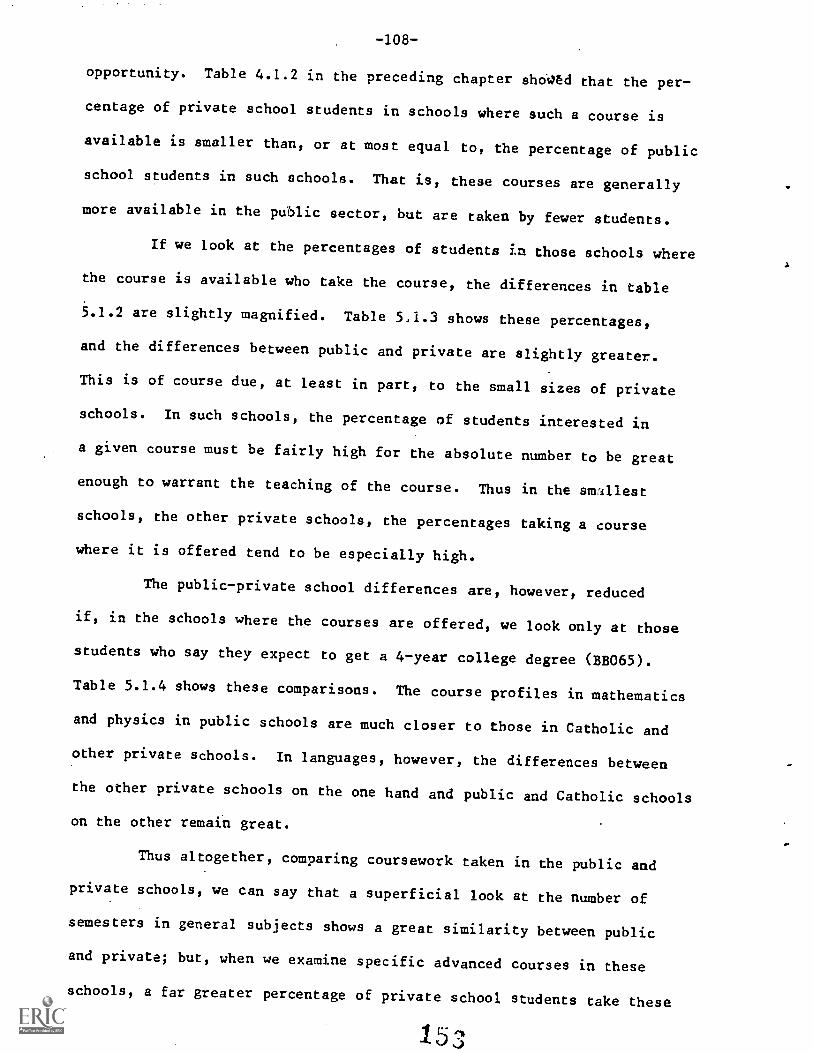
-108 -
opportunity. Table 4.1.2 in the preceding chapter shoiMd that the per-
centage of private school students in schools where such a course is
available is smaller than, or at most equal to, the percentage of public
school students in such schools. That is, these courses are generally
more available in the public sector, but are taken by fewer students.
If we look at the percentages of students in those schools where
the course is available who take the course, the differences in table
5.1.2 are slightly magnified. Table 5,1.3 shows these percentages,
and the differences between public and private are slightly greater.
This is of course due, at least in part, to the small sizes of private
schools. In such schools, the percentage of students interested in
a given course must be fairly high for the absolute number to be great
enough to warrant the teaching of the course. Thus in the smallest
schools, the other private schools, the percentages taking a course
where it is offered tend to be especially high.
The public-private school differences are, however, reduced
if, in the schools where the courses are offered, we look only at those
students who say they expect to get a 4-year college degree (BB065).
Table 5.1.4 shows these comparisons. The course profiles in mathematics
and physics in public schools are much closer to those in Catholic and
other private schools. In languages, however, the differences between
the other private schools on the one hand and public and Catholic schools
on the other remain great.
Thus altogether, comparing coursework taken in the public and
private schools, we can say that a superficial look at the number of
semesters in general subjects shows a great similarity between public
and private; but, when we examine specific advanced courses in these
schools, a far greater percentage of private school students take these
1L
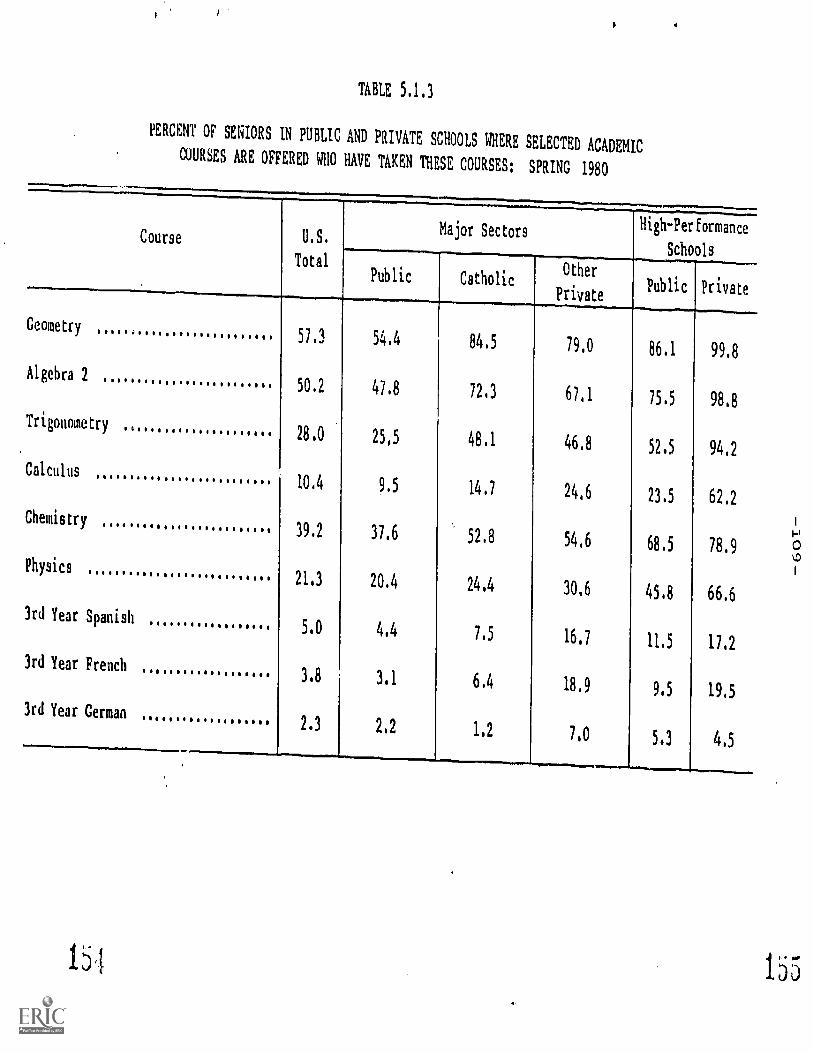
TABLE 5.1.3
PERCENT OF SENIORS IN PUBLIC AND PRIVATE SCHOOLS WHERE SELECTED ACADEMICCOURSES ARE OFFERED WHO HAVE TAKEN THESE COURSES: SPRING 1980
Course U.S.Major Sectors
TotalPublic Catholic
Other
Private
Geometry57.3 54.4 84,5 79.0
Algebra 250.2 47.8 12.3 67.1
Trigonometry28,0 25,5 48.1 46.8
Calculus10.4 9.5 14.1 24,6
Chemistry39.2 37.6 52.8 54,6
Physics21.3 20.4 24.4 30.6
3rd Year Spanish5.0 4,4 7,5 16,7
3rd Year French3.8 3,1 6.4 18.9
3rd Year Cerman2.3 2.2 1.2 7,0
lai
HighPerformance
Schools
Public Private
86.1
75.5
52.5
23.5
68.5
45.8
11.5
9.5
5.3
99.8
98.8
94.2
62.2
78.9
66.6
11,2
193
4,5
165
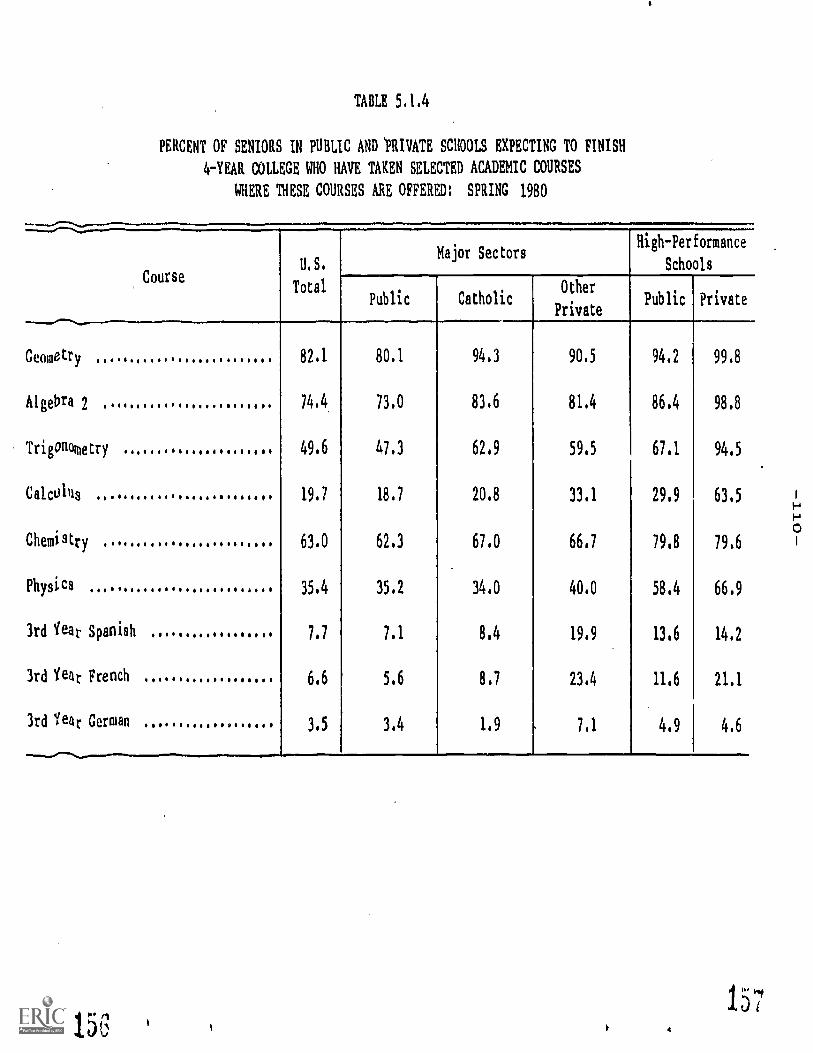
ceometr
Algebra
Triono
Calcoin
Chemist
Physics
3rd Yea
3rd Yes
3rd Yea
TABLE 5.1,4
PERCENT OF SENIORS IN PUBLIC AND 'PRIVATE SCHOOLS EXPECTING TO FINISH
4-YEAR COLLEGE WHO HAVE TAKEN SELECTED ACADEMIC COURSES
WHERE THESE COURSES ARE OFFERED: SPRING 1980
CourseU.S.
Total
Major SectorsHigh-Performance
Schools
Public CatholicOther
PrivatePublic Private
...-----.---
Y 82.1 80.1 94.3 90.5 94.2 99.8
2 74.4 73.0 83.6 81.4 86.4 98.8
metry 49.6 47.3 62.9 59.5 67.1 94.5
s 19.7 18.7 20.8 33.1 29.9 63.5
ry 63.0 62.3 67.0 66.7 79.8 79.6
35.4 35.2 34.0 40.0 58.4 66.9
r Spanish 7.7 7.1 8.4 19.9 13.6 14.2
r French 6.6 5.6 8.7 23.4 11.6 21,1
r German 3.5 3.4 1.9 7.1 4.9 4.6
156157
-111 -
courses. If we control for students' higher education plans, these
,differences are reduced, and, presumably, statistical controls on family
background would reduce the differences even more. Thus, while the
student bodies of public and private schools as a whole differ consid-
erably in their taking of these advanced courses, students with similar
college plans (and similar in other respects) have similar course pr)files.
This leaves open, of course, the question whether these college plans
are brought to the school wholly from the ow-_side or are in part gener-
ated by the different school environments. We examine that question
in section 6.2.
5.2 Extracurricular Activities
Along with the courses that students take in each of these types
of schools, they participate in extracurricular activities. And, because
the schools are organized quite differently, we might expect the extra-
curricular activity profiles of students to differ according to the
type of school they attend. Table 5.2.1 shows the percentage of students
in each sector participating in each of thirteen types of school activ-
ities listed in the student questionnaire (BB032). The activities are
grouped into four loosely related areas.
First of all, it is useful to note that there are few major dif-
fereuces between the participation profiles of sophomores and seniors.
The only major difference in the public schools is the 10 percent increase
in senior participation in vocational education clubs. Among the smaller
. differences, however, some are consistent across sectors. Band and
orchestra participation appears to decline slightly, as does participa-
tion in subject matter clubs. In contrast, participation in hobby clubs
appears to increase slightly. In addition, cheerleading seems to increase
lt 5 c.1

TABLE 5.2.1
PERCENT OF SOPHOMORES AND SENIORS IN PUBLIC AND PRIVATE SCHOOLS PARTICIPATING
IN VARIOUS EXTRACURRICULAR ACTIVITIES: SPRING 1980
Major Sectors
Activity Public Catholic
Grade Grade
10 12 10 12
Varsity athletics
(Seniors only) NAa
35 NA 37
Athletics (soph) or
other athletics
(seniors) 53 41 62 47
Cheerleading & pepclub 14 15 16 15
Debate, drama 10 14 14 18
Chorus, dance 22 121 23 20
Band, orchestra 17 15 10 9
Subject matter clubs. 26 24 28 25
Vocational education
clubs 15 25 4 7
Hobby :iubs 21 23 21 22
Honorary Society NA 17 NA 20
School newspaper NA 18 NA 28
Student government . NA 18 NA 20
High-Performance Schools
Other Private
Grade
10 12
NA 58
69 55
13 17
18 33
28 31
15 14
27 25
7 9
24 27
NA 17
NA 45
NA 30
Public Private
Grade Grade
10 12 10 12
NA 39 NA 73
20 26 84 65
17 07 11 17
18 15 24 36
20 19 24 27
18 15 11 12
24 21 30 23
6 8 3 0
21 26 34 43
NA 17 NA 13
NA 24 NA 57
NA 19 NA 29
aNA . not applicable; sophomores not asked about participation.
159 1 1; 1:1
-113 -
(the athletics questions are not quite comparable at the sophomore and
senior levels, and cannot be directly compared), as does participation
in debate or drama. Participation in chorus or dance appears to decline
slightly in the public and Catholic schools, but to increase in the
other private and high-performance private schools.
Among school sectors, the public schools az:f. the Catholic schools
seem similar, and somewhat different from the other private schools.
The high-performance private schools differ from public and Catholic
in the same direction as all of the other private schools, but more
emphatically. The principal difference between the public and Catholic
schools on the one hand and the other private and high-performance private
on the other is that in the latter a number of activities appear to
grow over time, with seniors participating considerably more than sopho-
mores. In the public and Catholic schools, where levels of participation
are in general slightly lower at the sophomore level, this growth does
not occur. The differences between school types at the senior level
in the last two activities, school newspaper and student government,
suggest that the same generalization would hold for these activities
if they had been included at the iophomore level.
Regardless of the reason, the end result is that participation
in extracurricular activities in the other private and high-performance
private schools, which is similar to that in public and Catholic schools
at the sophomore level, is considerably higher by the senior year. This
can be seen in a slightly different way by looking at two measures of
sophomore- senior differences for the seven activities that are directly
comparable (3 through 9 in table 5.2.1): the number of activities in
which seniors show a higher participation rate than sophomores, and
the sum of senior-sophomore difference in percentage participating.
-114 -
These are shown in table 5.2.2. The table shows that, by .3oth measures,
the other private and high-performance private schools are diFtinguish-
able from the other types of schools. Participation grows over time
in these schools, but declines or grows less in the others.
One might conjecture that extracurricular activities are organ-
ized differently in the Catholic and public schools than in the other
private schools. In particular, there are two approaches a school may
take to the organization of extracurricular activities. One is a selec-
tive orientation, which recruits younger students into, say, less selec-
tive choruses, with subsequent narrowing down for the Mora selective
chorus, or into junior varsity athletics with only the best going on
to the varsity. Another approach, the intramural orientation, holds
to the philosophy that everyone ought to try everything. This latter
approach may be seen in elite English schools that aspire to develop
a "well-rounded" individual.
If the public and Catholic schools have the selective orienta-
tion tl extracurricular activities, and the other private schools more
often have the intramural orientation, this would explain the partici-
pation decline from sophomore to senior in public and Catholic schools
and the growth (or at least the absence of decline) in the other private
schools.
5.3 Disciplinary Standards
Discipline in schools is regarded by many as the most important
problem in American education. In a yearly Gallup Poll concerning edu-
cation, the general public has for a number of years ranked discipline
as the most important problem in schools, And superintendents, principals,
and teachers complain bitterly about constraints on them, legal and
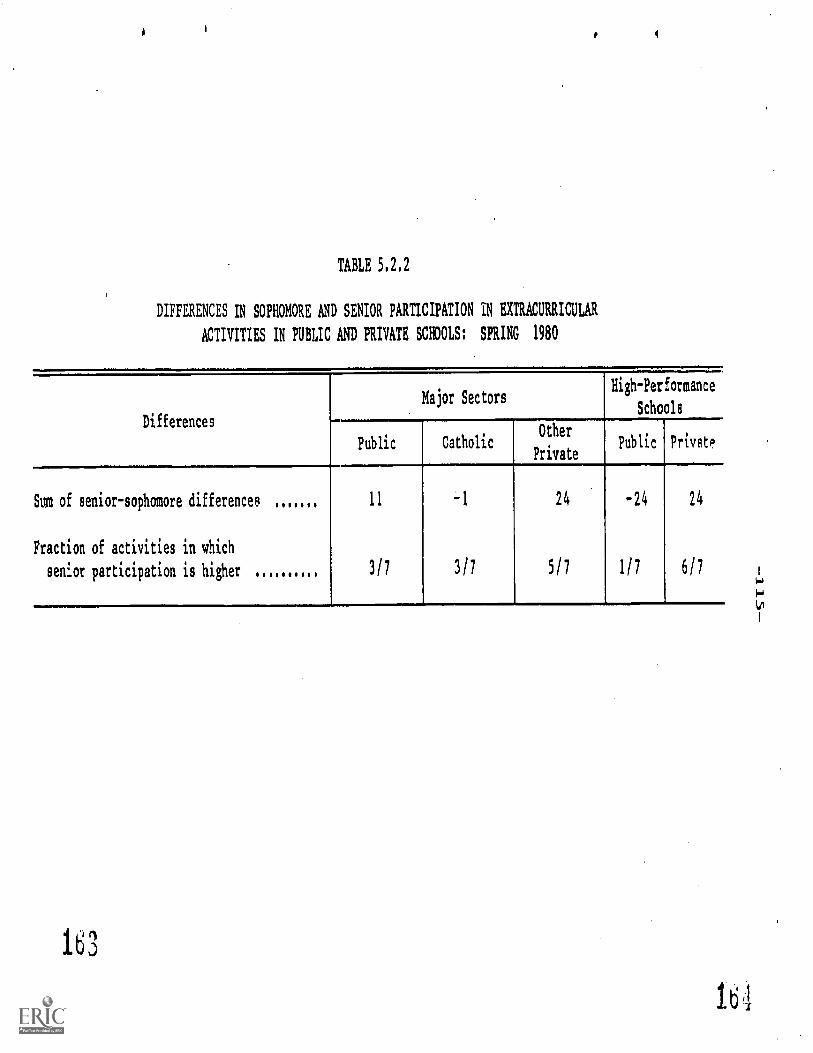
4
TABLE 5.2,2
DIFFERENCES IN SOPHOMORE AND SENIOR PARTICIPATION IN EXTRACURRICULAR
ACTIVITIES IN PUBLIC AND PRIVATE SCHOOLS: SPRING 1980
Differences
Major SectorsHigh-Performance
Schools
Public Catholic
Sum of senior-sophomore differences
Fraction of activities in which
senior participation is higher
11
3/7 3/7
Other
Private
24
5/7
Public Private
-24 24
1/7 6/7
163
1
-116-*
otherwise, which they regard as preventing them from imposing and main-
taining order in their schools.
Discipline is also one of the areas in which public and private
schools are believed to differ most. Catholic schools in particular
are frequently regarded as highly disciplined in comparison with public
schools. It is of special interest, then, to see the similarities and
differences in disciplinary standards and in student behavior in public
schools and the private school sectors. In this section we examine
disciplinary standards; in the next (section 5.4) we examine student
behavior.
Several questions were asked, in the school questionnaire and
the student questionnaire, about rules and enforcement of rules. Table
5.3.1 shows how the responses to two of those questions compare for the
different sectors, and huw the students' and administrators' responses
compare.
There is not a great difference among the sectors, according
to both administrators and students, in responsibility for property
damage. Virtually all administrators in all sectors indicate that stu-
dents are held responsible. Sophomores' responses are also similar
across types of schools, although the percentage is somewhat lower in
public schools. In all sectors, a substantial minority of sophomores
say no such rule is enforced. The difference between administrators
and students, of course, might be in interpretation of what "enforced"
means: for some of the students, enforced might include finding the
student who is responsibley and their responses may reflect the opinion
that the student is often not found. The difference between adminis-
trators and sophomores is greatest in the public schools and least in
165
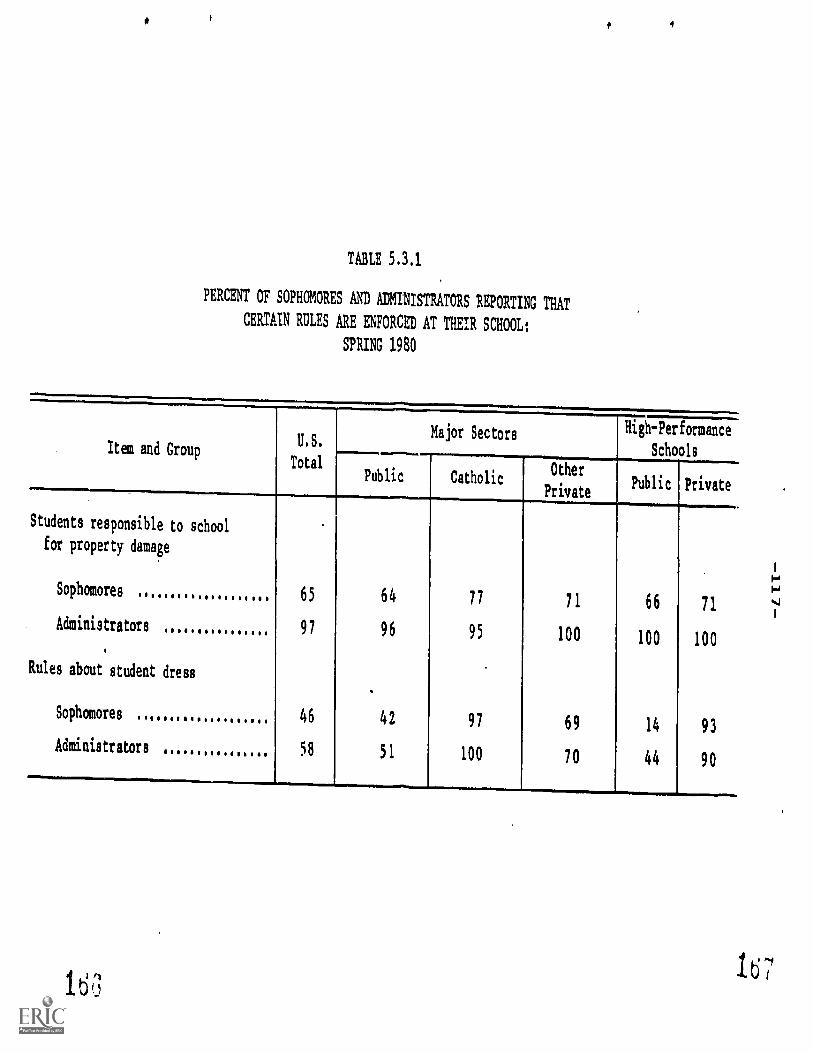
TABLE 5.3.1
PERCENT OF SOPHOMORES AND ADMINISTRATORS REPORTING THAT
CERTAIN RULES ARE ENFORCED AT THEIR SCHOOL:
SPRING 1980
Item and GroupU.S.
Major Sectors High-Performance
SchoolsTotal
_..........,
Public CatholicPrOtherivate
Public Private
Students responsible to school
for property damage
Sophomores 65 64 77 71 66 71
Administrators 97 96 95 100 100 100
Rules about student dress
Sophomores 46 42 97 69 14 93
Administrators 58 51 100 70 44 90
63
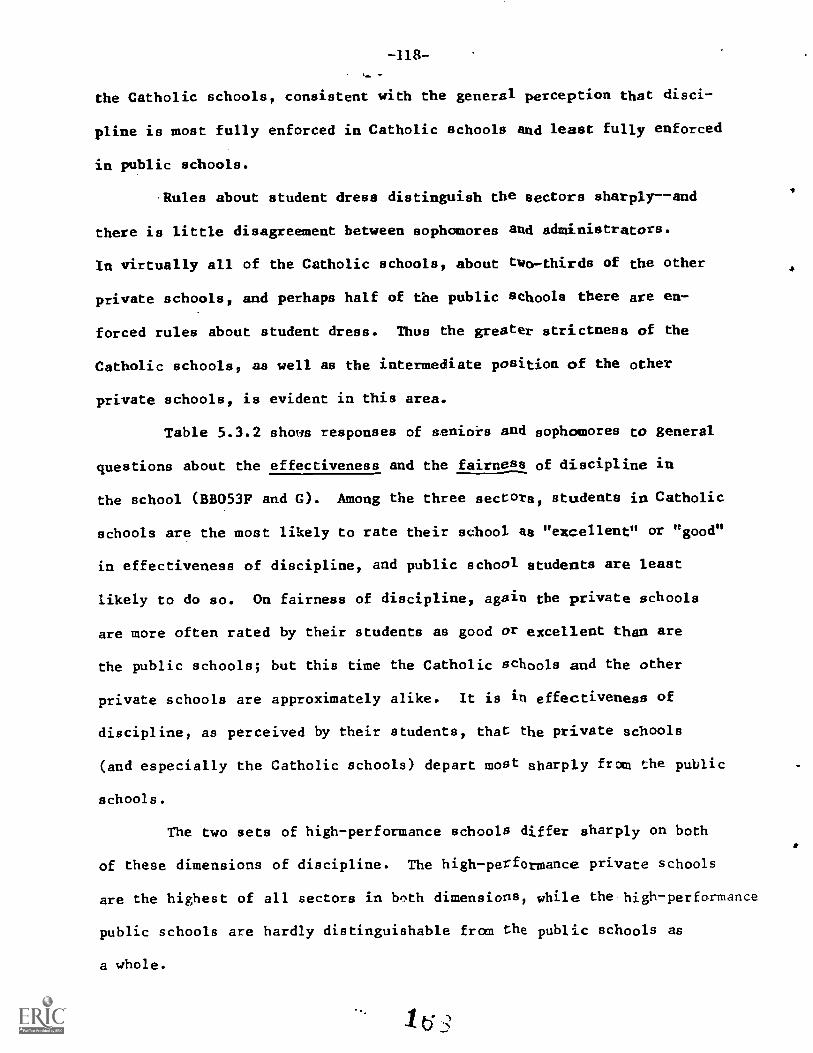
-118-
the Catholic schools, consistent with the general perception that disci-
pline is most fully enforced in Catholic schools and least fully enforced
in public schools.
Rules about student dress distinguish the sectors sharply--and
there is little disagreement between sophomores and administrators.
In virtually all of the Catholic schools, about two-thirds of the other
private schools, and perhaps half of the public schools there are en-
forced rules about student dress. Thus the greater strictness of the
Catholic schools, as well as the intermediate position of the other
private schools, is evident in this area.
Table 5.3.2 shows responses of seniors and sophomores to general
questions about the effectiveness and the fairness of discipline in
the school (BB053F and G). Among the three sectors, students in Catholic
schools are the most likely to rate their school as "excellent" or "good"
in effectiveness of discipline, and public school students are least
likely to do so. On fairness of discipline, again the private schools
are more often rated by their students as good or excellent than are
the public schools; but this time the Catholic schools and the other
private schools are approximately alike. It is in effectiveness of
discipline, as perceived by their students, that the private schools
(and especially the Catholic schools) depart most sharply from the public
schools.
The two sets of high-performance schools differ sharply on both
of these dimensions of discipline. The high-performance private schools
are the highest of all sectors in both dimensions, while the high performance
public schools are hardly distinguishable from the
a whole.
1
public schools as
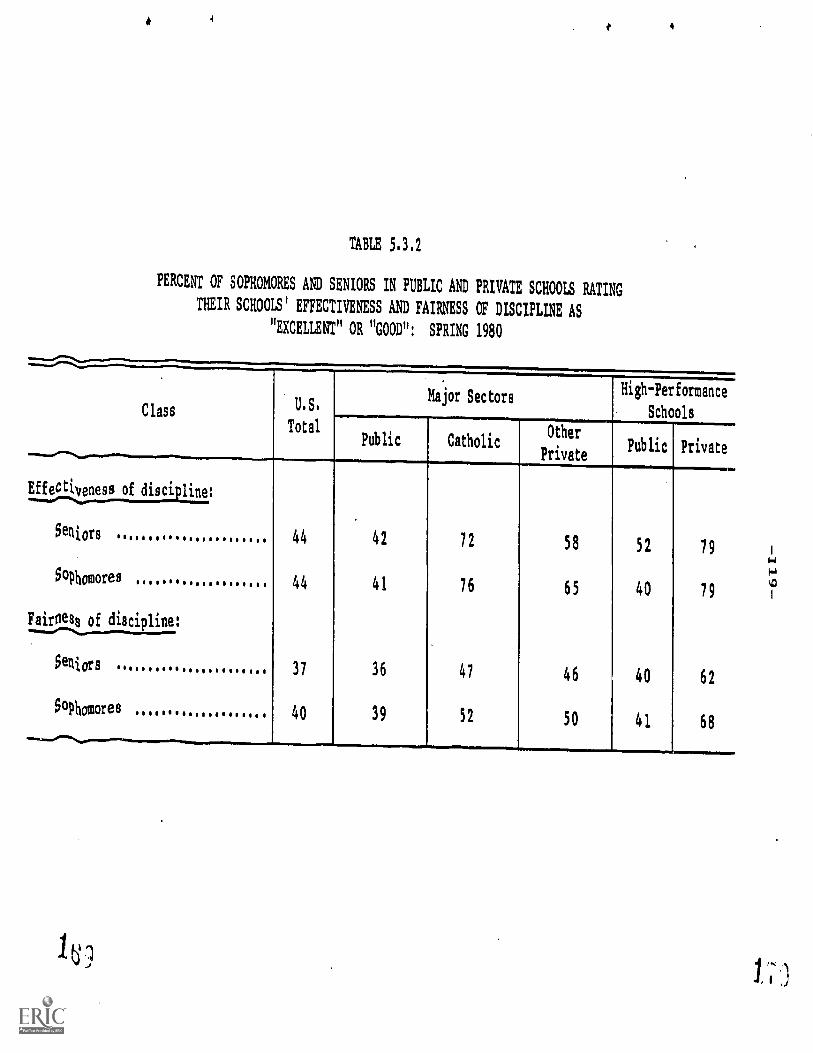
4
TABLE 5.3.2
PERCENT OF SOPHOMORES AND SENIORS IN PUBLIC AND PRIVATE SCHOOLS RATING
THEIR SCHOOLS' EFFECTIVENESS AND FAIRNESS OF DISCIPLINE AS
"EXCELLENT" OR "GOOD": SPRING 1980
4
ClassU.S.
Major Sectors High-Performance
SchoolsTotal
Public Catholicprivate
ther
iPublic Private
Azeissofcacialine:
liors 44 42 72 58 52 79
Phomores
es of discipline:
44 41 76 65 40 79
tliors 37 36 47 46 40 62
Phomores 40 39 52 50 41 68
ecti
Se
50
Fairoe
Se
S

-120 -
The lower rating of public schools by their students in fairness
of discipline is somewhat ironic. In the past decade and a half, legal
strictures to insure fairness of discipline, such as requirements for
due process before suspension, elaborate review processes, and statistical
comparisons of disciplinary actions by race to insure racial fairness,
have been imposed by the courts or the Federal government on public
schools. These strictures are much less fully imposed on private schools
(in part, of course, simply because attendance at these schools is by
choice rather than assignment). Yet it is the private schools, less
bound by the strictures designed to insure fairness, that are more often
regarded as fair by their students. This suggests that the legalistic
approach to insuring fairness in discipline may be less effective than
other approaches in bringing about fairness--and the upper panel of
the table suggests that it may indeed be counterproductive for effective-
ness of discipline. Of course, the effectiveness of discipline is also
dependent on other factors. In particular, private schools have more
control over the entrance and exit of their students than do public
schools.
One other question somewhat related to the disciplinary climate
of a school asked the students about teachers' interest in students.
The responses to that question are shown in table 5.3.3. The table
shows that among the three sectors it is the teachers in other private
schools who are most often regarded as interested in their students.
Teachers in the public schools are by far the least often seen as inter-
ested in students. Again, the high-performance private schools are
highest in perceived interest of teachers, while the high-performance
public schools are similar to the public schools as a whole. Here,
and to a lesser degree in other aspects of discipline, the smaller average
0
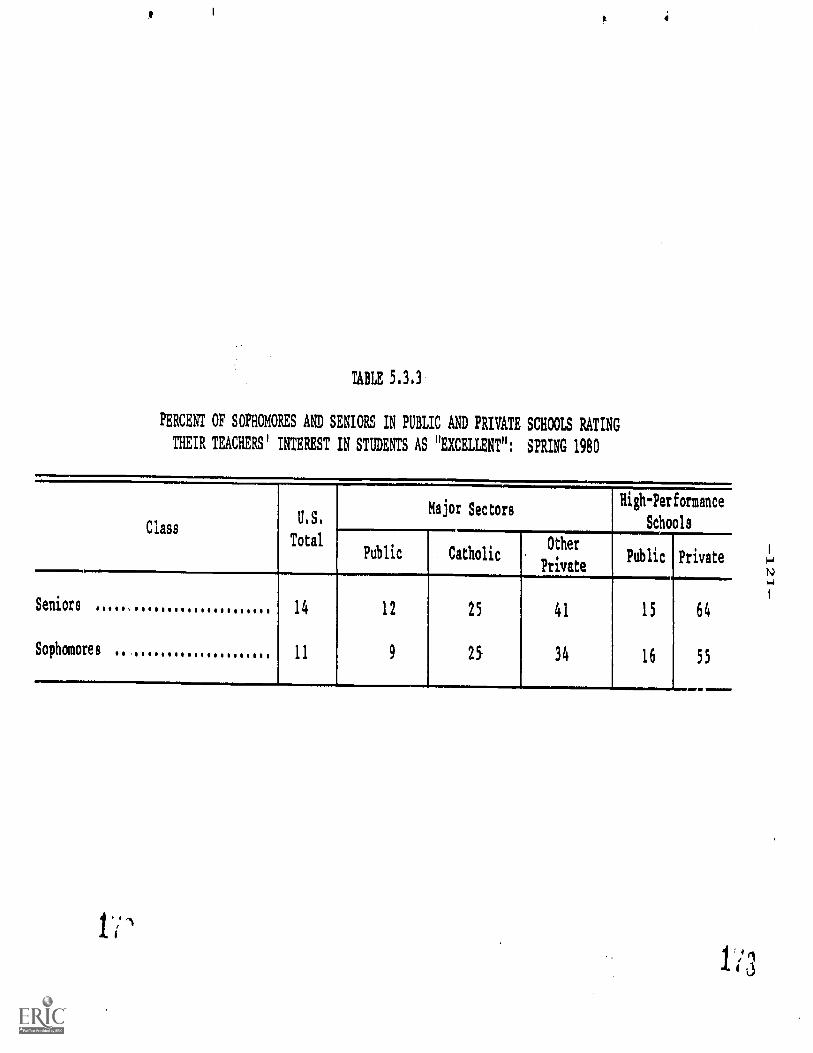
TABLE 5.3.3
PERCENT OF SOPHOMORES AND SENIORS IN PUBLIC AND PRIVATE SCHOOLS RATING
THEIR TEACHERS' INTEREST IN STUDENTS AS "EXCELLENT": SPRING 1980
ClassU.S.
Total
Major SectorsHigh-Performance
Schools
Public CatholicOther
PrivatePublic Private
Seniors
Sophomores
14
11
12
9
25
25
41
34
15
16
64
55
171
-122-
size of the private schools (and especially the other private schools)
may be responsible for some part of the differences.
Another way to examine the difference in disciplinary standards
in each type of school is to aggregate the student response in each
school and then compare the school averages and ranges within each sector.
This procedure gives us a way to compare general school climates among
sectors. Such an aggregation of responses was done for the discipline
and climate items discussed previously--teacher interest in students,
effectiveness of discipline, and fairness of discipline--as well as
for an item on school spirit (BB053H). The responses were aggregated
across both grades, and the school was characterized according to the
average student response. Figure 5.3.1 shows the mean of the school
rating for each sector, and an indication of the -Lange obtained by adding
and subtracting two standard deviations. (About 5 percent of schools
would fall outside of two standard deviations.) Thus, one can compare
both the average school climate for each sector, and the degree of simi-
liarity for schools within each sector (the range).
Some general differences in range hold across at least three
of the four measures: the very broad distributions among the other
private schools, and the tight distributions of high-performance private
and public schools. The breadth of the distributions for the other
private schools implies that these schools differ considerably among
themselves in fairness and effectiveness of discipline. For instance,
although they are higher than the public schools in average perceived
fairness, a few are seen as worse than nearly any public school in fair-
ness of discipline. Teacher interest in other private schools shows
a similarly broad distribution. Finally, there is high variability
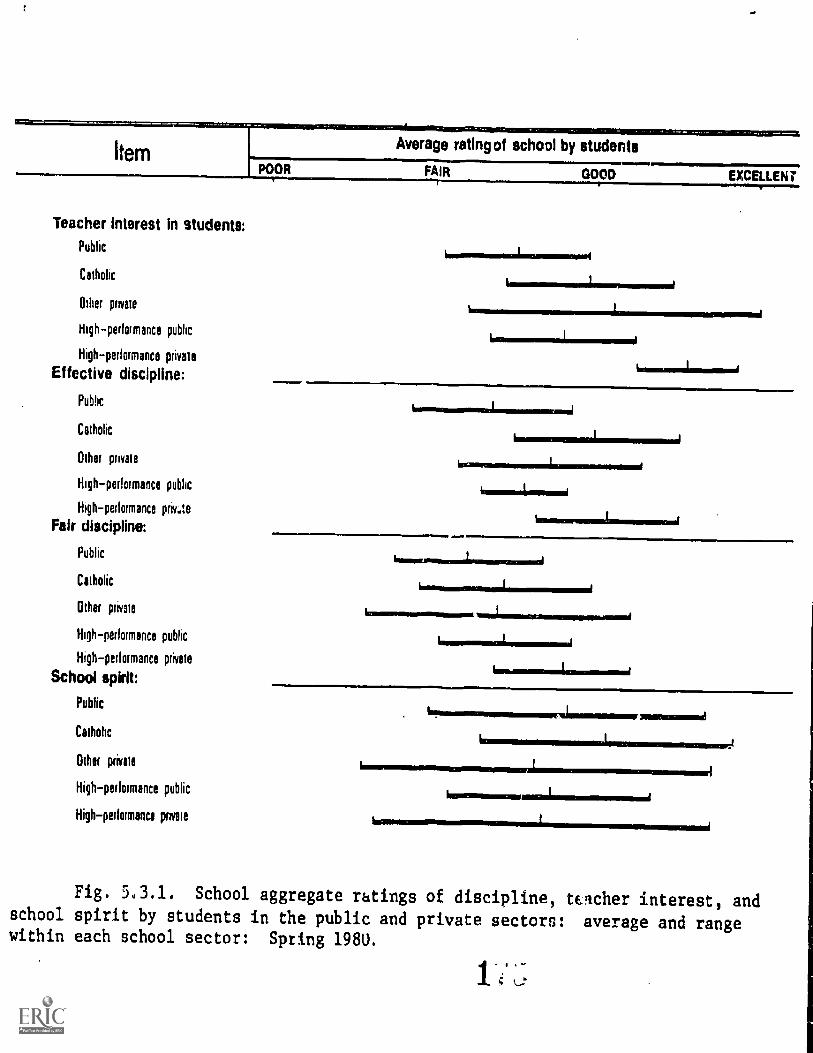
Item pAverage rating of school by students
Teacher interest in students:Public
Catholic
Other private
High-performance public
Highperformance private
Effective discipline:
Public
Catholic
Other private
Highperformance public
Highperformance prime
Fair discipline:
Public
Catholic
Other private
High performance public
Highperlormance private
School spirit:
Public
Catholic
Other private
High -- performance public
High performance pate
Fig. 5u3.1. School
school spirit by students
within each school sector:
POOR FAIR GOOD
ivoromienrwormormorl
imile.1.=m1
EXCELLENT
isnismummi...,1=mosimmi
leurwomussilimsommovoloiniur
kommommr...
601MIM=IMM1101
lmor
, 61ONANIMEMisimmrMIRTIMINIII
IMMINIMMIIMMIIMININMERIPME1111Milineminli
Inuseassmii.s.s...wissminimarf
irmenimimmov
insusassocommirommmommerilI
aggregate ratings of discipline, teacher interest, andin the public and private sectors: average and range
Spring 1980.
-124-
in school discipline climates in other private schools, and high consis-
tency among both public and private high-performance schools.'
Looking at central tendencies, which tell us about the average
school within each type, the high-performance private schools are highest
in teacher interest, effectiveness of discipline, and fairness of disci-
pline, and low only in school spirit (though they show a wide range).
Conversely, the public schools are lowest in teacher interest and in
effective and fair discipline; in school spirit they are relatively
high, exceeded only by the Catholic schools. High-performance public
schools tend to be rated slightly higher on these dimensions of school
environment than the public schools, except in school spirit.
Comparing Catholic and other private schools, the Catholic schools
are higher in effectiveness of discipline and in school spirit, the
other private schools are higher in teacher interest, and the two are
about equal in fairness of discipline.
These results at the school level are consistent with the individual-
level results, except that the inclusion of the range of schools within
each of the sectors on measures of discipline reveals the great variation
within the other private schools.
Altogether, the indicators of disciplinary standards and disci-
plinary climate indicate that the standard stereotypes are by and large
true. The Catholic schools are strictest in discipline; the other private
1Some part of the variability in all sectors is due to sampling
variability, since only a sample of students in each grade level wasinzluded in the study. For most sectors, this sampling variabilityis basil, since; if all sampL,d students responded, the school averageis based on seventy-two student responses. But some schools, anpeciallyin the ()the'. private sector, were so small that the total of the sopho-more and senior cl!-,,!s was considerably below seventy-two. Thus apart of the broader variability for other private schools is :sue tothis sampling variability.
41.1 j
-125
schools are somewhat less strict and appear to be more nurturant (as
evidenced by perceived teacher interest). The public schools, taken
as a whole, are neither strict nor nurturant. In addition, they are
least often regarded by cheir students as fair in their exercise of
discipline. The comparisons are not happy ones for American public
schools.
5.4 Student Behavior
In this section we compare the obverse of disciplinary standards,
that is, student behavior in different sectors, including involvement
in school, attendance, tardiness, and cutting classes. Student behavior
is in part the consequence of the way a school is organized and admin-
istered and in part the cause. We know that students attend school
with different degrees of regularity, making teaching more or less diffi-
cult; that students spend varying amounts of time on homework; and that,
when in school, students exhibit differing degrees of behavior problems.
The question of interest here is just how the various sectors of educe-
tion compare in student behavior.
5.4.1 Involvement in school
Involvement in school is one aspect of student behavior. There
are several measures of this in the student questionnaires. One is
the amount of time spent on homework (BB015); a second the true-false
response to a statement that the student is intere-ted in school (BB059C);
a third is another true-false response to a statement that the student
likes to work hard in school (BB061E).
The average amount of time spent on homework differs considerably
among the sectors. The averages for sophomores are: leis than four
hours a week in the public schools; over five and one-half in Catholic
1
-12b-
schools, other private schools, and high-performance public schools;
and over nine hours in the high-performance private schools. Again,
the other private schools show a greater diversity than the Catholic
schools, with more students at each extreme. Most homogeneous are high-
performance private schools, where nearly all of the sophomores spend
over three hours and almost half spend over ten hours (table 5.4,1).
Seniors spend less time on homework than do sophomores, except
in the high-performance private and public schools, where slightly more
time is spent, on the average. From this evidence, seniors appear slightly
less involved in schoolwork than are sophomores. One other point from
the table is noteworthy: In both the Catholic schools and the high-
performance private schools, no sophomore, and almost no senior, reports
not having homework assigned; in the public schools, 2.4 percent of
sophomores and 4 percent of seniors report that none is assigned.
Although watching television is not part of school functioning,
it stands as a kind of alternative time expenditure for high school
students, and it is useful to see how students from th-..! different types
of schools balance their time between television and homework. Table
5.4.2 shows the amount of time spent on watching television by all stu-
dents in a week, and these results can be compares: to the amount of
time spent on homework. Comparison of tables 5.4.1 and 5.4.2 reveals
that the lesser time spent on homework by the average public school
student is matched by a greater amount of time spent in watching tele-
vision. Because of the different time categories used for the two items,
and because of a general normative pressure to overreport time spent
in homework and underreport time spent watching television, the absolute
numbers of hours in the two activities cannot be directly compared.
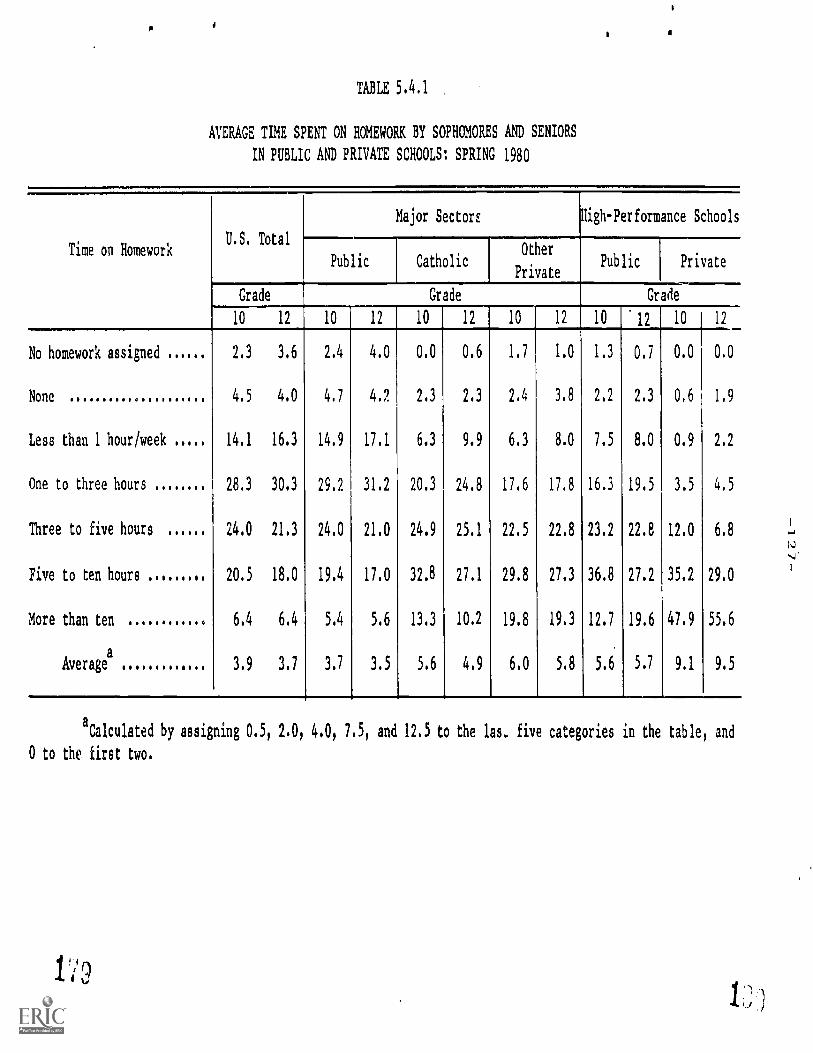
TABLE 5.4.1
AVERAGE TIME SPENT ON HOMEWORK BY SOPHOMORES AND SENIORS
IN PUBLIC AND PRIVATE SCHOOLS: SPRING 1980
Time on HomeworkU.S. Total
Major Sectors High-Performance Schools
Public CatholicOther
PrivatePublic Private
Grade Grade Grade
10 12 10 12 10 12 10 12 10 12 10 12
No homework assigned 2.3 3.6 2.4 4.0 0.0 0.6 1.7 1.0 1.3 0.7 0.0 0.0
None 4,5 4.0 4.7 4.2 2.3 2.3 2.4 3.8 2.2 2.3 0,6 1,9
Less than 1 hour/week 14.1 16.3 14.9 17.1 6.3 9.9 6.3 8.0 7.5 8.0 0.9 2.2
One to three hours 28,3 30.3 29,2 31.2 20.3 24.8 17.6 17,8 16.3 19.5 3.5 4,5
Three to five hours 24.0 21.3 24.0 21.0 24.9 25.1 22.5 22.8 23.2 22.8 12.0 6.8
Five to ten hours .., 20.5 18.0 19.4 17.0 32.8 27.1 29.8 27.3 36.8 27.2 35.2 29.0
More than ten 6.4 6.4 5.4 5.6 13.3 10.2 19.8 19.3 12.7 19.6 47.9 55.6
Averagea 3.9 3.7 3.7 3.5 5.6 4.9 6.0 5.8 5.6 5.7 9.1 9.5
aCalculated by assigning 0.5, 2.0, 4.0, 7.5, and 12.5 to the las. five categories in the table, and
0 to the first two.
110
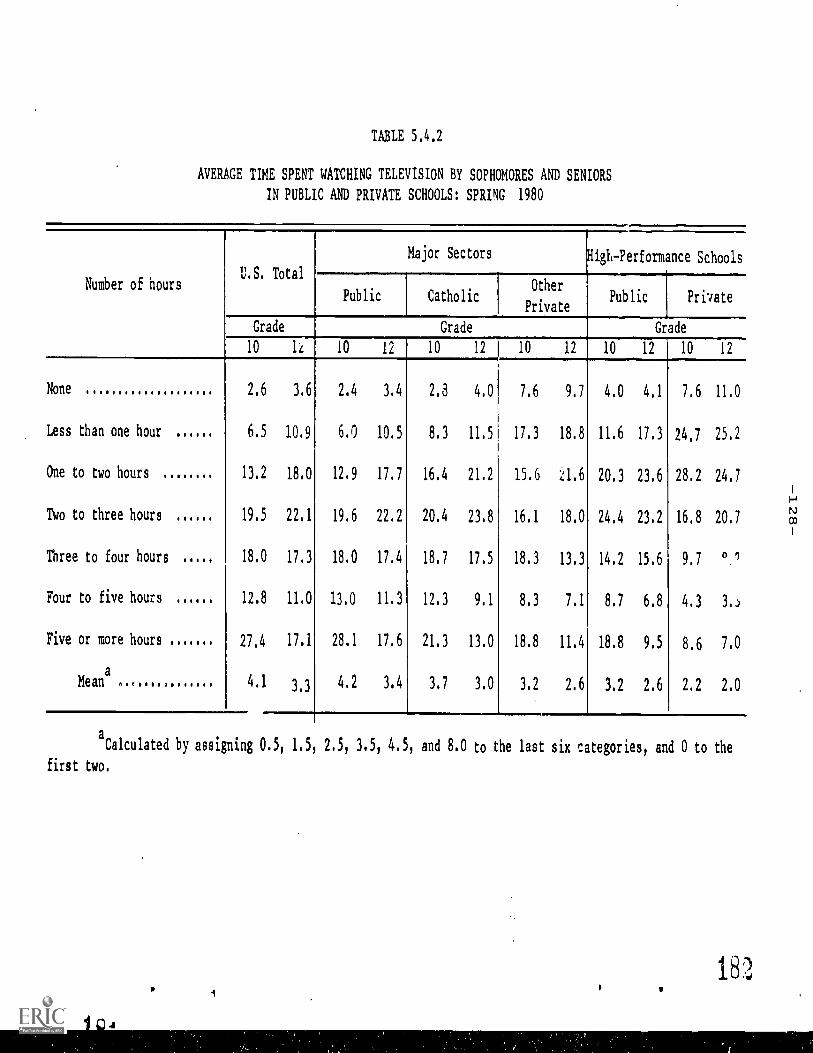
TABLE 5.4.2
AVERAGE TIME SPENT WATCHING TELEVISION BY SOPHOMORES AND SENIORS
IN PUBLIC AND PRIVATE SCHOOLS: SPRING 1980
Number of hoursU.S. Total
Grade
10 1
None 2,6 3.6
Less than one hour 6.5 10.9
One to two hours 13,2 18.0
Two to three hours 19.5 22.1
Three to four hours 18.0 17.3
Four to five hours 12.8 11.0
Five or more hours
a
27,4 17.1
Mean4.,O81.0 4,1 3.3
Major Sectors High-Performance Schools
Public CatholicOther
PrivatePublic Private
Grade Grade
10 1
2.4 3.4
6.0 10.5
12,9 17,7
19.6 22.2
18.0 17.4
13,0 11.3
28.1 17.6
4.2 3.4
10 12 J 10 12
2.8 4.0
8.3 11.5
16.4 21.2
20.4 23,8
18.7 17,5
12,3 9.1
21.3 13.0
3.7 3.0
10 12 10 12
7,6 9.7
17.3 18.8
15.6 ,1 6
16.1 18,0
18.3 13,3
8.3 7.1
18.8 11.4
3.2 2.6
4.0 4.1 7.6 11.0
11.6 17.3 24,7 25.2
20,3 23.6 28.2 24.7
24.4 23.2 16,8 20.7
14.2 15.6 9.7
8.7 6.8 4,3 3.)
18.8 9.5 8,6 7.0
3.2 2.6 2.2 2.0
a
Calculated by assigning 0.5, 1.5, 2.5, 3,5, 4.5, and 8.0 to the last six categories, and 0 to the
first two.
1 0
18?,
-129
But the direction of the differences among the sectors is exactly re-
versed for television watching and for homework. The public school
students are lowest in homework, highest in television watching; the
students in high-performance private schools are highest in homework,
lowest in television. These two time expenditure reports suggest the
differing levels of demands imposed on students in the different types
of schools.
In addition to comparisons by school type, comparison of seniors
and sophomores is of interest. Seniors watch less television, than
sophomores and are also less occupied by homework. A greater amount
of their attention than that of sophomores is devoted to activities
other than either schoolwork or television. Another report from this
study (Lewin-Epstein 1981), shows that a major area of activity for
many youth is anployment.
Student reports of interest in school and liking to work hard
in school give another perspective on the capacity of these schools
as constituted to capture the attention of their students (see table
5.4.3). These items, however, show considerably fewer differences among
students by sector than does the item concerning time spent on homework.
It is true that fewer of the students in public sc, is and more of
the students in high-performance private schools report being interested,
but the differences between the public and private schools as a whole
are very small. The same can be said for responses to the question
about liking to work hard: there are only small differences among the
schools, and the public spools are not consistently the lowest.
In general, for both of these questions, the seniors show, as
already suggested by their spending less time on homework: slightly
less interest in school than do the sophomores. Thus, aga.".n, there
- 18
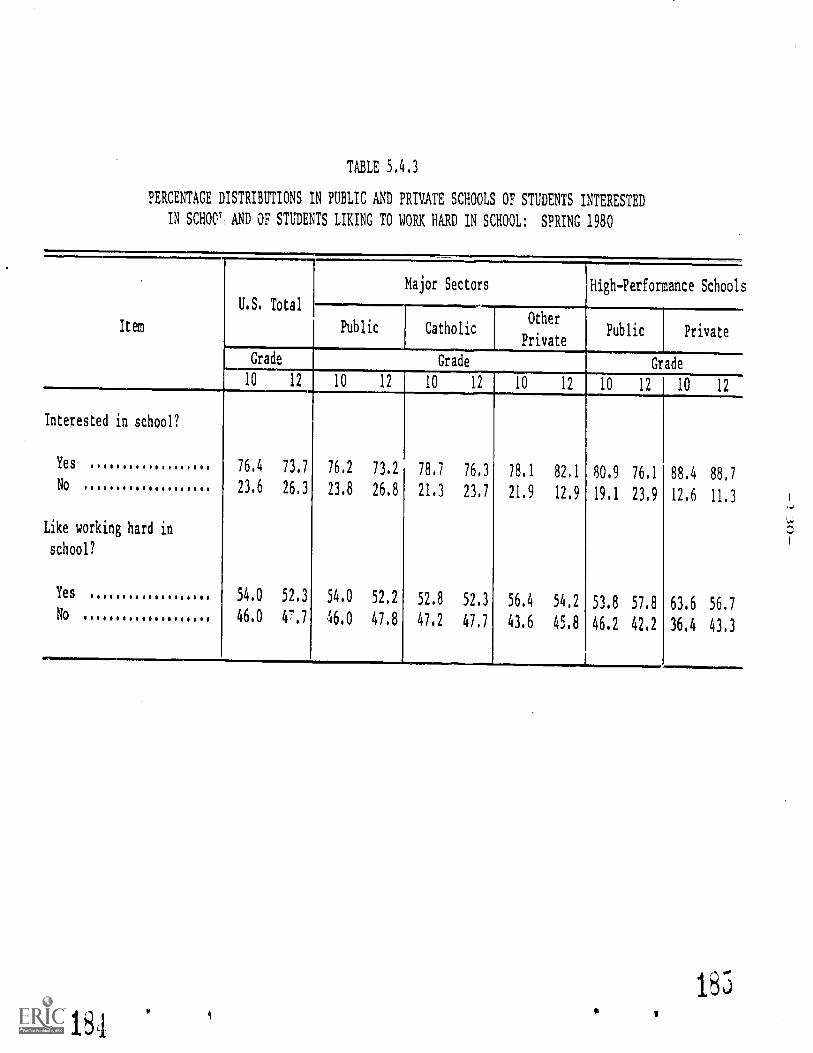
TABLE 5.4.3
PERCENTAGE DISTRIBUTIONS IN PUBLIC AND PRIVATE SCHOOLS OF STUDENTS INTERESTED
IN SCH001 AND OF STUDENTS LIKING TO WORK HARD IN SCHOOL: SPRING 1980
Item
U.S. Total
Major Sectors High-Performance SchoolE
Public CatholicPrivate
Public Private
Grade Grade Grade
10 12 10 12 10 12 10 12 10 12 10 12
Interested in school?
Yes
No
Like working hard in
school?
Yes
No
76.4
23.6
54.0
46.0
73.7
26.3
52.3
47.7
76.2
23.8
54.0
46.0
73.2
26.8
52.2
47.8
78.7
21.3
52.8
47.2
76.3
23.7
52.3
47.7
78.1
21.9
56.4
43.6
82.1
12.9
54.2
45.8
80.9
19.1
53.8
46.2
76.1
23.9
57.8
42.2
88.4
12.6
63.6
36.4
88.7
11.3
56.7
43.3
---
183
184
-131 -
is indication that in all sectors the interest and involvement of seniors
in high school is somewhat lower than that of sophomores.
5.4.2 School attendance
Another area of student behavior is attendance. We look at
three potential problems in this area: absence from school for reasons
other than illness, class cutting, and tardiness. Student behavior
along these lines differs according to type of school. Table 5.4.4
shows that the school sectors are ordered alike for all of these types
of behavior and for both seniors and sophomores: students in Catholic
schools show the highest consistency of attendance, students in other
private schools are next, and students in public schools are lowest.
Curiously, students in high-performance public schools have the poorest
attendance records.
This table includes, in addition. evidence that seniors are
less well disciplined in attendance than are sophomores. In all types
of schools, and by all three measures, seniors show less consistency
in their ;attendance at school than do sophomores. This is especially
noteworthy because the seniors are a more select group, excluding those
students--on the whole, less well disciplined--who have dropped out
between the sophomore and senior years. Thus there is further indica-
tion that seniors are less involved in high school than are sophomores.
5.4.3 Reports rbout discipline from administrators and students
In addition to these reports by students concerning their own
behavior, there ie. information about the. school's behavioral climate
from two other sources: the school questionnaire included questions
(SS056), answered by the school's administrative staff, about the seri-
ousness of various types of behavioral problems among students; and
186
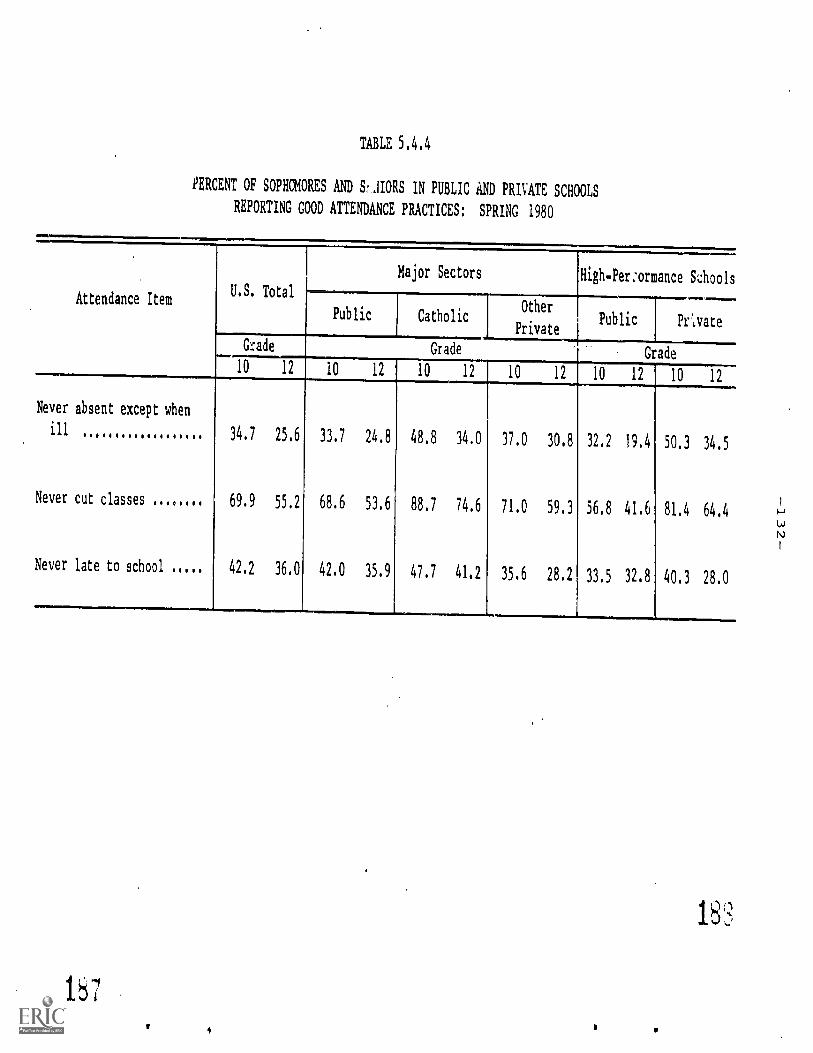
TABLE 5.4.4
PERCENT OF SOPHOMORES AND SHIORS IN PUBLIC AND PRIVATE SCHOOLS
REPORTING GOOD ATTENDANCE PRACTICES: SPRING 1980
Attendance ItemU.S. Total ---,---------
Public
Major Sectors
CatholicOther
Private
High-Per:ormance Schools
Public Pr1vate
Grade Grade Grade
10 12 10 12 10 12 10 12 10 12 10 12
Never absent except when
ill34.7 25.6 33.7 24.8 48.8 34.0 37.0 30.8 32.2 19.4 50.3 34.5
Never cut classes 69.9 55.2 68.6 53.6 88.7 74.6 71,0 59.3 56.8 41.6 81.4 64,4
Never late to school 42.2 36.0 42.0 35.9 47,7 41,2 35.6 28.2 33.5 32.8 40.3 28.0
1b7
-133 -
sophomores were asked (YB019) about how often certain behavior problems,
in some of the same areas as well as some others, arise in the school.
Responses to these questions offer two additional perspectives on the
school's behavioral climate. In two of the areas, student absenteeism
and class cutting, it is possible to examine the same behavior from
three perspectives: the students' reports of their own behavior, the
school administrators' reports about what happens in the school, and
the students' reports about what happens in the school. In another
area, verbal abuse of teachers, it is possible to get two perspectives:
reports from the administrative staff and from the students about what
happens in the school.
Table 5.4.5 presents the administrators' and the sophomores'
responses concerning behavioral problems, some covering the same areas
of behavior. Comparing the two areas in which there are three perspec-
tives, we find some -;.nteresting differences. First, two of the three
perspectives show Catholic schools to have the best attendance and public
schools to have the worst. But the perspectives differ: students'
reports of their own behavior show less difference among school types
than de administrators' and sophome-es' reports about the school. There
is a logical basis for the difference between student4' reports of their
own behavior and rerorts on a "school problem." If 5 percent cf students
are chronically absent in one school and 15 percent are absent'in another,
it is logically consistent for no one in the first school to report
that this "often happens" or is a "serious problem," and for all students
and kdmi%istrators in the seceud school to report that it often happens
or is a serious problem. Thus such reports oa a school can logically
show greater extremes than the actual behavioral averages.
1 8:1
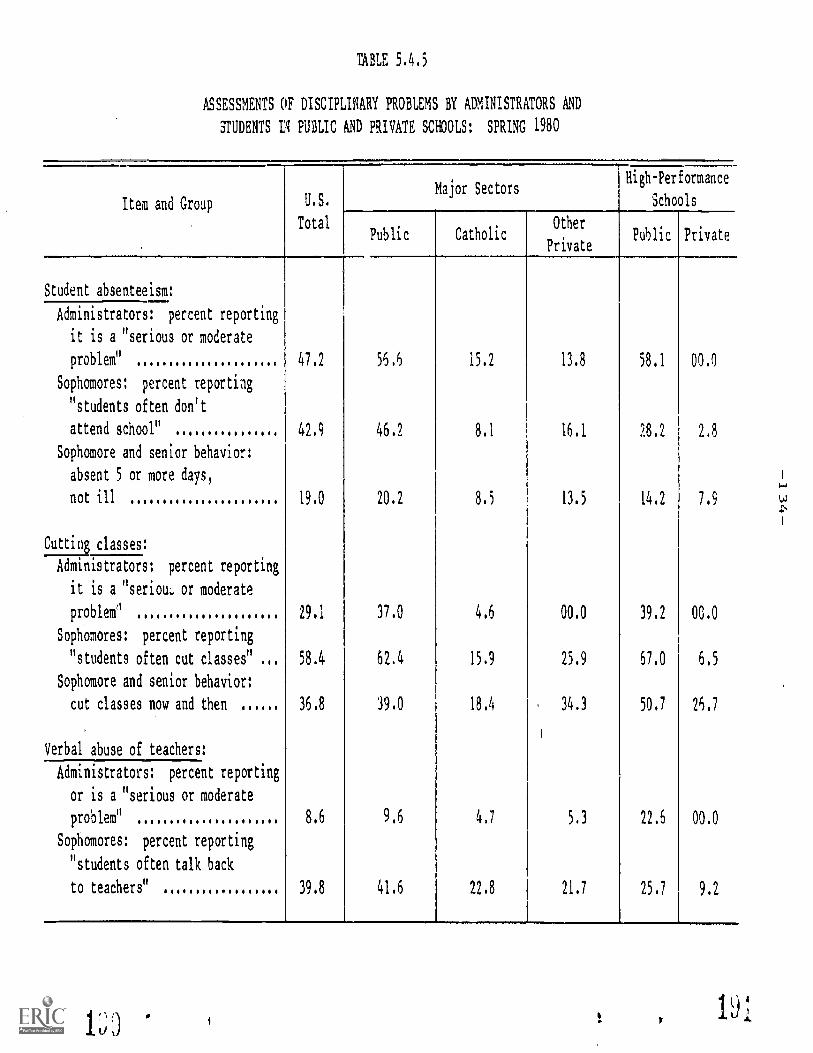
TABLE 5.4.5
ASSESSMENTS OF DISCIPLINARY PROBLEMS BY ADMINISTRATORS AND
STUDENTS Li PUBLIC AND PRIVATE SCHOOLS: SPRING 1980
Item and Group U.S.
Total
Major SectorsHigh-Performance
Schools
Public CatholicOther
PrivatePublic Private
Student absenteeism:
Administrators: percent reporting
it is a "serious or moderate
problem" 47.2 56,6 15.2 13.8 58.1 00.0
Sophomores: percent reporting
"students often don't
attend school" 42.9 46.2 8.1 16.1 28.2 2.8
Sophomore and senior behavior:
absent 5 or more days,
not ill 19.0 20.2 8.5 13.5 14.2 7.9
Cutting classes:
Administrators: percent reporting
it is a "seriou., or moderate
problem' 29.1 37.0 4.6 00.0 39.2 00.0
Sophomores: percent reporting
"students often cut classes" 58.4 62.4 15.9 25.9 67.0 6.5
Sophomore and senior behavior:
cut classes now and then 36.8 39.0 18.4 34.3 50,7 26.7
,
1
Verbal abuse of teachers:
Administrators: percent reporting
or is a "serious or moderate
problem" 8.6 9.6 4.7 5.3 22,6 00.0
Sophomores: percent reporting
"students often talk back
to teachers" 39.8 41.6 22.8 21.7 25.7 9.2
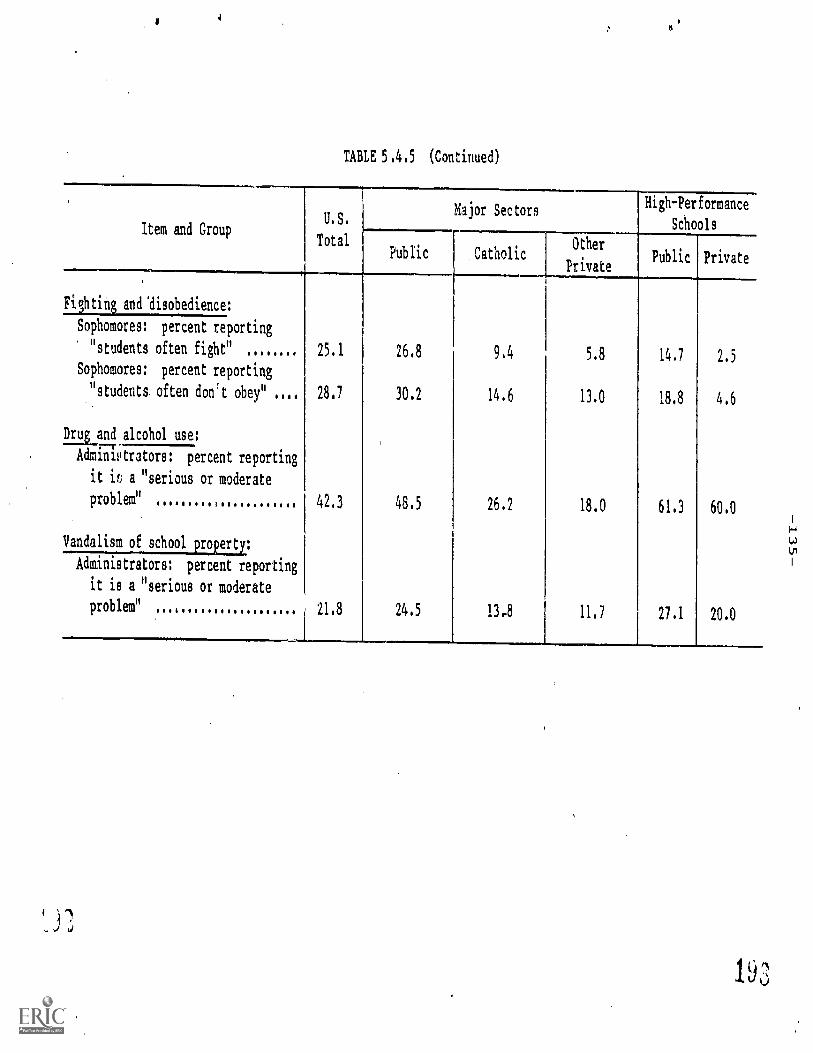
TABLE 5.4.5 (Continued)
Item and GroupU.S.
Total
Major SectorsHigh-Performance
Schools
Public CatholicOther
PrivatePublic Private
Fighting and 'disobedience:
Sophomores: percent reporting
"students often fight" 25,1 26.8 9.4 5.8 14.7 2.5Sophomores: percent reporting
"students. often don't obey" ... 28.1 30.2 14.6 13.0 18,8 4.6
2.1114 alcohol use:,
Adminivtrators: percent reporting
it it; a "serious or moderate
problem" 42.3 48.5 26.2 18.0 61.3 60.0
Vandalism of school proyerty:
Administrators: percent reporting
it is a "serious or moderate
problem" 1.21.8 24.5 13,8 11.7 21.1 20.0
-136 -
Table 5.4.5 also includes data on areas of behavior not related
to attendance; these have to do with disorderly and disobedient behavior
while in school, and in some cases directed toward the school. The
difference between public and private schools stands out just as strongly
here as in attendance. The incidence of problems of all sorts is high
in public schools, however reported and by whomever reported. There
is, however, a reversal between the two sectors of private schools.
In most of these areas of behavior--smIcifically verbal abuse of teachers,
fighting, drug and alcohol use, and vandalism--Catholic schools show
slightly higher rates of incidence than do other private schools. The
students' reports and the administrators' reports are reasonably consis-
tent in this (except that administrators report much lower levels of
verbal abuse of teachers than do sophomores, suggesting that the responses
of the two may be referring to somewhat different behavior--"verbal
abuse" vs. "talking back"). In absenteeism and cutting classes, as
indicated earlier, the other private schools are higher than the Catholic
schools. It seems likely that the reason for the somewhat poorer atten-
dance in the other private schools is that these schools are somewhat
less strict about enforcement of atterdance or disciplinary action for
nonattendance than are Catholic schools. This conjecture is reinforced
by the fact that while absenteeism and cutting classes, as reported
by students of themselves and of other students, are more prcvalent
in other private schoo..s than in Catholic schools, the principals less
often define this as a "problem."
As indicated by earlier data, the high-performance public schools
resemble the public schools as a whole tore than they resemble any of
the private secto::s, while the high-performance private schools tend
to show fewer disciplinary problems than either the Catholic or other
private schools.
i" 14_1 j
-137 -
In one area of behavior, however, administrators in both sets
of high-performance schools more often report a behavior problem than
do administrators in any other sector: use of alcohol or drugs. Admin-
istrators in three-fifths of the high-performance schools report a "serious"
or "moderate" problem. In the absence of further information (students
were not risked about alcohol or drug use), we can merely note this.
It is possible not only to characterize each of the sectors
by the distribution of student behavior, but also to characterize each
school according to the level of discipline problems students see in
the school. In add;tion to the items concerning attendance, cutting
classes, and verbal abuse, sophomores were asked about three areas of
student behavior problems in their school: not obeying, getting in
fights, and threatening or harming teachers. For each school, the stu-
dents' responses to these six items were averaged, so that the school
is characterized by the level of discipline problems as perceived by
all sophomores.
As in the analysis of disciplinary standards, where a similar
aggregation was done for each sector, the results are tabulated as the
mean and the range. (That is, plus and minus two standard deviations.
In some cases, this exceeds the upper limits of 3.0 or goes below the
lower limit of 1.0, but this can still serve as a measure of the range
of schools. On the graph, the ranges are truncated at the limits.)
About 5 percent of schools lie outside of a range of two standard devi-
ations.
The results are shown in figure 5.4.1. Several general results
hold over all areas of student behavior. Again, the high-performance
private schools show a tight distribution, just as they did earlier,
in the case of disciplinary standards. And, nairi, the other private
1 9 7
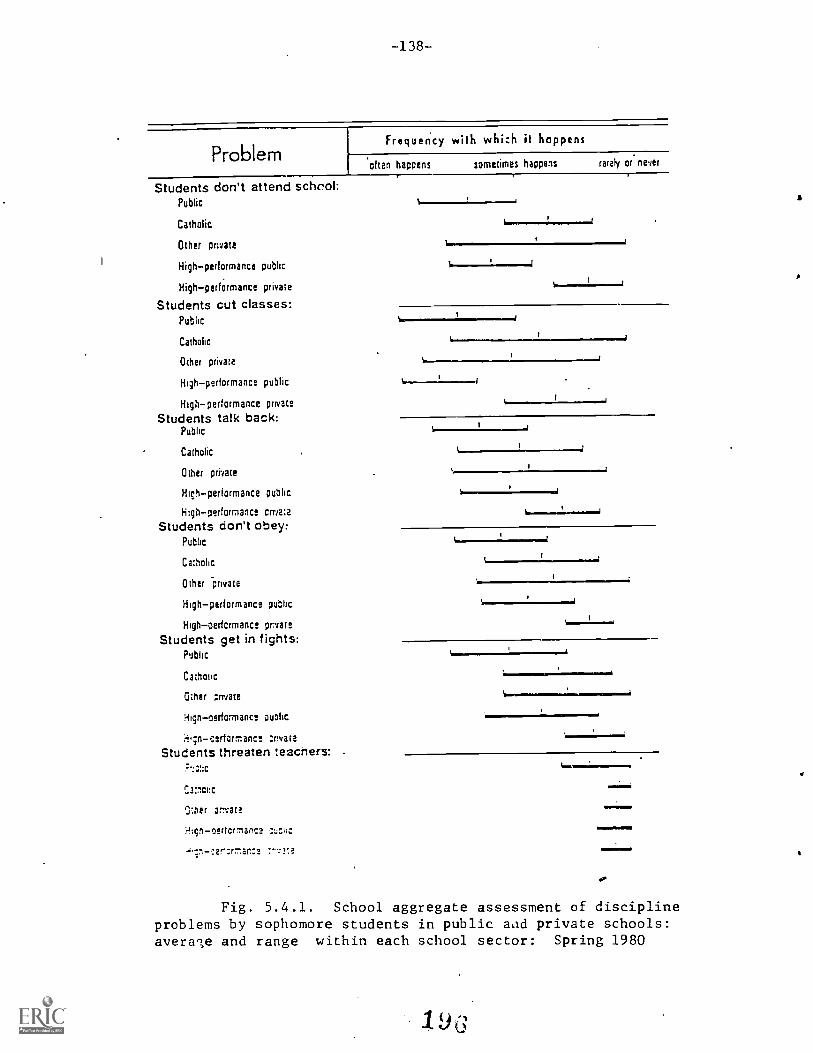
ProblemFrequericy with which it happens
often happens sometimes happens rarely or never
Students don't attend school:Public
Catholic
Other private
Highperformance public
Highperformance private
Students cut classes:Public
Catholic
Other private
Highperformance public
High performance privateStudents talk back:
Public
Catholic
Other private
High performance public
Highperformance crria :aStudents don't obey:
Public
Catholic
Other private
High performance public
High performance privet e
Students get in tights:Public
Catharic
Other ;mate
'firgnoerfarrnance pudic
ormance :rvareStudents threaten teachers:
CEnci:c
Omer sr::a:3
H.lonoeactmann=i,c
%1%
O
Fig. 5.4.1. School aggregate assessment of disciplineproblems by sophomore students in public aad private schools:averwle and range within each school sector: Spring 1980
-139--
schools siv-w the largest range in most areas, though in the area of
threatening or attacking teachers it is only the public schools that
show a range.
In all areas of behavior, without exception, the public schools
have greater student behavior problems than schools in any other sector.
In some areas, such as attendance, cutting classes, fighting, and threat-
ening teachers, the average public school is outside the whole range
of Catholic schools in the direction of more behavior problems (that
is, at a point beyond which we would find less than 2.5 percent of the
Catholic schools). The difference between the schools in these two
sectors in student behavior problems is clearly very great. The differ-
ence between public schools and other private schools is also great.
In every area except cutting classes and threatening teachers, the
average for other private schools is beyond the range of public schools,
in the direction of fewer behavior problems (i.e., at a point beyond
which we would find less than 2.5 percent of the public schools).
These characterizations of behavior problems in the schools
show extremely great differences between the public schools and the
private schools. In sum, although the distributions of schools do over-
lap, in some areas the majority of public schools are beyond the limits
of the distribution of private schools.
5.5 Students' Attitudes
Students' attitudes toward themselves and their environments
were elicited in the student questionnaire (BB058A through L). Several
questions related to what is ordinarily termed "self-concept"--just
how good one feels about oneself--were asked, using a five-point agree/
disagree scale. Another set of questions, using the same scale, tapped
-140-
what is ordinarily termed "internal control" or "fate control," that
is, the degree to which one feels in control of those Clings one regards
as important.
Through these questions it is possible to see how students in
each type of school feel about themselves. Information about such feelings
or attitudes gives a sense of the psychic state of a school's student
body, and thus add to our sense of just how the schools function as
social systems.
The proportion of students within each sector expressing a strong
sense of fate control is shown in table 5.5.1. Six items intended to
elicit these feelings are listed there. The differences among sectors
are not large, but they are consistent. For nearly all items, public
school students are lowest, Catholic school students ar: next, students
in other private schools and high-performance public schools are only
slightly higher, and students in high--performance private schools are
somewhat higher than the rest. Averages are shown at the bottom of
the table, indicating the differences. As these figures show, seniors
in all types of schools have a somewhat higher belief in their control
of their own fates than do sophomores, with the magnitude of the differ-
ences being about equal to that between the public and private school
students at the same grade level. However, the seniors in other private
and high-performance private schools exceed the sophomores in their
sense of fate control somewhat more than is true in the other sectors.
A variety of experiences, both within the school and outside
it, give some people more self-confidence about themselves elan others.
Academic achievement and leadership experience are two of the in-school
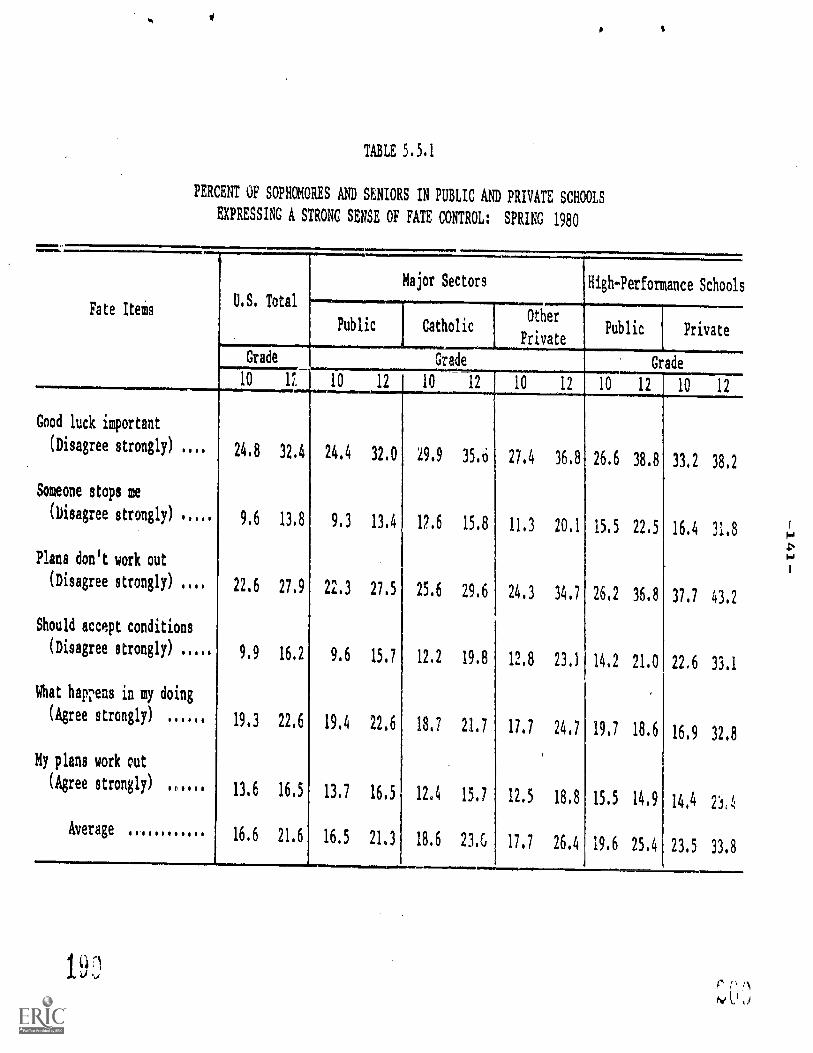
TABLE 5.5.1
PERCENT OF SOPHOMORES AND SENIORS IN PUBLIC AND PRIVATE SCHOOLS
EXPRESSING A STRONG SENSE OF FATE CONTROL: SPRING 1980
NOMNY .14===IIMAI.E.S1
Fate ReisU.S. Total
Major Sectors High-Performance Schools
Public CatholicOther
PrivatePublic Private
Grade Grade Grade
10 17. 10 12 10 12 10 12,..1.10 12 10 12
Good luck important
(Disagree strongly) 24.8 32.4 24.4 32.0 29.9 35.6 27,4 36,8 26.6 38.8 33.2 38.2
Someone stops me
(Disagree strongly) ...., 9.6 13.8 9.3 13.4 12.6 15.8 11.3 20.1 15.5 22.5 16.4 31,8
Plans don't work out
(Disagree strongly) 22.6 27.9 22.3 27,5 25.6 29.6 24.3 34.7 26,2 36.8 37,7 43.2
Should accept conditions
(Disagree strongly) 9.9 16.2 9.6 15.7 12.2 19.8 12.8 23.) 14,2 21.0 22,6 33.1
What harens in my doing
(Agree strongly) 19,3 22.6 19.4 22.6 18,7 21.7 17,7 24,7 19.7 18.6 16,9 32.8
My plans work out
(Agree strongly)13.6 16.5 13.7 16.5 12,4 15.7 12,5 18,8 15.5 14.9 14,4 2.J,1
Average16.6 21.6 16.5 21.3 18.6 23.G 17,7 26.4 19.6 25.4 23.5 33.8
a.,

-142-
experiences that can foster the growth of self-esteem. Table 5.5.2
shows the variation in high self-esteem responses for students in various
types of schools. Again, senior response& indicate higher self-esteem
than do those of sophomores regardless of sector. Generally, the magni-
tude of the differences is approximately the same for Catholic and both
types of pudic schools. The senior-sophomore difference is greater
in the other private and high-performance private schoo1.s, as it is
for fate control. Although it is beyond the scope of the present study,
future researchers might want to focus attention on those characteristics
in which these two sectors especially exceed the other sectors: teacher
interest (table 5.3.3), involvement in extracurricular activities (table
5.2.2), and number of teachers relative to students (table 4.2.1).
These factors, as well as school size; may play a role in the greater
change between the sophomore and senior years in these schools.
Finally, we lock at student concern for social and economic
inequalities. Students were asked about the importance of a variety
of factors in their lives, and "working to correct social and economic
inequalities" was among the items. We report only the responses of
non-Hispanic whites for two reasons. First, because we are interested
in capturing a concern for the social welfare of others, we wished to
look at the responses of those who are less often the victims of inequality.
Second, because minority students are disproportionately represented
in the public sector, their inclusion would have distorted the between-
sector comparison. Table 5.5.3 shows that among the three major sectors
there are only slight differences in the proportion of non-Hispanic
white students who consider it "very important" to work toward correcting
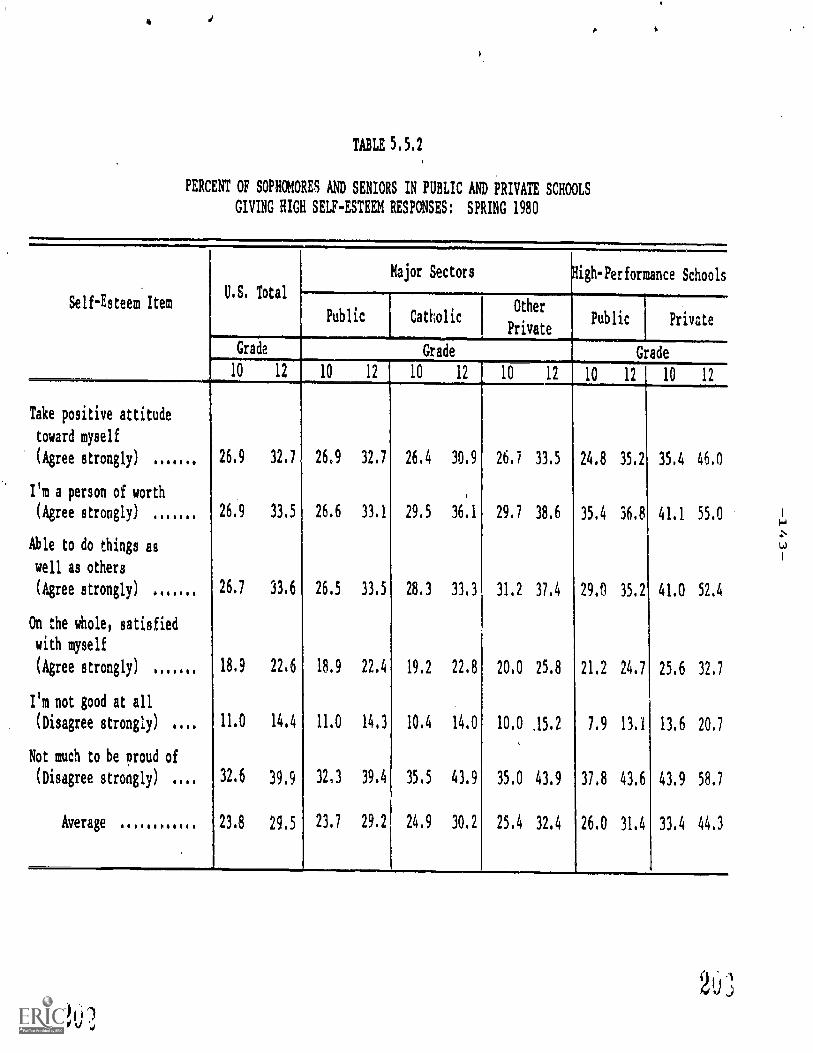
TABLE 5.5.2
PERCENT OF SOPHOMORES AND SENIORS IN PUBLIC AND PRIVATE SCHOOLS
GIVING HIGH SELF-ESTEEM RESPONSES: SPRING 1980
Self-Esteem ItemU.S. Total
Major Sectors igh- Performance Schools
Public CatholicOther
PrivatePublic Private
Grade Grade Grade
10 12 10 12 10 12 10 12 10 12 I 10 12
Take positive attitude
toward myself
(Agree strongly) 26,9 32.7 26.9 32,7 26,4 30.9 26.7 33.5 24.8 35,2 35,4 46,0
I'm a person of worth
(Agree strongly) 26,9 33,5 26.6 33.1 29.5 36,1 29,7 38,6 35,4 36,8 41,1 55,0
Able to do things as
well as others
(Agree strongly) 26,7 33.6 26.5 33.5 28,3 33.3 31,2 37,4 29,0 35,2 41,0 52.4
On the whole, satisfied
with myself
(Agree strongly) 18,9 22.6 18.9 22.4 19,2 22,8 20.0 25.8 21,2 24,7 25.6 32.7
I'm not good at all
(Disagree strongly) 11.0 14.4 11,0 14.3 10,4 14,0 10.0 ,15.2 7,9 13.1 13,6 20.7
Not much to be proud of
(Disagree strongly) 32,6 39,9 32,3 39.4 35,5 43.9 35,0 43.9 37.8 43.6 43,9 58,7
Average 23.8 29,5 23,7 29.2 24,9 30,2 25.4 32.4 26.0 31,4 33,4 44.3
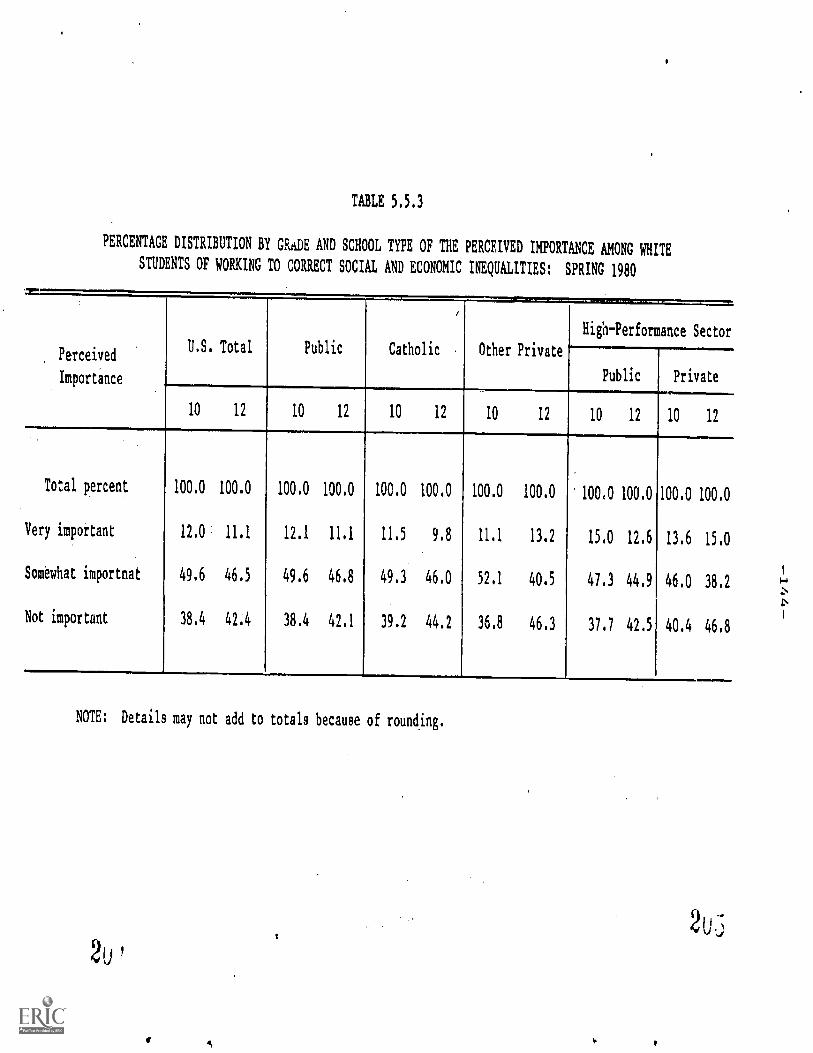
TABLE 5.5.3
PERCENTAGE DISTRIBUTION BY GRADE AND SCHOOL TYPE OF THE PERCEIVED IMPORTANCE AMONG WHITE
STUDENTS OF WORKING TO CORRECT SOCIAL AND ECONOMIC INEQUALITIES: SPRING 1980
..,
Perceived
Importance
U.S. Total Public Catholic Other Private
High-Performance Sector
Public Private
10 12 10 12 10 12 10 12 10 12 10 12
Total percent 100.0 100.0 100.0 100.0 100.0 100.0 100.0 100.0 100.0 100.0 100.0 100.0
Very important 12.0 11.1 12.1 11,1 11.5 9,8 11.1 13.2 15,0 12.6 13.6 15.0
Somewhat importnat 49.6 46.5 49.6 46.8 49.3 46.0 52.1 40.5 47.3 44,9 46,0 38.2
Not important 38.4 42.4 38.4 42.1 39.2 44.2 36.8 46.3 37.7 42.5 40.4 46,8
NOTE: Details may not add to totals because of rounding.
2u]2u ?
-145-
social and economic inequalities, and in all cases the proportion is
_elatively small (between 9 and 13 percent). Among sophomores, public
school students are slightly more concerned than students in the private
sector. In both the Catholic and public sectors the proportion of
seniors who consider working to correct inequalities "very important"
is slightly lower Ulan that of sophomores, while more other private
seniors than sophomores consider it "very important." All of these
differences, however, are quite small. Perhaps more important is the
fact that for all sectors more seniors than sophomores consider this
issue "not important." However, the increase in the private sector
appears to be greatest, especially in the other private sector. Overall,
the data suggest that among non-Hispanic white students there may be
less loss of concern for social and economic inequalities in the public
sector than in the private sector between the sophomore and senior years.
5.6 Conclusion
It should be said that the majority of hiz71 school students
appear to enjoy working hard in school and report that they are inter-
ested in school--regardless of the type of school they attend. Also,
student exposure to coursework does not differ greatly by type of school.
But schools in the different sectors appear to differ sharply in some
respects: the number of advanced courses students take, the number
of extracurricular activities in which students participate, the disci-
pline standards established for students, and the general behavior
patterns of students.
Catholic sch,ols are distinguished from others in the relatively
tight disciplinary standards established, their reported effectiveness,
2u
-146
and the high attendance patterns of their students. Furthermore, the
reports of students in Catholic schools concerning discipline tend to
accord better with principals' reports than do those of students in
other types of schools. In terms of extracurricular involvement, Catholic
school students appear to have experiences comparable to those of public
school students.
In all of the private sectors, students take more academic sub-
jects, and more advanced academic subjects, than students in the public
sector (except for the high-performance public schools). Other private
schools, as well as high-performance private schools, are distinguished
by the growth in participation in extracurricular activities between
the sophomore and senior years. The standards of discipline in other
private schools are similar to those in the Catholic schools, though
somewhat less strict, and the climate appears to involve closer teacher-
student relations than in either Catholic or public schools.
Public schools, in general, are distinguished by their disci-
pline problems, the lower average number of academic courses completed
by their students, and the lower number of hours spent on homework.
However, for public school students planning to complete four years
of college, exposure to advanced science courses is not much below that
of students in the private schools, though these students take substan-
tially fewer advanced mathematics courses than do students in private
s_hools.
Students in high-performance public schools are more likely
to complete advanced mathematics courses than students in other private
or Catholic schools, but are less likely to do so than students in high-
performance private schools. Students in high-performance public schools

-147-
also spend about the same amount of time on homework as do students
in Catholic and other private schools. But students in high-performance
public schools are distinguished by their consistently higher rate of
absenteeism and class cutting. In other areas of discipline they are
fairly comparable to other private and Catholic schools.
The types and amounts of courses completed, as well as the disci-
plinary climate, appear, then, to be important differences in the function-
ing of these schools. In the next chapter we discuss how these schools
differ in outcomes for their students.
-148-
CHAPTER 6
OUTCOMES OF EDUCATION
A central question in any consideration of policy concerning
public and private schools is the outcomes of these differing forms
of schooling for the children who pass through them. There is not,
however, a single question: there are two dominant ones, as well as
several subsidiary questions. The two dominant questions are "What
are the outcomes from public and private schools as they currently
function?" and "What would be the different outcomes of public and
private schooling for the same boy or girl going through the two differ-
ent kinds of schools?" The first is useful for purely descriptive
purposes, to see just what the products of public and private schools
in the U.S. are like, how they are alike and how they differ. It is
the second, however, that is more central for parents, and central to
policy arguments about the relative merits of public and private schools.
The first of the questions is simple and straightforward, and
can be answered directly, by comparing seniors in public and private
schools on various measures: test scores, post-high-school plans,
interest in school, adherence to discipline, effort expended on school-
work, attitudes toward oneself and others, and so on. Some of these
measures, which show differences in the way the ichools function, were
examined in chapter 5; others, which are purely outcomes of schooling,
are examined here.
The second question is more difficult) it requires an exper-
iment that can never be exactly carried out, but is approximated every
-149-
day. What would be the difference in outcome for a given boy or girl
in the different school settings? It is impossible to have the same
person in two different schools, but in everyday life we observe some-
thing like this--a brother goes to a public school, while his sister
goes to a private school; or two boys who have grown up as neighbors
and friends are sent, one to a private school and the other to a public
school.
In answering the second of these questions with data of the
sort contained in High School and Beyond, statistical controls are used
as substitutes for the ideal but unattainable experiment. The quality
of the answer to the question depends on the statistical controls that
are used. In attempting to answer the question, we will use a kind
of triangulation, obtaining evidence through different types of analyses
in order to get a more secure fix on the results.
Yet whatever the statistical controls, and despite the differing
kinds of analysis, some measure of uncertainly must remain. When the
sophomores are retested two years hence, the existence of measures at
two points in time will help remove some of the uncertainty; but even
then, uncertainty will remain. This, however, is the situation with
all questions of cause and effect; and, as in the use of evidence in
everyday life, our task will be to use the evidence at hand to cast
as much light on the causal questions as possible.
In addition to these two major questions, there are subsidiary
questions as well: What would be the outcome differences between public
and private schools if some input resource other than students were
the same? For example, how would public and private schools differ
in outcomes if they were, on average, the same size, or if the per-pupil
2i )
-150 -
expenditures in each were the same? Some of these hypothetical questions are
relevant to policy issues, because some policies would equalize these
schools on certain resource inputs. For example, a voucher plan, such
as that which has been proposed in CAifornia, would nearly equalize
per-pupil expenditures among public and private schools in the state.1
Like the questions about outcomes for students who are alike,
these questions about outcomes when various input resources or charac-
teristics are made alike can be answered only with uncertainty. But the
answers are valuable, not only for policy :,urposes, but also
because they give some insight into the sources of any different effects
that public and private schools have on the students who attend them.
Thus, they offer ideas about what policies may be valuable, both
in public schools and in private schools, to increase the school's effective-
ness for their students.
6.1 Descriptive Differences in OutcomesBetween Public and Private Schools
From one point of view, the products of a school are its grad-
uates, and we should thus look only at seniors to discover the differences
in these products. From another point of view, however, the school's
products are its students at every stage of their schooling, so that
it is reasonable to view the performance, behavior, and attitudes of
sophomores as the school's products as well. We take the second view,
looking at these attributes of sophomores as well as seniors.
1This plan has been developed by John Coons, Professor of Lawat the University of California, Berkeley. There was an initial attempt,later withdrawn, to pat the voucher proposal on the California ballotfor referendum.
-151-
Some of these descriptive differences in outcomes, that is,
certain behavior of students in schools and certain attitudes about
self and school, have been examined in the preceding chapter, and will
not be reexamined here. In this chapter we focus on two outcomes:
scores on standardized tests and plans beyond high school.
6.1.1 Cognitive achievement in each sector
Tests were given to sophomores and seniors in each of the schools
studied. The tests differed somewhat for sophomores and seniors; but
three of the tests had a number of items in common. The vocabulary
tests had eight words in common, the reading tests had eight questions
in common, and the mathematics tests had eighteen items in common.
The results Ore given separately for the sophomore tests (in table
6.1.1), for the senior tests (in table 6.1.2), and for the common sub-
tests taken by both seniors and sophomores (in table 6.1.3).
The sophomore test scores in table 6.1.1 show that the average
student in public schools scores below the average student in either
the Catholic or other private schools in every area tested. Students
from Catholic schools and from other private schools have similar aver-
ages, and the high-performance schools, both private and public, show
averages above those of students in the other sectors. The high-perfor-
mance private schools, more selective and more homogeneous, shcd averages
considerably above those for the high-performance public schools. These
differences in awmage test scores and in standard deviations illustrate
again the differences between the two sets of high-performance schools.
The high-performance public schools are generally large upper-middle-
class suburban schools with student bodies that perform well above those
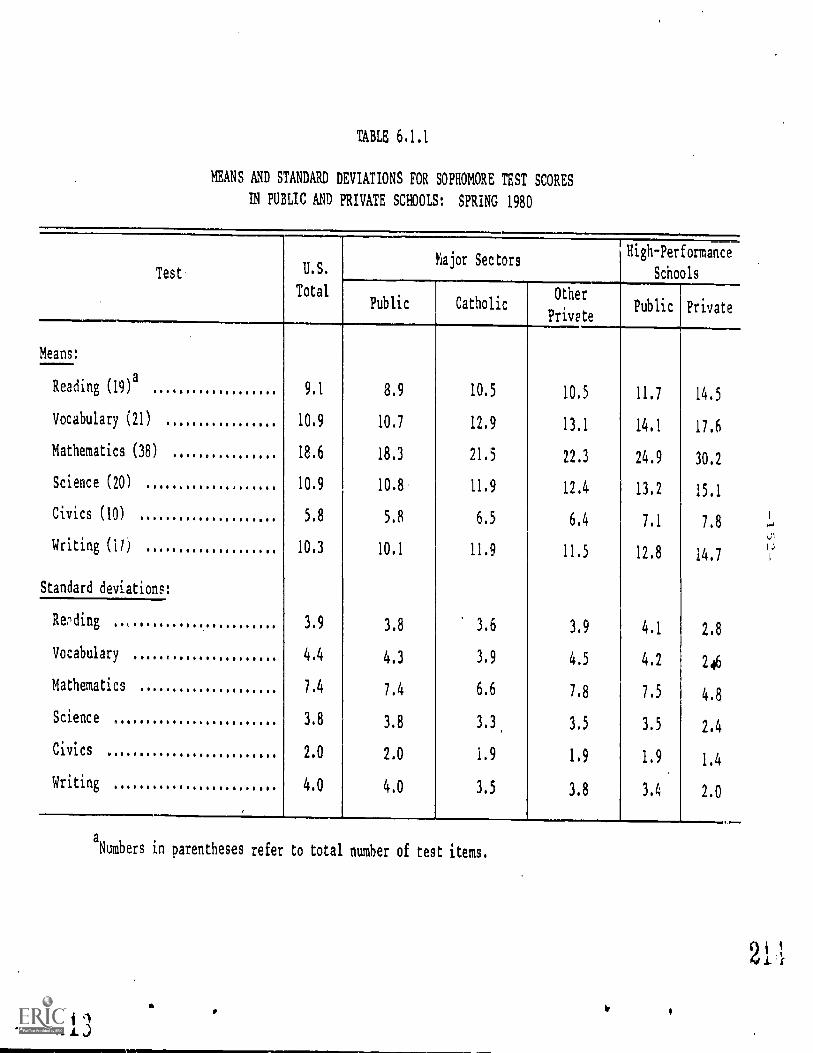
TABLE 6.1.1
MEANS AND STANDARD DEVIATIONS FOR SOPHOMORE TEST SCORES
IN PUBLIC AND PRIVATE SCHOOLS: SPRING 1980
Test U.S.Major Sectors
High-Performance
Schools
TotalPublic Catholic
i
Oher
Pr vatePublic Private
Means:
Reading (19)a 9.1 8.9 10.5 10.5 11.7 14.5
Vocabulary (21) 10.9 10.7 12.9 13.1 14.1 17.6
Mathematics (38) 18.6 18.3 21.5 22.3 24.9 30.2
Science (20) 10.9 10.8 11.9 12.4 13.2 15.1
Civics (10) 5.8 5.8 6.5 6.4 7.1 7.8
Writing (1 /) 10.3 10.1 11.9 11.5 12.8 14.7
Standard deviations:
Rvding 3.9 3.8 3.6 3.9 4.1 2.8
Vocabulary 4.4 4.3 3.9 4.5 4.2 246
Mathematics 7.4 7,4 6.6 7.8 7.5 4.8
Science 3.8 3.8 3.3 3.5 3.5 2.4
Civics 2.0 2.0 1.9 1.9 1.9 1.4
Writing 4.0 4.0 3.5 3.8 3.4 2.0
.
.._
a
Numbers in parentheses refer to total number of test items.
21 ,1
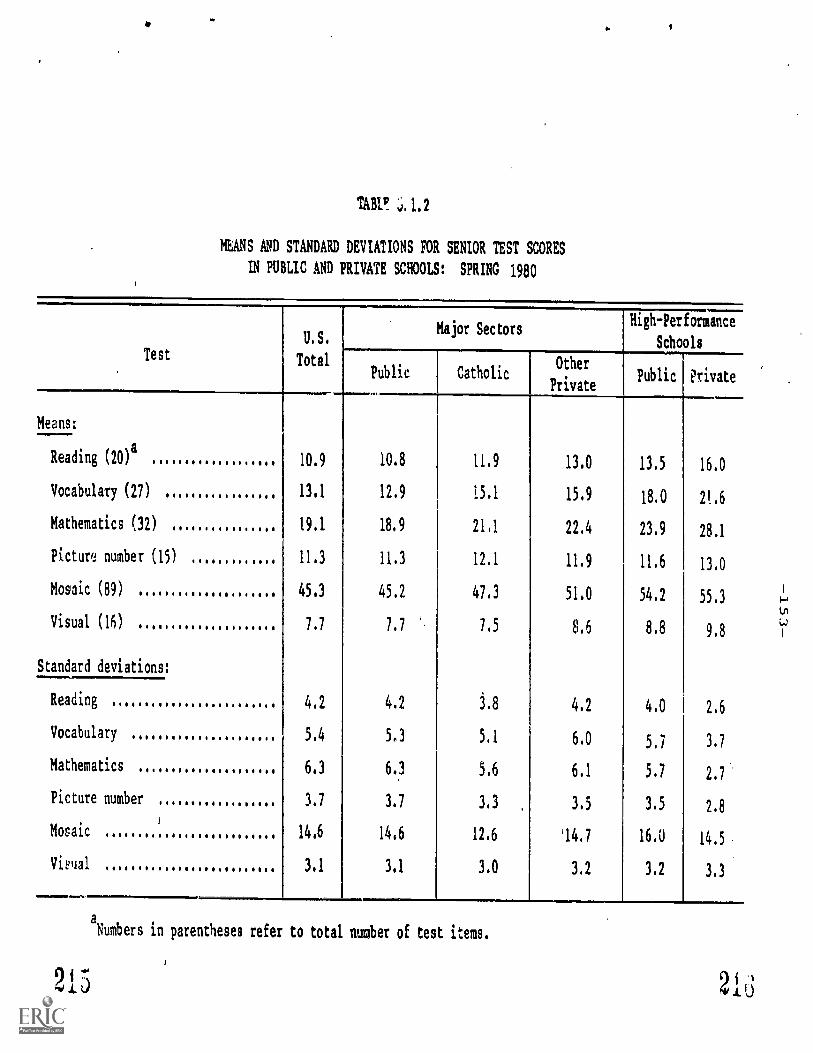
TABU
MEANS AND STANDARD DEVIATIONS FOR SENIOR TEST SCORES
IN PUBLIC AND PRIVATE SCHOOLS: SPRING 1980
Test
U.S.
Total
Major SectorsHigh-Performance
Schools
Public CatholicPrivat
Other
ePublic Private
Means:
Reading (20)a 10.9 10.8 11.9 13.0 13.5 16,0
Vocabulary (27) 13.1 12.9 15.1 15.9 18.0 21.6
Mathematics (32) 19.1 18.9 21.1 22.4 23.9 28,1
Picture number (15) 11.3 11,3 12.1 11.9 11.6 13.0
Mosaic (89) 45.3 45.2 47.3 51.0 54,2 55,3
Visual (16) 7.7 7,7 7.5 8.6 8.8 9.8
Standard deviations:
Reading 4.2 4,2 3.8 4,2 4.0 2,6
Vocabulary 5.4 5.3 5.1 6.0 5,7 3.7
Mathematics 6.3 6.3 5.6 6.1 5.7 2.7
Picture number 3.1 3.7 3,3 3,5 3.5 2.8
Mosaic 14.6 14.6 12.6 '14.7 16.0 14.5
Vieual 3.1 3.1 3.0 3.2 3,2 3,3
a
Numbers in parentheses refer to total number of test items.
215 21d
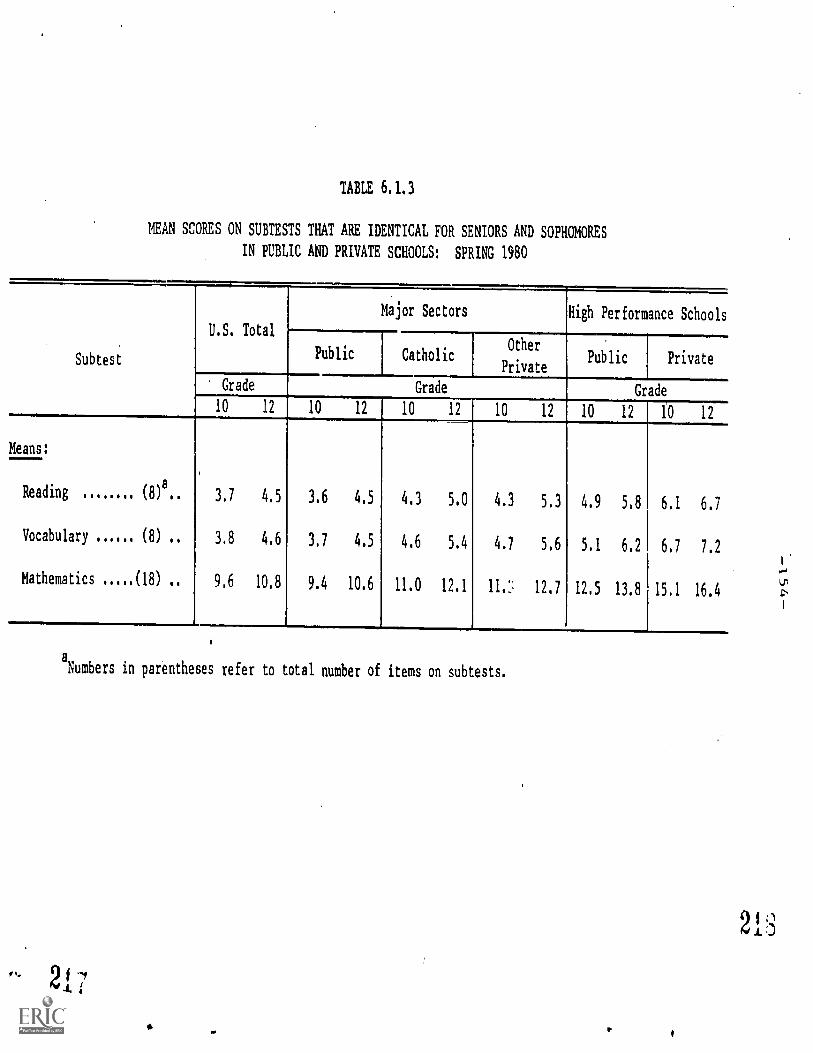
TABLE 6.1.3
MEAN SCORES ON SUBTESTS THAT ARE IDENTICAL FOR SENIORS AND SOPHOMORES
IN PUBLIC AND PRIVATE SCHOOLS: SPRING 1980
Subtest
U.S. Total
Major Sectors High Performance Schools
Public CatholicOther
PrivatePublic Private
Grade Grade Grade
10 12 10 12 10 12 10 12 10 12 10 12
Means:
(8)8..
(8) ..
(18) ..
3.7
3.8
9,6
4.5
4,6
10,8
3,6
3.7
9.4
4,5
4.5
10.6
4.3
4.6
11.0
5.0
5.4
12.1
4.3
4.7
11.:
5.3
5.6
12.7
4.9
5,1
12.5
5.8
6.2
13.8
6,1
6.7
15,1
6.7
7.2
16.4
Reading
Vocabulary
Mathematics
a
Numbers in parentheses refer to total number of items on subtests.
fy
2A.
-155 -
of the average public school, yet they contain much more diversity in
performance than the high-performance private schools, as comparison,
of the standard deviations shows.
There are some subject-matter variations between the sectors.
The Catholic schools are about half a standard deviation above the
public schools in vocabulary (using the U.S. total standard deviation),
a little less than half above in reading, mathematics, and writing
(English composition), and about a third above in civics and science.
The other private schools are slightly higher than the Catholic schools
in mathematics ana science, slightly lower in civics and writing.
It is also useful to look at the standard deiations of the
test scores in each of the school types. The standard deviations can
be thought of as test score variations consisting of two parts: the
variation among students within a school, and the variation among schools
within the same school sector. These standard deviations show that
the most variable performance is not found for all tests, as one might
expect, in the public schools. Rather, for reading, vocabulary, and
mathematics, the central core of basic cognitive skills, the most vari-
able performance is found in the sector labelled "other private" in
the table. This high variability expresses the extreme heterogeneity
amc,g these other private schools. They include the prestigious schools
that are often thought of as the private schools in America, schools
that roughly coincide with membership in the National Association of
Independent Schools. But they also include a wide range of church-
related schools, as shown in chapter 2, some of which operate on a shoe-
string; and they include as well schools that have sprung up in response
to school desegregation policies and other unpopular policies in the
21
-156
public schools. These schools vary, too, in the kinds of students served.
Some children are in private schools because their parents feel the
local public school offers too little challenge. But others are margi-
nal students, in private schools because they have done poorly in public
school. Some private schools cater to low achievers, others to high.
Altogether, the large variations in test scores in the "other private"
category of schools indicates the wide range of levels at N.hich these
schools operate and the wide range of functions they serve for different
types of students.
Test scores in the Catholic schools show less variation than
eithe,- those in the public schools or those in the other private schools,
as one might expect. Students in these schools come from backgrounds
that are more homogeneous in education and income level than those of
students in either the public schools or the other private schools.'
In addition, the schools themselves are more homogeneous, all operating
under the same church, and with some common practices.
The schools that show the least variation in test scores among
their students are the high-performance private schools. Because they
are within the prestigious segment of the private schools they, too,
draw students from rather homogeneous backgrounds. In addition, they
were selected for inclusion in this study on the basis of their simi-
larity in performance on a standardized test, the National Merit Schol-
arship Test. Thus, on both these grounds, they can be expected to show,
1Table 3.3.1 shows the lesser variation in income among parents
of children in Catholic schools than among parents of children in otherschools.
-157 -
as they do, considerably lower variation in test score performance by
their students.
In contrast, the high-performance public schools show about
the same diversity of performance as do the public schools as a whole,
though the average level of performance ranges from about two-thirds
a standard deviation to nearly a full standard deviation above that
in the public schools as a whole.
The senior test scores show a pattern similar to those for the
sophomore tests. Again, the public schools are lower than the Catholic
and other private schools, with only one exception among the twelve
comparisons between public schools and the two private school sectors
on the six tests. The other private schools are slightly higher than
the Catholic schools on five of the six tests. The high-performance
public schools are (except for the picture number test) higher than
the other private schools, and the high-performance private schools
are in turn considerably above the high-performance public schools.
It is tempting to compare the senior and sophomore test scores
for the three tests with comparable content (vocabulary, reading, mathe-
matics), to make some inference from the scores of the two cohorts about
"gains" or "growth" in achievement. However, there are difficulties
ir doing this. One principal difficulty is the fact that the tests
are not the same at the two grade levels. A second difficulty is that
the students in the two grades cannot be considered as representative
samples of the same population, largely because of dropouts between
the sophomore and senior yeirs.
The first of these difficulties can be overcome by examining
subtests consisting of the items that are identical in the two years.
2 -)N.+ .1
-158-
Scores these subtests are presented in table 6.1.3. The table shows
the same differences between school sectors seen in tables 5.1.1 and
5.1.2. The public school students' averages are lowest, Cathol. c school
students are somewhat higher, and the other private schools are highest
among the three major sectors. Students in the high-performance public
schools are somewhat higher still, and the students in high-performance
private schools are considerably higher than all.
When we look at differences between grades 10 and 12, with the
aim of inferring something about growth in achievement over the two
years, the first striking point is that the growth seems rather small
everywhere. Out of eight questions on reading comprehension, the aver-
age sophomore answers about four correctly, and the senior answers,
on the average, less than one additional question correctly. Similarly,
for the eight vocabulary items, the average sophomore answers about
half correctly, while the average senior has learned less than one more.
In mathematics, of the eighteen problems, the average sophomore answers
only a little more than half, and the average senior only a little over
one additional item.
The differences between sophomores and seniors, which could,
with some caveats, be regarded as growth, seem very much the same among
the different sectors, except for the high-performance private schools,
in which the growth is less, in vocabulary and reading. This result
for the high-performance private schools is almost certainly due to
a ceiling effect. The average number correct among sophomores was only
1.9 less than the number of questions in reading and 1.3 less in vocab-
ulary. This means that many sophomore students had all items correct:
16 percent of the sophomores in these schools had all items in the
2
-159-
reading test correct, and 35 percent had all items in the vocabulary
test correct. These students' scores could not be improved on by their
senior counterparts. The only gains could come in that fraction of
the student body with less-than-perfect scores, and, even then, the
opportunity for gain was small, since only one or two items were missed.
For other schools these data show no strikingly different degree of
growth from the sophomore to the senior year.
It might be argued that the lack of growth from the sophomore
to the senior year can be explained by the fact that these tests do
not cover subject matter that is an explicit part of the curriculum
in the later years of high school. The matheMatics items are all rather
elementary, involving basic arithmetic operations, fractions, and only
a few hints of algebra and geometry. Explicit attention to reading
comprehension and to vocabulary expansion is not part of standard curric-
ula in the tenth through twelfth grades. Thus we would not expect the
variation in intensity and scope of the academic courses taken during
these years--as examined in chapter 5--to have a direct impact on the
variations in the sophomore to senior test score gains. Two or three
of the tests given to sophomores (science, civics, writing composition
skills) should reflect such curriculum variations when they are repeated
for the sophomores two years hence. 1Yet the academic courses that are
taken in grades 10, 11, and 12 should provide the kind of practice and
experience that would lead to somewhat greater growth than the one item
1These tests were not given to seniors because there was a repli-
cation for seniors of the tests given to 1972 seniors, thus allowing1972 to 1980 comparisons.
-160
per test that is found. Among the students in the high-performance
private schools, who already at grade 10 are not far from the ceiling
of all items correct in the tests, the low amount of growth might be
expected, since there is not much room for gain, and among students
who have all items correct at grade 10 no gain can occur at all. But
in public and private schools generally only a small portion of sopho-
mores get all items correct, and there is great room for learning.
There, the small rates of growth are rather surprising.
There are difficulties in inferring differential growth in differ-
ent school sectors (or, as appears to be the case, lack of differential
growth) on "s-le basis of these comparisons. First, there may have been
differential growth, but differences which occurred before grade 10,
and were responsible for the observed differences at grade 10. That
is, the spring of grade 10 is not the entry point into high school for
these students, and thus differences between grades 10 and 12 capture
only part of the growth that occurs during the students' high school
careers.
Second, these are two different cohorts, and differential drop-
out in different sectors may result in the seniors being a differently-
selected group than the sophomores in the different sectors. (4e return
to the question of differential dropout later in this chapter.)
Third, quite apart from different dropout rates, the two cohorts
are samples from the population of sophomores and seniors in each type
of school, and normal sampling variation, particularly in the private
sectors, where the samples are not large, can lead to differences.
Fourth, it may be that average growth rates obscure differences
in growth among different segments of the student population. For
2
-161
example, it could be, because of the great diversity among the other
private schools, that there is high growth among some (e.g., the presti-
gious "independent" schools) and low growth among others. These differ-
ences would be masked by the overall 10-to-12 comparisons made in table
6.1.3.
An attempt is made, in section 6.2, to examine the question
of differential growth. At this point, all that can be said is that
there are differences at grade 10, which are certainly due in part to
differential selection of students into different types of schools,
and that similar differences are found at grade 12.
6.1.2 Post-high-school plans in each sector
Several questions were asked of sophomores and seniors about
their plans after high school. One of these (BB065) asked only about
schooling, with the question, As things stand now, how far in school
do you think you will get?" Students in the different sectors were
considerably differe7.t in their responses to this question. Table 6.1.4
shows the results.
For sophomores, the mode was less than four years of college
for public school students and college graduate for Catholic and other
private school students. For both the public and private high-perfor-
mance schools, it was an M.A. or Ph.D. Almost 30 percent of public
school sophomores expected not to go beyond high school, while 12.4
percent was the next highest percentage, among the students in other
private schools. Altogether, the distributions of sophomore schooling
expectations were very similar in the Catholic and other private schools.
Seniors in all sectors except Catholic schools show higher
educational expectations than sophomores. The differences are not large
-lEZ-
for public school students, but are rather large for students in other
private schools, and in the high-performance private schools. In both
these sectors, the seniors show about 10 percent more saying they expect
to get an M.A. or Ph.D.
The immediacy and concreteness of college plans are shown by
responses to another question (BB115), which asks when, if ever, the
student plans to attend college (either 2-year or 4-year). Responses
to this question are shown in table 6.1.5. As in the expectations about
ultimate level of schooling, there are differences the immediacy of
college plans, differences in which ale sectors are ordered in the same
way as before.
Public school sophomores show the greatest percentage deferring
college or undecided, nearly 40 percent taken altogether, while the
Catholic and other private schools both show percentages in the 20-to-
30 range in these uncertain categories, and, at the other extreme, only
about 5 percent of the sophomores from high-performance private schools
show this uncertainty.
In every sector, the seniors show a higher percentage planning
to go immediately to college, with the differences greatest by far in
the public schools. But there is also, in every sector, an increase
in the percentage who are definitely not going to college. The number
who say they plan to defer college decreases in all sectors, and the
number who say they don't know decreases even more sharply. Thus post-
high-school plans, whether for college or for something else, have
crystallized considerably by the senior year among students in all
school sectors. The percentage of seniors who still don't know, or
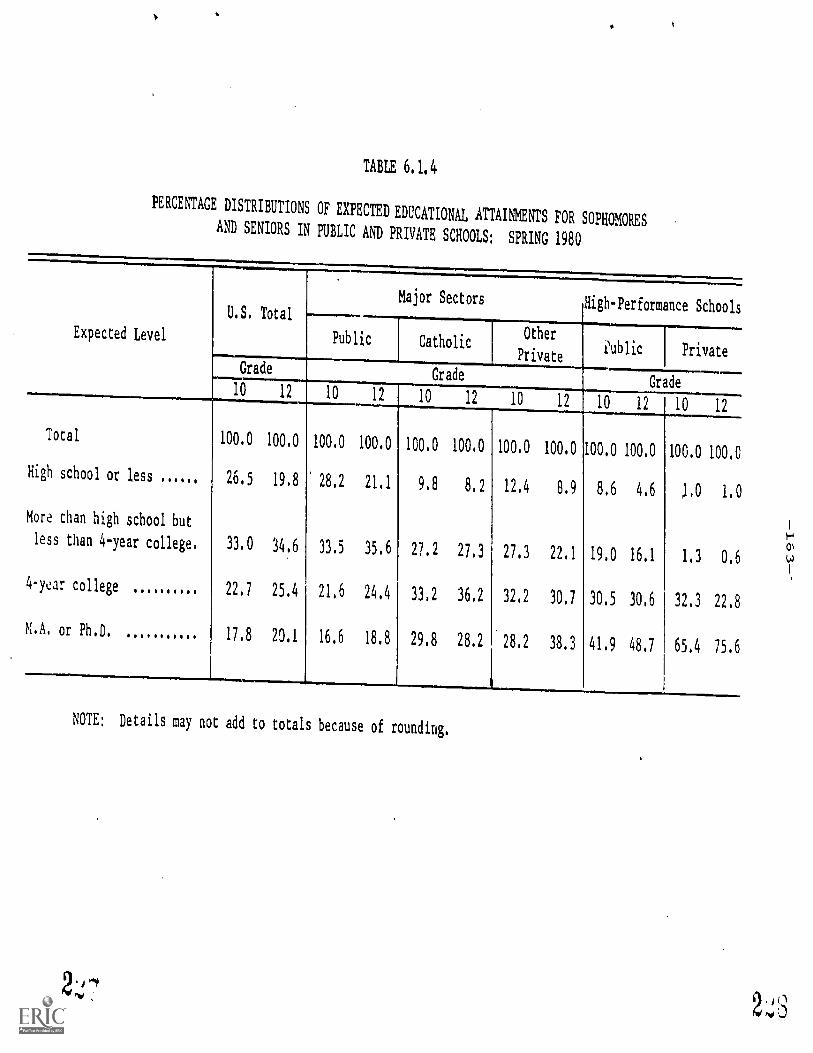
TABLE 6,1.4
PERCENTAGE DISTRIBUTIONS OF EXPECTED EDUCATIONAL ATTAINMENTS FOR SOPHOMORESAND SENIORS IN PUBLIC AND PRIVATE SCHOOLS: SPRING 1980
Expected Level
U.S. Total --------
Major SectorsHigh-Performance Schools
Public CatholicOther
PrivatePublic Private
GradeGrade
Grade10 12 10 12 10 12 10 12 10 12 10 12
Total 100.0 100.0 100.0 100.0 100,0 100,0 100.0 100.0 100.0 100.0 100.0 100.0
High school or less 26.5 19.8 28,2 21,1 9.8 8.2 12.4 8.9 8,6 4.6 1,0 1.(
More than high school but
less than 4-year college. 33.0 34.6 33,5 35.6 27.2 27.3 27.3 22,1 19.0 16.1 1.3 0,E
4 year college 22.1 25.4 21.6 24.4 33,2 36.2 32,2 30.7 30.5 30,6 32.3 22,
M.A. or Ph.D. 17.8 20.1 16.6 18,8 29.8 28.2 28.2 38.3 41.9 48.7 65,4 75,1
........................"......I.V.MIIMMI.M
NOTE: Details may not add to totals because of rounding.
2
0'
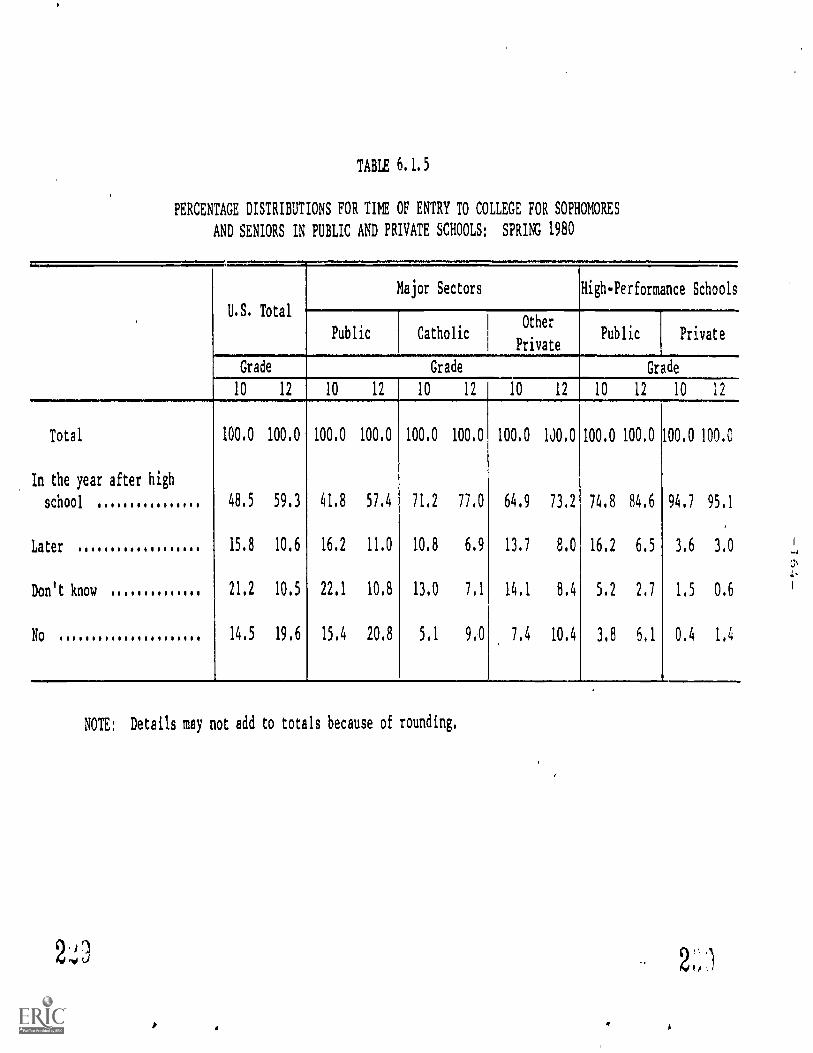
TABLE 6.1.5
PERCENTAGE DISTRIBUTIONS FOR TIME OF ENTRY TO COLLEGE FOR SOPHOMORES
AND SENIORS IN PUBLIC AND PRIVATE SCHOOLS: SPRING 1980
U.S. Total
Major Sectors High-Performance Schools
Public CatholicOther
PrivatePublic Private
Grade Grade
..__
Grade
10 12 10 12 10 12 10 12 10 12 10 12
Total 100.0 100.0 100.0 100.0 100.0 100.0 100.0 100.0 100.0 100,0 100.0 100.0
In the year after high
school 48.5 59.3 41.8 57.4 71,2 77,0 64.9 73,2 74.8 84.6 94.7 95.1
Later 15.8 10,6 16.2 11.0 10.8 6.9 13.7 8.0 16.2 6.5 3.6 3,0
Don't know 21,2 10,5 22.1 10,8 13.0 7.1 14,1 8.4 5.2 2.7 1.5 0.6
No 14.5 19.6 15.4 20.8 5.1 9.0 7.4 10.4 3.8 6,1 0.4 1,4
NOTE: Details may not add to totals because of rounding,
2(,) 2)
-165-
plan to defer college, remains greatest in the public schools, as it
was for the sophomores, but the crystallization appears to have been
greatest in the public schools.
Piens for higher education constitute one type of post-high
school-plan; another is plans for a job. We can ask, for those seniors
who are planning to work in the year after high school, just how concrete
their plans are: Do they have a job before they finish school? Table
6.1.6 shows responses to this question (EB073) among seniors from the
different types of schools.
Here it is the public school seniors whose plans are most fully
implemented. Of those who plan to work full time after high school,
a higher percentage in the public schools already have a job lined up.
The sectors are ordered in approximately the reverse of their order
with respect to concreteness of college plans. Just as college plans
are less concrete and less fully implemented among public school seniors
who expect to attend college than among their counterparts in private
schools, job plans are less concrete and less fully implemented among
those private school seniors who do plan to go to work after they finish
high school. This suggests that, the private schools--perhaps because
most do not have vocational programs, perhaps because of less tangible
factors--do less in aiding the job placement of their graduates who
are not going on to college than do the public schools.
6.2 Effects of Private Schools on Outcomes of Schooling
It is evident from the preceding section that students in different
sectors differ in their achievement on standardized tests and in their
post-high-school plans. What is not clear is whether goini, to a public
school, a Catholic school, or another type of private school makes a
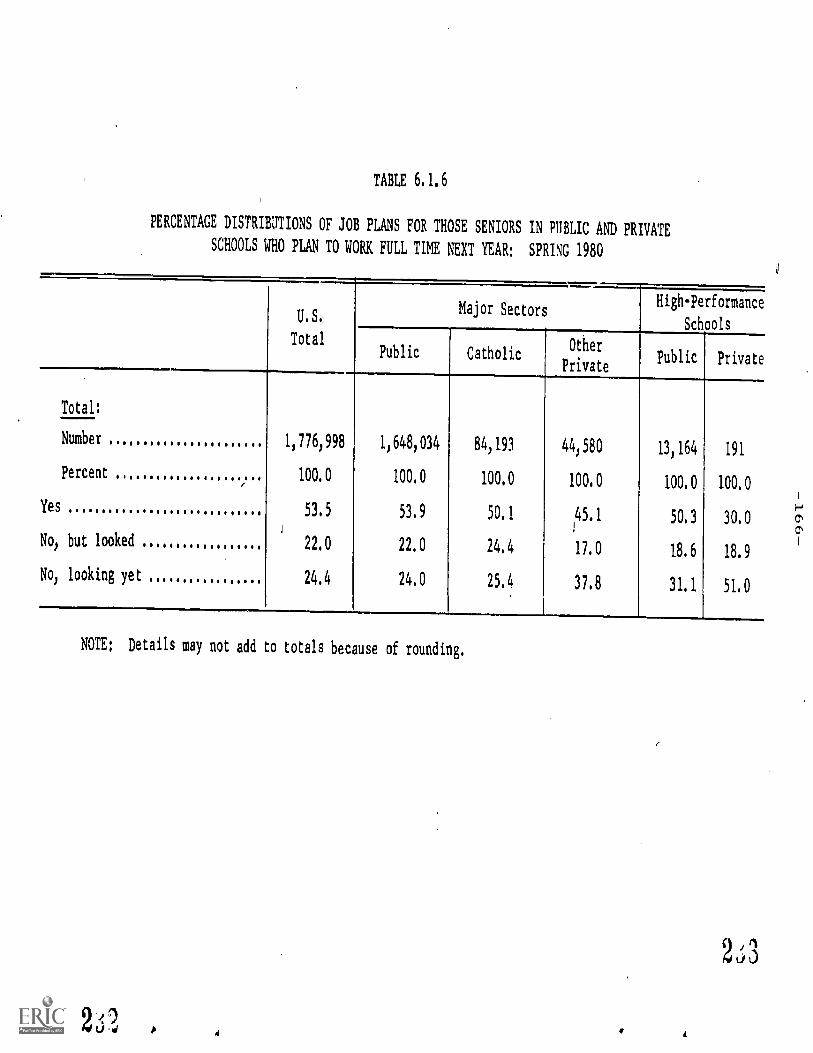
TABLE 6.1,6
PERCENTAGE DISTRIBUTIONS OF JOB PLANS FOR THOSE SENIORS IN PUBLIC AND PRIVATE
SCHOOLS WHO PLAN TO WORK FULL TIME NEXT YEAR: SPRING 1980
Total:
Number 11176,998
Percent 100.0
Yes 53.5
No, but looked 22,0
No, looking yet 24.4
U.S.
Total
Major SectorsHigh-Performance
Schools
Public CatholicOther
PrivatePublic Private
116481034 84,193 44,580 13,164 191
100.0 100.0 100.0 100.0 100.0
53.9 50.1 45,1 50.3 30,0
22.0 24.4 17.0 18.6 18.9
24.0 25.4 37,8 31,1 51.0
NOTE: Details may not add to totals because of rounding.
2 a9U 0
-167-
difference in either of these outcomes. For not only did seniors in
these different sectors differ in test performance and in plans for
further education; sophomores did as well. Thus the differences may
well be due merely to the differential selection of different students
into the different sectors. In this section we will try to answer that
fundamental question: Are the differences entirely due to selection,
or are there also different effects on basic cognitive skills and on
plans for further education? That is, what would be the differences
in outcome if the students coming into the different sectors were alike'
This is a central question both for policies that affect the fortunes
of public and private schools and for parental decisions about where
to send children to school.
There are two classical methods of answering this question with
data from ongoing (i.e., nonexperimental) schools. Both have some
defects. One method is to use multivariate analysis to apply statistical
controls in the form of background characteristics. It is hoped that
by comparing outcomes for students with the same parents' education,
the same income, the same parental interest in the child's education,
and so on, the students in different schools will be "equated" in terms
of their backgrounds, and any differences found in outcomes can then
be attributed to something about the school. The other method is to
measure the outcome variable early in the student's school career and
again later. Differential change in the outcome variable is then attributed
to something about the school. This method in effect uses the students'
own prior responses as a control for the later ones, using the prior
responses to control for differential selection into different schools.
-168
The principal defect of the first of these methods is that it
is seldom possible to control on all relevant background characteristics.
Thus the possibility always remains that the differences attributed
to differences in schools are instead due to some unmeasured aspect
of the student's background. This defect is particularly telling here,
for one known difference between parents of children in public schools
and parents of children in private schools it. that the latter have
chosen their child's school and are paying sizable amounts of tuition
money to implement this choice. It seems probable that this behavior
is an indicator of additional differences in the parents' behavior
toward the child's education, differences that could well affect the
very outcomes that are of interest. Yet this difference between parents,
by its very nature, is not something on which students in public and
private schools can be equated.' Thus this approach is a particularly
defective one in comparing public and private schools.
11t is possible that some analysis could be carried out comparingaggregate outcomes in geographic areas where private schools are widelyavailable with outcomes in those areas where private schools are largelyunavailable. If there is an effect of private schools, tilen the overallachievement in the former areas, after statistically controlling onfamily background characteristics, should be different from that inthe latter areas. If s is the average outcome score for public schools,standardized for family background, and s + c is the average standardizedscore for students in private schools (where c, either positive or negative,is the private school effect), then c can be estimated as follows:If pi is the proportion of students in private school in area 1, andp2
is the proportion in area w, the overall student average in area1 should be (1-p
1) s + p
1(s + c), or s + plc. In area 2, the average
should be (1-p2) s + p
2(s+c), or s + p
2c. the difference between these
averages is (p1 - pl) c. Thus if there are areas in which pi and plare considerably different, it is possible to estimate c, the privateschool effect, bythis method. The method assumes, of course, thats, the backgroun:-standardized outcome score, is the same in both areas,an assumption that may not be true. Because of the necessity of thisassumption, and because p. is rather small in all areas i (see table2.1.2), we have not used this method here.
-169-
The second approach, use of the same student's earlier response
on the same outcome variable, is free from some of the defects of the
first approach, but it has some defects of its own. For example, it
may be that the rate of change in an outcome variable such as achieve-
ment is different among students at different levels of performance,
even if the; are subject to the Fame school environment. If this is
the case, then differential changes in schools that had students who
were initially different can mistakenly be inferred to be due to effects
of the school.
But the virtues and defects of this second method of discovering
effects of different types of school are irrelevant to the present inquiry
because the data do not include prior measures of these outcome variables
on the same students. For the sophomores, such analysis will he possible
two years hence, when they are seniors, but not at present.
The fact that measures of the outcome variable are available
for sophomores and seniors in the same schools does, however, give some
additional ways of obtaining evidence about possible differential effects
of the different types of schools. In the remaining parts of this
chapter, we attempt to use several methods to determine whether there
are differential effects. The greatest attention is paid to cognitive
achievement as an outcome of schooling. This is followed by a shorter
examination of plans for higher education as a second type of outcome.
Throughout this section we examine only the three major sectors, leaving
aside the two high-performance sectors. 1
1The two high-performance sectors present several problems cf
different importance in different parts of this chapter. One is thesmall number of schools and students in these sectors: 12 schools,311 seniors, and 370 sophomores in the high-performance public schoolsand 11 schools, 326 seniors, and 353 sophomores in the high-performanceprivate schools. A second is the fact that, especially in the privateschools, the average number of items correct among sophomores is closeto the upper limit.
2 -
-170-
6.2.1 Effects on .,gnitive achievement
It is possiblt. to regress the outcome v ,riable, in this case
score on an achievement test, on type of school, while controlling on
family background characteristics--the first method described above
for finding differential effects. The apparent effect of the school
sector will be an estimate of the effect, but will be contaminated by
whatever differences in selection are not controlled for by the back-
ground variables. Table 6.2.1 shows, for sophomore scores on the reading
test, the vocabulary test, and the mathematics test, the estimated
addition to sophomore scores that is due to being in a Catholic or other
private school rather than a public school--for students with the same
measured background characteristics. 1
In order to minimize the effects of differences in initial
selection masquerading as effects of differences in the sectors themselves,
a large number of background differences were used, measuring both
objective and subjective differences in the home. Some of these sub-
jective differencei may not be prior to the student's achievement, but
may in part be consequences of it, so that there may be an overcompensation
for background differences. It was felt desirable to do this so as
1The background characteristics used as controls are described
in the text below. The regression analyses on which these two tablesare based are separate regressions for each school sector at each gradelevel. This was done, rather than use of a single regression equationwith dummy variables for sectors, to allow for different effects ofbackground characteristics in different sectors. The estimated incrementat the sophomore level due to each of the two private sectors is obtainedby first calculating the predicted test score in each sector for a studentwith backgroind characteristics standardized to that of the averagepublic school sophomore, and then finding the difference between theprivate sector and the public sector. Regression equations used inthis table and in table 6.2.2 are given in appendix tables A.4.1 andA.4.2.
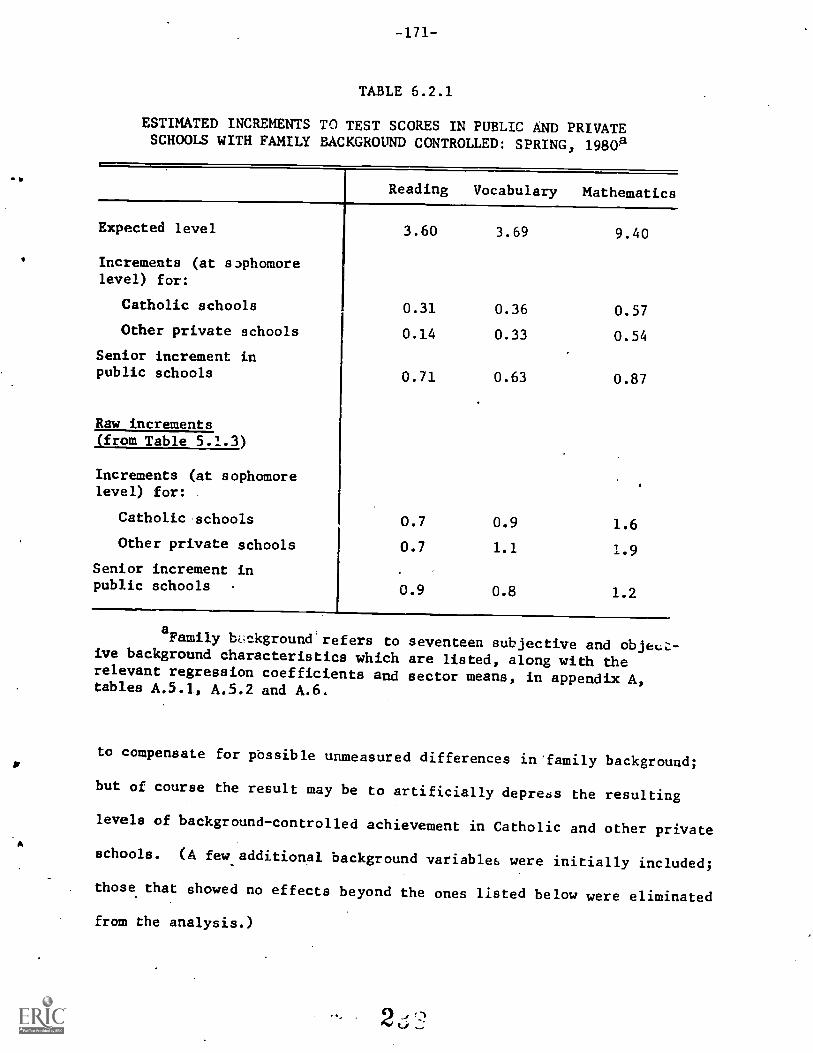
-171-
TABLE 6.2.1
ESTIMATED INCREMENTS TO TEST SCORES IN PUBLIC AND PRIVATESCHOOLS WITH FAMILY BACKGROUND CONTROLLED: SPRING, 1980a
Reading Vocabulary Mathematics
Expected level 3.60 3.69 9.40
Increments (at sophomorelevel) for:
Catholic schools 0.31 0.36 0.57
Other private schools 0.14 0.33 0.54
Senior increment inpublic schools 0.71 0.63 0.87
Raw increments(from Table 5.1.3)
Increments (at sophomorelevel) for:
Catholic schools 0.7 0.9 1.6
Other private schools 0.7 1.1 1.9
Senior increment inpublic schools 0.9 0.8 1.2
aFamily buckground'refers to seventeen subjective and objei.:Z-
ive background characteristics which are listed, along with therelevant regression coefficients and sector means, in appendix A,tables A.5.1, A.5.2 and A.6.
to compensate for possible unmeasured differences in 'family background;
but of course the result may be to artificially deprebs the resulting
levels of background-controlled achievement in Catholic and other private
schools. (A few additional background variables were initially included;
those that showed no effects beyond the ones listed below were eliminated
from the analysis.)
2-,.;
The background characteristics used in the analysis include
the following, classified as clearly prior to (that is, unaffected by)
the student's achievement level, and not clearly prior to the student's
achievement level.
Clearly priorFamily incomeMother's ducatior.Father's educationRaceHispanic-non-HispanicNumber of siblingsNumber of rooms in the homeBoth parents presentMother's working before child was in elementary schoolMother's working when child was in elementary school
Not clearly prior (in rough order of likelihood of being prior)Encyclopedia in homeMore than fifty books in homeTypewriter in homeOwns pocket calculatorFrequency of talking with mother or father about personalexperiencesMother thinks student should go to college after high schoc_
Father thinks student should go to college after high school
These variables were used to account for student achievement
in twelve regression equations: public sophomores, public seniors,
private sophomores, and private seniors for each of the three areas
of achievement.1
Then7in order to control or standardize on student
background, the expected achievement for a student with the average
background characteristics of the public school sophomore students was
calculated for each grade level within each of the three sectors (public
school seniors, for Catholic and other private sophomores, and for Catholic
1The total variance explained by these background factors in
each of these equations is listed in appendix A, table A.S. In theprivate school regressions, dummy variables were used for other privateand high-performance private schools. The latter, however, are notincluded in the results discussed in this section.
2
-173-
and other private seniors). These expected achievement levels can then
be compared to find the difference between sectors and between grades,
having standarized for family background. The results of all of this
are given in table 6.2.1.
The increments for each type of private schools are positive,
showing that students of the same background characteristics have generally
higher achievement in both of these types of private schools than in
the public schools. However, the differences are reduced compared to
the raw differences from table 6.1.3 (shown in the lower half of table
6.2.1), because of the statistical control of family background. They
are slightly higher for Catholic schools than for other private schools.
Thus, in general, with these background characteristics controlled,
Catho.i^ school sophomores perform at the highest level, sophomores
in other private schools next, and sophomores in the public schools
lowest.
The fourth line of the table shows that, controlling for family
background, the estimated sophomore-to-senior growth rates are below
those shown in table 6.1.3, less than one item for reading, vocabulary,
and mathematics. The fact that the estimates are all slightly lower
than what would be estimated from table 6.1.3 (shown in the lower half
of the table) indicates that family backgrounds of seniors are slightly
higher than those of sophomores, a difference that is attributable to
greater dropout rates between grades 10 ands 12 for students from lower
backgrounds. Thus the estimated growth from sophomore to senior, which
appears low in table 6.1.3, is even less than what appears there.
-174-
A second way to attempt to examine differential growth in public
and private schools is suggested by table 6.1.3, comparing sophomores
and seniors in each sector on identical subtests. That table compares
raw scores, uncontrolled for family background differences; it is possible
to do something like this, but controlling on family background differences.
In effect, this is an extension of table 6.2.1, with increments calculated
at the senior level for each of the private sectors, and then comparing
the senior-level increments to the sophomore-level increments shown
in table 6.2.1. Senior-level increments that are larger than sophomore-
level increments indicate greater sophomore-to-senior growth in the
private sector, smaller increments indicate greater growth in the public
sector.
The excess of sophomore-to-senior increments in both private
sectors beyond the increment (shown in table 6.2.1) in the public sector
is shown in table 6.2.2. The table shows, overall, little or no evidence
of extra growth in the Catholic schools beyond that in the public schools,
but consistent extra growth in the other private schools. The amount
of extra growth in the other private schools averages about a quarter
of the sophomore-senior growth in the public schools (0.27 + 0.18 +
0.15 from table 6.2.2 divided by 0.71 + 0.63 + 0.87 from table 6.2.1).
Thus for a student body standardized to the public-school-sophomore
average in family background, the expected achievement of sophomores
is highest in Catholic schools, next in other private schools. As for
sophomore-to-senior growth, there is evidence of about 25 percent more
growth in the other private schools than in either the Catholic or public
schools.
2 it
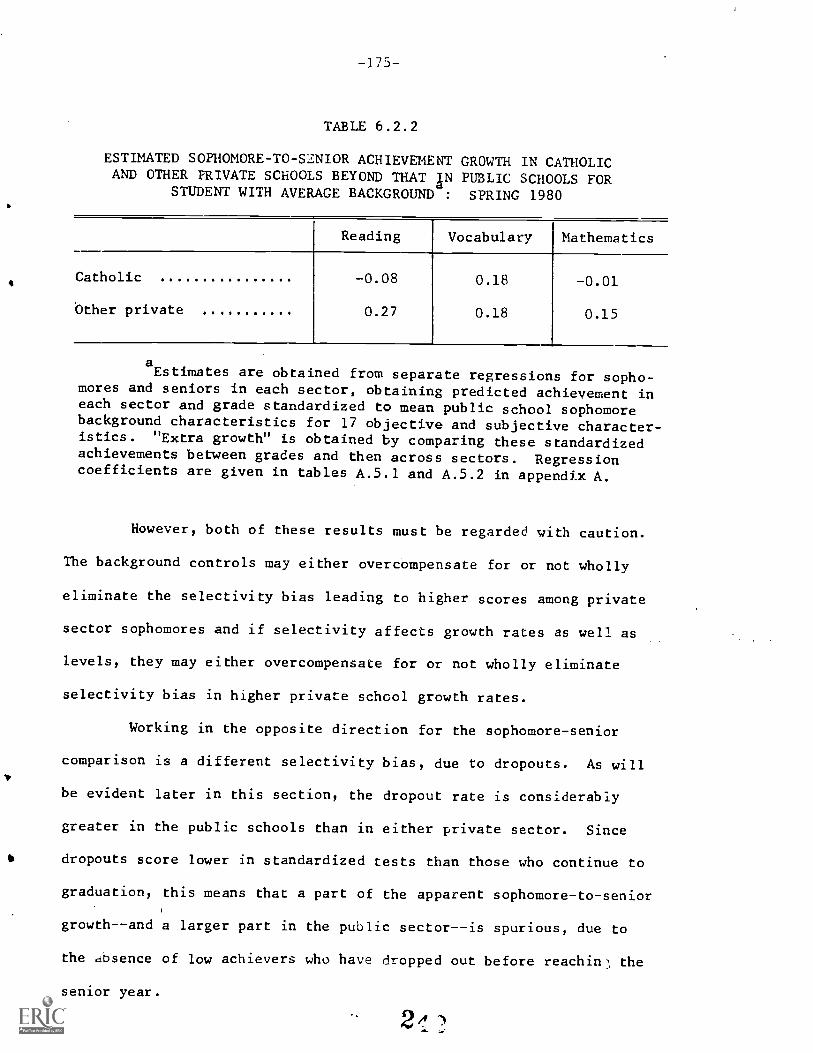
-175-
TABLE 6.2.2
ESTIMATED SOPHOMORE- TO- S2NIOR ACHIEVEMENT GROWTH IN CATHOLICAND OTHER PRIVATE SCHOOLS BEYOND THAT IN PUBLIC SCHOOLS FOR
STUDENT WITH AVERAGE BACKGROUND : SPRING 1980
Reading Vocabulary Mathematics
Catholic
Other private
-0.08
0.27
0.18
0.18
-0.01
0.15
aEstimates are obtained from separate regressions for sopho-
mores and seniors in each sector, obtaining predicted achievement ineach sector and grade standardized to mean public school sophomorebackground characteristics for 17 objective and subjective character-istics. "Extra growth" is obtained by comparing these standardizedachievements between grades and then across sectors. Regressioncoefficients are given in tables A.5.1 and A.5.2 in appendix A.
However, both of these results must be regarded with caution.
The background controls may either overcompensate for or not wholly
eliminate the selectivity bias leading to higher scores among private
sector sophomores and if selectivity affects growth rates as well as
levels, they may either overcompensate for or not wholly eliminate
selectivity bias in higher private school growth rates.
Working in the opposite direction for the sophomore-senior
comparison is a different selectivity bias, due to dropouts. As will
be evident later in this section, the dropout rate is considerably
greater in the public schools than in either private sector. Since
dropouts score lower in standardized tests than those who continue to
graduation, this means that a part of the apparent sophomore-to-senior
growth--and a larger part in the public sector--is spurious, due to
the absence of low achievers who have dropped out before reaching, the
senior year.
2,
-176-
Later, we attempt to find a practical way around both of these
difficulties. At present, however, it is possible to examine another
question related to differential achievement in different sectors, but
examining performance of students from different backgrounds.
6.2.1.1 Different effects for students from different backgrounds:
We can examine the difference in expected achievement levels
of sophomores in each sector that are considerably above the national
average in parental education and those that are considerably below
the national average in parental education, keeping the same mix of
certain three background factors as found in the national average; we
can do a similar examination for seniors. The results ol such a comparison
will show how well each of these school sectors functions for students
from different family backgrounds.
In calculating the difference in expected levels of achievement
of students in each sector for parents with extreme educational levels,
we will assume first students whose parents are both high school graduates
only, and then students whose parents are both college graduates. Similarly,
for the public and Catholic sectors we can examine the difference in
expected achievement levels of blacks and whites at both grade levels,
controlling on parental income, education, and (Hispanic) ethnicity.
And we can examine, in these two sectors, the difference in expected
achievement levels of non-Hispanics and Hispanics, with the same back-
ground controls.' Thus, we are asking what is the difference in achieve-
ment that occurs for students with contrasting background characteristics
1These comparisons are carried out using the same type of analysis
as in tables 6.2.1 and 6.2.2, but with fewer background variables, asdescribed in the text. Regression coefficients are given in appendixA. For the black-white and Hispanic-non-Hispanic comparisons, the regression
-177-
within each of the school sectors. In carrying out this analysis, we
chose to examine separately Catholic and other private schools, because
of evidence that students from differing family backgrounds fare dif-
ferently in these two sectors. Consequently, it was necessary to reduce
the number of background characteristics that were controlled, in order
to obtain stable estimates. We believe that this does not affect the
inferences drawn in this section. The background characteristics used
(beside mother's education and father's education) are family income,
race, and Hispanic/non-Hispanic ethnicity.
Table 6.2.3 shows the results of calculating these expected
achievement differences. The first and most.striking result is the
greater homogeneity of achievement of students with different parental
education levels in Catholic schools than in public schools. Second
is the greater difference in achievement among students with different
parental education levels in the other private schools than in the
public schools. That is, the performance of children from parents with
differing educational levels is more similar :;r1 Catholic schools than
in public schools (as well as being, in gener7.11, higher), while the
performance of children of parents with differing educational backgrounds
is less similar in other private schools than in public schools (as
well as being, in general, higher).
Thus we have the paradoxical result that the Catholic schools
come closer to the American ideal of the "common school," educating
all alike, than do the public schools. Furthermore, as the lower panels
coefficients themselves are used, since black and Hispanic were dummyvariables in the equation. For parental education, the difference iscalculated as the sum of regression coefficients for parental education,multiplied by 5 (=7-2). The black-white and Hispanic-non-Hispanicdifferences are not shown for other private schools, because the numbersof blacks and Hispanics in the sample of these schools is small enoughto makes estimates unstable.
2A
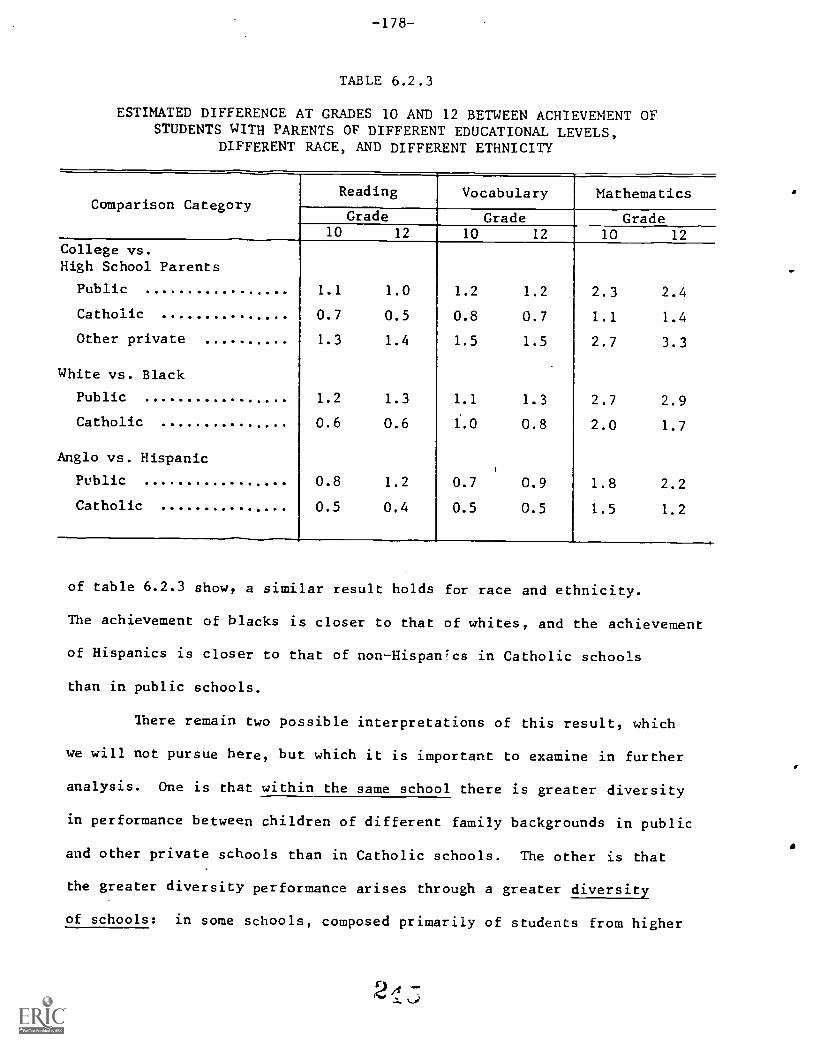
TABLE 6.2.3
ESTIMATED DIFFERENCE AT GRADES 10 AND 12 BETWEEN ACHIEVEMENT OFSTUDENTS WITH PARENTS OF DIFFERENT EDUCATIONAL LEVELS,
DIFFERENT RACE, AND DIFFERENT ETHNICITY
Comparison CategoryReading Vocabulary Mathematics
Grade Grade Grade10 12 10 12 10 12
College vs.High School Parents
Public 1.1 1.0 1.2 1.2 2.3 2.4
Catholic 0.7 0.5 0.8 0.7 1.1 1.4
Other private 1.3 1.4 1.5 1.5 2.7 3.3
White vs. Black
Public 1.2 1.3 1.1 1.3 2.7 2.9
Catholic 0.6 0.6 1.0 0.8 2.0 1.7
Anglo vs. Hispanic
Public 0.8 1.2 0.7 0.9 1.8 2.2
Catholic 0.5 0.4 0.5 0.5 1.5 1.2
of table 6.2.3 show, a similar result holds for race and ethnicity.
The achievement of blacks is closer to that of whites, and the achievement
of Hispanics is closer to that of non- Hispanics in Catholic schools
than in public schools.
There remain two possible interpretations of this result, which
we will not pursue here, but which it is important to examine in further
analysis. One is that within the same school there is greater diversity
in performance between children of different family backgrounds in public
and other private schools than in Catholic schools. The other is that
the greater diversity performance arises through a greater diversity
of schools: in some schools, composed primarily of students from higher
2
-179-
socioeconomic. backgrounds, performance is high, higher than would be
predicted on the basis of comparable students' performance in more heter-
ogeneous schools; in other schools, composed primarily of students from
lower socioeconomic backgrounds performance is lower than would be
predicted on the basis of comparable students' performance in heter-
ogeneous schools.
There may be some difference between public and other private
schools in this, for public high schools are large on the average (758),
while other private schools are quite small (215). That_ is, it may
be that in the other private schools a considerably greater fraction
of the diversity in achievement is between schools than is true in the
public schools. It is possible with the data from the present study
to examine these alternative hypotheses; however, that work must remain
for further analyses of this dat.a.
There is another important aspect of table 6.2.3. This is the
comparison of achievement differences among students from different
backgrounds at the sophomore and senior levels in different sectors.
In general, these differences are smaller at the senior level in the
Catholic schools, while they are greater at the senior level in the
public and other private schools. Among nine comparisons at the senior
level, six are smaller, two are equal, and one is greater in the Catholic
schools; one is smaller, one is equal, and seven are greater in the
public schools; and one is equal and two are greater in the other private
schools.
Thus, not only is the achievement more alike among stu =Its from
different backgrounds in the Catholic schools than in the other sectors,
2/!
-180-
it becomes increasingly alike from the sophomore to the senior year. In
the public and other private schools, the achievement of students from
different backgrounds diverges.
6.2.1.2 Taking dropouts into account
To this point we have not explicitly considered the effect of
dropouts on the inferences about growth from sophomore to senior year
in each of the sectors. The problem, of course, is that dropouts, or
any other form of loss or gain from the sophomore to senior year, means that
the sophomores and seniors in the sample represent somewhat different
populations. If there is sophomore-to-senior dropout, and dropouts are
lower-achieving, then the seniors represent a higher-achieving segment
of the total cohort of all youth at their age level than the sophomores
do of their cohort at their age level. This leads to an overestimate
of growth rates (e.g., from table 6.1.3, or table 6.2.1) and an underestimate
of the ircrease in divergence of scores of students from different
backgrounds (table 6.2.3). And the greater the dropout rate, the greater
these over- and underestimates.
. This makes it especially important to estimate the dropout rates
in the three sectors. Our estimate is obtained as follows. In each
school, we know the total size of the senior roster and the total size of
tge sophomore roster. The difference between them is due to several
factors, including the sizes of the total cohort in these two years,
as well as the dropout rate between sophomore and senior years. All
factors except the last are relatively minor, we may regard this difference
as an estimate of the number of dropouts who are no longer present in
the senior class.
Table 6.2.4 shows the total number of sophomores and seniors
in the sampled schools in each sector, as well as the fraction this
represents of the sophomore class and the fraction it represents of
the senior class. The table shows that, according to this estimate,
about 24 percent of the sophomore class in public schools is gone by
the senior year, or a 24 percent dropout rate. The comparable rates
in Catholic and other private schools are 12 percent and 13 percent
respectively.
The 24 percent dropout rate in public schools represents 31
percent of the senior class. This means that only about 69 percent
of the students who should be compared with sophomores to get a measure
of achieves -rowth have been included in the public school data--and
that the missing 31 percent came primarily from the lower part of the
distribution. Similar statements, though for smaller fractions of the
class (13 to 15 percent), could be made about Catholic and other private
schools.
Some part of the bias this introduces into measures of growth
has been taken care of by controlling on family background, as was done
for tables 6.2.1, 6.2.2, and 6.2.3. But because dropping out of school
is an act of negative selection, the students who drop out are very likely
lower achieving than those from similar backgrounds who remain in school.
If we knew how the test scores of the dropouts would have been
distributed, it would be possible to calculate the "true" growth rate
in each sector. That, of course, is not possible. But whatever that
distribution is (and assuming it is the same in each sector relative
to the sector distribution), the downward adjustment to obtain the true
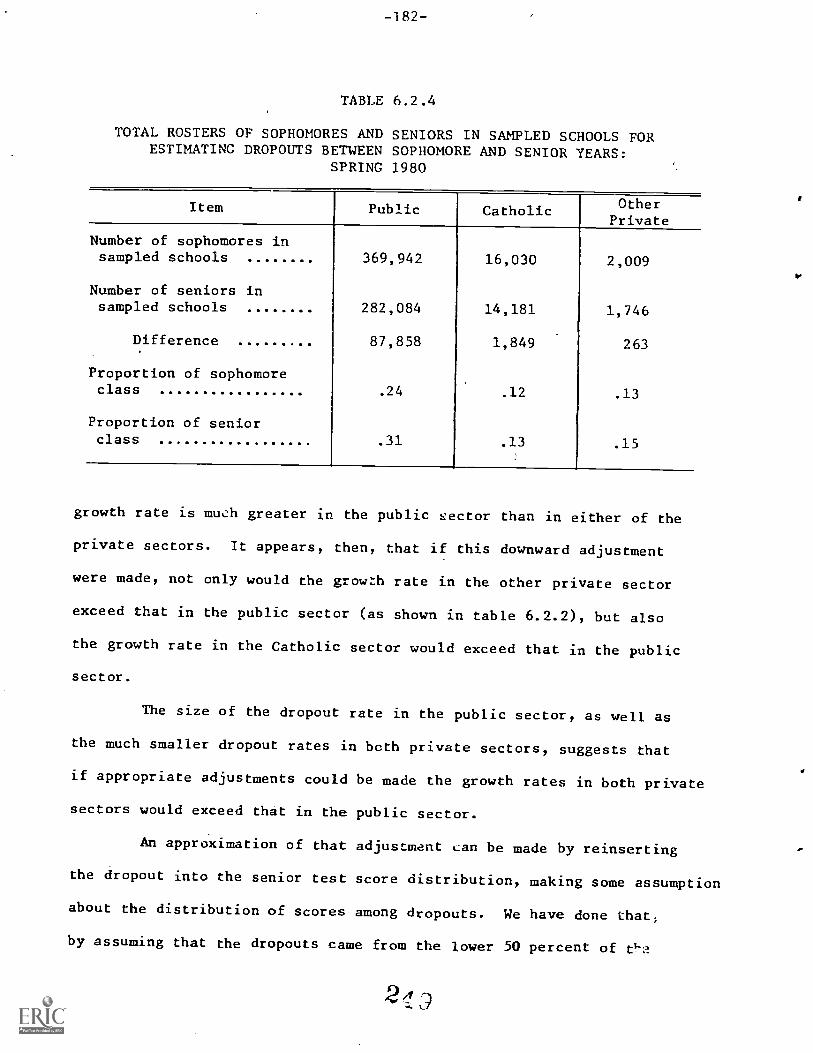
TABLE 6.2.4
TOTAL ROSTERS OF SOPHOMORES AND SENIORS IN SAMPLED SCHOOLS FORESTIMATING DROPOUTS BETWEEN SOPHOMORE AND SENIOR YEARS:
SPRING 1980
Item Public Catholic OtherPrivate
Number of sophomores insampled schools 369,942 16,030 2,009
Number of seniors insampled schools 282,084 14,181 1,746
Difference 87,858 1,849 263
Proportion of sophomoreclass .24 .12 .13
Proportion of seniorclass .31 .13 .15
growth rate is much greater in the public sector than in either of the
private sectors. It appears, then, that if this downward adjustment
were made, not only would the growth rate in the other private sector
exceed that in the public sector (as shown in table 6.2.2), but also
the growth rate in the Catholic sector would exceed that in the public
sector.
The size of the dropout rate in the public sector, as well as
the much smaller dropout rates in bcth private sectors, suggests that
if appropriate adjustments could be made the growth rates in both private
sectors would exceed that in the public sector.
An approximation of that adjustment can be made by reinserting
the dropout into the senior test score distribution, making some assumption
about the distribution of scores among dropouts. We have done that
by assuming that the dropouts came from the lower 50 percent of es,,
-133-
test score distribution on each test and were distributed in that lower
half in the same way that remaining seniors in the lower half of the
distribution are distributed. What this means in effect is that within
the lower half of the senior test score distribution, and within the
upper half, the distributions do not change; but the lower half, aug-
mented by the dropouts, becomes a larger share of the total.
This assumption probably errs on the side of being favorable
to those schools with high proportions of dropouts (in this case, the
public schools), because dropouts are probably concentrated more toward
the bottom of the distribution than is assumed. Thus the assumption
is probably conservative with respect to the inference at hand: that
is, the greater achievement growth of students in the private sector.
This assumption leads to modified senior test scores, giving the
senior scores and estimated senior-sophomore gains shown in panel (a)
of table 6.2.5, the upper half. The estimated gain is reduced most
in the public schools, because dropout is over twice as high as in either
private sector. In all three tests, the estimated gain in other private
schools is greater than that in public schools, and in two of the three
tests it is higher in Catholic than public schools--despite the fact
that both private sectors begin with more items correct among
sophomores, and arethus closer to the ceiling.
A learning rate that is not affected by the existence of a
ceiling can be calculated in each sector with these models. If p is
the probability of not knowing an item at a given time, and q is tnn
learning rate expressed as the probability per unit time of learning
what remains to be learned, then the equation for learning is
dp/dt -qp. Solving for q, the learning rate, in terms of po (the
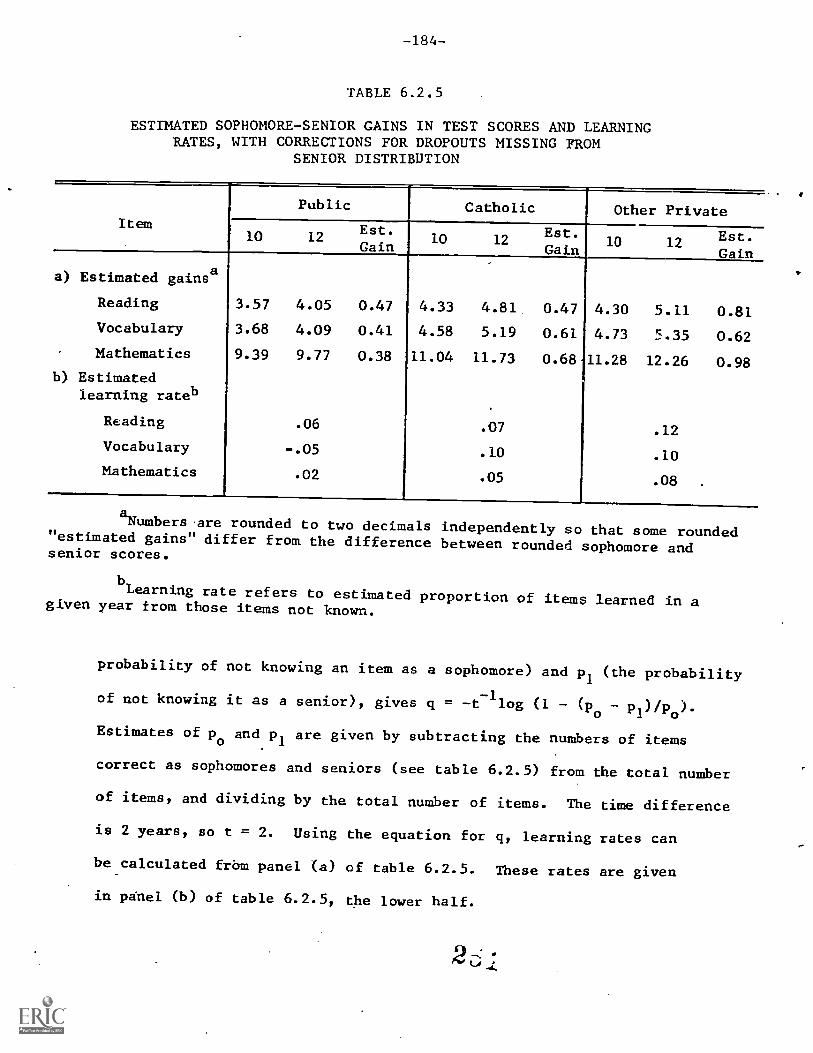
-184-
TABLE 6.2.5
ESTIMATED SOPHOMORE-SENIOR GAINS IN TEST SCORES AND LEARNINGRATES, WITH CORRECTIONS FOR DROPOUTS MISSING FROM
SENIOR DISTRIBUTION
Item
Public Catholic Other Private
10 12Est.Gain
10 12Est.Gain 10 12 Est.
Gain
a) Estimated gainsa
Reading 3.57 4.05 0.47 4.33 4.81, 0.47 4.30 5.11 0.81Vocabulary 3.68 4.09 0.41 4.58 5.19 0.61 4.73 5.35 0.62Mathematics
b) Estimatedlearning rateb
9.39 9.77 0.38 11.04 11.73 0.68 11.28 12.26 0.98
Reading .06 .07 .12Vocabulary -.05 .10 .10Mathematics .02 .05 .08 .
aNumbers are rounded to two decimals independently so that some rounded"estimated gains" differ from the difference between rounded sophomore andsenior scores.
bLearning rate refers to estimated proportion of items learned in agiven year from those items not known.
probability of not knowing an item as a sophomore) and pl (the probability
of not knowing it as a senior), gives q = -t -flog (1 - (pc) - pi)/p0).
Estimates of po and pl are given by subtracting the numbers of items
correct as sophomores and seniors (see table 6.2.5) from the total number
of items, and dividing by the total number of items. The time difference
is 2 years, so t = 2. Using the equation for q, learning rates can
be calculated from panel (a) of table 6.2.5. These rates are given
in pdnel (b) of table 6.2.5, the lower half.
-185-
The estimated learning rates show great differences between
students in other private schools and those in public schools. Dif-
ferences exist, but are smaller, between students in Catholic and public
schools. The calculations suggest that the growth rate in achievement
does differ among sect-ors, being highest in the other private sector,
next in the Catholic sector, and lowest in the public sector. It is
true that various assumptions are necessary, as discussed earlier, to
estimate such rates. But if the assumptions are favorable to any sector
it is probably the public sector. The evidence is thus rather strong
that average achievement growth is considerably greater in the private
sectors than it is in the public sector.1
1A problem not discussed in the text is the fact that some students
in all sectors did not take the tests, and the proportion differs fromsector to sector. For the mathematics test, it is 9.2 percent for sopho-mores and 13.0,percent for seniors in the public sector, 4.2 percentfor sophomores and 8.8 percent for seniors in the Catholic sector, and18.2 percent for sophomores and 19.0 percent for seniors in the otherprivate sector. To take into account these differences, test scoreswere imputed for those with missing test scores, using a variety ofpredictor variables. For example, for the mathematics test for seniors,the following variables were included: grades in school;,number ofsemesters of mathematics courses in grades 10 to 12; having taken algebra2, calculus, remedial mathematics, advanced mathematics; reading thefront page of the newspaper; interest in school; satisfaction with self;absences; tardiness; sex; father's education; mother's education; familyincome; race; and ethnicity. Separate regression equations were estimatedfor seniors and sophoTores, and for public and private (the two privatesectors together). R were .37 and .50 for sophomores and seniors inpublic schools and .39 and .47 for sophomores and seniors in privateschools. Recalculating the mean achievement in mathematics after valueswere imputed changes the means very little (sophomores: 9.2, 11.1, 11.2in public, Catholic, and other private, and seniors: 10.4, 12.2, 12.7in public, Catholic, and other private). Comparing these scores withthose in table 6.1.3 shows little difference, with 0.2 in decrease inboth sophomores and seniors in public schools, 0.1 increase in bothsophomores and seniors in Catholic schools, and 0.1 decrease in sopho-mores in other private schools, and no change in seniors. Consequently,imputed values were not included in making the calculations in the text.However, to fully test any effect of the missing values, learning-ratecalculations were made for mathematics with imputed scores included.These were .02, .07, and .09 for public, Catholic, and other privateschools respectively. These show slightly higher values for Catholicand other private schools, but do not change the qualitative inferencesmade in the text.
26;2
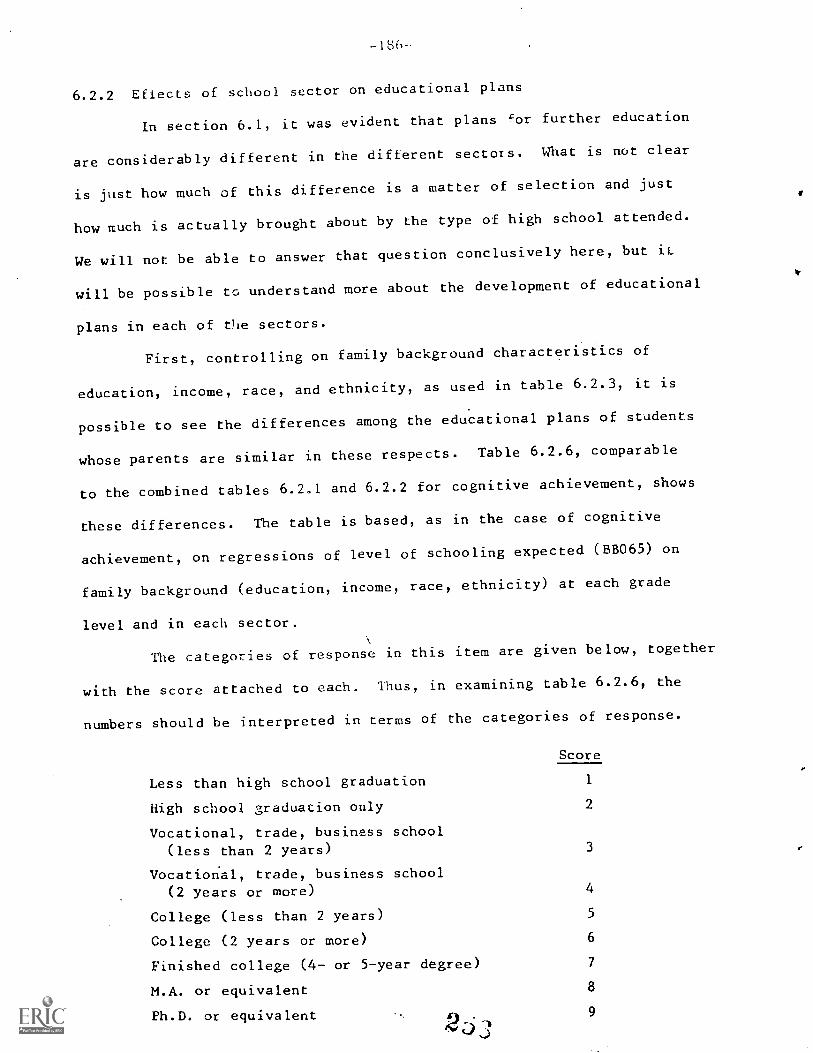
-186-
6.2.2 Effects of school sector on educational plans
In section 6.1, it was evident that plans For further education
are considerably different in the different sectors. What is not clear
is just how much of this difference is a matter of selection and just
how much is actually brought about by the type of high school attended.
We will not be able to answer that question conclusively here, but it
will be possible to understand more about the development of educational
plans in each of the sectors.
First, controlling on family background characteristics of
education, income, race, and ethnicity, as used in table 6.2.3, it is
possible to see the differences among the educational plans of students
whose parents are similar in these respects. Table 6.2.6, comparable
to the combined tables 6.2.1 and 6.2.2 for cognitive achievement, shows
these differences. The table is based, as in the case of cognitive
achievement, on regressions of level of schooling expected (BB065) on
family background (education, income, race, ethnicity) at each grade
level and in each sector.
The categories of response in this item are given below, together
with the score attached to each. Thus, in examining table 6.2.6, the
numbers should be interpreted in terms of the categories of response.
Score
Less than high school graduation 1
High school graduation only 2
Vocational, trade, business school(less than 2 years) 3
Vocational, trade, business school(2 years or more) 4
College (less than 2 years) 5
College (2 years or more) 6
Finished college (4 or 5year degree) 7
M.A. or equivalent 8
Ph.D. or equivalent 9
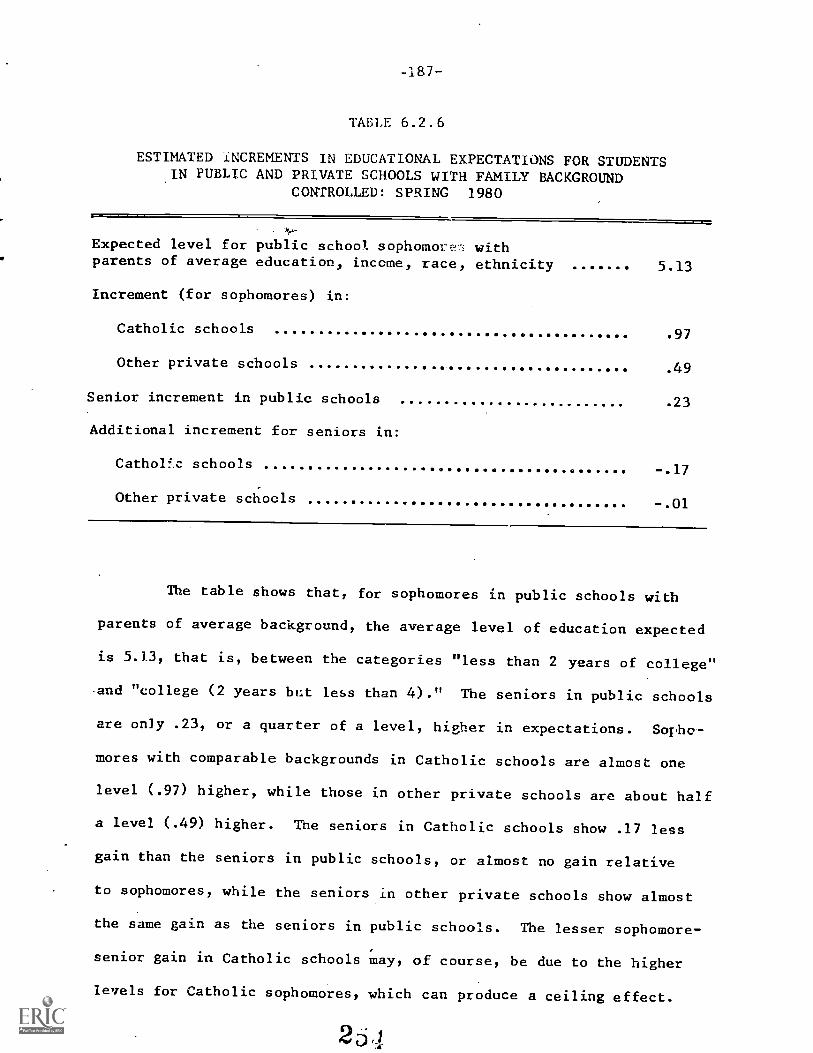
-187-
TABLE 6.2.6
ESTIMATED INCREMENTS IN EDUCATIONAL EXPECTATIONS FOR STUDENTSIN PUBLIC AND PRIVATE SCHOOLS WITH FAMILY BACKGROUND
CONTROLLED: SPRING 1980
Expected level for public school sophomor withparents of average education, income, race, ethnicity 5.13
Increment (for sophomores) in:
Catholic schools .97
Other private schools .49
Senior increment in public schools .23
Additional increment for seniors in:
Cathol!.c schools -.17
Other private schools -.01
The table shows that, for sophomores in public schools with
parents of average background, the average level of education expected
is 5.13, that is, between the categories "less than 2 years of college"
.and "college (2 years but less than 4)." The seniors in public schools
are only .23, or a quarter of a level, higher in expectations. Sopho-
mores with comparable backgrounds in Catholic schools are almost one
level (.97) higher, while those in other private schools are about half
a level (.49) higher. The seniors in Catholic schools show .17 less
gain than the seniors in public schools, or almost no gain relative
to sophomores, while the seniors in other private schools show almost
the same gain as the seniors in public schools. The lesser sophomore-
senior gain in Catholic schools may, of course, be due to the higher
levels for Catholic sophomores, which can produce a ceiling effect.
25,1
-188--
It is also difficult to estimate the differential sophomore-
senior change in educational expectations in the different sectors,
because of differential dropout in the different types of schools (as
shown in table 6.2.4), although this is partially corrected by controlling
on family background characteristics. It is possible, for example,
that the estimated gain of .23 of an educational level in public schools
is due solely to the fact that those with the lowest educational expecta-
tions, who are present in the sophomore class, are no longer present
in the senior class.
This possible dropout effect can be examined through use of
another question (BB068, EB068, YB072), which depends on retrospectiVe
accounts to learn whether the sophomores and seniors planned to attend
college in earlier years of school. The seniors were asked whether
they expected to attend college when they were in grades 8, 9, 10, and
11. The sophomores were asked the same question about their college
expectations in grades 6, 7, 8, and 9. Although such retrospective
accounts cannot be wholly reliable, they are the only source of such
information for these students. And they do show changes over time,
indicating that students did discriminate between years, and did not
simply respond alike for all years. For the sample as a whole table
6.2.7 shows in panel (a) that 49 percent of seniors indicated that they
expected to go to college when they were in grade 8. This rose to 53
percent in grade 9, 58 percent in grade 10, and 63 percent in grade
11. For the sophomores shown in panel (c), the figures are 42 percent
at grade 6, 46 percent at grade 7, 54 percent at grade 8, and 61 percent
at grade Comparing the two cohorts for grades 8 and 9 shows that
sophomores are 5 and 8 percent higher for these two grades, a difference
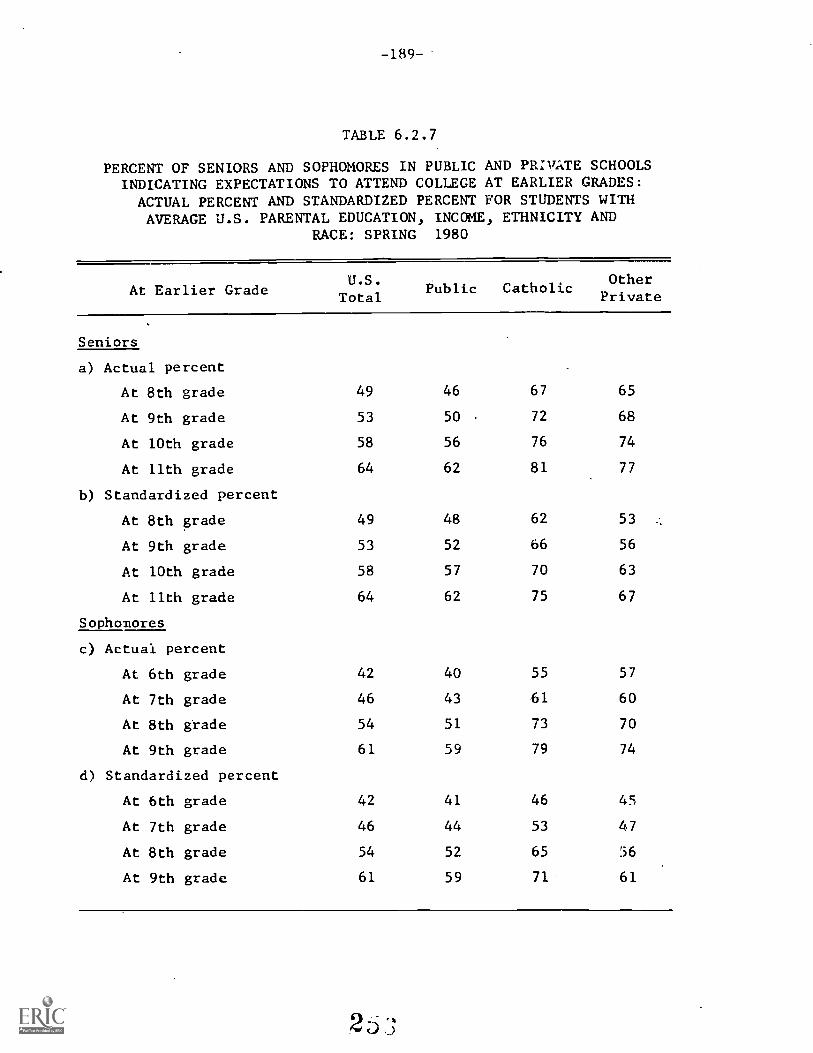
-189-
TABLE 6.2.7
PERCENT OF SENIORS AND SOPHOMORES IN PUBLIC AND PRIVATE SCHOOLSINDICATING EXPECTATIONS TO ATTEND COLLEGE AT EARLIER GRADES:ACTUAL PERCENT AND STANDARDIZED PERCENT FOR STUDENTS WITHAVERAGE U.S. PARENTAL EDUCATION, INCOME, ETHNICITY AND
RACE: SPRING 1980
At Earlier GradeU.S.
TotalPublic Catholic
OtherPrivate
Seniors
a) Actual percent
At 8th grade
At 9th grade
At 10th grade
At 11th grade
b) Standardized percent
49
53
58
64
46
50
56
62
67
72
76
81
65
68
74
77
At 8th grade 49 48 62 53
At 9th grade 53 52 66 56
At 10th grade 58 57 70 63
At 11th grade 64 62 75 67
Sophomores
c) Actual percent
At 6th grade 42 40 55 57
At 7th grade 46 43 61 60
At 8th grade 54 51 73 70
At 9th grade
d) Standardized percent
61 59 79 74
At 6th grade 42 41 46 45
At 7th grade 46 44 53 47
At 8th grade 54 52 65 56
At 9th grade 61 59 71 61
2j
r-190-
that is probably due to the difference between a one- or two-year retro-
spection and a three- or four-year retrospection.1
But we will ignore
these differences here. The question, then, is whether there was a
differential increase from grade 6 to grade 11 in different sectors.
Panel (a) in table 6.2.7 shows the actual percent of seniors
who reported expecting to go to college at each grade level in each
sector, and panel (b) shows the expected percent for students with family
education, income, race, and ethnicity at the national average.2
Panels (c) and (d) show comparable information for sophomores.
Looking at panels (a) and (c), the actual responses, the data
show that college expectations are higher in'the private school sectors
than in the public sectors. Catholic schools show higher expectations
than other private schools in seven of eight comparisons. The differences
between sectors in educational plans correspond to differences in family
background in the different sectors, except that parental income and
education are lower in Catholic schools than in other private schools,
while college expectations in Catholic schools are slightly higher
in both cohorts.
1The true difference, if the sophomores and seniors were sampled
from the same population (i.c , if the senior sample did not exclude
dropouts), would be grester than the 5 and 8 percent differences observed.
2 These numbers in the (b) snd (d) panels are calculated for
regression equations which used as the dependent variable expectations
to attend college (=I) or no expectation or uncertainty (=0). It would
have been preferable to use a logit analysis, but that would--in this
case--have involved an iterative algorithm that would have been prohibitively
expensive to use with the full dataset. in any case, experience shows
that the use of a 0-1 dependent variable gives coefficients that lead
to calculated values of the proportion positive that are almost identical
to those obtained by use of an iterative algorithm for estimation of the
logit, so long as the proportions are not too close to 0 or 1. Therefore
we can be confident that calculated percentages in the (b) and (d) fourth
paneIs of table 6.2.6 are close to those that would have been obtained
if an iterative logit algorithm had bee4sdvc_d
When backgrounds are standardized to the U.S. average, in panels
(b) and (d) of the table, the differences are in the same direction.
The differences between public and private are reduced, though all private
schools remain above the public schools. The differences between Catholic
and other private schools increase.
Apart from changes over the years, the differing levels of educa-
tional aspirations, when family background is controlled, show results
similar to those in table 6.2.6. In both cases, students in Catholic
schools show the highest educational aspirations when family background
is controlled, students in other private schools the next highest, and
public school students the lowest. Expectations are quite high in all
sectors, however, and the differences between the sectors are not great. -
However, the principal question at hand to which table 6.2.7
is relevant concerns the development or changes in expectations over years
of school. What do these retrospective accounts show about such changes
in different types of school? First, the expectations grow, and grow
substantially. The difference in the sample as a whole is 15 percentage
points between grades 8 and 11 for the seniors, and 19 points between
grades 6 and 9 for the sophomores. But that growth differs in different
types of school. It is difficult to make comparisons, because differing
amounts of growth are possible at different levels.
The most commonly accepted way of making comparisons in a case
like this is by comparing not percentages, but the logarithm of the
ratio of the percentage and its complement, p/(1-p), called a logit.
According to a reasonable model of the way effects take place to push
proportions up or down, a measure of effects can be made by a comparison
of logits for the background-standardized public school percentages
2
and the background-standardized percentages for the two private school
sectors, taken from panels (b) and (d). The excess of the private school
logit over the public school logit is a measure of the effect of being
in the private school on the likelihood of planning to attend college.
This "effect" of course includes both any actual effect of the type
of school in bringing about college plans and any selection effect that
is not captured by statistically controlling on family Lackground.
Thus the fact of a positive value for the diference between
private and public school logits is not evidence for an effect of being
in telat type of school on the development of college plans. What is
evidence of such an effect is an increase over the years in school of
the difference in logits.
Table 6.2.8 shows the difference in logits between each private
school sector and the public schools, based on panels (b) and (d) of
table 6.2.8. The results are very mixed. The data in panel (a) for
the zeniors shows no increase for the Catholic schools and a small
increase for the other private schools. Thus the senior data suggest
that being in a Catholic school has no greater effect on increasing
college plans than does being in a public school, and that being in
an other private school has a slightly greater effect.
But panel (b) for the sophomores presents evidence that con-
flicts with this. For the Catholic schools, the measure of effect does
increase, suggesting that there is a greater effect of being in a Catholic
school on growth in college plans than of being in a public school.
The measure of effect does not increase for other private schools,
suggesting no greater effect of being in such a school on college plans.
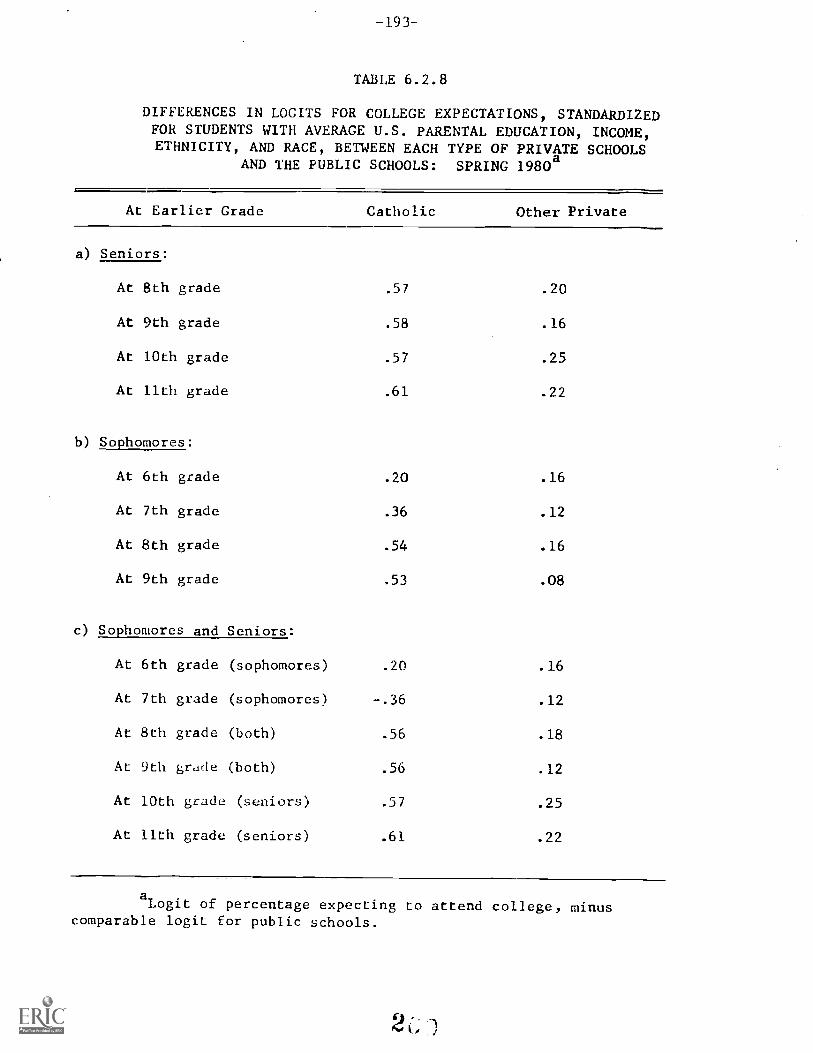
-193-
TABLE 6.2.8
DIFFERENCES IN LOGITS FOR COLLEGE EXPECTATIONS, STANDARDIZEDFOR STUDENTS WITH AVERAGE U.S. PARENTAL EDUCATION, INCOME,ETHNICITY, AND RACE, BETWEEN EACH TYPE OF PRIVATE SCHOOLS
AND THE PUBLIC SCHOOLS: SPRING 1980a
At Earlier Grade Catholic Other Private
a) Seniors:
.57
.58
.20
.16
At 8th grade
At 9th grade
At 10th grade .57 .25
b)
At 11th grade
Sophomores:
.61 .22
At 6th grade .20 .16
At 7th grade .36 .12
At 8th grade .54 .16
c)
At 9th grade
Sophomores and Seniors:
.53 .08
At 6th grade (sophomores) .20 .16
At 7th grade (sophomores) -.36 .12
At 8th grade (both) .56 .18
At 9th grade (both) .56 .12
At 10th grade (seniors) .57 .25
At 11th grade (seniors) .61 .22
aLogit of percentage expecting to attend college, minus
comparable logit for public schools.
A somewhat more reliable indicator of growth in college plans
over time by these students can be obtained by combining the senior
and sophomore retrospective data to obtain a single series beginning
at grade 8 and continuing through grade 11. To create such a series,
the difference in senior logits shown in panel (a) for grades 8 and
9 is averaged with the difference in sophomore ogits shown in panel
(b) for grades 8 and 9. The result is shown in panel (c). For the
Catholic schools and the other private schools, there is a general
increase in the gap between each sector and the public sector. There
is greater consistency for the Catholic sector, where the absolute
levels also suggest a stronger effect; but in the other private schools
as well there is an indication of greater growth in educational aspira-
tions for background-standardized students than in the public schools.
The end result of the analysis is that there is reasonably
strong evidence of the greater development of college plans in the
Catholic sector than in the public sector, and somewhat less strong
evidence of greater development of college plans in the other private
sector than in the public sector. The different sectors are consistently
different in the proportions of studerts expecting to attend college,
even after standardizing on parental education, family income, race,
and ethnicity, and there is evidence from retrospective accounts by
sophomores and seniors that these differences are not wholly due to
initial selection.
Now we turn to the examination of different educational expecta-
tions for students with high or low parental education. As in the case
of cognitive achievement, the differential educational expectations
of students with especially high or low parental education in different
2
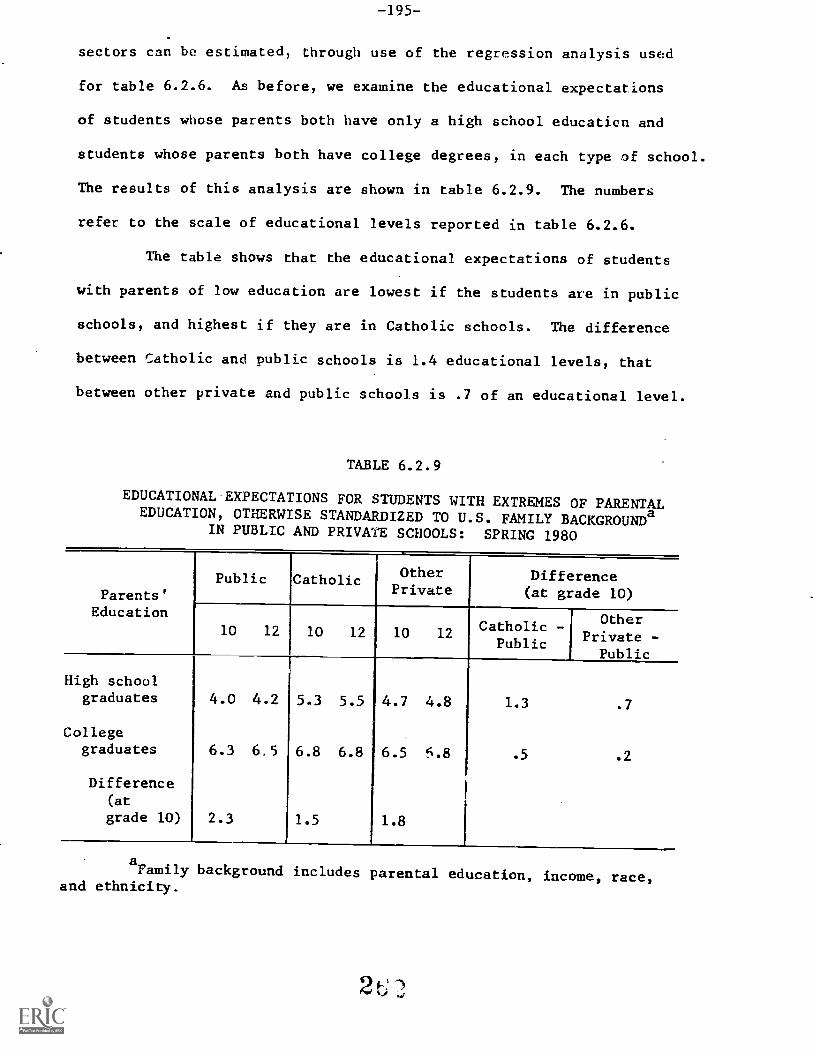
-195-
sectors can be estimated, through use of the regression analysis used
for table 6.2.6. As before, we examine the educational expectations
of students whose parents both have only a high school education and
students whose parents both have college degrees, in each type of school.
The results of this analysis are shown in table 6.2.9. The numbers
refer to the scale of educational levels reported in table 6.2.6.
The table shows that the educational expectations of students
with parents of low education are lowest if the students are in public
schools, and highest if they are in Catholic schools. The difference
between Catholic and public schools is 1.4 educational levels, that
between other private and public schools is .7 of an educational level.
TABLE 6.2.9
EDUCATIONAL EXPECTATIONS FOR STUDENTS WITH EXTREMES OF PARENTALEDUCATION, OTHERWISE STANDARDIZED TO U.S. FAMILY BACKGROUNDa
IN PUBLIC AND PRIVATE SCHOOLS: SPRING 1980
Parents'Education
Public Catholic OtherPrivate
Difference(at grade 10)
10 12 10 12 10 12Catholic --
Public
OtherPrivate -
Public
High schoolgraduates
Collegegraduates
Difference(at
grade 10)
4.0
6.3
2.3
4.2
6.5
5.3
6.8
1.5
5.5
6.8
4.7
6.5
1.8
4.8
6.8
1.3
.5
.7
.2
aFamily background includes parental education, income, race,
and ethnicity.
2t-; 2,
-1q6-
For children of parents with college degrees, the expected education
is higher in all sectors. But the difference between sectors is much
less, only half an educational level between Catholic and public schools,
and only .2 of an educational level between other private and public
schools.
The bottom row of the table shows the difference in educational
expectations between children of high- and low-education parents in each
type of school. Here, the differences are greatest in the public schools
and least in the Catholic schools, with the other private schools in
between. As in the case of cognitive achievement, the Catholic schools
come closest to meeting the ideal of the "common school." The public
schools are furthest from this idea in educational expectations. Children
from differing educational backgrounds in Catholic schools are most
alike in their educational expectations, while children from differing
educational backgrounds in public schools are least alike in educational
expectations. In other words, in the public schools, the educational plans
of children with college-educated parents diverge more sharply from
those of children with high school -- educated parents than is true in any
other type of school. And the divergence is least in Catholic schools.
The gains in educational expectations from the sophomores to the senior
year are small in all sectors and for both levels of parental education. They
are least in the Catholic schools. But, as indicated in previous analysis,
the retrospective questions examined earlier probably give better information
about the development of education plans than does the sophomore-to-
senior comparison.
2 v J
6.3 Factors Affecting Cognitive Achievement in the Schools
The indication that there are different achievement growth rates
in different sectors, as well as the evidence of sector effects on homo-
geneity of achievement, suggests that it may be useful to try to get
a better understanding of the differences among the sectors. One strategy
for doing so is this: If attending one type of private school, an other
private school for example, is hypothesized to bring about higher achieve-
ment than attending a public school, then it should be the case that
within each of the sectors students achieve more highly in Schools that
differ from the average school in ways that other private schools differ
from public schools--but only, of course, in those ways that make a
difference for achievement. If the higher levels of homework that
characterize other private schools (chapter 5) are effective in leading
to higher achievement, then in those schools that have high levels of
homework, no matter whether they are Catholic, public, or other private,
achievement should be higher than in other schools of that sector.
If other private schools are not more effective for cognitive achievement,
or if some aspect of other private schools other than homework is the
factor that makes for higher achievement, then achievement should not
be higher, in such an analysis. If, for example, other private schools
are more effective, but it is their smaller size (as shown in chapter
2) that makes them so, then smaller schools in each sector, not schools
with higher homework levels, should show higher achievement when student
background is controlled.
Thus, this will be the general strategy: to examine the relations,
within each of the sectors, of various factors that distinguish the
Catholic and other private schools from the public schools. If certain
-198-
of these factors do consistently make a difference in cognitive achieve-
ment, whatever the sector, then this is rather strong evidence both
that the different school sectors do bring about differing achievement,
and that one way they do so is through their difference on the factors
that in the analysis shows effects on achievement. In addition, beyond
confirming the differential effects on achievement of different school
sectors, this approach will give some insight into the policies that,
in any sector, affect achievement.
The first examination concerns discipline-related behavior.
Analyses were carried out on the relation of attendance, being late
to school, and cutting classes to achievement in each of the three sectors.
Parental education, family income. race, and ethnicity were statistically
controlled. The analyses were carried out for sophomores and seniors
together, with a 0-1 variable for sophomore-senior grade level. Scores
in the reading, vocabulary, and mathematics subtests with common items
for seniors and sophomores were used as dependent variables.
Table 6.3.1 shows the regression coefficients for absenteeism,
lateness, and cutting classes (all in the same equation) in each of
the four types of schools. In addition, means on each of these variables
are listed, in the bottom panel. (Cutting classes is a 0-1 variable,
so that the coefficient can be interpreted as an effect of "cutting
classes now and then" versus not doing so. The other variables are
scaled, with one unit being the difference in one category in the item
responses.)
There is a high degree of consistency in the results. The
coefficients are almost all negative, meaning that students who report
missing school or class or being late achieve consistently less well,
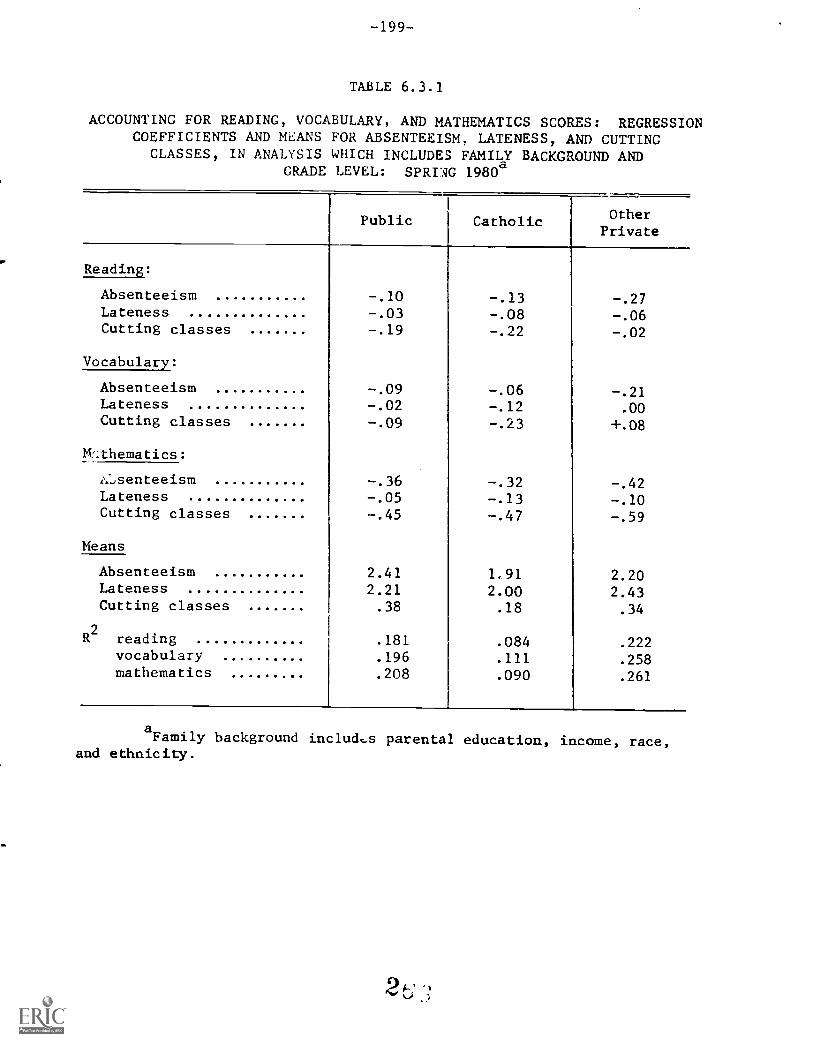
-199--
TABLE 6.3.1
ACCOUNTING FOR READING, VOCABULARY, AND MATHEMATICS SCORES: REGRESSIONCOEFFICIENTS AND MEANS FOR ABSENTEEISM, LATENESS, AND CUTTING
CLASSES, IN ANALYSIS WHICH INCLUDES FAMILY BACKGROUND ANDGRADE LEVEL: SPRING 1980a
Public Catholic OtherPrivate
Reading:
Absenteeism -.10 -.13 -.27Lateness -.03 -.08 -.06Cutting classes -.19 -.22 -.02
Vocabulary:
Absenteeism -.09 -.06 -.21Lateness -.02 -.12 .00Cutting classes -.09 -.23 +.08
Mathematics:
1,....,senteeism -.36 -.32 -.42Lateness -.05 -.13 -.10Cutting classes -.45 -.47 -.59
Means
Absenteeism 2.41 1,91 2.20Lateness 2.21 2.00 2.43Cutting classes .38 .18 .34
R2
reading .181 .084 .222vocabulary .196 .111 .258mathematics .208 .090 .261
aFamily background includ,s parental education, income, race,
and ethnicity.
2
-200-
in all sectors, than those from the same types of family background
who do not do these things.1
Of the three types of behavior, lateness
is least related to achievement.
Something about the magnitude of the effect of these types of
behavior, at the levels at which they exist in the various types of
schools, can be obtained by multiplying the regression coefficients
shown in the upper three panels of table 6.3.1, by differences in the
means of the variables between different sectors. The result shows
the amount of extra achievement in one sector (the sector with the
lower level of absences, lateness, or class cutting) over that in
another which is related to these three problems of discipline. For
example, the difference between Catholic schools and public schools
in cutting classes is a difference of 18 percent versus 38 percent.
This difference (.18 .38) multiplied by the regression coefficient
of -.45 (effect of cutting classes on mathematics achievement in public
schools) gives a value of .09. This means that, on the average, achieve-
ment was lower in the public schools by .09 of an item in the mathematics
1This does not imply, of course, that public schools could
easily establish and implement those policies. In chapter 5 we pointedout the much greater restrictions on the public schools in ability tocarry out effective discipline.
One might argue that the reasoning in the text is flawed--thatpolicy differences leading to different levels of absenteeism wouldnot affect achievement but rather that the kind of students who tendto be lower achievers are those who are absent or cut classes, and itis not the absences themgelves that reduce achievement. This may beso, and the issue certainly merits further attention. However, thesimilarity of regression coefficients in the different sectors, wherepolicies lead to very different levels of absenteeism, suggests thatthe interpretation in the text may be the correct one. The questionis examined explicitly later in this section.
-201-
test because of disciplinary policies that allowed a level of 38 percent
of students cutting classes rather than the 18 percent found in Catholic
schools.1
Carrying out such an exercise over all tests, comparing the
public schools with both private school sectors and summing over the
three types of behavior, shows the loss in reading, vocabulary, and
mathematics achievement in public schools that is due to the higher
degree of absenteeism, lateness, and class cutting found in these schools
as compared to the levels found in both Catholic schools and other private
schools (table 6.3.2). The public school losses are highly consistent,
are greater relative to the Catholic schools, and seem to be somewhat
'Igher for mathematics. (The number of items on the mathematics test
is 18, a little over twice that on the other two; consequently, its
coefficients should be expected to be about twice as great as the others.
But they are somewhat greater than this.) The achievement losses are
not large, but this must be seen in perspective: the differences in
mathematics due to Catholic-public behavior differences are about one-
fourth of all the mathematics achievement gain from the sophomore to
the senior year. In addition, the indicators we have used of different
levels of discipline-related behavior are very likely pale reflections
of the behavioral differences among these schools. Thus, the actual
effects of all discipline-related behavioral differences between these
schools may be considerably greater (as subsequent analysis indicates).
1When independent variables in a regression equation are cor-
related, as these three are, there is sometimes instability in individualcoefficients, becoming extreme in opposite directions. This seems tobe what has occurred fol. vocabulary in other private schools, for example.There are techniques, such as ridge regression, for restabilizing thecoefficients. But if one is interested only in the combined effects,as we are here, then the approach we use in table 6.3.2 and subsequentanalyses is ordinarily sufficient.
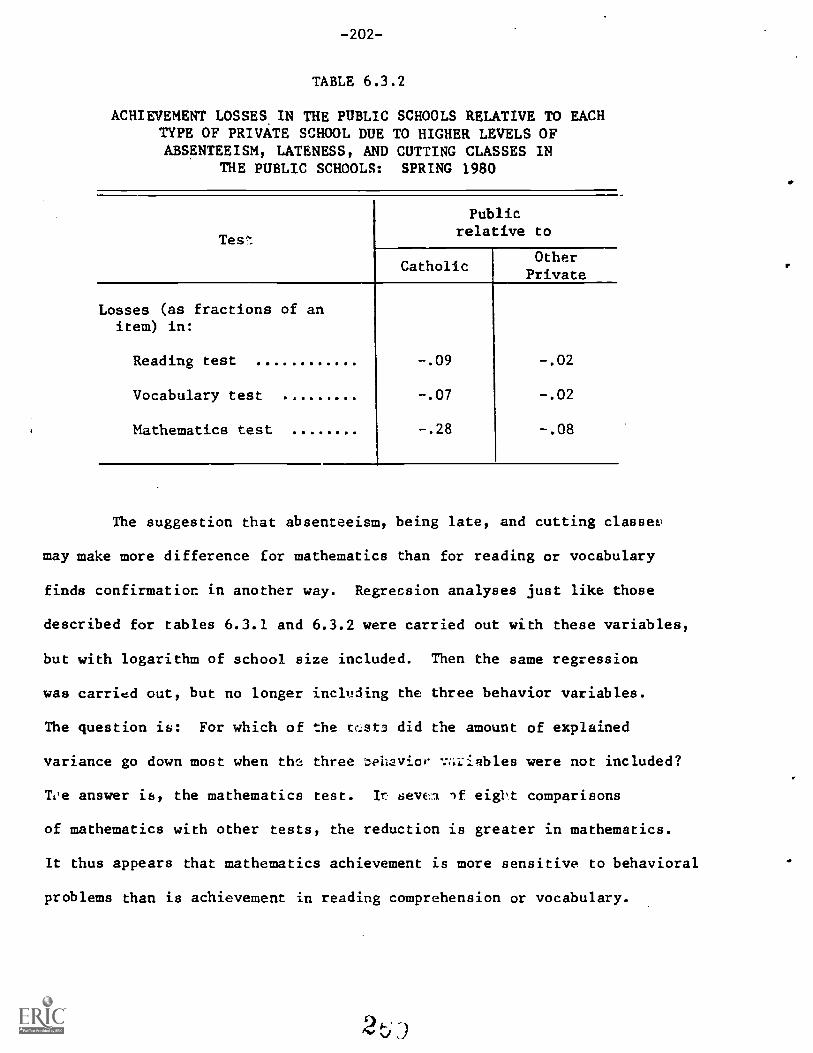
-202-
TABLE 6.3.2
ACHIEVEMENT LOSSES IN THE PUBLIC SCHOOLS RELATIVE TO EACHTYPE OF PRIVATE SCHOOL DUE TO HIGHER LEVELS OFABSENTEEISM, LATENESS, AND CUTTING CLASSES IN
THE PUBLIC SCHOOLS: SPRING 1980
Tes
Publicrelative to
CatholicOtherPrivate
Losses (as fractions of anitem) in:
Reading test -.09 -.02
Vocabulary test ... -.07 -.02
Mathematics test -.28 -.08
The suggestion that absenteeism, being late, and cutting classes'
may make more difference for mathematics than for reading or vocabulary
finds confirmation in another way. Regression analyses just like those
described for tables 6.3.1 and 6.3.2 were carried out with these variables,
but with logarithm of school size included. Then the same regression
was carried out, but no longer including the three behavior variables.
The question is: For which of the tr_st3 did the amount of explained
variance go down most when the three rcehavior -.7:iiinbles were not included?
Toe answer is, the mathematics test. It seven if eight comparisons
of mathematics with other tests, the reduction is greater in mathematics.
It thus appears that mathematics achievement is more sensitive to behavioral
problems than is achievement in reading comprehension or vocabulary.
2 j
When we turn to size of school itself as a factor differentiating
public and private schools, and possibly making for differential achieve-
ment, we find that size of school is positively related to achievement
in the Catholic and other private sectors for all three tests, and in
the public sector for two of the three, when family background and grade
in school are controlled. Thus it appears that public schools have
a gain in achievement relative to private schools as a consequence of
their larger size. The amount of gain they experience can be calculated
as it was done in the case of the behavior problems: by multiplying
the regression coefficient for the effect of size by the difference
in average size between sectors.' Before presenting these results,
_ however, it is useful to introduce another set of variables: the at-
tendance variables whose effect was discussed above. For the relation
of school size to achievement is positive, while the relation of absenteeism,
lateness, and cutting classes to achievement is negative, but the latter
are positively related to size. At least, this is the case in the public
schools. The correlation of the three behavior problems with the logarithm
of size is as given below in the three sectors:2
Public Catholic Other Private
Absenteeism .02 -.02 .00
Lateness .10 .00 -.20
Cutting class .12 .00 .01
1The variable actually used in the regression is logarithm of
size. In the calculation described in the text, regression coefficientsfor the school sector to which the size-related loss for gain) willbe attributed are used. This is because, as will be evident in thediscussion, we want to distinguish the gain that private schools couldexpect through change in average size to that of public achools fromthe loss that public schools could expect through a change in averagesize to that of private schools.
2Because the number of private schools is 27, the number of
Catholic schools is 84, and the number of public schools is 894,and because size is a school-level variable, sampling variation in correlationscan be expected in other private schools, and to a ?Lesser degree inCatholic schools. cj-,
j
-204-
Controlling on the behavior problems in a regression of achievement
on size is like hypothetical experiment: What would be the effect
of size on achievement if school staff were able to control the behavior
problems that are correlated with size. The absence of correlation
with size in the private schools (or, in the case of lateness, in other
private schools, a negative relation to size) shows that the question
is not a hypothetical one for staff in private schools. They apparently
are able to control the behavior problems that in the public schools
increase with size. This may be due to the greater degree of
overall control that private schools are able to exercise, or to the
smaller sizes of the schools.
Table 6.3.3 shows (in the upper three lines) the gains--or
in the case of reading, losses--that public schools experience Li
to Catholic and other private schools because of their large size.
But comparing that to the next three lines shows that these gains are
smaller than they would be--and the losses larger than they would be-
-with the behavior problems controlled. (It should be emphael ,c1 that
the true effect of size alight be less than indicated in this analysis
because large schools in the public sector are positively associated
with certain background variables that have not been statistically
controlled such as parental expectations and small family size, both
of which are positively related to achievement. tut, even if this is
the case, it would merely reduce the measurId effect of size by a constant
amount.)
The positive effect of size, assuming that it is a true effect,
might be due to any of several factors. It was once assumed, in fact,
that larger schools meant better educations as ir Conant's influential
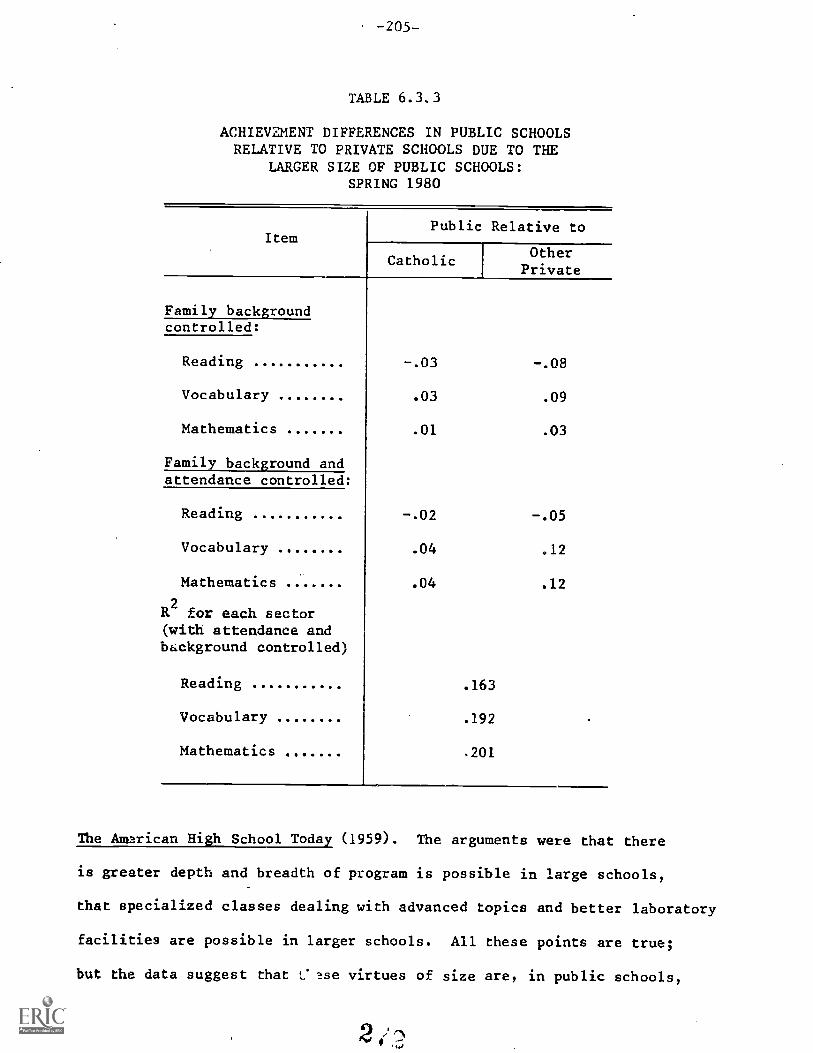
TABLE 6.3.3
ACHIEVZMENT DIFFERENCES IN PUBLIC SCHOOLSRELATIVE TO PRIVATE SCHOOLS DUE TO THE
LARGER SIZE OF PUBLIC SCHOOLS:SPRING 1980
Item
Family backgroundcontrolled:
Public Relative to
Catholic OtherPrivate
Reading
Vocabulary
Mathematics
Family background andattendance controlled:
Reading
Vocabulary
Mathematics
R2
for each sector(with attendance andbackground controlled)
Reading
Vocabulary
Mathematics
-.03 -.08
.03 .09
. 01 .03
-.02 -.05
. 04 .12
.04 .12
.163
.192
.201.
The Amarican High School Today (1959). The arguments were that there
is greater depth and breadth of program is possible in large schools,
that specialized classes dealing with advanced topics and better laboratory
facilities are possible in larger schools. All these points are true;
but the data suggest that Case virtues of size are, in public schools,
2,
-20E-
largely cancelled out by the inability to manage behavior problems as
school size increases--an inability that has very likely grown since
Conant made his survey of high schools in 1958.
The analyses of tables 6.3.1 and 6.3.2 included only a small
number of background variables, and did not include other possible
school factors that might be responsible for some of the differences
found. Initially our strategy was to proceed in this way generally)
examining sequentially the effects of various school factors that differ
between public and private schools, in separate regression equations.
However, the correlations between these various school characteristics
mean that such a procedure might easily lead to incorrect inferences,
attributing effects to one factor in the schools that are due to a factor
that is correlated with the first but not included in the equations.'
Consequently, a single analysis is carried out for all of the factors
to be examined. In addition, to reduce the lowest lev..1.1 possible any
spurious inferences due to differences in family background that are
correlated with school factors, all of the family background factors
used for the analysis reported in table 6.2.1 are incltAed in subsequent
analyses. For each of the characteristics of schools and of school
functioning that is a source of possible differences in the effectiveness
of public and private schools) we ask the following pair of questions:
1. What is the level of that characteristic in Catholic or otherprivate schools) for students with the same subjective andobjective background characteristics as the average sophomorepublic school student? For example, the overall average dif-ference between Catholic school and public school sophomoresin the amount of homework they do is the difference between
1 Thomas DiPrete first brought this matter to our attention.His analysis for another report from the High School and Beyond project)Discipline and Order in American High Schools, suggested that this mightbe the case. We thank Professor DiPrete.
-207--
5.56 hours a wee in the Catholic schools and 3.75 a week in
the public schools. But for Catholic school sophomores withthe same subjective and objective characteristics as the averagepublic school sophimore, the 5.56 hours a week is reduced to4.92 hours a week. Thus, the difference in levels of homeworkfor the same type of student between the public and Catholicschools is 4.92 3.75, or 1.2 hours a week of homework.
2 What difference in achievement would we expect to find in thepublic schools if the school factor were at the level at whichit is found in Catholic Jr other private schools for studentsof a given background (i.e., the background of the avaragepublic school sophomore)? For example, what increment in achieve-ment would we expect to find in the public schools if the averagepublic school student spent 1.2 more hours on homework? Thisis obtaiLied by multiplying the 1.2 hours by the regressioncoefficient for the effect of homework on achievement in publicschools, controlling for the effects of family background char-acteristics and other school factors.
Thus there are two questions of interest for each of the school
factors that might contribute to the public-Catholic or public-other
private difference in achievement: What is the difference between the
level of that factor in the Catholic or other private schools and public
schools, for students like the average public school sophomore? And
what would be the expected difference in achievement in the public
schools if that factor were at the level found in the Catholic or other
private schools, controlling on family background and other school
factors? We address these questions in turn.
6.3.1 The difference in levels of school factors between public andprivate schools for students of comparable backgrounds
Each of five areas related to the functioning of the school
was examined as a potential means through which private schools obtain
different levels of achievement from comparable students. These are:
1 The standardized estimates of school functioning were calculatedas follows: For each grade in the public and private sectors, we estimatedseparate regression equations for each of the sr:hool functioning variablesusing the seventeen family background characteristics. A background-standardized estimate for the level of school functioning in each gradeand sector was calculated using the means of the public school sophomorecharacteristics and the effects of these background characteristics
O , 4in the respective sector and gr;-'e.41
-208-
1. Different coursework. This was measured in two ways. Formathematics in the senior year, it was possible to measurecoursework in mathematics, that is, the total number of coursesthat the student had taken among the following: algebra 1,algebra 2, geometry, trigometry, calculus. As chapter 5 showed,higher proportions of private school seniors than public schoolseniors have taken each of these courses. Unfortunately, forthe reading and vocabulary tests, and for the mathematics testfor sophomores, there is no comparable measure of coursework.Instead, for these tests, having taken an honors English course(for the reading and vocabulary tests) or an honors mathematicscourse (for the mathema.Acs test) was used as the measure ofcoursework. This is a poor measure of coursework differencesbetween public and private schools, both because the proportionsof students having taken an honors course were very similarin the three sectors and because an "honors" course means verydifferent things in different school contexts.
2. Homework. As chapter 5 showed, the amount of homework in theCatholic schools is greater than that in the public schools,and the amount in the other private sector is greater yet.For both sophomores and seniors it was possible to estimatethe actual hours per week spent on homework.
3. Attendance in school and class. Chapter 5 showed that studentsin Catholic schools were much less often absent and much lesslikely to cut class than students in public schools. Studentsin other private schools were between the Catholic and publicschools on these measures of behavior.
4. Disciplinary climate. Students were asked three questions relatedto the disciplinary climate of the school, as shown in chapter5: how interested the teachers are in students, how effectivethe discipline is in the school, and how fair the disciplineis in the school. Each school was characterized by the averageof the responses for all the students in that school, and theseaverages were then used as measures of the school disciplinaryclimate. As chapter 5 chewed, there were some differences inthe average disciplinary climates in the three sectors.
5. Student behavior in the school. The behavior of all the studentsin the school may have some effect on what individual studentslearn, even controlling on the student's own behavior. Theitems used as a measure of the behavior in the school were theaverages, over the school, of sophomore responses to .four questionsasking the extent to which certain types of behavior occurredin the school: students not attending school, students cuttingclasses, students fighting, students threatening or attackingteachers. Alternative, measures of attendance and cutting classeswere obtained by averaging over the school the students' responsesconcerning their own attendance and cutting classes, and characterizingeach student by the average in the school, excluding his orher own responses.
-209-
Chapter 5 showed the differences in the levels of these school
characteristics in public and private schools. The differences in these
characteristics for students from the same family backgrounds are of
interest here. More specifically, we are interested in the differences
for students who are like the average public school sophomore, so that
the levels of the school characteristics are standardized to the public
school sophomore population. The importance of this question lies in
the fact that the family backgrounds of public, Catholic, and other
private school students differ in both objective characteristics, such
as parental education and income, and in subjective characteristics
such as the amount of student conversation with parents about school-
work. In most of these ways, students in public schools have backgrounds
that are less conducive to achievement than do students in private
schools. Thus the measures of school functioning, which are in part
determined by the backgrounds from which the students come, must be
adjusted or standardized for student background in order not to attribute
to school policies those differences in achievement that are in fact
due to student background effects on school functioning.
The background-standardized measures of school functioning are
shown in table 6.3.4. The table shows that with very few exceptions
(all in the percent taking honors mathematics or honors English) the
Catholic and other private schools are higher in those characteristics
that appear to be conducive to achievement (homework, teacher interest,
fairness or effectiveness) and low'r in those that appear inimical to
achievement (absenteeism, cutting class, fighting, threatening teachers).
The differences are generally reduced compared to those found in chapter 5
because standardization of family background brings the student behavior
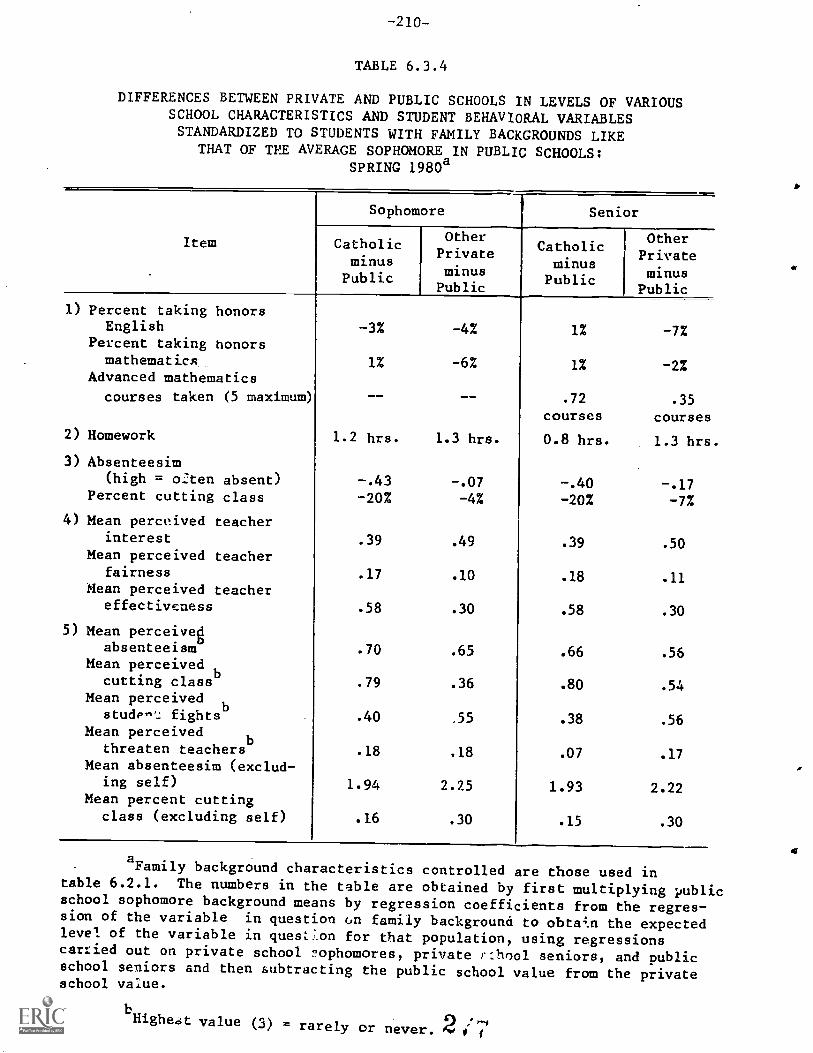
-210-
TABLE 6.3.4
DIFFERENCES BETWEEN PRIVATE AND PUBLIC SCHOOLS IN LEVELS OF VARIOUSSCHOOL CHARACTERISTICS AND STUDENT BEHAVIORAL VARIABLESSTANDARDIZED TO STUDENTS WITH FAMILY BACKGROUNDS LIKE
THAT OF TEE AVERAGE SOPHOMORE IN PUBLIC SCHOOLS:SPRING 1980a
Sophomore Senior
Item CatholicminusPublic
OtherPrivateminusPublic
CatholicminusPublic
OtherPrivateminusPublic
1) Percent taking honorsEnglish
Percent taking honorsmathematics
Advanced mathematics
courses taken (5 maximum
2) Homework
3) Absenteesim
-3%
1%
1.2 hrs.
-4%
-6%
1.3 hrs.
1%
1%
.72
courses
0.8 hrs.
-7%
-2%
.35
courses
1.3 hrs.
(high = oaten absent) -.43 -.07 -.40 -.17Percent cutting class -20% -4% -20% -7%
4) Mean perceived teacherinterest .39 .49 .39 .50
Mean perceived teacherfairness .17 .10 .18 .11
Mean perceived teachereffectiveness .58 .30 .58 .30
5) Mean perceivegabsenteeism .70 .65 .66 .56
Mean perceivedcutting class .79 .36 .80 .54
Mean perceivedstudero.: fights .40 55 .38 .56
Mean perceivedb
threaten teachers .18 .18 .07 .17Mean absenteesim (exclud-
ing self) 1.94 2.25 1.93 2.22Mean percent cutting
class (excluding self) .16 .30 .15 .30
aFamily background characteristics controlled are those used intable 6.2.1. The numbers in the table are obtained by first multiplying publicschool sophomore background means by regression coefficients from the regres-sion of the variable in question on family background to obta4.n the expectedlevel of the variable in quesLon for that population, using regressionscarried out on private school ?ophomores, private r:hool seniors, and publicschool seniors and then subtracting the public school value from the privateschool value.
bHigheat value (3) = rarely or never. 2 , I
-2 1 l-
in the private schools closer to that in the public schools. Yet the
differences remain in the same direction as those in chapter 5, when
student background was not controlled.
6.3.2 Differences in achievement attributable to particular schoolcharacteristics and student behavior
Given these differences, it becomes possible to estimate the
effect of being in a Catholic or other private school on achievement
through each of the types of differences. This will show, for example,
the estima"-ed gain in achievement if the amount of homework done by
public school sophomores were the same as that done by Catholic school
students with similiar backgrounds (that is, an extra 1.2 hours a week),
but other measured characteristics of the school remained the same.
In this way sorry or all of the differences between private and
public schools shown in table 6.2.1 may be accounted for or explained.
For example, in table 6.2.1, the reading achievement in Catholic schools
of sophomores with backgrounds similar to those of public school sopho-
mores is 0.31 items greater than that of the public school sophomores.
This difference of 0.31 items may be due in part to the 1.2 hours more
homework in the Catholic schools. Carrying out the calculations we
can see that public school sophomores who are average in all the mea-
sured family background cha:acteristics and in a school that is average
in the measured school characteristics get .06 more items on the reading
test covered if they do the same amount of homework as similar students
(i.e., background-standardized) do in the Catholic sector.
In carrying out this examination, the amount of achievement
explained by the variables in each of the five areas of school func-
tioning is added, to give a total explained by measured characteristics
-212-
in that area.' Thus, in the area of coursework, homework, attendance,
disciplinary climate, and student behavior, the analysis results in
a number that is the amount of achievement difference between public
and Catholic or other private schools that can be accounted for by the
differences in the level at which that factor exists in each sector.
If the number is positive, this means that the average public school
student would gain in achievement if the public school operated at the
same level as the Lverage Catholic or other private school. If the
number is negative, it means that the average public school student
would have lower achievement if the public school operated at the same
level as the average Catholic or other private school.
Table 6.3.5 shows the overall difference in achievement in
reading, vocabulary, and mathematics in public and private shcools,
controlling on student background, taken from table 6.2.1, and the
amount of achievement difference that can be accounted for by the dif-
ferences in each of the five areas. The sum of these five differential
achievements (labelled "total accounted for" in the table) is the amount
of achievement difference explained by all these mlasures of school
functioning. If that sum is less than the overall difference in achieve-
ment, there remains an unexplained achievement difference between the
private and the public sector. If the total accounted for is greater
than the overall difference (as, for example, with reading achievement
for sophomores in the Catholic-public comparison--.31 overall differences
and .43 accounted for), this suggests that there are other unmeasured
school factors that partly compensate for the effects of these factors
1In terms of calculations, this was estimated by multiplying
the difference in the two levels of functioning (seen in table 6.3.4)by the relevant regression coefficient in the public sector.
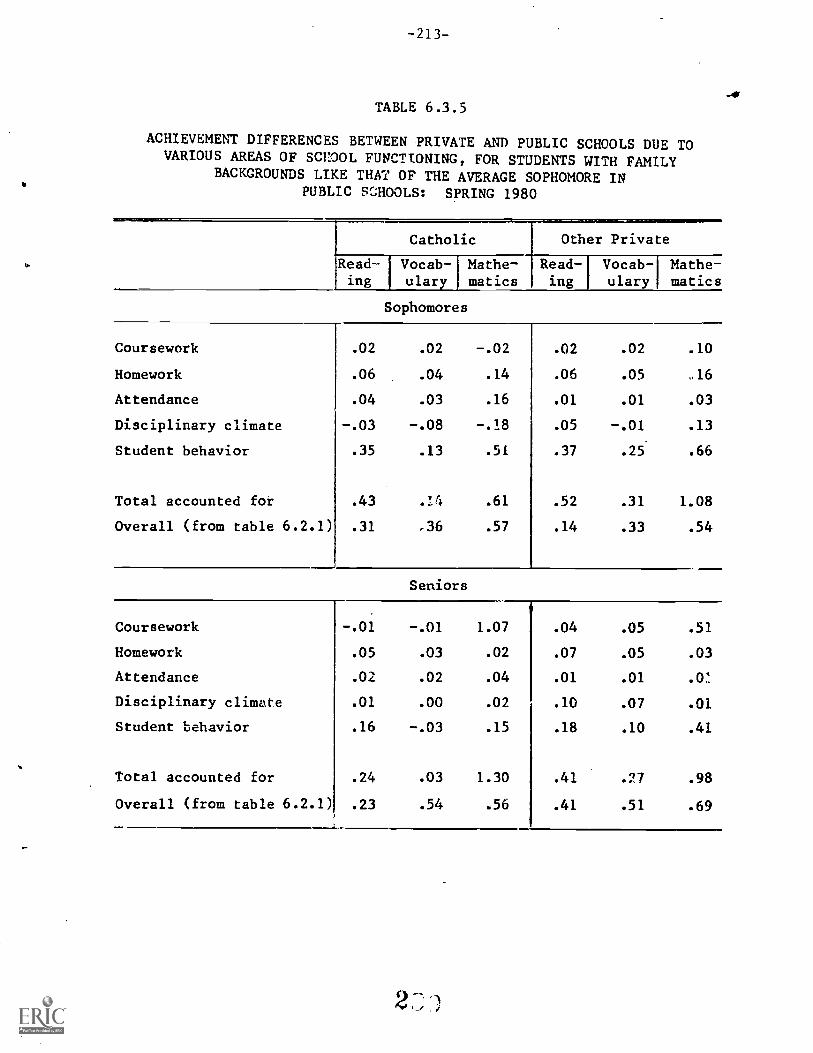
-213-
TABLE 6.3.5
ACHIEVEMENT DIFFERENCES BETWEEN PRIVATE AND PUBLIC SCHOOLS DUE TOVARIOUS AREAS OF SCKOOL FUNCTIONING, FOR STUDENTS WITH FAMILY
BACKGROUNDS LIKE THAT OF THE AVERAGE SOPHOMORE INPUBLIC SCHOOLS: SPRING 1980
Catholic
Read- I Vocab-ing ulary
Mathe-matics
Sophomores
Coursework
Homework
Attendance
Disciplinary climate
Student behavior
.02 .02 -.02
.06 .04 .14
.04 .03 .16
-.03 -.08 -.18
.35 .13 .51
Total accounted for .43 .61
Overall (from table 6.2.1) .31 ,36 .57
Other Private
Read-ing
Vocab-I Mathe-ulary matics
.02 .02 .10
.06 .05 .16
.01 .01 .03
.05 -.01 .13
.37 .25 .66
.52 .31 1.08
.14 .33 .54
Seniors
Coursework -.01 -.01 1.07 .04 .05 .51
Homework .05 .03 .02 .07 .05 .03
Attendance .02 .02 .04 .01 .01 .fr
Disciplinary climate .01 .00 .02 .10 .07 .01
Student behavior .16 -.03 .15 .18 .10 .41
Total accounted for .24 .03 1.30 .41 .27 .98
Overall (from table 6.2.1) .23 .54 .56 .41 .51 .69
-214-
but are not included in tilt! analysis. It is clear that the present
analysis is imperfect, certainly excluding some fc-.tors that either
augment or depress achievement in the -ublic schools. 1
Despite the existence of some puzzling differences between the
overall differences and the total accounted for, the results shown in
table 6.3.5 give an idea of the sources of the difference in achievement
between the public and private sectors. Differences in the level of
homework account for a small but consistent part of the differences
in achievement; differences in the student's own attendance patterns
account for a smaller part. The effects of differences in the discipli-
nary climate are inconsistent in direction and size. The effects of
coursework are difficult to assess, since the measurement is weak except
in the senior year for mathematics, where the taking of specific courses
was measured and where the effect of coursework on achievement was found
to be great. The one area in which the effect of public-private differences
is most consistently strong is student behavior (with one inconsi-tency,
in the senior vocabulary test for the Catholic-public comparison).
The effect of student behavior is considerably stronger at the
sophomore level than at the senior level. This could reasonably be
true for either of two reasons, one purely technical, the other sib
stantive. The technical reason is that the measures of student behavior
problems are based on sophomore perc °ption of problems, and thus should
reflect behavior problems among sophomores more than among seniors.
Insofar as these problems differ in the two gras of the same school,
one would expect a Lower relation of the perceived problems to senior
1iThis is especially true for advanced mathematics courses, where
the regression coefficient is 1.40 in the private sector and 1.51 inthe public -0-i-or.
-215
achievement than to sophomore achievement. The substantive reason is
that the sophomore year is before the end of compulsory education for
many students. Thus in some schools there are a number of students
who are uninterested in school, behave poorly, and perform poorly on
tests like those given as a part of the survey. In the senior year,
many of there students are missing, having dropped out, and the remaining
behavior problems are less associated with achievement. Without further
data, it is not possible to distinguish between these two possible
reasons for the lower effects at the senior level.
These measures of student behavior are school-level measures
and it is important to clarify exactly what they refer to. To some
degree, the student's own behavior is statistically controlled through
the two measures of the student's own attendance, which constitute area
3 in the table. If the student's own behavior were fully controlled
statistically, we could attribute this student behavior effect wholly
to the effect of behavior problems among other students on the stude.t's
own achievement. As it is, such an inference is somewhat speculative.
since the student's own behavior is not well controlled statistically.
Yet the indication is there that the cffect may be not only through
the interference of the student's misbehavior on that same student's
achievement, but also through the general level of behavior disorder
on t%e achievement of even those students whose behavior is good.'
1It of fully clear just what is measured by these perceptions
of student bt ior. They are not direct measures of the actual ratesof behavior problems, and they may be measures of some more subtle differencein the disciplinary character of the school. We conducted a partialtest of this question fox t.' of the four measures osed in this analysis.Direct measures from the students are available for absenteeism andcutting classes. For each student we calculated a measure of the averageabsenteeism and percent who cut classes among the students in that student'sschool who were in the survey, excluding the student's own responsesto these two questions. Tha effects of these tw.) measures of: attendance,
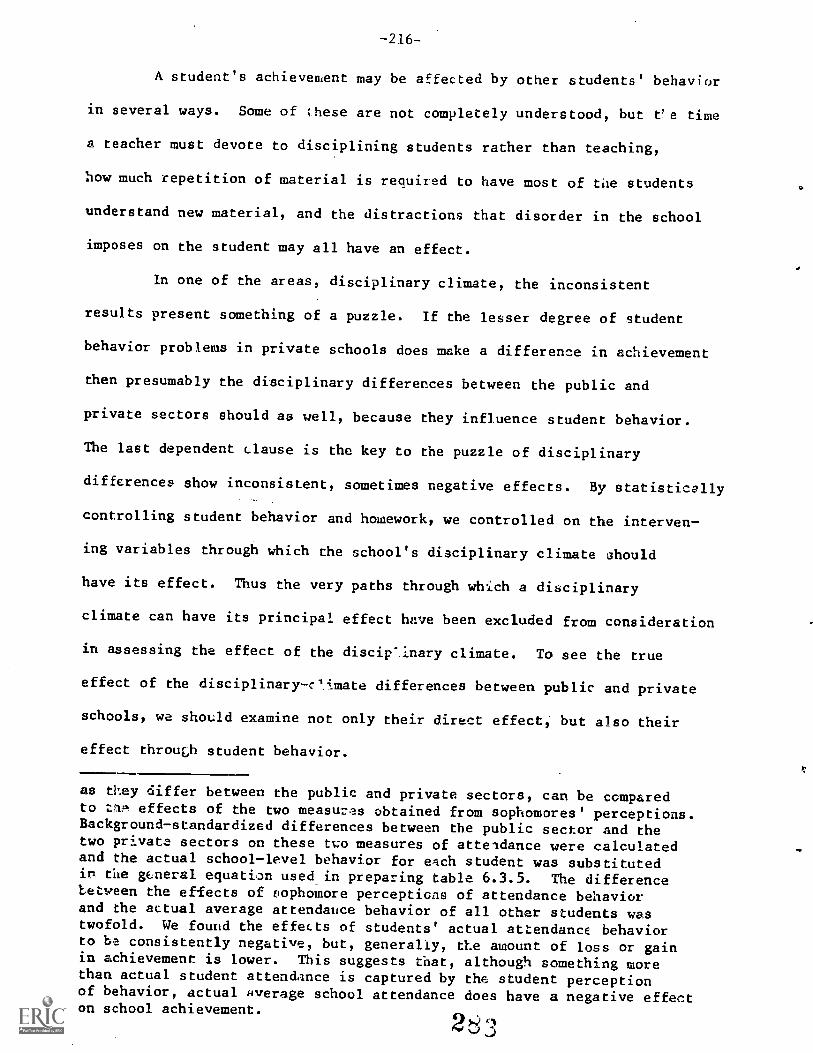
-216 -
A student's achievement may be affected by other students' behavior
in several ways. Some of these are not completely understood, but t'e time
a teacher must devote to disciplining students rather than teaching,
how much repetition of material is required to have most of the students
understand new material, and the distractions that disorder in the school
imposes on the student may all have an effect.
In one of the areas, disciplinary climate, the inconsistent
results present something of a puzzle. If the lesser degree of student
behavior problems in private schools does make a difference in achievement
then presumably the disciplinary differences between the public and
private sectors should as well, because they influence student behavior.
The last dependent clause is the key to the puzzle of disciplinary
differences show inconsistent, sometimes negative effects. By statistically
controlling student behavior and homework, we controlled on the interven-
ing variables through which the school's disciplinary climate should
have its effect. Thus the very paths through which a disciplinary
climate can have its principal effect have been excluded from consideration
in assessing the effect of the discip-inary climate. To see the true
effect of the disciplinary-climate differences between public and private
schools, we should examine not only their direct effect but also their
effect through student behavior.
as they differ between the public and private sectors, can be comparedto taP effects of the two measures obtained from sophomores' perceptions.Background-standardized differences between the public sector and thetwo private sectors on these two measures of attendance were calculatedand the actual school-level behavior for each student was substitutedin the general equation used in preparing table 6.3.5. The differenceLetween the effects of sophomore perceptions of attendance behaviorand the actual average attendance behavior of all other students wastwofold. We found the effects of students' actual attendance behaviorto be consistently negative, but, generally, tLe amount of loss or gainin achievement is lower. This suggests that, although something morethan actual student attendance is captured by the student perceptionof behavior, actual average school attendance does have a negative effecton school achievement.
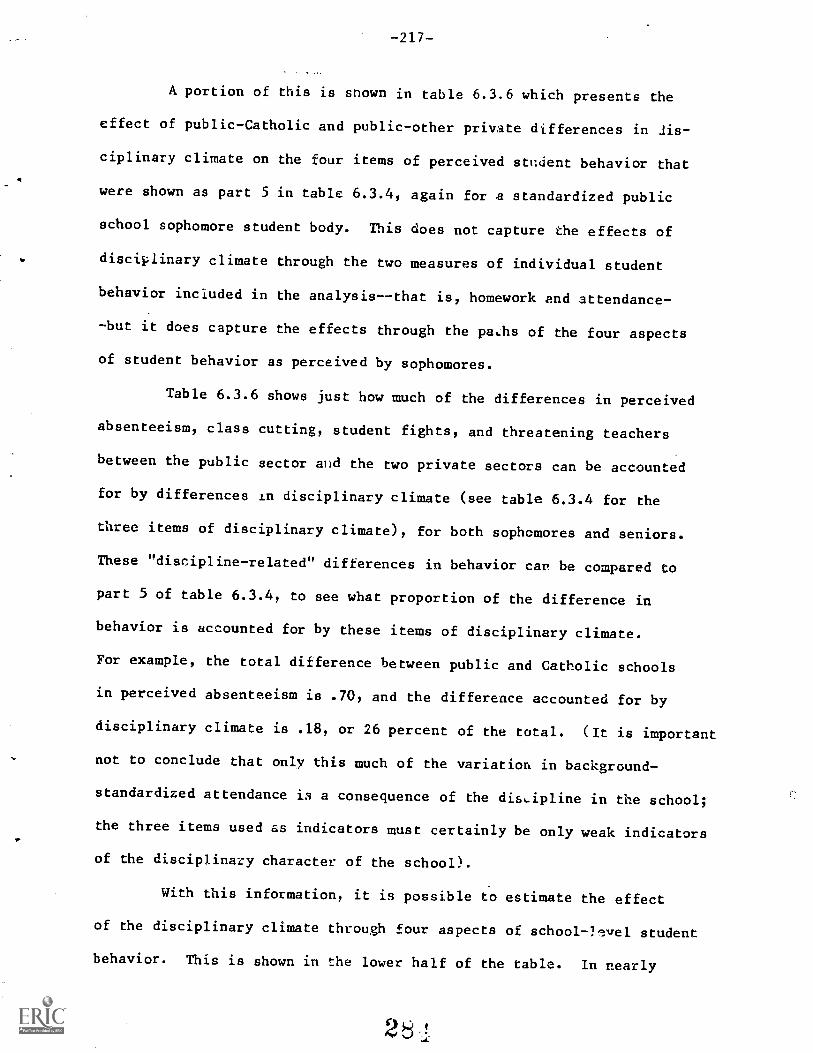
-217-
A portion of this is shown in table 6.3.6 which presents the
effect of public-Catholic and public-other private differences in dis-
ciplinary climate on the four items of perceived student behavior that
were shown as part 5 in table 6.3.4, again for a standardized public
school sophomore student body. This does not capture the effects of
disciplinary climate through the two measures of individual student
behavior included in the analysis--that is, homework and attendance-
-but it does capture the effects through the pa,hs of the four aspects
of student behavior as perceived by sophomores.
Table 6.3.6 shows just how much of the differences in perceived
absenteeism, class cutting, student fights, and threatening teachers
between the public sector and the two private sectors can be accounted
for by differences in disciplinary climate (see table 6.3.4 for the
three items of disciplinary climate), for both sophomores and seniors.
These "discipline-related" differences in behavior car be compared to
part 5 of table 6.3.4, to see what proportion of the difference in
behavior is accounted for by these items of disciplinary climate.
For example, the total difference between public and Catholic schools
in perceived absenteeism is .70, and the difference accounted for by
disciplinary climate is .18, or 26 percent of the total. (It is important
not to conclude that only this much of the variation in background-
standardized attendance is a consequence of the dis,..ipline in the school;
the three items used as indicators must certainly be only weak indicators
of the disciplinary character of the school).
With this information, it is possible to estimate the effect
of the disciplinary climate through four aspects of school-lIvel student
behavior. This is shown in the lower half of the table. In nearly
2
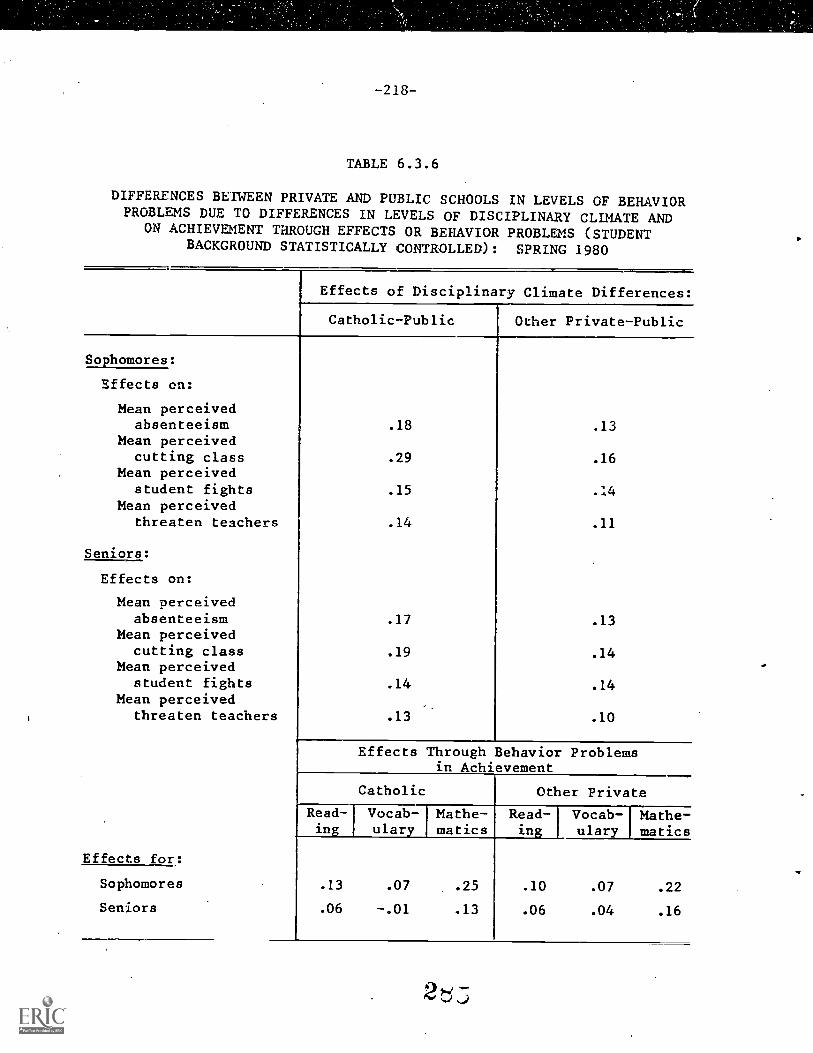
-218-
TABLE 6.3.6
DIFFERENCES BETWEEN PRIVATE AND PUBLIC SCHOOLS IN LEVELS OF BEHAVIORPROBLEMS DUE TO DIFFERENCES IN LEVELS OF DISCIPLINARY CLIMATE AND
ON ACHIEVEMENT THROUGH EFFECTS OR BEHAVIOR PROBLEMS (STUDENTBACKGROUND STATISTICALLY CONTROLLED): SPRING 1980
Effects of Disciplinary Climate Differences:
Catholic-Public Other Private-Public
Sophomores:
Effects on:
Mean perceivedabsenteeism
Mean perceivedcutting class
Mean perceivedstudent fights
Mean perceivedthreaten teachers
Seniors:
Effects on:
Mean perceivedabsenteeism
Mean perceivedcutting class
Mean perceivedstudent fights
Mean perceivedthreaten teachers
Effects for:
Sophomores
Seniors
.18
. 29
.15
.14
.17
.19
.14
. 13
. 13
.16
2.4
.11
. 13
.14
. 14
.10
Effects Through Behavior Problemsin Achievement
Catholic Other Private
Read-ing
Vocab-ulary
Mathe-matics
Read-ing
.13 .07 .25
.06 -.01 .13
Vocab-I Mathe-ulary matics
.10 .07 .22
.06 .04 .16
-219--
all cases, the positive effects of disciplinary climate through student
behavior outweigh the negative direct effects shown in table 6.3.5.
Thus, through the the aspects of behavior shown in table 6.3.6 the
disciplinary-climate differences between the public and private sectors
lead to greater achievement in the private sectors, though the imperfections
of measurement have very likely masked part of the effects.
6.4 Summary of Educational Outcomes
This section has examined two kinds of outcomes in public and
private schools: cognitive outcomes, as measured by standardized test
scores in reading, vocabulary, and mathematics; and plans for after
high school,,primarily plans for further education. The first question,
.in section 6.1, was just how the sectors differ in these respects.
The second question, in seu.!.4on 6.2, was whether being in a private
school made any difference in cognitive achievement or educational
aspirations, or whether the greater achievement and aspirations in the
private sector were wholly due to selectivity. The third question,
in section 6.3, was, given the greater cognitive achievement in private
schools, and given the strong evidence from section 6.2 that private
schools have an effect in increasing achievement, what are the mechanisms
through which that greater achievement comes about?
The answer to the first question is that achievement is somewhat
higher, in both the sophomore and senior years, in Catholic schools
and in other private schools than it is in public schools. Achievement
in the high-performance private schools is considerably higher than
that in the high-performance public schools, but both are higher than
in either of the private sectors.
-220-
The differences between sectors in educational expectations
and aspirations are similar to the differences in achievement. The
sectors are ordered in the same way, with public school students having
the lowest educational aspiratioas and those in the high-performance
private schools having the highest aspirations. For the other post-
secondary activity, work, the order is reversed. Among seniors who
planned to work full time after graduation, a higher proportion in the
public schools already had a job lined up. This suggests that the
greater vocational resources and opportunities in the public schools,
as shown in chapter 4, lead to a better connection with the world of
work for those students who are going into the full-time labor force.
The second question, which attempted to separate effects of
private schools on achievement and aspirations from selection into
private schools, is examined in several ways. In the examination of
effects on achievement, statistical controls on family background are
introduced, in order to control on those background characteristics
that are most related to achievement. A large number of background
characteristics is introduced, to insure that the selectivity-related
differences are controlled for. The achievement differences between
the private sectors and the public sector are reduced (more for other
private schools than for Catholic schools), but differences remain.
Then there is an examination of imputed growth from the sophomore to
the senior year. In a first examination of differential growth, the
Catholic schools appear to show about the same growth rates for students
comparable to the average public school sophomore and the other private
schools about a 25 percr!',' higher growth rate. This, however, is sub-
ject to the serious problem of differential dropout in different sectors.
-221-
The high rate of dropouts in the public sector, which, if present, would
expand the senior class by 31 percent, indicates that the sophomore-
senior growth rate in the public schools is considerably overestimated.
The dropout rates in Catholic and other pri-rate schools are less than
half as great, indicating much less bias in the estimates of their
growth rates. When the dropout bias is taken into account, with an
assumed distribution of achievement among the dropouts, the estimated
learning rate is considerably higher in both private sectors than in
the public sector. Thus the indication is that there is a non-trivial
effect of the Catholic and other private schools in bringing about
higher cognitive achievement, wholly apart from their selectivity.
In addition, there is a major difference in homogeneity of
achievement between Catholic schools on the one hand and public and
other private schools on the other. Students of parents with different
educational backgrounds achieve at more nearly comparable levels in
the Catholic schools than in the public schools, while the achievement
levels are even more divergent in other private schools than in the
public schools. And comparison of blacks and Hispanics in Catholic
and public schools (controlling on parental income and education) reveals
that as sophomores these minority students achieve at a level closer
to that of non-Hispanic whites in Catholic schools than in public schools;
the achievement gap between minorities and non-Hispanic whites as seniors
decreases slightly in Catholic schools, while it increases slightly
in public schools. Altogether, the evidence is strong that the Catholic
schools function much closer to the American ideal of the "common school,"
educating children from different backgrounds alike, than do the public
schools.
2)")J
-222-
Turning to educational aspirations, the question arises whether
the private-public difference is wholly due to selection or is in part
due to effects of the sector. Statistical controls on family background
leave a difference, with students in Catholic schools showing especially
high aspirations. No differential sophomore-senior growth is found,
except for lower growth in Catholic schools. This result is suspect,
however, because of a ceiling effect due to the higher level of aspira-
tions among Catholic school sophomores. Using the same reasoning about
dropouts as was used in the case of cognitive achievement, it appears
that there is a positive effect, non-trivial in size, of being in a
Catholic or other private school on educational aspirations. An analysis
that uses retrospective reports of seniors and sophomores about expectations
of attending college in earlier years confirms this, through evidence
that the proportion planning to attend college increases more in the
private sectors than in public sector.
Again, the Catholic schools show much greater homogeneity in
the educational aspirations among students from different parental
education backgrounds than do other schools. Here the other private
schools are intermediate and the public schools are at the extreme,
public school students with low educational backgrounds being furthest
from those with high educational backgrounds in their own educational
aspirations.
The third question is a question about what differences between
public and private schools are responsible for the additional achieve-
ment that occurs in the private schools. The answer to this is only
partial, because the investigation covered only selected differences.
But the partial answer is fairly cleat.4 t ')
-223-
There are at least two important ways in which private schools
produce higher achievement outcomes than public schools. First, given
the same type of student (i.e., vith background standardized), private
schools create higher rates of engagement in academic activities.
School attendance is better, students do more homework, and students
generally take more rigorous subjects (i.e., more advanced mathematics).
The first two of these factors provide modestly greater achievement
in private schools. The third, taking advanced mathematics courses,
brings substantially greater achievement. The indication is that more
extensive academic demands are made in the private schools, leading
to more advanced courses and 'thus to greater achievement. This is a
somewhat obvious conclusion, and the statisti;a1 evidence supports it.
Second, student behavior in a school has strong and consistent effects
on student achievement. Apart from mathematics coursework for seniors,
the greatest differences in achievement between private and public
schools are accounted for by school-level behavior variables (i.e.,
the incidence of fights, students threatening teachers, etc.). The
disciplinary climate of a school, that is, the effectiveness and fairness
of discipline and teacher interest, affect achievement at least in part
through their effect on these schoollevel behavior variables.
Although these answers are only partial, in that additional
sc. aol factors may also explain the different outcomes in the sectors,
they st:ongly suggest that school functioning makes a difference in
achievfment outcomes for the average student. And private schools of
both 'sectors appear to function Letter in the areas that contribute
to achievement.
2
CHAPTER 7
CONCLUSION
In chapter 1 of this report, we examined a number of premises
underlying policies that would increase the role of private schools
and a number underlying policies that would decrease their role. Perhaps
the best way to conclude is to review those premises, to see just which
premises this report has provided evidence on, and what can be concluded
from the evidence about each premise. In addition, other results were
found along the way, some of which provide additional information that
bears upon the overall policy questions.
Premises underlying policies that would increase the role of
private schools:
1. Private schools produce better cognitive outcomes than dopublic schools (chapter 6).
The evidence from chapter 6 is that private schools do produce
better cognitive outcomes than public schools. When family background
factors that predict achievement are controlled students in both Catholic
and other private schools are shown to achieve at a higher level than
students in public schools. The difference at the sophomore level,
which was greater for Catholic schools than for other private schools,
ranged from about a fifth of the sophomore-senior gain to about two-
thirds the size of that gain (i.e., from a little less than half a year's
difference to something more than one year's difference). This evidence
is subject to a caveat: despite extensive statistical controls on parental
background, there may very well be other unmeasured factors in the sell-
selection into the private sector that are associated with higher a
achievement. 2",,.
-225-
When wt. examined gains from the sophomore to the senior year
in the three sectors, the first evidence was that students from comparable
backgrounds make greater gains in other private schools than in public
schools, but that students in Catholic schools do not. However, the
much greater sophomore- senior dropout in public schools than in either
the Catholic or other private schools shows that the apparent public
school gains have a considerable upward bias, leading to the conclusion
that greater cognitive growth occurs between the sophomore and senior
years in both private sectors than in the public sector.
A caveat to all these results is shown by the high-performance
public and private schools. Performance was much higher in both of
these sets of schools, than in any of the three sectors (section 6.1),
although these schools could not be separately studied in the extended
analysis of section 6.2 because of ceiling effects in achievement scores.
2. Private schools provide better character and personality develop-ment than do public schools (chapter 5).
Little evidence on character and personality development was
provided in this report. However, students in other private schools
show both higher levels of self-esteem and fate control than sophomores
and higher gains from the sophomore to senior year than students in
public or Catholic schools. The inference that there is greater growth
on these dimensions in other private schools is strengthened by the
fact that students in high-performance private schools showed even
higher levels as sophomores, and similarly high sophomore-senior gains,
while students in high-performance public schools did not, despite the
fact that the parental backgrounds of students in the latter schools
are higher than those in other private schools. The fact that the other
-226 -
private and high-performance private schools have less than half the
student-teacher ratio than schools in the other sectors suggests that
the difference might be due to this.
3. Private schools provide a safer, more disciplined, and moreordered environment than do public schools.(chapter 5).
The evidence is strong that this premise is true. The greatest
difference found in any aspect of school functioning between public
and private schools was in the degree of discipline and order in the
schools (sections 5.3, 5.4). The Catholic and other private schools
appear somewhat different in their discipline, and behavior profiles,
with students in other private schools reporting more absences and class
cutting but also more homework, fewer fights among students, and greater
teacher interest in students. However, in all these respects, both
sectors showed greater discipline and order than the public schools.
4. Private schools are more successful in creating an interestin learning than are public schools (chapter 5)
There is little evidence to confirm or disconfirm this premise
in the report. The sectors differ only slightly in student responses
to the two direct questions concerning interest in school, and there
is not much to be inferred from indirect evidence presented in the
report.
5. Private schools encourage interest in higher education andlead more of their students to attend college. than do publicschools with comparable students (chapter 6).
The evidence on this premise is toward a positive answer, but
it is not extremely strong .vidence. There is some evidence that students
have higher college aspirations and expectations in private schools
than do students from comparable backgrounds in public schools (Table 6.2.).
3
-217-
The report contains no evidence on this premise.
6. Private schools are smaller and thus fazing about greater degreesof participation in sports and other a,ttivities than do publicschools (chapter 5).
The evidence shows that this premise is true for other private
schools, but not for Catholic schools (though Catholic school students
report highest school spirit, and other private school students lowest);
The fact that Catholic schools are smaller in size than public schools
does not result in increased participation in extracurricular activities.
In addition, participation grows between the sophomore and senior years
in other private schools, while it declines slightly in Catholic and
public schools.
7. Private schools have smaller class size, and thus allow teachersand students to have greater contact (chapter 4).
The other private schools have sharply lower student-teacher
ratios than the public schools, while the Catholic schools have slightly
higher ratios. There are fewer than half the students per teacher in
other private schools than in public or Catholic schools (Table 4.2.1).
No direct evidence on contact between students and teachers is presented.
8. Private schools are more efficient than public schools, accom-plirhing their task at a lower cost.
The report contains no evidence on this premise.
Premises underlying policies that would decrease mne role of
private schools:
1. Private schools are socially divisive along income lines, creamingthe students from higher income backgrounds, and segregatingthem into elite schools (chapter 3).
The evidence on this premise wcrks in two directions. First,
among the three major sectors, the other private schools contain students
from somewhat higher income backgrounds and the Catholic schools contain
-228-
students from slightly higher income backgrounds than the public schools.
The differences are primarily at the highest and lowest income levels,
with all three sectors having a majority of students in a broad middle
income category ranging from $12,000 tc $38,000 a year, and similar
proportions at different levels within this range. Second, the internal
segregation by income within each sector goes in the opposite direction,
with'the public sector showing slightly higher income segregation than
either the Catholic or other private sectors. However, income segrega-
tion is not high within any sector. The end result of these two forces
acting in opposite directions is that U.S. schools as a whole show
slightly greater segregation by income than would be the case if private
school students of differing income levels were absorbed into the public
schools in the same wy that public school students of differing income
levels are currently distributed among schools.
2. Private schools are divisive along religious lines, segregatingdifferent religious groups into different schools (chapter 3).
The evidence is strong that this is true. Besides the 30 percent
of private schools that are Catholic, enrolling 66 percent of all private
school students, 25 percent of private schools, enrolling 12 percent
of private school students, are affiliated with other religious denominations.
Examining religious segregation sole.ky in the Catholic /non- -Catholic
dimension, the report shows that the great majority of Catholics are
in public schools, but that over 90 percent of the students in Catholic
schools are Catholic. Within each sector, the Catholic/non-Catholic
segregation is least in the Catholic schools themselves, greatest in
the other private schools. The overall impact of the between-sector
segregation and die differing segregation within sectors is, as might
2
-299-
be expected, that schools in the United States are more segregated along
Catholic/non-Catholic lines than they woula be if private school students
were absorbed into the public schools.
3. Private schools are divisive along racial lines, in two ways:they contain few blacks or other minorities, and thus segregatewhites in private schools from blacks in public schools; and theprivate sector itself is more racially segregated than the publicsector (chapter 3).
The evidence shows that the first of these premises is true
with respect to blacks but not with respect to Hispanics and that the
second is not true with respect to blacks or Hispanics. The end result
with respect to Hispanics is that the segregation of U.S. schools is
little different from what it would be if there were no private schools.
Catholic schools enroll about half as high a proportion of blacks
as the puolic schools, and other private schools only about a quarter
as high a proportion. Internally, however, the other private sector
is least racially segregated and the public sector by fax the most
segregated. The end result of these two opposing forces, between-sector
and within-sector, is that the segregation of black and white students
iii U.S. schools is no greater and no less than it would be'if there
were no private schools, and their students were absorbed into the public
sector, distributed among schools as public sector black and white students
are now distributed.
4. Private schools do not provide the educational range that publicschools do, particularly in vocational and other nontraditionalcourses or programs (chapter. 4).
The evidence on this premise is that it is correct. Schools
in both the Catholic and other private sectors provide primarily academic
programs and have few vocational or technical courses. Even in academic
areas, however, some of the smaller schools in the other private sector
have a limited range of subjects, as evidenced by the fact that 44 percent
2
-230
of students in the other private sector are in schools with no third-
year foreign language courses. The lesser educational range of the
private sector is also shown by the more c'mprehensive character of
the high-performance public schools compared to the high-performance
private schools.
5. Private schools have a narrower range of extracurricularactivites, and thus deprive their students of participationin school activities outside the classroom (chapter 5).
This premise is almost the direct opposite of premise 7 or the
other side, so the answer is the same as was given there. Students
in Catholic and public schools show about the same amount of participation
in extracurricular activities, while students in other private schools
show more, and participation is higher for seniors than for sophomores
Thus this premise is not correct.
6. Private schools are unhealthily competitive, and thus publicschools provide a healthier affective development (chapter 5).
The report provides no direct evidene on this premise, but
the indirect evidence suggests that something like the reverse is true
for the comparison between the other private and public schools. Self-
esteem and fare control are both higher in other private schools than
in public schools, and the sophomore-senior gain is greater.
7. Facilitating the use of private schools aids whites more thanblacks and those better off financially at the expense of thoseworse off; as a result, it increases racial and economic segrega-tion (chapter 3).
An examination of the predicted effect of a $1,000 increase
in income for all income groups shows that this would increase the
proportion of blacks and Hispanics in the private sector, as well as
the proportion of students from lower income families. Because a tuition
tax credit or a school voucher would even more greatly facilitate private
-231--
school enr.111ment for students from lower income families relative to
studerLs from higher income families, we can expect that either of those
policies would even more greatly increase the proportion of blacks or
students from low-income backgrounds in the private sector (primarily
in the Catholic sector). If either of these policies failed to increase
the proportion of blacks or students from low-income families in private
schools relative to that in the public schools, then, overall, either
of these policies would provide greater financial benefit to whites
than to blacks, or to higher income than to lower income families, because
of the tuition reductions for parents of those students currently enrolled
in the private sector. If one considers only new entrants into the
private sector, the evidence from the hypothetical experiment, together
with the fact that a tuition tax credit or voucher plan would likely
be more progressive in its effect than a $1,000 increase in income,
indicates that blacks, Hispanics, and low-income families would differen-
tially benefit. To consider the educational rather than the financial
benefits means to consider only the new entrants into the private sector,
for it is only their education that would be changed; thus' blacks and
Hispanics would differentially benefit educationally.
The evidence indicates that facilitating use of private schools
through policies of the sort described above would not increase segregation
along racial or economic lines but would decrease it (though the evidence
indicates that religious segregation would increase). Such policies
would bring more blacks, Hispanics, and students from lower income back-
grounds into the private schools, thus reducing the between-sector segrega-
tion, and these students would be moving from a sector of high racial
segregation to a sector of low racial segregation, as well as from a
sector slightly higher in economic segregation to one slightly lower.
-232 -
Additional results relevant to the policy question of facilitating
or constraining use of public schools:
1. At middle and higher income level' the increase in probability
of enrollment of blacks with increase in income is higher than that
of whites. At virtually all income levels, both the probability of
enrollment of Hispanics and the increase in that probability with income
are higher than for non-Hispanic whites. Comparing Catholics with Catholics
and non-Catholics with non-Catholics shows that blacks have the highest
absolute rate of enrollment in Catholic schools, at low as well as high
income levels and among both Catholics and non-Catholics, while Hispanics
have the lowest rate. In other private schools, black enrollment is
low at all income levels except the very highest.
2. Catholic schools more nearly approximate the "common school"
ideal of American education than do public schools, in that the achieve-
ment levels of students from different parental educational backgrounds,
of black and white students, and of Hispanic and non-Hispanic white
students are more nearly alike in Catholic schools than in public schools.
In addition, the educational aspirations of students from different
parental educational backgrounds are more alike in Catholic than in
public schools. Comparing public and other private schools shows that
students in ether private schools with parents of differing education
have greater differences in scholastic achievement, while public school
students with differing parental education have greater differences
in educational aspirations.
3. Important factors in bringing about higher scholastic achievement
in private schools than in public schools are the greater academic demands
and more ordered environment in the private schools (section 6.3).
2uo
71.
-233-
The evidence shows not only that the sectors differ greatly on these
dimensions, but also that within the public schools students who are
better disciplined and are in schools with more ordered environments
achieve more highly.
It may or may not be useful to attempt to sum up the overall implica-
tions for the premises underlying policy arguments to facilitate or
constrain the use of private schools. Some of the premises on each
side are confirmed, some on each side are disconfirmed. It is hard,
however, to avoid the overall conclusion that the factual premises under-
lying policies that would facilitate use of private schools are much
better supported on the whole than those underlying policies that would
constrain their use. Or, to put it another way, the constraints imposed
on schools in the public sector (and there is no evidence that those
constraints are financial, compared with the private sector) seem to
impair their functioning as educational institutions, without providing
the more egalitarian outcomes that are one of the goals of public schooling.
APPENDIX A
STATISTICAL REFERENCES
301
A-1
A.1 Calculation of Standard Errors of Estimates
Neither standard errors nor confidence intervals are reported
in the tabulations and analyses of this report. Instead, this section
presents information that allows calculation of approximate standard
errors for most percentages based on stu&nt data.
The general equation for calcula:ing the approximate standard
error of a percentage is:
s.e.(p) = A 1100-p)/n
where p is the percentage for which the standard error is to be calcu-
lated; s.e.(p) is the approximate standard error of p; A is a correction
factor, which increases with the departure of the sample form a simple
random sample through clustering or other aspects of the sample design;
and n is the unweighted number of students in the partictAar class over
which the percentage is calculated. (For example, table 3.1.1 estimates
that 5.8 percent of sophomores in Catholic schools are black. The un-
weighted number of sophomores in Catholic schools, which is 2,831--see
table A.1.1 below--is the correct value of n for calculating the standard
error of this percentage. 1)
The values of A and n for classes on which most of the percent-
ages in this report are based are given in table A.1.1. When percentages
are based on different classifications or en subclassifications within
each cf these classifications, it is appropriate to use the subclass
1This does not take into account sample size reduction by non-'
response. Throughout the report, nonresponses are excluded from thebase on which the percentage is calculated. An approximate reductionof n for nonresponse can be determined from the marginals providedin "High School and Beyond Information for Users, Base Year (1980) Data,"available from NCES.
31
A-2
size together with the largest correction factor of those shown in the
table that could apply to the subclass.
The equation for calculating standard errors, together with
the data shown in table A.1.1, were used to calculate approximate stan-
dard errors for percentages of 50 percent, 10 percent, and 90 percent
(the latter two of which have the same standard error). These are given
in table A.1.2.
It should be emphasized that these standard errors are approx-
imations intended merely to provide guidance as to the confidence interval
around a percentage estimate, or the chance that a difference between
two percentages could be due to sampling error.
For estimation of approximate standard errors for data from
the school questionnaires, a conservative estimate can be obtained by
assuming A to be the same as for student data, and taking n from the
number of schools shown for the relevant class in table A.1.3; a non-
conservative estimate can be obtained by assuming A=1 for all classes
of schools.
A.2 Calculation of Measures of the Distributionof Students within Sectors
The measures employed in chapter 3 for describing variations
in student mix among schools within a sector are described below. The
measure of interracial contact within a sector is constructed as follows.
If we number the schools in the sector 1, ...k, ...n, and consider the
first school, there is a given proportion of whites in that school.
Call this piw. There is also a certain number of blacks in the school.
Call this nib. Then, for this number of blacks, the proportion of whites
in their school is piw. If we average this proportion over all schools,
weighting by the number of blacks, we obtain the desired measure, which
303
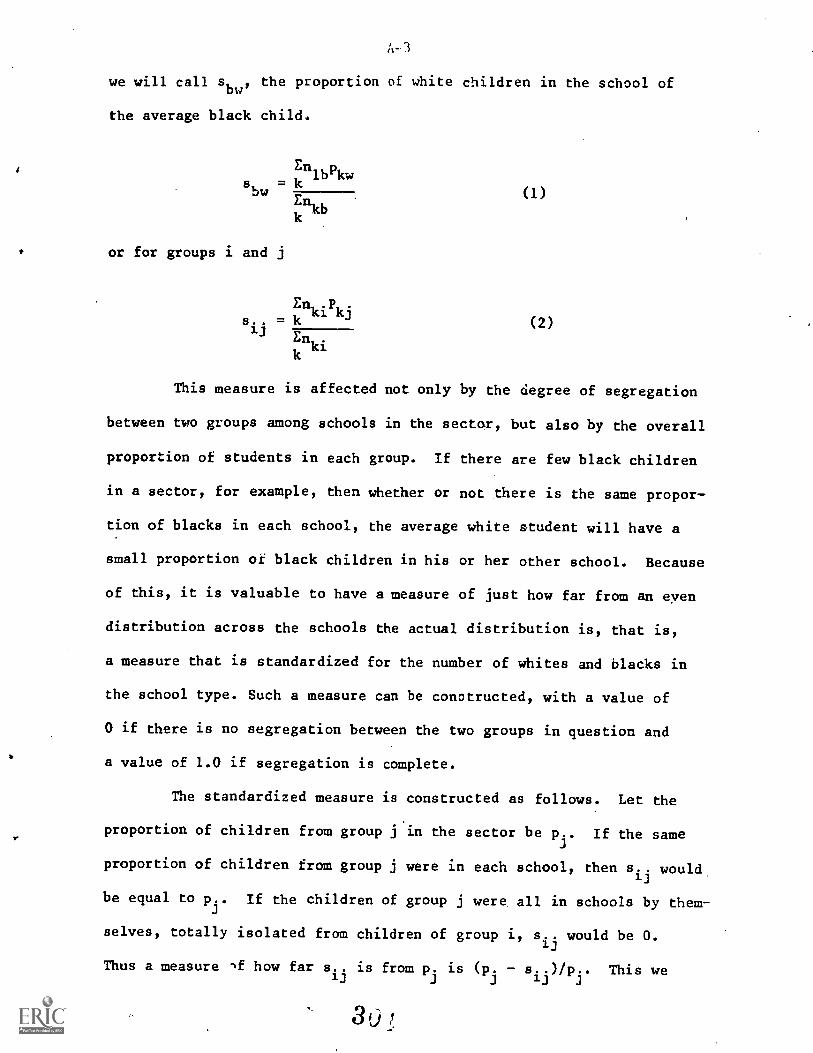
A-3
we will call sbw'
the proportion of white children in the school of
the average black child.
sbwEnkb
=En
lbpkw
or for groups i and j
E .PkJ
.
kis.. = k
n
13 Enki
(1)
(2)
This measure is affected not only by the degree of segregation
between two groups among schools in the sector, but also by the overall
proportion of students in each group. If there are few black children
in a sector, for example, then whether or not there is the same propor-
tion of blacks in each school, the average white student will have a
small proportion of black children in his or her other school. Because
of this, it is valuable to have a measure of just how far from an even
distribution across the schools the actual distribution is, that is,
a measure that is standardized for the number of whites and blacks in
the school type. Such a measure can be constructed, with a value of
0 if there is no segregation between the two groups in question and
*a value of 1.0 if segregation is complete.
The standardized measure is constructed as follows. Let the
proportion of children from group j in the sector be Pj If the same
proportion of children from group j were in each school, then s..ij
would
be equal to p.. If the children of group j were all in schools by them-
selves, totally isolated from children of group i, s..1J
would be 0.
Thusameasure,fhowfars..13 isfromp.is(Pj13
.-s..)/p.. This we3 3
3'j
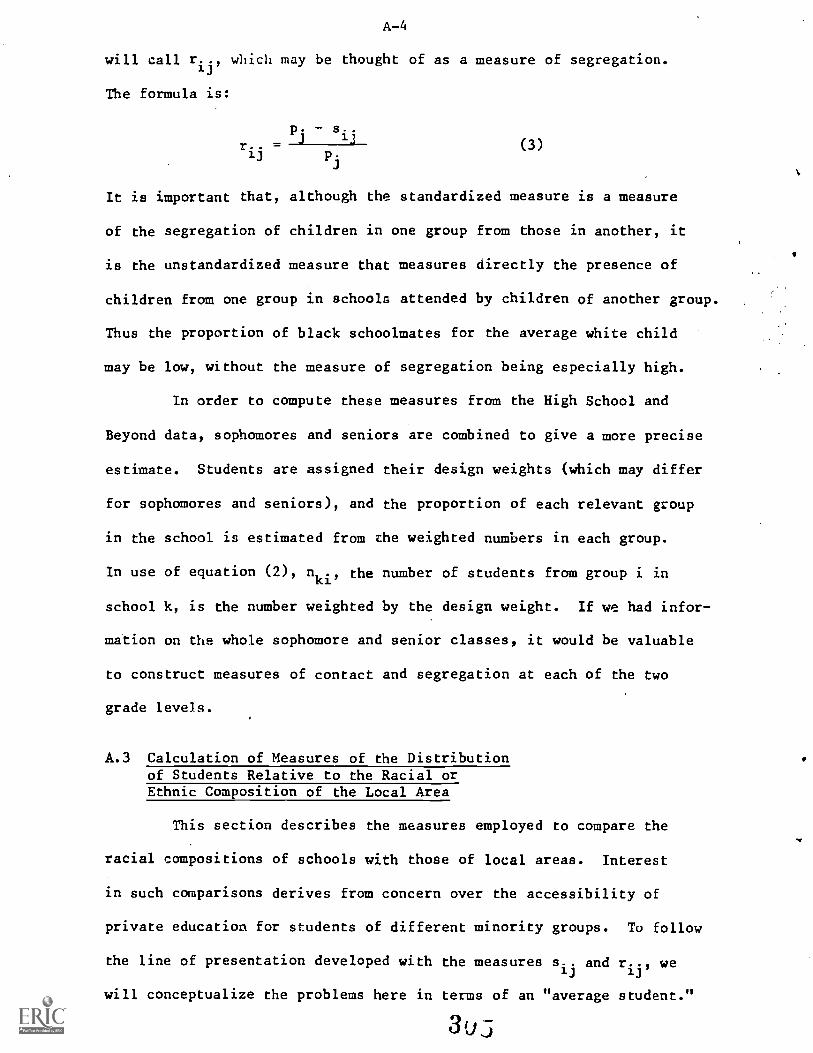
A-4
will call r..13 , which may be thought of as a measure of segregation.
The formula is:
r..
p. s..13
13 pi(3)
It is important that, although the standardized measure is a measure
of the segregation of children in one group from those in another, it
is the unstandardized measure that measures directly the presence of
children from one group in schools attended by children of another group.
Thus the proportion of black schoolmates for the average white child
may be low, without the measure of segregation being especially high.
In order to compute these measures from the High School and
Beyond data, sophomores and seniors are combined to give a more precise
estimate. Students are assigned their design weights (which may differ
for sophomores and seniors), and the proportion of each relevant group
in the school is estimated from the weighted numbers in each group.
In use of equation (2), nki, the number of students from group i in
school k, is the number weighted by the design weight. If we had infor-
mation on the whole sophomore and senior classes, it would be valuable
to construct measures of contact and segregation at each of the two
grade levels.
A.3 Calculation of Measures of the Distributionof Students Relative to the Racial orEthnic Composition of the Local Area
This section describes the measures employed to compare the
racial compositions of schools with those of local areas. Interest
in such comparisons derives from concern over the accessibility of
private education for students of different minority groups. To follow
the line of presentation developed with the measures13
s..13
and r.., we
will conceptualize the problems here in terms of an "average student."
3u5
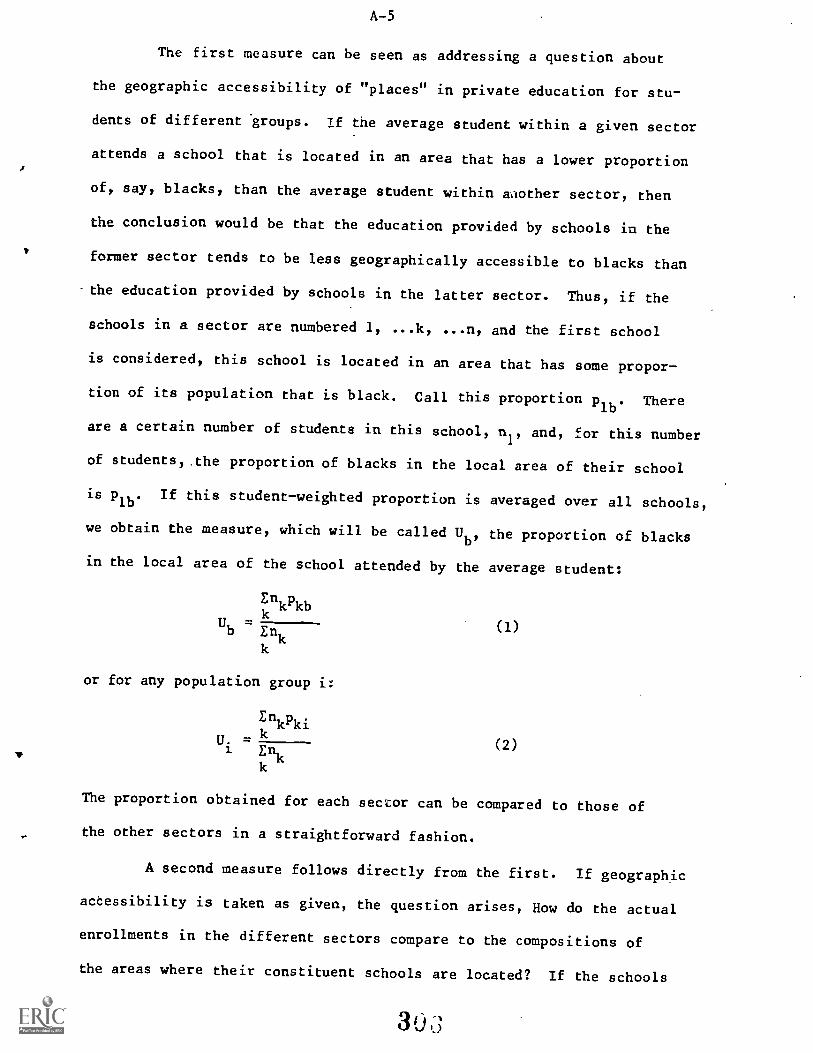
A-5
The first measure can be seen as addressing a question about
the geographic accessibility of "places" in private education for stu-
dents of different groups. If the average student within a given sector
attends a school that is located in an area that has a lower proportion
of, say, blacks, than the average student within another sector, then
the conclusion would be that the education provided by schools in the
former sector tends to be less geographically accessible to blacks than
-the education provided by schools in the latter sector. Thus, if the
schools in a sector are numbered 1, ...k, ...n, and the first school
is considered, this school is located in an area that has some propor-
tion of its population that is black. Call this proportion'lb' There
are a certain number of students in this school nl, and, for this number
of students, the proportion of blacks in the local area of their school
is plb. If this student-weighted proportion is averaged over all schools,
we obtain the measure, which will be called Ub' the proportion of blacks
in the local area of the school attended by the average student:
Enkpkb
U -b En
k
or for any population group i:
EnkPkiU.
Enkk
(1)
(2)
The proportion obtained for each sector can be compared to those of
the other sectors in a straightforward fashion.
A second measure follows directly from the first. If geographic
accessibility is taken as given, the question arises, How do the actual
enrollments in the different sectors compare to the compositions of
the areas where their constituent schools are located? If the schools
3u.3
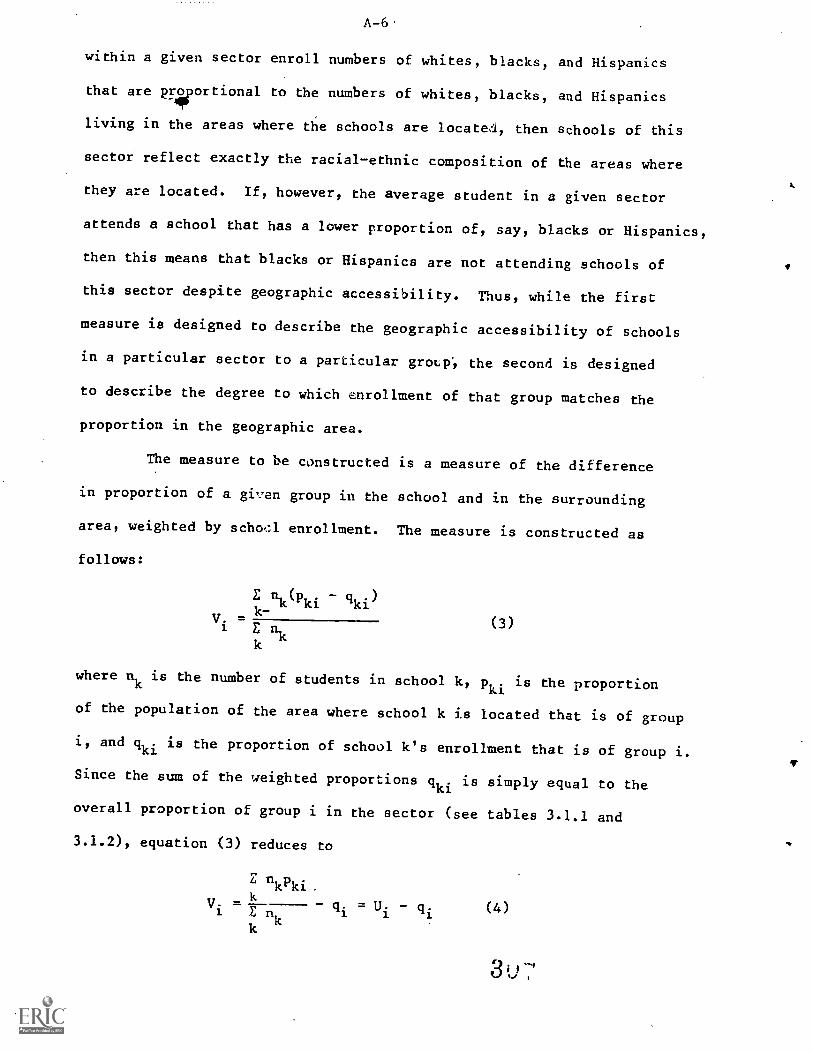
A-6.
within a given sector enroll numbers of whites, blacks, and Hispanics
that are priwortional to the numbers of whites, blacks, and Hispanics
living in the areas where the schools are locate, then schools of this
sector reflect exactly the racial-ethnic composition of the areas where
they are located. If, however, the average student in a given sector
attends a school that has a lower proportion of, say, blacks or Hispanics,
then this means that blacks or Hispanics are not attending schools of
this sector despite geographic accessibility. Thus, while the first
measure is designed to describe the geographic accessibility of schools
in a particular sector to a particular group, the second is designed
to describe the degree to which enrollment of that group matches the
proportion in the geographic area.
The measure to be constructed is a measure of the difference
in proportion of a given group in the school and in the surrounding
area, weighted by school enrollment. The measure is constructed as
follows:
k-nk(Pki clki)
V.E nk (3)
where nk is the number of students in school k, pki is the proportion
of the population of the area where school k is located that is of group
i, and qki is the proportion of school k's enrollment that is of group i.
Since the sum of the weighted proportions qki is simply equal to the
overall proportion of group i in the sector (see tables 3.1.1 and
3.1.2), equation (3) reduces to
nkpki
V. =k
1. 1 1.
q. = U. q.1 n (4)
u
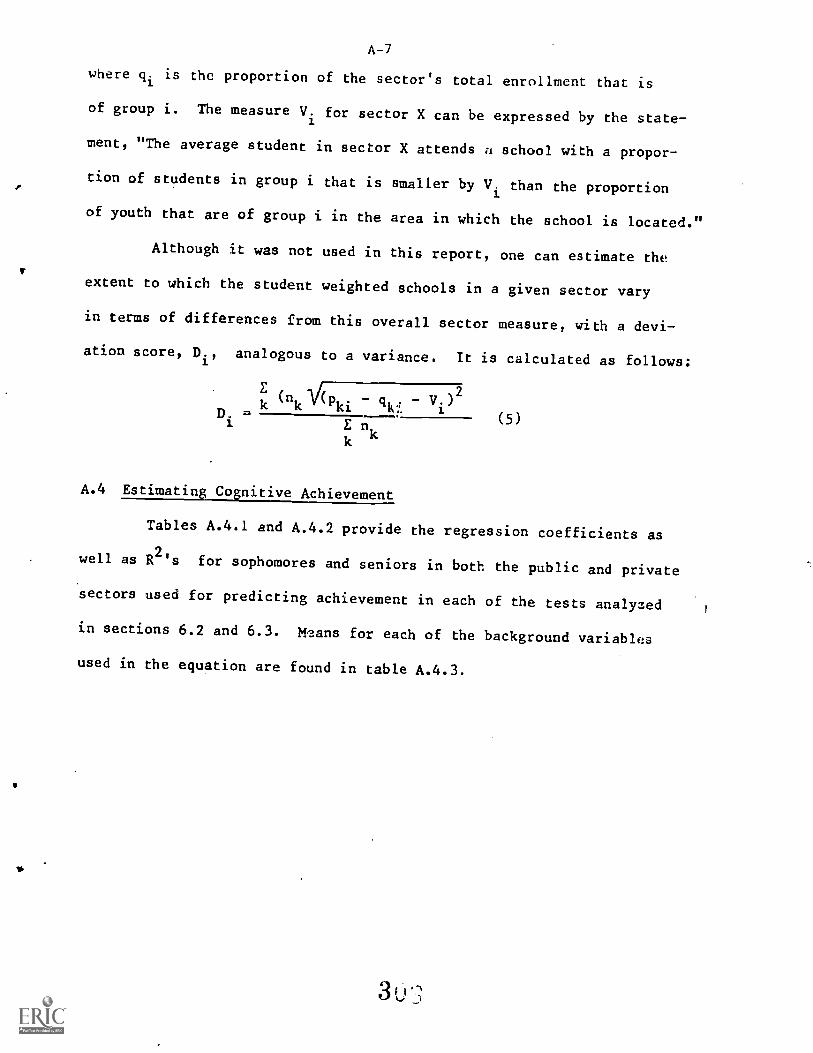
af.
A-7
where qi is the proportion of the sector's total enrollment that is
of group i. The measure Vi for sector X can be expressed by the state-
ment, "The average student in sector X attends u school with a propor-
tion of students in group i that is smaller by Vi than the proportion
of youth that are of group i in the area in which the school is located."
Although it was not used in this report, one can estimate the
extent to which the student weighted schools in a given sector vary
in terms of differences from this overall sector measure, with a devi-
ation score, Di, analogous to a variance. It is calculated as follows:
D.E n
)fip . q .k k Iv:.v.)
2
A.4 Estimating Cognitive Achievement
(5)
Tables A.4.1 and A.4.2 provide the regression coefficients as
well as R2's for sophomores and seniors in both the public and private
sectors used for predicting achievement in each of the tests analyzed
in sections 6.2 and 6.3. Means for each of the background variables
used in the equation are found in table A.4.3.
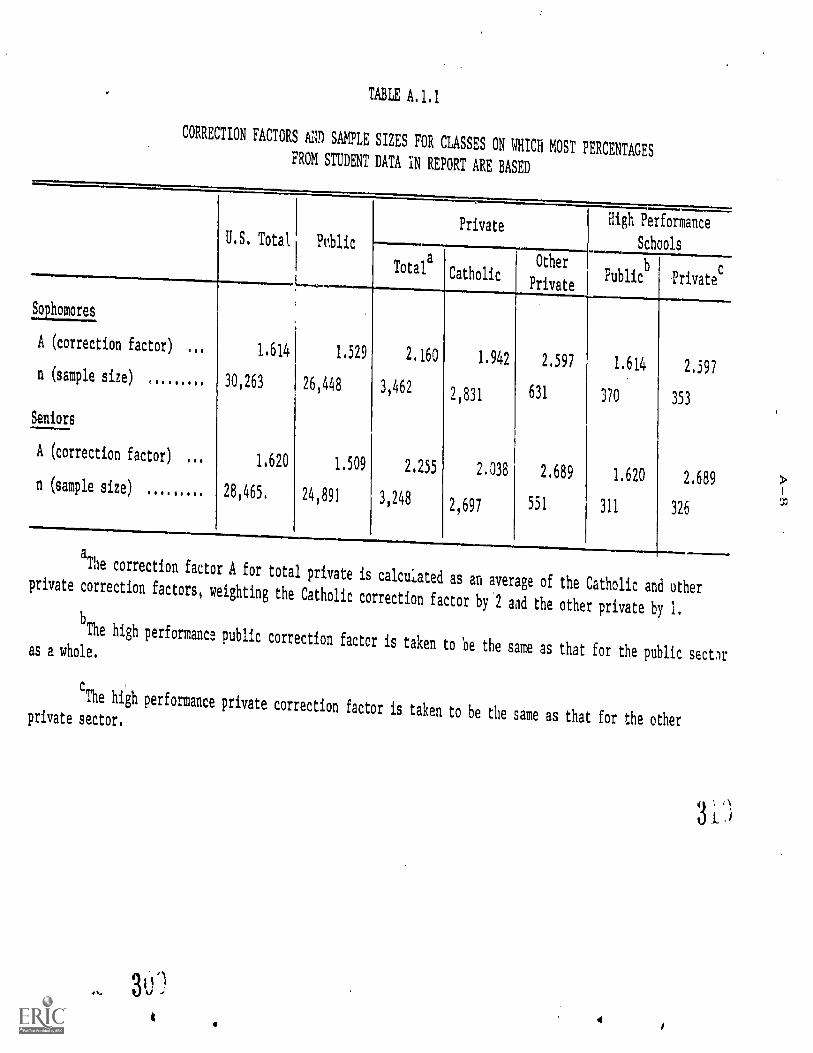
TABLE A.1.1
CORRECTION FACTORS AND SAMPLE SIZES FOR CLASSES ON WHICH MOST PERCENTAGESFROM STUDENT DATA IN REPORT ARE BASED
Sophomores
A (correction factor)1.6141 1.529 2.160
n (sample size)30,263 26,448 3,462
U.S. Total Pdlic
Total
Seniors
A (correction factor)
n (sample size)
Private
Catholic
1.942
2,831
High Performance
Schools
Ot
PrivatePublic
bPrivates
2.597 1.614 2.597
631 370 353
2.689 1.620 2,689
551 311 326
1,620 1.509 2.255
28,465. 24,891 3,248
2.038
2,697
aThe correction factor A for total private is calculated as an average of
private correction factors, weighting the Catholiccorrection factor by 2 and the
bThe high performance
public correction factor is taken to be the same asas a whole.
the Catholic and other
other private by 1.
that for the public sector
c
The high performanceprivate correction factor is taken to be the same as that for the otherprivate sector,
4
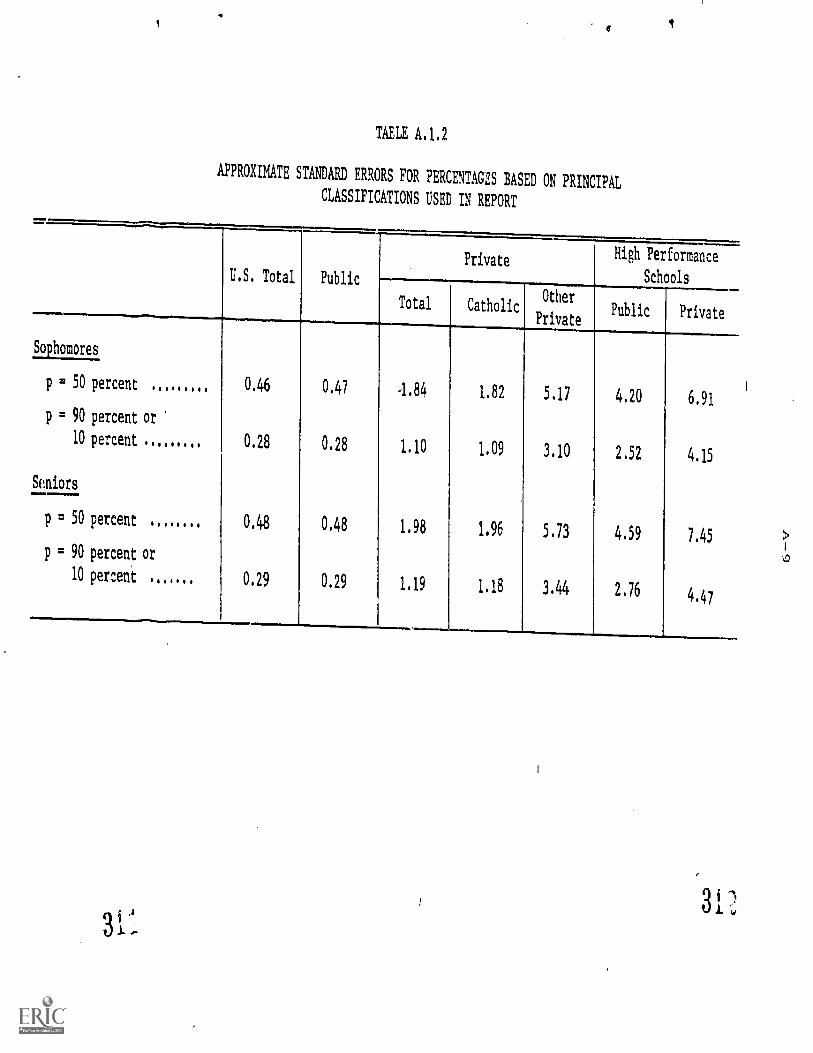
TABLE A.1.2
APPROXIMATE STANDARD ERRORS FOR PERCENTAGES BASED ON PRINCIPAL
CLASSIFICATIONS USED IN REPORT
Sophomores
p = 50 percent
p = 90 percent or
10 percent
Seniors
p = 50 percent
p = 90 percent or
10 percent
U.S. Total
Private High Performance
SchoolsPublic
Total CatholicOther
PrivatePublic Private
0.46 0.47 .1.84 1.82 5.17 4.20 6.91
0.28 0.28 1.10 1.09 3.10 2.52 4.15
0.48 0.48 1.98 1,96 5.73 4.59 7,45
0.29 0.29 1.19 1.18 3.44 2.76 4.47
1111M41INII..11.als~ MialM1.11
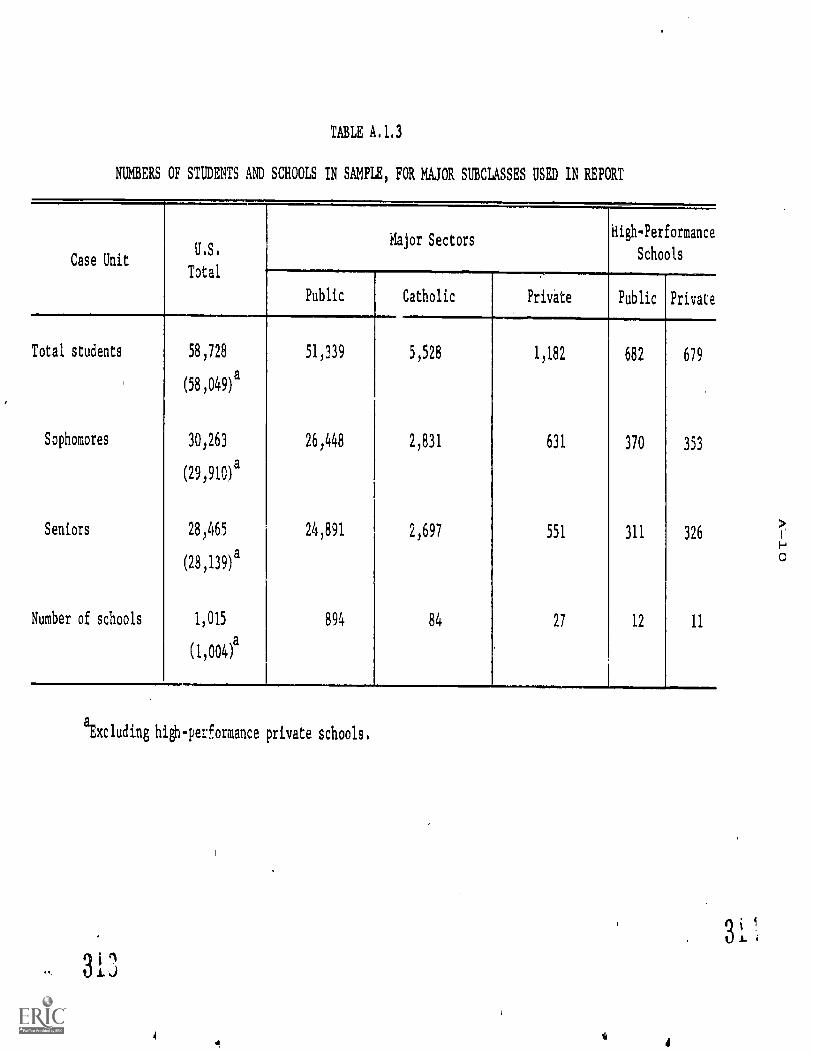
TABLE A,1,3
NUEERS OF STUDENTS AND SCHOOLS IN SAMPLE, FOR MAJOR SUBCLASSES USED IN REPORT
Case UnitU.S.
Total
Major SectorsUgh-Performance
Schools
Public Catholic Private Public Private
Total students 58,728 51,339 5,528 1,182 682 679
(58,049)a
Sophomores 30,263 26,448 2,831 631 370 353
(29,910)a
Seniors 28,465 24,891 2,697 551 311 326
(28,139)a
Number of schools 1,015 894 84 27 12 11
(1,004)a
aExcluding high-performance private schools.
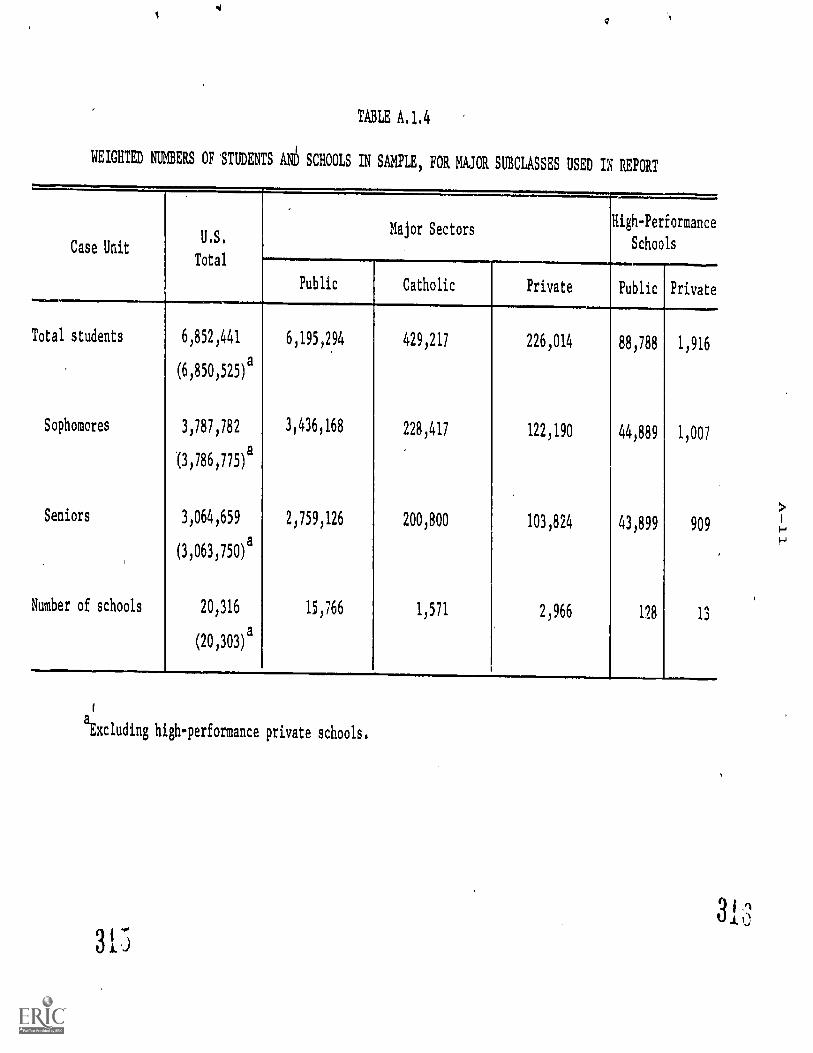
TABLE A.1.4
WEIGHTED RIDERS OF 'STUDENTS AND SCHOOLS IN SAMPLE, FOR MAJOR SUBCLASSES USED IN REPORT
Case UnitU.S.
Major SectorsHigh - Performance
Schools
Total
Public Catholic Private Public Private
Total students 6,852,441 6,195,294 429,217 226,014 88,788 1,916
(6,850,525)a
Sophomores 3,787,782 3,436,168 228,417 122,190 44,889 1,007
0,786,775)a
Seniors 3,064,659 2,759,126 200,800 103,824 43,899 909
(3,063,750)a
Number of schools 20,316 15,766 1,511 2,966 128 13
(20,303)a
alExcluding high-performance private schools.
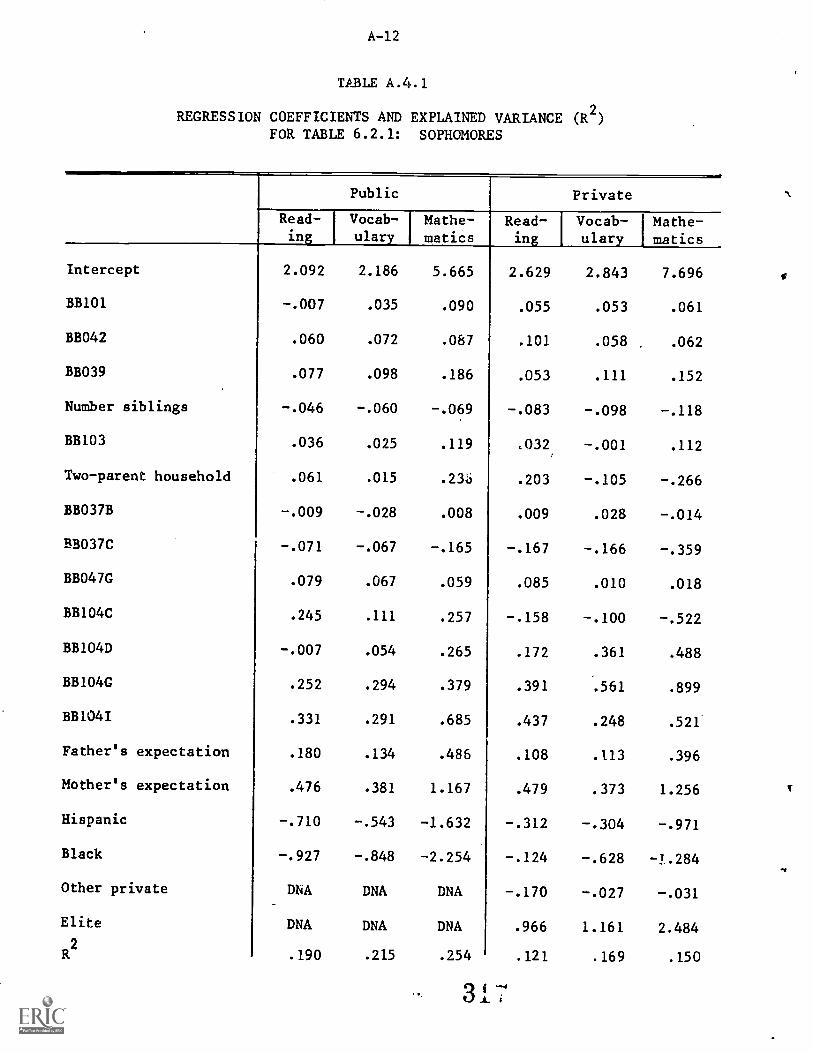
A-12
TABLE A.4.1
REGRESSION COEFFICIENTS AND EXPLAINED VARIANCE (R2)
FOR TABLE 6.2.1: SOPHOMORES
Public Private
Read-ing
Vocab-ulary
Mathe-matics
Read-ing
Vocab- I Mathe-ulary I matics
Intercept 2.092 2.186 5.665 2.629 2.843 7.696
BB101 -.007 .035 .090 .055 .053 .061
BB042 .060 .072 .087 .101 .058 .062
BB039 .077 .098 .186 .053 .111 .152
Number siblings -.046 -.060 -.069 -.083 -.098 -.118
BB103 .036 .025 .119 ,032, -.001 .112
Two-parent household .061 .015 .23o .203 -.105 -.266
BB037B -.009 -.028 .008 .009 .028 -.014
318037C -.071 -.067 -.165 -.167 -.166 -.359
BB047G .079 .067 .059 .085 .010 .018
BB104C .245 .111 .257 -.158 -.100 -.522
BB104D -.007 .054 .265 .172 .361 .488
BB104G .252 .294 .379 .391 .561 .899
BB104I .331 .291 .685 .437 .248 .521
Father's expectation .180 .134 .486 .108 .113 .396
Mother's expectation .476 .381 1.167 .479 .373 1.256
Hispanic -.710 -.543 -1.632 -.312 -.304 -.971
Black -.927 -.848 -2.254 -.124 -.628 -3.284
Other private DNA DNA DNA -.170 -.027 -.031
Elite DNA DNA DNA .966 1.161 2.484
R2
.190 .215 .254 .121 .169 .150
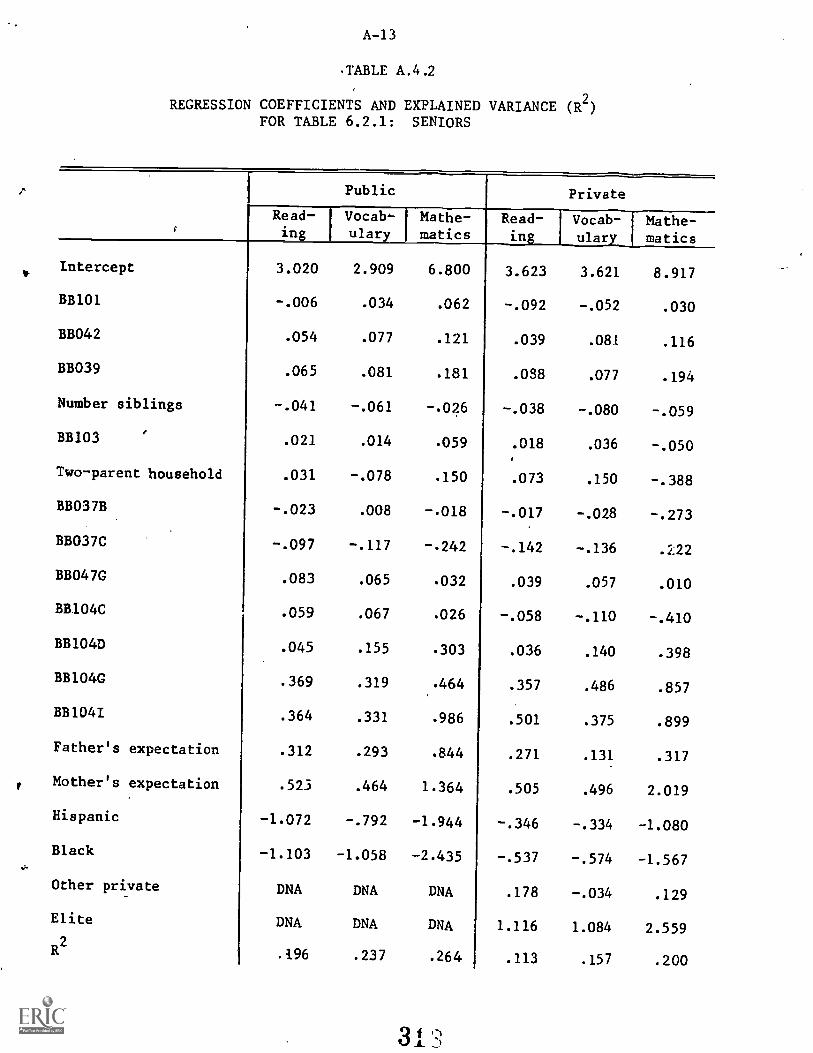
A-13
.TABLE A.4.2
REGRESSION COEFFICIENTS AND EXPLAINED VARIANCE (R2)FOR TABLE 6.2.1: SENIORS
Read-ing
Intercept 3.020
BB101 -.006
BB042 .054
BB039 .065
Number siblings -.041
BB103 .021
Two-parent household .031
BB037B -.023
BB037C -.097
BB047G .083
BB104C .059
BB104D .045
BB104G .369
BB104I .364
Father's expectation .312
Mother's expectation .523
Hispanic -1.072
Black -1.103
Other private DNA
Elite DNA
R2
.196
Public Private
Vocal).- I Mathe-ulary matics
Read-ing
Vocab-ulary
Mathe-matics
2.909 6.800
.034 .062
.077 .121
.081 .181
-.061 -.026
.014 .059
-.078 .150
.008 -.018
-.117 -.242
.065 .032
.067 .026
.155 .303
.319 .464
.331 .986
.293 .844
.464 1.364
-.792 -1.944
-1.058 -2.435
DNA DNA
DNA DNA
.237 .264
3.623 3.621 8.917
-.092 -.052 .030
.039 .081 .116
.088 .077 .194
-.038 -.080 -.059
.018 .036 -.050
.073 .150 -.388
-.017 -.028 -.273
-.142 -.136
.039 .057 .010
-.058 -.110 -.410
.036 .140 .398
.357 .486 .857
.501 .375 .899
.271 .131 .317
.505 .496 2.019
-.346 -.334 -1.080
-.537 -.574 -1.567
.178 -.034 .129
1.116 1.084 2.559
.113 .157 .200
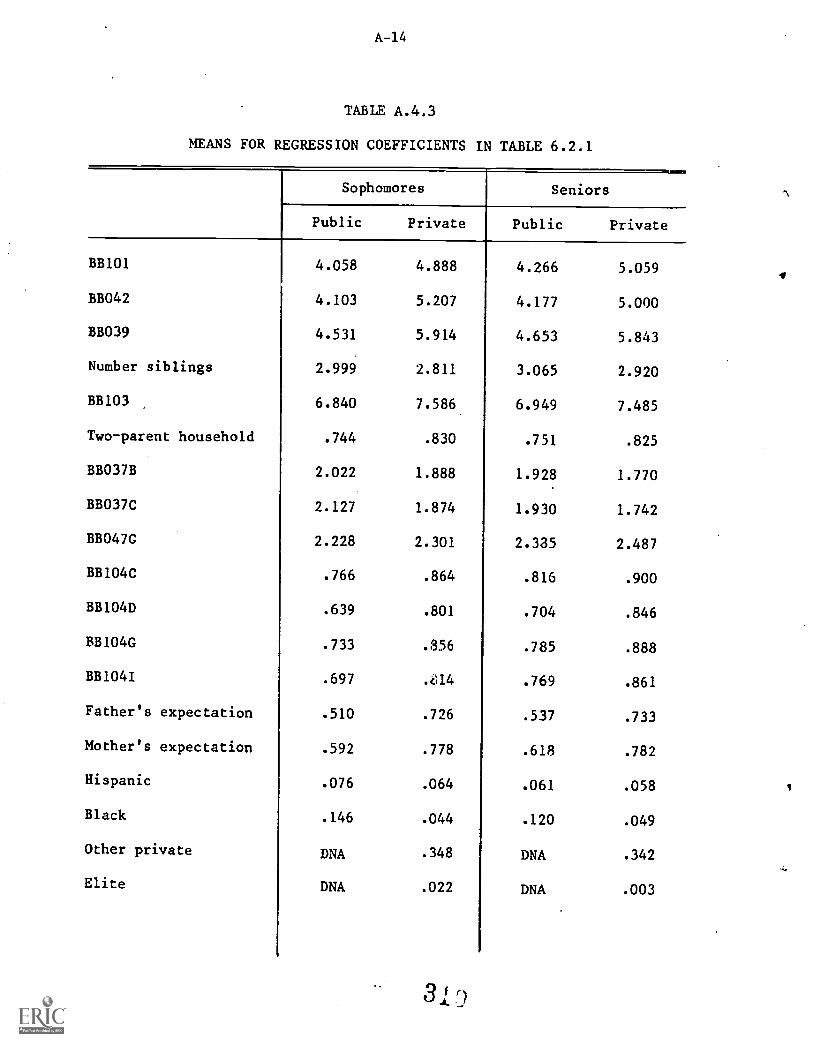
A-14
TABLE A.4.3
MEANS FOR REGRESSION COEFFICIENTS IN TABLE 6.2.1
Sophomores Seniors
Public Private Public Private
BB101
BB042
BB039
Number siblings
BB103
Two-parent household
BB037B
BB037C
BB047G
BB104C
BB104D
liB104G
BB104I
Father's expectation
Mother's expectation
Hispanic
Black
Other private
Elite
4.058 4.888
4.103 5.207
4.531 5.914
2.999 2.811
6.840 7.586
.744 .830
2.022 1.888
2.127 1.874
2.228 2.301
.766 .864
.639 .801
.733 .8.56
.697 .614
.510 .726
.592 .778
.076 .064
.146 .044
DNA .348
DNA .022
31)
4.266 5.059
4.177 5.000
4.653 5.843
3.065 2.920
6.949 7.485
.751 .825
1.928 1.770
1.930 1.742
2.335 2.487
.816 .900
.704 .846
.785 .888
.769 .861
.537 .733
.618 .782
.061 .058
.120 .049
DNA .342
DNA .003
7
APPENDIX B
ITEMS FROM THE STUDENT AND SCHOOL QUESTIONNAIRESUSED IN THE ANALYSIS
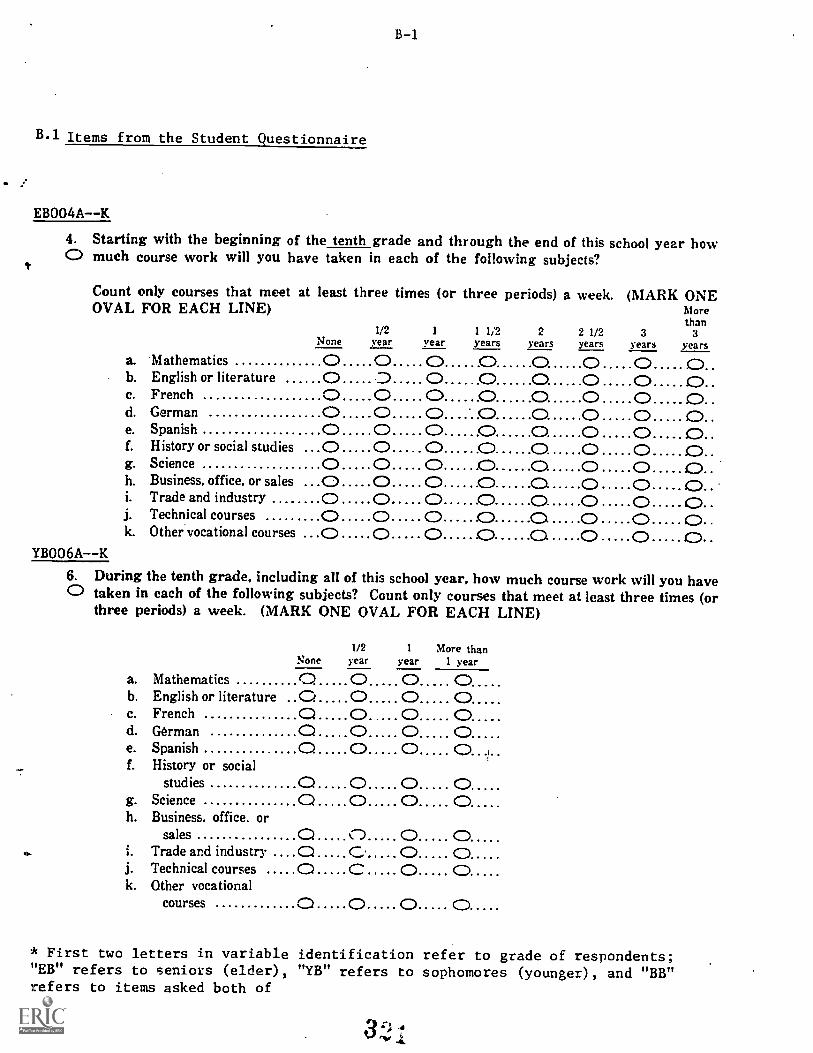
B.1 Items from the Student Questionnaire
EBOO4A--K
4. Starting with the beginning of the tenth grade and through the end of this school year how0 much course work will you have taken in each of the following subjects?
Count only courses that meet atOVAL FOR EACH LINE)
least three times (or three periods) a week.
1/2 1 1 1/2 2 2 1/2None year year years years years
(MARK ONEMorethan
3 3years years
a. Mathematics 0 0 0 0 0 0 0 0..b. English or literature 0 D O 0 0 0 0 0..c. French 0 0 0 0 0 0 0 0..d. German 0 0 0 0 0 0 0 0..e. Spanish 0 0 0 0 0 0 0 0..f. History or social studies 0 0 0 0 0 0 0 0..g. Science 0 0 0 0 0 0 0 0h. Business, office, or sales 0 0 0 0 0. 0 0i. Trade and industry 0 0 0 0 0 0 0 0j. Technical courses 0 0 0 0 O. 0 0 0k. Other vocational courses 0 0 0 0 0
YBOO6A--K
6. During the tenth grade, including all of this school year, how much course work will you have0 taken in each of the following subjects? Count only courses that meet at least three times (or
three periods) a week. (MARK ONE OVAL FOR EACH LINE)
1/2 1 More thanNone year year 1 year
a. Mathematics 0 0 0 0b. English or literature .0 0 0 0c. French 0 0......0 0d. German a 0 0 0e. Spanish 0 0 0 0.../..f. History or social
studies 0 0 0 0g. Science 0 0 0 0h. Business, office. or
sales 0 0 0 0i. Trade and industry ... .0 C. , 0 0j. Technical courses 0 C 0 0k. Other vocational
courses 0 0 0 0* First two letters in variable identification refer to grade of respondents;"EB" refers to seniors (elder), "YB" refers to sophomores (younger), and "BB"refers to items asked both of
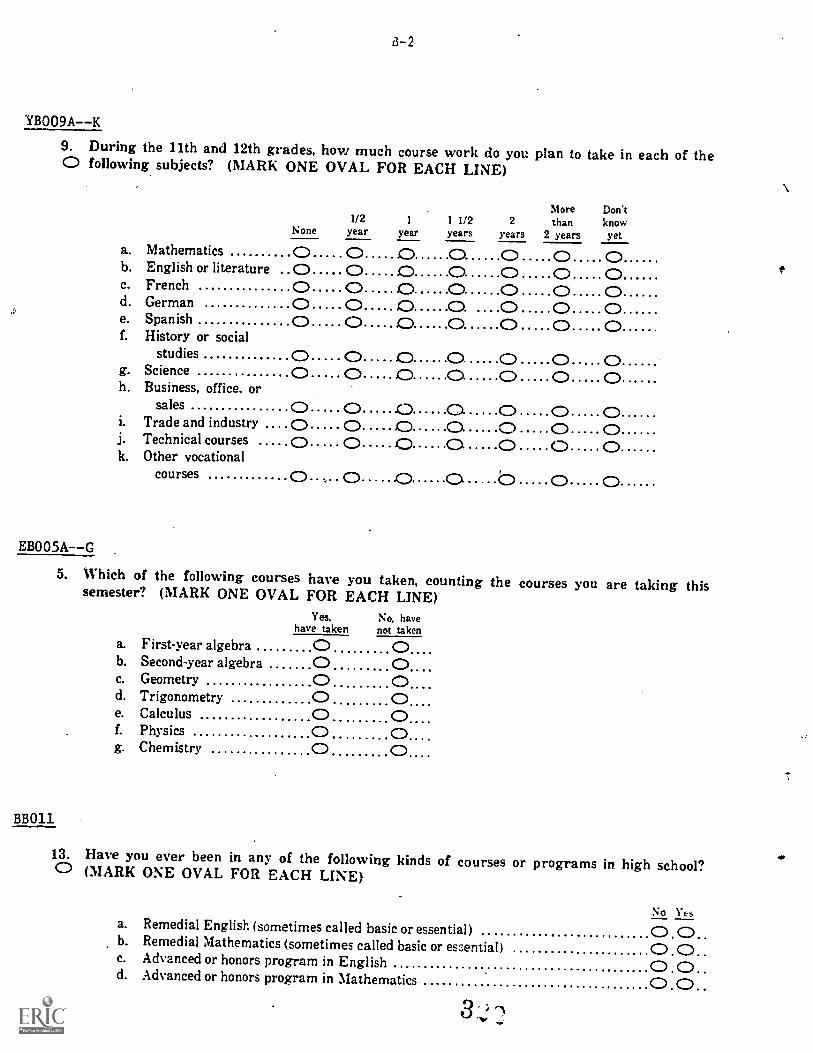
3-2
YBOO9A--K
9. During the 11th and 12th grades, how much course work do you plan to take in each of the0 following subjects? (MARK ONE OVAL FOR EACH LINE)
None1/2
year1
year1 1/2years
a. Mathematics 0 0 0 0b. English or literature 0 0 0 0c. French 0 0. 0 0d. German 0 0 0 0e.f.
SpanishHistory or social
0 0 0 0studies 0 0 CD 0
g.h.
ScienceBusiness, office, or
0 0 0 0sales 0 0 0 0
i. Trade and industry 0 0 0 0j.k.
Technical coursesOther vocational
0 0 0 O.
courses 0 0 .0 0
2
years
000.0000000b
Morethan
2 years
Don'tknowyet
0 00 00 00 00 00 00 00 00 00 00 0
EBOO5AG
5. Which of the following courses have you taken, counting the courses you are taking thissemester? (MARK ONE OVAL FOR EACH LINE)
Yes. No. havehave taken not taken
a. First-year algebra 0b. Second-year algebrac. Geometryd. Trigonometrye. Calculusf. Physicsg. Chemistry
BBO11
13. Have you ever been in any of the following kinds of courses or programs in high school?0 (MARK ONE OVAL FOR EACH LINE)
No Yesa. Remedial English (sometimes called basic or essential) 0 . 0..b. Remedial Mathematics (sometimes called basic or essential) 0 . 0c. Advanced or honors program in English 0 .0..d. Advanced or honors program in Mathematics 0 .0..
3
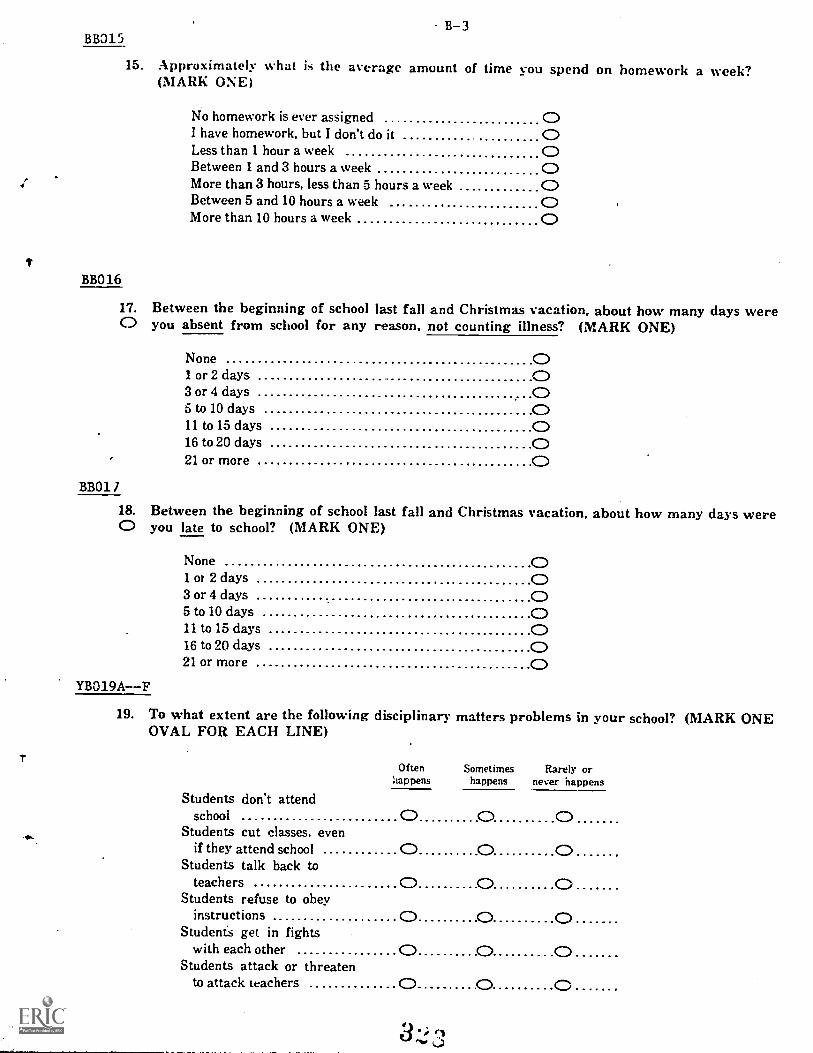
BB015B-3
15. Approximately what is the average amount of time you spend on homework a week?(MARK ONE)
No homework is ever assignedI have homework, but I don't do itLess than 1 hour a weekBetween 1 and 3 hours a weekMore than 3 hours, less than :5 hours a weekBetween 5 and 10 hours a weekMore than 10 hours a week
BB016
17. Between the beginning of school last fall and Christmas vacation, about how many days were0 you absent from school for any reason, not counting illness? (MARK ONE)
None1 or 2 days3 or 4 days5 to 10 days11 to 15 days16 to 20 days21 or more
BB01
18. Between the beginning of school last fall and Christmas vacation, about how many days were0 you late to school? (MARK ONE)
None1 or 2 days3 or 4 days5 to 10 days11 to 15 days16 to 20 days21 or more
YB019A--F
19. To what extent are the following disciplinary matters problems in your school? (MARK ONEOVAL FOR EACH LINE)
Often Sometimes Rarely orhappens happens never happens
Students don't attendschool 0
Students cut classes, evenif they attend school O O 0
Students talk back toteachers
Students refuse to obeyinstructions
Students get in fightswith each other
Students attack or threatento attack teachers O O 0
e"I
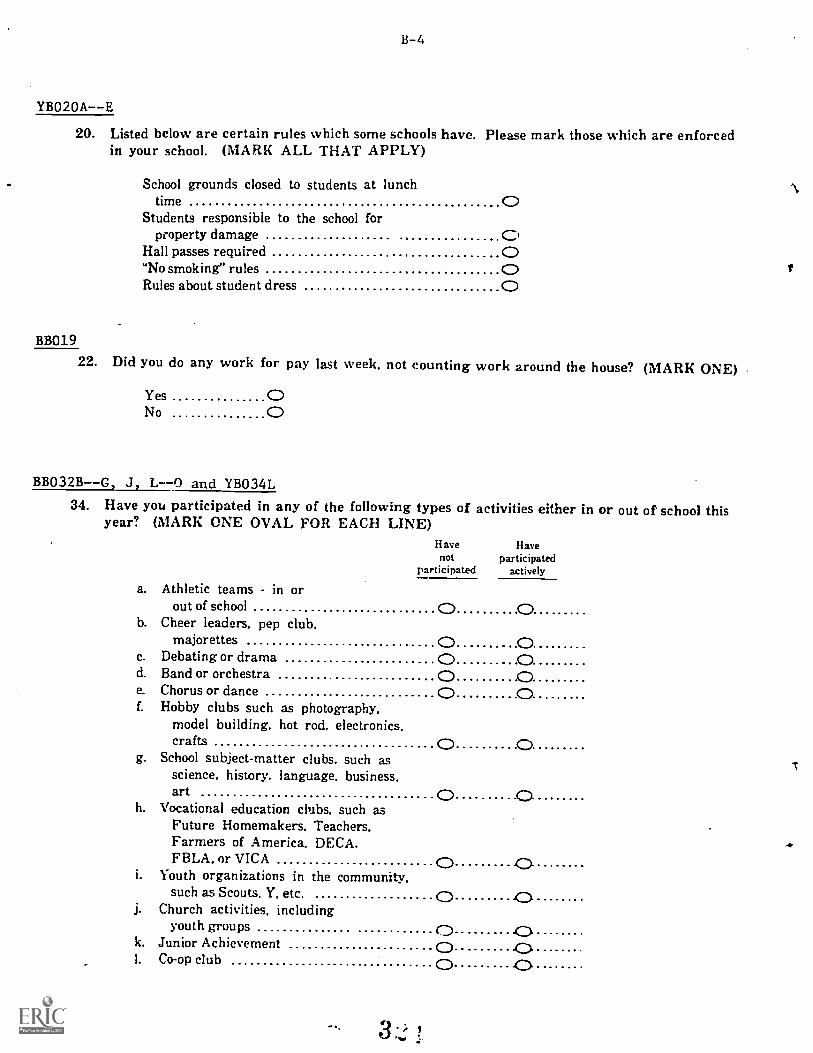
B-4
YB020A--E
20. Listed below are certain rules which some schools have. Please mark those which are enforcedin your school. (MARK ALL THAT APPLY)
School grounds closed to students at lunchtime
Students responsible to the school forproperty damage
Hall passes required"No smoking" rulesRules about student dress
BB019
22. Did you do any work for pay last week, not counting work around the house? (MARK ONE)
YesNo
BB032B--G, J, L--0 and YB034L
34. Have you participated in any of the following types of activities either in or out of school thisyear? (MARK ONE OVAL FOR EACH LINE)
Have Havenot participated
participated actively
a. Athletic teams - in orout of school Q 0
b. Cheer leaders, pep club,majorettes
c. Debating or drama 0d. Band or orchestrae. Chorus or dancef. Hobby clubs such as photography,
model building, hot rod, electronics,crafts Q 0
g. School subject-matter clubs. such asscience, history. language. business.art Q O.
h. Vocational education clubs, such asFuture Homemakers, Teachers.Farmers of America, DECA.FBLA, or VICA
i. Youth organizations in the community.such as Scouts, Y, etc.
j. Church activities, includingyouth groups rD
k. Junior AchievementI. Co-op club C:)
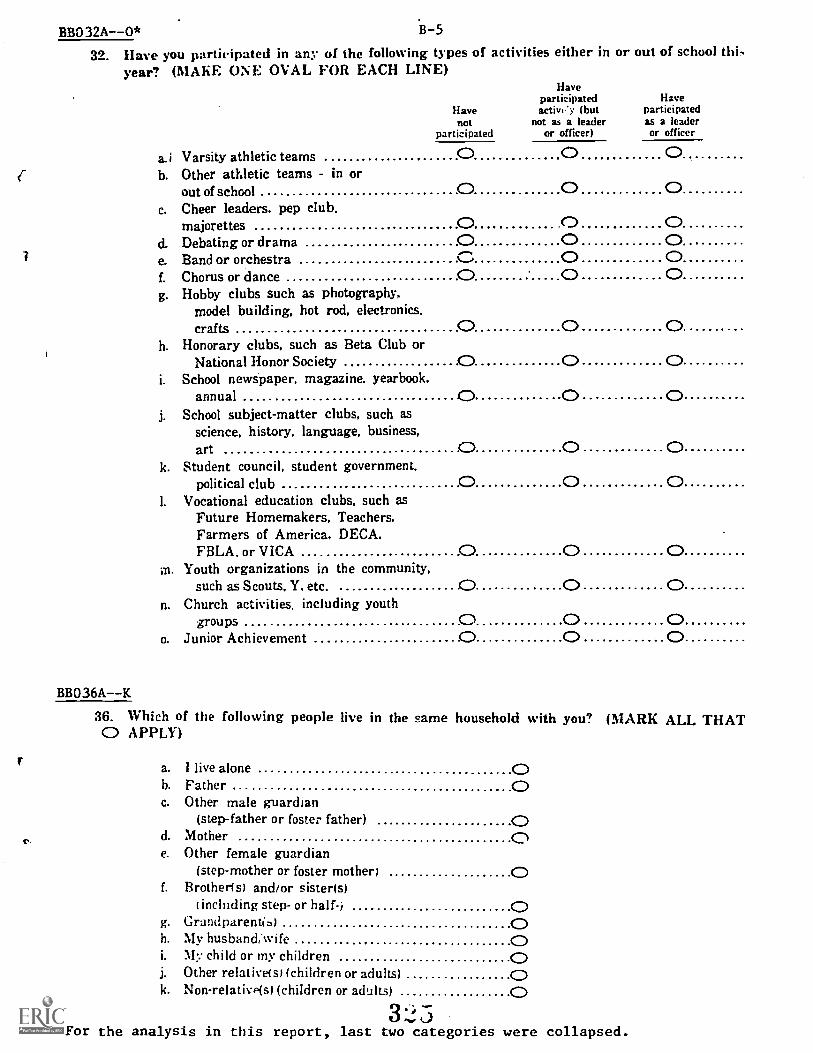
BBO 32A-0*
32. Have you participated in any of the following types of activities either in or out of school thisyear? (MAKE ONE OVAL FOR EACH LINE)
Haveparticipated Have
Have activi'y (but participatednot not as a leader as a leader
participated or officer) or officer
a.1 Varsity athletic teamsb. Other athletic teams in or
out of schoolc. Cheer leaders, pep club.
majorettes O ,0d. Debating or drama ..e. Band or orchestraf. Chorus or danceg. Hobby clubs such as photography,
model building, hot rod, electronics.crafts O 0 0
h. Honorary clubs, such as Beta Club orNational Honor Society
i. School newspaper, magazine. yearbook.annual 0
j. School subject-matter clubs, such asscience, history, language, business,art 0
k. Student council, student government.political club O O 0
1. Vocational education clubs, such asFuture Homemakers, Teachers.Farmers of America, DECA.FBLA, or VICA
m. Youth organizations in the community,such as Scouts. Y. etc. 0 0
n. Church activities. including youthgroups 0
o. Junior Achievement 0
BB036A--K
36. Which of the following people live in the same household with you? (MARK ALL THATO APPLY)
a. I live aloneb. Fatherc. Other male guardian
(step-father or foster father)d. Mothere. Other female guardian
(step-mother or foster mother)f. Brother(s) and/or sisters)
( including step- or half-)g. G rand parenti3)h. My husband,'wifei. 'My child or my childrenj. Other relativeist (children or adults)k. Non-relativP(s) (children or adults)
323*For the analysis in this report, last two categories were collapsed.
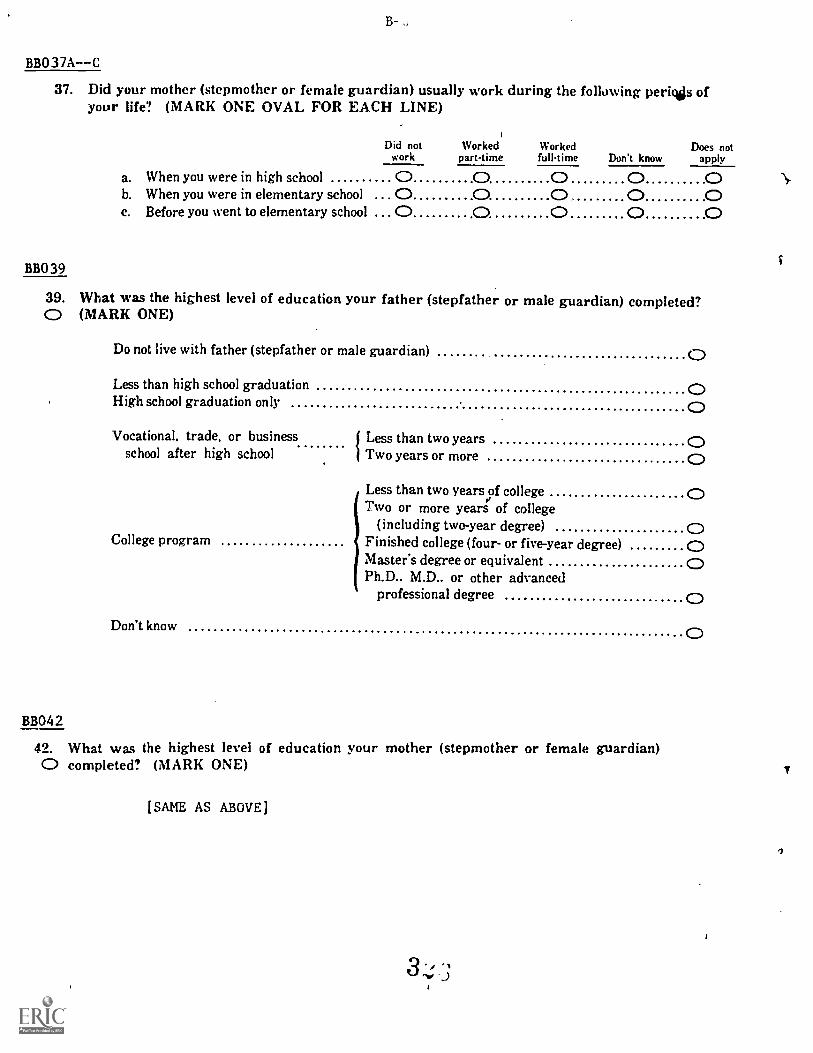
B-
BB037A--C
37. Did your mother (stepmother or female guardian) usually work during the following pericias ofyour life? (MARK ONE OVAL FOR EACH LINE)
Did notwork
Workedpart -time
Workedfull-time Don't know
Does notapply
a. When you were in high school 0 0 0 0 0b. When you were in elementary school 0 0 0 0 0c. Before you went to elementary school 0 0 0 0 0
BBO 39
39. What was the highest level of education your father (stepfather or male guardian) completed?0 (MARK ONE)
Do not live with father (stepfather or male guardian)
Less than high school graduationHigh school graduation only
Vocational, trade, or business Less than two yearsschool after high school Two years or more
Less than two years of collegeTwo or more years of college
(including two-year degree)College program Finished college (four- or five-year degree)
Master's degree or equivalentPh.D.. M.D.. or other advanced
professional degree
Don't know
BB042
42. What was the highest level of education your mother (stepmother or female guardian)0 completed' (MARK ONE)
[SAME AS ABOVE]
0OO
O
O
OOO
O
O
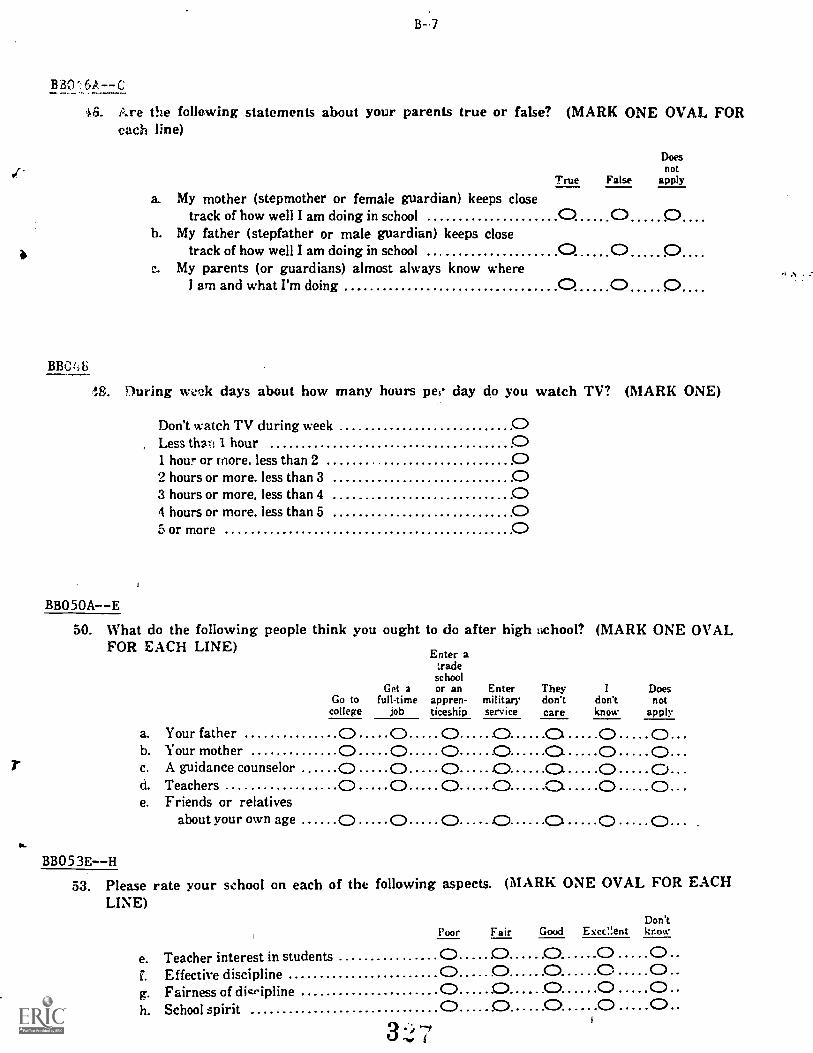
T
HO C
46. Are the following statements about your parents true or false? (MARK ONE OVAL FOReach line)
BB048
Doesnot
True False apply
a. My mother (stepmother or female guardian) keeps closetrack of how well I am doing in school 0 0 0....
h. My father (stepfather or male guardian) keeps closetrack of how well I am doing in school 0....
c. My parents (or guardians) almost always know whereI am and what I'm doing O O 0....
During we ek days about how many hours pea day do you watch TV? (MARK ONE)
Don't watch TV during weekLess than 1 hour1 hour or more, less than 22 hours or more. less than 33 hours or more, less than 44 hours or more, less than 5 05 or more
BB050A--E
50. What do the following people think you ought to do after high uchool? (MARK ONE OVALFOR EACH LINE) Enter a
:radeschool
Get a or an Enter They I DoesGo to full-time appren- military don't don't notcollege job ticeship service care know apply
a. Your father 0 0 0 0..0 0b. Your mother 0 0 0 0 0- 0c. A guidance counselor 0 0 0 -0 ..0 0d.e.
TeachersFriends or relatives
0 0 0 .0 0 0about your own age 0 0 0 -0 0 0
BB053E--H
53. Please rate your school on each of the following aspects. (MARK ONE OVAL FOR EACHLINE)
e. Teacher interest in studentsf. Effective disciplineg. Fairness of disciplineh. School spirit
3. "
Poor Fair Good Excaent knowDon't
0 0 0 0 00 0. 0 0 00 JO 0 0 0..0 0 0 0 0..1
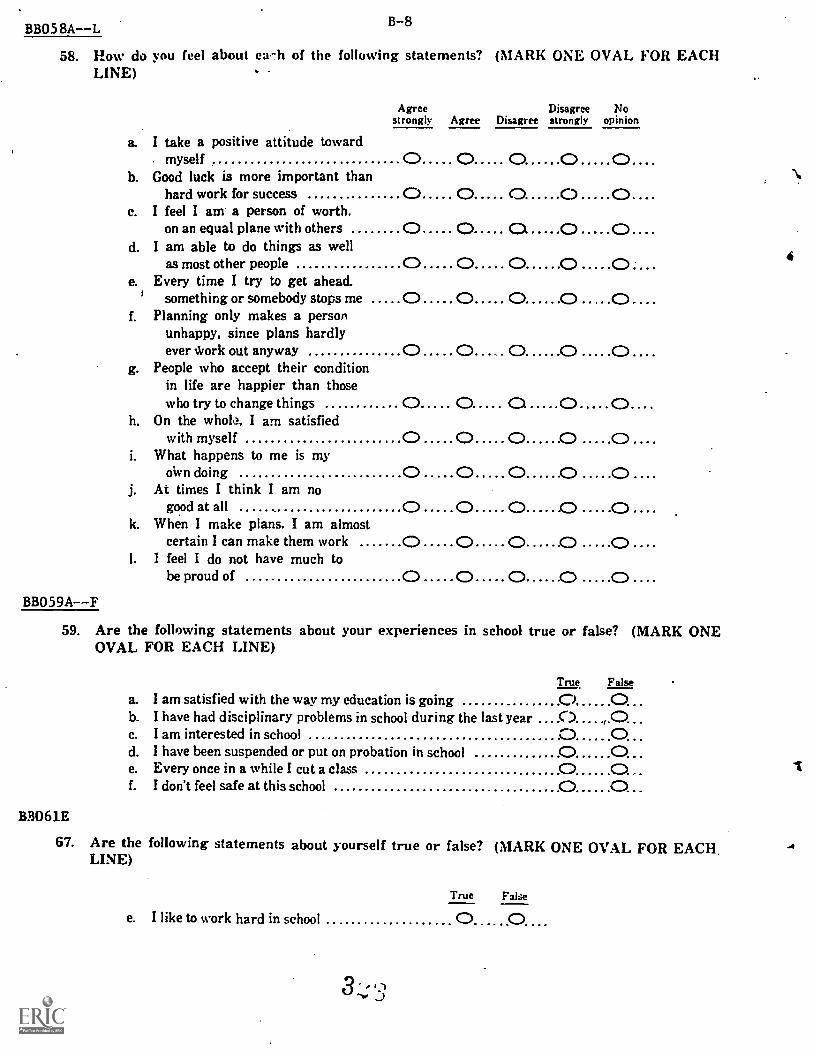
BB058A--L
58. How do you feel about ea-h of the following statements? (MARK ONE OVAL FOR EACHLINE)
B-8
a. I take a positive attitude toward
Agreestrongly Agree Disagree
Disagree Nostrongly opinion
b.. myselfGood luck is more important than
0 0 0 0
c.hard work for success
I feel I am a person of worth.0 0 0 0
d.
on an equal plane with othersI am able to do things as well
0 0 Q 0
e.as most other people
Every time I try to get ahead.0 0 0 0 0
f.
something or somebody stops mePlanning only makes a person
unhappy, since plans hardly
0 0 0 0 0
g.ever Afork out anyway
People who accept their conditionin life are happier than those
0 0 0 0 0
h.who try to change things
On the whole. I am satisfied0 0 0 0
i.
with myselfWhat happens to me is my
0 0 0 0 0
j.oi.vn doing
At times I think I am no0 0 0 0 0
k.good at all
When I make plans. I am almost0 0 0 0 0
certain I can make them work 0 0 0 0 0I. I feel I do not have much to
be proud of 0 0 0 0 0
.
BB059A--F
59. Are the following statements about your experiences in school true or false? (MARK ONEOVAL FOR EACH LINE)
True False
a. I am satisfied with the way my education is going 0 0...b. I have had disciplinary problems in school during the last year 0 0c. I am interested in school 0 CD...d. I have been suspended or put on probation in school O 0...e. Every once in a while I cut a class O O., .
f. I don't feel safe at this school 0 0...BB061E
67. Are the following statements about yourself true or false? (MARK ONE OVAL FOR EACH.LINE)
True False
e. I like to work hard in school
3^10
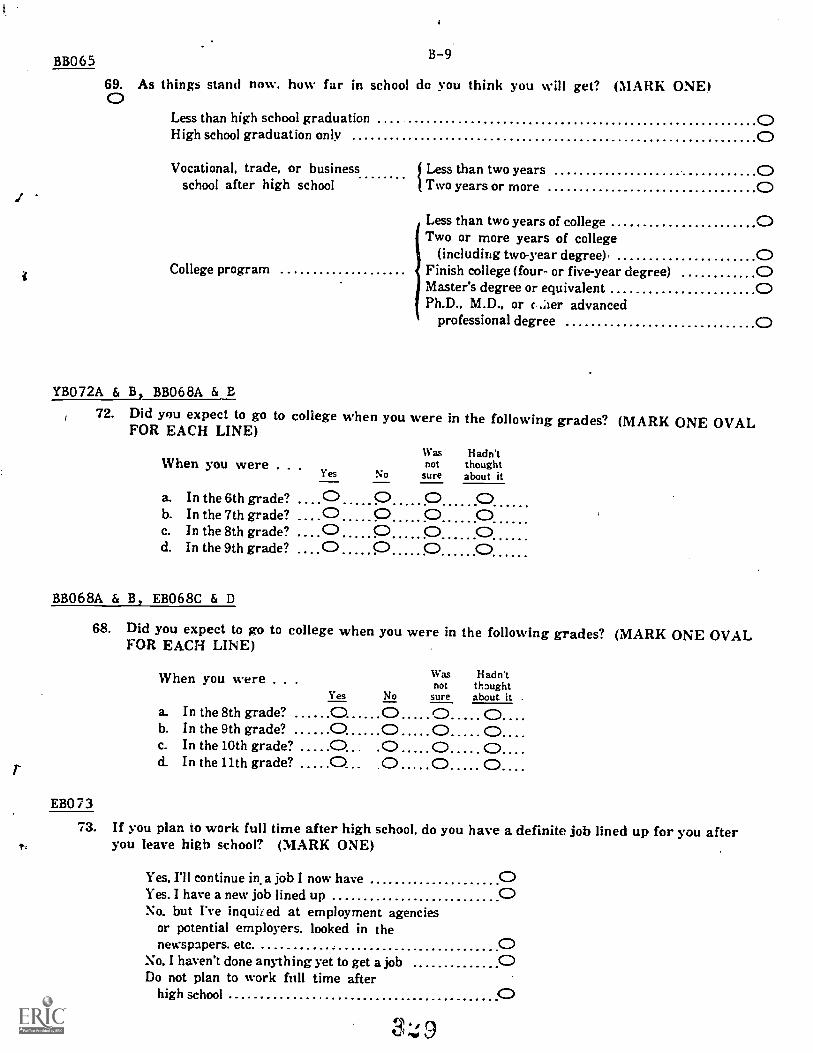
BB065
69. As things stand now, how far inO
B-9.
school do you think you will get? (MARK ONE)
Less than high school graduation 0High school graduation only
Vocational, trade, or businessschool after high school
College program
5 Less than two yearsTwo years or more 0Less than two years of college 0Two or more years of college
(including two-year degree) , 0Finish college (four- or five-year degree) 0Master's degree or equivalent 0Ph.D., M.D., or c . ;ter advanced
professional degree 0
YB072A & B BB068A & B
72. Did you expect to go to college when you were in the following grades? (MARK ONE OVALFOR EACH LINE)
When you were . . .Yes No
Wasnot
sure
Hadn'tthoughtabout it
a. In the 6th grade? 0 0 0 0b. In the 7th grade? 0 0 0 0c. In the 8th grade? 0 0 0 0d. In the 9th grade? 0 0 0 0
BB068A & B, EB068C & D
68. Did you expect to go to college when you were in the following grades? (MARK ONE OVALFOR EACH LINE)
When you were . . .
a. In the 8th grade"b. In the 9th grade?c. In the 10th grade?d. In the llth grade?
Yes No
000.0
Was Hadn'tnot thoughtsure about it
000.0.
0000 0
.
EB073
73. If you plan to work full time after high school, do you have a definite job lined up for you afteryou leave high school? (MARK ONE)
Yes. I'll continue in. a job I now haveYes. I have a new job lined up 0No. but I've inquired at employment agencies
or potential employers. looked in thenewspapers. etc.
No. I haven't done anything yet to get a job 0Do not plan to work full time after
high school
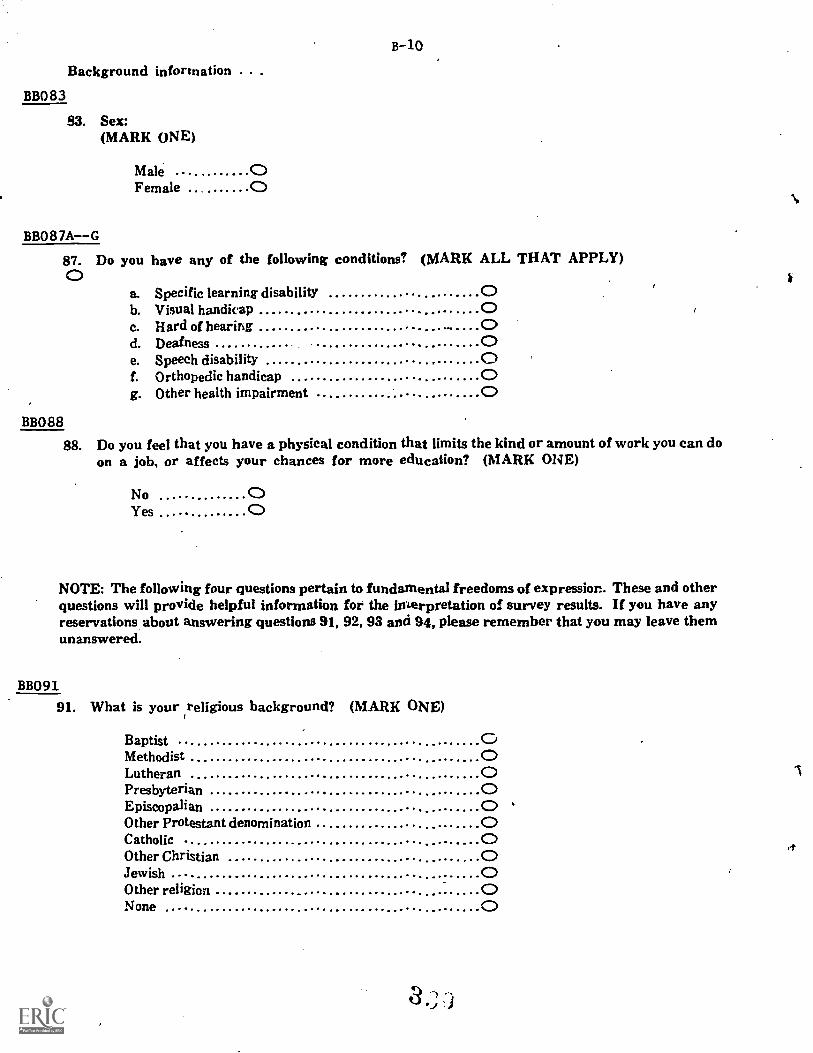
B -10
Background information
BBO 83
83. Sex:(MARK ONE)
Male 0Female 0
BB087A---G
87. Do you have any of the following conditions? (MARK ALL THAT APPLY)O
a. Specific learning disabilityb. Visual handicapc. Hard of hearingd. Deafnesse. Speech disabilityf. Orthopedic handicapg. Other health impairment
BB088
88. Do you feel that you have a physical condition that limits the kind or amount of work you can doon a job, or affects your chances for more education? (MARK ONE)
NoYes
NOTE: The following four questions pertain to fundamental freedoms of expression. These and otherquestions will provide helpful information for the interpretation of survey results. If you have anyreservations about answering questions 91, 92, 93 and 94, please remember that you may leave themunanswered.
BB091
91. What is your religious background? (MARK ONE)
BaptistMethodistLutheranPresbyterianEpiscopalianOther Protestant denominationCatholicOther ChristianJewish -
Other religionNone
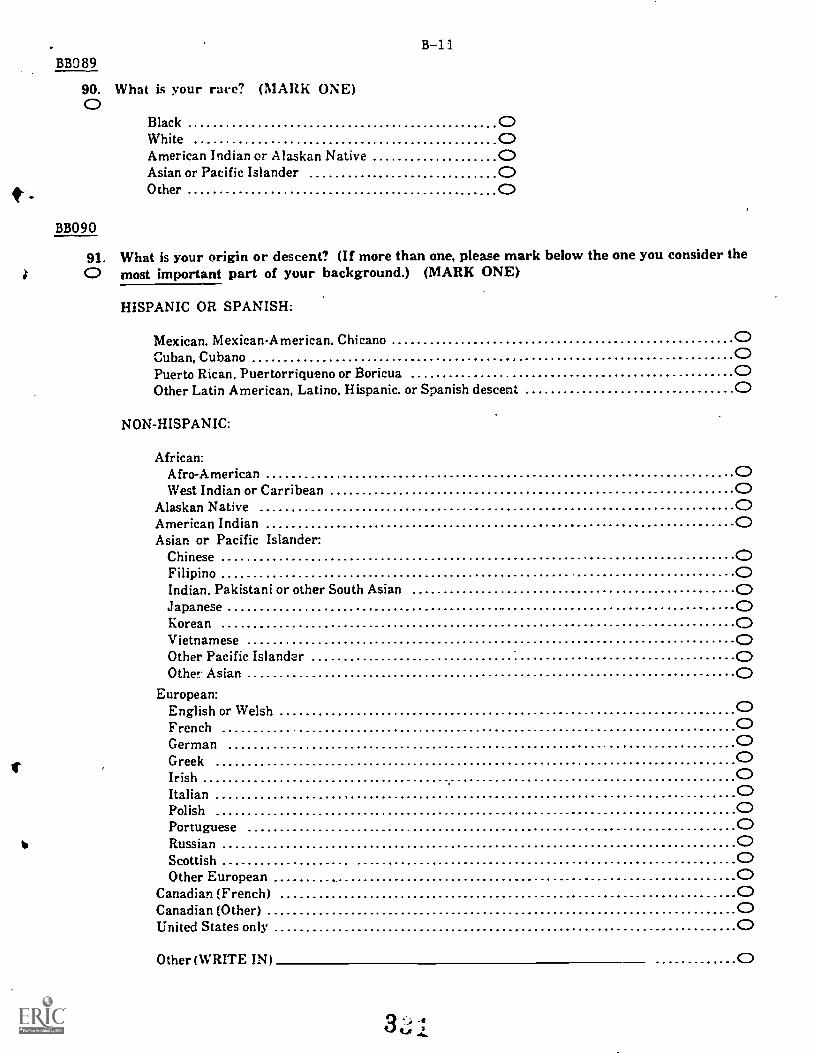
B-11BBO 89
90. What is your race? (MARK ONE)O
Black 0WhiteAmerican Indian or Alaskan NativeAsian or Pacific IslanderOther
BB090
91. What is your origin or descent? (If more than one, please mark below the one you consider the1 0 most important part of your background.) (MARK ONE)
HISPANIC OR SPANISH:
Mexican. Mexican-American, ChicanoCuban, CubanoPuerto Rican, Puertorriqueno or BoricuaOther Latin American, Latino. Hispanic. or Spanish descent
NON-HISPANIC:
African:Afro-AmericanWest Indian or Carribean
Alaskan NativeOAmerican Indian
Asian or Pacific Islander:ChineseFilipinoIndian. Pakistani or other South AsianJapaneseKoreanVietnameseOther Pacific IslanderOther Asian
European:English or WelshFrenchGermanGreekIrishItalianPolishPortugueseRussianScottishOther European
Canadian (French)Canadian (Other)United States only
Other (WRITE IN)
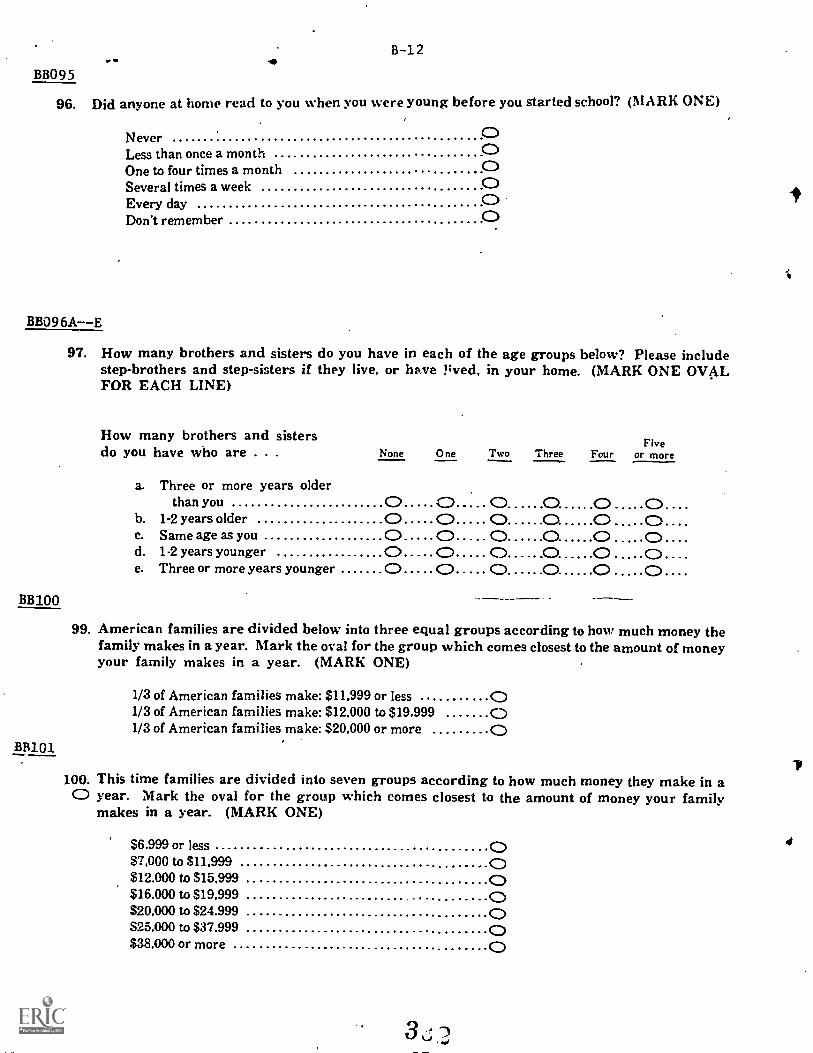
r. eB -12
BBO 95
96. Did anyone at home read to you when you were young before you started school? (MARK ONE)
NeverLess than once a monthOne to four times a monthSeveral times a weekEvery dayDon't remember
BB09 6A---E
97. How many brothers and sisters do you have in each of the age groups below? Please includestep-brothers and step-sisters if they live, or have ved, in your home. (MARK ONE OVALFOR EACH LINE)
BB100
BR101
How many brothers and sistersdo you have who are . . .
a. Three or more years older
None One Two ThreeFive
Four or more
than you 0 0 0 0 0 0b. 1-2 years older 0 0 0 0 0 .....Oc. Same age as you 0 40 0 0 0 0d. 1-2 years younger 0 0 0 0 0 0e. Three or more years younger 0 0 0 0 0 0 .
.
99. American families are divided below into three equal groups according to how much money thefamily makes in a year. Mark the oval for the group which comes closest to the amount of moneyyour family makes in a year. (MARK ONE)
1/3 of American families make: $11,999 or less1/3 of American families make: $12,000 to $19,9991/3 of American families make: $20,000 or more 0
100. This time families are divided into seven groups according to how much money they make in a0 year. Mark the oval for the group which comes closest to the amount of money your family
makes in a year_ (MARK ONE)
$6.999 or less$7,000 to $11,999$12.000 to $15,999$16.000 to $19,999$20,000 to $24.999S25.000 to $37.999$38,000 or more
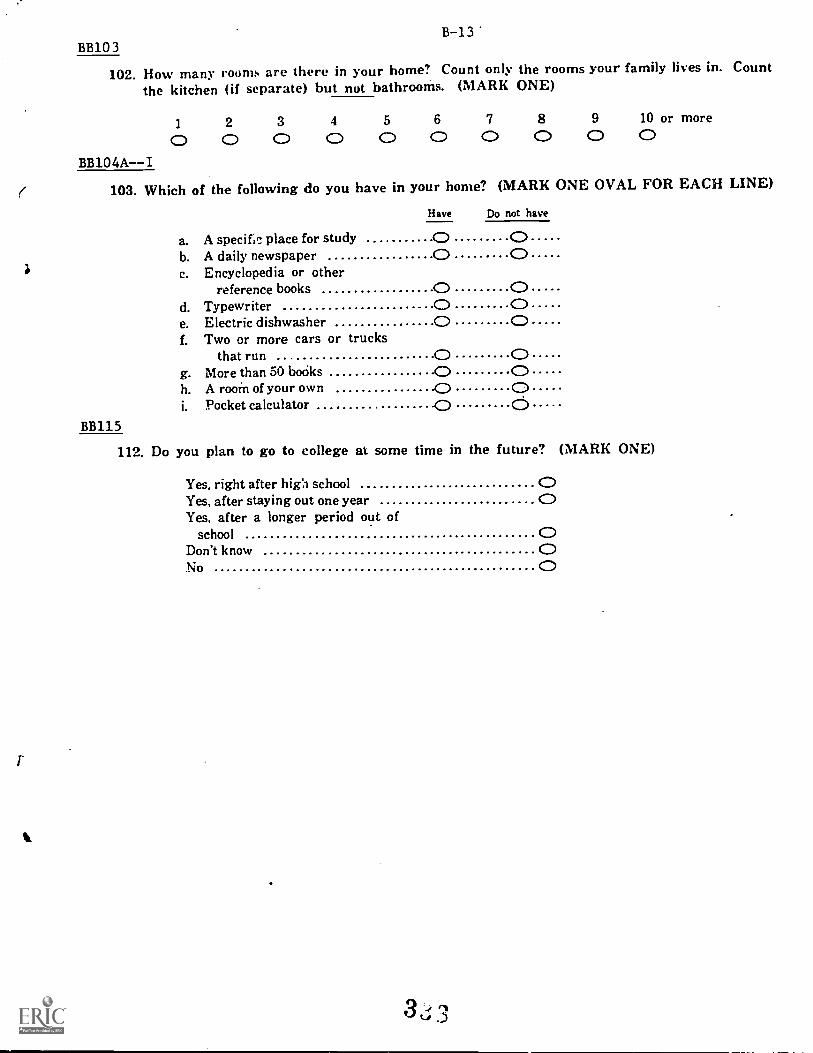
B-13BB103
102. How many rooms are there in your home? Count only the rooms your family lives in. Countthe kitchen (if separate) but not bathrooms. (MARK ONE)
1 2 3 4 5 6 8 9 10 or more
BB104A--I
103. Which of the following do you have in your home? (MARK ONE OVAL FOR EACH LINE)
Have Do not have
a. A specif,c.: place for study 0b. A daily newspaperc. Encyclopedia or other
reference booksd. Typewritere. Electric dishwasherf. Two or more cars or trucks
that rung. More than 50 boOks .0h. A room of your own -0 CDi. Pocket calculator
BB115
112. Do you plan to go to college at some time in the future? (MARK ONE)
Yes, right after high schoolYes, after staying out one yearYes, after a longer period out of
schoolDon't knowNo
r
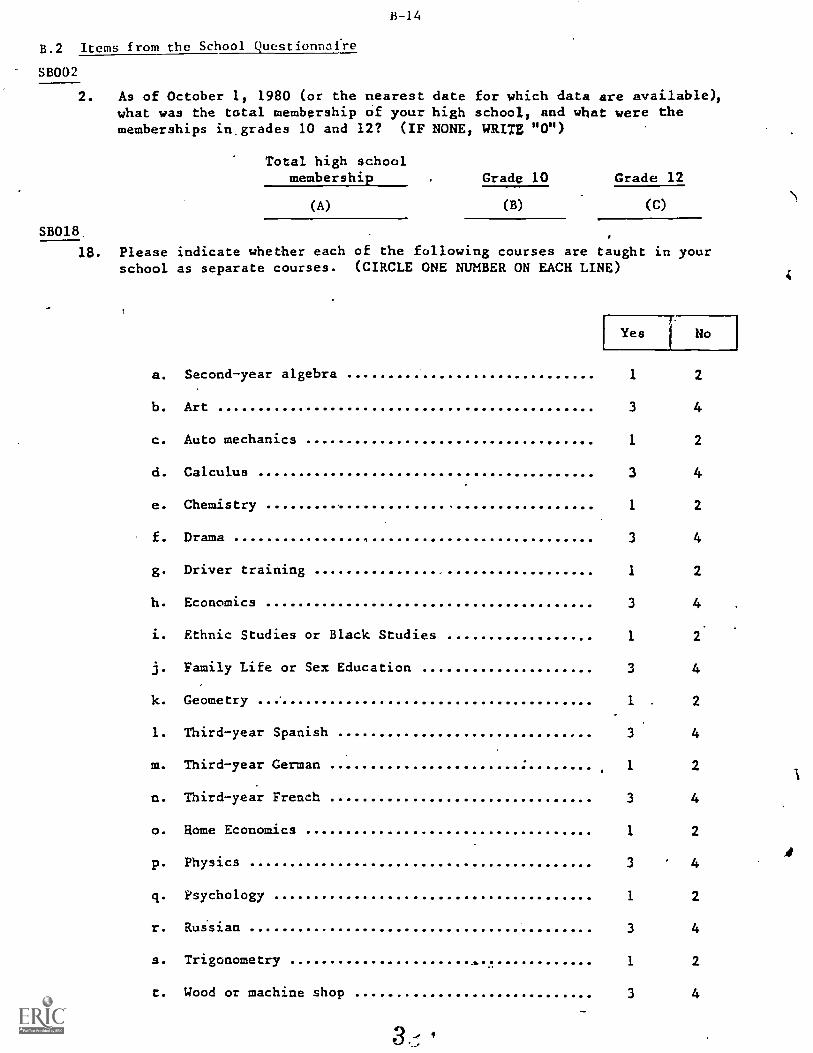
B-14
B.2 Items from the School Questionnaire
SB002
2. As of October 1, 1980 (or the nearest date for which data are available),what was the total membership of your high school, and what were thememberships in.grades 10 and 12? (IF NONE, WRITE "0")
Total high schoolmembership
(A)
Grade 10 Grade 12
(B) (C)
SB018
18. Please indicate whether each of the following courses are taught in yourschool as separate courses. (CIRCLE ONE NUMBER ON EACH LINE)
Yes No
a. Second-year algebra 1 2
b. Art 3 4
c. Auto mechanics 1 2
d. Calculus 3 4
e. Chemistry 1 2
f. Drama 3 4
g. Driver training 1 2
h. Economics 3 4
i. Ethnic Studies or Black Studies 1
j. Family Life or Sex Education 3 4
k. Geometry 1 . 2
1. Third-year Spanish 3 4
m. Third-year German ... 1 2
n. Third-year French 3 4
o. Home Economics 1 2
p. Physics 3 4
q. Psychology 1 2
r. Ruisian 3 4
s. Trigonometry 1 2
t. Wood or machine shop 3 4
3 ,
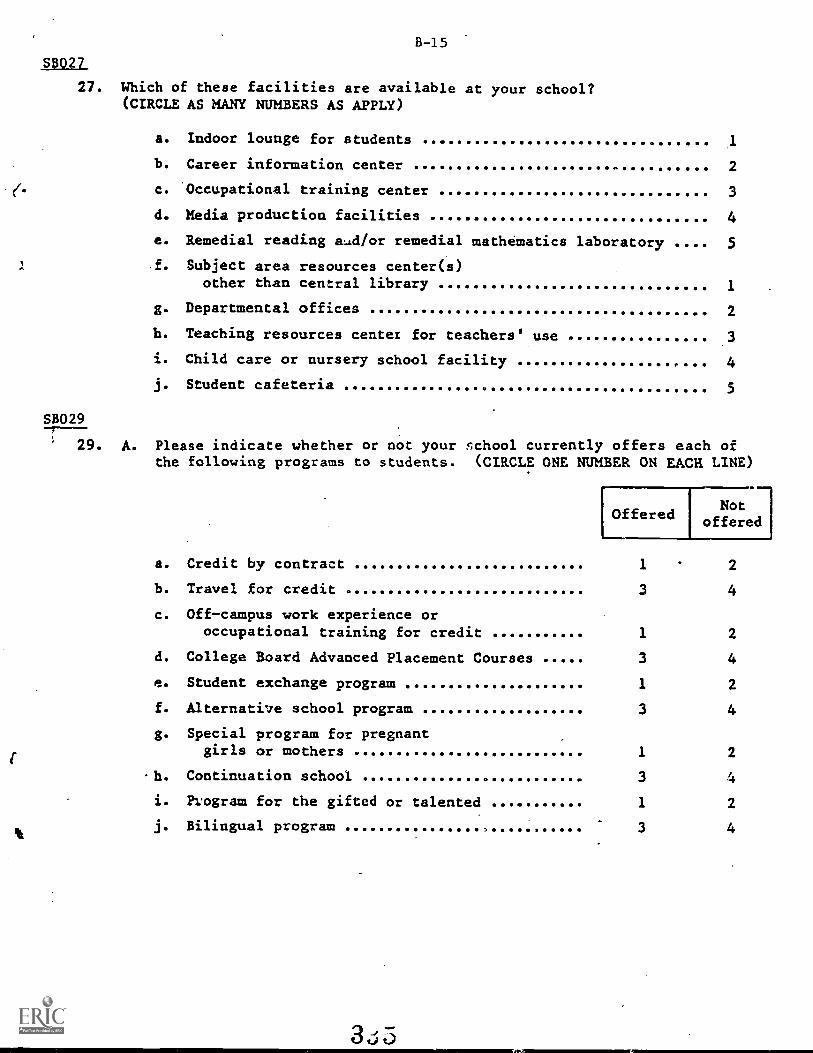
ti
B-15
SB027
these facilities are available at your school?AS MANY NUMBERS AS APPLY)
27. Which of(CIRCLE
a. Indoor lounge for students 1
b. Career information center 2
c. Occupational training center 3
d. Media production facilities 4
e.
f.
Remedial reading aud/or remedial mathematics laboratory
Subject area resources center(s)
5
other than central library 1
g. Departmental offices 2
h. Teaching resources center for teachers' use 3
i. Child care or nursery school facility 4
j. Student cafeteria 5
SB029-r-29. A. Please indicate whether or not your school currently offers each of
the following programs to students. (CIRCLE ONE NUMBER ON EACH LINE)
Offered
.,,II.M IMONIM,
Notoffered
a.
b.
c.
Credit by contract
Travel for credit
Off-campus work experience oroccupational training for credit
1
3
1
2
4
2
d. College Board Advanced Placement Courses 3 4
e. Student exchange program 1 2
f.
g.
Alternative school program
Special program for pregnant
3 4
girls or mothers 1 2
h. Continuation school 3 4
i. Pvogram for the gifted or talented 1 2
j. Bilingual program 3 4
3 ti
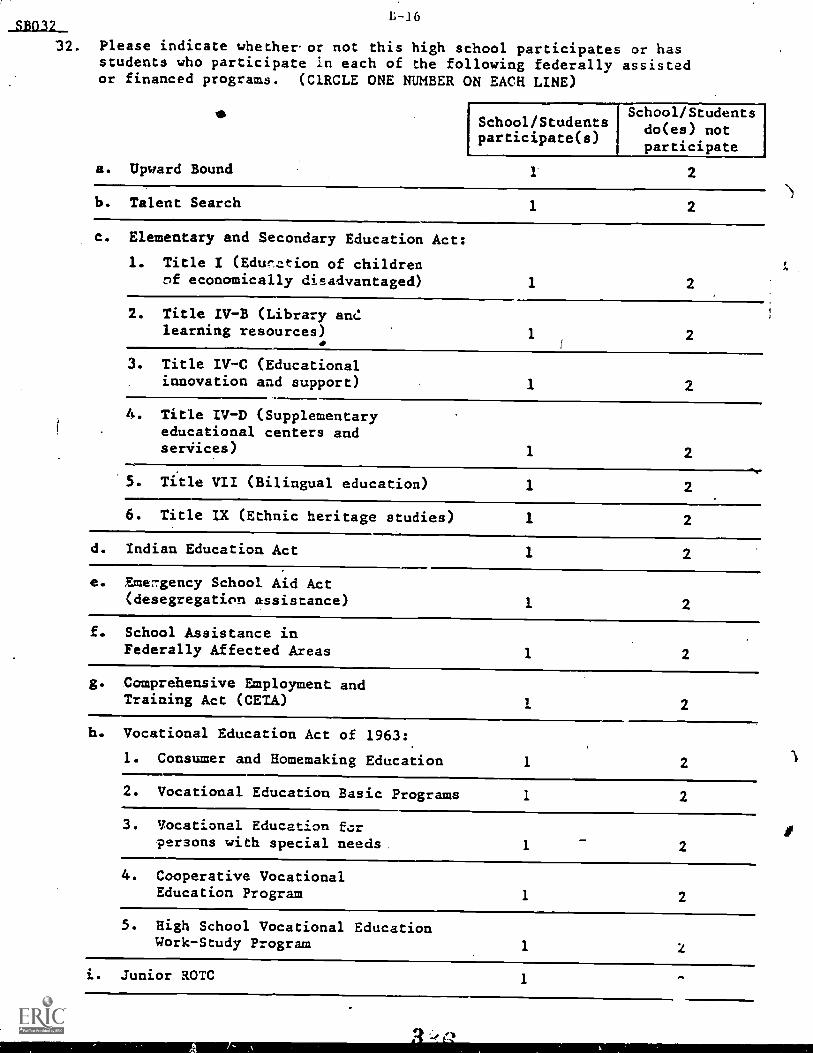
L-16SB032_
32. Please indicate whether or not this high school participates or hasstudents who participate in each of the following federally assistedor financed programs. (CIRCLE ONE NUMBER ON EACH LINE)
a. Upward Bound
b. Talent Search
c. Elementary and Secondary Education Act:
1. Title I (Edurction of childrenof economically disadvantaged)
2. Title /V-B (Library andlearning resources)
3. Title IV-C (Educationalinnovation and support)
4. Title IV-D (Supplementaryeducational centers andservices)
5. Title VII (Bilingual education)
6. Title IX (Ethnic heritage studies)
d. Indian Education Act
e. Eme7gency School. Aid Act(desegregation assistance)
f. School Assistance inFederally Affected Areas
g. Comprehensive Employment andTraining Act (CETA)
h. Vocational Education Act of 1963:
1. Consumer and Homemaking Education
2. Vocational Education Basic Programs
3. Vocational Education forpersons with special needs
4. Cooperative VocationalEducation Program
5. High School Vocational EducationWork-Study Program
.1,=1.4School/Studentsparticipate(s)
School/Studentsdo(es) notparticipate
1 2
1 2
1 2
1 2
1 2
1 2
1 2
1 2
1 2
1 2
1 2
1 2
1 2
1 2
1 2
1 2
1
i. Junior ROTC Orb
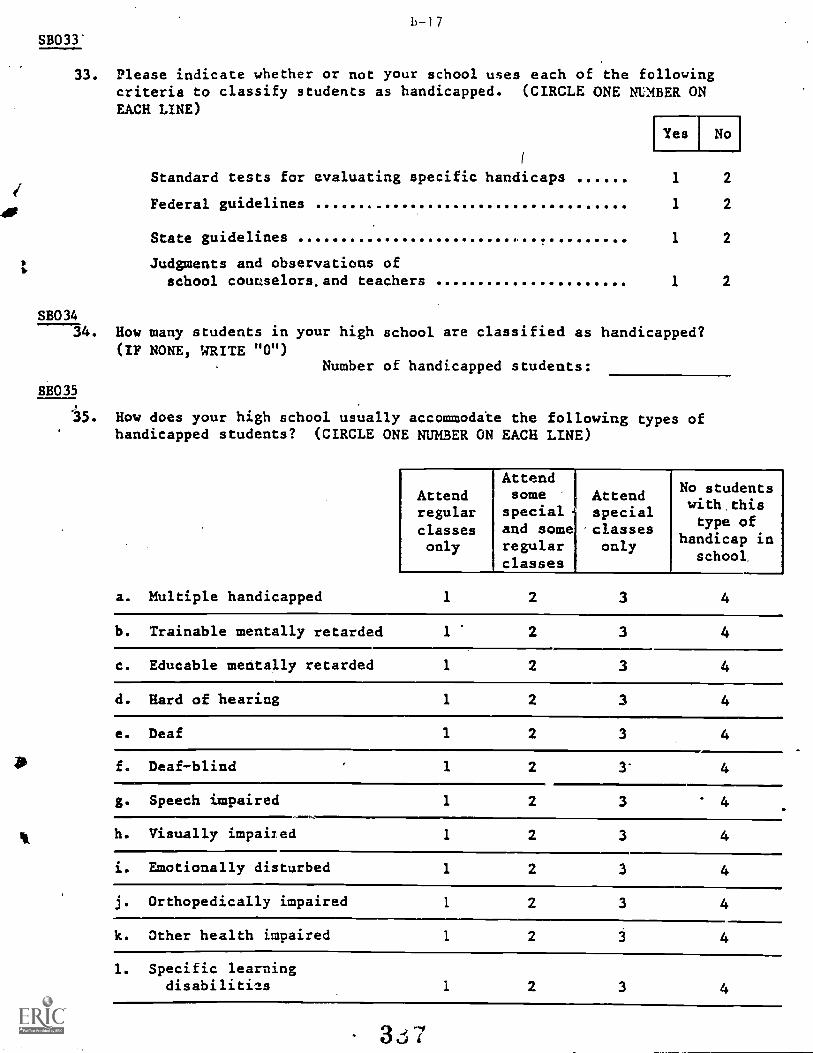
0
h -1 7
SB033'
33. Please indicate whether or not your school uses each of the followingcriteria to classify students as handicapped. (CIRCLE ONE NUMBER ONEACH LINE)
Standard tests for evaluating specific handicaps
Federal guidelines
State guidelines
Judgments and observations ofschool couuselors.and teachers
Yes No
1 2
1 2
1 2
1 2
SB03434. How many students in your high school are classified as handicapped?
(IF NONE, WRITE "0")Number of handicapped students:
8B035
35. How does your high school usually accommodate the following types ofhandicapped students? (CIRCLE ONE NUMBER ON EACH LINE)
Attendregularclassesonly
Attendsome
specialsand someregularclasses
Attendspecialclassesonly
No studentswith thistype of
handicap inschool.
a. Multiple handicapped 1 2 3 4
b. Trainable mentally retarded 1' 2 3 4
c. Educable mentally retarded 1 2 3 4
d. Hard of hearing 1 2 3 4
e. Deaf 1 2 3 4
f. Deaf-blind 1 2 3' 4
g. Speech impaired 1 2 3 4
h. Visually impaired 1 2 3 4
i. Emotionally disturbed 1 2 3 4
j. Orthopedically impaired 1 2 3 4
k. Other health impaired 1 2 3 4
1. Specific learningdisabilities 1 2 3 4
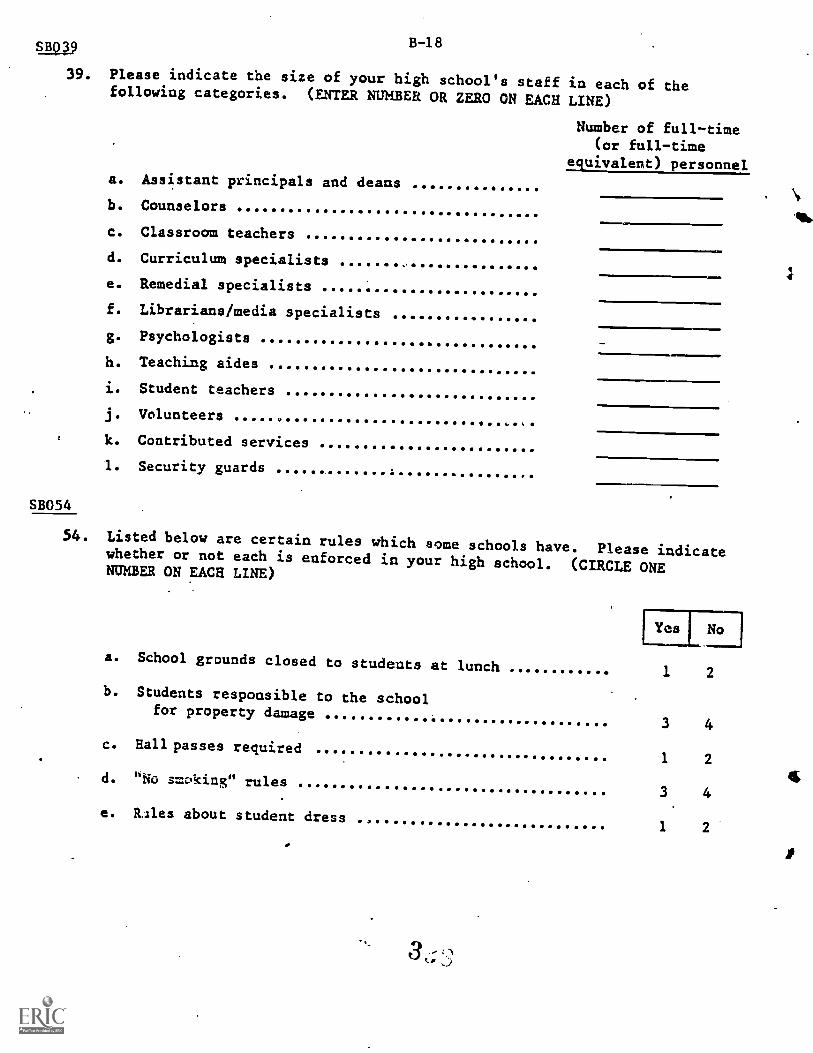
B-18SBN9
39. Please indicate the size of your high school's staff in each of thefollowing categories. (ENTER NUMBER OR ZERO ON EACH LINE)
Number of full-time(or full-time
equivalent) personnela. Assistant principals and deans
b. Counselors46
c. Classroom teachers
d. Curriculum specialists
e. Remedial specialists
f. Librarians/media specialists
g. Psychologists
h. Teaching aides
i. Student teachers
j. Volunteers
k. Contributed services
1. Security guards
SBOS4
54. Listed below are certain rules which acme schools have. Please indicatewhether or not each is enforced in your high school. (CIRCLE ONENUMBER ON EACH LINE)
Yes I No I
a.
b.
School grounds closed to students at lunch
Students responsible to the school
1 2
for property damage3 4
c. Hall passes required1 2
d. "No smoking" rules3 4
e. Riles about student dress1 2
a
3 C:1
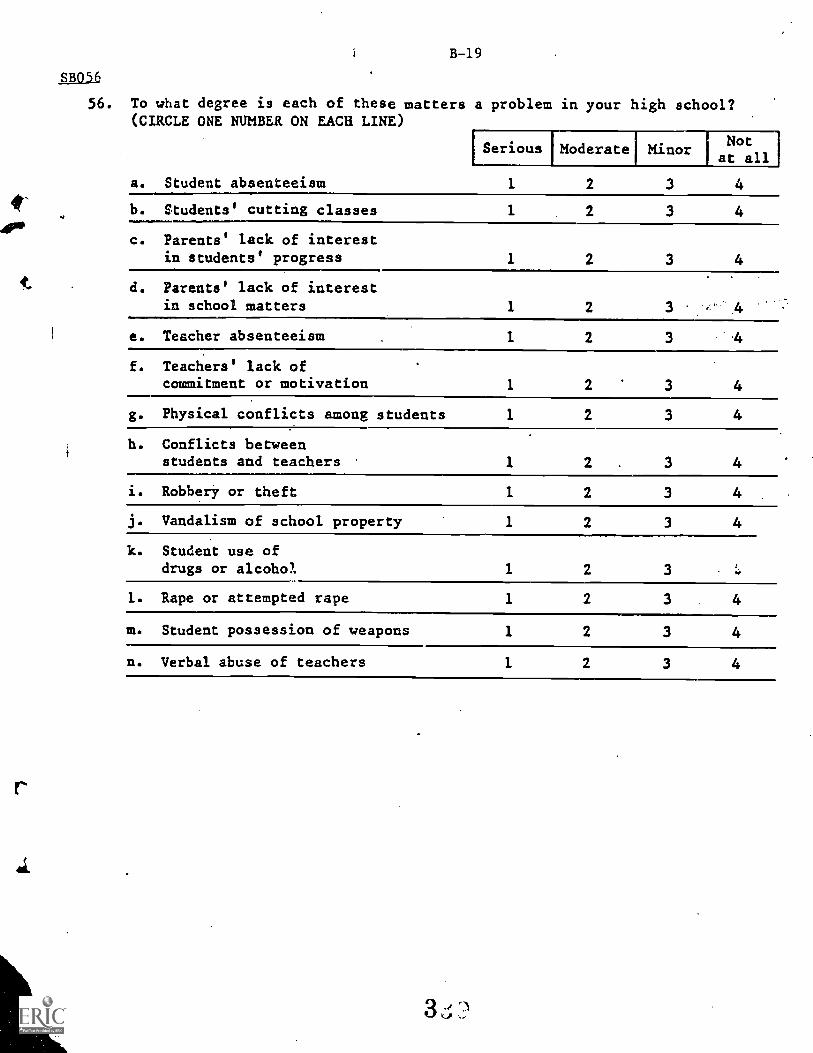
B-19
SB056
56. To what degree is each of these matters a problem in your high school?(CIRCLE ONE NUMBER ON EACH LINE)
SeriousI
Moderate MinorNot
at all
4P.
t
a. Student absenteeism 1 2 3 4
b. Students' cutting classes 1 2 3 4
c. Parents' lack of interestin students' progress 1 2 3 4
d. Parents' lack of interestin school matters
e. Teacher absenteeism 1 2 3 .4
f. Teachers' lack ofcommitment or motivation 1 2 3 4
g. Physical conflicts among students 1 2 3 4
h. Conflicts betweenstudents and teachers 1 2 . 3 4
i. Robbery or theft 1 2 3 4
j. Vandalism of school property 1 2 3 4
k. Student use ofdrugs or alcohol 1 2 3
1. Rape or attempted rape 1 2 3 4
m. Student possession of weapons 1 2 3 4
n. Verbal abuse of teachers 1 2 3 4
r
R-1
REFERENCES
Becker. H.J., McPartland, J. M., and Thomas, G. E. 1978. "The Measurementof Sweeation: The Dissimilarity Index and Coleman's SegregationIndex_Compared." Social Statistics SectiOh, ArintialMeeflfigSof the AmericanStatistical Association.
Coleman, J., Kelly, S., and Moore, J. 1975. Trends in School Segregation,1968-1973. Washington: The Urban Institute.
Conant, J. B. 1959. The American High School Today. New York: McGraw-Hill.
Cortese, C. F., Falk, R. F., and Cohen, F. 1976. "Further Considerations onthe Methodological Analysis of Segregation Indices." American SociologicalReview 41: 630-37.
Erir:kson D. A., Nault, F. L., and Cooper,
IticUlininriEroltenn7olThNational Institute of Education.
B. 1978. "Recent Enrollment TrendsAbramowitz and Stuart Rosenfeld, eds.,of the Coming Decade. Washington, D.C.:
Kraushaar, O. F. 1972. American Nonpublic Schools. Baltimore: The JohnsHopkins University Press.
Lott, J. R. and Freling, G. M. 1980. "Juvenile Delinquency and Education: AnEconomic Study." Los Angeles, California: International Institute forEconomic Research, Westwood Center.
McLaughlin, D. H. and Wise, L. L. 1980. "Nonpublic Education of the Nation'sChildren." Palo Alto, California: American Institute for Research, April(mimeo).
National Center for Education Statistics. 1979. Bulletin 80-B012 October 23.
Nehrts, R. 1980. National Center for Education Statistics, Tables A-Tand 1-12 (mimeo).
Thomas, G. E., Alexander, K., and Eckland, B.K. 1979. "Access to Higher Educa-tion: The Importance of Race, Sex, Social Class, and Academic Credentials.School Review 57: 133-156.
West, E. G. 1980. "Education and Crime: A Political Economy of Interdependents."Character 1: 5-7.
Zoloth, S. S. 1976. "Alternative Measures of School Segregation." Land Economics52: 278-298.
GPO 879-019