Embed Size (px)
Citation preview
DOCUMENT RESUME
ED 100 825 SP 008 734
AUTHOR Giovino, Rosemarie; Orlandi, LeeTITLE The Evaluation of a Special Educatton Teacher
Preparation Model, The Integrated Program1973-1974.
INSTITUTION Fitchburg State Coll., Mass. Dept. of SpecialEducation.
PUB DATE 74NOTE 44p.
EDRS PRICE MF-$0.75 HC-$1.85 PLUS POSTAGEDESCRIPTORS *Experimental Programs; *Field Experience Programs;
Models; *Performance Based Teacher Education;*Program Evaluation; *Special Education Teachers;Teacher Education
ABSTRACTThis paper reports the results of the evaluation
study of the Integrated Program, a special education teacherpreparation model at Fitchburg State College. Course content ispresented during formal learning seminars scheduled at schools in thecommunities. Students observe professional personnel teachingchildren and follovup their observations through discussion with acollege faculty member. The students are also prov. d with asupervised teaching experience based on the theoretical frameworkthey are learning. The evaluation focuses on the overall objectivesof the program, which state that a student will be able to (a) listthe strengths and weaknesses of any evaluation instrument, (b) assesschildren's needs through the administration of specific evaluationinstruments, (c) write behavioral objectives, (d) design aninstructional strategy, and (e) identify himself as a member of aprofessional team. ThP control group consisted of students who hadcompleted special education methodology courses prior to initiatingthe experimental integrated program. Tests were constructed tomeasure attainment of program objectives and were administered toexperimental and control group participants. Results of the testsshow no significant differences in the attainment of any objectivesand suggest that when the experimental integrated program is refined,it will produce more capable special education teachers. (HUD)
BEST COPY AVAILABLE
The Evaluation of a Special Education Te ^her Preparation Model,
The Integrated Program
1973-1974
U DEPARTMENT OF NEAL'S.EDUCATION i WELPARENATIONAL INSTITUTE
OP
EDUCATIONrm., (Xi? HAS HIEN REPRO
Mu t) IxACILY AS RECEIVED ROM
?tit 1.1 liSON t)kOR(.ANI/A tioN ORIGIN
A 'IN.. 1OINISOf vit Oti OPINIONS
SIA11 h DO Not hi( ft sSAR1LY REPRE
SI NI 01 t it IA( NATIONALINSTITUTE OF
LOIIiAHION PO1 .1 ION OR POLICY
Preparedby
Dr. Rosemarie Giovino, Associate ProfessorDepartment of Special EducationFitchburg State CollegeFitchburg, Mass.
Assistedby
Dr. Lee Orlandi, Evaluation ConsultantHeuristics, Inc.850 Providence HighwayDedham, Mass.
Table of Contents
Page
INTRODUCTION1
PROGRAM DESCRIPTION 3
General Requirements 3
Structure 3
Content 5
Objectives6
Elementary School - Staff and Students 10
NCATE Standards 10
EVALUATION DESIGN12
PROGRAM OUTCOMES19
CONCLUSIONS28
SUMMARY29
APPENDIX31
INTRODUCTION
The experimental integrated program is the initial phase
of a teacher preparation model developed for the first semester
College junior whose career goal is to be a special educator.
The Integrated Program was designed by the faculty of the Special
Education Department of Fitchburg State College. The major focus
of the program was.tke effort to move the preparation model from
the college to the elementary schools inithe community.
Traditionally, junior students entered the profesiional
block of their college education during the first semester and en-
rolled in the following methods courses given at the colleges
Reading in Special Education
Identification and Diagnosis of LearningDisabilities (elective)
Language Arts
Curriculum in Special Education
Methods and Materials in Special Education
Student teaching was completed in the second semester.
The experimental integrated program, in contrast employs
a different strategy. The underlying assumption is that better
preparation of teachers will occur if college students and college
faculty are located in the educational settings in the communities.
Course content is presented during formal learning seminars scheduled
at the schools in nearby communities. Students observe professional
personnel teaching children, and follow up their observations
through discussions with a college faculty team member who is also
present during observational periods. Further, the college students
-1-

are provided with supervised teaching experience based on the
theoretical framework they are learning. Student teaching occurs
during the final phase of the teacher preparation model.
-2-
J
PROGRAM DESCRIPTION
General Requirements
At the end of the sophomore year Special Education College
Students have completed some of the general education requirments
of the college. In addition, they must have an overall average of
2.0 or above to be admitted to the expeilmental program. Included
in the completed requirements are the following professional courses.
Nature and Needs of Exceptional Children
General Psychology
Child Psychology
Tests and Measurements (if possible)
The remaining general education requirements and elective courses
may be completed during first and/Or second semester senior year.
Student Teaching is done in the second semester junior year or
first semester senior year. Students may elect to enter the experi-
mental integrated program in the second semester junior year. If
they choose the latter course, they continue to take general education
and elective courses in the first semester, junior year, enter the
integrated program second. semester junior year, and complete student
teaching in the first or second semester of the senior year.
Structure
The experimental integrated program was introduced during a
three-week orientation program held on the college campus. The
major emphasis of this first phase was on reading and language
development (18 lecture hours). The design also included an
introduction to the following areas. Organizational 'design and
.3-
planning (6 hours), observational systems (3 hours); group dynamic
techniques (6 hours); learning styles (3 hours); instructional media
(3 hours); social studies (3 hours); creative arts (3 hours); math
methods (14 hours); behavioral management (6 hours). The entire
faculty of the Special Education Department taught during orienta-
tion, along with faculty members from other departments in the
college.
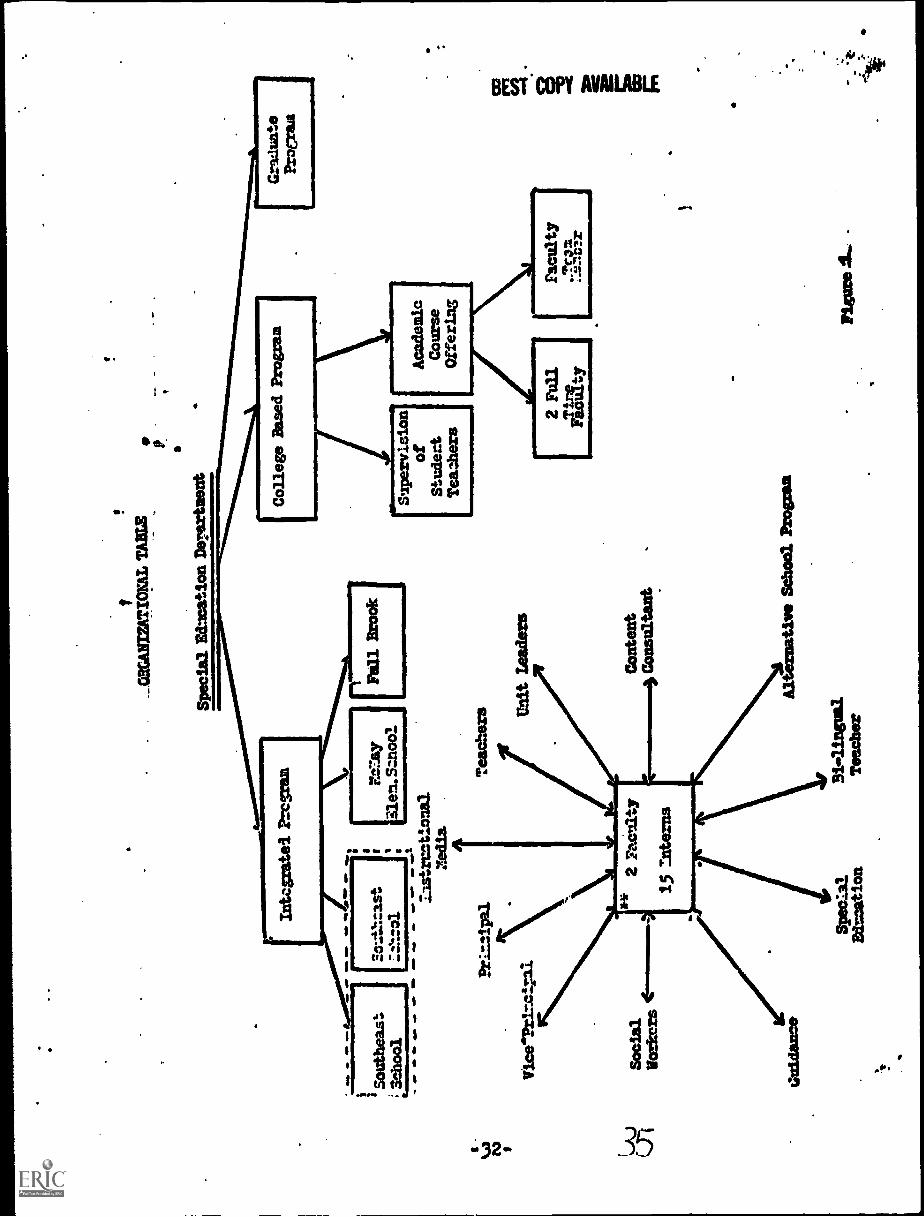
In the second phase four teams, each made up of fifteen
students, and two faculty members from the Special Euucativa Depart-
ment worked in four elementary schools, located in Leominster (3)
and Fitchburg (1), Monday through Thursday from 8,30 to 12,00.
(Faculty members alternated days so that they were free to teach
elective courses at the college and to supervise student teachers.
See Figure 1 in Appendix.) Each team operated out of a classroom
provided for that purpose. The students learned theory during
formal learning seminars, observed children in academic and social
interactions, and taught individual and small groups of children
under direct supervision from college faculty and/Or elementary
school personnel. In this way, the content presented during orienta-
tion was developed further. Major emphasis was placed on reading and
language development, math skills, affective education, individual
diagnosis, prescriptive programming, individually guided instruction,
and group teaching experiences. In addition, on Friday, the program
participants attended planned workshops in math, physical education,
home arts, etc.., held either at the college or at various locations
in the communities.
-4-7
Content
During formal seminars the reading/language content was
presented sequentially beginning with the pre-reading period.
This included defining reading as a physical process, a neurological
process, a language, a social and a cognitive process. Emphasis was
placed on reading as skill development and reading as it related to
the other communication arts. The college student analyzed the
elementary students' learning styles and*diagnand behaviors in
relation to each component of the reading sequence. The, college
student then developed and taught individual programs based on this
analysis. A structured communication system between the college
student, the college faculty team member, and the classroom teacher
permitted formal carry-over of skill development and successful
learning experiences for the child during the integrated day.
The psychological education content included a study of
self-image building, self-concept in relation to group interaction,
value clarification, achievement motivation, group dynamic techniques,
and organizational strategies to program for such learning within
the specific content area of reading and math. The college student
studied the theories related to these areas and experienced a
number of techniques within the team itself, as well as operational-
izing these techniques while working with the elementary students.
Upon completion of one semester of the experimental integrated
program the college student developed at least two prescriptive
programs, one for a primary age child and one for an intermediate
age child. During this educational experience, the college student
observed the children in various academic and recreational settings,
assessed acadsmicand social needs through formal and informal
tests and observations, designed programs based on assessment data,
implemented teaching strategies for a three-month period, and de-
signed a six-month program for these elementary students.
In addition to the above, the college students developed and
taught a learning experience packet for a group of six to eight
elementary age students. The packet was based on the academic and
social interests of these children. Some of the packets included
experiences in the areas oft
Creative Listening Black StudiesStory Plays Physical SafetyMusic Creative ArtCommunity Involvement Social Skill DevelopmentBuying Science
Classroom management strategies and small group interaction processes
were assessed and analyzed by the college students and the faculty
team.
Objectives
The training/learning environment in the community schools
is central to the pursuit of the objectives of the special education-
teacher preparation progrim. Traditionally, these objectives were
accomplished through formal methodology courses and through student
teaching. The experimental integrated progral attempts to achieve
the objectives through academic, observational and participatory
experiences in the elementary school and through student teaching.
The specific objectives of 'the professional block are as
follows*
Objective 1. Students will be able to list the strengths and weak-
nesses of any evaluation instrummt in terms oft
-6-1)
Objectivity
Reliability
Validity
Objective 2. Students will be able to assess children's physical,
socio-emotional, perceptual, academic, language,
intellectual, and psychomotor needs through either
the administration of or examination of the results of
specific evaluation instruments including tests, rating
scales, and systematic observations.
a. Students will be able to list the stages of growth
in the development of:
Language
Motor Skill
Speech
Cognitive functionaling
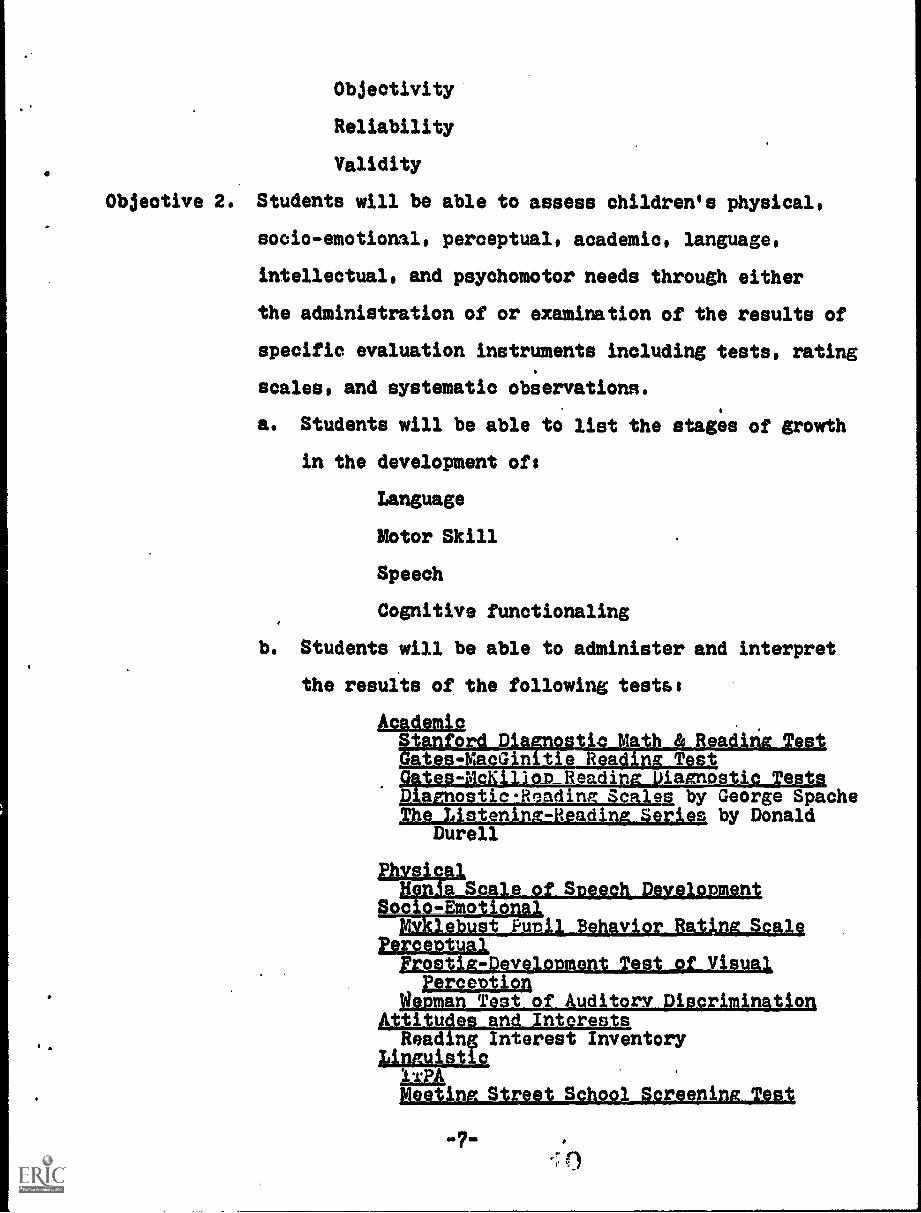
b. Students will be able to administer and interpret
the results of the following testes
AgadalamAnzrsulimorsjsilG t -Ma ts iti Rea i a T stGates-McK lioD_Reading biaonostic TestsDiapnosticReadina Scales by George SpacheThe Listening- Reading Series, by Donald
Durell
Rhysicalpima Scale of Speech Deyelopment
Socio-EmotionalMYklebust Pupil Behavior Rating_ Scale,
pprceptual,Yrosti-Development Test_of_Visual
PerceptionWeinman Test of Auditory Discrimination
Attitufts and Interests,Reading Interest Inventory
Ximuistic1.suMeeting Street Scho1 Screening Test,
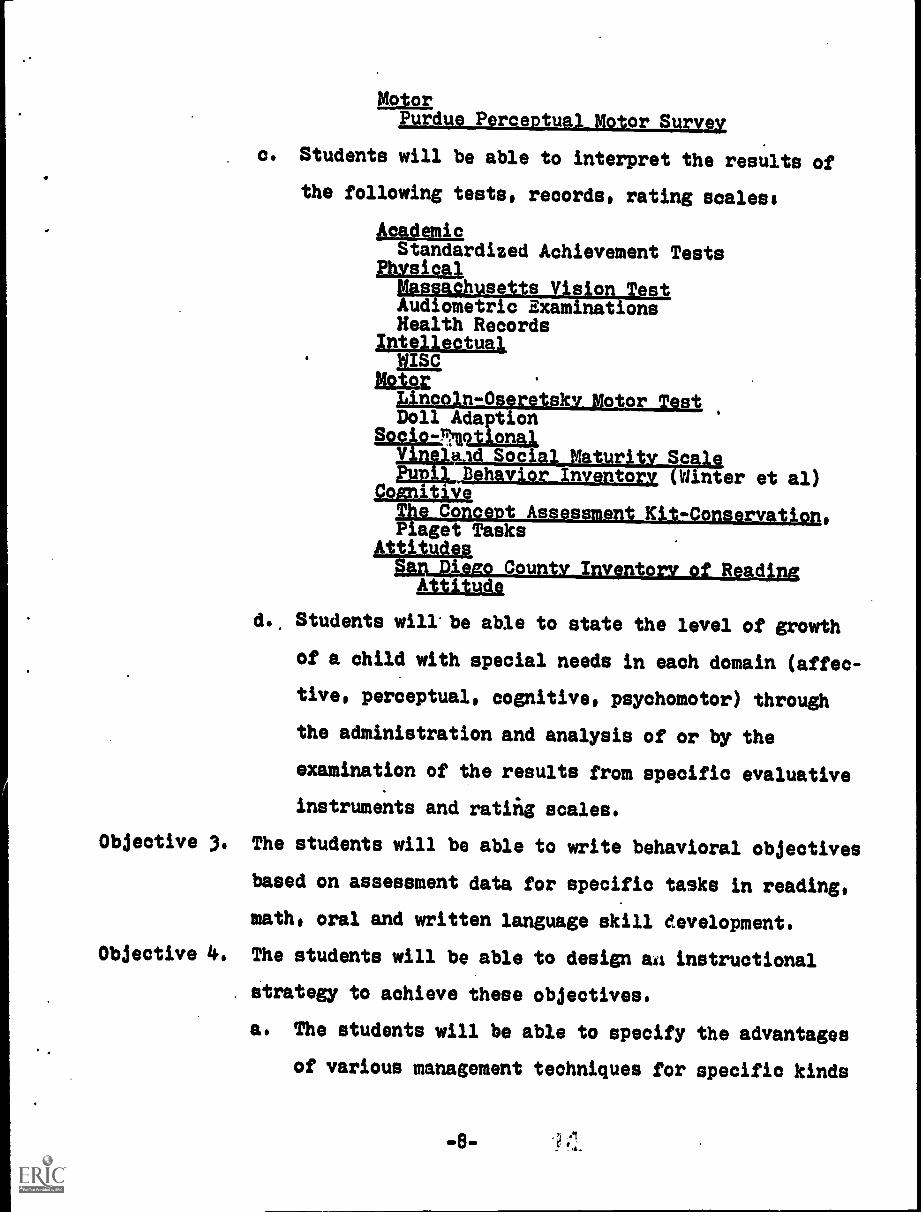
MotorPurdue Per eptual Motor Sury
c. Students will be able to interpret the results of
the following tests, records, rating saltless
Academic,
Standardized Achievement Testsphysical
Massaghusetts Vision Test,Audiometric ExaminationsHealth Records
Iptellectual
Motorpincoln-Oseretsky Motor TestDoll Adaption
So i -Notionejsaid Social Maturity qallBehavior Inventory, (Winter et al)
CognitiveThe Conant Assessment Kit-Conservation,Paget Tasks
Attitude!i,iego County Invento of ReadingAttitudg
d., Students will be able to state the level of growth
of a child with special needs in each domain (affec-
tive, perceptual, cognitive, psychomotor) through
the administration and analysis of or by the
examination of the results from specific evaluative
instruments and rating scales.
Objective 3. The students will be able to write behavioral objectives
based on assessment data for specific tasks in reading,
math, oral and written language skill development.
Objective 4. The students will be able to design Eta instructional
. strategy to achieve these objectives.
a. The students will be able to specify the advantages
of various management techniques for specific kinds
.8.
of leniners on a one-to-one basis and in a group
situation.
one -to -one,
Negative reinforcement, positive reinforcement,
contrast designs
Grow
Group dynamic techniques, transactional analysis,
grouping strategies
b. The student will be able to assess the auditory,
visual, tactile, and kinesthetic learning style
of the child.
c. The student will be able to write lesson plans,
block plans, plan book, a unit, a case study and
individual prescriptive programs in reading, math,
and language in accordance with the child's strong
learning style.
d. The student will be able to define task analysis
and the student will be able to adapt tasks accord-
ing to a visual style of learning or an auditory
style of learning.
Objective 5. The student will serve as a member of professional
teams by contributing quality information (e.g., about
a child's problems, progress, etc.) to appropriate
recipients and by respecting the confidentiality of
this information he or she possesses.
Objective 6. The student will be able to identify him/herself as
a member of a professional team, e.g. willingness
.9--11
to share ideas, willingness to listen to others'
viewpoints, willingness to initiate activities.
Competency in the above objectives is essential to the special educa-
tion teacher.
Elementary School-Students and Staff
The elementary students participating in the program were
from ages six to fourteen years. whey were identified as needing
special help by the unit leaders and the classroom ttacher- The
referrals to the integrated program were based on teachei judgment
and initial screening instruments. An in-depth analysis of learning
needs and the development of prescriptive programs were planned by .
the college students. Since the children were integrated into
regular classes for a part of the school day they were in contact
with not only the special educator but also with other school
personnel, including the principal, vice-principal, special education
coordinator, guidance counselor, bilingual edtcator, instructional
media specialists, speech therapist, unit leaders, curriculum
specialist, and classroom teacher. An important part of the'college
student's preparation as a special educator was to learn how to
work with other school personnel who had roles in the total educa-
tional process of the child.
NCATE Standards
The Integrated Program, as developed, appears to be in accord
with the criteria established for the professional studies component
of the NCATE Standard of 1973, sections 1.31 through 1.3.4s
-10- r I
"...Standard 1.3.3. - Teaching and Learning Theory withLaboratory and Clinical Experience - 'The professionalstudies component of each curriculum includes the sys-tematic study of teaching and learning theory withappropriate laboratory and clinical experience.' Thestudy of teaching and learning theory requires labor-atory experience through which the student may con-ceptualize principles and interpret their applicationto practical problems.
Certain kinds of problems such as planning, selec-tion of learning resources, motivation, presentation,diagnosis of learning difficulties, individualizationof instruction, classroom management, and evaluation,represent recurring types of classroom situations.Clinical teaching involves the student in the diag-nosis and 'treatment' of the individual probl:m, urAlrthe guidance of an experienced teacher. Because it isnow possible to simulate many of these situations'orto display a selection of real problems electronically -and because the prospective teacher's efforts can berecorded, viewed, and reviewed it is now feasible togive much effective clinical experience outside theschool classroom."
Stan4ard 1.3.4. - Practioum - "The professionalstudies component of each curriculum for prospectiveteachers includes direct substantial participation inteaching over an extended period of time under thesupervision of qualified personnel from the institu-tion and the cooperating school..."
EVALUATION DESIGN
Evaluation of an education program may involve tasks
concerned with needs assessment, program planning, program
implementation, process evaluation, and outcome evaluation.
The Experimental Integrated Program offered to students enrolled
in the Special Education program of Fitchburg State College was
concerned with an.assessment of program outcomes, i.e., summa-
tive evaluation, and, to this end, an evaluation plan was
designed. The design, unfortunately, was not developed until
the program was near the end of its first year of operation, and
was developed with this constraint in mind. In some respects,
though, this limitation w.0 turned to its advantage.
As it turned out, a number of students did not participate
in the Experimental Integrated Program this year. These students
were already enrolled in or had completed the special education
methodology courses prior to initiating the experimental integrated
program. The faculty did not consider the non-participants differ-
ent from the participants in any important ways. Although the
non-participants did not-meet the stringent requirements of a
true control group, as is necessary in pure research, they
appeared similar enough to the participants to serve as members
of a comparison group in a summative evaluation study. Conse-
quently, performance of the non-participants (who proceeded
through the regular traditional program for Special Education
students prior to the introduction of the integrated program
this year) was compared with that of participants, in the
expectation that results would provide some indication of the
-12- 15
'effects of the Experimental Integrated Program, as it operated
this past year.
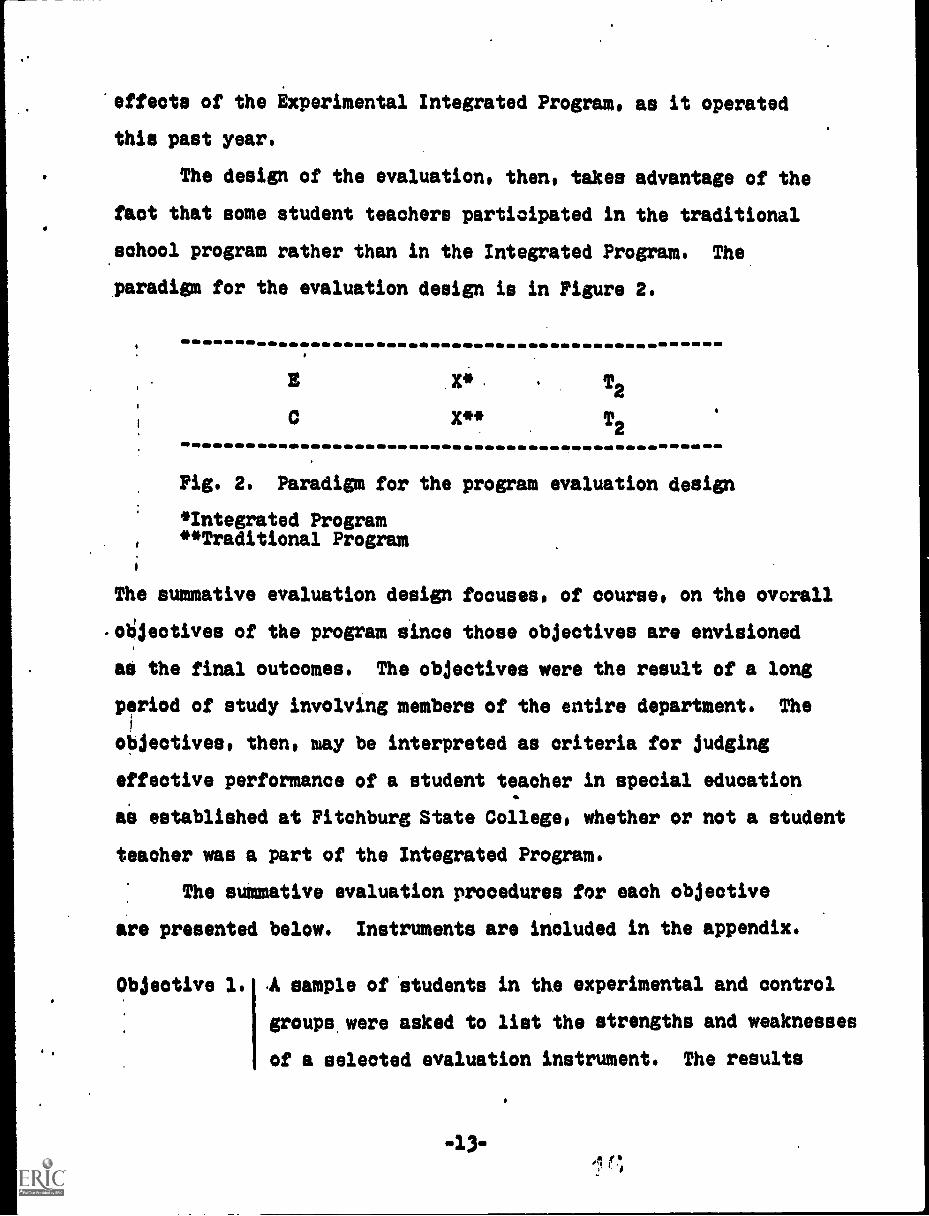
The design of the evaluation, then, takes advantage of the
fact that some student teachers participated in the traditional
school program rather than in the Integrated Program. The
paradigm for the evaluation design is in Figure 2.
E X* T2
C X** T2
Fig. 2. Paradigm for the program evaluation design
*Integrated Program**Traditional Program
The summative evaluation design focuses, of course, on the ovorall
-olijeotives of the program since those objectives are envisioned
as the final outcomes. The objectives were the result of a long
period of study involving members of the entire department. The
objectives, then, may be interpreted as criteria for judging
effective performance of a student teacher in special education
as established at Fitchburg State College, whether or not a student
teacher was a part of the Integrated Program.
The summative evaluation procedures for each objective
are presented below. Instruments are included in the appendix.
Objective 1. A sample of students in the experimental and control
groups, were asked to list the strengths and weaknesses
of a selected evaluation instrument. The results
-13-Ars
Objective 2.(a)
(b)
(c,d)
Objective 3.
were scored by instructors (after establishing
explicit scoring criteria to guard against
intrascorer and intrascorer differences), and
analyzed by at-test for unoorrelated data.
A sample of students in the experimental and
control groups were asked to list and describe
the stages of growth in the development of
language and motor skill. The results were scored
and analyzed in the sameway as for Objective I.
A sample of students in the experimental and
control groups were observed and rated (i.e.lecored)
on their administration of selected tests. The
students were also scored on their interpretation
of selected test results. The scoring and statistical
analysis were the same as described in Objective I.
A sample of students in the experimental and control
groups were presented with a complete case study
presentation of a child including a variety of test
results, personal background information, physical
information,results of observation, rating scales,
etc. On the basis of this case study, the students
were asked to list the child's strengths and weak-
nesses in cognitive, perceptual, psychomotor,
affective areas. The scoring and statistical
analysis were the same as described in Objective I.
A sample of students in the experimental and control
groups were presented with records (see 2c,d) of a
Objective 4
(a)
(booed)
Objective 5
Objective 6
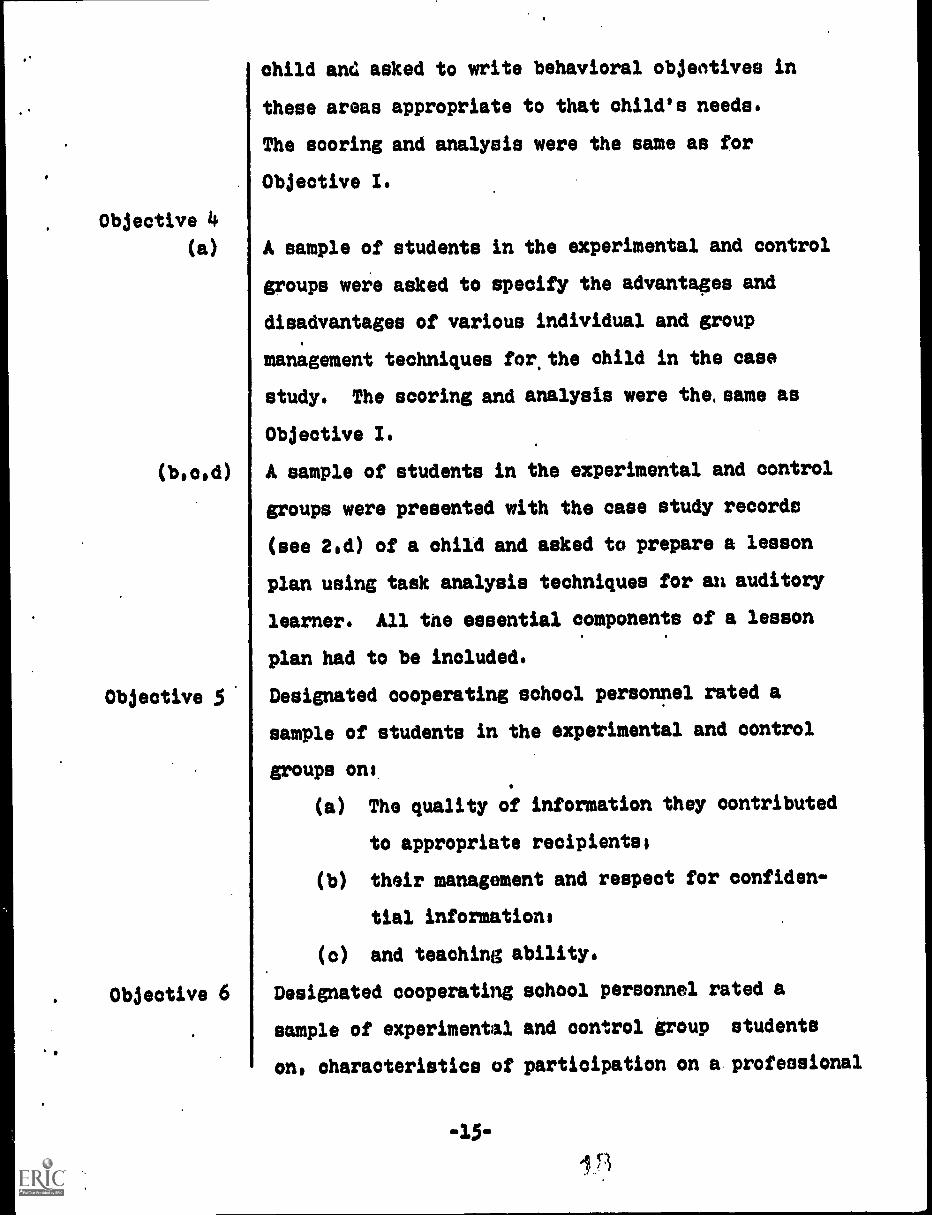
child and asked to write behavioral objectives in
these areas appropriate to that child's needs.
The scoring and analysis were the same as for
Objective I.
A sample of students in the experimental and control
groups were asked to specify the advantages and
disadvantages of various individual and group
management techniques fore the child in the case
study. The scoring and analysis were the, same as
Objective I.
A sample of students in the experimental and control
groups were presented with the case study records
(see 2,d) of a child and asked to prepare a lesson
plan using task analysis techniques for an auditory
learner. All the essential components of a lesson
plan had to be included.
Designated cooperating school personnel rated a
sample of students in the experimental and control
groups on:
(a) The quality of information they contributed
to appropriate recipients;
(b) their management and respect for confiden-
tial information:
(c) and teaching ability.
Designated cooperating school personnel rated a
sample of experimental and control group students
on, characteristics of participation on a professional
-13-
team, e.g., willingness to share ideas, willingness
to listen to others' viewpoints, willingness to
initiate activities.
On May 31, 1974 the student teachers assembled at Fitchburg
State College to take the tests described in the evaluation pro-
cedures. Thirty students had participated in the experimental
integrated program and 39 had participated in the traditional pro-
gram prior to their student teaching experience. Students in each
group (i.e., Experimental and Traditional) were randomly, divided into
two pairs (e.g., 15 and 18; 15 and 21): One of the two pairs was
randomly selected to respond to questions on the case study (i.e.,
items 4,5,7)1 the other pair responded to questions 1,2, and 6.
The cooperating teachers rated the students on the Test
Administration Competence Scale, the scale on Participation on a
Professional Teal, and the Student Teacher Evaluation Form.
All instruments were developed as part of the evaluation.
Within the time limits available, it was not possible to validate
or determine the reliability of the instruments. The instrumentsolo
were prepared, however, with the assistance of a professional
evaluator, and their content was thoroughly scrutinized by members
of the special education department. Evaluation plans for the
future include provisions for refining the instruments in accordance
with accepted principles of measurement.
Two members of the special education department scored the
test items. Each first made up correct answers separately; they
then compared notes, and constructed composite answers. Values
were assigned to each of the points that should have been included
-16-
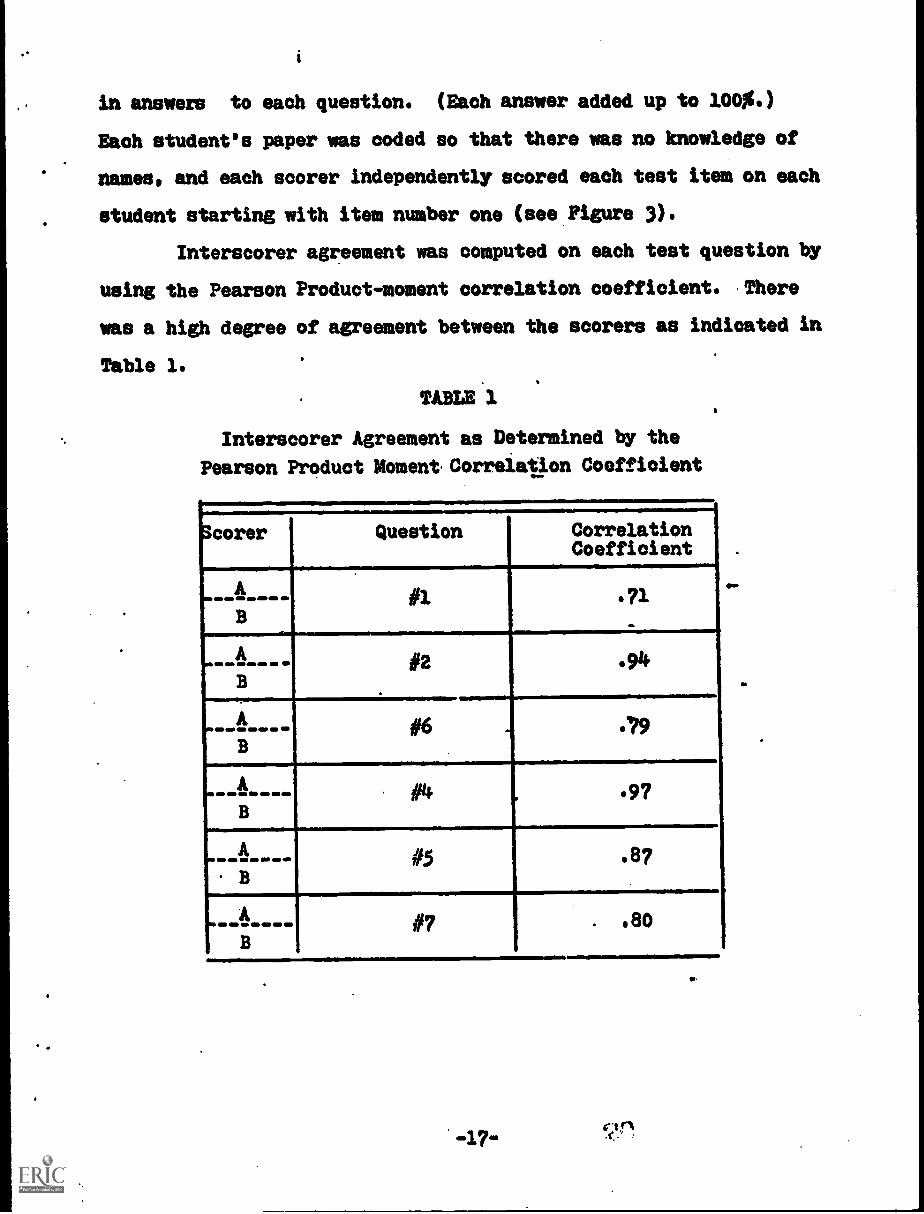
in answers to each question. (Each answer added up to 100)
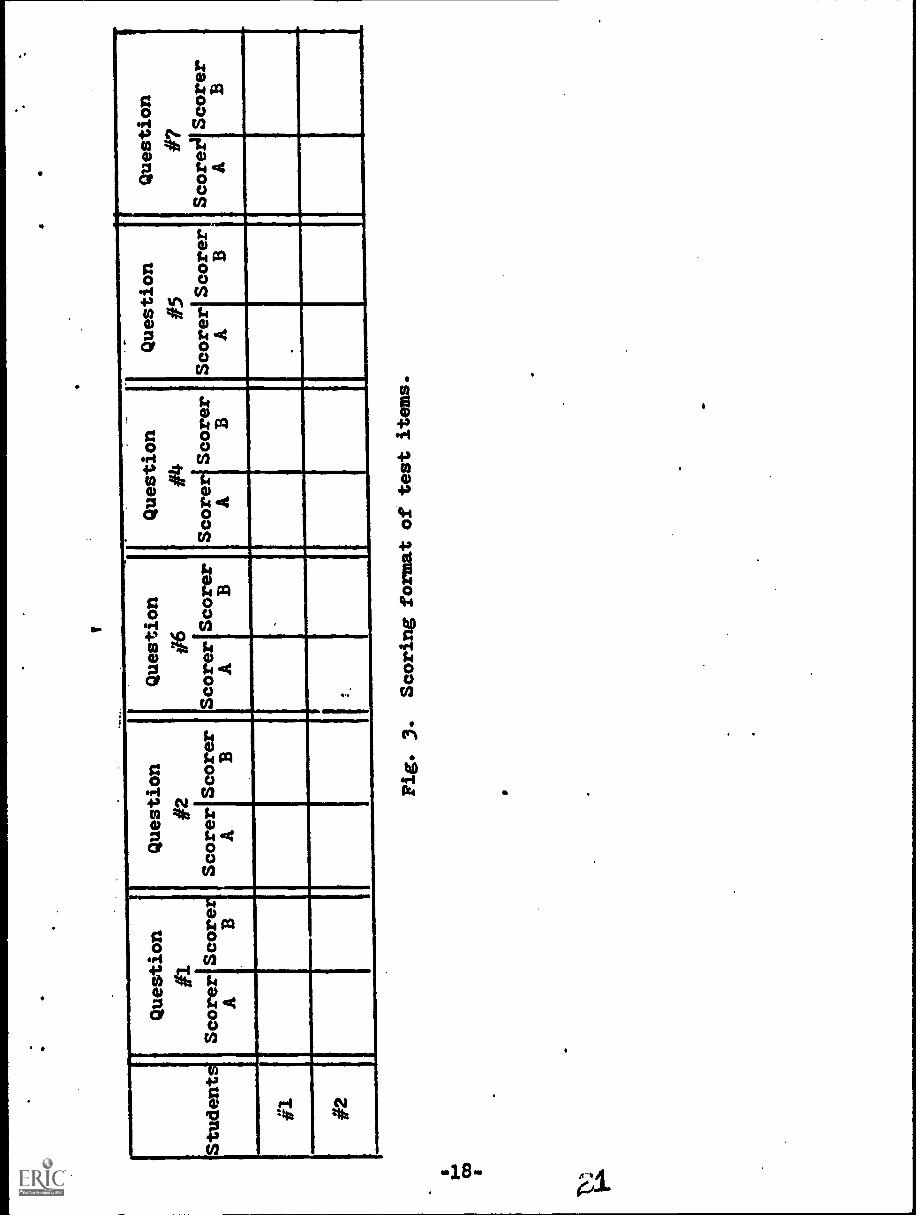
Each student's paper was coded so that there was no knowledge of
names, and each scorer independently scored each test item on each
student starting with item number one (see Figure 3).
Interscorer agreement was computed on each test question by
using the Pearson Product-moment correlation coefficient. There
was a high degree of agreement between the scorers as indicated in
Table 1.
TABLE 1
Interscorer Agreement as Determined by the
Pearson Product Moment. Correlation Coefficient
Scorer Question CorrelationCoefficient
MMMMAM ...B
#1 .71
....A... .
B#2 .94
A
B#6 . 79
A
B#4 ,
.9?
-A
. B#5 .87
... .A....B
#7 .80
ein
Student
I
Question
#1
Scorer
AScore B
Question
#2
Scorer
AScorer
B
Question
#6
Scorer
A
1
Scorer
B
Question
#4
Scorer
AScorer
B
Question
#5
Scorer
AScorer
B
Question
#7
Scorer'
AScorer
B
a #2
:.
Fig. 3.
Scoring format of test items.
PROGRAM OUTCOMES
Results of comparisons between experimental and traditional
groups on each objective have been reported below in accordance
with the evaluation procedures described earlier.
Obiective 1. Qtiestipn 1111
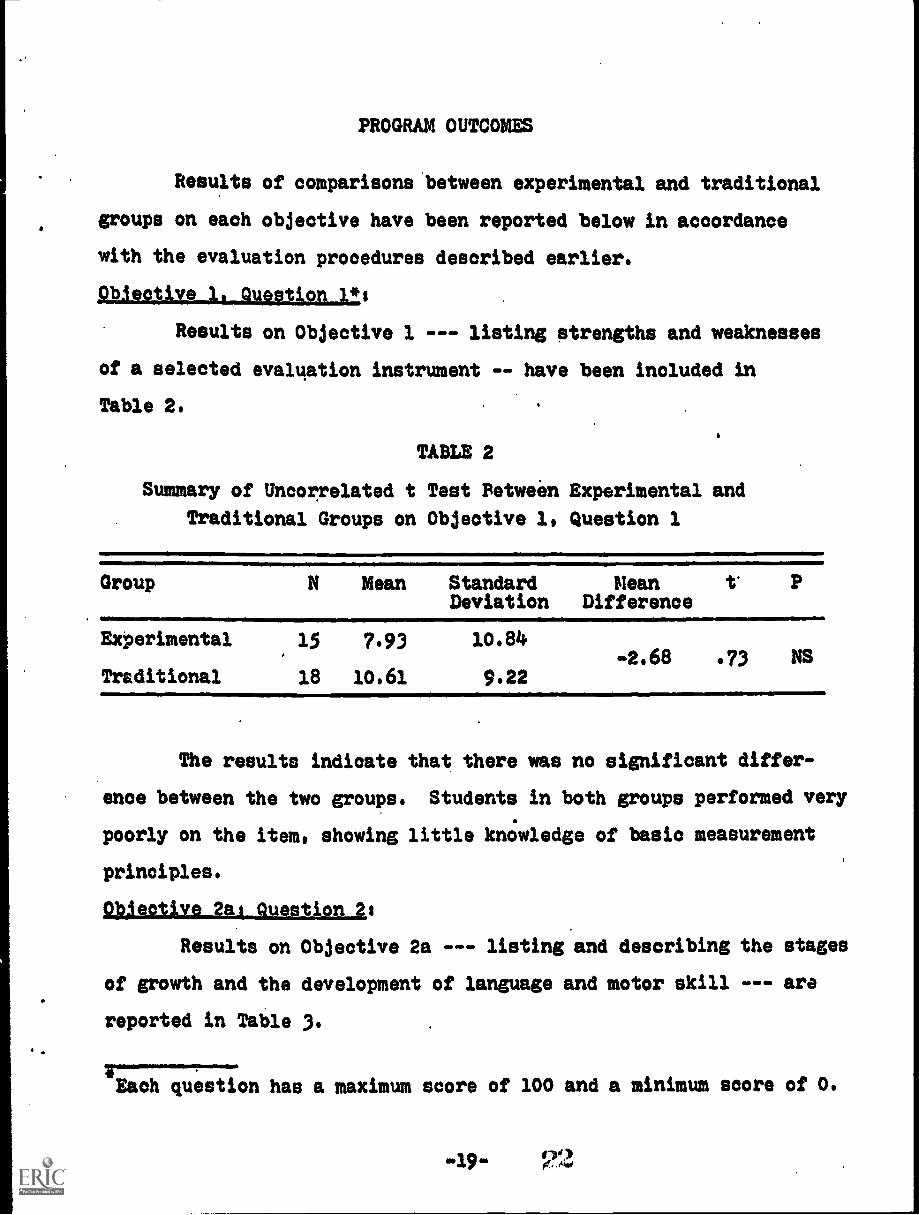
Results on Objective 1 --- listing strengths and weaknesses
of a selected evaluation instrument -- have been included in
Table 2.
TABLE 2
Summary of Uncorrelated t Test Between Experimental and
Traditional Groups on Objective 1, Question 1
Group N Mean Standard Mean t. PDeviation Difference
Experimental 15 7.93 10.84
Traditional 18 10.61 9.22-2.68 .73 NS
The results indicate that there was no significant differ-
ence between the two groups. Students in both groups performed very
poorly on the item, showing little knowledge of basic measurement
principles.
Objective 2ai Question 2,
Results on Objective 2a --- listing and describing the stages
of growth and the development of language and motor skill --- are
reported in Table 3.
Each question has a maximum score of 100 and a minimum snore of O.
-19-
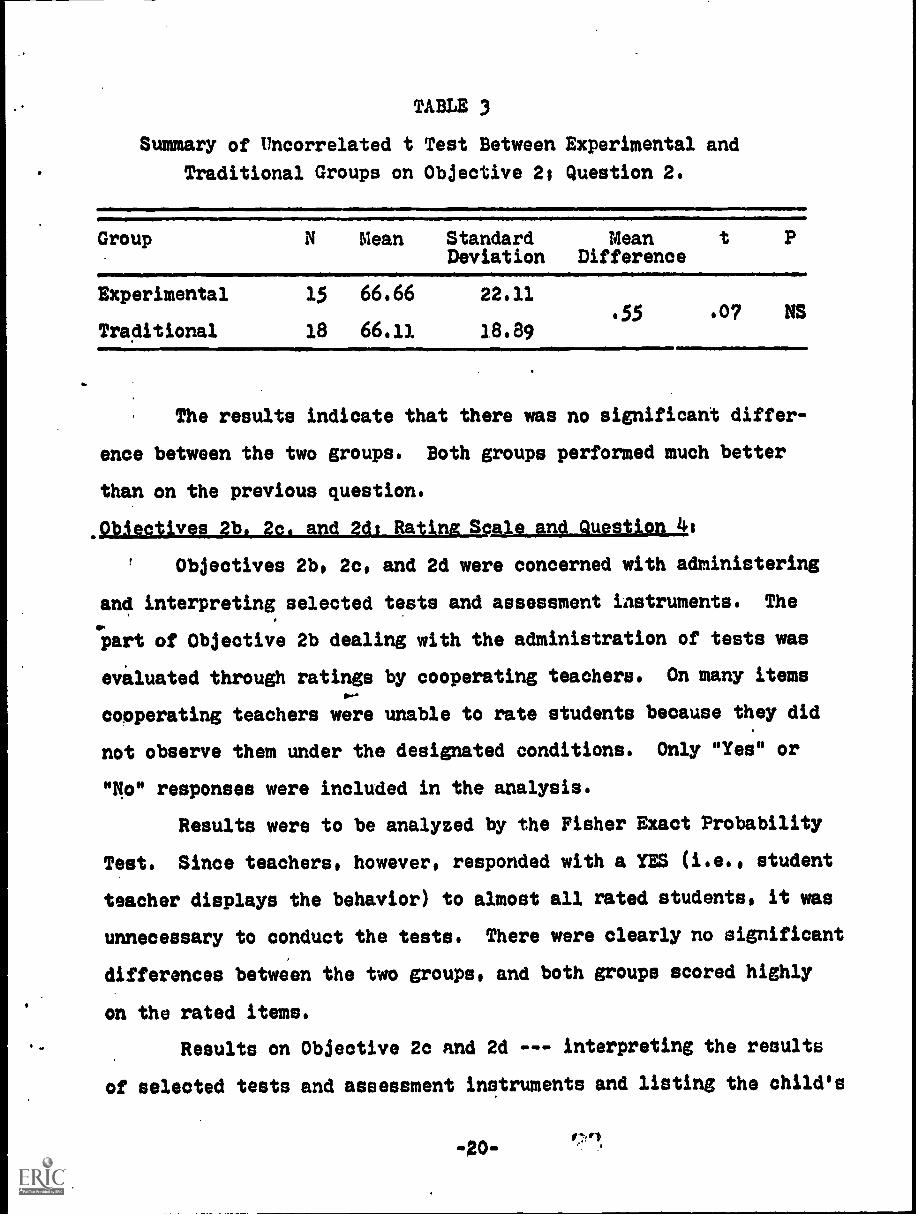
TABLE 3
Summary of tlncorrelated t Test Between Experimental and
Traditional Groups on Objective 21 Question 2.
Group N
Experimental 15
Traditional 18
111111101111=1111111IMMI
Mean Standard Mean t PDeviation Difference
66.66 22.11
66.11 18.8955 .07 NS
The results indicate that there was no significant differ-
ence between the two groups. Both groups performed much better
than on the previous question.
Objectives 2b. 2c. and ids Rating Scale and Question 41
Objectives 2b, 2c, and 2d were concerned with administering
and interpreting selected tests and assessment iastruments. The
part of Objective 2b dealing with the administration of tests was
evaluated through ratings by cooperating teachers. On many items
cooperating teachers were unable to rate students because they did
not observe them under the designated conditions. Only "Yes" or
"No" responses were included in the analysis.
Results were to be analyzed by the Fisher Exact Probability
Test. Since teachers, however, responded with a YES (i.e., student
teacher displays the behavior) to almost all rated students, it was
unnecessary to conduct the tests. There were clearly no significant
differences between the two groups, and both groups scored highly
on the rated items.
Results on Objective 2c and 2d --- interpreting the results
of selected tests and assessment instruments and listing the child's
-20-
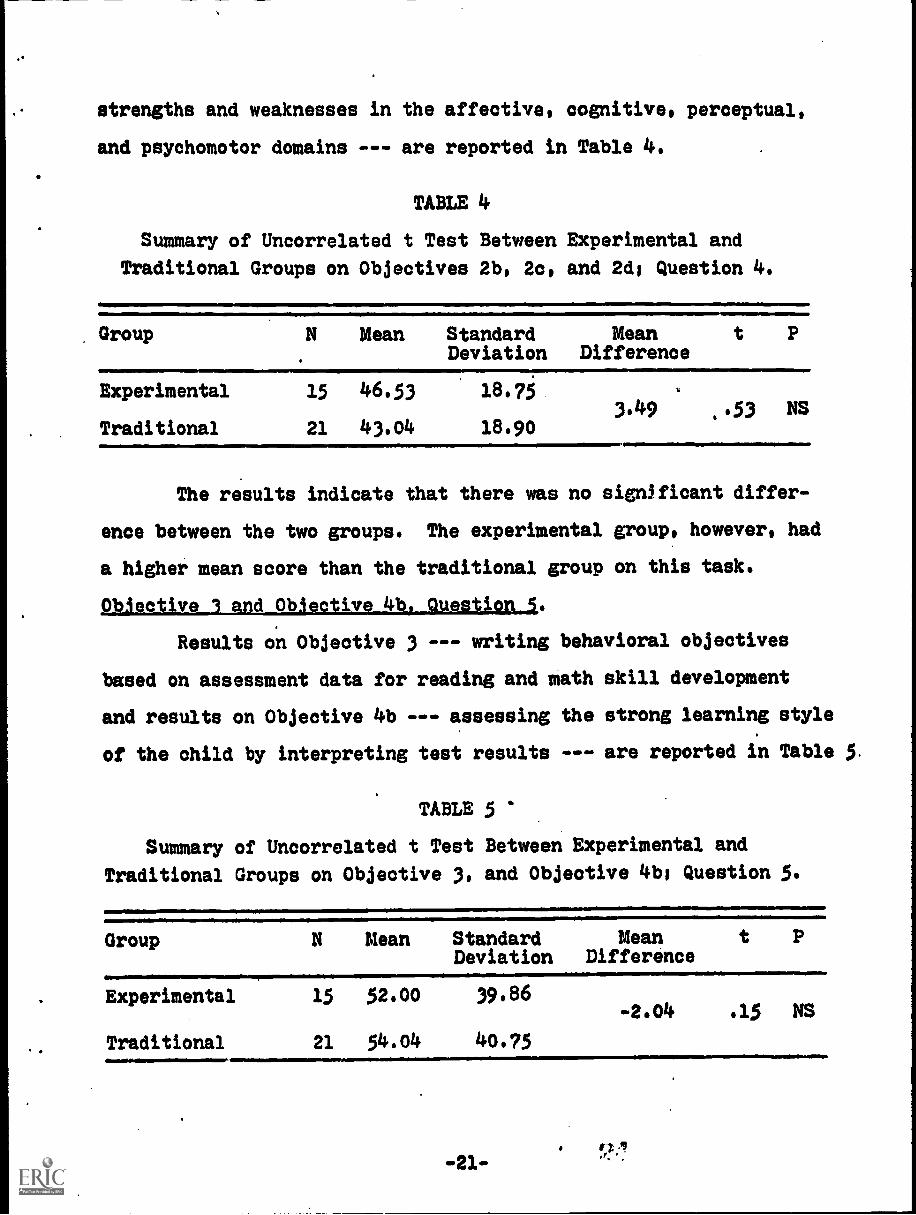
strengths and weaknesses in the affective, cognitive, perceptual,
and psychomotor domains --- are reported in Table 4.
TABLE 4
Summary of Uncorrelated t Test Between Experimental and
Traditional Groups on Objectives 2b, 20, and 2d1 Question 4.
Group N Mean Standard MeanDeviation Difference
t P
Experimental 15 46.53 18.75
Traditional 21 43.04 18.903.49 ..53 NS
The results indicate that there was no significant differ-
ence between the two groups. The experimental group, however, had
a higher mean score than the traditional group on this task.
01 L0bectiv,..921L11,buesti .
Results on Objective 3 --- writing behavioral objectives
based on assessment data for reading and math skill development
and results on Objective 4b assessing the strong learning style
of the child by interpreting test results --- are reported in Table 5.
TABLE 5
Summary of Uncorrelated t Test Between Experimental and
Traditional Groups on Objective 3, and Objective 4bs Question 5.
Group N Mean Standard Mean t PDeviation Difference
Experimental 15 52.00 39.86
Traditional 21 54.04 40.75
-21-
-2.04 .15 NS
11111~AMOMM.11,010
The results indicate that there was no significant differ-
ence between the experimental and the traditional groups on this
task.
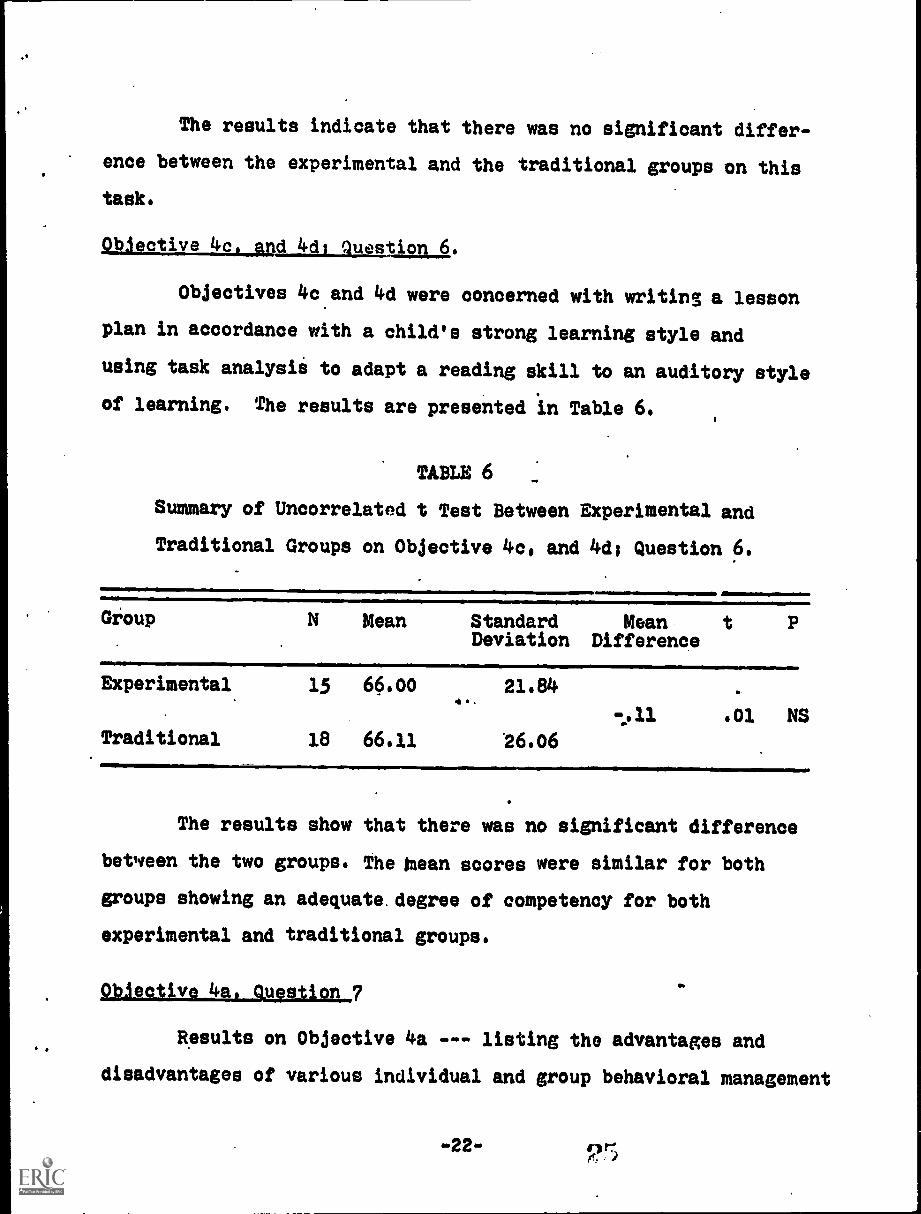
Obiective 4c, And 4d: question 6.
Objectives 40 and 4d were concerned with writins a lesson
plan in accordance with a child's strong learning style and
using task analysii to adapt a reading skill to an auditory style
of learning. The results are presented in Table 6.
TABLE 6
Summary of Uncorrelated t Test Between Experimental and
Traditional Groups on Objective 4c, and 4d1 Question 6.
Group
IIIMMWIMMII.IMPMa
Experimental
N Mean Standard MeanDeviation Difference
P
15 66.00 21.84
.01 NSTraditional 18 66.11 26.06
The results show that there was no significant difference
between the two groups. The bean scores were similar for both
groups showing an adequate. degree of competency for both
experimental and traditional groups.
Diective 4a. question 7
Results on Objective 4a --- listing the advantages and
disadvantages of various individual and group behavioral management
-22-
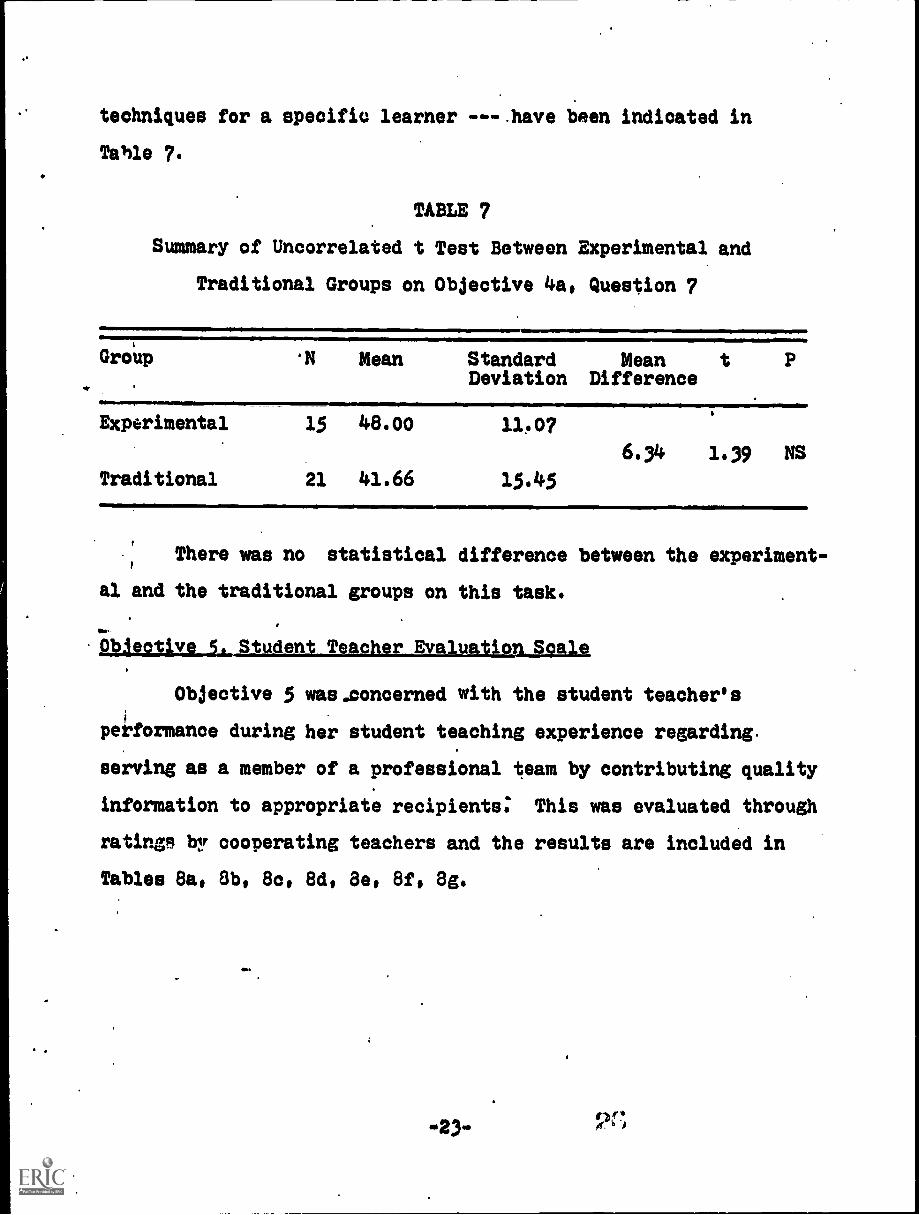
techniques for a specific learner ---.have been indicated in
Table 7.
TABLE 7
Summary of Uncorrelated t Test Between Experimental and
Traditional Groups on Objective 4a, Question 7
Group 'N Mean Standard Mean t PDeviation Difference
Experimental 15 48.00 11.07
6.34 1.39 NS
Traditional 21 41.66 15.45
,
There was no statistical difference between the experiment-
al and the traditional groups on this task.
Objective 5 was.concerned with the student teacher's
performance during her student teaching experience regarding.
serving as a member of a professional team by contributing quality
information to appropriate recipients: This was evaluated through
ratings by cooperating teachers and the results are included in
Tables 8a, 8b, 8c, 8d, 8e, 8f, 8g.
a.
-23-
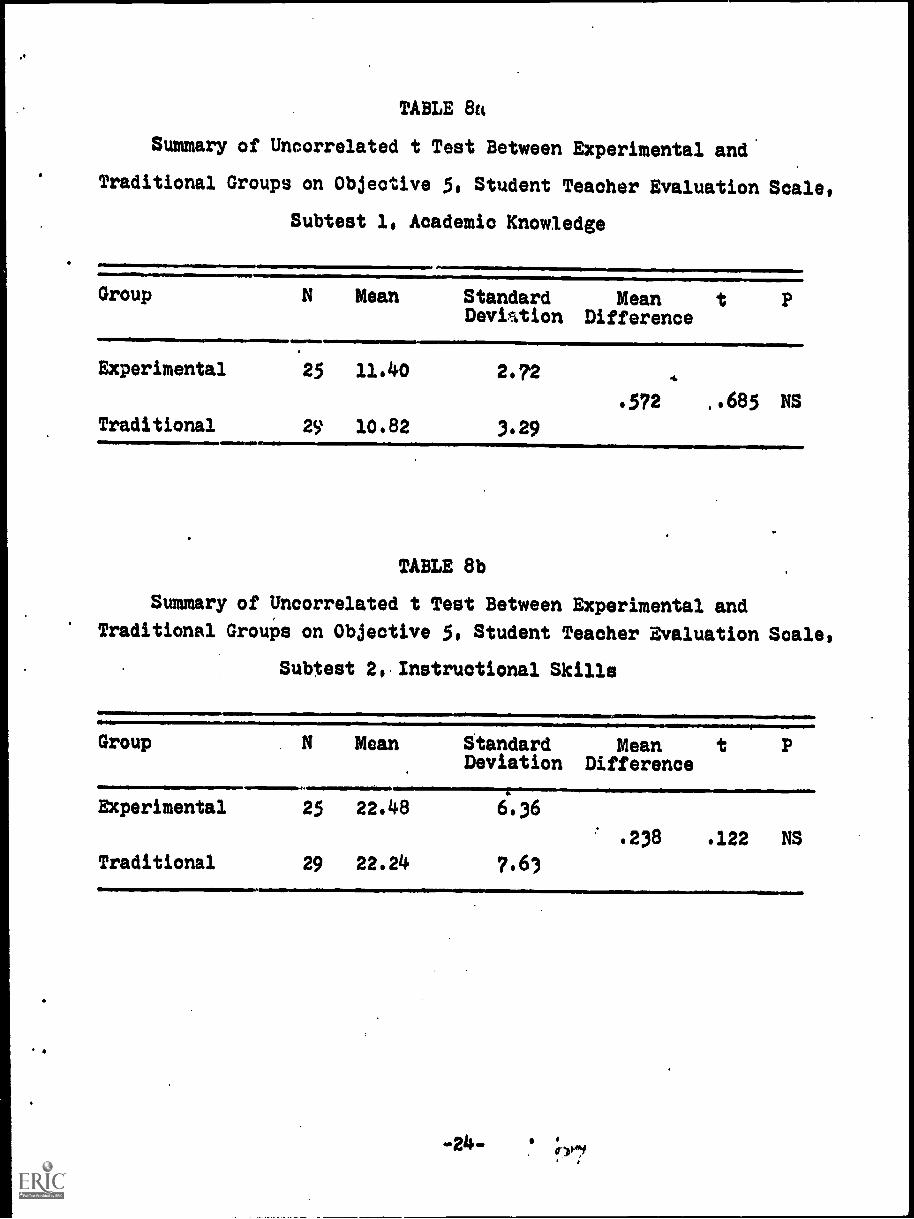
TABLE 8tt
Summary of Uncorrelated t Test Between Experimental and
Traditional Groups on Objective 5, Student Teacher Evaluation Scale,
Subtest 1, Academic Knowledge
4Group N Mean
,Experimental 25 11.40
Traditional 29 10.82
Standard MeanDeviation Difference
2.72 4
.572 ..685 NS
3.29
TABLE 8b
Summary of Uncorrelated t Test Between Experimental and
Traditional Groups on Objective 5, Student Teacher Evaluation Scale,
Subtest 2,. Instructional Skills
ANY ,11111111=111111111/
Group
Nwlimmompre
Mean Standard MeanDeviation Difference
P
Experimental 25 22.48 6.36
.238 .122 NS
Traditional 29 22.24 7.6,
-24-
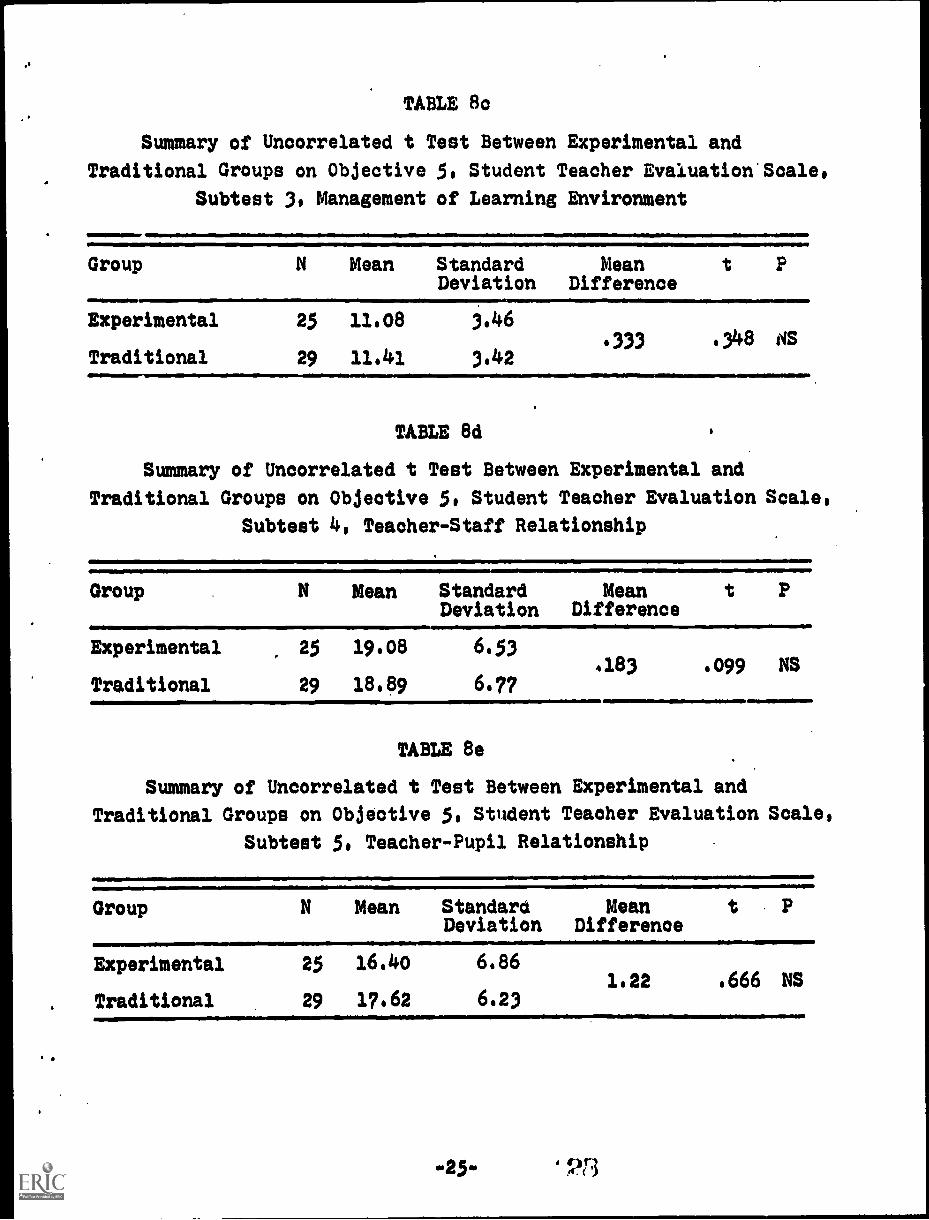
TABLE 8c
Summary of Uncorrelated t Test Between Experimental and
Traditional Groups on Objective 5, Student Teacher Evaluation'Scale,
Subtest 3, Management of Learning Environment
Group N
Experimental 25
Traditional 29
Mean Standard Mean t PDeviation Difference
11.08 3.46
11.41 3.4233 .348 NS
TABLE 8d
Summary of Uncorrelated t Test Between Experimental and
Traditional Groups on Objective 5, Student Teacher Evaluation Scale,
Subtest 4, Teacher-Staff Relationship
Group N
Experimental 25
Traditional 29
Mean Standard Mean t PDeviation Difference
19.08 6.53
18.89 6.7?4183 .099 NS
TABLE 8e
almmill11111=111111M
Summary of Uncorrelated t Test Between Experimental and
Traditional Groups on Objective 5, Student Teacher Evaluation Scale,
Subtest 5, Teacher-Pupil Relationship
Group N
Experimental 25
Traditional 29
1111111M
Mean Standard Mean t PDeviation Difference
16.40 6.86
17.62 6.231.22 .666 NS
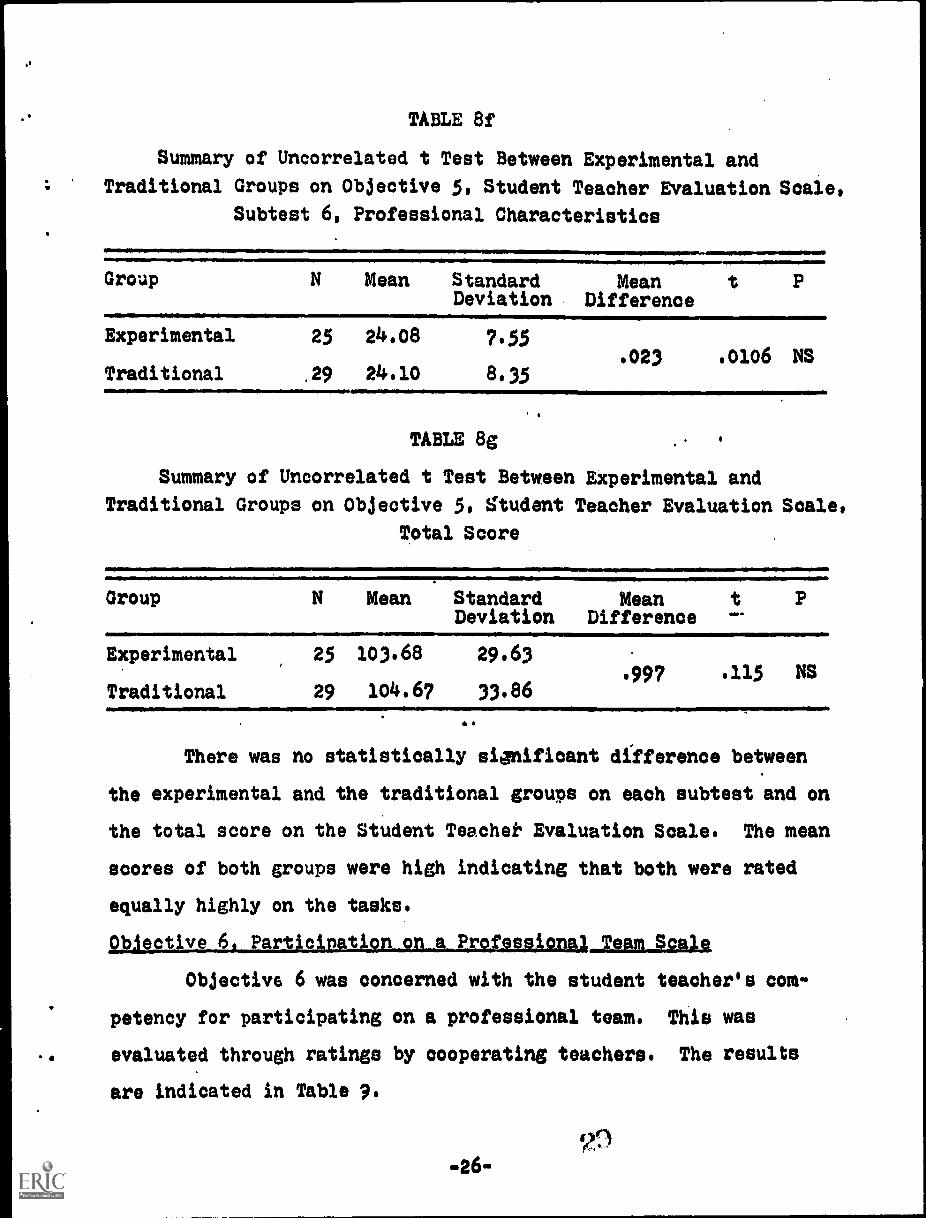
TABLE 8f
Summary of Uncorrelated t Test Between Experimental and
Traditional Groups on Objective 5, Student Teacher Evaluation Scale,
Subtest 6, Professional Characteristics
Group N
Experimental 25
Traditional ,29
vamtwimmalmiaRamMolis
Mean Standard Mean t PDeviation Difference
24.08 7.55
24.10 8.35.023 .0106 NS
TABLE 8g
Summary of Uncorrelated t Test Between Experimental and
Traditional Groups on Objective 5, Student Teacher Evaluation Scale,
Total Score
Group
101111111M.
N Mean Standard Mean t PDeviation Difference
Experimental 25 103.68 29.63
Traditional 29 104.67 33.86.997 .115 NS
There was no statistically sianificant difference between
the experimental and the traditional groups on each subtest and on
the total score on the Student Teschek Evaluation Scale. The mean
scores of both groups were high indicating that both were rated
equally highly on the tasks.
Objective 6, Participation on a Professioneil Team Scale
Objective 6 was concerned with the student teacher's com-
petency for participating on a professional team. This was
evaluated through ratings by cooperating teachers. The results
are indicated in Table 9.
-26-
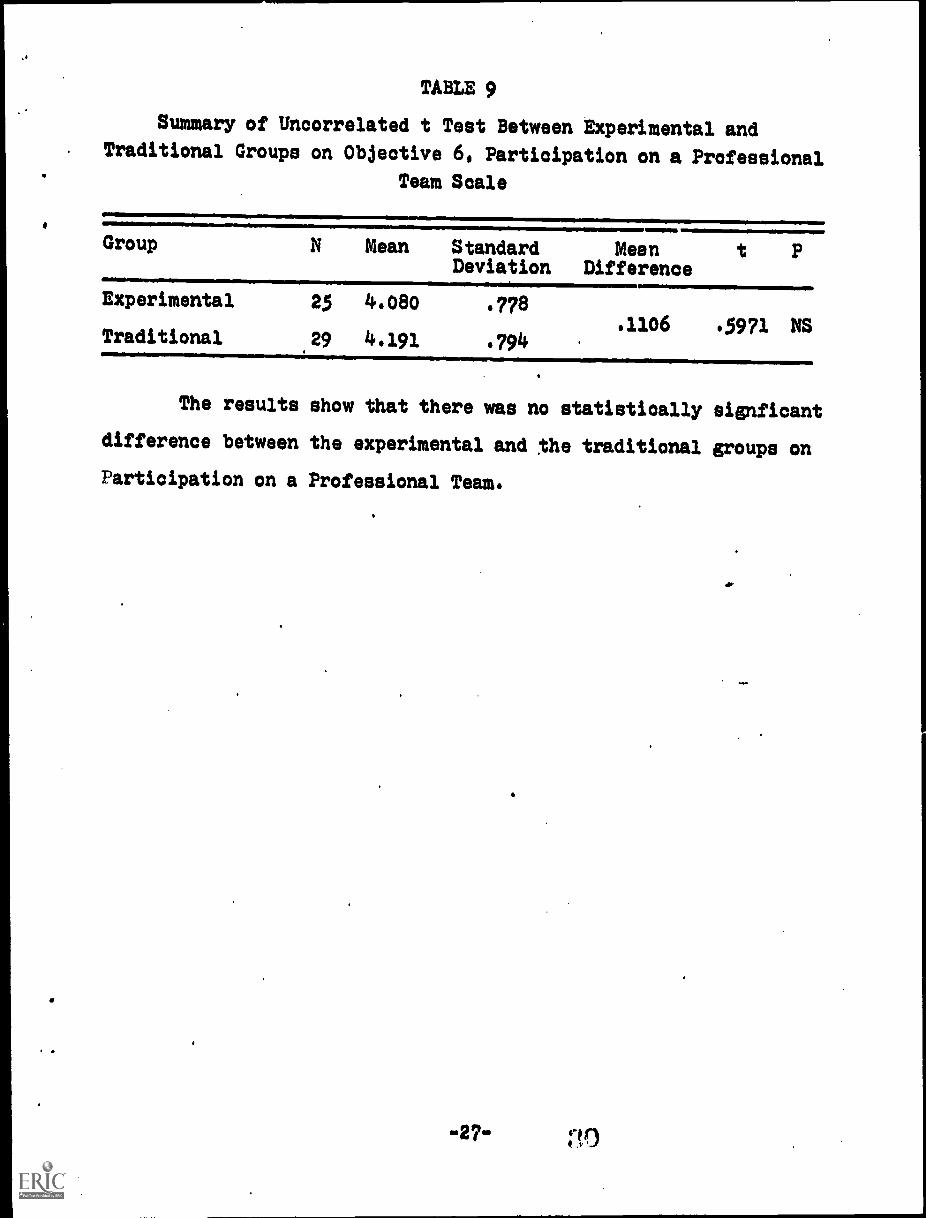
TABLE 9
Summary of Uncorrelated t Test Between Experimental andTraditional Groups on Objeotive 6, Participation on a Professional
Team Scale
Group N
Experimental 25
Traditional 29
Mean Standard Mean t PDeviation Difference
4.080 478
4.191 .794.1106 .5971 NS
The results show that there was no statistically signficant
difference between the experimental and the traditional groups on
Participation on a Professional Team.
ao
ND.
CONCLUSIONS
The evaluation design had important shortcomings, particularly
the use of a control group which had not been randomly assigned.
An assumption was made that the control group was similar to the
experimental group prior 3 receiving the past year of instruction.
The control group had, in fact, taken more course work in the areas
involved, giving it some advantage over the experimental group.
Within the limitations of this design, the data appear to support
the conclusion that the experimental group did not diffei signifi-
cantly from the traditional group on any of the specific objectives
measured. It should be noted, however, that this evaluation did
not measure change in attitude toward school and learning on the
part of the college student or on the part of the elementary
school child worked with. Also the study did not evaluate attitude
change on the part of elementary school teachers toward the child
with special needs. Further the study did not assess the gains
made by the elementary school children in skill development in
reading and math. Possibly these topics could be considered' for
analysis in the future.
In the final analysis, it is important to note that the
experimental program, in its first year of operation, yielded
results comparable to the traditional program. As the program is
refined after several cycles, it is probable that the experimental
program will result in superior performance on the pert of the
students. Certainly the evaluation has identified several areas
in which the educational program is deficient, and obviously re-
quires further review.
-28-
SUMMARY
There are many points of view in the education of children
with special needs and in the education of teachers of these
children. The Department of Special Education at Fitchburg
Stato College believes that the personal and professional growth
of the college student deserves a major emphasis alone with the
development of the children with whom they will be interacting.
.The,00nclusions of this study indicate that we do not have an
answer as to the best way to implement this emphasis, but we do
have an alternative approach, namely,that if students are preparing
to teach children with special needs who are integrated into the
regular school program, they should be taught 3.n a learning
environment that is responsive to their needs and interests and
to the needs and interests of the children with whom they are
Working..
Our approaches in combining theory and practice in the
integrated program ranged from structured daily seminars in con-
tent, guided individual and group observations, group meetings,
group dynamic sessions, supervised teaching of individual children
and of small groups and so on. In plane of traditionally separeGe
courses and content, the regular daily seminar meeting covered
content that might have normally been covered as part of the
regular course structure along with topics that wore directly
related to the daily work with the children. The integrated
program developed the belief that affective and °unitive growth
should go together and the college student was encouraged in
each. The integrated program emphasized an interactive approach
-29- rp I
to learning in which being a member of a group could aid the
eudent in the development of skills as well as offering the
student an opportunity to share his resources with others along
with benefiting from others' resources. In addition the program
encouraged meetings with faculty team members to share affective
reactions to content and teaching processes. Finally, although
not analyzed in this study, was the progress of the elementary
ohildren worked with in the integrated program in reading skill
development as expressed by the classroom teacher. Regardless
of the specifics, however, it seems, from the conclusions of this
study, that there are many ways to communicate to students the
value of their own growth and development and that of the children
with whom they are working. The Department of Special Education at
Fitchburg State College offers the Experimental Integrated Program
as one alternative model for the preparation of Special Education
Teachers.
rlI .1.i.411
.30.

APPENDIX
-31-
'V =
au
Alturiv3
AV
4111T
EM
Z
=M
alanSIT
-TE
nesSitosi vows *A
ntonym
noTw
e=pgr
It Tow
%
azuepptp
Itzw4- InsuoD
szr4soASueluoD
'Mon
gzepurt llua
rarSOM
O0^02:1100
OM
PIM
=O
W 113X
VerettiS
aotunstA
xaclusau
3100311Used
ve.t.k.saezertre..-D
urez2cssa pasvg aorroo
TPaZ
TIM
On=
.11.-er:
tow:sm
ellA
N9-m
2
It:77-141..8TA
Ic7-7A1
0111. 4111.111110
.1=1
44rerrn0F,O
SSV
.AP
I
VD
/XPE
luouVulea uoT
Teor453 PripadS
_
sun sivicatainexo--4
;
Tavaltz..44tri
Iog
Co1
1
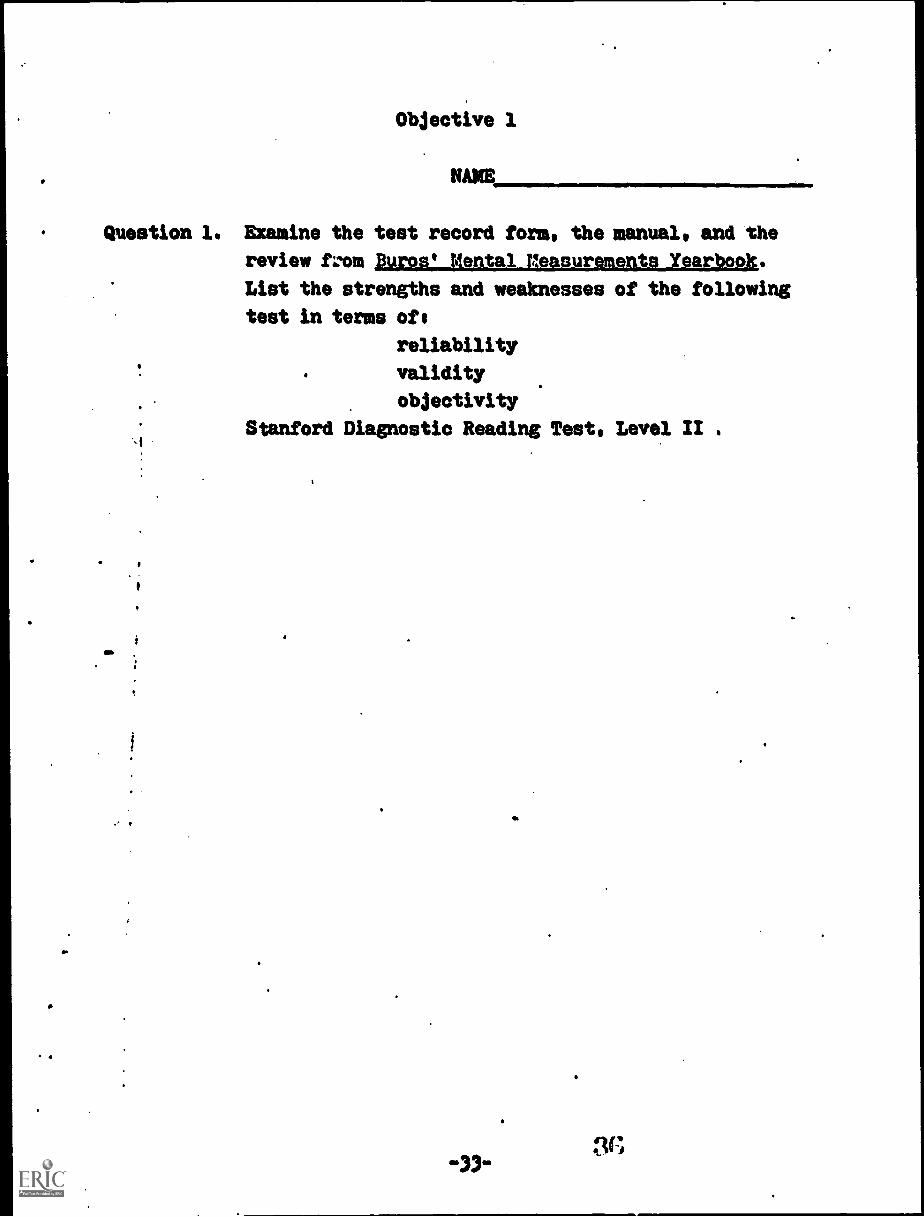
Objective 1
Question 1. Examine the test record form, the manual, and the
review from Buros' Mental Measurements Yearbook.
List the strengths and weaknesses of the following
test in terms of.
reliability
I
validity
objectivity
Stanford Diagnostic Reading Test, Level II .
-33-
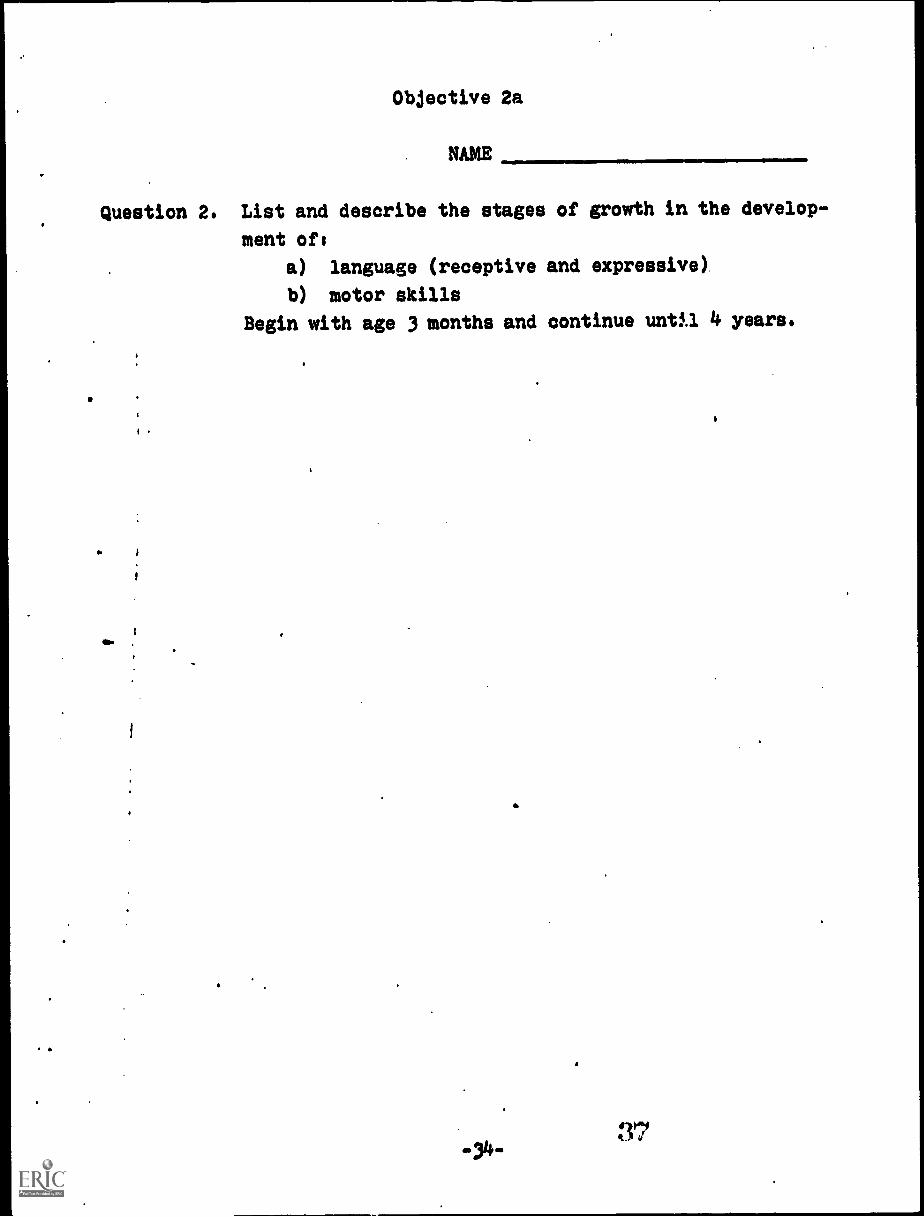
Objective 2a
NAME
Question 2. List and describe the stages of growth in the develop-
ment oft
a) language (receptive and expressive)
b) motor skills
Begin with age 3 months and continue until 4 years.
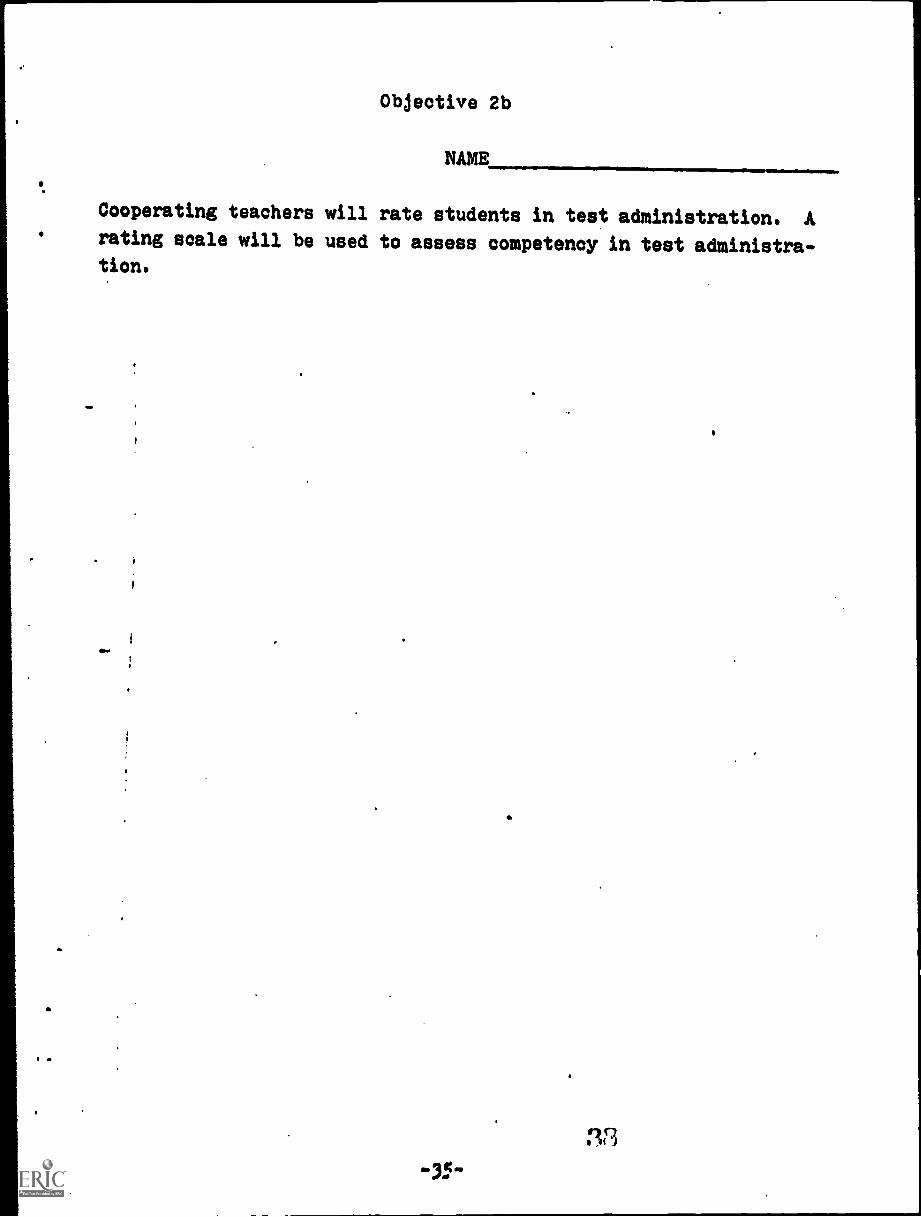
Objective 2b
NAME
Cooperating teachers will rate students in test administration. Arating scale will be used to assess competency in test administra-tion.
Sri
.
Objective 2o, 2d
NAME
Qv'etion 4. On the basis of this case study, list the child's
strengths and weaknesses in such areas as the
followings
cognitive
perceptual
psychomotor
affective
-36-
39
A

Objective 3, 4b
Question 5. On the basis of this case study, write a behavioral
objective appropriate to this child, (a) in the
area of reading skill development, and (b) in the
area of math skill development.
6
11
4
1
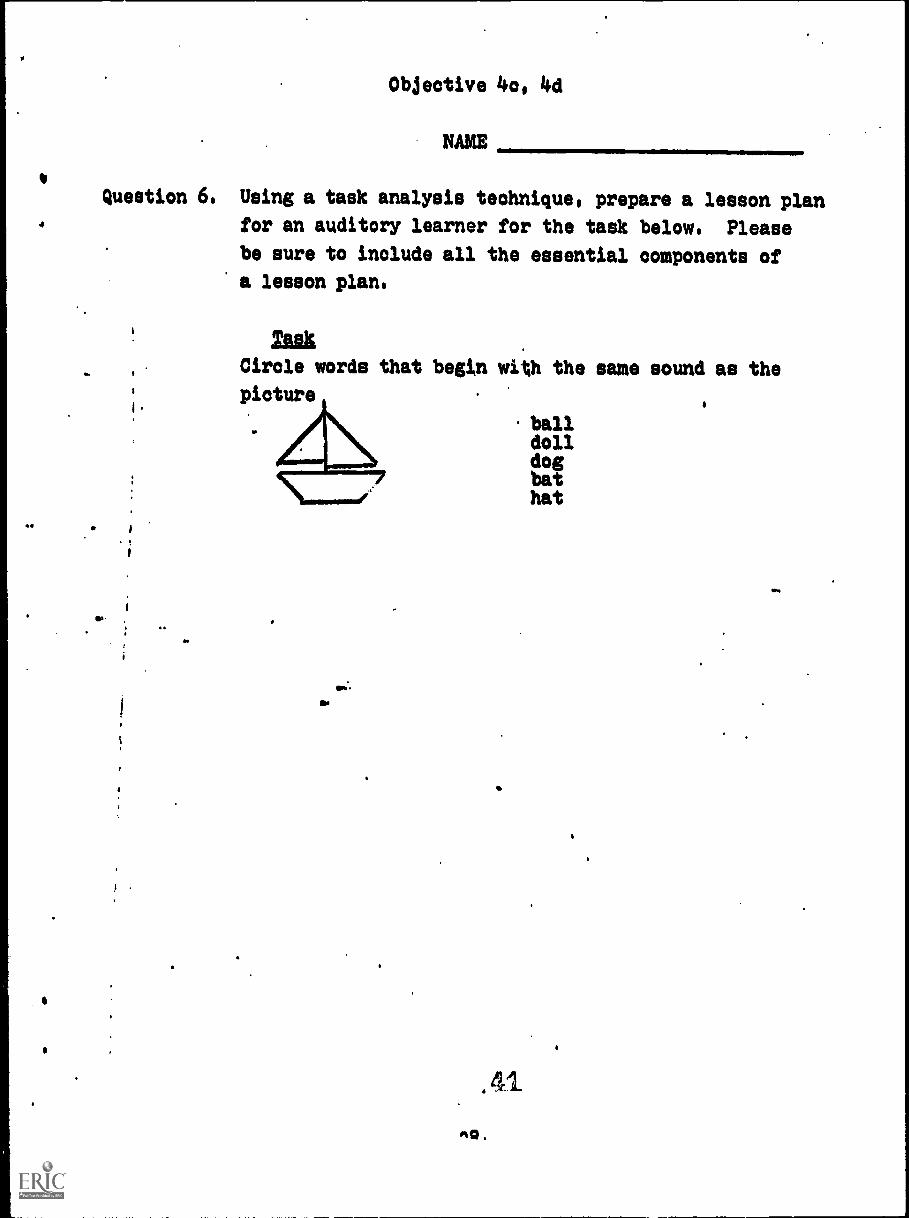
Objective 4e, 4d
NAME
Question 6. Using a task analysis technique, prepare a lesson plan
for an auditory learner for the task below. Please
be sure to include all the essential components of
a lesson plan.
ti
InkCircle words that begin with the same sound as the
picture
balldolldogbathat
41
S.
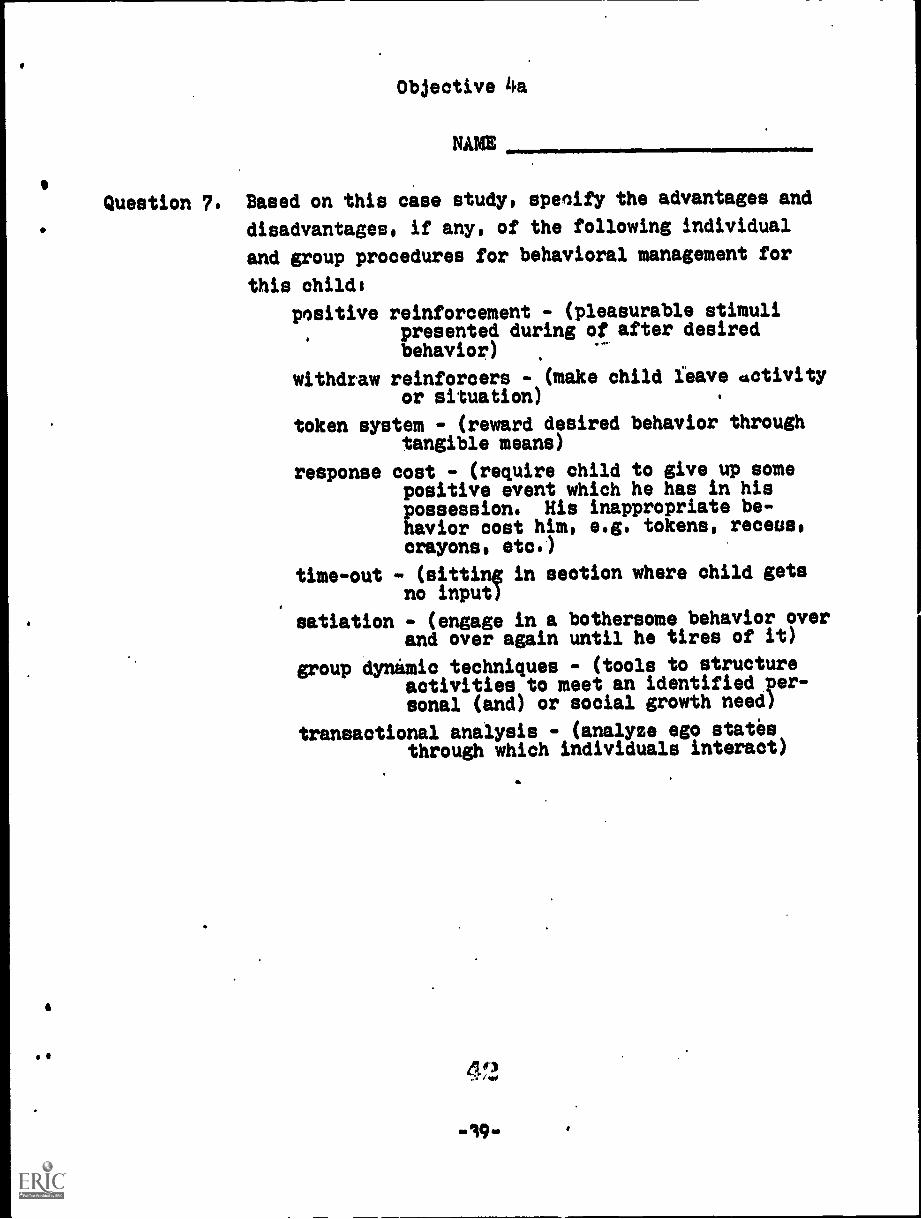
Objective ka
NAME
Question 7. Based on this case study, spenify the advantages and
disadvantages, if any, of the following individual
and group procedures for behavioral management for
this child,
positive reinforcement - (pleasurable stimulipresented during of after desiredbehavior)
withdraw reinforcers - (make child leave activityor situation)
token system - (reward desired behavior throughtangible means)
response cost - (require child to give up somepositive event which he has in hispossession. His inappropriate be-havior cost him, e.g. tokens, receus,crayons, etc.)
time-out - (sitting in section where child getsno input)
satiation - (engage in a bothersome behavior overand over again until he tires of it)
group dynamic techniques - (tools to structureactivities to meet an identified per-sonal (and) or social growth need)
transactional analysis - (analyze ego statesthrough which individuals interact)
Objective 5
Cooperating teachers will complete a rating scale on the student'
teacher regarding academic knowledge, instructional skill,
management of learning environment, teacher pupil relationships.
Objective 6
Cooperating teachers wi31 complete a rating scale on the student
teacher 1 ,garding the student teacher's competency for participat-ing on a professional team.
M.