Embed Size (px)
Citation preview

DOCUMENT RESUME
ED 089,651 HE 005 409
AUTHOR Lavin, David E.; Silberstein, RichardTITLE Student Retention Under Open Admissions at the City
University of New York: September 1970 EnrolleesFollowed Through Four Semesters.
INSTITUTION City Univ. of New York, N.Y. Office of Program andPolicy Research.
PUB DATE Feb 74NOTE 30p.
EDRS PRICE MF-$0.75 HC-$1.85 PLUS POSTAGEDESCRIPTORS *Admission (School); *College Students; Enrollment
Trekds; *Higher Education; Institutional Research;*Open Enrollment; *Retention; Retention Studies;Withdrawal
IDENTIFIERS *City University of New York
ABSTRACTAmong the freshmen who entered the City University of
New York (CUNY) in fall 1970, about 63% were enrolled withoutinterruption in each of their initial four semesters. Approximately70%'of them were enrolled in CUNY during spring 1972, the fourthsemester since their original enrollment. At the senior college, morethan 75% were in attendance during the fourth semester; this was truefor 60% of the students from the community colleges. At both, highschool average was positively associated with retention. Amongstudents who left college, about 18% returned and were present forthe fourth semester. While attrited students from community collegeswere more likely to return than those from senior colleges, thedifferences were quite small. With regard to net retention rates,there was considerable variation among the colleges of CUNY. Therewas even more variation in the rates of return of attrited students.When the C4NY net retention data over four semesters are comparedwith national data over eight semesters, it is apparent thatconsiderably more attrition will have to cccur before the CUNY netretention rate approaches the threshold defined by the national data.(Author)

BEST COPY AVAILABLE
1.11 STUDENT RETENTION UNDER OPEN ADMISSIONS AT THE CITY UNIVERSITY OrNI.IV YORK: SEPTEMBER 1070 ENROLLEES FOLLOWED THROUGH FOUR SEMESTERS
CT,CC)
U S DEPARTMENT OF HEALTH,EDUCATION &WELFARENATIONAL INSTITUTE OF
EDUCATIONTHIS DOCUMENT HAS BEEN REPRODuCED EXACTLY AS RECEIVED FROMTHE PERSON OR ORGANIZATION ORIGIN
INC,A. IT POINTS OF VIEW OR OPINIONSSTATED DO NOT NECESSARILY REPRESEN TOFF ICI AL NATIONAL INSTITUTE OFEDUCATION POSITION OR POLICY
ss
by
David F. Lavin, Associate ProfessorHerbert H. Lehman College
and
Richard Silberstein
February, 1974
Office of Program and Policy ResearchCrIN UNIVERSIU OF NEW YORK
S35 East 80 StreetNew York, N.Y. 10021
abe

INTRODUCTION
In the fall of 1970, the City Univorsit) of New York (CONY) initiated
a policy of open admissions, whereby all graduates of New York Ciiks high
schhols were guaranteed admission. An important goal of the open admi!.sioie;
progrmii is to avoid the low retention rates which have characteri7,0d open
admissions models in other places. For this reason retention data. a .c-
u !i--
of great interest and significance, both within the University and for
the public) Indeed, the question of retention has generated considerable
controversy. Some of the issues may he clarified by data we shalt present.
This report has two aims. First, it presents data concerning tho phenomena
or retention, (including return from temporary leave). Second,
the CUN1' data in A national\context, thus adding perspective for the local
considers
Setting.
niscns,:ions of college attrition use the concept in different ways. lie'
troadost definition would concern students who are no longer matricolatei
at the colicTe at which they initially registered. While'snch ra definition
is used in some studies, it is simplistic, since it overlooks a number of
phenomena: the students may have transferred to another CUNY college or
are attending on another basis and are, therefore, still retained by the
University; students may have dropped out of CUNY at on--t,ir and may
reenter later. Thus, a college's retention rate is, to some extent, a
function of the definition.
A very important aspect of retention at CUNY concerns those students who
leave, later to return to college. In A study of CUNY students completed
196S, Max (3) found that less than half graduated within four years.

However, over 70': graduated within seven years -- a figure cons iderably
higher than at other large ttniversit This suggests that a sithstant
number of CONY students exhibit a lot ern of leave and return, Althowli
open admissions has not been in ef feet long enough to assess the presence
or 1114. pattern over a seven year period, data presented by Lavin and
acohy.on 121 showed that , among t he 1970 IresItmen , about 0 t h i riI ul 1ho'cr:C:,--"
who I (. ft a r their st semester had returned for the I tird, fro r
this class, we can nlw present additional data covering the first four
semesters of open admissions.
PROCEDURES
Official CUNY retention data provided periodically by registrars on each
mpus are subject to certain limitations. First, students who transfer
" f ruin t ht r original ro 1 ege to another CIINY unit or to a college out ul t he
LIINY .-,ystm are not counted as ',gained. Second, students who leave and
taen return to another college (both inside and outside of CUNY) are not
cA:nted as retained Thid, students who transfer from the day session to
the evening sessiir at a given college are also not counted as retained,
Fourth, students who leave and then return to their initial college
should he included among the retained but thi.s ;:ay not have occurred for
andall cascsAon all campuses. A consequence of these limitations is that
the registrars' data underestimate the retention rates,
The data presented in thiS report are not subject to ;ill of t he above
I Imitat ions, and t bus may provide a more refined assessment of the phenomena
of retest ion,
Studentswho transfer from their original college to anot her
CUNI fol I ege 0re I i stud as retained. Moreover. students who leave and

- .' -
(akk
return to their origina 1 college. or to another college within he CIINY
system are also included among the retained. (For purposes of !his report,
they have been counted as retained at the college of original enrollment.)
However, the data do have certain limitations which should he noted. rirst,
although We are able to track students who migrate from one college to
another within CUNY, we cannot do this for students who transfer to colleges
outside the University. Second, students who transfer from the day session
to the evening session at a college are not counted as retained. Third,
there are three colleges for which the data are not yet complete enough
to permit application or our computerized tracking system. However for
these campuses we do have the, unrefined registrar data; in response to
requests, we have made "refined estimates" in these three enses.2
In short, though CUNY has made improvements in its data collection
system and will continue to do so -- our data still tend to underesti-
mate retention rates. Nevertheless, the undereimates are not as great
as those contained in the registrars' data.
DEFINITIONS
The data are summarized in terms of the following variables: retention
rate, net retention rate, and fourth semester return rate. The retention
rate is simply the proportion of the original cohort of freshmen who entered
in Fall, 1970, who registered for all of the first four semesters at any
college in CONY. The net retention rate is defined by those students who
are present for all four semesters, plus those students who left, returned,

el
and were present in CONY for the fourth semester, regardless or whether or
not they returned to the college at which they originally matriculated.
The fourth semester return rate is the proportion or attrited students who
returned and were present at any CONY college in the fourth semester.
Our data on retent ion, net retention, and return are considered in the
following manner: First, we present findings for CONY as a whole. Second,
we report aggregate findings for the senior colleges and for community,
colleges. Third, we present data for individual colleges. These findings
are described with reference to high school average (really college ad-
missions average or CAA)4 categories. The following chart indicates the
names and definitions of the high school average categories:
Iligh School
Average (CAA)Senior College Community College
Label Imbel
Less than 70.0", Level li Level it
7(1.(I 74.9':. Level A.I Level A
75.0 79.!r, Level A.2 RcTular 1
80 0_____
.",, or Above Regular Regular 2__..... ...,...____ _______________________...... . ....... _ _ ..
At senior colleges open admissions students are in the Level B, Level A,I,
and level A.2 categories. At community colleges the open admissions students
are in the Level It and Level A categories. These definitions allow one to
compare-senior college and community college students at all levels of high
school average. We also present data on students for whom no information en
high school average was available. This group consists of those who attained
high school equivalency diplomas, students from outside of New York City,
and others for whom the data were missing.

S
In the analyses to follow, data presented cover all freshmen who entered
in 1970. This includes special program students (e.g., SEEK, College
Discovery, and other special programs) .
RETENTION
Data on retention and net retention rates arc. presented in Table 1. The
overall CONY data show that of the students who matriculated in the Fall
of 197, 62.9% were present for all four semesters. As has been demonstrated
in almost all other studies of student retention, therp was a substantial
difference between the senior and community colleges: 71.4% of the students
at the former and 51.4'i, at the latter were present for their first four
semesters. When we consider the students who were in attendance without
interruption, as well as the students who left, returned, and were present
in the fourth semester (the net retention rate) , we see that the proportion
of the original cohort still in attendance was considerably larger. Whereas
the retention rate for the university as a whole was 62.9%, the net retention
wasratoA69.5%. This net rate, was higher for the senior colleges (76%) than for
the community colleges (60.5%). However, at the latter the difference
between the retention and net retention rates was greater.
Among the senior colleges, the schools with the highest net retention rate
were Brooklyn College and Queens College, while those with the lowest were
John Jay and Lehman. At the community colleges the highest net retention
rate was exhibited by Borough of Manhattan, while Queensborough had the
lowest rate.

- 6
We now conAider retention rates in relation to high school average. Table
2 presents the data for level B students (those with high school averages
below 70%). For the university as a whole, the net retention rate was
57.6%. The senior college rate (63.3%) was higher than the community college
rate (55.4%). Among the senior colleges, retention was greatest at Hunter,
City College, and York. It was lowest at Brooklyn College. Among the
community colleges, the net retention rate was highest at Manhattan and
lowest at Queensborough.
We next consider the findings for students whose high school averages were
between 70.0 - 74.9%. The data are presented in Table 3, For this group
the net retention rate for the University was 63%. Retention was higher
at the senior olleges (68.8%) than at the community colleges (60.1%).
2
Among the inddAridual senior colleges, retention was greatest at Hunter,4
City College and York. It was lowest at Lehman. Borough of Manhattan was
the community college with the highest net persistence rate, while Queens-
borough had the lowest rate.
Table 4 presents the data for students with high school averagesAn the
75.0 - 79.9% interval. Seventy percent of these students enrolled during
the fourth semester. Senior college students were more likely to have done
so (72.2%) than community college students (66.7%).
Among the senior colleges, students at Brooklyn had the highest net reten-
tion rate (79.5%); we estimated that John Jay students had the lowest net
retention rate (64.4%). Kingsborough showed the highest net retention

7
rate among the community colleges (74.8%), while Queensborough exhibited
the lowest rate (59.3%),
Table 5 presents the data for students with high school averages of 80%
and above. The net retention rate for these students was about 81%. The
rate for the senior colleges (81.9%) was considerably higher than the rate
for the community colleges (68.3%).
Among the senior colleges, the net retention rate was highest at Rrooklyn
(87.6',i) while the estimated rate for John Jay was 63.2%. For the community
colleges, Kingsborough (75.7%) and Manhattan (74%) showed the highest net
retention rate, while Queensborough again had the lowest rate.
Table 6 provides the data for the group of students who have either no
high school average or for whom this information was missing from our files.
For this group the net retention rate for the University as a whole was
60.1 percent. It was higher at the senior colleges than at the community
colleges.
Three main points emerge from this data. First, when students who left,
returned, and were present in the fourth semester were added to those who
were matriculated without interruption, the retention rate is increased.
Second, both the retention rate and the net retention rate were higher
at the senior colleges than at the community colleges. Third, both rates
were positively associated with high school average That is, as high
school average increases, the greater is the probability that students who
entered the University in the Fall, 1970, would be in attendance for the

fourth semester.
8
RETURN
An important aspect of retention analyses concerns the proportion of
attrited students who return. (An earlier report (2) indicated that about
one-third of the 1970 freshmen who left after their first semester of
college came hack for the third semester.S) Of all CONY students who
dropped out at any time during the first three semesters, nearly 18% re-
turned and were in attendance for the fourth semester. The summary data
arc presented in Table 7. There was very little difference among the
community collep and senior college return rates.
Return rate data for level B students are presented in Table 8. The Uni-
versity-wide rate was 14.6%; senior colleges and community colleges had
almost the same rate. However, there was considerable variation among
individual campuses. For the senior colleges, almost one-fourth of the
students who left Hunter College returned and were present for the
fourth semester. This was true for only about 7% of those from Brooklyn
College (i.e., those leaving Hunter were more than three times as
likely to return for the fourth semester as the attrited from Brooklyn).
Among the community colleges, the return rate at Borough of Manhattan was
about 28%,while at Kingsborough and NYCCC, it was about 10%.
Table 9 presents data for students whose high school average was between
70.0 74.9%. Overall, about 15% of the attrited students returned for
the fourth semester. Community college figures were similar to those for
senior colleges.

- 9
Hunter College students had the greatest probability of returning, while
Brooklyn and Baruch had tho lowest fourth semester return rate.
At the community collegis, students who left Borough of Manhattan CC
were five times as likely to return as their counterparts at NYCCC.
The figures for attrited students with high school averages in the 75.0 -
7).9 interAl are presented in Table 10. About,Tistudents in this
category returned for the fourth semester. Again, senior and community
colleges had similar return rates.
Ichman (23.10) and York (22.8%) showed the highest r4urn rates, while
Baruch (5%) and Brooklyn (8,9%) exhibited the lowest rates. Among community
colleges, the return rate for students at Borough of Manhattan CC was 35%
At NYCCC the rate was 11.1%. In short, students leaving BMCC were more
than three times as likely to return than those leaving NYCCC.
Table 11 presents the data for students who were graduated from high
school with an average of 80% or above. The return rate for these stu-
dents was about 16%. The differ;:iize between senior (15.7%) and community
colleges (20.1%) was relatively small.
Among the individual senior colleges, almost 29% of York students who
left college returned for the fourth semester. This was true for less
than 8% of Baruch students. Among community colleges, the return rate at
BMCC was almost 30 %; at NYCCC it was 5%.

- 10 -
The data for attrited students without high school averages are shown in
Table 12. The overall return rate for this group was about 35%. There
was substantial difference between senior and community colleges; at the
latter, the return rate was 40%, while at the former it was less than 20%.
While we note this difference, we are unable to interpret the finding at
this time.
In summary, the return rate for the University as a whole was about 18%.
At the senior colleges, high school average was unrelated to the return
rate. At the community colleges, there was a slight tendency for high
school average to be positively associated with return rate.
COMPARISON OF NATIONAL AND CUNY DATA
One of the difficulties concerning the interpretation of CUNY retention
data is that no commonly accepted standards exist which define a "high"
or a "low" rate. One way of approaching this question is to compare CUNY
data with finding:; at the national level. Thus, a "high" rate could he
defined as any figure exceeding the national rate, and a low rate would be
any figure less than the national rate.
The most recent national data have been presented by Astin (1). This
study followed a national cohort of students who entered college as fresh-
men in the Fall of 1966. For this group, one year follow-up data were
collected in the Pall of 1967, and four year follow-up data were obtained
during the Fall and Winter of 1970-71. This second follow-up occurred four
years after original enrollment. Thus, the students in this cohort who
attLd four year colleges, if they were "on schedule", would have been

11 -
graduated in June (1970).
Astin does not present retention data for the,same time period, fourA
thsemesters, covered in this report on
Ace ohort that entered in 1970. Ile
provides data describing retention and degree attainment through eight
semesters. While the tiny periods are not the same, it may he useful to
compare the two sets of data: such comparisons provide an assessment of1
0. the degree to which the CUNY four semester retenon data approach the
:41eight semester threshold provided by the national data. (Of course, CUNY
is not a "typical" university. Compared with students nationally, its
student 4ody has characteristics [lower socioeconomic status, etc.] which
ore more likely to result in lower retention rates.)
The data ore presented in Table The comparisons show that the four
semester CUNY net retention rates are considerably higher than the eight
semester nationiAites. The significance of this is that the CUNY cohort
can withstand considerably more attrition before it approaches the national
eight semester threshold.
SUMMARY
Among the freshmen who entered CUNY in Fall, 1970, about 63 percent were
enrolled withoUt interruption in each of their initial four semesters.
Approximately 70 percent of them were enrolled in CUNY during Spring, 1972,
the fourth semester since their original enrollment, At the s nior
colleges, more than 75 percent were in attendance during the Irth
semester; this was true for 60 percent of the students from community
colleges. At both, high schoO1 average (CAA) was positively associated

6
- 12 -
with retention. (Sec Table 14)
*Among students who left college, about 18 percent returned and were present
for the fourth semester. While attrited students from'community colleges
were more likely to return than those from senior colleges, the differences
were quite small.
With regard to net retention rates, there was considerable variation among
the colleges of CUNY. There was even more variation in the rates of return
of attrited students.
When the CUNY net retention data over four semesters are compared with
national data, over eight semesters, it is apparent that considerably
more attrition will have to occur before the CUNY net retention rate
approaches the threshold defined by the national data.
\., )
et
a-

- 13-
NOTES
1. Many supporters and opponents of open admissions uncritically acceptthe idea that attrition is a "negative" outcome of education. In
many cases this may be untrue, both from the viewpoint of the studentand the University. We believe, for example, that a set of courses,particularly in community colleges, may provide students with skillswhich allow them to find more desirab.1 jobs. From this vantage point,attendance, even if followed by leave, had.a "positive" outcome. In
t short, we believe that even & truncaed exposure to higher educationmay help improve a person's quality of life.
2. Estimates have been made in the following manner: At John Jay College,the average difference between retention and net retention rates forsenior colleges has been added to the retention rate. This generatedthe net retention rate for John Jay. For Bronx and Hostos the sameprocedure was followed, except that we have used the average difference
'forecommunity colleges,
3. Attrited_s.tudents who return to a CONY college other than the one atwhich they originally enrolled were counted as part of the net reten-tion rate for their original college.
4. College Admissions Average (CAA) is computed from grades received infive high school subjects: English, foreign language, mathematics,science, and social studies.
5. Of this group of second semester attrited students, about 32% had re-turned and were also present for the fourth semester.

of
-14-
REFERENCES
1. Astin, Alexander W., Colle e Dro outs: A National Profile, Washington,D. C.: American Council on E ucation, 1972.
2. Lavin, David E., and Barbara Jacobson, Open Admissions Uni-
versity of New York: A Description of Academic Outcomes After ThreeSemesters, New York: City University of',New York, 1973.
3. Max, Pearl, How Many Graduate, New York: City University of New York, 1958.
4. Office of University Management Data, Attrition Ex erience of Enteringply Sossion Matriculated Fall 1970 Freshman Class After One and One HalfYears,
yOf
ith

College
Baruch
Brooklyn
City College
Hunter
John Jay
Lehman
Queens
York
SENIOR COLLEGE
TOTALS
Manhattan
Bronx
Hostos
Kingsborough
NYCCC
Queenshoro
Staten Iand
COMMUNITY COLLEGE
TOTALS
LUNY TOTALS
TABLE 1
Retention and Net Retention Rates
by College
Fall 1970 Freshman Class
C2F
Total Matriculants
Total
.t.
-
Vreseat All
Retention
Four Semesters
Rate
Total
Net
Present In
I--
;Retention
Fourth Semester
Rate
-
1355
927
68.4%
968
71.4%
4319
3408
78.9
3527
81.7
2931
2103
71.8
2212
75.5
3075
2148
69.9
2329
75.7
1022
581
56.8
639*
62.5*
R
2337
1475
63.1
1656
70.9
3400
2566
75.5
2702
79.5
840
558
66.41'
'621
73.9 sick,.
/9,279
13,766
71.4
14,654
76.0
1559
748
48.0
1049
67.3
1827
g1032
56.5
1164*
63.7*
573
289
50.4
330*
57.6*
2492
1337
53.7
1542
61.9
2251
1280
56.9
1360
b0.4
f
3266
1533
46.9
1808
.-
,J..:LD-
2165
1041
48.1
1304
62.2
aw
/14,133
7260
51.4
8557
;........
____---_>-,
__----
..
11,A1!)
21,026
62.97
,
/1 /11

TAflTr 2
Retention ana Net Retention Mies fstr Level B Students by College
Fall 1970 Freshman Class
J
College
,..
Total Matriculants
Total
Frecent All
Four Sem.
Retention
Rate
Total
.kPresent In
Fourth SeT.
Net
Retention
Rate
Baruch
166
89
532.62
103
62.02
dr
Brooklyn
240
123
151.3
131
54.6
City College
287
186
64.8
202
70.4
Hunter
162
105
64.8
119
73.5
John Jay
421
224
53.2
253*
60.1*
Lehman
191
%.
102
53.4
118
61.8
Queens
133
69
51.9
82
61.7
York
164%108
66
61.1
74
68.5
SENIOR COLLEGE
TOTALS
1708
964
56.4
1032
63.3
Manhattan
416
206
49.5
265
-63.7
Bronx
723
388
53.7
442*
61.1*
Hostos
259
118'
45.6
137*
53.0*
Kingsboro4gh
895
456
50.9
499
55.S
YCCC
708
370
52.3
403
56.9
Queensboro
876
345
39.4
421
=.3.0
Staten Island
466
202
43.3
240
51.5
CO:CqUNITY COLLEGE
TOTALS
4343
2085
48.0
2407
=5.4
CUNY TOTALS
6051
3049
50.4
3489
57.6
*Estimate
A

TARLP 3
A4t.ention ana Net xetention Rates for Level A.1 (Senior Colleges) and Level A (Community Colleges) Students
by College (Fall 1970 Freshman Class)
Total
Present All
Retention
Total
Present In
Net
Retention
College
Total :Intriculants
Four Sem.
Rate
Fourth Sem.
Rate
Baruch
261
166
63.6%
177
67.8%
Brooklyn
361
227
62.9
241
66.8
City College
424
281
66.3
302
71.2
Hunter
379
243
64.1
279
73.6
John Jay
--*
--
--
--
Lehmaa
361
197
54.6
228
63.2
Queens
133
77
57.9
89
66.9
York
201
127
63.2
143
71.1
SENIOR COLLEGE
TOTALS
2120
1318
62.2
1459
68.8
Manhattan
390
197
50.5
250
64.1
Bronx
599
338
56.4
3791*
63.1*
Hostos
194
98
50.5
1110e*
57.2'
Ringsborough
749
451
60.2
474
63.3
NYCCC
V634
352
55.5
367
57.9
Queensboro
1053
515
48.9
601
37.1
Staten Island
625
306
49.0
367
,..,
./
COMMUNITY COLLEGE
TOTALS
4244
2257
53.2
2549
.63.1
CUNY TOTALS
6364
357 5
56.2%
4008
03:1
2,*Data not available
**Estimate

TABLE 4
Retention and Net Retention
Rates for Level A.2 (Senior Colleges) and Regular I (Community Colleges) Students
by College (Fall 1970 Freshman Class)
Total
Present/41- -Retention,
Total
Net
Present In
Retention
C2ngjmroaLktKraicyjjxsm,__.1ate,
Baruch.
495
-
335
67.7%
343
69.3%
Brooklyn -
650
-504.
77.5
517
79.5
City College
701
473
67.5
303
71.8
Bunter
-
666
455
68.3
495
14.3
John Jay
514
305
59.3
331*
64.41
Lehmaa
794
478
60.2
551
69.4
/Queens
492
337
68.5
360
73.2
York
'372
258
69.4
284
76.3
SENOR COLLEGE
TOTALS
"
4684
3145
67.1
3384,
72.2
Manhattan
323
166
51.4
---222
-68.7
Bronx
505
306:
60.6
343**
68.0**
Hostos
120
760.8
82**
68.3**
gingsborough
397
274
69.0
297
74.8
NYCCC
450
297
66.0
314
69.8
Queeusboro
816
432
52.9
484
59.3
Statea Island
465
278
59.8
310
66.7
COMMUNITY COLLEGE
'3076
TOTALS
1826
59.4
2052
66.7
CUNT TOTA LS
7760
4971
64.0%
5436
70.0Z
*Estimated-Includes all Level A S
eats (A.1 + A.2)

TABLE 5
Retention and Net Retention Rates for Regular (Senior Colleges) and Regular 2 (Community Colleges) Students
by College (Fall 1970 Freshmmd Class)
Total
Present All
Rstention
Total
Present In
Net
Retention
College
Total Matricu1ants
Four Sem.
Rate
Foukh Sem.
Rate
Baruch
423
332
78.5%
339
80.1%
Brooklyn
2847
-
2421
85.0
2493
87.6
City College
1490
1147
77.0
1188
79.7
Bunter
1765
1281
72.6
1363
77.2
John Jay
87
52
59.8
55*
63.2*
Lehman.
896
661
73.8
704
78.6
Queens
2577
2043
79.3
2127
82.5
York
119
81
68.1
92
77.3
SENIOR COLLEGE
TOTALS
10.204
8013
J8.6
8361
11-9
Manhattan
154
97
63.0
114
74.0
Bronx
--**
__
--
--
__
Hostos
--**
--
--
__
Kingsborough
115
80
69.6
87
75.7
NYCCC
244
163
66.8
167
68.4
Queensboro
333
171
51.4
.201
60.4
Staten Island
308
185
60.1
jjk
71.1
COMMUNITY COLLEGE
-
TOTALS
1154
695
60.3
88
68.3
CUNY TOTALS
11,358
8714
76.7%
9149
80.6%
*Estimated
**Data not available

do.
TABLE 6
-Retention and Net Retention Rates for Students with No High School Average by College
Fall 1970 Freshman Class
Total
Present All
Retention
Total
Present In
Net
Retention
College
Total ftatriculants
Four Sem.
Rate
Fourth Sem.
Rate
Baruch.
10
550.02
660.0%
Brooklyn
221
133
60.2
145
65.6
City. College
29
16
55.2
17
58.6
Hunter
103
64
62.1
.
-72
70.9
John Jay
__.*
__
--
--
Lehman
95
37
38.9
55
57.9
Queens
65
40
61.5
44
67.7
York
40
26
65.0
28
'
70.0
SENIOR COLLEGE
TOTALS
563
321
57.0
368
65.4
Manhattan
276
82
29.7
-71.7
-198
Bronx
--*
--
--
__
__
Hostos
--*
--
__
__
Kingsborough
336
76
22.6
185
55.1
NYCCC
215
98
45.6
109
50.7
Queensboro
188
70
37.2
.101
53.7
Staten Island
301
70
23.3
16R
S.5 8
COMMUNITY COLLEGE
TOTALS
1316
396
30.1
761
.S7 _R
CUNY TOTALS
1879
717
38-1Z
1179
60 11
*Data unavailable.

-21-
TABLE 7
Fourth Semester Return Rates by CollegeFall 1970 Freeman Claes
COLLEGEsnesterReturnei.zrxcea 4106...11AA "fm,,04.1110 &....,WNi"., ,U" -.....--.....
Rate
Baruch 428 41 9.67.
Brooklyn. 911 119 13.1
City College 828 409 - 13.2
Hunter 927 181 19.5
John Jay 441 58* 13.2*
Lehman,. 862 181 21.0
Queens 834 136 16.3
York 282 63 22.3
SENIOR COLLEGETOTALS 5513 888 16.1
.
Manhattan 811 301 37.1
Bronx 795 132* 16.6*
Hostos 284 41* 14.4*
Kingsborough ' 1155 205 17.1
NYCCC \ 971 80 8.2
Quecnsboro / 1733 275.
15.9
Staten Island 1124 263 23,4
COMMUNITY COLLEGETOTALS 6873 1297 18.9
CUNY TOTALS 12,386 2185 17.6%
EStimated

-22-
TABLE 8
Fourth Semester Return Rates by College for Leyl B StudentsPall 1970 Freshman Class
Present 4.th Semester--larfite4----------Total Returns
COLLEGE Students-....--
4th Semester Return Rate
Baruch 77 14 18.2%
Brooklyn 117 8 6.8
City College 101 16 15.8
Hunter 57 14 24.6
John Jay 197 29* 14.7*
Lehman 89 16 18.0
Queens 64 13 20.3
York 4?. 8 19.0
SENIOR COLLNETOTALS 744 118 15.9
Manhattan 210 59 28.1
Bronx 335 54* 16.1*
Ilostos 141 19* 13.5*
Kingsborough 439 43 9.8
NYCCC 338 33 9.8
Queensboro 531 76 14.3
Staten Island 264 38 14.4COMMUNITY COLLEGETOTALS
2258 322 14.3
CUNY TOTALS 3002 440 14.6X

23-
TABLE 9
Fourth Semester Return Rates by College for Level A.I (Senior Collages) andLevel A (Community Colleges) StudentsFall 1970 Freshman Class
4th SemcFtarAttrited Total Returns Present
COLLEGE 4th Semester Return Rate
Baruch
_Students
95 11 11.6Z
Brooklyn. 134 14 10.4
City College 143 21 14.7
Hunter 136 36 26.5
John Jay -* Imp
Lehman 164 31 18.9
Queens 56 12 21.4
York 74 16 21.6
SENIOR COLLEGETOTALS 802 141 17.6
Manhattan 193 53 27.5
Bronx 261 41** 15.7**
Hostos 96 13** 13.5**
Kingsborough 298 23 7.7
NYCCC 282 15 5.3
Queensboro 538 86 16.0
Staten Island 319 61 19.1
COMMUNITY COLLEGETOTALS 1987 292 14.7
CONY TOTALS 2789 433 15.5 Z.
* Data Unavailable** Estimated

- 24 -
TABLE 10
Fourth Semester Return Rates by College for Level A.2 (Senior Colleges)and Regular 1 (Community Colleges) Students
Fall 1970 Freshman Class
COLLEGE
IltritedStudents
Total Returns Present4th Semester
4th SemesterReturn Rate
Baruch 160 8 5.0%
Brooklyn 146 13 8.9
City College 228 30 13.2
Hunter 211 40 18.9
John Jay 209 26* 12.4*
Lehman 316 73 23.1
Queens 155 23 14.8
York 114 26 22.8
SENIOR COLLEGET(JTALS 1539 239 15.5
Manhattan 157 56 35.7
Bronx 199 37** 18.6**
Restos 47 9** 19,1**
Kingsburough 123 23 18.7
NYCCC 153, 17 11.1
Queensboro 384; 52 13.5
Staten Island 187 32 17.1
COMMUNITY COLLEGETOTALS 1250 226 18.1 -CONY TOTALS 2789 465 16,17
* EstiMated lnclud s all level A students (A.1 -1- A.2)
** Estimated Ine1ties all regular students (Regular 1 + Regular 2)

.25-
TABLE 11
Fourth Semester'Return Rates by College for Regular (Senior Colleges) andRegular 2 (Community Colleges) Students
Fall 1970 Freshman Class
rttr to -WarReturns PresentStudents 4th Semester
6W-FCx7gterReturn RateCOLLEGE
Baruch 91 7 7.7%
Brooklyn. 426 72 16.9
City College 343 41 11.9
Hunter 484 82 de 16.9
Johnqay 35 3* 8.6*
Lehman 235 43 18.3
Queens 534 84
York 18SENIOR COLLEGETOTALS
Manhattan 57 17 29.8'
Bronx 11.
Itostos
Kingsborough 35 7 20:0
NYCCC 81 '4 4.9
Quoensboro 162 30 18.5
Staten Island 123 34 27.6
COMMUNITY COLLEGETOTALS 458 92 20.1
CUNY TOTALS 2644 435 16.5%
* Estimated** Data Unavailable

-26 -
TABLE 12
Fourth Semester Return Rates by College for Students with No High School Average
F411 1970 Freshman Class
ttrited
0.
Total Returns Present .4th SemesterCOLLEGE Students 4th Semester aeturn Rate
Baruch
Brooklyn 88
City College 13
Hunter 39
JOhn Jay -*
Lehman 58
Queens 25
York 14
SENIOR COLLEGETOTALS 242-,
1 20.0%
12 13.6
1 7.7
9 23.1
011.
18 31.0
4 16.0
2 14.3
47 19.4
Manhattan194 116 59.8
Bronx -*
Hostas
Kingsborough 260 109 41.9
NYCCC 117 11 9.4
Queensboro 118 31 26.3
Staten Island 231 98 42.4COMMUNITY COLLEGETOTALS 920 365 39.7
CUNY TOTALS 4° 1162 412 35.5%
* Data Unavailable
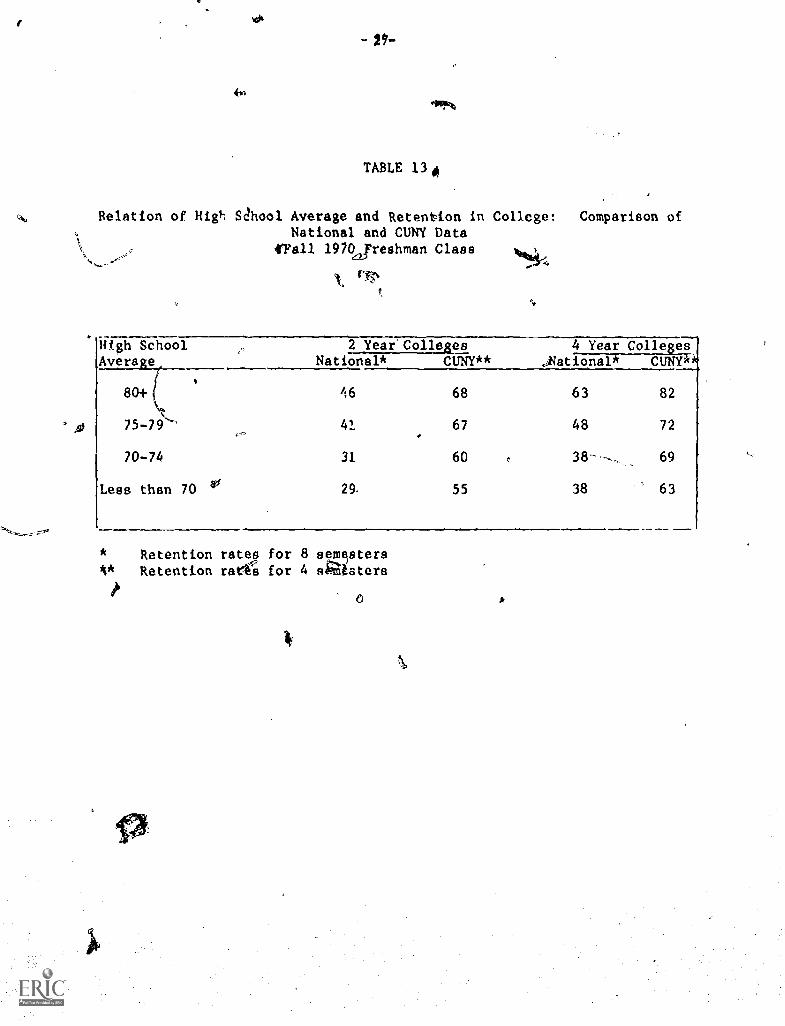
TABLE 13
Relation of Hie SChool Average and Retention in College; Comparison ofNational and CUN7 Data
tFall 19702freshman Class
ti
High School 2 Year Colleges 4 Year CollegesAverapt National* CUNY** jlational* CUNY'
1
80+ A6 68 63 82
75-79'." 41 67,
48 72
70-74 31 60 38-- 69
Less than 70 v29, 55 38 63
Retention rates for 8 semestersRetention rat for 4 sbmtsters
6

cry
-28-
TAhLrn.4
Net Retention Rates for Senior and Community Colleges by High School AverageFall 1970 Freshman Class Through Four Semesters
High School F.,
Average (CAA)SeniorColleges
,CommunityColleges
68.3%
66.7
60.1
55.4
TotalCUNY
80.6%
70.0
63.0
57.6
80+
7.5-79
70-74
Legs than 70
, .I 81.9%
72.2
68.8
63.3
OTAL 76.0%(19,219)
60.5%(14,133)
69.5%(33,412)