Embed Size (px)
Citation preview
DOCUMENT RESUME
ED 235 406, CG 016 939
AUTHOR Proefrock, David W.TITLE Prediction of Recidivism in Juvenile Offenders Based
on Discriminant Analysis.PUB DATE 24 Mar 83NOTE 22p.; Paper presented at the Annual Meeting of the
Southeastern Psychological Association (29th,Atlanta, GA, April 23-26, 1983).
PUB TYPE Reports - Research/Technical (143) --Speeches/Conference Papers (150)
EDRS PRICE MF01/PC01 Plus Postage..DESCRIPTORS Adolescents; Crime Prevention; *Delinquency;
*Discriminant Analysis; Juvenile Courts; PersonalityDevelopment; *Predictive Measurement; *PredictorVariables; *Recidivism; Secondary Education; SocialPsychology.
IDENTIFIERS Minnesota Multiphasic Personality Inventory
ABSTRACTThe recent development of strong statistical
techniques has made accurate predictions of recidivism possible. Toinvestigate the utility of discriminant analysis methodology inmaking predictions of recidivism in juvenile offenders, the courtrecords of 271 male and female juvenile offenders, aged 12-16, werereviewed. A croso validation group (N=43) was randomly selected fromthe original sample. Cases were selected for inclusion based on ageof less than 17 at the time of evaluation; evaluation battery whichincluded at least the mini-mult form of the Minnesota MultiphasicPersonality Inventory (MMPI), either the Wechsler Intelligence Scalefor Children--Revised (WISC-R) or the Wechsler Adult IntelligenceScale (WAIS); and Full Scale Intelligence of at least 70. The 12discriminant variables which were examined represented demographic,economic, educational, legal, and personality indices. Discriminantanalysis was performed on the entire sample at the end of a 12-monthfollow-up period (analysis 1), and again at the end of the samefollow-up period (analysis 2) on that portion of the sample notplaced in a residential setting following evaluation. Results showedthat both of the derived discriminant functions were able to predictrecidivism at better than the established change level. The factorswhich proved to be important in the prediction of recidivism were theD and K scales (which measure depression, guilt, openness and trust)from the mini-multi MMPI and prior criminality, particularly theseriousness of that record. (BL)
***********************************************************************Reproductions supplied, by EDRS are the best that can be made
from the original document.***********************************************************************
*47
CZ) Prediction of Recidivism inJuvenile Offenders Based on
LCN Discriminant Analysispr\
(NJ
C7.]
LLJ
Presented at the 28th AnnualMeeting of the SoutheasternPsychological Association
March 24, 1983Atlanta, Georgia
cr. David W. Proefrock, Ph.D.Department of Psychology
ONAugusta College
sA3Augusta, Georgia 30910
CaU.S. DEPARTMENT OF EDUCATIONCO
NATIONAL INSTITUTE OF EDUCATIONEDUCATIONAL RESOURCES INFORMATION
CENTER (ERIC)\I This document has been reproduced as
received from the person or organizationoriginating it.
Minor changes have been made to improvereproduction quality.
Points of view or opinions stated in this documere do not necessarily represent official NIEposition or policy.
"PERMISSION TO REPRODUCE THISMIERIMT
.4
AL HAS BEE RANTED BY
/&Z.. 44
/../ E
TO THE EDUCATIONAL RESOURCESINFORMATION CENTER (ERIC)."
Abstract
Prediction of Recidivism in Juvenile OffendersBased on Discriminant Analysis
Efforts to use psychological and demographic variables to predict
recidivism in juvenile offenders are now quite well-established. These
efforts, however, have been inconclusive and contradictory. The
development of stronger statistical techniques has. made accurate prediction
of recidivism a real possibility. It is also now possible to make
statements about factors which contribute to recidivism. The present
study utilizes discriminant analysis to make predictions of recidivism.
The juvenile court records of 271 juvenile offenders were reviewed
in an effort to predict recidivism with a discriminant analysis methodology.
Prediction was attempted on the entire sample at the end of the twelve-
month follow-up period and on that portion of the sample not placed in a
residential setting following evaluation at the end of the same follow-up
period. Both of the derived discriminant functions were found to be able
to predict recidivism at better than the established change level. They
were also found to be able to predict consistently in a cross-validation
group. Factors which proved to be important in the prediction of recidivism
were the D and K scales from the Mini-Mult MMPI and prior criminality.
The implications of the predictive ability of these factors and directions
for further research are discussed.
Prediction of Recidivism
2
Prediction of Recidivism in Juvenile Offenders
Based on Discriminant Analysisl
Prediction, one of the traditional aims of science, is of particular im-
portance in the area of crime and delinquency. Society has long demanded
means by which criminal behavior could be predicted and intervention systems
by which criminal behavior could be controlled. When rehabilitation became
an accepted aim of the penal system the prediction of recidivism following
treatment or imprisonment also became an important topic of research. Recid-
ivism quickly became the most popular index of program efficacy. The present
study will focus on the prediction of recidivism in juvenile offenders.
The original attempt to predict recidivism in juvenile offenders by Shel -.
don and Eleanor Glueck (1930) entailed the examination of fifty factors for
their relationship to recidivism. The prediction table developed for this
study successfully predicted both on an individual, case by case, basis and
when used for group prediction. This methodology set the stage for the next
forty years of research in the prediction of recidivism in juvenile offenders.
Prediction in general has been greatly influenced by the discovery and
application of the concepts of expectancy and inverse probability (Glaser,
1955; Meehl, 1954). In essence, these concepts show that the efficacy of any
predictive method must be weighed against the chance level of accuracy based
on the observed frequency of the criterion. For example, if it is known that
only 30% of a given population will recidivate, a prediction that no subject
will recidivate will have a 70% hit rate. In order to be useful, any statist-
ical predictive method will have to show an ability to predict at above that
70% level. As is clear in this example, the less frequently a given event
Prediction of Recidivism
3
occurs, the more difficult it will be for a prediction methodology to exceed
the "chance" prediction level.
In a direct follow-up to the prediction table methodology developed by the
Gluecks, Gough, Wenk, and Rozynko (1965) used a weighted based expectancy table
along with Minnesota Multiphasic Personality Inventory (MMPI) and California
Personality Inventory (CPI) scores to predict the outcome of parole among
California Youth Authority offenders. This study was the first which took in-
verse probability and expectancy into account. Thus, the prediction table was
renamed base expectancy table. In summary, the findings of this study showed
that each of the three instruments could differentiate recidivists from non-
recidivists at the .01 level of significance. In addition, the various com-
binations of the three did serve to augment predictive power. The base expect-
ancy table was the best single predictor, followed by the CPI and then the MMPI.
Subsequent studies have shown the base expectancy table methodology to be
a useful prediction technique (Ganzer and Sarason, 1973; Smith and Lanyon, 1968)
However, the relative difficulty of construction of the tables have resulted
in group comparison and correlational methods being more widely employed in pre-
diction studies. The correlational method of prediction was introduced to this
area of research by Cowden (1966) in a study designed to predict both institu-
tional adjustment and recidivism. Age and ratings of personality, seriousness
of offense, and adjustment were all found to be significantly related in the
positive direction to recidivism. Because it produces a list of factors related
to the criterion for the entire sample, however, individual prediction can not
be made. Although other studies employed the correlational technique (Cowden
and Pacht, 1967; Mack, 1969), the methodology was more useful as a means of
Prediction of Recidivism
4
determining factors related to recidivism rather than for prediction.
Unkovic and Ducsay.(1969) introduced somewhat more sophisticated statist-
ical procedures to the prediction of recidivism in juvenile offenders by using
a configurational analysis methodology to predict recidivism in boys and girls
released from a correctional institution. Chase (1977) used factor analysis
along with a stepwise multiple regression in a prediction study based on a
sample of deinstitutionalized, male delinquents. Although no definitive con-
clusions could be drawn from these studies, the findings were consistent with
those reported in previous studies and the methodologies, though complex,
were judged to be useful. The use of factor analysis and multiple regression
Analysis brought research on the prediction of recidivism to the next step
beyond the base expectancy table methodology.
An examination of the results of these studies of prediction show that
age and adjustment to treatment program appear to be the most consistently
predictive variables (Cowden, 1966; Ganzer & Sarason, 1973; Unkovic & Ducsay,
1969). In nearly every study in which they were considered, non-recidivists
were older and better able to make a successful adjustment to a treatment pro-
gram than were recidivists. Because the sex and race factors were so rarely
considered, the review of their usefulness as predictors was inconclusive.
However, in the few studies where it was analyzed, race appeared to be an O-.
fective predictor. White offenders tended to be non-recidivists. OF course,
the confounds of a variable such as race are considerable. Overall, any kind
of rating by staff proved to be a poor predictor. Also, most psychological
tests were not very useful as predictors. The Gough, Wenk, and Rozynko (1965)
study, which found both the MMPI and the CPA to be strong predictors, is the
Prediction of Recidivism
5
primary exception to that finding. Contrary to what might have been expected,
the various factors related to prior criminality showed mixed results as pre-
dictors. It must be considered that in the studies which make up this body of
literature, there was great variation in methodology, subject population, fac-
tors considered, and statistical analyses. That even two factors emerged as
consistent, is somewhat remarkable.
The present study represents an attempt to predict recidivism among juv-
enile offenders with a discriminant analysis methodology. Two published reports
of the use of discriminant analysis in the prediction of recidivism were re-
viewed. Brown, D'Agistino, and Craddick(1978) used the discriminant anal-
ysis technique to predict recidivism in adult parolees. They found the pro-
cedure to show accurate classification at the 76 percent level and judged it to
be a superior classification tool. Alumbaugh, Crigler and Dightman (1978) com-
pared discriminant functions to multiple regression and factor analysis for
their relative predictive ability on a sample of juvenile offenders. On the
basis of the number of hits versus misses for each technique on two comparison
samples, the discriminant analysis proved superior to the other methods. While
research on the predictive ability of the discriminant analysis is just beg-
inning to emerge, it does seem to hold considerable promise.. The logic of the
technique is relatively easily understood, it apparently compares quite fav-
orably to other techniques of prediction, and it readily allows for prediction
in applied settings
Method
Subjects
The records of 271 male and female juvenile offenders who were referred
Prediction of Recidivism
6
to the Southwestern Juvenile Diagnostic Center, Memphis, Tennessee, for eval-
uation were reviewed. All of the subjects were referred by the Juvenile Court
of Memphis and Shelby County, Tennessee, from January 1977 to March, 1979.
The subjects ranged in age from 12 to 16 years. The Southwestern Juvenile Diag-
\
nostic Center routinely performs evaluations at the request of the Juvenile
Court to aid in disposition decisions. Of the original 271 cases, 43 were ran-
domly designated for a cross-validation group leaving 228 in the classification
sample.
Cases were selected for inclusion based on the following criteria: (1) Age
less than 17 at the time of evaluation. (2) Evaluation battery which included
at least the Mini-Mult form of the Minnesota Multiphasic Personality Inventory
(Mini-Mult MMPI) (Kincannor, 1968) and either the Wechsler Intelligence Scale
for Children - Revised (WISC-R) or the Wechsler Adult Intelligence Scale (WAIS).
(3) Measured Full Scale Intelligence of at least 70. All cases in the specified
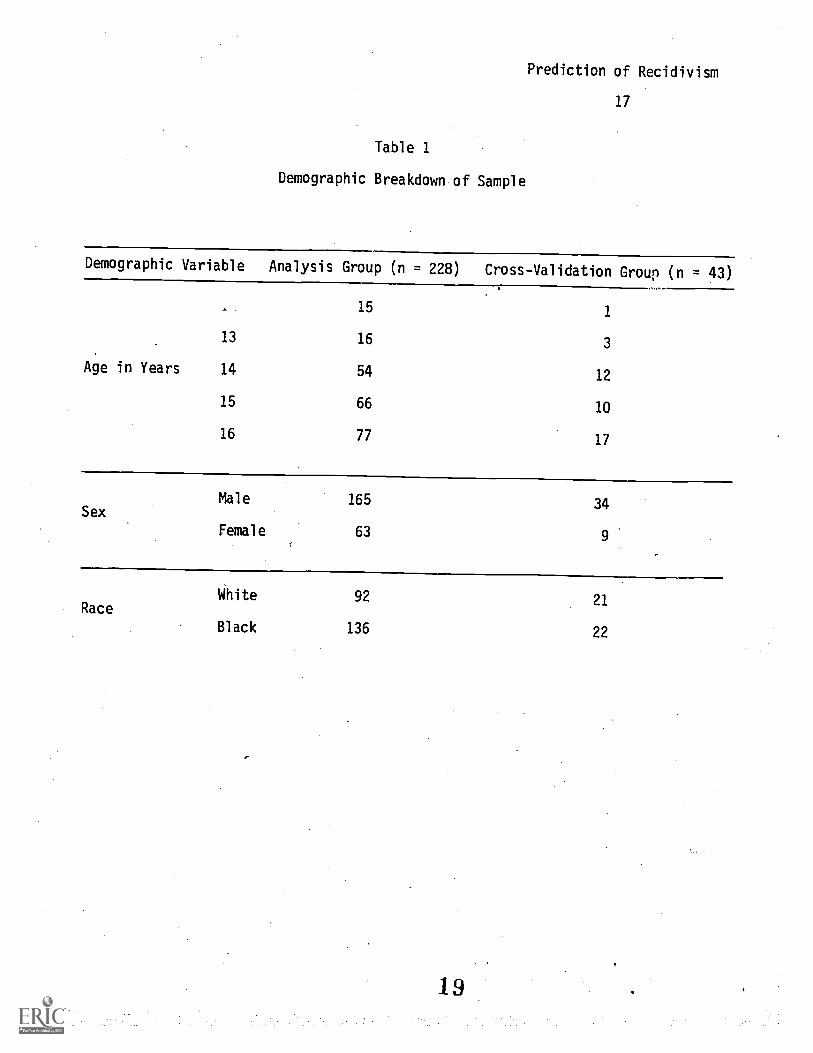
time period which met the criteria were included. Table 1 presents the sample
population broken down on the basis of demographic variables;
Discriminant Analysis
The discriminant analysis technique (Cooley & Lohnes, 1971; Klecka, 1975)
is designed to discriminate, statistically, between two or more known groups
by the formation of linear combinations of discriminating variables. These
linear combinations,' known as discriminant functions, serve to analyze and
classify data.
The discriminant variables examined in the present study made up the stan-
dard Southwestern Juvenile Diagnostic Center evaluation. Data was collected on
the following discriminant variables for each subject:

Prediction of Recidivism
7
(1) Age in months
(2) Sex
(3) Race
(4) Family make-up measured by defining an intact family as one which
included both a biological mother and father, all other situations
were defined as broken families
(5) Family income in thousands
(6) School grade placement relative to age
(7) Full Scale IQ, Verbal IQ, and Performance IQ as measured by the
WISC-R or WAIS.
(8) The individual scales from the Mini-Mult MMPI
(9) Delinquency (Dq) special MMPI scale developed for the prediction of
delinquent behavior (Hathaway & Monachesi, 1957)
(10) Total number of,Juvenile Court charges prior to evaluation
(11) Criminality rating of prior charges determined by assigning weights
to offenses based on the maximum sentence for the offense according
t6 Tennessee Code for adult crimes.
(12) Average criminality of prior charges derived by dividing the crimin-
ality rating by the number of prior charges.
Procedure
By reviewing the Juvenile Court records of each case, the number of juv-
enile charges were recorded for a twelve month follow-up period. Because the
juveniles who were placed in any type of residential setting following eval-
uation would have significantly less opportunity to continue delinquent ca-
reers and because the answer to the question, "What are the chances of recidivism
Prediction of Recidivism
8
if this child is not placed" seemed to be most important to the court; the
discriminant analysis was performed on two sets of data. In the first set,
the entire sample of 228 cases was included. In the second set, those cases
which were placed after evaluation were deleted from the sample. This manip-
ulation left 164 cases in the second analysis.
Results
Analysis 1 - Entire Sample at Twelve Months
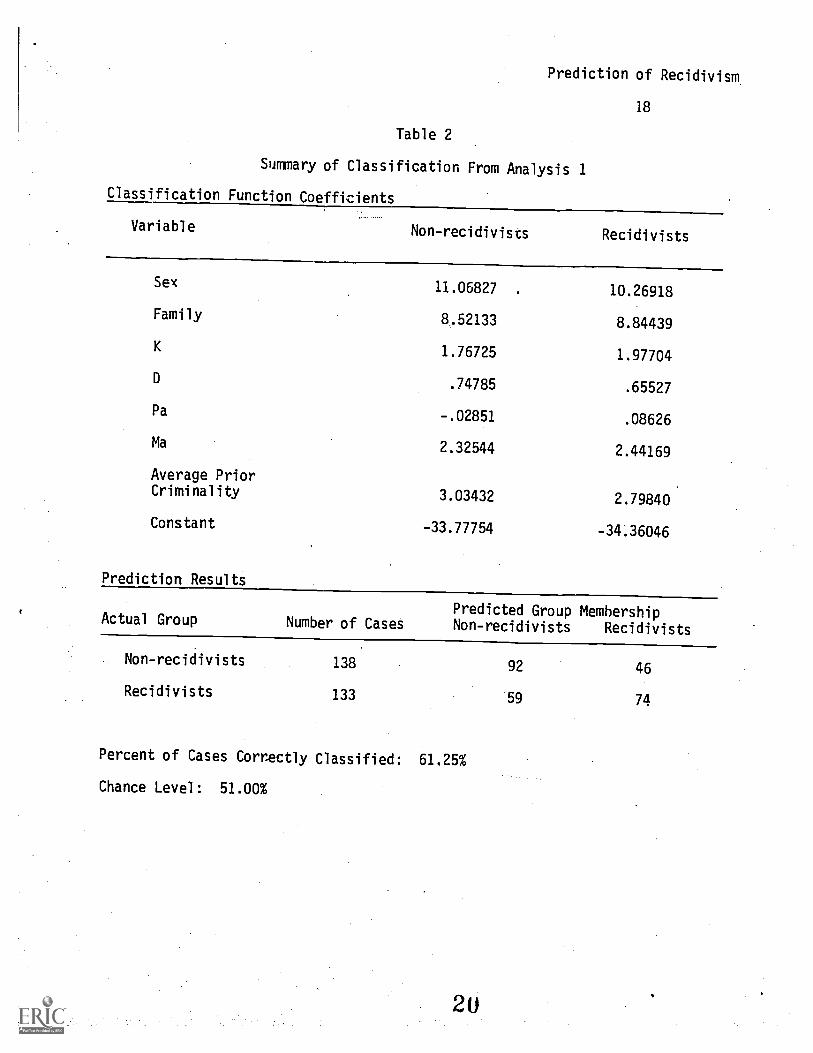
Table 2 shows that the discriminant function produced in Analysis 1, the
analysis of the entire sample for the twelve month follow-up period, was able
to correctly classify 61.25% of the cases. The chance level for this analysis,
that is the percentage of cases correctly classified if all cases were pre-
dicted to be nonrecidivists, was 51.00%. Analysis 1, then, can be considered
useful for the prediction of recidivism in this sample.
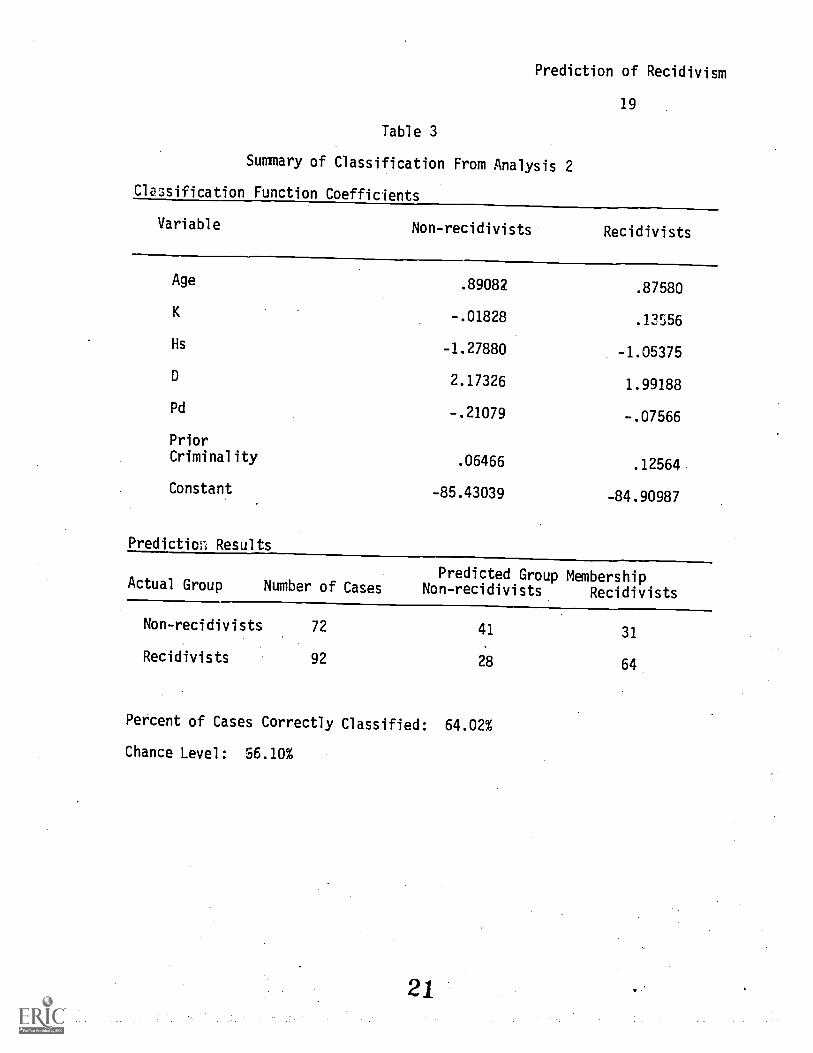
Analysis 2 - Sample Not Placed At Twelve Months.
Analysis 2 represents the discriminant analysis performed on the sample
not placed after evaluation for the entire twelve-month follow-up period. It
can be seen.in Table 3 that there were more recidivists than non-recidivists
in this analysis. The discriminant function produced in the analysis clas-
sified cases at far better than the chance level of 56.10% when chance was
defined as predicting recidivism for all subjects. Thus, Analysis 2 can also
be considered a useful predictive tool.
Discriminant Variables
An examination of the variables which were included in the discriminant
functions shows some interesting patterns. Both the D scale and the K scale
of the Mini-Mult were included in both discriminant functions. Non-recidivists
10

Prediction of Recidivism
9.
tended to score higher on the D scale and lower on the K scale than did re-
cidivists.
Prior criminality and average prior criminality, two of the three measures
related to the subjects' previous delinquent records, were also included in the
discriminant functions considered. Their contributions, however, were differ-
ent. In Analysis 1 non- recidivists were found to nave a higher average prior
criminality ratings than recidivists. In Analysis 2, non-recidivists were
shown to have a lower prior criminality rating than did recidivists.
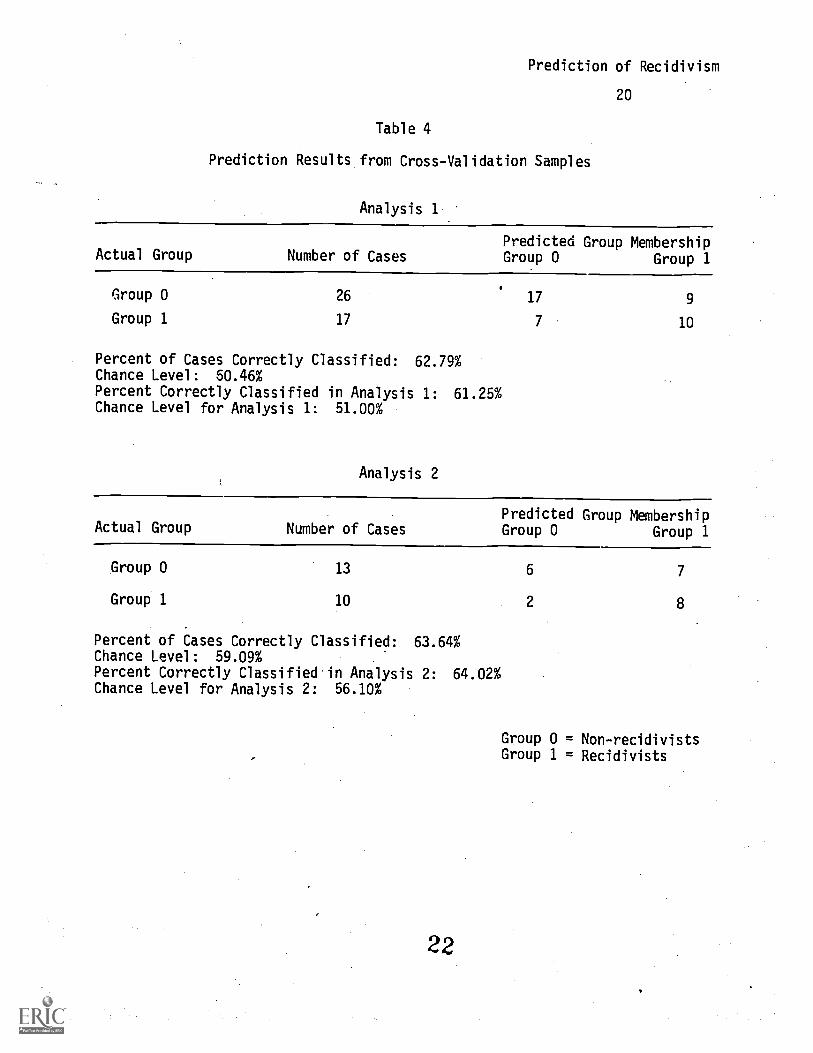
Cross-Validation Sample
The classification functions derived from the analyses were checked with
the cross-validation group. Table 4 shows a summary of the results of the
cross-validation analyses for both Analysis 1 and Analysis 2. It can be seen
that the percentage of cases correctly classified in the check of the class-
ification function for the entire sample was 62.79%. This is essentially equal
to and not significantly different from the 61.25% correctly classified in
Analysis 1. The portion of the cross-validation group not placed after eval-
uation, 23 subjects, was also classified and the results compared to the re-
sults of Analysis 2. It can be seen from Table 4 that the percentage cor-
rectly classified in the cross-validation group, 63.64%, was again essentially
equal to the 64.02% correctly classified in Analysis 2.
Discussion-
The discriminant analysis methodology provided mooerate predictive ability
when applied to this sample with these particular discriminant variables en-
tered into analysis. It does appear that the procedure was able to classify
cases at above the established chance level in both of the analyses. These
Prediction of Recidivism
10
classification systems were able.to predict from 60 to 65 percent of the cases
correctly and that level was shown to be consistently attainable in the cross-
validtion sample. However, the error rates of 35 to 40 percent must be im-
proved upon if they are to be useful in making placement decisions for juv-
enile offenders.
The discriminant analysis procedure itself can do no less than to maximally
separate the groups on the basis of the discriminant variables available for
analysis. The obtained percentage of cases correctly classified, then, can be
attributed to either differences between the two groups or to the quality of
the discriminant variables used. It can not be attributed to the discriminant
analysis methodology.
One of the possible explanations for the failure of th,s methodology to
show better predictive ability is that the population may be, for all practical
purposes, homogenous. When it is considered that the youths referred to the
Southwestern Juvenile Diagnostic Center are similar at least in the sense that
they present disposition problems for Juvenile Court, this explanation seems
plausiLle. There does exist, however, at least one crucial difference between the
two groups. The non-recidivists were able to return to the environment in which
they first began their delinquent activity and not accumulate further juvenile
charges. The recidivists were not for whatever reason, able to do that This
difference alone implies further difterences between the groups. Another pos-
sible explanation for only moderate predictive ability is the quality of the
discriminant variables. An analysis of the relative usefulness of each of the
discriminant variables included in the present analyses is relatively simple
because that analysis is a part of the discriminant analysis procedure:
Prediction of Recidivism
11
It seems clear, since IQ was not included in either of the discriminant
functions, that intellectual level is not a useful predictor for this popula-
tion. Also, race was not found to be an important distinction between non-
recidivists in either of the analyses. While age did enter into the discrim-
inant function produced in Analysis 2, it was not found to be as important as
might have been expected from the review of the existing literature. Sex and
family make-up also appeared in only one of the discriminant functions. The
other demographic variables, family income and grade placement relative to
age were not included in either of the discriminant functions.
Certain of the scales from the Mini-Mult form of the MMPI were found to
be predictive. In general, previous research had shown the MMPI to be of
little help in predicting recidivism in juvenile offenders. However, it should
be noted that all of the previously reviewed work with the MMPI was based on
the entire inventory. The degree to which the Mini-Mult and the full MMPI are
related continues to be open to debate (Newmark, Ziff, Finch, & Kendall, 1978;
Poythress.& Blaney, 1978).
Specifically, the D and K scales showed some ability to discriminate re-
cidivists from non-recidivists. Non-recidivists tended to score higher on the
D scale which is indicative of depression and guilt. The non-recidivists also
tended to score lower on the K scale which would indicate that they are, in
general, more trusting and open than are the recidivists. It appears, then,
that on the basis of the Mini-Mutt scores the non-recidivists in this sample
were the youths who were more reachable by others and more uncomfortable in
their delinquent role.
Prior criminality also emerged from this analysis as an important factor.
Prediction of Recidivism
12
The number of prior charges alone, however, did not carry sufficient informa-
tion to be of use. The seriousness of a youth's prior record as a whole and
the average seriousness of each of the prior charges were found to be better
predictors. The way in which these, two factors seemed to interact is worthy
of closer examination. In one of the analyses, it was found that non-recidivists
tended to have a lower level of prior criminality. In the other analysis, the
non-recidivists tended to have higher average prior criminality. This pattern
may be suggested that, in general, the non-recidivists tend to !lave a history
of fewer, but more serious, juvenile charges. While not clearly delineated in
the present study, the concept is in keeping with patterns suggested in earlier
studies (Cowden, 1966; Glueck & Glueck, 1930; Laulicht, 1963).
To suggest alternative discriminant variables which may be more useful
than those included in this analysis is a relatively speculative endeavor.
However, there are inditations in the literature on juvenile delinquency that
certain variables would merit further study. Demographic variables were fairly
well covered in the present study, but a few additional factors could be re-
searched.' Recently reported work on the etiology of juvenile delinquency (El-
liott, Ageton, Canter, 1979) suggests a combination of community and family in-
volvement in the development of delinquent behavior. Thus, the presence in the
family of other youths who have been charged with delinquent acts may be a use-
ful predictor. An estimate of the socioeconomic status and of the prevailing
crime rate for the neighborhood in which a youth lives may also be of use.
Because learning disabilities have been linked rather convincingly with juvenile
delinquency (e.g., Dowis, 1977; Mesinger, 1976; and Poremba, 1975), an indication
of the presence or absence of learning disability may prove to be a valuable
predictor.
14.
Prediction of Recidivism
13
There are certain psychological measures which could well be more effect-
ive predictors than the ones included in the present study. The California
Personality Inventory was judged to be quite useful in one of the studies pre-
viously reviewed (Gough, Wenk, Rozynko, 1965), but has not been included in
any of the other predictive research. There is also an increasing body of
literature which suggests that the Interpersonal Maturity Level (Sullivan, Grant,
& Grant, 1957) may have applications in many different aspects of juvenile de-
linquency (Jesness, 1971; Warren, 1978). The Interpersonal Maturity Level has
become an accepted typological system for juvenile offenders and, like the CPI,
has not been included in any of the published research on the prediction of re-
cidivism. Of course any number of psychological measures which may effective-
ly differentiate recidivists from non-recidivists could be suggested. The CPI
and the Interpersonal Maturity Level, however, seem to have already been well-
researched in other contexts related to delinquency. Their inclusion in future
work on the prediction of recidivism in juvenile offenders seems warranted.
It is further suggested that agencies which are engaged in the evaluation
of juvenile offenders conduct ongoing research into the effectiveness with
which the information obtained from their evaluations can discriminate recid-
ivists from non-recidivists. Beyond determining an intellectual level and
screening for severe emotional or personality disturbances, the purpose of any
evaluations ordered by the juvenile justice system is to predict the ability of
a given youth to function outside of a correctional or psychiatric facility.
Recidivism is one of the strongest indices of that type of functioning. There-
fore, the prediction of recidivism must certainly be seen as a primary purpose
of an evaluation of a juvenile offender.
15
Prediction of Recidivism
14
References
Alumbaugh, R.V.; Crigler, M.A.; Dightman, C.R. Comparison of multi-
variate techniques in the prediction of juvenile postparole out-
come. Educational and Psychological Measurement, 1978, 38, 97-106.
Brown, R.C.; D'Agistino, C.A.; & Craddick, R.A. Prediction of parole
outcome based on discriminant function. Corrective and Social
Psychiatry and Journal of Behavior Technology, Methods, and Therapy,
1978, 24, 93-97.
Chase, M.M. Behavioral and environmental characteristics of delinquent
youth as related to recidivism. Catalog of Selected Documents in
Psychology, 1977, 7, 43, MS 142.
Cooley, W.W. & Lohnes, P.R. Multivariate Data Analysis. New York:
Wiley, 1971.
Cowden, J.E. Predicting institutional and post-release adjustment of
delinquent boys. Journal of Criminal Law, Criminology, and Police
Science, 1966, 57, 39-44.
Cowden, J.E. & Pacht, A.R. Predicting institutional and post-release
adjustment of delinquent boys. Journal of Consulting Psychology,
1967 31, 377-381.
Dowis, R.T. The effect of a visual training program on juvenile de-
linquency. Journal of the American Optometric Association, 1977,
48, 1173-1176.
Elliott, D.S. & Ageton, S.S.; & Canter, R.J. An integrated theoretical
perspective on delinquent behavior. Journal of Research in Crime
and Delinquency, 1979, 16, 3-27.
16
Prediction of Recidivism
15
Ganzer, V.J. & Sarason, I.G. Variables associated with recidivism among
juvenile delinquents. Journal of Consulting and Clinical Psycho-logy, 1973, 40, 1-5.
Glaser, D. The efficacy of alternative approaches to parole prediCtion.
American Sociological Review, 1955, 20, 283-287.
Glueck, S. & Glueck, E.T. 500 Criminal Careers. New York: Alfred A.Knopf, 1930.
Gough, H.G.; Wenk, E.A.; & Rozynko, V.V. Parole outcome as predictedfrom the CPI, the MMPI, and a base expectancy table. Journal of
Abnormal Psychology, 1965, 70, 432-441.
Hathaway, S.R. & Monachesi, E.D. The personalities of predelinquentboys. Journal of Criminal Law, Criminology, and Police Science,
1957, 48, 149-163.
Jesness, C.F. The Preston typology study: An experiment with differ-ential treatment in an institution.
Journal of Research in Crimeand Delinquency, 1971, 8, 38-52.
Kincannon, J. C. Prediction of the standard MMPI scale scores from 71
items: The Mini-Mult. Journal of Consulting and Clinical Psycho-
logy, 1968, 32, 319-325.
Klecka, W.R. Discriminant analysis. In Nie, N.H.; Hull, C.H.; Jenkins,
J.G.; Stienbrenner, K.; & Bent, D.H. (Eds.) Statistical Package
for the Social Sciences (2nd Ed.). New York: McGraw-Hill, 1975.
Mack, J.L. The MMPI and recidivism. Journal of Abnormal Psychology,
1969, 74, 612-614.
Meehl, P.E. Clinical Versus Statistical Prediction. Minneapolis:
University of Minnesota Press, 1954.
17
Prediction of Recidivism
16
Mesinger, J,F. Juvenile delinquents: A relatively untapped population
for special education professionals. Behavioral Disorders, 1976,
2, 22-28.
Newmark, C.S.; Ziff, D.R.; Finch, A.J.; & Kendall, P.C. Comparing the
empirical validity of the standard form with two abbreviated MMPIs.
Journal of Consulting and Clinical Psychology, 1978, 46, 53-61.
Poremba, C.D. Learning disabilities, youth and delinquency: Programs
for intervention. In mykiebust, H.R. (Ed.) Progress in Learning
Disabilities. New York: Grune & Stratton, 1975.
Poythress, N.C. & Blaney, P.H. The validity of MMPI interpretations
based on the Mini-Mult and the FAM. Journal of Personality Assess-
ment, 1978, 42, 143-147.
Smith, J. & Lanyon, R.I. Prediction of probation violation. Journal
of Consulting and Clinical Psychology, 1968, 32, 54-58.
Sullivan, C.E.; Grant, M.Q.; & Grant, J.D. The development of inter-
personal maturity: Applications to delinquency. Psychiatry, 1957,
20, 373-385.
Unkovic, C.M. & Ducsay, M.J. An application of configural analysis to
the recidivism of juvenile delinquent behavior. Journal of Crimi-
nal Law, Criminology, and Police Science, 1969, 60, 340-344.
Warren, M.Q. The impossible child, the difficult child, and other
assorted delinquents. Canadian Psychiatric Association Journal,
1978, 23 (Supplement), 1-45.
18
Prediction of Recidivism
17
Table 1
Demographic Breakdown of Sample
Demographic Variable Analysis Group (n = 228) Cross-Validation Group (n = 43)
15 1
13 16 3
Age in Years 14 54 12
15 66 10
16 77 17
Male 165 34Sex
Female 63 9
White 92 21Race
Black 136 22
Prediction of Recidivism
Table 2
Summary of Classification From Analysis 1
Classification Function Coefficients
18
Variable Non-recidivists Recidivists
Sex 11.06827 . 10.26918
Family 8.52133 8.84439
K 1.76725 1.97704
0.74785 .65527
Pa -.02851 .08626
Ma 2.32544 2.44169
Average PriorCriminality 3.03432 2.79840
Constant -33.77754 -34.36046
Prediction Results
Actual Group Number of CasetPredicted Group MembershipNon-recidivists Recidivists
Non-recidivists 138 92 46
Recidivists 133 59 74
Percent of Cases Correctly Classified: 61.25%
Chance Level: 51.00%
Prediction of Recidivism
19
Table 3
Summary of Classification From Analysis 2
Classification Function Coefficients
Variable Non - recidivists Recidivists
Age .89082 .87580
K -.01828 .13556
Hs -1.27880 -1.05375
D 2.17326 1.99188
Pd -.21079 -.07566
Prior
Criminality .06466 .12564.
Constant -85.43039 -84.90987
Prediction Results
Actual Group Number of CasesPredicted Group Membership
Non-recidivists Recidivists
Non-recidivists 72 41 31
Recidivists 92 28 64
Percent of Cases Correctly Classified: 64.02%
Chance Level: 56.10%
21
Prediction of Recidivism
20
Table 4
Prediction Results from Cross-Validation Samples
Analysis 1
Actual Group Number of CasesPredicted Group MembershipGroup 0 Group 1
Group 0 26 17 9
Group 1 17 7 10
Percent of Cases Correctly Classified: 62.79%Chance Level: 50.46%
Percent Correctly Classified in Analysis 1: 61.25%Chance Level for Analysis 1: 51.00%
Analysis 2
Actual Group Number of CasesPredicted Group MembershipGroup 0 Group 1
Group 0 13 6 7
Group 1 10 2 8
Percent of Cases Correctly Classified: 63.64%Chance Level: 59.09%Percent Correctly Classified in Analysis 2: 64.02%Chance Level for Analysis 2: 56.10%
Group 0 = Non-recidivistsGroup 1 = Recidivists
22