Embed Size (px)
Citation preview

Do the WTO and RTAs Promote Food Trade?
Irfan MujahidΔ and Matthias KalkuhlΔ
ΔCenter for Development Research, University of Bonn
Walter-Flex-Str. 3 D-53113 Bonn, Germany
Abstract
In addition to multilateral trade agreements under the World Trade Organization
(WTO), the world has seen a remarkable proliferation of regional trade agreements
(RTAs) in the last two decades. This study investigates the impacts of these multilateral
and regional trade institutions on food trade. The Gravity model of international trade
is used for the empirical analysis. The model is developed in a large panel data setting
and attempted to address some potential problems in the estimation including
multilateral trade resistances and zero trade values. The results suggest that both the
WTO and RTAs have delivered significant positive effects on bilateral trade among the
participant countries, but not food. Only RTAs are found to have increased bilateral
food trade among the members. However, although no evidence can be found that the
WTO enhances food trade among the members, it promotes food trade of the developing
countries more than the developed ones.
JEL Classification: F13, F14, O13, Q17, Q18
Keywords: WTO, regional trade agreement, food trade, food security
Corresponding author Email addresses: [email protected] (Irfan Mujahid), [email protected] (Matthias Kalkuhl)

1
1. Introduction
After for more than a decade of deadlock in the negotiations of Doha Development Agenda, the
World Trade Organization (WTO) has gained a noteworthy momentum by the success of the
Ninth Ministerial Meeting at the end of 2013. The first ever multilateral trade agreements since
the formation of the WTO and approved by all member countries have been reached in Bali
Indonesia. However, member countries are still struggling to find permanent solution on public
stockholding for food security issues, confirming that food remains a very sensitive sector in the
agreement.1
On the other hand, the world has seen a remarkable proliferation of regional trade agreements
(RTAs) in the last two decades, growing from only less than 40 in 1990 to nearly 400 that were
in force in 2013. The data suggest that almost all WTO members are participating in one or more
regional trade agreements. These figures result in very complicated overlapping trade relations
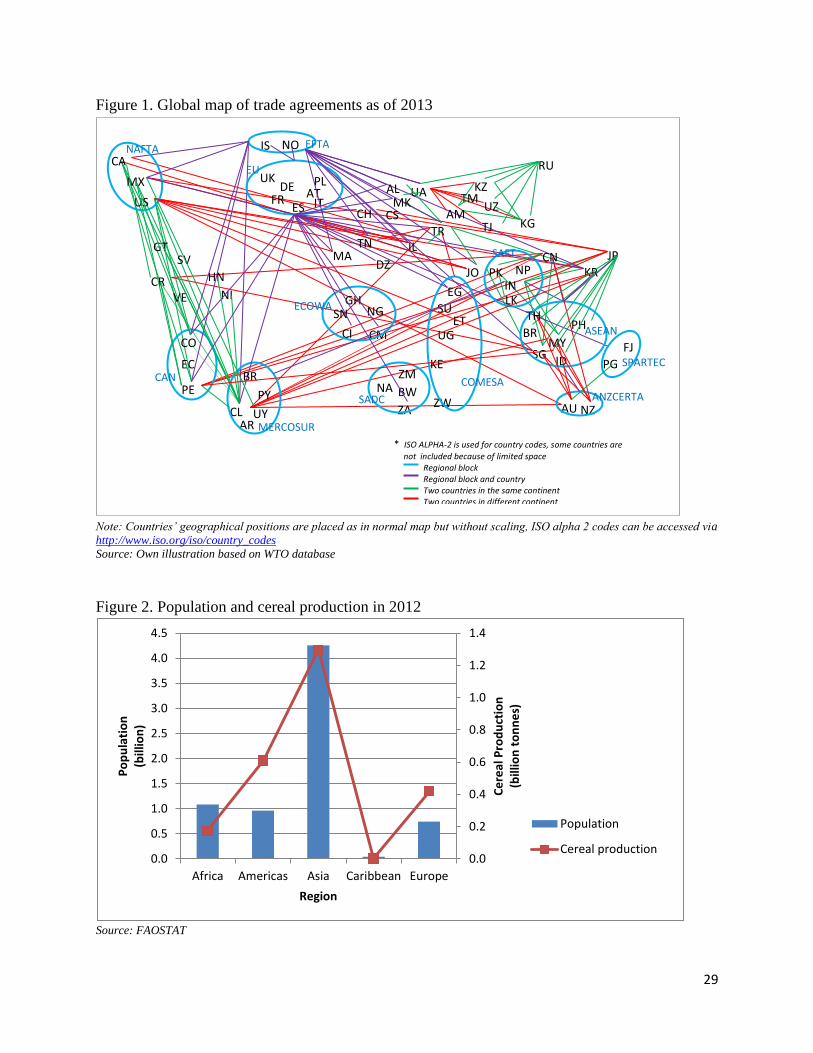
among countries (figure 1). The term “Spaghetti Bowl” has been widely used by trade researcher
and practitioner to describe global trade relations.
[Figure 1 here]
One issue often raised is whether these agreements can play a positive role in strengthening food
security at the worldwide level. “Food security exists when all people, at all times, have access
to sufficient, safe and nutritious food to meet their dietary needs and food preferences for an
active and healthy life”2. An important key factor relates to this definition of food security is
physical availability of food at all times in all places. Economic means to access food will be
meaningless when food is not available. Certain geographies in the global world are endowed by
natural resources needed to produce surplus food, while some others deficit because they have
more demand than food that they can produce. Global imbalances occur since high population is
1 At the 9th WTO ministerial meeting in Bali, December 2013, member countries agreed on an interim solution of
public stockholding for food security purposes until permanent solution is found by 2017. In the post-Bali work,
India blocked Trade Facilitation Agreement (TFA) requesting to delete the time limit of 2017. In November 2014,
member countries agreed that if the permanent solution cannot be found by 2017, the interim solution remains. 2 1996 World Food Summit

2
not associated with high food production (figure 2). Food security at the global level is only
possible when food can move freely from areas of surplus to areas of deficit.
[Figure 2 here]
In the light of the recent excessive food price volatility since 2007-08, in which international
trade distortions have been found to be among the main key drivers of the food price crises
(Martin and Anderson, 2012; von Braun and Tadesse, 2012; World Bank, 2010), it is highly
important to analyze whether trade agreements may contribute to reduce trade distortions and
can bring the world to a freer flow of food by increasing food trade among countries.
Trade agreements are usually based on the commitments to reduce market barriers for all trade
sectors among participant countries. Food is an integral part of these agreements as usually no
important sector to be omitted. However, as these agreements are subject to negotiation, they are
substantially varied in scope and depth. The agreements to reduce the so called bound tariff rates
may or may not affect market access, depending on the gap between the bound rates and the
tariffs that a country actually applies to imports. In addition, non-tariff measures are often used
to protect countries’ interests in some sectors including food. Therefore, the impact of trade
agreements on food trade is an empirical question. Despite that this appears to be a very relevant
issue, to date there is rather poor empirical evidence on the impact of trade agreements on food
trade. Most studies on trade agreements both multilateral and at the regional level are usually
based on aggregate trade, without exclusively looking at the food sector.
Many studies on trade agreements have come naturally to the use of gravity model, one of the
most successful trade analysis device offered in the literature (Anderson, 1979). Rose (2004),
Subramanian and Wei (2007), Grant and Boys (2011), Baier and Bergstrand (2007) and Sun and
Reed (2010) are among the few careful empirical studies that analysed the impact of multilateral
and regional trade agreements on trade of the participant countries. While the first three studies
mentioned above focused on the WTO, the interests of the latter two are on regional trade
agreements.
This paper contributes to the literature in two-folds. First, although Sun and Reed (2010) and
Grant and Boys (2011) have addressed the agricultural trade sector in their study, none of them

3
nor the studies mentioned above have exclusively analysed the impact of trade agreement on
food trade, which will be the main focus of this paper. Second, unlike most papers which usually
focusing on one of the multilateral or regional institutions, this paper brings WTO and RTAs
together in one analysis to compare their impacts on food trade. Using gravity model of
international trade, the discussions framework built in this paper is simply to answer whether the
establishments of the WTO and RTAs have facilitated food trade among the participant
countries.
The remainder of this paper is organized as follows. The next section provides the background
information of trade agreements, market access and food trade. The third section discusses the
theoretical framework followed by section on model specification, data description and results
discussion. The last section concludes.
2. Trade Agreements, Market Access and Food Trade
Before discussing the theoretical framework of the gravity model used in the analysis and
presenting the results, this section provides background information for the study. It provides
some information on the development of trade agreements both multilateral and at the regional
level, followed by the market access of food and global food trade.
2.1. Trade Agreements
Trade Agreements in the global world trade system can be distinguished by multilateral and
regional trade agreements. The WTO is the one and only recognized body in the multilateral
trading system that intends to supervise international trade. The organization officially exists
since 1995, replacing its predecessor the General Agreement on Tariffs and Trade (GATT)
which embarked in 1948. The WTO has been struggling for more than a decade to complete the
Doha Development Agenda which was launched in 20013. The negotiations have been
deadlocked because of many differences between developed and developing countries mainly in
3 Doha Development Agenda is the current WTO trade negotiation round launched at the fourth ministerial meeting
in Doha, Qatar November 2001

4
view of some major issues including agricultural trade restriction and facilitation. Only at the end
of 2013 significant progress was made by the negotiation. Trade facilitation agreement known as
“Bali Package” was adopted in the 9th ministerial meeting hosted by Indonesia and thus the first
multilateral agreements approved by all member countries have been finally reached in the
history of the WTO.
While the principle of non-discrimination in trade is central to multilateral trade system under the
GATT/WTO system, member countries are permitted to enter RTAs to promote free trade
among members as long as these agreements do not raise barriers to non-members4. However,
RTAs have had controversial role, some argue that the enormous number of RTAs have been
hampering multilateral trade negotiation (Levy, 1997) while some others believe that RTAs have
positive effects toward freer multilateral trade (Freund, 2000; Ornelas, 2005).
RTAs come in variety of types and forms based on the scope and depth. The most common type
of the agreement is Free Trade Agreement which is a commitment among participant countries to
remove tariffs across members while continuing to maintain their own tariff regimes to other
countries that are not members of the agreement. Another type of the agreement is customs union
which goes one step further by uniting tariff regimes. Beyond customs union is a common
market which allows not only free flow of goods but also other factors of production i.e. labor
and capital. A common market with monetary union is generally referred as an economic union.
Even though there are some distinctions between these agreements, the borderlines between
those definitions are somehow blurred in practice and depend on the settings agreed by all
participant countries.
As of January 2014, there have been 583 regional trade agreements notified to the WTO, 377 of
them were in force5. Figure 3 shows that the numbers of regional trade agreements have been
growing sharply since early 1990s, and even more accelerated since early 2000s. The agreement
formation among countries has gone beyond only with neighboring countries and their only
natural trading partners, they are often cross continents. European Union – Papua New Guinea,
US – Australia, Japan – Switzerland are among a few mentioned trade agreements that have been
formed among countries or entities from different continents.
4 GATT, Article XXIV 5 http://www.wto.org/english/tratop_e/region_e/region_e.htm, accessed on March 17th 2014

5
[Figure 3 here]
2.2. Market Access
Most of trade agreements are based on the commitments of member countries to reduce market
barriers. For example, the 1995 Agreement on Agriculture (AoA) of the WTO required 36
percent average tariff reduction by developed countries with a minimum per tariff line reduction
of 15 percent over six years. Developing countries are required to reduce their tariffs by 24
percent on average with a minimum per tariff line reduction of 10 percent over ten years. Least
Developed Countries were exempted from tariff reductions, but either have to convert their non-
tariff measures to tariffs or bind their tariffs and creates a ceiling which cannot be increased in
the future.6
Tariff reduction schedules of RTAs are varied depend on their settings. However, most of these
agreements have contributed to tariff reductions across products and countries. Fulponi et al.,
(2011) discover that in addition to WTO-AoA, regional trade agreements have a significant
impact on tariffs elimination in agricultural products. Their investigation found that on average
over products and concessions, 90 percent of tariff lines are duty-free at the end of RTAs
implementation period.
[Table 1 here]
All countries have been found to reduce their tariffs on average for all sectors including food
(table 1). However, food is always among the highly restrictive sectors in international trade. In
2012, the simple average applied tariff rate of food for all countries is 11.55 percent, which has
been reduced from 14.55 percent in 1992. This tariff reduction is relatively lower compare to
other sectors. Textiles for example, the tariffs on average have been reduced from 17.21 percent
in 1992 to 10.06 percent in 2012.
[Figure 4 here]
6 http://www.wto.org/english/thewto_e/whatis_e/tif_e/agrm3_e.htm, accessed March 17th, 2014.

6
Surprisingly, Low Income Countries (LIC) have contributed the most to the food tariff reduction.
This country group has significantly reduced their tariffs on food from 24 percent in 1992 to 10
percent in 2012 on average. The fact is interesting since Least Developed Countries are
exempted from tariff reduction in the WTO-AoA.
Average applied tariff rates of food are found to have decreased over years for all country
groups, except for High Income Countries (HIC) which remain 8 percent in 1992 and 2012.
Their applied food tariff rates have been already low compared to other country groups. Upper
middle income countries (UMIC) have reduced their applied food tariff rates from 20 percent in
1992 to 15 percent in 2012 on average, while Lower Middle Income Countries (LMIC) are found
to have reduced their applied food tariff rates from 24 percent in 1992 to 16 percent in 2012 on
average.
There are also a number of policy measures other than tariffs that may affect trade flow between
countries. These policy measures are usually categorized as non-tariff measures (NTMs) and can
be described as the following:
[Table 2 here]
Although quantitative studies continue to evaluate trade based on tariffs as trade barriers, much
attention has now shifted to NTMs. However, data on NTMs are less transparent compared to
tariffs which make the evaluation on NTMs difficult. Most important is to analyze what have
been the impacts of NTMs on the trade flow. Thus, the analysis can be directly addressed at the
trade flows among countries.
4.2.3. Food Trade
Trade plays an important role in the food equation of most countries. It can be an alternative
when supply of food from own production does not meet demand, because the inelastic nature of
food production can only respond slowly to increasing demand (Haile et al., 2013). Food trade is
also the source of income for many countries, especially for the main food producer countries.
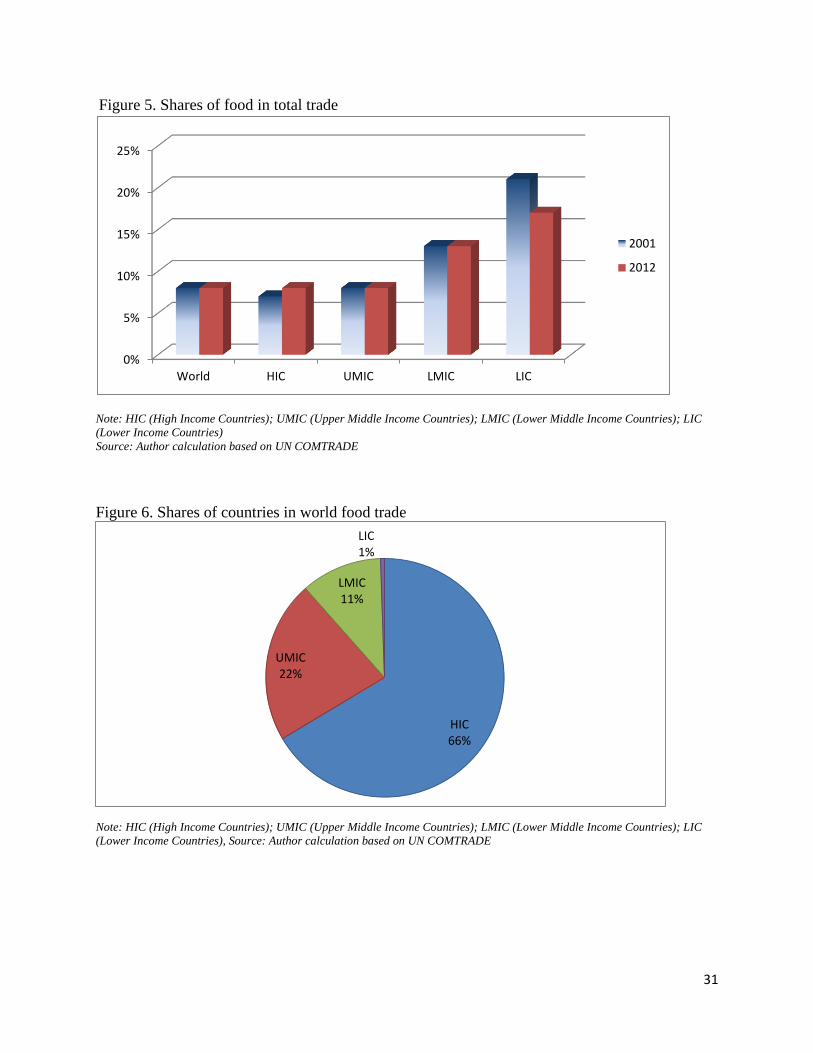
[Figure 5 here]

7
The share of food in the total world trade is relatively small and remains stable over years at
about 8 percent in 2001 and in 2012 (figure 5). The highest share of food in the total trade is
found for LICs which accounted for 21 percent in 2001 and have decreased to 17 percent in
2012. The share decrease is not because LICs trade less food, but their trade in other sectors has
increased more than the food sector. This is an indication that LICs are more connected to the
world trade system. Change in share of food in the total trade is also the case for HIC where their
food shares in 2012 is higher compare to 2001. Other country groups’ shares remain stable
across years at 8 percent and 13 percent for UMICs and LMICs respectively.
The total value of the world food trade in 2012 is USD 2.6 billion7. HIC have the highest share
accounted for 66 percent of the total world food trade, followed by UMICs, LMICs and LICs
(figure 6). The data show that share of country groups in world food trade are consistent with
their income levels. The higher the income, their share in the world food trade is also higher.
Although the share of food in the total trade of LICs is relatively higher compare to other country
groups, their total value accounted only for 1 percent of the world food trade.
[Figure 6 here]
3. Theoretical Framework
The gravity framework that is employed in this study suggests that the patterns of trade are
explained by the forces behind trade flows between two trading partners. The theoretical
underpinning of the model was inspired by the Newtonian theory of gravitation, where countries
are mutually attracted to trade just like planets are mutually attracted in proportion to their sizes
and proximity. After being conceptualized for the first time by Jan Tinbergen8 in 1962, gravity
model is considered as the workhorse of international trade with fortunate empirical validity.
Initially there was no theoretical foundation behind the econometric model used as the ex-post
analysis of trade pattern between the two countries. One of the very first theoretical explanations
for the gravity model was the work of Anderson (1979) which based on a demand function using
7 UN COMTRADE via WITS, Standard International Trade Classification (SITC) is use to categorize food 8 Jan Tinbergen was an economist with physics degree. He was the first Nobel Prize winner in economic science
which he received in 1969 together with Ragnar Frisch
8
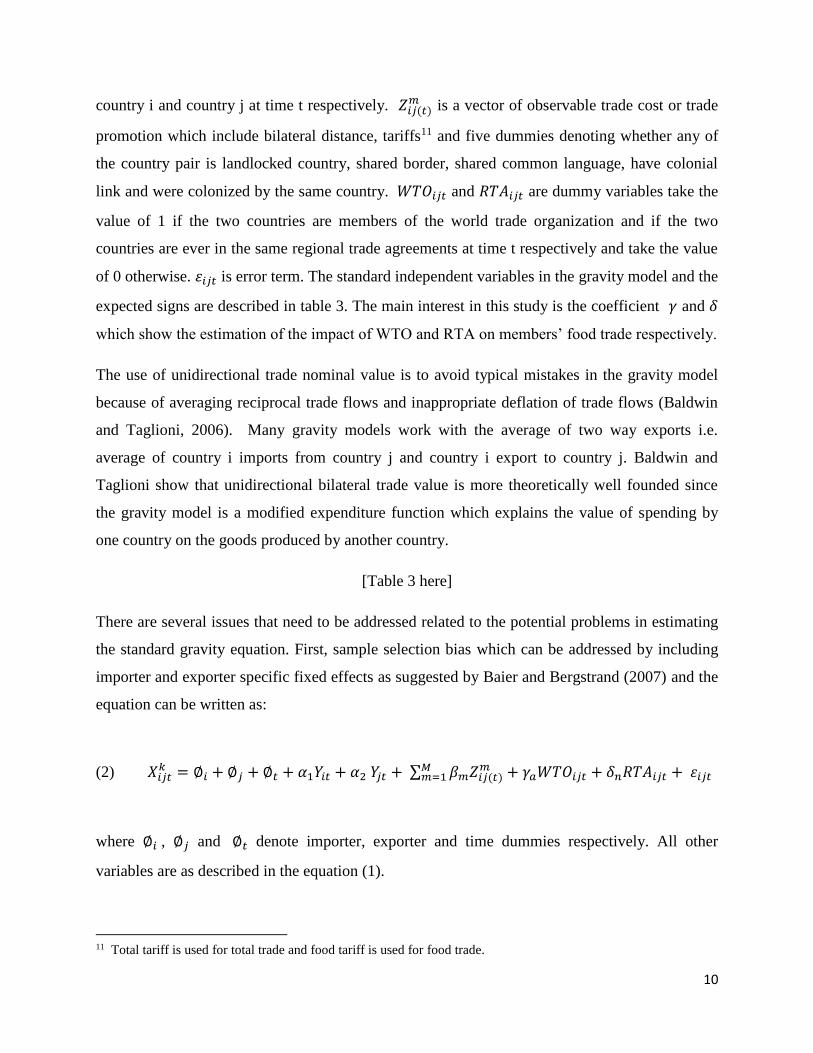
Armington elasticity9 where each country produces and sells goods on the international market
that are differentiated from other goods produced in other countries. Later works have built
gravity model in the monopolistic competition frameworks (Helpman and Krugman, 1985),
Heckscher-Ohlin framework (Deardorff, 1998) and the Ricardian framework (Eaton and Kortum,
2002). The gravity models work well in these different approaches, each with different
assumptions.
Gravity model in the Ricardian framework builds on the assumption that trade is beneficial due
to comparative advantage. A country that is less productive in absolute terms can nevertheless
have a comparative advantage in the production of a good by differing costs in production or
production technologies. In the Heckscher-Ohlin, international trade occurs as a result of relative
differences in factor endowments between countries. Countries tend to export goods which are
produced by their abundant factor endowments and import goods which are intensively
manufactured. Consequently, the exported goods are relatively cheap to produce, whereas the
imported goods are relatively expensive in production due to factor scarceness. The Helpman
and Krugman approach assumes increasing returns to scale and a state of monopolistic
competition between firms. The approach is usually used to explain intra-industry trade which is
the trade of products belonging to the same categories. Economies of scale incentivize the
countries to produce selected products and trade with other countries producing some other
products.
International trade is basically not so much different from domestic trade as the motivation and
behavior of traders involved do not change fundamentally regardless of whether trade is across
national border or within a nation. The main difference is that international trade is typically
more costly as crossing national borders usually impose additional costs such as tariffs or other
costs associated with country differences such as language and culture. These additional costs
are usually well captured in the gravity equation. The gravity model essentially explains how
countries attracted to goods produced in other countries and this attraction is reduced by costs
related with geographical distance and other costs associated with countries’ differences.
9 Armington elasticity refers to the work by Paul Armington (1969) that products traded internationally are
differentiated by country of origin

9
Bilateral trade flows are also heavily influenced by trade agreements. In a non-discriminatory
trade, countries are able to export their products if they are the most efficient producers and to
import from the lowest-cost suppliers. Trade agreements change this pattern by lowering barriers
to trade among member countries. Member countries of an agreement which could be not the
most efficient producers might be able to export their products to other member countries simply
because they enjoy tariff preferences in the agreements.
Economic motivation is in particular important consideration in the choice of partner countries in
establishing or joining an agreement. Welfare gains from trade are expected from expanding the
market. Nevertheless economic motivation is not always behind the deal of countries to form an
agreement. Empirical studies suggest that the welfare effects of trade agreements can be positive
or negative, thus the expected benefit could be non-economic factors. Wonnacott and Lutz
(1989) argue that political factors are also important for countries in determining with which
countries they are likely to form trade agreements.
Standard method to evaluate the impacts of trade agreement on bilateral trade flows is usually to
include trade agreement as dummy variable in the right-hand side of the gravity equation. The
direction is clear, to what extent trade agreement influence trade flows between countries.
However, trade agreement might not be purely exogenous when one considers these economic
and political factors in driving countries’ choices of partners in forming or joining trade
agreement.
4. Model Specification
The basic formulation of the gravity equation that will be used in the study is the following:
(1) 𝑋𝑖𝑗𝑡𝑘 = 𝛼1𝑌𝑖𝑡 + 𝛼2 𝑌𝑗𝑡 + ∑ 𝛽𝑚𝑍𝑖𝑗(𝑡)
𝑚𝑀𝑚=1 + 𝛾𝑎𝑊𝑇𝑂𝑖𝑗𝑡 + 𝛿𝑛𝑅𝑇𝐴𝑖𝑗𝑡 + 휀𝑖𝑗𝑡
where 𝑋𝑖𝑗𝑡𝑘 is unidirectional trade10 nominal value at time t with the superscript k to note that the
estimation will distinguish the value of total trade and food trade to allow for comparison
between the two. 𝑌𝑖𝑡 and 𝑌𝑗𝑡 are economic size represented by gross domestic product (GDP) of
10 Unidirectional trade could be import of country i from country j or export of country i to country j, here import
value is used.
10
country i and country j at time t respectively. 𝑍𝑖𝑗(𝑡)𝑚 is a vector of observable trade cost or trade
promotion which include bilateral distance, tariffs11 and five dummies denoting whether any of
the country pair is landlocked country, shared border, shared common language, have colonial
link and were colonized by the same country. 𝑊𝑇𝑂𝑖𝑗𝑡 and 𝑅𝑇𝐴𝑖𝑗𝑡 are dummy variables take the
value of 1 if the two countries are members of the world trade organization and if the two
countries are ever in the same regional trade agreements at time t respectively and take the value
of 0 otherwise. 휀𝑖𝑗𝑡 is error term. The standard independent variables in the gravity model and the
expected signs are described in table 3. The main interest in this study is the coefficient 𝛾 and 𝛿
which show the estimation of the impact of WTO and RTA on members’ food trade respectively.
The use of unidirectional trade nominal value is to avoid typical mistakes in the gravity model
because of averaging reciprocal trade flows and inappropriate deflation of trade flows (Baldwin
and Taglioni, 2006). Many gravity models work with the average of two way exports i.e.
average of country i imports from country j and country i export to country j. Baldwin and
Taglioni show that unidirectional bilateral trade value is more theoretically well founded since
the gravity model is a modified expenditure function which explains the value of spending by
one country on the goods produced by another country.
[Table 3 here]
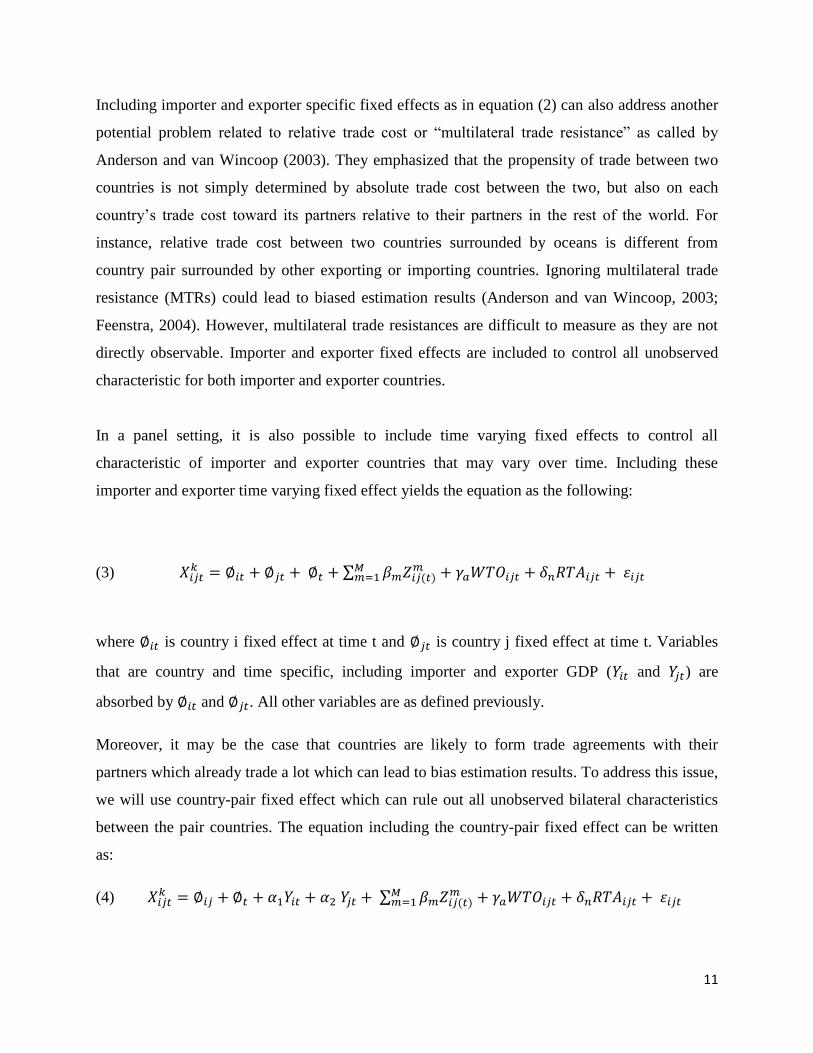
There are several issues that need to be addressed related to the potential problems in estimating
the standard gravity equation. First, sample selection bias which can be addressed by including
importer and exporter specific fixed effects as suggested by Baier and Bergstrand (2007) and the
equation can be written as:
(2) 𝑋𝑖𝑗𝑡𝑘 = ∅𝑖 + ∅𝑗 + ∅𝑡 + 𝛼1𝑌𝑖𝑡 + 𝛼2 𝑌𝑗𝑡 + ∑ 𝛽𝑚𝑍𝑖𝑗(𝑡)
𝑚𝑀𝑚=1 + 𝛾𝑎𝑊𝑇𝑂𝑖𝑗𝑡 + 𝛿𝑛𝑅𝑇𝐴𝑖𝑗𝑡 + 휀𝑖𝑗𝑡
where ∅𝑖 , ∅𝑗 and ∅𝑡 denote importer, exporter and time dummies respectively. All other
variables are as described in the equation (1).
11 Total tariff is used for total trade and food tariff is used for food trade.
11
Including importer and exporter specific fixed effects as in equation (2) can also address another
potential problem related to relative trade cost or “multilateral trade resistance” as called by
Anderson and van Wincoop (2003). They emphasized that the propensity of trade between two
countries is not simply determined by absolute trade cost between the two, but also on each
country’s trade cost toward its partners relative to their partners in the rest of the world. For
instance, relative trade cost between two countries surrounded by oceans is different from
country pair surrounded by other exporting or importing countries. Ignoring multilateral trade
resistance (MTRs) could lead to biased estimation results (Anderson and van Wincoop, 2003;
Feenstra, 2004). However, multilateral trade resistances are difficult to measure as they are not
directly observable. Importer and exporter fixed effects are included to control all unobserved
characteristic for both importer and exporter countries.
In a panel setting, it is also possible to include time varying fixed effects to control all
characteristic of importer and exporter countries that may vary over time. Including these
importer and exporter time varying fixed effect yields the equation as the following:
(3) 𝑋𝑖𝑗𝑡𝑘 = ∅𝑖𝑡 + ∅𝑗𝑡 + ∅𝑡 + ∑ 𝛽𝑚𝑍𝑖𝑗(𝑡)
𝑚𝑀𝑚=1 + 𝛾𝑎𝑊𝑇𝑂𝑖𝑗𝑡 + 𝛿𝑛𝑅𝑇𝐴𝑖𝑗𝑡 + 휀𝑖𝑗𝑡
where ∅𝑖𝑡 is country i fixed effect at time t and ∅𝑗𝑡 is country j fixed effect at time t. Variables
that are country and time specific, including importer and exporter GDP (𝑌𝑖𝑡 and 𝑌𝑗𝑡) are
absorbed by ∅𝑖𝑡 and ∅𝑗𝑡. All other variables are as defined previously.
Moreover, it may be the case that countries are likely to form trade agreements with their
partners which already trade a lot which can lead to bias estimation results. To address this issue,
we will use country-pair fixed effect which can rule out all unobserved bilateral characteristics
between the pair countries. The equation including the country-pair fixed effect can be written
as:
(4) 𝑋𝑖𝑗𝑡𝑘 = ∅𝑖𝑗 + ∅𝑡 + 𝛼1𝑌𝑖𝑡 + 𝛼2 𝑌𝑗𝑡 + ∑ 𝛽𝑚𝑍𝑖𝑗(𝑡)
𝑚𝑀𝑚=1 + 𝛾𝑎𝑊𝑇𝑂𝑖𝑗𝑡 + 𝛿𝑛𝑅𝑇𝐴𝑖𝑗𝑡 + 휀𝑖𝑗𝑡

12
where ∅𝑖𝑗 is country-pair fixed effect and ∅𝑡 is time effect. All other variables are as defined
previously.
Applying gravity model into a sector level of trade such as food is not entirely straightforward.
The reason is that there are more differences between countries when one aims to analyze a
specific sector. For instance, not all countries are categorized as food producers. These
differences, however, can be well captured by including country specific fixed effects in the
estimation. Another consideration that needs to be specially addressed in analyzing sectoral
trade is zero trade values. It is likely that zero trade values are more frequent when estimating
specific sector of trade. The use of logarithmic transformation in the standard gravity model
creates immediate problem when trade value is zero, since log of zero is undefined. Omitting
zero variables may result in bias estimation (Santos Silva and Tenreyro, 2006). As an alternative,
Santos Silva and Tenreyro suggest to use Poisson Pseudo maximum Likelihood (PPML)
estimator. They show that PPML provides robust estimation in the presence of
heteroskedasticity. PPML estimation can be estimated by solving the following first order
condition:
(5) ∑ (𝑋𝑝 − exp(𝑍𝑝�̂�))𝑝 = 0
where p denotes country pairs, 𝑋𝑝 is unidirectional trade (i.e. imports) between the country pairs
expressed in levels not in logarithms and 𝑍𝑝 is the full vector of the gravity equation as defined
in equation (1).
5. Data Description
Bilateral food and total trade data are derived from the United Nations Commodity Trade
Statistics Database (UN COMTRADE) via World Integrated Trade Solution (WITS). The
definition of food uses standard product in the Standard International Trade Classification (SITC,
revision 1) 0+1+22+4. Specifically it includes food and live animal, beverages and tobacco, oil
seeds, oil nuts, oil kernels, animal and vegetable oils/fats.

13
The database developed in this study consists of 162 countries around the globe over the period
1991 – 2012 with three years intervals (1991, 1994, …, 2012). There are maximum 208656
(162x161x8) observations with the number of zero trade observations are 90867 (43.5%) and
144240 (69%) for total trade and food trade respectively.
Gross domestic product (GDP) in nominal US dollars comes from World Development
Indicators12 of the World Bank. Data on total tariffs and food tariffs come from Trade Analysis
and Information system (TRAINS) database and derived via WITS13. Data on distance,
landlocked, contiguous border, common language, colonial link and common colony are taken
from Centre d'Etudes Prospectives et d'Informations Internationales (CEPII). WTO database is
the main source for data on WTO membership and regional trade agreements. There are 188
RTAs included in the sample covering all regional trade agreements involving sample countries
in the analysis that enter into force from 1960 to 2012. Countries’ level of development is
represented by income level; high income countries is categorized as developed countries,
middle and low income countries are categorized as developing countries. The levels of income
are according to GNI per capita, taken from the World Bank database.
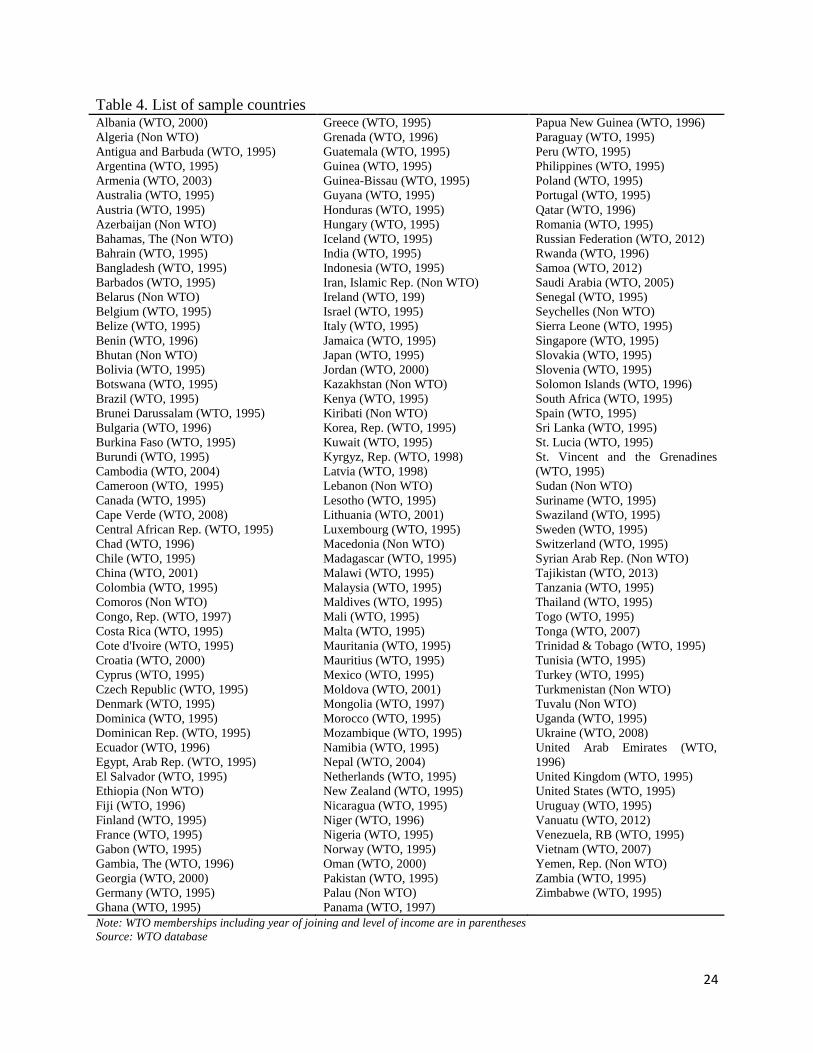
[Table 4 here]
[Table 5 here]
6. Results Discussions
The basic estimation results are presented in table 6. We first estimate the model using Ordinary
Least Squares (OLS) with time, importer and exporter fixed effects. On the total trade as
dependent variable, all coefficients are statistically significant and show the correct signs as
expected. Economic size (GDP) both importer and exporter positively impact total trade. Tariff,
Distance and landlocked negatively impacts trade, while sharing border, language and colonial
ties stimulate trade. For food trade, statistically significant coefficients are found for GDP
12 In some cases, data are taken from national statistics to supplement World Bank data when it is missing or
incomplete. 13 When data on tariffs is missing in some years of a particular country, the tariffs of the nearest year is used and the
earlier year comes at the first place.

14
importer, tariff, distance and shared border. Other variables are not statistically significant.
Unexpected sign is food tariff which positively impacts food trade with the coefficient of 0.0266
and statistically significant at 1 percent.
[Table 6 here]
The main interests of the estimation are the coefficients of WTO and RTAs that show to what
extent both agreements, at the multilateral and regional levels, impact trade flow among
participant countries. For total trade as dependent variable, the membership of the WTO results
in a coefficient 0.216 that is positive and statistically significant; suggesting that trade among
WTO members is about 22 percent higher relative to non-members. The result for RTA
membership is also positive and statistically significant with the coefficient 0.250, suggesting
that joining RTA increase members’ trade about 25 percent on average compared to other
countries trade without RTAs. The key question is whether WTO and RTAs have facilitated food
trade among the participant countries. However, no statistically significant results are found from
the estimations. the coefficient of WTO is negative (-0.0557) and the coefficient of RTAs is
positive (0.0269), both are statistically insignificant.
The results of the estimation when controlling for all characteristics of the importer and exporter
that may vary over time by including time varying fixed effects do not change a lot from the
previous estimation. Nearly all coefficients of the standard gravity model explanatory variables
consistently show the same signs and significance level as in the previous estimation. Only tariff
is much different but with the same sign with the previous specification with the coefficient of (-
0.102) and statistically significant at 1 percent. In this estimation, GDP importer and GDP
exporter are absorbed by the time varying fixed effects. However, this does not really matter
since our main interest is on the coefficient of WTO and RTA. We found the coefficient of the
WTO is 0.231 which is positive and statistically significant, suggesting that the WTO have
increased trade among its member countries by 23 percent on average compared to non
members. The coefficient of RTA is 0.169, positive and statistically significant, suggesting that
trade among RTA members is relatively 17 percent higher compared to countries without RTAs.
15
For food trade, we found that the coefficient of food tariff is statistically insignificant. All other
variables are consistent with the previous specification in terms of signs and significance levels.
The magnitudes of the coefficient are also not much different. For the variable of interests, like
in the previous specification, the coefficient of WTO membership is negative (-0.219) and
statistically insignificant. However, RTAs is positive and statistically significant with coefficient
0.113 which suggests that food trade among RTA members are relatively 11 percent higher than
non-members on average.
In the estimations of OLS with bilateral country pair fixed effect to control for all unobserved
country-pair characteristics, we found that both GDP importer and exporter positively impacts
trade with the coefficient of 1.002 and 0.526 that are statistically significant. The coefficient of
tariff is negative (-0.0065) but statistically insignificant and all other country-pair specific
variables are absorbed by the country-pair fixed effects. For the variable of interests, the
coefficient of WTO is 0.193, positive and statistically significant, suggesting that the WTO have
increased trade among its member countries by 19 percent on average compared to non
members. RTAs is also positive and statistically significant with coefficient 0.176 which
suggests that food trade among RTA members are about 18 percent higher than non-members on
average. For food trade, the two coefficients of WTO and RTAs are statistically insignificant.
We further estimate the gravity model using Poisson Pseudo-Maximum Likelihood (PPML). In
this specification, we use bilateral country-pair fixed effect to control all unobserved bilateral
country-pair characteristics. For total trade, we found GDP importer and GDP exporter are
positive and statistically significant as expected with the coefficient of 0.734 and 0.696
respectively. For tariff, the coefficient is statistically insignificant, while all other country-pair
specific variables are absorbed by the bilateral fixed effect. For food trade, as in the previous
estimations using OLS, we found only GDP importer of the standard gravity variables that is
positive and statistically significant. For the variables of interest, the WTO and RTAs are
positive and statistically significant for total trade with the coefficients of 0.108 and 0.0698
respectively, suggesting that the trade of WTO members and RTAs members are higher about 11
percent and 7 percent respectively compared to non members. For food trade, we found the
coefficient of WTO is statistically insignificant, while RTA is positive and statistically
significant with the coefficient of 0.222.
16
Our results show that nearly all signs and significance levels of the variables estimated are
consistent with slightly different magnitudes in all different specifications. However, interesting
result comes from tariff, especially for food trade, which shows positive sign suggesting that the
increase of tariff increases food trade. We further check this result by estimating the effect of
WTO and RTA membership on tariff. This is important since the purpose of trade agreements is
basically to reduce trade barriers including through tariff reduction. Moreover, the test is
conducted to find out whether higher tariff reduction in one sector such as food discourage trade
in other sector or vice versa.
[Table 7 here]
The effects of the WTO and RTAs on tariff are tested using three categories; total tariff, food
tariff and food tariff relative to total tariff. On the third category, we divide the food tariff by
total tariff to analyze the increase/reduction of food tariff relative to total tariff. We found only
RTAs that have significantly reduced tariff and food tariff, while the WTO is found to have
positive impacts on tariff. The results are not as expected and that are questioning the tariff
reduction effects of the memberships of the WTO. On the food tariff relative to total tariff, we
found negative signs for both WTO and RTAs. This indicates that the WTO and RTAs
memberships result in higher food tariff reduction relative to total tariff.
Further investigation is conducted to analyze possible asymmetries in trade agreements
especially between developed and developing countries and countries in different regions. Since
all specifications in the previous estimations show consistent results, the following estimations
only employ PPML with considerations that addressing zero trade values in analyzing sector
trade such as food is highly important. We include bilateral country pair fixed effect in the
estimation to control all unobserved variables that are country-pair specific.
[Table 8 here]
The results suggest that WTO negatively impacts trade when both countries are developed but
positively impacts trade when trade involves developing countries. While for food trade, positive
impacts are found when both counties are categorized as developing countries. RTAs are also
found to have positive impacts when trade is between developed and developing countries or
17
both parties are developing countries. We found statistically insignificant effect of the RTAs on
trade when both countries are developed countries. While for food trade, positive and statistically
significant effect is found when food trade is between developed and developing country.
[Table 9 here]
From the estimation of the WTO based on regions, we found that the WTO has different impacts
in different regions (table 9). The highest positive impact of the WTO on trade is found for trade
between African countries with the coefficient of 0.608. For food trade, the highest positive
impact is found for food trade between European countries with the coefficient of 0.895. The
results also indicate that food is traded more within a region rather that traded across regions.
We further analyse several specific RTAs around the globe (table 10). RTAs analysed are
selected from different continents to see their impacts on food trade. For Asia, this include
ASEAN Free Trade Area (AFTA) and Pan Arab Free Trade Area (PAFTA). In Africa, RTAs
analyzed are Common Market for Eastern and Southern Africa (COMESA), Economic
Community of West African States (ECOWAS) and Southern African Development Community
(SADC). North American Free Trade Agreement (NAFTA) and Southern Common Market
(MERCOSUR) are taken for American countries, and European Union (EU) for Europe.
[Table 10 here]
We found that COMESA, ECOWAS, EU, MERCOSUR and SADC positively impacts trade
among the members with ECOWAS being the highest with the coefficient of 1.608. Among
these RTAs, only EU is found to also positively impacts food trade among its members with the
coefficient of 0.940 which suggests that food trade among its members is about 94 percent higher
compare to non members. Another RTA that found to have positive impacts on food trade is
NAFTA. However, no statistically significant result is found that NAFTA has also positive
impacts on total trade among its members.
18
7. Conclusions
The fast increase and excessive volatility of food prices in recent years are a significant
indication of change in the global food market and a strong signal of resource scarcity (von
Braun et al., 2014). Therefore, global food security is only possible when food can move freely
from countries of surplus to countries of deficit and should not be prevented by international
trade distortions.
This chapter is questioning the contributions of the enormous number of trade agreements in the
world trade system in strengthening food security at the worldwide level. The focus of the study
is investigating whether trade agreements, both multilateral i.e. the WTO and at the regional
level enhance food trade among the participant countries and bring the world into a freer flow of
food.
Empirical results suggest that the multilateral and regional trade institutions indeed have
delivered significant positive impacts on trade but not necessarily in the food sector. The
findings suggest that only RTAs enhance food trade among their member countries whereas no
evidences can be found that the WTO membership increase food trade among the members.
Surprisingly however, contrary to general believes where the WTO is often criticized by
benefiting the developed countries more than the developing ones, we found that the WTO has
facilitated trade as well as food trade of the developing countries more than of the developed
countries. We found positive impacts of the WTO on trade when trade involves developing
countries. The negative sign of trade between developed countries also indicates that the
developed countries trade more with the developing countries than with the other developed
ones. The results indicate that developing countries are more connected to the global trade than
before.
The findings also suggest that trade among countries is likely to have gone beyond only with
traditional partners and beyond only with partner country in the same region. Food trade
however, is still concentrated based on regions. We found that the WTO has stronger effects on
food trade when the country-pair belongs to the same region than food trade between countries in
different regions. Our analysis on selected RTAs around the globe also supports the evidences.
19
Trade agreements, both at multilateral and regional level, are intended to reduce trade barriers
including through tariff elimination. However, our results suggest that no evidences are found
that the WTO has reduced tariffs among the member countries. Only RTAs are found to have
reduced tariffs among the members. Nevertheless, the positive effects of the WTO on trade show
that the cooperation in the multilateral trade institution is more than only reducing tariffs. The
member countries seems to prefer trade more with other members compared to trade with non-
members even without tariff facilitation. On the other hand, no tariff reduction effect of the
WTO on food trade confirms the findings that the food sector in the cooperation is still left
behind.
Stronger cooperation and coordination among countries is still needed to ensure the delivery of
food to the people at all times in all places. The success of the 9th ministerial meeting of the
WTO which has delivered the Bali Package can be an important momentum in strengthening
international trade cooperation at the multilateral level including in the food sector and bring the
world to a freer flow of food. Way forward is to ensure that the agreements can be implemented
and bring benefits to global food security.

20
References
Anderson, J. E., and E. van Wincoop. 2003. Gravity with Gravitas: A Solution to the Border
Puzzle. American Economic Review 93(1): 170–92.
Bagwell, K., and R. W. Staiger. 2002. The Economics of the World Trading System. Cambridge,
MA: MIT Press.
Baier, S. L., and J. H. Bergstrand. 2007. Do Free Trade Agreements Actually Increase Members’
International Trade? Journal of International Economics 71(1):72-95.
Baldwin, R., and D. Taglioni. 2006. Gravity for Dummies and Dummies for Gravity Equations.
NBER Working Paper No. 12516.
Cameron, C., and P. Trivedi, 1990. Regression Based Tests for Over Dispersion in the Poisson
Model. Journal of Econometrics 46(3): 347–364.
CEPII (Centre d'Etudes Prospectives et d'Informations Internationales). Database.
http://www.cepii.fr/CEPII/en/welcome.asp. Accessed in January 2014.
Engelbrecht, B. and C. Pearce. 2007. The GATT/WTO has Promoted Trade, but Only in Capital-
Intensive Commodities. Applied Economics 39 (12): 1573–1581.
Fally, T. 2012. Structural Gravity and Fixed Effects. Unpublished working paper, University of
Colorado.
FAO (Food and Agriculture Organization of the United Nations). 2003. Trade reforms and food
security: conceptualizing the linkages. Rome.
FAO (Food and Agriculture Organization of the United Nations). 2012. Regional trade
agreements and food security in Asia. Food and Agriculture Organization of the United Nations
regional office for Asia and the Pacific. Bangkok.
FAOSTAT. http://faostat3.fao.org/faostat-gateway/go/to/home/E. Accessed in January 2014.
Feenstra, R. 2004. Advanced International Trade: Theory and Evidence. Princeton, NJ:
University Press.
Freund C. 2000. Different Paths to Free Trade: The Gains from Regionalism. Quarterly Journal
of Economics 115 (4): 1317–1341.
Fulponi, L., M. Shearer and J. Almeida. 2011. Regional Trade Agreements - Treatment of
Agriculture, OECD Food, Agriculture and Fisheries Working Papers, No. 44, OECD Publishing.
Haile, M. G., M. Kalkuhl and J. von Braun. 2013. Short-term Global Crop Acreage Response to
Prices and Implications of Volatility. ZEF Discussion Papers on Development Policy No. 175.

21
Heckman,J. J. 1979. Sample Selection Bias and a Specification Error. Econometrica 47 (1):
153–161.
Helpman, E., M. Melitz, and Y. Rubinstein. 2008. Estimating Trade Flows: Trading Partners
and Trading Volumes. Quarterly Journal of Economics 123 (2): 441–487.
Ingco, M. D. 1995. Agricultural Liberalization in the Uruguay Round: One Step Forward, One
Step Back? World Bank Policy Research Working Paper No. 1500, Washington DC.
Irwin, D. A. 1995. The GATT in Historical Perspective. American Economic Review 85 (2):
232–328.
Josling, T. E. 2011. Regional Integration and Agricultural Trade Policy. A Chapter in
Preferential Trade Agreement Policies: A Handbook. The World Bank.
Josling, T. E., K. Anderson, A. Schmitz, S. Tangermann. 2010. Understanding International
Trade in Agricultural Products: One Hundred Years of Contributions by Agricultural
Economists. American Journal of Agricultural Economics 92 (2): 424 - 446
Levy, P. I. 1997. A Political-Economic Analysis of Free-Trade Agreements. American Economic
Review 87 (4): 506–519.
Linders, G.-J., and H. de Groot. 2006. Estimation of the Gravity Equation in the Presence of
Zero Flows. Tinbergen Institute Discussion Paper, TI 2006-072.
Liu, X. 2009. GATT/WTO Promotes Trade Strongly: Sample Selection and Model Specification.
Review of International Economics 17(3): 428–446.
Magee, Chris. 2003. Endogenous preferential trade agreements: an empirical analysis.
Contributions to Economic Analysis and Policy, vol. 2, no. 1. Berkeley Electronic Press.
Martin, W. and K. Anderson. 2012. Export Restrictions and Price Insulation during Commodity
Price Booms. American Journal of Agricultural Economics 94: 422-27
Mitra, Devashish, Dimitrios Thomakos, and Mehmet Ulubasoglu. 2002. Protection for Sale in a
Developing Country: Democracy vs. Dictatorship. Review of Economics and Statistics 84 (3), 497 – 508.
OECD (Organization for Economic Co-operation and Development). 2004. Agricultural Policies
in OECD Countries: Monitoring and Evaluation in 2004. Paris.
Ornelas, E. 2005. Endogenous Free Trade Agreements and the Multilateral Trade System.
Journal of International Economics 67 (2): 471–497.
Rose, A. 2004. Do We Really Know That the WTO Increases Trade? American Economic
Review 94(1): 8–114.

22
Santos Silva, J., and S. Tenreyro. 2006. The Log of Gravity. Review of Economics and Statistics
88(4): 641–658.
Subramanian, A., and S. J. Wei. 2007. The WTO Promotes Trade Strongly but Unevenly. Journal
of International Economics 72(1): 151–175.
Sun, L., and M. Reed. 2010. Impact of Free Trade Agreements on Agricultural Trade Creation
and Trade Diversion. American Journal of Agricultural Economics 92(5): 1351–1363.
Timmer, C. P. 2010. Preventing Food Crises Using a Food Policy Approach. The Journal of
Nutrition 140: 224S-228S.
Tinbergen, J. 1962. Shaping the World Economy; Suggestions for an International Economic
Policy. Twentieth Century Fund, New York.
UNCTAD (United Nations Conference on Trade and Development) and WTO (World Trade
Organization). 2012. Practical Guide to Trade Policy Analysis. Geneva.
UNCTAD. http://unctad.org/en/Pages/Home.aspx. Accessed in january 2014.
von Braun, J., B. Algieri and M. Kalkuhl. 2014. World Food System Disruptions in the Early
2000s: Causes, Impacts and Cures. World Food Policy. Volume 1, Number 1. Policy Studies
Organization.
von Braun, J. and G. Tadesse. 2012. Global food price volatility and Spike: An overview of costs,
causes, and solutions. ZEF Discussion Papers on Development Policy No. 161.
WITS (World Integrated Trade Solutions). http://wits.worldbank.org/default.aspx. Accessed in
January 2014.
Wonnacott, P. and M. Lutz. 1989. Is There a Case for Free Trade Areas? in Free Trade Areas
and U.S. Trade Policy. Schott, Jeffrey, Washington, D.C.: Institute for International Economics,
pp. 59-84.
Wooldridge, J. 2002. Econometric Analysis of Cross Section and Panel Data. Cambridge, MA:
MIT Press.
World Bank. 2010. Boom, bust and up again? Evolution, drivers, and impact of commodity
prices: implications for Indonesia. World Bank office Jakarta.
World Bank. World Development Indicators. http://data.worldbank.org/data-catalog/world-
development-indicators. Accessed in January 2014.
WTO (World Trade Organizations). Regional Trade Agreements.
http://rtais.wto.org/UI/PublicMaintainRTAHome.aspx. Accessed in January 2014.

23
Table 1. Average tariff rates of different sectors
Sector Tariff Rates
1992 2012
All Sectors 13.06 6.74
Manufactures 13.21 6.49
Agriculture 13.28 10.24
Textiles 17.21 10.06
Food 14.55 11.55 Note: Average tariff rates not weighted, classification based on standard product in SITC
Source: TRAINS database accessed via WITS
Table 2. International classification of non-tariff measures
A Sanitary and phytosanitary measures
B Technical barriers to trade
C Pre-shipment inspection and other formalities
D Price control measures
E Licenses, quotas, prohibitions ad other quantity control measures
F Charges, taxes and other para-tariff measures
G Finance measures
H Anti-competitive measures
I Trade-related investment measures
J Distribution restrictions
K Restrictions on post-sales services
L Subsidies (excluding export subsidies)
M Government procurement restrictions
N Intellectual property
O Rules of origin
P Export-related measures Source: UNCTAD
Table 3. Standard gravity independent variables and expected signs
Independent Variables Descriptions Expected Signs
Gross domestic product of the importer country i +
Gross domestic product of the exporter country j +
Geographical distance -
Tariffs -
Landlocked -
Shared border +
Common language +
Colonial link +
Common colony +
24
Table 4. List of sample countries Albania (WTO, 2000)
Algeria (Non WTO)
Antigua and Barbuda (WTO, 1995)
Argentina (WTO, 1995)
Armenia (WTO, 2003)
Australia (WTO, 1995)
Austria (WTO, 1995)
Azerbaijan (Non WTO)
Bahamas, The (Non WTO)
Bahrain (WTO, 1995)
Bangladesh (WTO, 1995)
Barbados (WTO, 1995)
Belarus (Non WTO)
Belgium (WTO, 1995)
Belize (WTO, 1995)
Benin (WTO, 1996)
Bhutan (Non WTO)
Bolivia (WTO, 1995)
Botswana (WTO, 1995)
Brazil (WTO, 1995)
Brunei Darussalam (WTO, 1995)
Bulgaria (WTO, 1996)
Burkina Faso (WTO, 1995)
Burundi (WTO, 1995)
Cambodia (WTO, 2004)
Cameroon (WTO, 1995)
Canada (WTO, 1995)
Cape Verde (WTO, 2008)
Central African Rep. (WTO, 1995)
Chad (WTO, 1996)
Chile (WTO, 1995)
China (WTO, 2001)
Colombia (WTO, 1995)
Comoros (Non WTO)
Congo, Rep. (WTO, 1997)
Costa Rica (WTO, 1995)
Cote d'Ivoire (WTO, 1995)
Croatia (WTO, 2000)
Cyprus (WTO, 1995)
Czech Republic (WTO, 1995)
Denmark (WTO, 1995)
Dominica (WTO, 1995)
Dominican Rep. (WTO, 1995)
Ecuador (WTO, 1996)
Egypt, Arab Rep. (WTO, 1995)
El Salvador (WTO, 1995)
Ethiopia (Non WTO)
Fiji (WTO, 1996)
Finland (WTO, 1995)
France (WTO, 1995)
Gabon (WTO, 1995)
Gambia, The (WTO, 1996)
Georgia (WTO, 2000)
Germany (WTO, 1995)
Ghana (WTO, 1995)
Greece (WTO, 1995)
Grenada (WTO, 1996)
Guatemala (WTO, 1995)
Guinea (WTO, 1995)
Guinea-Bissau (WTO, 1995)
Guyana (WTO, 1995)
Honduras (WTO, 1995)
Hungary (WTO, 1995)
Iceland (WTO, 1995)
India (WTO, 1995)
Indonesia (WTO, 1995)
Iran, Islamic Rep. (Non WTO)
Ireland (WTO, 199)
Israel (WTO, 1995)
Italy (WTO, 1995)
Jamaica (WTO, 1995)
Japan (WTO, 1995)
Jordan (WTO, 2000)
Kazakhstan (Non WTO)
Kenya (WTO, 1995)
Kiribati (Non WTO)
Korea, Rep. (WTO, 1995)
Kuwait (WTO, 1995)
Kyrgyz, Rep. (WTO, 1998)
Latvia (WTO, 1998)
Lebanon (Non WTO)
Lesotho (WTO, 1995)
Lithuania (WTO, 2001)
Luxembourg (WTO, 1995)
Macedonia (Non WTO)
Madagascar (WTO, 1995)
Malawi (WTO, 1995)
Malaysia (WTO, 1995)
Maldives (WTO, 1995)
Mali (WTO, 1995)
Malta (WTO, 1995)
Mauritania (WTO, 1995)
Mauritius (WTO, 1995)
Mexico (WTO, 1995)
Moldova (WTO, 2001)
Mongolia (WTO, 1997)
Morocco (WTO, 1995)
Mozambique (WTO, 1995)
Namibia (WTO, 1995)
Nepal (WTO, 2004)
Netherlands (WTO, 1995)
New Zealand (WTO, 1995)
Nicaragua (WTO, 1995)
Niger (WTO, 1996)
Nigeria (WTO, 1995)
Norway (WTO, 1995)
Oman (WTO, 2000)
Pakistan (WTO, 1995)
Palau (Non WTO)
Panama (WTO, 1997)
Papua New Guinea (WTO, 1996)
Paraguay (WTO, 1995)
Peru (WTO, 1995)
Philippines (WTO, 1995)
Poland (WTO, 1995)
Portugal (WTO, 1995)
Qatar (WTO, 1996)
Romania (WTO, 1995)
Russian Federation (WTO, 2012)
Rwanda (WTO, 1996)
Samoa (WTO, 2012)
Saudi Arabia (WTO, 2005)
Senegal (WTO, 1995)
Seychelles (Non WTO)
Sierra Leone (WTO, 1995)
Singapore (WTO, 1995)
Slovakia (WTO, 1995)
Slovenia (WTO, 1995)
Solomon Islands (WTO, 1996)
South Africa (WTO, 1995)
Spain (WTO, 1995)
Sri Lanka (WTO, 1995)
St. Lucia (WTO, 1995)
St. Vincent and the Grenadines
(WTO, 1995)
Sudan (Non WTO)
Suriname (WTO, 1995)
Swaziland (WTO, 1995)
Sweden (WTO, 1995)
Switzerland (WTO, 1995)
Syrian Arab Rep. (Non WTO)
Tajikistan (WTO, 2013)
Tanzania (WTO, 1995)
Thailand (WTO, 1995)
Togo (WTO, 1995)
Tonga (WTO, 2007)
Trinidad & Tobago (WTO, 1995)
Tunisia (WTO, 1995)
Turkey (WTO, 1995)
Turkmenistan (Non WTO)
Tuvalu (Non WTO)
Uganda (WTO, 1995)
Ukraine (WTO, 2008)
United Arab Emirates (WTO,
1996)
United Kingdom (WTO, 1995)
United States (WTO, 1995)
Uruguay (WTO, 1995)
Vanuatu (WTO, 2012)
Venezuela, RB (WTO, 1995)
Vietnam (WTO, 2007)
Yemen, Rep. (Non WTO)
Zambia (WTO, 1995)
Zimbabwe (WTO, 1995)
Note: WTO memberships including year of joining and level of income are in parentheses
Source: WTO database

25
Table 5. List of sample regional trade agreements EFTA (1960)
CACM (1961)
PACTRA (1977)
SPARTECA (1981)
LAIA (1981)
ANZCERTA (1983)
US-Israel (1985)
CAN (1988)
GSTP (1989)
MERCOSUR (1991)
ASEAN/AFTA (1992)
ECO (1992)
EFTA-Turkey (1992)
European Union (1993)
EFTA-Israel (1993)
Russia-Azerbaijan (1993)
Russia-Turkmenistan
(1993)
Russia-Tajikistan (1993)
Russia-Belarus (1993)
Kyrgyz, Rep-Russia (1993)
Russia-Kazakhstan (1993)
ECOWAS (1993)
MSG (1994)
NAFTA (1994)
Ukraine-Russia (1994)
Georgia-Russia (1994)
COMESA (1994)
CIS (1994)
Colombia-Mexico (1995)
Ukraine-Turkmenistan
(1995)
Kyrgyz, Rep.-Kazakhstan
(1995)
SAPTA (1995)
EU-Turkey (1996)
Georgia-Ukraine (1996)
Georgia-Azerbaijan (1996)
Ukraine-Azerbaijan (1996)
Canada-Israel (1997)
Turkey-Israel (1997)
Canada-Chile (1997)
EAEC (1997)
Russia-Belarus-Kazakhstan
(1997)
PAFTA (1998)
Kyrgyz-Ukraine (1998)
EU-Tunisia (1998)
Ukraine-Kazakhstan (1998)
CEMAC (1999)
Georgia-Kazakhstan (1999)
Chile-Mexico (1999)
EFTA-Morocco (1999)
Georgia-Turkmenistan
(2000)
WAEMU (2000)
EU-South Africa (2000)
EU-Morocco (2000)
EU-Israel (2000)
EU-Mexico (2000)
Israel-Mexico (2000)
EAC (2000)
SADC 2000)
Turkey-Macedonia (2000)
New Zealand-Singapore
(2001)
EU-Macedonia (2001)
EFTA-Mexico (2001)
Ukraine-Macedonia (2001)
Dominican Rep.-Central
America (2001)
India-Sri Lanka (2001)
US-Jordan (2001)
APTA-China (2002)
Chile-Costa Rica (2002)
EFTA-Macedonia (2002)
EU-Jordan (2002)
Chile-El Salvador (2002)
Ukraine-Tajikistan (2002)
EFTA-Jordan (2002)
Canada-Costa Rica (2002)
Japan-Singapore (2002)
EFTA-Singapore (2003)
GCC (2003)
EU-Chile (2003)
EU-Lebanon (2003)
Panama-El Salvador (2003)
PICTA (2003)
Singapore-Australia (2003)
US-Chile (2004)
US-Singapore (2004)
Korea-Chile (2004)
CEZ (2004)
EU-Egypt (2004)
Mexico-Uruguay (2004)
SACU (2004)
EFTA-Chile (2004)
ASEAN-China (2005)
US-Australia (2005)
Thailand-Australia (2005)
Japan-Mexico (2005)
Ukraine-Moldova (2005)
EFTA-Tunisia (2005)
Pakistan-Sri Lanka (2005)
Turkey-Tunisia (2005)
Thailand-New Zealand
(2005)
India-Singapore (2005)
Jordan-Singapore (2005)
EU-Algeria (2005)
SAFTA (2006)
US-Morocco (2006)
Turkey-Morocco (2006)
CAFTA_DR (2006)
Korea-Singapore (2006)
TPSEP (2006)
Japan-Malaysia (2006)
Panama-Singapore (2006)
India-Bhutan (2006)
US-Bahrain (2006)
EFTA-Korea (2006)
Chile-China (2006)
Ukraine-Belarus (2006)
EU-Albania (2006)
EFTA-Lebanon (2007)
Turkey-Syria (2007)
Egypt-Turkey (2007)
Pakistan-China (2007)
EFTA-Egypt (2007)
Chile-India (2007)
Chile-Japan (2007)
Japan-Thailand (2007)
Pakistan-Malaysia (2008)
Panama-Chile (2008)
Turkey-Albania (2008)
EFTA-SACU (2008)
Japan-Indonesia (2008)
Chile-Honduras (2008)
Brunei-Japan (2008)
China-New Zealand (2008)
EU-CARIFORUM (2008)
Turkey-Georgia (2008)
Panama-Costa Rica (2008)
ASEAN-Japan (2008)
Japan-Philippines (2008)
EU-Cote d’Ivoire (2009)
China-Singapore (2009)
US-Oman (2009)
Panama-Honduras (2009)
US-Peru (2009)
Peru-Chile (2009)
Australia-Chile (2009)
Chile-Colombia (2009)
MERCOSUR-India (2009)
Panama-Guatemala (2009)
EFTA-Canada (2009)
Canada-Peru (2009)
Peru-Singapore (2009)
Japan-Switzerland (2009)
Japan-Vietnam (2009)
EU-Cameroon (2009)
India-Nepal (2009)
Colombia-Northern
Triangle (2009)
Panama-Nicaragua (2009)
EU-PNG (2009)
ASEAN-Korea (2010)
ASEAN-India (2010)
AANZFTA (2010)
Korea-India (2010)
Peru-China (2010)
Chile-Guatemala (2010)
New Zealand-Malaysia
(2010)
EFTA-Albania (2010)
Turkey-Jordan (2011)
Turkey-Chile (2011)
EU-Korea (2011)
India-Japan (2011)
India-Malaysia (2011)
EFTA-Peru (2011)
EFTA-Colombia (2011)
China-Costa Rica (2011)
Peru-Korea (2011)
Canada-Colombia (2011)
Peru-Mexico (2012)
Chile-Malaysia (2012)
Japan-Peru (2012)
Korea-US (2012)
Panama-Peru (2012)
EU-EPA (2012)
US-Colombia (2012)
EFTA-Ukraine (2012)
Mexico-Central America
(2012)
Canada-Jordan (2012)
Chile-Nicaragua (2012)
US-Panama (2012)
Note: Years of entry into force are in parentheses, the analysis takes into account different years of joining of some member
countries into the agreement but their years of joining are not shown in the table to save space, further information can be found
at http://rtais.wto.org/UI/PublicAllRTAList.aspx
Source: WTO database

26
Table 6. Basic results
OLS (1) OLS (2) OLS (3) PPML
Total Trade Food Trade Total trade Food Trade Total Trade Food Trade Total Trade Food Trade
GDP Importer 0.967*** 0.776*** 1.002*** 0.831*** 0.734*** 0.791***
(0.0263) (0.0396) (0.0265) (0.0402) (0.0321) (0.0705)
GDP Exporter 0.503*** -0.00995 0.526*** -0.000150 0.696*** 0.0521
(0.0287) (0.0358) (0.0292) (0.0366) (0.0315)
Total Tariff -0.0108* -0.102*** -0.00650 0.00222
(0.00567) (0.0121) (0.00573) (0.00959)
Food Tariff 0.0266*** 0.00664 0.0261*** 0.00681
(0.00895) (0.0110) (0.00917) (0.00912)
Distance -1.600*** -0.329*** -1.613*** -0.317***
(0.0207) (0.0335) (0.0208) (0.0340)
Landlocked -0.916*** 0.287 -2.068*** -0.311
(0.197) (0.347) (0.330) (0.407)
Shared Border 0.337*** 0.467*** 0.333*** 0.462***
(0.113) (0.170) (0.114) (0.173)
Common Language 0.737*** 0.0667 0.747*** 0.0612
(0.0432) (0.0718) (0.0434) (0.0727)
Colonial Link 1.111*** -0.165 1.100*** -0.155
(0.102) (0.177) (0.103) (0.183)
Common Colony 0.948*** -0.00262 0.936*** -0.0124
(0.0557) (0.0882) (0.0560) (0.0895)
WTO 0.216*** -0.0557 0.231*** -0.0122 0.193*** -0.0510 0.108*** 0.107
(0.0264) (0.0366) (0.0677) (0.111) (0.0270) (0.0375) (0.0299) (0.119)
RTA 0.250*** 0.0269 0.169*** 0.113** 0.176*** -0.0428 0.0698** 0.222***
(0.0231) (0.0466) (0.0258) (0.0475) (0.0266) (0.0567) (0.0355) (0.0765)
t dummies Yes Yes Yes Yes Yes Yes Yes Yes
i and j dummies Yes Yes No No No No No No
it and jt dummies No No Yes Yes No No No No
ij dummies No No No No Yes Yes Yes Yes
Observations 117,789 64,416 117,789 64,416 117,789 64,416 178,128 116,856
Note: All variables are in logarithm, except the dummies and the dependent variables in ppml estimations. Total tariff is used for total trade and food tariff is used for food
trade, both using 1+tariff specification. Robust standard errors clustered by country pairs are in parentheses, * p<0.1, ** p<0.05, *** p<0.001.

27
Table 7. Impacts of WTO and RTAs on Tariff
Total Tariff Food Tariff
Food Tariff/Total
Tariff
WTO 0.107*** 0.136*** -0.0289***
(0.00743) (0.00685) (0.00584)
RTA -0.240*** -0.0727*** -0.168***
(0.0136) (0.0126) (0.0107)
Total tariff is used for total trade and food tariff is used for food trade, both using 1+tariff specification. Time and bilateral
country-pair effects are included but not reported. Robust standard errors are in parentheses, * p<0.1, ** p<0.05, ***
p<0.001.
Table 8. Results of developed and developing countries
Total Trade Food Trade
WTO both developed -0.189*** 0.0283
(0.0408) (0.0893)
WTO both developing 0.587*** 0.398***
(0.0711) (0.125)
WTO developed and developing 0.161*** 0.0387
(0.0374) (0.125)
RTA both developed -0.0582 -0.0129
(0.0656) (0.143)
RTA both developing 0.141** 0.321
(0.0714) (0.215)
RTA developed and developing 0.0819* 0.234**
(0.0468) (0.0932)
Country-pair and Year dummies Yes Yes
Observations 178,128 116,856
Note: variables included but not reported: gdp importer, gdp exporter, distance, landlocked, shared border, common
language, common colony, colonial link. Robust standard errors are in parentheses, * p<0.1, ** p<0.05, *** p<0.001.

28
Table 9. Impacts of WTO in different regions
Total Trade Food Trade
WTO both Asia 0.0762 -0.327***
(0.0862) (0.108)
WTO one Asia 0.170*** 0.102
(0.0369) (0.0640)
WTO both Africa 0.608*** 0.763***
(0.164) (0.202)
WTO one Africa 0.160*** 0.0691
(0.0577) (0.0829)
WTO both America 0.0443 0.114
(0.0891) (0.0986)
WTO one America 0.202*** -0.00565
(0.0643) (0.0835)
WTO both Europe 0.122* 0.895***
(0.0675) (0.250)
WTO one Europe (0.0354) 0.00265
(0.0368) (0.0672)
Country-pair and Year dummies Yes Yes
Observations 178,128 116,856
Note: variables included but not reported: gdp importer, gdp exporter, Robust standard errors are in parentheses, * p<0.1, **
p<0.05, *** p<0.001.
Table 10. Results of selected RTAs around the globe
Total Trade Food Trade
AFTA -0.117 0.453
(0.224) (0.308)
COMESA 1.183*** 0.459
(0.377) (0.689)
ECOWAS 1.608*** 1.172
(0.485) (0.721)
EU 0.170*** 0.940***
(0.0391) (0.0784)
MERCOSUR 0.466*** -0.267*
(0.141) (0.157)
NAFTA 0.0628 3.175**
(0.112) (1.324)
PAFTA -0.197 -0.374
(0.165) (0.246)
SADC 1.045*** -0.151
(0.404) (0.189)
Country-pair and Year dummies Yes Yes
Observations 178,128 116,856
Note: variables included but not reported: gdp importer, gdp exporter and tariffs. Distance, landlocked, shared border,
common language, common colony, colonial link are absorbed by the country-pair fixed effects. Robust standard errors are in
parentheses, * p<0.1, ** p<0.05, *** p<0.001.
29
Figure 1. Global map of trade agreements as of 2013
Note: Countries’ geographical positions are placed as in normal map but without scaling, ISO alpha 2 codes can be accessed via
http://www.iso.org/iso/country_codes
Source: Own illustration based on WTO database
Figure 2. Population and cereal production in 2012
Source: FAOSTAT
0.0
0.2
0.4
0.6
0.8
1.0
1.2
1.4
0.0
0.5
1.0
1.5
2.0
2.5
3.0
3.5
4.0
4.5
Africa Americas Asia Caribbean Europe
Ce
real
Pro
du
ctio
n(b
illio
n t
on
ne
s)
Po
pu
lati
on
(bill
ion
)
Region
Population
Cereal production
MX
US
SV
VE
HN NI
CO
EC
PE
CL PY
UY AR
IS NO
UK DE
FR ES IT
AT PL
CH CS MK
AL UA
GH NG
MA DZ
SN
CI CM
TJ
TM UZ
RU
KG
ET
KE
UG
SU
JO
EG
ZM BW NA
ZA ZW
NP PK IN LK
KR JP
BR
SG ID
PH
FJ PG
AU NZ
EFTA NAFTA
SAFTA
ASEAN
SPARTECA
ANZCERTA
CAN
MERCOSUR
ECOWAS
COMESA SADC
CA EU
TN GT
BR
CN
CR
MY
TH
TR IL
KZ
AM
* ISO ALPHA-2 is used for country codes, some countries are
not included because of limited space
Regional block Regional block and country
Two countries in the same continent Two countries in different continent

30
Figure 3. Numbers of regional trade agreements 1960 – 2013
Source: Author illustration based on WTO database
Figure 4. Food tariff rates evolution 1992 - 2012
Note: Average tariff rates not weighted of country groups based on level of income facing all countries. HIC (High Income
Countries); UMIC (Upper Middle Income Countries); LMIC (Lower Middle Income Countries); LIC (Lower Income Countries)
Source: TRAINS database accessed via WITS
0
50
100
150
200
250
300
350
400
450
1960 1970 1980 1990 2000 2010 2013
0%
5%
10%
15%
20%
25%
30%
1992 1996 2000 2004 2008 2012
HIC
UMIC
LMIC
LIC
31
Figure 5. Shares of food in total trade
Note: HIC (High Income Countries); UMIC (Upper Middle Income Countries); LMIC (Lower Middle Income Countries); LIC
(Lower Income Countries)
Source: Author calculation based on UN COMTRADE
Figure 6. Shares of countries in world food trade
Note: HIC (High Income Countries); UMIC (Upper Middle Income Countries); LMIC (Lower Middle Income Countries); LIC
(Lower Income Countries), Source: Author calculation based on UN COMTRADE
0%
5%
10%
15%
20%
25%
World HIC UMIC LMIC LIC
2001
2012
HIC66%
UMIC22%
LMIC11%
LIC1%