Embed Size (px)
Citation preview

Do Free Trade Agreements Create Trade for South Africa?
Merle Holden1 & Landon McMillan2
Working Paper Number 19
1 University of Kwa-Zulu-Natal 2 University of Kwa-Zulu-Natal

Do Free Trade Agreements Create Trade forSouth Africa?
Merle Holden¤and Landon McMillany
ABSTRACT: This paper shows that South Africa’s exports and imports hadbeen determined by the normal variables found in gravity models, namely GDP,population and distance. However, di¤erences in the composition of trade hadresulted in distance from markets having a greater adverse e¤ect on exports thanimports. Cross section estimates of the impact of the free trade agreementsbetween South Africa the EU and SADC failed to show signi…cant e¤ects. Panelestimates on the other hand yielded positive e¤ects for EU exports and importswith South Africa. The SADC FTA was found to have stimulated South Africa’sexports to SADC but with little e¤ect on SADC imports into South Africa.Finally, it was found that preferential access under the US AGOA had notparticularly bene…ted South African exporters.
¤University of KwaZulu-Natal, DurbanyUniversity of KwaZulu Natal, Durban

Free Trade Agreements 1
1 Introduction
While trade policy in South Africa has been determined in a multilateralsetting under the auspices of the Uruguay Round and the WTO, preferentialtrading agreements have also been pursued as evidenced by the SADC FreeTrade Agreement and the EU SA FTA. In addition South African exportershave recently bene…ted from preferential access into the United States underthe African Growth and Opportunity Act (AGOA). These agreements arerelatively recent events, for South Africa is also a member of the longeststanding customs union in the world namely the Southern African CustomsUnion (SACU) consisting of South Africa, Botswana, Lesotho, Swaziland andNamibia. However, despite multilateral commitments policy makers in SouthAfrica continue to negotiate preferential agreements with countries as diverseas the United States, India, Brazil and more recently China. Whether theseagreements will act as a substitute for MFN trade policy remains to be seenbut many economists view these developments with a degree of skepticismgiven their potential for trade diversion as well as trade creation.
This paper attempts to ascertain whether the two free trade agreements,the EU SA FTA, and SADC have had any signi…cant impact on tradingpatterns for South Africa. Furthermore, although the AGOA arrangementswith the United States do not take the form of a free trade agreement, byestimating the impacts on exports and imports separately it is possible tofactor this agreement as well into the analysis. . Although these agreementsall came into force in 2000/2001 after a period of phased in aggressive tradeliberalization under the Uruguay Round, the view may be that insu¢cienttime had passed to enable the impact to be felt. Nevertheless it is ourview that su¢cient time has elapsed for exporters and importers to haveresponded and given that the EU SA agreement is due for renegotiation,assessment of these agreements will add to the debate. Therefore the paperfocuses on whether exports from South Africa have increased and whetherimports have similarly been a¤ected by the granting of preferential accessunder the agreements. In addition, the research is able to estimate the roleplayed by changing transport costs over the period 1994 to 2004.

Free Trade Agreements 2
Figure 1: Total Exports and Imports for South Africa: 1994-2004 (mill US$)
2 Trends in Trade
The following graphs provide a picture of the trends in South Africa exportsand imports from 1994 to 2004.
Figure 1 demonstrates that both imports and exports for South Africaexperienced signi…cant growth in the years 2003 and 2004.
Figure 2 shows that the EU and rest of the world exports increasedmarkedly in 2003 and 2004 despite the strength of the rand during this pe-riod.
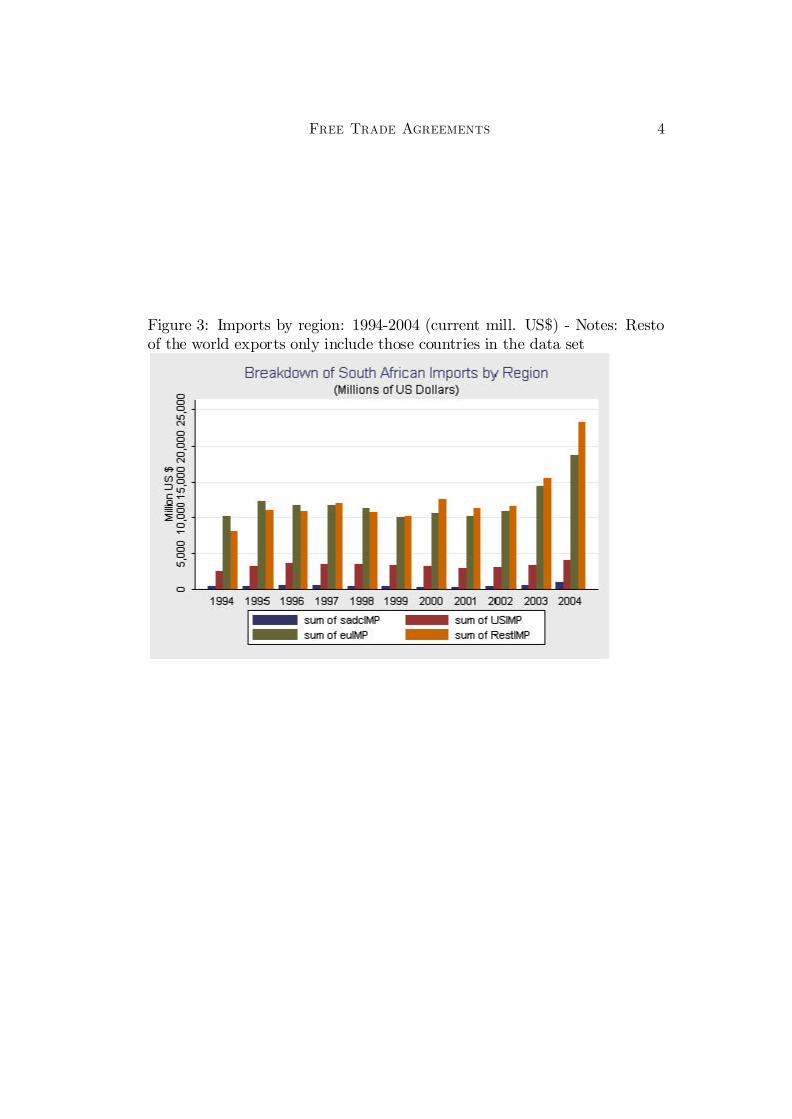
Figure 3 shows an increase in imports predominantly from the EU (espe-cially Germany) and the rest of the world (especially China, see AppendixFigure A1). While imports from Germany demonstrate signi…cant growthover the period, growth of imports from China has been greater. When thegrowth of exports and imports from China are compared, clearly the balanceof trade is turning in the Chinese direction providing evidence of increasingChinese investment in the South African economy.

Free Trade Agreements 3
Figure 2: Exports by region: 1994-2004 (current mill US$) - Notes: Rest ofthe world exports only include those countries in the data set
Free Trade Agreements 4
Figure 3: Imports by region: 1994-2004 (current mill. US$) - Notes: Restoof the world exports only include those countries in the data set

Free Trade Agreements 5
3 Methodology
Given that South Africa has recently entered into two free trade agreements,one with the South African Development Community (SADC) and the otherwith the European Union (EU), a methodology that attempts to establishthe trade increasing e¤ects of both of these agreements relies primarily onapplication of several regression models.
The regressions distinguish the impact of the agreements based on paneldata for South African exports and imports over the period 1994 to 2004.The evidence is derived from equations of the following form:
For South African exports X to country i at time t
Xit = ® + ¯EU + ±SADC + @AGOA+ §j°jYjt + "it (1)
For South African imports M from country i at time t
Mit = ´+ ¸EU + !SADC+ §jvjYjt + ¹it (2)
where
² EU, SADC and AGOA are binary dummy variables which are unityfor member countries (aside from South Africa) of the two groups andunity for SA exports to the US,
² Ys are sets of variables from gravity models,
² " and ¹ are well behaved residuals
Feenstra (2002) divides estimation of a gravity type equation in three ap-proaches. Firstly, price indices can be used to measure price e¤ects (Bergstrand,1989); secondly border e¤ects can be used to measure price e¤ects indirectly(Anderson and van Wincoop, 2002), and …nally, …xed e¤ects can be usedfor the source of imports and destination of exports. Given the di¢cultiesof speci…cally modeling the price implications of the agreements, the secondapproach was used. We ruled out the use of …xed e¤ects for reason of wishingto estimate the impact of distance on South African trade. More recently thedivision of markets spatially has been successfully modeled by applying grav-ity variables relating to economic mass and we follow this approach in thepaper. The variables included are as follows: relative GDP, population, and

Free Trade Agreements 6
the distance between trading partners. (Rose 2004, Anderson and Wincoop,2002). Using border e¤ects for the trading agreements in the form of dummyvariables, once the agreements were implemented even during the phase -in,it is possible to ascertain whether the trading agreements had shifted tradeor not for South Africa.
Thus, the conditioning variables Y above include the speci…c countryGDP vis a vis South African GDP; speci…c country population vis a visSouth African population and the distance from the South African port tothe speci…c country port of entry. When the estimating equation is expressedin log linear terms it follows thatLogtradeij = b1 + b2 (LogYiYj) + b3 (LogPiPj) + b4LogDij + b5EU +
b6SADC + b7AGOA+ hijFor the export equation the AGOA dummy is included whereas for im-
ports it is excluded. The South African data is represented by the subscriptj and the trading partners by the subscript i.
4 Estimation Results
The data are summarized in Table 1. Given that suitable de‡ators are notavailable for trade from and to the trading partner countries, South Africanexports and imports are measured in nominal US dollars converted at averagefor the year market exchange rates. GDPs are measured in constant USdollars and Distance in thousands of kms. Data sources and the list ofcountries can be found in the appendix.
4.1 Cross Section ResultsInitially the model in equation 3 was estimated as individual cross sectionsfor each year for both exports and imports. The results are shown in Tables2 and 3. Table 2 shows the estimation results for exports from South Africato 136 countries for each year from 1994 to 2004. The estimated coe¢cientson relative GDPs and population were of the expected signs from gravityequation theory, namely that GDP is signi…cantly and positively related totrade while populations were negatively related. While larger countries tendto be more self su¢cient, the emergence of countries such as China and Indiaas major trading nations, is altering the negative signi…cance of population.Distance is also shown to be signi…cant and, interestingly, surprisingly high

Free Trade Agreements 7
when compared with other estimates for gravity equations.The elasticity on the distance variable for exports is estimated to decline
from - 4.93 in 1994 to -3.11 in 2004. Estimates of the distance elasticityin other studies is usually in the range of -0.5 to -1.0. (Coe et al, 2002).The high elasticity for South African exports demonstrates the remotenessof South Africa located as it is at the tip of Africa, from its major marketsin Europe, the US and East Asia. It is encouraging however that contraryto other studies (See Coe et al, 2002 ) that have estimated constant dis-tance coe¢cients over time, that the South African elasticity for exports isdeclining.
More importantly the coe¢cients on the dummy variables for the freetrade agreements appear to demonstrate that in only one year was preferen-tial access important for South African exports. EU exports were shown tobe a¤ected by the free trade agreement in 2002. On the other hand neitherthe SADC nor AGOA access were signi…cant demonstrating in the …rst placethat access into the US market had not been particularly bene…cial giventhe caveats attached to such preferential access. In the case of SADC thisresult is not surprising given the asymmetrical phase in of the agreement.Once the estimations were done in panel form, these results were found tobe more favourable towards the impact of the agreements on trade over theentire period.
Table 3 shows the estimations for South African imports. Again the GDPand population variables behave as expected from gravity equations. The dis-tance variable is also a signi…cant determinant of imports but interestinglythe elasticity on the variable is not as high as it is for exports. Althoughthe elasticity declines from -3.66 in 1994 to -2.73 in 2004 this decline is notcontinuous. We are of the view that the di¤erence in the distance elastici-ties between exports and imports re‡ects the di¤erence in the compositionof trade. South Africa is a major exporter of bulk lower value goods whileimporting higher value intermediates, consumer and capital goods hence ac-counting for the di¤erence in these coe¢cients. The higher elasticity of thedistance coe¢cient for exports also re‡ects the impact of competition fromsuppliers of substitutable goods that are closer to the main markets of thedeveloped world. Whereas South Africa sources most of its imports fromthe developed world, and therefore has less choice in substituting sources ofsupply that are closer.
The EU dummy in the import equation is found to be signi…cant in theyears 2003 and 2004 probably due to the asymmetrical phase-in that favoured

Free Trade Agreements 8
South African access into the EU and delayed EU access into the SouthAfrican market. Therefore, the …nding of a later response on the import sideis not surprising.
4.2 Panel EstimationsGiven the nature of the data it was also decided to run panel estimations ofthe gravity equations for both exports and imports. The distance variable istime invariant, therefore …xed e¤ects estimations were not used as we wereinterested in estimating the impact of distance in the model and checkingthis against the cross section work.1 Generalised least squares estimationsassuming heteroskedastic panels with common autoregressive …rst order co-e¢cients of all panels were performed on the data (Tables 4 and 5). Theestimated coe¢cients of the gravity variables were found to be similar to theaverage of the annual estimates suggesting that the pooling of the data intothe panels is valid. The panel estimates with the introduction of time raisesquestions as to the role of the exchange rate. However given the nature of thequestion asked in this paper namely the impact of distance and the free tradeagreements on trade between trading partners it was argued that changes inthe exchange rate would not a¤ect the allocation of trade between tradingpartners particularly as South African trade is mainly invoiced in foreigncurrency namely the US dollar. This hypothesis was tested by running re-gressions that included the exchange rate in both nominal and real terms foreach trading partner in order to satisfy ourselves that this was the appropri-ate way to proceed. The exchange rate was found to be insigni…cant in theregressions and it’s inclusion in the equations that follow failed to a¤ect our…ndings.
An additional data problem presented itself in the manner in which ex-ports and imports value data in rand terms are de‡ated. Bilateral tradede‡ators are not available in any studies of the gravity equation. Typicallythe trade values are simply de‡ated using the dollar exchange rate. In anattempt to deal with the problem the export and impart trade data for SouthAfrica were also de‡ated by the export and import unit value indices pro-vided by the South African Reserve Bank. The estimates using these datawere found to only have a marginal impact on the results failing to change
1 In …xed e¤ects estimations time invariant variables are dropped.

Free Trade Agreements 9
the overall conclusions.2In Table 4, since the regressand is the natural logarithm of exports, the
impact of the agreements over the period since the agreement had been inplace is estimated to raise South African exports by 33 per cent for the EU(since exp (0.286) -1 = 0.33), by 50 per cent for SADC (since exp (0.405)-1= 0.50) and 3 per cent for the AGOA3 (since exp (0.032)-1 = 0.03). Theelasticities on the other variables are of the expected sign and signi…cance.The elasticity on the distance variable in the panel estimates is -3.33 forexports.
In Table 5, the impact of the agreements over the period is estimated toraise South African imports by 53 per cent (since exp (0.42) -1 = 0.53) fromthe EU and 80 per cent from SADC (since exp (0.59) -1 = 80). Both thefree trade agreements had stimulated trade for those countries selling intothe South African market.
Once again the elasticities on the other variables were found to be of theexpected sign and signi…cance. The distance elasticity for imports is -2.41.This value is lower than in the cross section work and certainly lower than itis for exports.
While our data for exports and imports are measured in nominal terms,namelyUS dollars, we included time e¤ects to absorb the e¤ects of in‡ation inthe following regression. (See Frankel et al, 1997 and Coe and Ho¤maister,1999). Thus, additional linear time trends were included for the distance,GDP and population variables as well as the dummy variables. These resultsare shown in Tables 6 and 7 for exports and imports respectively. Onceagain the estimated coe¢cients are similar to the average annual estimatesin the cross section estimates suggesting that the time dummies do addressthe problem of de‡ating the trade data.
The addition of the linear time trends shows that, where they are signif-icantly di¤erent from zero, the signs of the interactive time trend variablesimply that the absolute value of the estimated coe¢cients decline over time.4
The distance variable is initially signi…cantly negative and becomes less soover time (because the trend is positive). The SADC, EU and AGOA, in
2These regressions are available from the authors on request.3The coe¢cient on the AGOA variable was found not to be signi…cantly di¤erent from
zero anyway.4The distance, EU, SADC and AGOA trend variables are all found to be signi…cantly
di¤erent from zero. The fact that the trend variables on GDP and population were in-signi…cant suggests that their explanatory e¤ects remained relatively constant over time.

Free Trade Agreements 10
contrast, are signi…cantly positive and declining over time. This …nding isonly con…rmed in the cross section estimations for the distance variable.
The inclusion of the interactive linear time trends into the import equa-tion led to much the same results as previous estimations, except for theSADC dummy and its time trend and the distance time trend. The SADCtime trend appears to have completely reduced the value of the access forSADC members into the South African market. This …nding could be relatedto the view that many SADC countries had, prior to the agreement, enjoyedsome preferential access under bilateral agreements with South Africa andtherefore the value of additional access under the FTA was low.5 The EUagreement remains a signi…cant determinant of imports into South Africa.Interestingly, the impact of distance on imports over time, in contrast to ex-ports is found to be insigni…cantly di¤erent from zero. On closer examinationof the cross-section estimates, the distance coe¢cients are not monotonicallydeclining over the period. The fact that the population trend is more signi…-cant and positive for imports than for exports is a re‡ection of the increasedproportion of imports originating in China.
5 Conclusion
This research shows that the impact of economic mass in terms of GDPsand population is found to be in accord with gravity theory. Distance (ortransport costs) is shown to play an important role in determining the volumeof exports and imports. While trading partners closer to South Africa havea comparative advantage, exports from South Africa experience a greaterimpact on the volume traded than imports into South Africa. This …ndingcan be explained by the composition of trade in exports and imports. Exportsfrom South Africa are high bulk and expensive to transport while imports arelargely high value and proportionately cheaper to transport. Furthermore,over time the impact of distance on South African exports is shown to bedeclining while its impact on imports into South Africa remains relativelyunchanged.
In the main the results for trade agreements in the cross-section andpanel estimates are di¤erent. Whereas the cross-sections appear to showlittle impact, both the panel estimates, with and without the time trend,
5Zimbabwe, Zambia, Malawi and Mozambique had agreements that had been negoti-ated during the apartheid era.

Free Trade Agreements 11
indicate positive impacts for the trade agreements (with the exception ofthe SADC agreement in the time trend analysis for imports). The panelanalysis introduces a time element and thus a dynamic aspect to the analysisand the phasing in of the agreements. The cross-sectional analysis providesonly a static snapshot picture, comparing the e¤ects of GDP, populationand distance on the level of trade along with the e¤ect of the agreementdummies. The panel analysis, on the other hand, examines the changingimpacts of the agreements over time, whilst controlling for the changes in thegravity variables. Changes in the exchange rate over time failed to impacton the allocation of exports and imports across trading partners supportingthe theoretical approach used in the study.
A major limitation of this research lies in the absence of suitable de‡atorsfor bilateral trade requiring the use of trade to be measured in current USdollars. An extension of this work could be to experiment with alternativeproxy de‡ators to test the sensitivity of the results. De‡ating current randvalues of exports and imports by the overall South African export and importde‡ators did not change the results but these are not bilateral. In additionfuture research should disaggregate the data by commodity allowing for in-dividual price e¤ects. The work so far has averaged across all exports andimports. While this may also be viewed as a limitation of the research itnevertheless does answer the question posed at the beginning of this project,namely, to ascertain whether in general exports and imports have changedas a result of the agreements. The panel analysis supports the view that theEU-SA FTA stimulated both exports and imports, while for SADC exportswere stimulated but the results for imports was ambiguous. The AGOA re-sults were far less signi…cant overall, suggesting that preferential access forSouth African exports into the US, had not been particularly bene…cial.
References
Anderson, J E and E van Wincoop, 2002 “Gravity with Gravitas: ASolution to the Border Puzzle”, American Economic Review 93, 170 -92.
Bergstrand, Je¤rey H. 1989. “The Gravity Equation in InternationalTrade: Some Microeconomic Foundations and Empirical Evidence” Re-view of Economics and Statistics 67: 474-81.

Free Trade Agreements 12
Coe, David, Arvind Subramanian, and Natalia Tamirisa with RikhilBhavnani (2002) The Missing Globalisation Puzzle, IMF Working Pa-per WP/02/171, Washington DC.
Coe, David and Alexander Ho¤maister, (1999) “North-South Trade: IsAfrica Unusual?”. Journal of African Economies, Vol 8, No 2 : 228-256.
Feenstra, Robert. C. (2002) “Border E¤ects and the Gravity Equa-tion: Consistent Methods for Estimation” Scottish Journal of PoliticalEconomy, Vol 49, No5, 491 - 506.
Feenstra Robert. C. (2004) Advanced International Trade: Theory andEvidence. Princeton University Press, Princeton.
Frankel, J., E. Stein and S. Wei (1997). Regional Trading Blocs in theWorld Economic System, Washington DC: Institute for InternationalEconomics.
Holden, Merle (1996) “Economic Integration in southern Africa: Isthere a role for South Africa?” World Bank Discussion Paper No 342,Washington D C.

Table 1: Summary Statistics of the Model Data 1994-2004 for 136 countries
1994 1996 1998 2000 2002 2004Exports (Million US Dollars)Mean 131.40 158.28 153.64 186.21 159.39 288.10Standard Deviation 327.69 378.24 387.04 500.41 382.67 732.54Minimum 0.00 0.00 0.00 0.00 0.11 0.04Maximum 1,857.06 2,976.76 2,721.74 3,605.38 2,411.38 4,529.39
Imports (Million US Dollars)Mean 156.03 196.93 189.88 196.55 189.09 345.01Standard Deviation 497.92 591.60 543.12 541.94 536.09 910.26Minimum 0.00 0.00 0.00 0.00 0.00 0.00Maximum 3,734.16 4,050.91 3,752.04 3,585.16 4,066.71 6,728.66
GDP (Million US Dollars)Mean 188,996 200,848 212,875 228,346 235,412 249,563Standard Deviation 786,056 833,419 891,839 956,539 979,301 1,037,948Minimum 86 85 99 108 108 127Maximum 7,775,500 8,271,400 9,012,500 9,764,800 10,342,992 10,663,625
Population (Millions)Mean 38.68 39.78 40.84 41.87 42.72 43.85Standard Deviation 131.61 135.15 138.62 141.88 144.92 148.51Minimum 0.01 0.01 0.01 0.01 0.01 0.01Maximum 1,191.84 1,217.55 1,241.94 1,262.65 1,280.40 1,303.55
Distance (Thousand Km)Mean 11.12Standard Deviation 3.63Minimum 1.50Maximum 19.00

Table 2: Cross Section Estimates for Exports: 1994-2004
GDPs Populations Distance Constant EU SADC AGOA
Exports Dependent variable
1994 1.73* -0.54* -4.93* -21.91* - - -
1995 1.52* -0.34*** -4.34* -19.25* - - -
1996 1.46* -0.34** -4.29* -17.75* - - -
1997 1.40* -0.35** -4.09* -16.68* - - -
1998 1.48* -0.43* -4.29* -17.35* - - -
1999 1.31* -0.24*** -3.85* -15.51* - - -
2000 1.39* -0.34* -4.14* -16.01* - - -
2001 1.28* -0.21*** -3.90* -14.75* 0.26 0.34 -0.15
2002 1.08* -0.18** -2.96* -12.34* 0.38 0.96** 0.40
2003 1.09* -0.12 -3.25* -12.52* 0.50 0.64 0.33
2004 1.11* -0.15 -3.11* -13.16* -.09 0.64 0.25
Notes: (1)* significance at 1 per cent level or higher (2)** significance at 5 per cent level (3)***significance at 10 per cent level (4) Robust standard errors computed

Table 3: Cross Section estimates for Imports: 1994-2004
GDPs Populations Distance Constant EU SADC
Imports Dependent variable
1994 1.85* -0.60* -3.66* -27.77* - -
1995 1.66* -0.42* -2.89* -25.82* - -
1996 1.65* -0.44* -3.03* -24.88* - -
1997 1.66* -0.44* -3.04* -24.74* - -
1998 1.76* -0.54* -2.58* -27.29* - -
1999 1.73* -0.55* -2.89* -25.87* - -
2000 1.81* -0.54* -2.73* -27.95* - -
2001 1.81* -0.58* -3.03* -26.90* 0.09 0.28
2002 1.58* -0.35** -2.60* -23.61* 0.18 0.23
2003 1.63* -0.34* -2.71* -25.99* 0.70** 1.07
2004 1.66* -0.26** -2.73* -27.05* 0.72** 1.09
Notes: (1)* significance at 1 per cent level or higher (2)** significance at 5 per cent level (3)***significance at 10 per cent level (4) Robust standard errors computed
Table 4: Panel Estimates for Log Exports as dependent variable
Variable Coefficient Std Err z P>z
Log GDPs 1.08 0.03 36.97 0.000
Log populations -0.06 0.03 -2.07 0.039
Log Distance -3.33 0.11 -31.32 0.000
EU 0.286 0.07 3.80 0.000
SADC 0.405 0.115 3.54 0.000
AGOA 0.032 0.22 0.15 0.88
Constant -12.60 0.44 -28.77 0.000
Note: Coefficients were estimated by generalized least squares assuming heteroskedastic panels with common autoregressive first order coefficients of all panels

Table 5: Log Imports as dependent variable
Variable Coefficient Std Err z P>z
Log GDPs 1.46 0.02 50.72 0.000
Log populations -0.29 0.03 -9.21 0.000
Log Distance -2.41 0.097 -24.65 0.000
EU 0.42 0.071 5.86 0.000
SADC 0.59 0.15 3.89 0.000
Constant -22.41 0.47 -47.59 0.000
Coefficients were estimated by generalized least squares assuming heteroskedastic panels with common autoregressive first order coefficients of all panels

Table 6: Log of Exports as Dependent variable
Coefficient Std Error Z P> Z
Log GDPs 1.30 0.02 60.27 0.000
Log GDPs x trend -0.002 0.003 -0.57 0.570
Log Population -0.26 0.031 -8.36 0.000
Log Populations x trend 0.005 0.005 1.04 0.300
Log distance -4.29 0.132 -32.39 0.000
Log distance x trend 0.06 0.022 2.64 0.008
EU 1.54 0.375 4.09 0.000
EU x trend -0.18 0.04 -4.43 0.000
SADC 2.37 0.89 2.66 0.008
SADC x trend -0.199 0.09 -2.11 0.035
AGOA 1.01 0.52 1.95 0.052
AGOA x trend -0.15 0.05 -2.74 0.006
Constant -15.04 0.19 -79.27 0.000
Notes: Generalized least squares estimates of coefficients with heteroskedastic panels. The trend is equal to 1 in 1994, 2 in 1995…and 11 in 2004.
Table 7: Log of Imports as Dependent variable
Coefficient Std Error Z P> Z
Log GDPs 1.69 0.022 75.27 0.000
Log GDPs x trend -0.00 0.003 -0.19 0.851
Log Population -0.54 0.34 -15.84 0.000
Log Populations x trend 0.01 0.005 2.14 0.032
Log distance -2.92 0.102 -28.80 0.000
Log distance x trend 0.02 0.019 1.34 0.18
EU 1.77 0.466 3.79 0.000
EU x trend -0.17 0.049 -3.49 0.000
SADC 0.187 0.912 0.21 0.837
SADC x trend 0.06 0.098 0.57 0.57
Constant -25.70 0.288 -89.28 0.000
Notes: Generalized least squares estimates of coefficients with heteroskedastic panels. The trend is equal to 1 in 1994, 2 in 1995, … and 11 in 2004.

APPENDIX: COUNTRIES AND DATA SOURCES
The countries included in the study numbered 136 in total. These countries had
traded with South Africa over the period 1994 to 2004. During some years when
either imports or exports were zero log values were taken on the value one.
Gross Domestic Product, population and South African exports and imports by
trading partner were obtained from the TIPS database. Distance between trading
partners and South Africa were obtained from Holden(1996).
Albania Ecuador Malaysia Thailand Algeria Egypt Maldives Togo Angola El Salvador Mali Trinidad and Tobago Anguilla Estonia Malta Tunisia Antigua and Barbuda Ethiopia Mauritius Turkey Argentina Finland Mexico Uganda Armenia France Moldova Ukraine Australia Gabon Morocco United Arab Emirates Austria Germany Mozambique United
Kingdom
Bahamas Ghana Nepal United States
Bangladesh Greece Netherlands Uruguay Barbados Guatemala New Zealand Venezuela Belgium Guinea Niger Vietnam Belize Guinea-Bissau Nigeria Yemen Benin Guyana Norway Zambia Bolivia Haiti Oman Zimbabwe Brazil Honduras Pakistan British Virgin Islands Hong Kong Peru Bulgaria Hungary Philippines Burkina Faso Iceland Poland Burundi India Portugal Cambodia Indonesia Republic of Korea Cameroon Iran Romania Canada Ireland Russian Federation Cayman Islands Israel Samoa Central African Republic Italy Saudi Arabia Chile Jamaica Taiwan Province of
China
China Japan Tanzania Colombia Kazakhstan Senegal Comoros Kenya Seychelles

Figure A1: South African exports by major Trading partner: 1994-2004 (current mill US$)
-
1,000
2,000
3,000
4,000
5,000
6,000
7,000
8,000
1994 1995 1996 1997 1998 1999 2000 2001 2002 2003 2004
Mill
ions
ChinaGermanyJapanUnited KingdomUnited States
Figure A2: South African Imports by Major Trading Partner: 1994-2004 (current
mill US$)
-
1,000
2,000
3,000
4,000
5,000
6,000
7,000
8,000
1994 1995 1996 1997 1998 1999 2000 2001 2002 2003 2004
Mill
ions
ChinaGermanyJapanUnited KingdomUnited States